Portuguese Disability Age 5 to 17
COMPARE
Portuguese
Select to Compare
Disability Age 5 to 17
Portuguese Disability Age 5 to 17
6.1%
DISABILITY | AGE 5 TO 17
0.1/ 100
METRIC RATING
280th/ 347
METRIC RANK
Portuguese Disability Age 5 to 17 Correlation Chart
The statistical analysis conducted on geographies consisting of 444,787,533 people shows a weak positive correlation between the proportion of Portuguese and percentage of population with a disability between the ages 5 and 17 in the United States with a correlation coefficient (R) of 0.217 and weighted average of 6.1%. On average, for every 1% (one percent) increase in Portuguese within a typical geography, there is an increase of 0.057% in percentage of population with a disability between the ages 5 and 17.
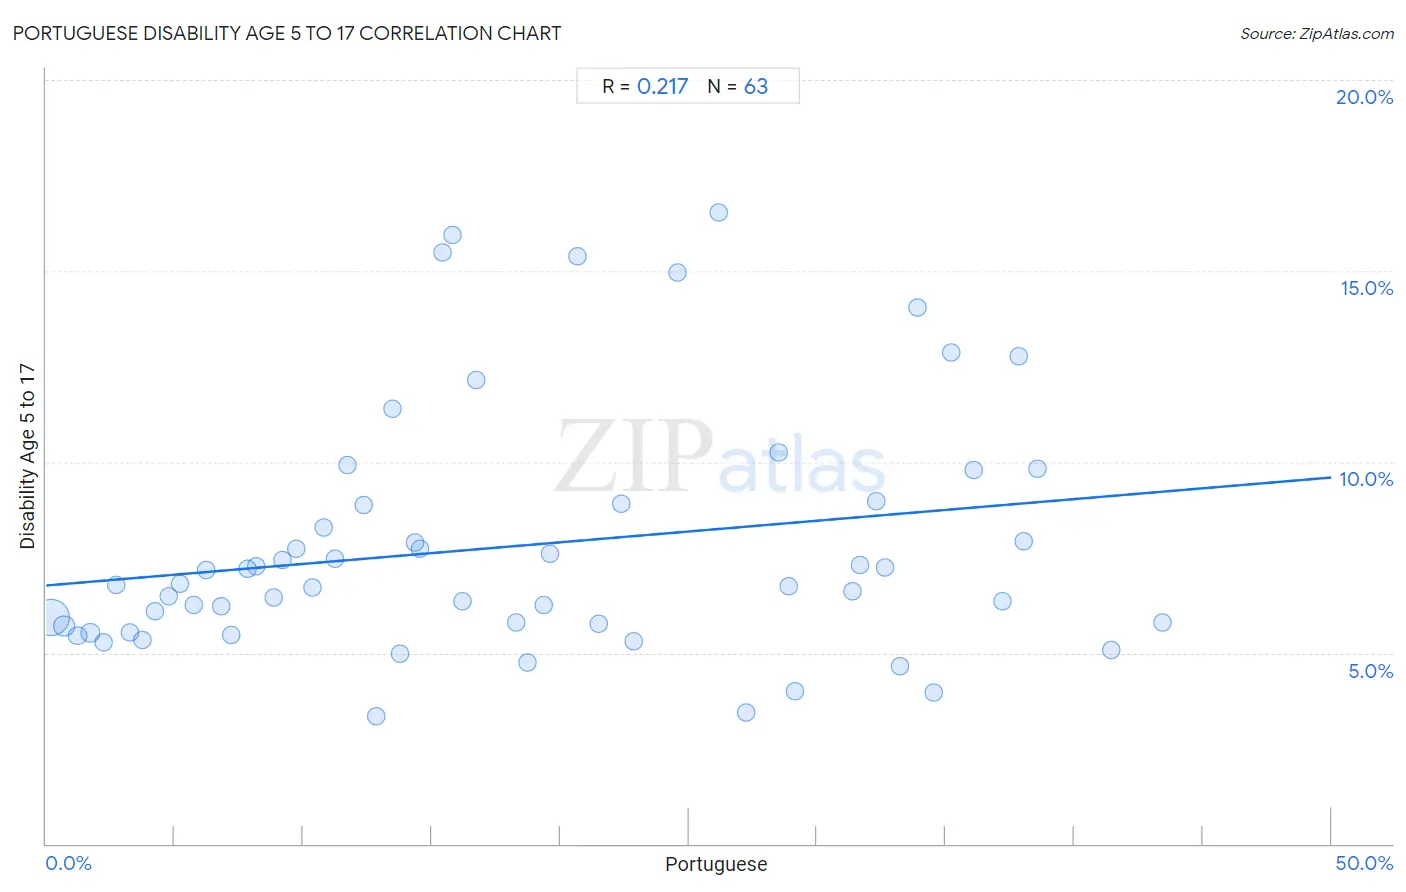
It is essential to understand that the correlation between the percentage of Portuguese and percentage of population with a disability between the ages 5 and 17 does not imply a direct cause-and-effect relationship. It remains uncertain whether the presence of Portuguese influences an upward or downward trend in the level of percentage of population with a disability between the ages 5 and 17 within an area, or if Portuguese simply ended up residing in those areas with higher or lower levels of percentage of population with a disability between the ages 5 and 17 due to other factors.
Demographics Similar to Portuguese by Disability Age 5 to 17
In terms of disability age 5 to 17, the demographic groups most similar to Portuguese are Immigrants from Jamaica (6.1%, a difference of 0.14%), Scottish (6.1%, a difference of 0.25%), Immigrants from Liberia (6.1%, a difference of 0.28%), Puget Sound Salish (6.1%, a difference of 0.36%), and German (6.1%, a difference of 0.50%).
| Demographics | Rating | Rank | Disability Age 5 to 17 |
| Alaska Natives | 0.2 /100 | #273 | Tragic 6.0% |
| Cheyenne | 0.2 /100 | #274 | Tragic 6.0% |
| Dutch | 0.2 /100 | #275 | Tragic 6.0% |
| Japanese | 0.1 /100 | #276 | Tragic 6.1% |
| Puget Sound Salish | 0.1 /100 | #277 | Tragic 6.1% |
| Immigrants from Liberia | 0.1 /100 | #278 | Tragic 6.1% |
| Immigrants from Jamaica | 0.1 /100 | #279 | Tragic 6.1% |
| Portuguese | 0.1 /100 | #280 | Tragic 6.1% |
| Scottish | 0.0 /100 | #281 | Tragic 6.1% |
| Germans | 0.0 /100 | #282 | Tragic 6.1% |
| Ugandans | 0.0 /100 | #283 | Tragic 6.2% |
| Sub-Saharan Africans | 0.0 /100 | #284 | Tragic 6.2% |
| English | 0.0 /100 | #285 | Tragic 6.2% |
| Colville | 0.0 /100 | #286 | Tragic 6.2% |
| Pima | 0.0 /100 | #287 | Tragic 6.2% |
Portuguese Disability Age 5 to 17 Correlation Summary
| Measurement | Portuguese Data | Disability Age 5 to 17 Data |
| Minimum | 0.18% | 3.3% |
| Maximum | 43.5% | 16.5% |
| Range | 43.3% | 13.2% |
| Mean | 18.3% | 7.8% |
| Median | 15.8% | 6.8% |
| Interquartile 25% (IQ1) | 7.8% | 5.7% |
| Interquartile 75% (IQ3) | 29.1% | 8.9% |
| Interquartile Range (IQR) | 21.3% | 3.2% |
| Standard Deviation (Sample) | 12.3% | 3.2% |
| Standard Deviation (Population) | 12.2% | 3.2% |
Correlation Details
| Portuguese Percentile | Sample Size | Disability Age 5 to 17 |
[ 0.0% - 0.5% ] 0.18% | 345,487,038 | 5.9% |
[ 0.5% - 1.0% ] 0.70% | 52,631,578 | 5.7% |
[ 1.0% - 1.5% ] 1.20% | 19,214,010 | 5.4% |
[ 1.5% - 2.0% ] 1.72% | 9,820,946 | 5.5% |
[ 2.0% - 2.5% ] 2.22% | 5,343,447 | 5.3% |
[ 2.5% - 3.0% ] 2.74% | 2,662,898 | 6.8% |
[ 3.0% - 3.5% ] 3.25% | 2,346,651 | 5.5% |
[ 3.5% - 4.0% ] 3.73% | 1,317,765 | 5.3% |
[ 4.0% - 4.5% ] 4.21% | 694,336 | 6.1% |
[ 4.5% - 5.0% ] 4.74% | 801,799 | 6.5% |
[ 5.0% - 5.5% ] 5.22% | 636,438 | 6.8% |
[ 5.5% - 6.0% ] 5.74% | 723,095 | 6.2% |
[ 6.0% - 6.5% ] 6.21% | 403,024 | 7.2% |
[ 6.5% - 7.0% ] 6.79% | 358,654 | 6.2% |
[ 7.0% - 7.5% ] 7.22% | 249,699 | 5.5% |
[ 7.5% - 8.0% ] 7.81% | 318,372 | 7.2% |
[ 8.0% - 8.5% ] 8.19% | 113,195 | 7.3% |
[ 8.5% - 9.0% ] 8.83% | 131,172 | 6.4% |
[ 9.0% - 9.5% ] 9.17% | 140,996 | 7.4% |
[ 9.5% - 10.0% ] 9.74% | 131,181 | 7.7% |
[ 10.0% - 10.5% ] 10.36% | 5,676 | 6.7% |
[ 10.5% - 11.0% ] 10.80% | 59,274 | 8.3% |
[ 11.0% - 11.5% ] 11.22% | 72,367 | 7.5% |
[ 11.5% - 12.0% ] 11.70% | 124,158 | 9.9% |
[ 12.0% - 12.5% ] 12.34% | 8,869 | 8.9% |
[ 12.5% - 13.0% ] 12.86% | 28,653 | 3.3% |
[ 13.0% - 13.5% ] 13.47% | 17,440 | 11.4% |
[ 13.5% - 14.0% ] 13.77% | 25,346 | 5.0% |
[ 14.0% - 14.5% ] 14.34% | 4,880 | 7.9% |
[ 14.5% - 15.0% ] 14.54% | 2,290 | 7.7% |
[ 15.0% - 15.5% ] 15.40% | 5,460 | 15.5% |
[ 15.5% - 16.0% ] 15.81% | 6,140 | 15.9% |
[ 16.0% - 16.5% ] 16.19% | 8,855 | 6.3% |
[ 16.5% - 17.0% ] 16.74% | 19,376 | 12.1% |
[ 18.0% - 18.5% ] 18.28% | 37,822 | 5.8% |
[ 18.5% - 19.0% ] 18.73% | 82,595 | 4.7% |
[ 19.0% - 19.5% ] 19.35% | 52,129 | 6.3% |
[ 19.5% - 20.0% ] 19.58% | 4,519 | 7.6% |
[ 20.5% - 21.0% ] 20.65% | 954 | 15.4% |
[ 21.0% - 21.5% ] 21.48% | 20,883 | 5.8% |
[ 22.0% - 22.5% ] 22.36% | 12,614 | 8.9% |
[ 22.5% - 23.0% ] 22.84% | 51,666 | 5.3% |
[ 24.5% - 25.0% ] 24.56% | 16,286 | 15.0% |
[ 26.0% - 26.5% ] 26.17% | 10,792 | 16.5% |
[ 27.0% - 27.5% ] 27.23% | 7,422 | 3.4% |
[ 28.0% - 28.5% ] 28.50% | 11,117 | 10.2% |
[ 28.5% - 29.0% ] 28.88% | 62,947 | 6.8% |
[ 29.0% - 29.5% ] 29.14% | 21,742 | 4.0% |
[ 31.0% - 31.5% ] 31.35% | 50,072 | 6.6% |
[ 31.5% - 32.0% ] 31.65% | 18,445 | 7.3% |
[ 32.0% - 32.5% ] 32.30% | 10,466 | 9.0% |
[ 32.5% - 33.0% ] 32.62% | 120,137 | 7.2% |
[ 33.0% - 33.5% ] 33.21% | 8,763 | 4.6% |
[ 33.5% - 34.0% ] 33.89% | 15,629 | 14.1% |
[ 34.5% - 35.0% ] 34.52% | 8,403 | 4.0% |
[ 35.0% - 35.5% ] 35.22% | 17,164 | 12.9% |
[ 36.0% - 36.5% ] 36.09% | 93,638 | 9.8% |
[ 37.0% - 37.5% ] 37.20% | 43,238 | 6.4% |
[ 37.5% - 38.0% ] 37.83% | 30,558 | 12.8% |
[ 38.0% - 38.5% ] 38.05% | 21,383 | 7.9% |
[ 38.5% - 39.0% ] 38.59% | 4,556 | 9.8% |
[ 41.0% - 41.5% ] 41.44% | 11,431 | 5.1% |
[ 43.0% - 43.5% ] 43.45% | 25,084 | 5.8% |