Croatian Disability Age 5 to 17
COMPARE
Croatian
Select to Compare
Disability Age 5 to 17
Croatian Disability Age 5 to 17
5.7%
DISABILITY | AGE 5 TO 17
23.6/ 100
METRIC RATING
194th/ 347
METRIC RANK
Croatian Disability Age 5 to 17 Correlation Chart
The statistical analysis conducted on geographies consisting of 372,001,330 people shows a weak positive correlation between the proportion of Croatians and percentage of population with a disability between the ages 5 and 17 in the United States with a correlation coefficient (R) of 0.276 and weighted average of 5.7%. On average, for every 1% (one percent) increase in Croatians within a typical geography, there is an increase of 0.37% in percentage of population with a disability between the ages 5 and 17.
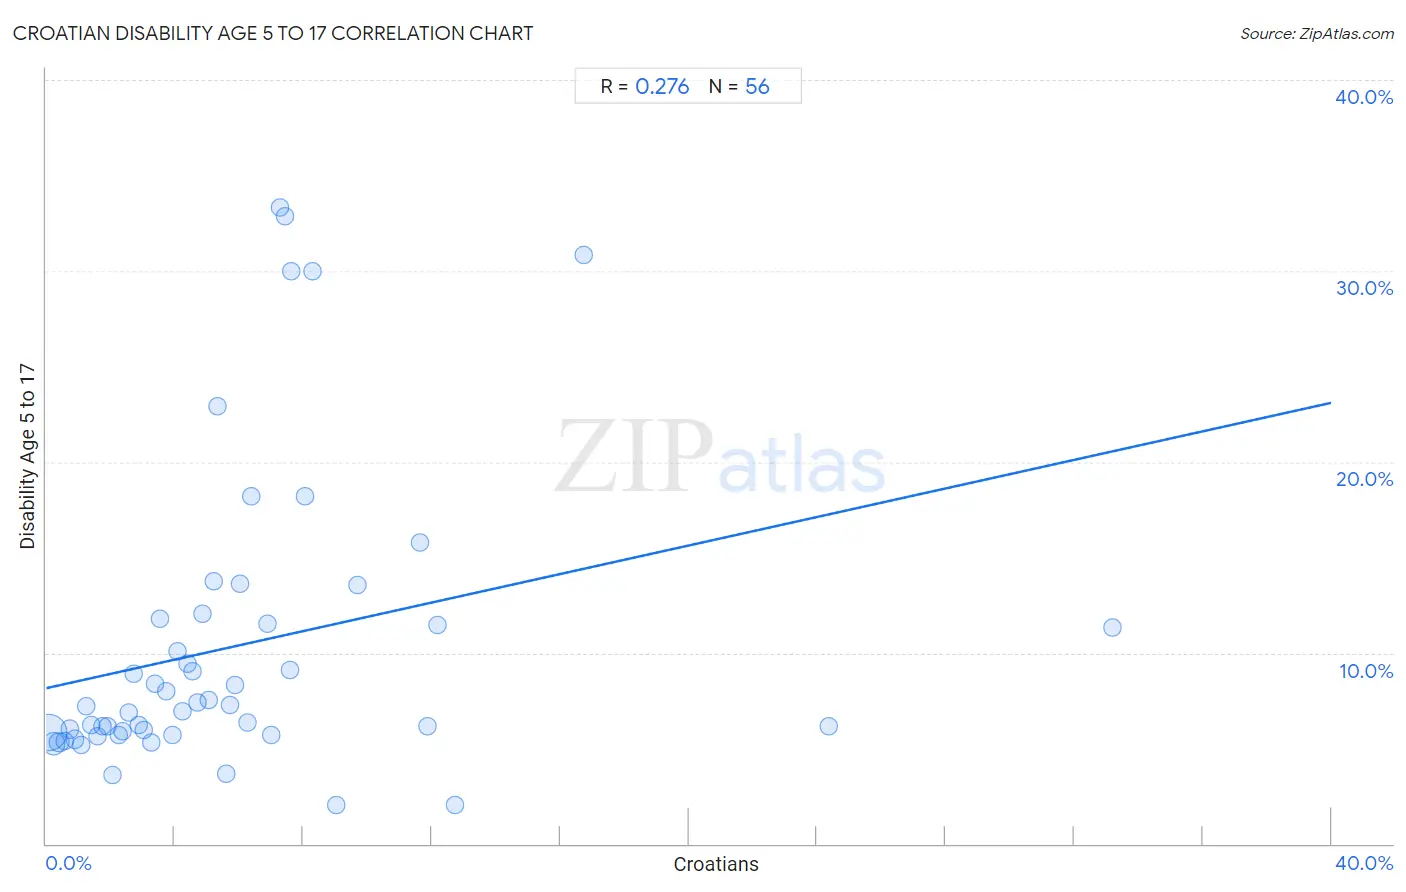
It is essential to understand that the correlation between the percentage of Croatians and percentage of population with a disability between the ages 5 and 17 does not imply a direct cause-and-effect relationship. It remains uncertain whether the presence of Croatians influences an upward or downward trend in the level of percentage of population with a disability between the ages 5 and 17 within an area, or if Croatians simply ended up residing in those areas with higher or lower levels of percentage of population with a disability between the ages 5 and 17 due to other factors.
Demographics Similar to Croatians by Disability Age 5 to 17
In terms of disability age 5 to 17, the demographic groups most similar to Croatians are Immigrants from Nigeria (5.7%, a difference of 0.010%), Inupiat (5.7%, a difference of 0.020%), Immigrants from North America (5.7%, a difference of 0.030%), Immigrants from Canada (5.7%, a difference of 0.16%), and Immigrants from Bosnia and Herzegovina (5.7%, a difference of 0.17%).
| Demographics | Rating | Rank | Disability Age 5 to 17 |
| Immigrants from Thailand | 30.2 /100 | #187 | Fair 5.7% |
| Marshallese | 28.1 /100 | #188 | Fair 5.7% |
| Pueblo | 27.5 /100 | #189 | Fair 5.7% |
| Immigrants from Eastern Africa | 27.3 /100 | #190 | Fair 5.7% |
| Danes | 26.5 /100 | #191 | Fair 5.7% |
| Immigrants from Bosnia and Herzegovina | 26.3 /100 | #192 | Fair 5.7% |
| Immigrants from Canada | 26.1 /100 | #193 | Fair 5.7% |
| Croatians | 23.6 /100 | #194 | Fair 5.7% |
| Immigrants from Nigeria | 23.4 /100 | #195 | Fair 5.7% |
| Inupiat | 23.3 /100 | #196 | Fair 5.7% |
| Immigrants from North America | 23.1 /100 | #197 | Fair 5.7% |
| Norwegians | 20.9 /100 | #198 | Fair 5.7% |
| Northern Europeans | 15.2 /100 | #199 | Poor 5.7% |
| Icelanders | 14.6 /100 | #200 | Poor 5.7% |
| Basques | 13.7 /100 | #201 | Poor 5.7% |
Croatian Disability Age 5 to 17 Correlation Summary
| Measurement | Croatian Data | Disability Age 5 to 17 Data |
| Minimum | 0.073% | 2.0% |
| Maximum | 33.2% | 33.3% |
| Range | 33.1% | 31.3% |
| Mean | 5.8% | 10.3% |
| Median | 4.6% | 7.2% |
| Interquartile 25% (IQ1) | 2.3% | 5.8% |
| Interquartile 75% (IQ3) | 7.4% | 11.6% |
| Interquartile Range (IQR) | 5.0% | 5.9% |
| Standard Deviation (Sample) | 5.7% | 7.8% |
| Standard Deviation (Population) | 5.7% | 7.7% |
Correlation Details
| Croatian Percentile | Sample Size | Disability Age 5 to 17 |
[ 0.0% - 0.5% ] 0.073% | 255,257,959 | 5.8% |
[ 0.0% - 0.5% ] 0.23% | 69,280,860 | 5.2% |
[ 0.0% - 0.5% ] 0.40% | 22,414,128 | 5.3% |
[ 0.5% - 1.0% ] 0.57% | 9,502,813 | 5.4% |
[ 0.5% - 1.0% ] 0.74% | 5,622,260 | 6.0% |
[ 0.5% - 1.0% ] 0.91% | 3,110,633 | 5.5% |
[ 1.0% - 1.5% ] 1.08% | 1,718,644 | 5.2% |
[ 1.0% - 1.5% ] 1.24% | 940,148 | 7.2% |
[ 1.0% - 1.5% ] 1.40% | 612,263 | 6.2% |
[ 1.5% - 2.0% ] 1.58% | 480,458 | 5.6% |
[ 1.5% - 2.0% ] 1.75% | 573,377 | 6.2% |
[ 1.5% - 2.0% ] 1.91% | 472,818 | 6.2% |
[ 2.0% - 2.5% ] 2.07% | 344,420 | 3.6% |
[ 2.0% - 2.5% ] 2.24% | 351,167 | 5.7% |
[ 2.0% - 2.5% ] 2.39% | 315,757 | 5.9% |
[ 2.5% - 3.0% ] 2.58% | 158,097 | 6.9% |
[ 2.5% - 3.0% ] 2.71% | 105,372 | 8.9% |
[ 2.5% - 3.0% ] 2.89% | 160,166 | 6.2% |
[ 3.0% - 3.5% ] 3.03% | 118,176 | 6.0% |
[ 3.0% - 3.5% ] 3.26% | 27,818 | 5.3% |
[ 3.0% - 3.5% ] 3.38% | 52,965 | 8.4% |
[ 3.5% - 4.0% ] 3.56% | 40,407 | 11.8% |
[ 3.5% - 4.0% ] 3.72% | 74,955 | 8.0% |
[ 3.5% - 4.0% ] 3.92% | 18,380 | 5.7% |
[ 4.0% - 4.5% ] 4.08% | 29,730 | 10.1% |
[ 4.0% - 4.5% ] 4.23% | 103,849 | 7.0% |
[ 4.0% - 4.5% ] 4.39% | 3,945 | 9.4% |
[ 4.5% - 5.0% ] 4.54% | 14,768 | 9.0% |
[ 4.5% - 5.0% ] 4.71% | 9,392 | 7.4% |
[ 4.5% - 5.0% ] 4.86% | 6,421 | 12.0% |
[ 5.0% - 5.5% ] 5.06% | 2,136 | 7.5% |
[ 5.0% - 5.5% ] 5.20% | 13,274 | 13.7% |
[ 5.0% - 5.5% ] 5.35% | 505 | 22.9% |
[ 5.5% - 6.0% ] 5.61% | 22,078 | 3.7% |
[ 5.5% - 6.0% ] 5.73% | 6,088 | 7.2% |
[ 5.5% - 6.0% ] 5.87% | 6,266 | 8.3% |
[ 6.0% - 6.5% ] 6.04% | 5,533 | 13.6% |
[ 6.0% - 6.5% ] 6.26% | 463 | 6.3% |
[ 6.0% - 6.5% ] 6.38% | 1,912 | 18.2% |
[ 6.5% - 7.0% ] 6.89% | 5,038 | 11.5% |
[ 6.5% - 7.0% ] 7.00% | 7,759 | 5.7% |
[ 7.0% - 7.5% ] 7.27% | 110 | 33.3% |
[ 7.0% - 7.5% ] 7.43% | 1,278 | 32.9% |
[ 7.5% - 8.0% ] 7.57% | 1,466 | 9.1% |
[ 7.5% - 8.0% ] 7.64% | 314 | 30.0% |
[ 8.0% - 8.5% ] 8.04% | 199 | 18.2% |
[ 8.0% - 8.5% ] 8.30% | 289 | 30.0% |
[ 9.0% - 9.5% ] 9.03% | 299 | 2.0% |
[ 9.5% - 10.0% ] 9.68% | 589 | 13.6% |
[ 11.5% - 12.0% ] 11.62% | 912 | 15.8% |
[ 11.5% - 12.0% ] 11.87% | 396 | 6.2% |
[ 12.0% - 12.5% ] 12.16% | 148 | 11.4% |
[ 12.5% - 13.0% ] 12.71% | 480 | 2.0% |
[ 16.5% - 17.0% ] 16.74% | 1,111 | 30.8% |
[ 24.0% - 24.5% ] 24.36% | 312 | 6.2% |
[ 33.0% - 33.5% ] 33.19% | 229 | 11.3% |