Assyrian/Chaldean/Syriac vs Nigerian Disability Age 5 to 17
COMPARE
Assyrian/Chaldean/Syriac
Nigerian
Disability Age 5 to 17
Disability Age 5 to 17 Comparison
Assyrians/Chaldeans/Syriacs
Nigerians
5.0%
DISABILITY AGE 5 TO 17
100.0/ 100
METRIC RATING
46th/ 347
METRIC RANK
5.8%
DISABILITY AGE 5 TO 17
7.5/ 100
METRIC RATING
216th/ 347
METRIC RANK
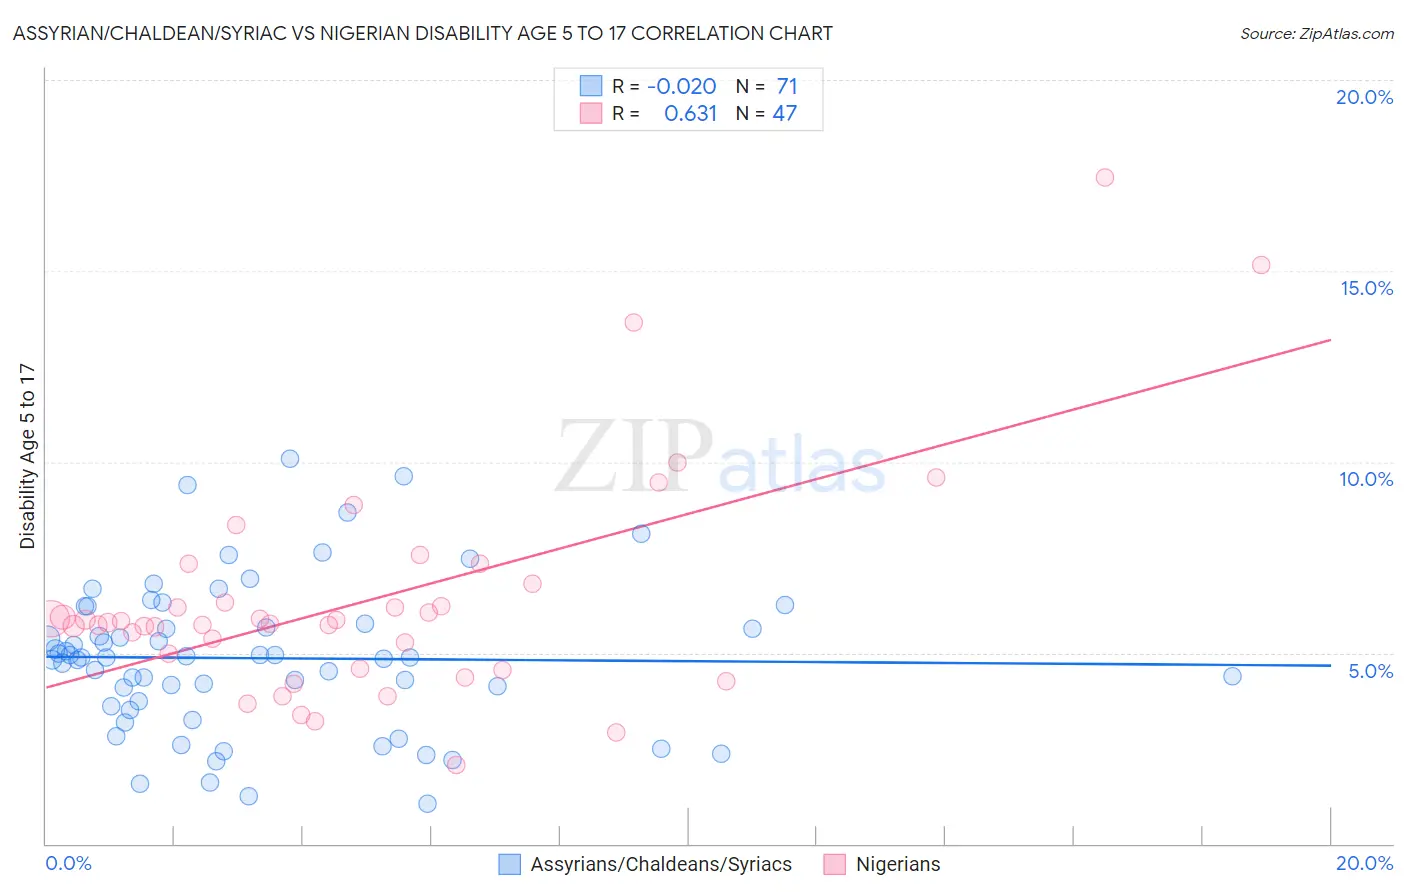
Assyrian/Chaldean/Syriac vs Nigerian Disability Age 5 to 17 Correlation Chart
The statistical analysis conducted on geographies consisting of 110,004,122 people shows no correlation between the proportion of Assyrians/Chaldeans/Syriacs and percentage of population with a disability between the ages 5 and 17 in the United States with a correlation coefficient (R) of -0.020 and weighted average of 5.0%. Similarly, the statistical analysis conducted on geographies consisting of 330,899,838 people shows a significant positive correlation between the proportion of Nigerians and percentage of population with a disability between the ages 5 and 17 in the United States with a correlation coefficient (R) of 0.631 and weighted average of 5.8%, a difference of 14.4%.
Disability Age 5 to 17 Correlation Summary
| Measurement | Assyrian/Chaldean/Syriac | Nigerian |
| Minimum | 1.0% | 2.1% |
| Maximum | 10.1% | 17.5% |
| Range | 9.0% | 15.4% |
| Mean | 4.9% | 6.4% |
| Median | 4.9% | 5.8% |
| Interquartile 25% (IQ1) | 3.6% | 4.6% |
| Interquartile 75% (IQ3) | 5.8% | 6.8% |
| Interquartile Range (IQR) | 2.2% | 2.2% |
| Standard Deviation (Sample) | 2.0% | 2.9% |
| Standard Deviation (Population) | 1.9% | 2.9% |
Similar Demographics by Disability Age 5 to 17
Demographics Similar to Assyrians/Chaldeans/Syriacs by Disability Age 5 to 17
In terms of disability age 5 to 17, the demographic groups most similar to Assyrians/Chaldeans/Syriacs are Tongan (5.0%, a difference of 0.070%), Vietnamese (5.1%, a difference of 0.13%), Egyptian (5.0%, a difference of 0.14%), Immigrants from Russia (5.0%, a difference of 0.18%), and Korean (5.1%, a difference of 0.31%).
| Demographics | Rating | Rank | Disability Age 5 to 17 |
| Immigrants | Argentina | 100.0 /100 | #39 | Exceptional 5.0% |
| Okinawans | 100.0 /100 | #40 | Exceptional 5.0% |
| Immigrants | Australia | 100.0 /100 | #41 | Exceptional 5.0% |
| Immigrants | Sri Lanka | 100.0 /100 | #42 | Exceptional 5.0% |
| Immigrants | Russia | 100.0 /100 | #43 | Exceptional 5.0% |
| Egyptians | 100.0 /100 | #44 | Exceptional 5.0% |
| Tongans | 100.0 /100 | #45 | Exceptional 5.0% |
| Assyrians/Chaldeans/Syriacs | 100.0 /100 | #46 | Exceptional 5.0% |
| Vietnamese | 100.0 /100 | #47 | Exceptional 5.1% |
| Koreans | 100.0 /100 | #48 | Exceptional 5.1% |
| Immigrants | Western Asia | 100.0 /100 | #49 | Exceptional 5.1% |
| Argentineans | 99.9 /100 | #50 | Exceptional 5.1% |
| Turks | 99.9 /100 | #51 | Exceptional 5.1% |
| Immigrants | Fiji | 99.9 /100 | #52 | Exceptional 5.1% |
| Immigrants | Lithuania | 99.9 /100 | #53 | Exceptional 5.1% |
Demographics Similar to Nigerians by Disability Age 5 to 17
In terms of disability age 5 to 17, the demographic groups most similar to Nigerians are Czech (5.8%, a difference of 0.030%), Immigrants from Sierra Leone (5.8%, a difference of 0.080%), Swedish (5.8%, a difference of 0.090%), Sierra Leonean (5.8%, a difference of 0.090%), and Belgian (5.8%, a difference of 0.10%).
| Demographics | Rating | Rank | Disability Age 5 to 17 |
| Immigrants | Uganda | 9.7 /100 | #209 | Tragic 5.8% |
| Immigrants | Haiti | 9.5 /100 | #210 | Tragic 5.8% |
| Yugoslavians | 9.1 /100 | #211 | Tragic 5.8% |
| Immigrants | Panama | 8.7 /100 | #212 | Tragic 5.8% |
| Immigrants | Cameroon | 8.3 /100 | #213 | Tragic 5.8% |
| Immigrants | Morocco | 8.3 /100 | #214 | Tragic 5.8% |
| Swedes | 8.1 /100 | #215 | Tragic 5.8% |
| Nigerians | 7.5 /100 | #216 | Tragic 5.8% |
| Czechs | 7.4 /100 | #217 | Tragic 5.8% |
| Immigrants | Sierra Leone | 7.1 /100 | #218 | Tragic 5.8% |
| Sierra Leoneans | 7.0 /100 | #219 | Tragic 5.8% |
| Belgians | 6.9 /100 | #220 | Tragic 5.8% |
| Lithuanians | 6.7 /100 | #221 | Tragic 5.8% |
| Immigrants | Sudan | 6.7 /100 | #222 | Tragic 5.8% |
| Alsatians | 6.0 /100 | #223 | Tragic 5.8% |