Assyrian/Chaldean/Syriac vs Immigrants from China Disability Age 5 to 17
COMPARE
Assyrian/Chaldean/Syriac
Immigrants from China
Disability Age 5 to 17
Disability Age 5 to 17 Comparison
Assyrians/Chaldeans/Syriacs
Immigrants from China
5.0%
DISABILITY AGE 5 TO 17
100.0/ 100
METRIC RATING
46th/ 347
METRIC RANK
4.5%
DISABILITY AGE 5 TO 17
100.0/ 100
METRIC RATING
7th/ 347
METRIC RANK
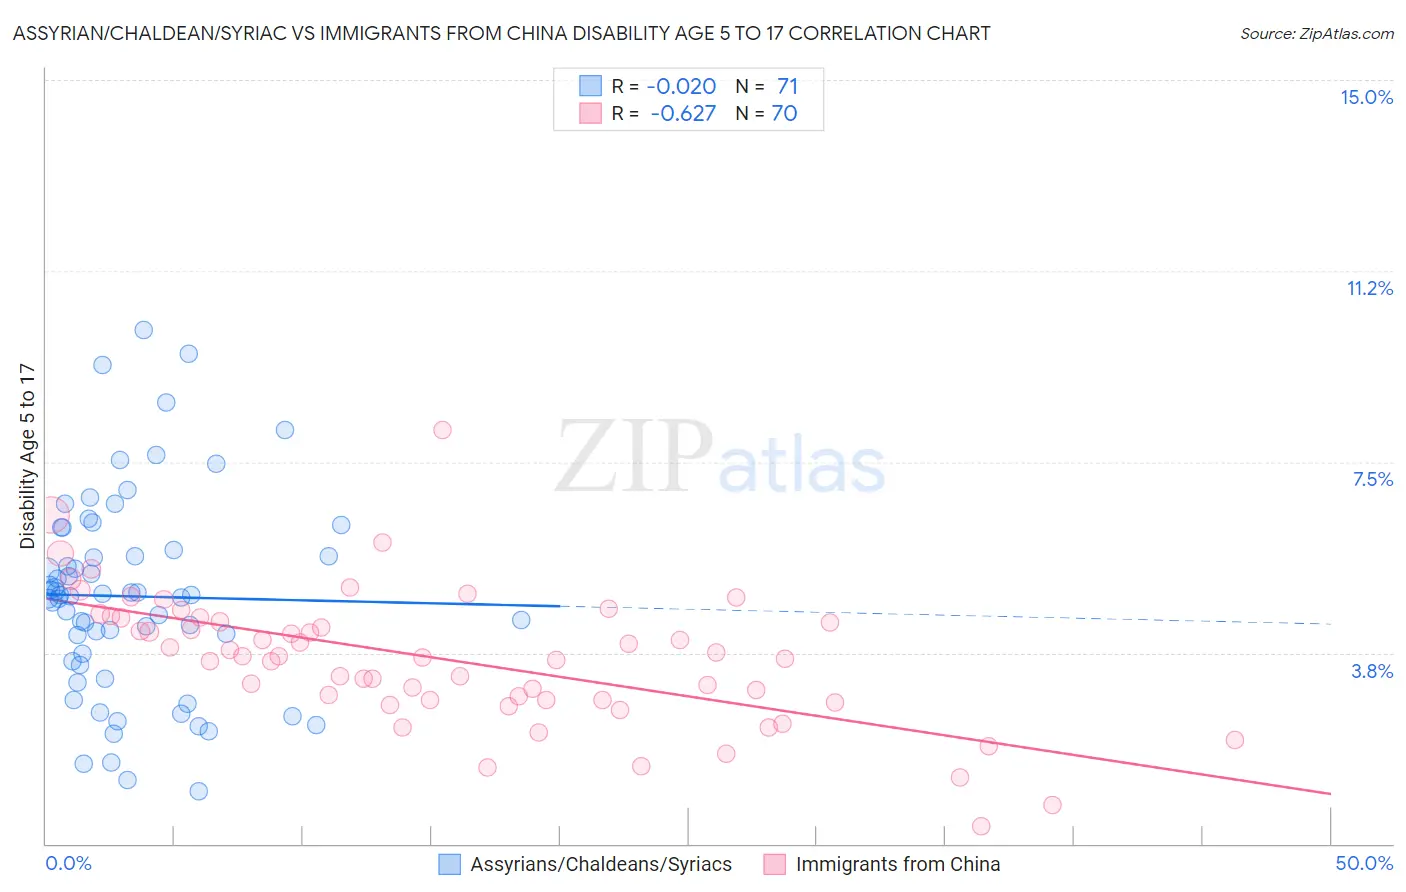
Assyrian/Chaldean/Syriac vs Immigrants from China Disability Age 5 to 17 Correlation Chart
The statistical analysis conducted on geographies consisting of 110,004,122 people shows no correlation between the proportion of Assyrians/Chaldeans/Syriacs and percentage of population with a disability between the ages 5 and 17 in the United States with a correlation coefficient (R) of -0.020 and weighted average of 5.0%. Similarly, the statistical analysis conducted on geographies consisting of 452,068,027 people shows a significant negative correlation between the proportion of Immigrants from China and percentage of population with a disability between the ages 5 and 17 in the United States with a correlation coefficient (R) of -0.627 and weighted average of 4.5%, a difference of 11.5%.
Disability Age 5 to 17 Correlation Summary
| Measurement | Assyrian/Chaldean/Syriac | Immigrants from China |
| Minimum | 1.0% | 0.35% |
| Maximum | 10.1% | 8.1% |
| Range | 9.0% | 7.8% |
| Mean | 4.9% | 3.6% |
| Median | 4.9% | 3.7% |
| Interquartile 25% (IQ1) | 3.6% | 2.8% |
| Interquartile 75% (IQ3) | 5.8% | 4.4% |
| Interquartile Range (IQR) | 2.2% | 1.6% |
| Standard Deviation (Sample) | 2.0% | 1.3% |
| Standard Deviation (Population) | 1.9% | 1.3% |
Similar Demographics by Disability Age 5 to 17
Demographics Similar to Assyrians/Chaldeans/Syriacs by Disability Age 5 to 17
In terms of disability age 5 to 17, the demographic groups most similar to Assyrians/Chaldeans/Syriacs are Tongan (5.0%, a difference of 0.070%), Vietnamese (5.1%, a difference of 0.13%), Egyptian (5.0%, a difference of 0.14%), Immigrants from Russia (5.0%, a difference of 0.18%), and Korean (5.1%, a difference of 0.31%).
| Demographics | Rating | Rank | Disability Age 5 to 17 |
| Immigrants | Argentina | 100.0 /100 | #39 | Exceptional 5.0% |
| Okinawans | 100.0 /100 | #40 | Exceptional 5.0% |
| Immigrants | Australia | 100.0 /100 | #41 | Exceptional 5.0% |
| Immigrants | Sri Lanka | 100.0 /100 | #42 | Exceptional 5.0% |
| Immigrants | Russia | 100.0 /100 | #43 | Exceptional 5.0% |
| Egyptians | 100.0 /100 | #44 | Exceptional 5.0% |
| Tongans | 100.0 /100 | #45 | Exceptional 5.0% |
| Assyrians/Chaldeans/Syriacs | 100.0 /100 | #46 | Exceptional 5.0% |
| Vietnamese | 100.0 /100 | #47 | Exceptional 5.1% |
| Koreans | 100.0 /100 | #48 | Exceptional 5.1% |
| Immigrants | Western Asia | 100.0 /100 | #49 | Exceptional 5.1% |
| Argentineans | 99.9 /100 | #50 | Exceptional 5.1% |
| Turks | 99.9 /100 | #51 | Exceptional 5.1% |
| Immigrants | Fiji | 99.9 /100 | #52 | Exceptional 5.1% |
| Immigrants | Lithuania | 99.9 /100 | #53 | Exceptional 5.1% |
Demographics Similar to Immigrants from China by Disability Age 5 to 17
In terms of disability age 5 to 17, the demographic groups most similar to Immigrants from China are Immigrants from Israel (4.5%, a difference of 0.31%), Indian (Asian) (4.6%, a difference of 0.93%), Immigrants from Eastern Asia (4.6%, a difference of 1.3%), Immigrants from India (4.6%, a difference of 1.3%), and Armenian (4.6%, a difference of 1.5%).
| Demographics | Rating | Rank | Disability Age 5 to 17 |
| Immigrants | Armenia | 100.0 /100 | #1 | Exceptional 4.1% |
| Immigrants | Taiwan | 100.0 /100 | #2 | Exceptional 4.2% |
| Immigrants | Hong Kong | 100.0 /100 | #3 | Exceptional 4.3% |
| Filipinos | 100.0 /100 | #4 | Exceptional 4.3% |
| Immigrants | Iran | 100.0 /100 | #5 | Exceptional 4.4% |
| Immigrants | Israel | 100.0 /100 | #6 | Exceptional 4.5% |
| Immigrants | China | 100.0 /100 | #7 | Exceptional 4.5% |
| Indians (Asian) | 100.0 /100 | #8 | Exceptional 4.6% |
| Immigrants | Eastern Asia | 100.0 /100 | #9 | Exceptional 4.6% |
| Immigrants | India | 100.0 /100 | #10 | Exceptional 4.6% |
| Armenians | 100.0 /100 | #11 | Exceptional 4.6% |
| Iranians | 100.0 /100 | #12 | Exceptional 4.6% |
| Thais | 100.0 /100 | #13 | Exceptional 4.7% |
| Immigrants | Korea | 100.0 /100 | #14 | Exceptional 4.7% |
| Chinese | 100.0 /100 | #15 | Exceptional 4.7% |