Immigrants from Ireland Disability Age 5 to 17
COMPARE
Immigrants from Ireland
Select to Compare
Disability Age 5 to 17
Immigrants from Ireland Disability Age 5 to 17
5.2%
DISABILITY | AGE 5 TO 17
99.8/ 100
METRIC RATING
62nd/ 347
METRIC RANK
Immigrants from Ireland Disability Age 5 to 17 Correlation Chart
The statistical analysis conducted on geographies consisting of 239,046,676 people shows a moderate positive correlation between the proportion of Immigrants from Ireland and percentage of population with a disability between the ages 5 and 17 in the United States with a correlation coefficient (R) of 0.431 and weighted average of 5.2%. On average, for every 1% (one percent) increase in Immigrants from Ireland within a typical geography, there is an increase of 1.1% in percentage of population with a disability between the ages 5 and 17.
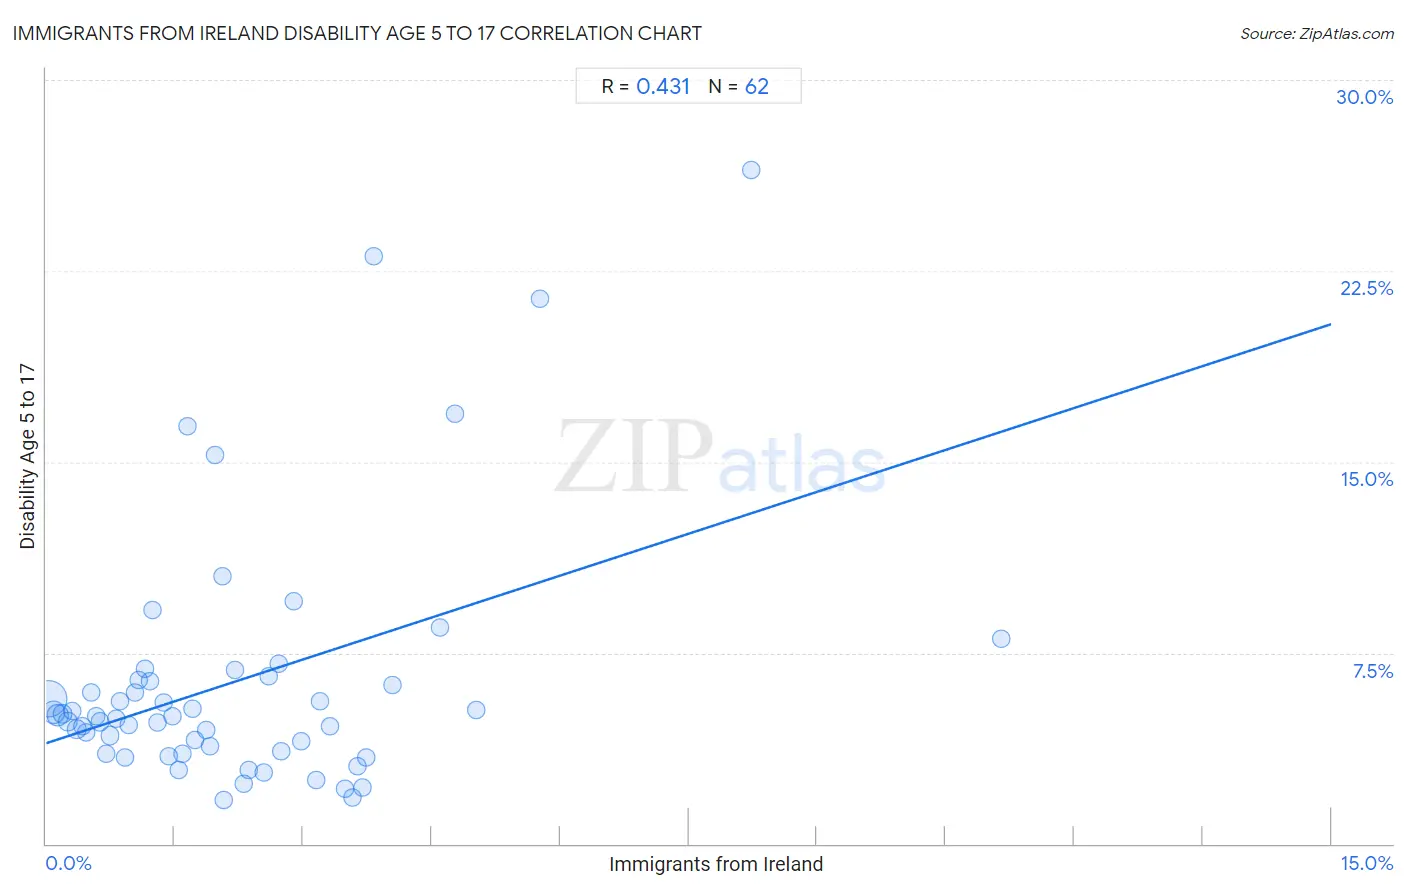
It is essential to understand that the correlation between the percentage of Immigrants from Ireland and percentage of population with a disability between the ages 5 and 17 does not imply a direct cause-and-effect relationship. It remains uncertain whether the presence of Immigrants from Ireland influences an upward or downward trend in the level of percentage of population with a disability between the ages 5 and 17 within an area, or if Immigrants from Ireland simply ended up residing in those areas with higher or lower levels of percentage of population with a disability between the ages 5 and 17 due to other factors.
Demographics Similar to Immigrants from Ireland by Disability Age 5 to 17
In terms of disability age 5 to 17, the demographic groups most similar to Immigrants from Ireland are Immigrants from Switzerland (5.2%, a difference of 0.090%), Immigrants from Bangladesh (5.2%, a difference of 0.11%), Immigrants from South Eastern Asia (5.2%, a difference of 0.14%), Immigrants from Greece (5.2%, a difference of 0.15%), and Palestinian (5.2%, a difference of 0.19%).
| Demographics | Rating | Rank | Disability Age 5 to 17 |
| Laotians | 99.9 /100 | #55 | Exceptional 5.1% |
| Immigrants from Turkey | 99.9 /100 | #56 | Exceptional 5.1% |
| Immigrants from Poland | 99.9 /100 | #57 | Exceptional 5.1% |
| Immigrants from Ukraine | 99.9 /100 | #58 | Exceptional 5.1% |
| Immigrants from North Macedonia | 99.9 /100 | #59 | Exceptional 5.1% |
| Immigrants from Eastern Europe | 99.9 /100 | #60 | Exceptional 5.1% |
| Immigrants from Switzerland | 99.8 /100 | #61 | Exceptional 5.2% |
| Immigrants from Ireland | 99.8 /100 | #62 | Exceptional 5.2% |
| Immigrants from Bangladesh | 99.8 /100 | #63 | Exceptional 5.2% |
| Immigrants from South Eastern Asia | 99.8 /100 | #64 | Exceptional 5.2% |
| Immigrants from Greece | 99.8 /100 | #65 | Exceptional 5.2% |
| Palestinians | 99.8 /100 | #66 | Exceptional 5.2% |
| Macedonians | 99.8 /100 | #67 | Exceptional 5.2% |
| Immigrants from Syria | 99.7 /100 | #68 | Exceptional 5.2% |
| Guyanese | 99.7 /100 | #69 | Exceptional 5.2% |
Immigrants from Ireland Disability Age 5 to 17 Correlation Summary
| Measurement | Immigrants from Ireland Data | Disability Age 5 to 17 Data |
| Minimum | 0.024% | 1.7% |
| Maximum | 11.1% | 26.5% |
| Range | 11.1% | 24.8% |
| Mean | 2.2% | 6.4% |
| Median | 1.7% | 5.0% |
| Interquartile 25% (IQ1) | 0.86% | 3.6% |
| Interquartile 75% (IQ3) | 3.1% | 6.4% |
| Interquartile Range (IQR) | 2.3% | 2.8% |
| Standard Deviation (Sample) | 2.0% | 5.0% |
| Standard Deviation (Population) | 1.9% | 4.9% |
Correlation Details
| Immigrants from Ireland Percentile | Sample Size | Disability Age 5 to 17 |
[ 0.0% - 0.5% ] 0.024% | 144,505,107 | 5.7% |
[ 0.0% - 0.5% ] 0.080% | 41,355,811 | 5.2% |
[ 0.0% - 0.5% ] 0.14% | 25,688,047 | 5.1% |
[ 0.0% - 0.5% ] 0.19% | 8,412,381 | 5.1% |
[ 0.0% - 0.5% ] 0.25% | 5,105,354 | 4.8% |
[ 0.0% - 0.5% ] 0.31% | 3,635,798 | 5.2% |
[ 0.0% - 0.5% ] 0.36% | 2,658,722 | 4.5% |
[ 0.0% - 0.5% ] 0.42% | 1,384,316 | 4.6% |
[ 0.0% - 0.5% ] 0.47% | 1,066,648 | 4.4% |
[ 0.5% - 1.0% ] 0.52% | 800,795 | 5.9% |
[ 0.5% - 1.0% ] 0.58% | 873,521 | 5.0% |
[ 0.5% - 1.0% ] 0.63% | 589,743 | 4.8% |
[ 0.5% - 1.0% ] 0.70% | 361,944 | 3.6% |
[ 0.5% - 1.0% ] 0.75% | 390,815 | 4.2% |
[ 0.5% - 1.0% ] 0.81% | 375,693 | 4.9% |
[ 0.5% - 1.0% ] 0.86% | 325,388 | 5.6% |
[ 0.5% - 1.0% ] 0.92% | 72,432 | 3.4% |
[ 0.5% - 1.0% ] 0.97% | 108,387 | 4.7% |
[ 1.0% - 1.5% ] 1.04% | 119,545 | 6.0% |
[ 1.0% - 1.5% ] 1.08% | 250,863 | 6.4% |
[ 1.0% - 1.5% ] 1.16% | 66,723 | 6.9% |
[ 1.0% - 1.5% ] 1.21% | 283,834 | 6.4% |
[ 1.0% - 1.5% ] 1.24% | 73,841 | 9.2% |
[ 1.0% - 1.5% ] 1.30% | 83,847 | 4.7% |
[ 1.0% - 1.5% ] 1.37% | 41,009 | 5.5% |
[ 1.0% - 1.5% ] 1.43% | 23,080 | 3.4% |
[ 1.0% - 1.5% ] 1.47% | 41,090 | 5.0% |
[ 1.5% - 2.0% ] 1.54% | 55,238 | 2.9% |
[ 1.5% - 2.0% ] 1.59% | 15,643 | 3.6% |
[ 1.5% - 2.0% ] 1.65% | 9,515 | 16.4% |
[ 1.5% - 2.0% ] 1.71% | 15,807 | 5.3% |
[ 1.5% - 2.0% ] 1.74% | 29,568 | 4.1% |
[ 1.5% - 2.0% ] 1.86% | 30,627 | 4.5% |
[ 1.5% - 2.0% ] 1.91% | 26,076 | 3.8% |
[ 1.5% - 2.0% ] 1.96% | 9,062 | 15.3% |
[ 2.0% - 2.5% ] 2.05% | 341 | 10.5% |
[ 2.0% - 2.5% ] 2.08% | 6,312 | 1.7% |
[ 2.0% - 2.5% ] 2.21% | 996 | 6.8% |
[ 2.0% - 2.5% ] 2.30% | 304 | 2.4% |
[ 2.0% - 2.5% ] 2.36% | 9,856 | 2.9% |
[ 2.5% - 3.0% ] 2.54% | 2,991 | 2.8% |
[ 2.5% - 3.0% ] 2.60% | 3,034 | 6.6% |
[ 2.5% - 3.0% ] 2.72% | 2,799 | 7.0% |
[ 2.5% - 3.0% ] 2.74% | 7,599 | 3.6% |
[ 2.5% - 3.0% ] 2.89% | 3,809 | 9.5% |
[ 2.5% - 3.0% ] 2.97% | 20,306 | 4.0% |
[ 3.0% - 3.5% ] 3.15% | 4,481 | 2.5% |
[ 3.0% - 3.5% ] 3.20% | 2,812 | 5.6% |
[ 3.0% - 3.5% ] 3.31% | 8,872 | 4.6% |
[ 3.0% - 3.5% ] 3.49% | 15,666 | 2.1% |
[ 3.5% - 4.0% ] 3.58% | 2,041 | 1.8% |
[ 3.5% - 4.0% ] 3.64% | 1,292 | 3.1% |
[ 3.5% - 4.0% ] 3.70% | 16,426 | 2.2% |
[ 3.5% - 4.0% ] 3.74% | 3,828 | 3.4% |
[ 3.5% - 4.0% ] 3.83% | 575 | 23.1% |
[ 4.0% - 4.5% ] 4.05% | 7,312 | 6.2% |
[ 4.5% - 5.0% ] 4.59% | 2,047 | 8.5% |
[ 4.5% - 5.0% ] 4.77% | 943 | 16.9% |
[ 5.0% - 5.5% ] 5.01% | 32,438 | 5.2% |
[ 5.5% - 6.0% ] 5.76% | 191 | 21.4% |
[ 8.0% - 8.5% ] 8.24% | 595 | 26.5% |
[ 11.0% - 11.5% ] 11.14% | 2,540 | 8.0% |