Assyrian/Chaldean/Syriac vs Immigrants from Poland Disability Age 5 to 17
COMPARE
Assyrian/Chaldean/Syriac
Immigrants from Poland
Disability Age 5 to 17
Disability Age 5 to 17 Comparison
Assyrians/Chaldeans/Syriacs
Immigrants from Poland
5.0%
DISABILITY AGE 5 TO 17
100.0/ 100
METRIC RATING
46th/ 347
METRIC RANK
5.1%
DISABILITY AGE 5 TO 17
99.9/ 100
METRIC RATING
57th/ 347
METRIC RANK
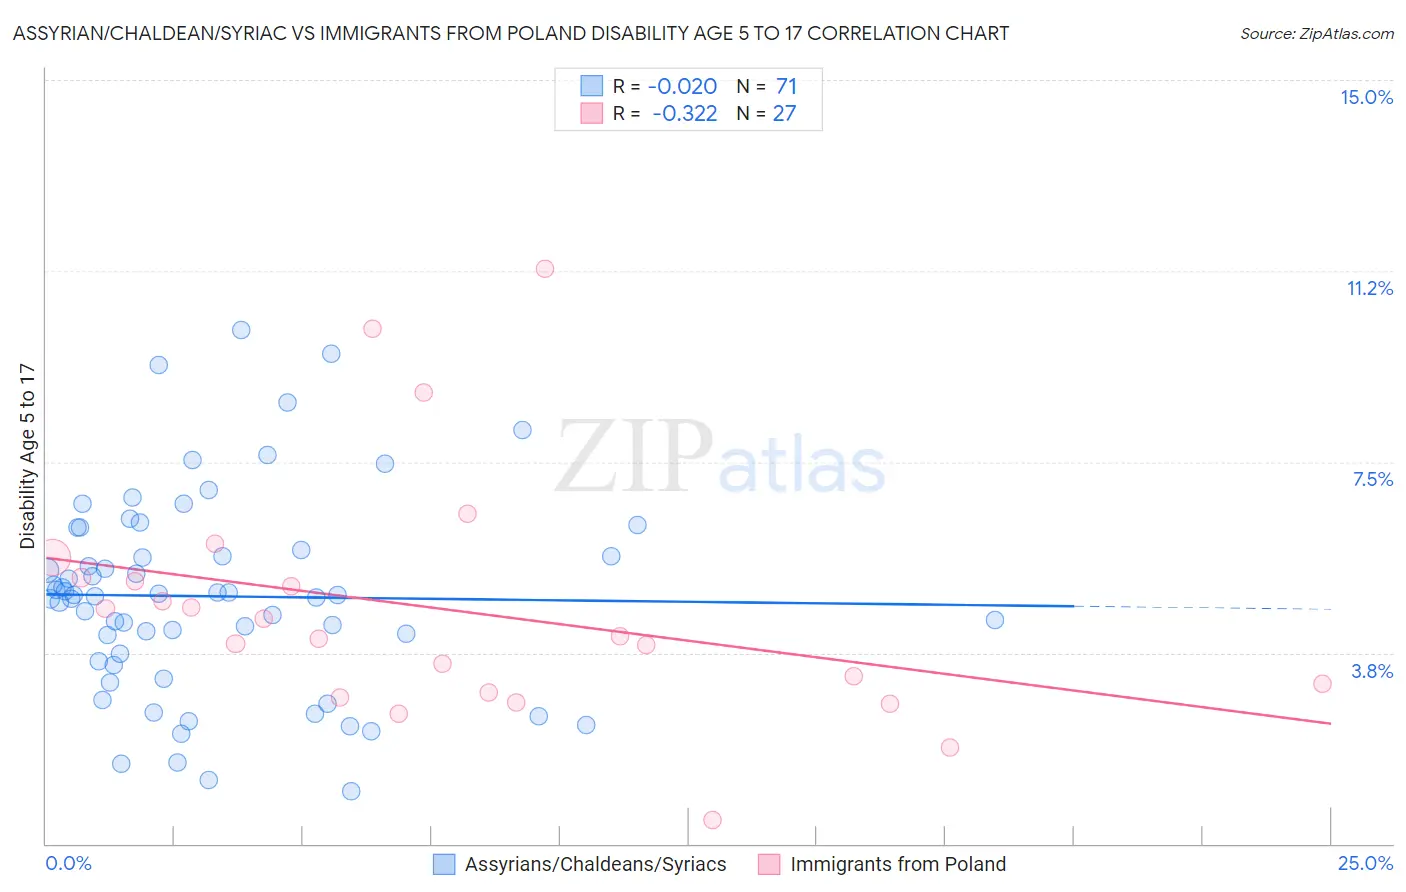
Assyrian/Chaldean/Syriac vs Immigrants from Poland Disability Age 5 to 17 Correlation Chart
The statistical analysis conducted on geographies consisting of 110,004,122 people shows no correlation between the proportion of Assyrians/Chaldeans/Syriacs and percentage of population with a disability between the ages 5 and 17 in the United States with a correlation coefficient (R) of -0.020 and weighted average of 5.0%. Similarly, the statistical analysis conducted on geographies consisting of 302,444,917 people shows a mild negative correlation between the proportion of Immigrants from Poland and percentage of population with a disability between the ages 5 and 17 in the United States with a correlation coefficient (R) of -0.322 and weighted average of 5.1%, a difference of 1.5%.
Disability Age 5 to 17 Correlation Summary
| Measurement | Assyrian/Chaldean/Syriac | Immigrants from Poland |
| Minimum | 1.0% | 0.46% |
| Maximum | 10.1% | 11.3% |
| Range | 9.0% | 10.8% |
| Mean | 4.9% | 4.6% |
| Median | 4.9% | 4.1% |
| Interquartile 25% (IQ1) | 3.6% | 3.0% |
| Interquartile 75% (IQ3) | 5.8% | 5.2% |
| Interquartile Range (IQR) | 2.2% | 2.3% |
| Standard Deviation (Sample) | 2.0% | 2.4% |
| Standard Deviation (Population) | 1.9% | 2.3% |
Demographics Similar to Assyrians/Chaldeans/Syriacs and Immigrants from Poland by Disability Age 5 to 17
In terms of disability age 5 to 17, the demographic groups most similar to Assyrians/Chaldeans/Syriacs are Tongan (5.0%, a difference of 0.070%), Vietnamese (5.1%, a difference of 0.13%), Egyptian (5.0%, a difference of 0.14%), Immigrants from Russia (5.0%, a difference of 0.18%), and Korean (5.1%, a difference of 0.31%). Similarly, the demographic groups most similar to Immigrants from Poland are Immigrants from Ukraine (5.1%, a difference of 0.090%), Immigrants from Turkey (5.1%, a difference of 0.14%), Laotian (5.1%, a difference of 0.16%), Paraguayan (5.1%, a difference of 0.20%), and Immigrants from Lithuania (5.1%, a difference of 0.23%).
| Demographics | Rating | Rank | Disability Age 5 to 17 |
| Immigrants | Australia | 100.0 /100 | #41 | Exceptional 5.0% |
| Immigrants | Sri Lanka | 100.0 /100 | #42 | Exceptional 5.0% |
| Immigrants | Russia | 100.0 /100 | #43 | Exceptional 5.0% |
| Egyptians | 100.0 /100 | #44 | Exceptional 5.0% |
| Tongans | 100.0 /100 | #45 | Exceptional 5.0% |
| Assyrians/Chaldeans/Syriacs | 100.0 /100 | #46 | Exceptional 5.0% |
| Vietnamese | 100.0 /100 | #47 | Exceptional 5.1% |
| Koreans | 100.0 /100 | #48 | Exceptional 5.1% |
| Immigrants | Western Asia | 100.0 /100 | #49 | Exceptional 5.1% |
| Argentineans | 99.9 /100 | #50 | Exceptional 5.1% |
| Turks | 99.9 /100 | #51 | Exceptional 5.1% |
| Immigrants | Fiji | 99.9 /100 | #52 | Exceptional 5.1% |
| Immigrants | Lithuania | 99.9 /100 | #53 | Exceptional 5.1% |
| Paraguayans | 99.9 /100 | #54 | Exceptional 5.1% |
| Laotians | 99.9 /100 | #55 | Exceptional 5.1% |
| Immigrants | Turkey | 99.9 /100 | #56 | Exceptional 5.1% |
| Immigrants | Poland | 99.9 /100 | #57 | Exceptional 5.1% |
| Immigrants | Ukraine | 99.9 /100 | #58 | Exceptional 5.1% |
| Immigrants | North Macedonia | 99.9 /100 | #59 | Exceptional 5.1% |
| Immigrants | Eastern Europe | 99.9 /100 | #60 | Exceptional 5.1% |
| Immigrants | Switzerland | 99.8 /100 | #61 | Exceptional 5.2% |