South American Disability Age 5 to 17
COMPARE
South American
Select to Compare
Disability Age 5 to 17
South American Disability Age 5 to 17
5.4%
DISABILITY | AGE 5 TO 17
97.1/ 100
METRIC RATING
118th/ 347
METRIC RANK
South American Disability Age 5 to 17 Correlation Chart
The statistical analysis conducted on geographies consisting of 487,738,327 people shows a mild negative correlation between the proportion of South Americans and percentage of population with a disability between the ages 5 and 17 in the United States with a correlation coefficient (R) of -0.317 and weighted average of 5.4%. On average, for every 1% (one percent) increase in South Americans within a typical geography, there is a decrease of 0.045% in percentage of population with a disability between the ages 5 and 17.
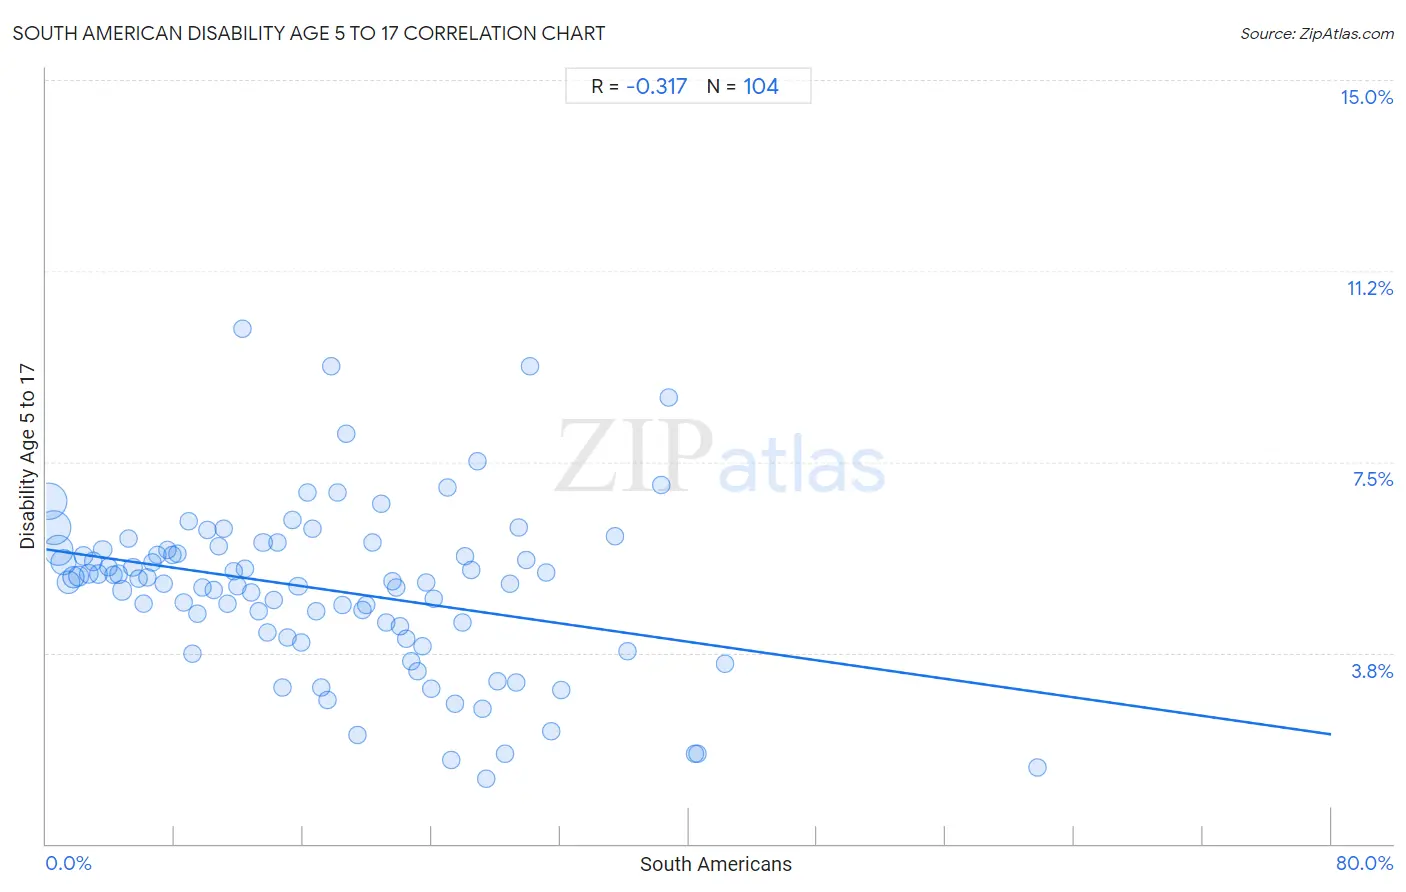
It is essential to understand that the correlation between the percentage of South Americans and percentage of population with a disability between the ages 5 and 17 does not imply a direct cause-and-effect relationship. It remains uncertain whether the presence of South Americans influences an upward or downward trend in the level of percentage of population with a disability between the ages 5 and 17 within an area, or if South Americans simply ended up residing in those areas with higher or lower levels of percentage of population with a disability between the ages 5 and 17 due to other factors.
Demographics Similar to South Americans by Disability Age 5 to 17
In terms of disability age 5 to 17, the demographic groups most similar to South Americans are Immigrants from South America (5.4%, a difference of 0.010%), Immigrants (5.4%, a difference of 0.060%), Immigrants from Afghanistan (5.3%, a difference of 0.11%), Cypriot (5.3%, a difference of 0.27%), and Cuban (5.3%, a difference of 0.33%).
| Demographics | Rating | Rank | Disability Age 5 to 17 |
| Ethiopians | 97.9 /100 | #111 | Exceptional 5.3% |
| Immigrants from Latvia | 97.9 /100 | #112 | Exceptional 5.3% |
| Aleuts | 97.8 /100 | #113 | Exceptional 5.3% |
| Immigrants from Northern Europe | 97.8 /100 | #114 | Exceptional 5.3% |
| Cubans | 97.8 /100 | #115 | Exceptional 5.3% |
| Cypriots | 97.7 /100 | #116 | Exceptional 5.3% |
| Immigrants from Afghanistan | 97.4 /100 | #117 | Exceptional 5.3% |
| South Americans | 97.1 /100 | #118 | Exceptional 5.4% |
| Immigrants from South America | 97.1 /100 | #119 | Exceptional 5.4% |
| Immigrants | 97.0 /100 | #120 | Exceptional 5.4% |
| Maltese | 96.0 /100 | #121 | Exceptional 5.4% |
| Chileans | 95.8 /100 | #122 | Exceptional 5.4% |
| Immigrants from Ethiopia | 95.5 /100 | #123 | Exceptional 5.4% |
| Crow | 95.0 /100 | #124 | Exceptional 5.4% |
| Immigrants from Chile | 95.0 /100 | #125 | Exceptional 5.4% |
South American Disability Age 5 to 17 Correlation Summary
| Measurement | South American Data | Disability Age 5 to 17 Data |
| Minimum | 0.16% | 1.3% |
| Maximum | 61.7% | 10.1% |
| Range | 61.6% | 8.8% |
| Mean | 17.2% | 5.0% |
| Median | 16.1% | 5.2% |
| Interquartile 25% (IQ1) | 8.0% | 4.1% |
| Interquartile 75% (IQ3) | 25.1% | 5.8% |
| Interquartile Range (IQR) | 17.1% | 1.7% |
| Standard Deviation (Sample) | 11.5% | 1.6% |
| Standard Deviation (Population) | 11.4% | 1.6% |
Correlation Details
| South American Percentile | Sample Size | Disability Age 5 to 17 |
[ 0.0% - 0.5% ] 0.16% | 113,277,986 | 6.7% |
[ 0.0% - 0.5% ] 0.46% | 96,195,297 | 6.2% |
[ 0.5% - 1.0% ] 0.76% | 71,674,508 | 5.8% |
[ 1.0% - 1.5% ] 1.08% | 48,986,208 | 5.5% |
[ 1.0% - 1.5% ] 1.39% | 33,683,693 | 5.1% |
[ 1.5% - 2.0% ] 1.70% | 25,778,475 | 5.2% |
[ 2.0% - 2.5% ] 2.01% | 16,101,880 | 5.3% |
[ 2.0% - 2.5% ] 2.30% | 11,340,450 | 5.6% |
[ 2.5% - 3.0% ] 2.62% | 7,094,934 | 5.3% |
[ 2.5% - 3.0% ] 2.94% | 5,857,283 | 5.5% |
[ 3.0% - 3.5% ] 3.24% | 4,561,220 | 5.3% |
[ 3.5% - 4.0% ] 3.54% | 5,082,096 | 5.8% |
[ 3.5% - 4.0% ] 3.87% | 3,758,232 | 5.4% |
[ 4.0% - 4.5% ] 4.18% | 2,890,420 | 5.3% |
[ 4.0% - 4.5% ] 4.49% | 2,434,136 | 5.3% |
[ 4.5% - 5.0% ] 4.75% | 11,168,596 | 5.0% |
[ 5.0% - 5.5% ] 5.12% | 2,514,235 | 6.0% |
[ 5.0% - 5.5% ] 5.40% | 1,675,002 | 5.4% |
[ 5.5% - 6.0% ] 5.72% | 1,847,253 | 5.2% |
[ 6.0% - 6.5% ] 6.03% | 1,496,510 | 4.7% |
[ 6.0% - 6.5% ] 6.32% | 1,119,860 | 5.2% |
[ 6.5% - 7.0% ] 6.63% | 877,917 | 5.5% |
[ 6.5% - 7.0% ] 6.93% | 1,421,616 | 5.7% |
[ 7.0% - 7.5% ] 7.29% | 703,776 | 5.1% |
[ 7.5% - 8.0% ] 7.56% | 849,461 | 5.8% |
[ 7.5% - 8.0% ] 7.87% | 597,512 | 5.7% |
[ 8.0% - 8.5% ] 8.17% | 716,413 | 5.7% |
[ 8.5% - 9.0% ] 8.53% | 771,124 | 4.7% |
[ 8.5% - 9.0% ] 8.85% | 457,049 | 6.3% |
[ 9.0% - 9.5% ] 9.12% | 547,409 | 3.7% |
[ 9.0% - 9.5% ] 9.43% | 762,995 | 4.5% |
[ 9.5% - 10.0% ] 9.71% | 327,513 | 5.0% |
[ 10.0% - 10.5% ] 10.03% | 519,970 | 6.2% |
[ 10.0% - 10.5% ] 10.40% | 314,513 | 5.0% |
[ 10.5% - 11.0% ] 10.71% | 350,264 | 5.8% |
[ 11.0% - 11.5% ] 11.07% | 740,244 | 6.2% |
[ 11.0% - 11.5% ] 11.29% | 199,723 | 4.7% |
[ 11.5% - 12.0% ] 11.63% | 346,352 | 5.4% |
[ 11.5% - 12.0% ] 11.89% | 685,193 | 5.1% |
[ 12.0% - 12.5% ] 12.19% | 152,639 | 10.1% |
[ 12.0% - 12.5% ] 12.41% | 280,842 | 5.4% |
[ 12.5% - 13.0% ] 12.76% | 806,726 | 4.9% |
[ 13.0% - 13.5% ] 13.20% | 393,650 | 4.6% |
[ 13.5% - 14.0% ] 13.50% | 190,046 | 5.9% |
[ 13.5% - 14.0% ] 13.76% | 438,508 | 4.2% |
[ 14.0% - 14.5% ] 14.14% | 319,452 | 4.8% |
[ 14.0% - 14.5% ] 14.42% | 218,756 | 5.9% |
[ 14.5% - 15.0% ] 14.69% | 204,467 | 3.1% |
[ 14.5% - 15.0% ] 14.99% | 234,613 | 4.1% |
[ 15.0% - 15.5% ] 15.33% | 401,866 | 6.4% |
[ 15.5% - 16.0% ] 15.68% | 266,981 | 5.1% |
[ 15.5% - 16.0% ] 15.89% | 185,657 | 3.9% |
[ 16.0% - 16.5% ] 16.26% | 311,983 | 6.9% |
[ 16.5% - 17.0% ] 16.54% | 236,283 | 6.2% |
[ 16.5% - 17.0% ] 16.83% | 148,606 | 4.6% |
[ 17.0% - 17.5% ] 17.14% | 89,321 | 3.1% |
[ 17.5% - 18.0% ] 17.52% | 19,785 | 2.8% |
[ 17.5% - 18.0% ] 17.77% | 238,695 | 9.4% |
[ 18.0% - 18.5% ] 18.10% | 85,976 | 6.9% |
[ 18.0% - 18.5% ] 18.43% | 81,050 | 4.7% |
[ 18.5% - 19.0% ] 18.69% | 40,042 | 8.0% |
[ 19.0% - 19.5% ] 19.39% | 111,443 | 2.1% |
[ 19.5% - 20.0% ] 19.70% | 85,749 | 4.6% |
[ 19.5% - 20.0% ] 19.96% | 147,015 | 4.7% |
[ 20.0% - 20.5% ] 20.33% | 22,724 | 5.9% |
[ 20.5% - 21.0% ] 20.84% | 158,259 | 6.7% |
[ 21.0% - 21.5% ] 21.17% | 109,134 | 4.3% |
[ 21.5% - 22.0% ] 21.54% | 31,140 | 5.2% |
[ 21.5% - 22.0% ] 21.81% | 240,443 | 5.0% |
[ 22.0% - 22.5% ] 22.03% | 56,571 | 4.3% |
[ 22.0% - 22.5% ] 22.42% | 103,554 | 4.0% |
[ 22.5% - 23.0% ] 22.72% | 10,396 | 3.6% |
[ 23.0% - 23.5% ] 23.10% | 64,260 | 3.4% |
[ 23.0% - 23.5% ] 23.39% | 174,565 | 3.9% |
[ 23.5% - 24.0% ] 23.68% | 230,198 | 5.1% |
[ 23.5% - 24.0% ] 23.96% | 59,843 | 3.1% |
[ 24.0% - 24.5% ] 24.14% | 2,419 | 4.8% |
[ 24.5% - 25.0% ] 24.95% | 20,760 | 7.0% |
[ 25.0% - 25.5% ] 25.23% | 5,164 | 1.7% |
[ 25.0% - 25.5% ] 25.42% | 101,739 | 2.8% |
[ 25.5% - 26.0% ] 25.90% | 35,967 | 4.4% |
[ 26.0% - 26.5% ] 26.05% | 56,757 | 5.6% |
[ 26.0% - 26.5% ] 26.50% | 21,935 | 5.4% |
[ 26.5% - 27.0% ] 26.89% | 89,647 | 7.5% |
[ 27.0% - 27.5% ] 27.16% | 42,956 | 2.6% |
[ 27.0% - 27.5% ] 27.42% | 42,058 | 1.3% |
[ 28.0% - 28.5% ] 28.08% | 67,090 | 3.2% |
[ 28.5% - 29.0% ] 28.57% | 20,971 | 1.8% |
[ 28.5% - 29.0% ] 28.87% | 57,106 | 5.1% |
[ 29.0% - 29.5% ] 29.27% | 26,364 | 3.2% |
[ 29.0% - 29.5% ] 29.41% | 22,540 | 6.2% |
[ 29.5% - 30.0% ] 29.84% | 112,750 | 5.6% |
[ 30.0% - 30.5% ] 30.10% | 23,734 | 9.4% |
[ 31.0% - 31.5% ] 31.13% | 11,069 | 5.3% |
[ 31.0% - 31.5% ] 31.40% | 15,184 | 2.2% |
[ 32.0% - 32.5% ] 32.05% | 2,811 | 3.0% |
[ 35.0% - 35.5% ] 35.42% | 68,029 | 6.0% |
[ 36.0% - 36.5% ] 36.16% | 31,514 | 3.8% |
[ 38.0% - 38.5% ] 38.28% | 4,407 | 7.0% |
[ 38.5% - 39.0% ] 38.73% | 1,761 | 8.8% |
[ 40.0% - 40.5% ] 40.36% | 14,639 | 1.8% |
[ 40.5% - 41.0% ] 40.54% | 14,572 | 1.8% |
[ 42.0% - 42.5% ] 42.26% | 6,186 | 3.5% |
[ 61.5% - 62.0% ] 61.73% | 139,642 | 1.5% |