Kiowa Disability Age 5 to 17

COMPARE

Kiowa
Race
Ancestry
AfghanAfricanAlaska NativeAlaskan AthabascanAlbanianAleutAlsatianAmericanApacheArabArapahoArgentineanArmenianAssyrian/Chaldean/SyriacAustralianAustrianBahamianBangladeshiBarbadianBasqueBelgianBelizeanBermudanBhutaneseBlackfeetBolivianBrazilianBritishBritish West IndianBulgarianBurmeseCajunCambodianCanadianCape VerdeanCarpatho RusynCelticCentral AmericanCentral American IndianCherokeeCheyenneChickasawChileanChineseChippewaChoctawColombianColvilleComancheCosta RicanCreeCreekCroatianCrowCubanCypriotCzechCzechoslovakianDanishDelawareDominicanDutchDutch West IndianEastern EuropeanEcuadorianEgyptianEnglishEstonianEthiopianEuropeanFijianFilipinoFinnishFrenchFrench American IndianFrench CanadianGermanGerman RussianGhanaianGreekGuamanian/ChamorroGuatemalanGuyaneseHaitianHmongHonduranHopiHoumaHungarianIcelanderIndian (Asian)IndonesianInupiatIranianIraqiIrishIroquoisIsraeliItalianJamaicanJapaneseJordanianKenyanKiowaKoreanLaotianLatvianLebaneseLiberianLithuanianLumbeeLuxembourgerMacedonianMalaysianMalteseMarshalleseMenomineeMexicanMexican American IndianMongolianMoroccanNative HawaiianNavajoNepaleseNew ZealanderNicaraguanNigerianNorthern EuropeanNorwegianOkinawanOsageOttawaPaiutePakistaniPalestinianPanamanianParaguayanPennsylvania GermanPeruvianPimaPolishPortuguesePotawatomiPuebloPuerto RicanPuget Sound SalishRomanianRussianSalvadoranSamoanScandinavianScotch-IrishScottishSeminoleSenegaleseSerbianShoshoneSierra LeoneanSiouxSlavicSlovakSloveneSomaliSouth AfricanSouth AmericanSouth American IndianSoviet UnionSpaniardSpanishSpanish AmericanSpanish American IndianSri LankanSubsaharan AfricanSudaneseSwedishSwissSyrianTaiwaneseThaiTlingit-HaidaTohono O'OdhamTonganTrinidadian and TobagonianTsimshianTurkishU.S. Virgin IslanderUgandanUkrainianUruguayanUteVenezuelanVietnameseWelshWest IndianYakamaYaquiYugoslavianYumanYup'ikZimbabwean
Immigration
NonimmigrantsImmigrantsAfghanistanAfricaAlbaniaArgentinaArmeniaAsiaAustraliaAustriaBahamasBangladeshBarbadosBelarusBelgiumBelizeBoliviaBosnia and HerzegovinaBrazilBulgariaBurma/MyanmarCabo VerdeCambodiaCameroonCanadaCaribbeanCentral AmericaChileChinaColombiaCongoCosta RicaCroatiaCubaCzechoslovakiaDenmarkDominicaDominican RepublicEastern AfricaEastern AsiaEastern EuropeEcuadorEgyptEl SalvadorEnglandEritreaEthiopiaEuropeFijiFranceGermanyGhanaGreeceGrenadaGuatemalaGuyanaHaitiHondurasHong KongHungaryIndiaIndonesiaIranIraqIrelandIsraelItalyJamaicaJapanJordanKazakhstanKenyaKoreaKuwaitLaosLatin AmericaLatviaLebanonLiberiaLithuaniaMalaysiaMexicoMicronesiaMiddle AfricaMoldovaMoroccoNepalNetherlandsNicaraguaNigeriaNorth AmericaNorth MacedoniaNorthern AfricaNorthern EuropeNorwayOceaniaPakistanPanamaPeruPhilippinesPolandPortugalRomaniaRussiaSaudi ArabiaScotlandSenegalSerbiaSierra LeoneSingaporeSomaliaSouth AfricaSouth AmericaSouth Central AsiaSouth Eastern AsiaSouthern EuropeSpainSri LankaSt. Vincent and the GrenadinesSudanSwedenSwitzerlandSyriaTaiwanThailandTrinidad and TobagoTurkeyUgandaUkraineUruguayUzbekistanVenezuelaVietnamWest IndiesWestern AfricaWestern AsiaWestern EuropeYemenZaireZimbabweAzores
Select to Compare
Race
Ancestry
AfghanAfricanAlaska NativeAlaskan AthabascanAlbanianAleutAlsatianAmericanApacheArabArapahoArgentineanArmenianAssyrian/Chaldean/SyriacAustralianAustrianBahamianBangladeshiBarbadianBasqueBelgianBelizeanBermudanBhutaneseBlackfeetBolivianBrazilianBritishBritish West IndianBulgarianBurmeseCajunCambodianCanadianCape VerdeanCarpatho RusynCelticCentral AmericanCentral American IndianCherokeeCheyenneChickasawChileanChineseChippewaChoctawColombianColvilleComancheCosta RicanCreeCreekCroatianCrowCubanCypriotCzechCzechoslovakianDanishDelawareDominicanDutchDutch West IndianEastern EuropeanEcuadorianEgyptianEnglishEstonianEthiopianEuropeanFijianFilipinoFinnishFrenchFrench American IndianFrench CanadianGermanGerman RussianGhanaianGreekGuamanian/ChamorroGuatemalanGuyaneseHaitianHmongHonduranHopiHoumaHungarianIcelanderIndian (Asian)IndonesianInupiatIranianIraqiIrishIroquoisIsraeliItalianJamaicanJapaneseJordanianKenyanKoreanLaotianLatvianLebaneseLiberianLithuanianLumbeeLuxembourgerMacedonianMalaysianMalteseMarshalleseMenomineeMexicanMexican American IndianMongolianMoroccanNative HawaiianNavajoNepaleseNew ZealanderNicaraguanNigerianNorthern EuropeanNorwegianOkinawanOsageOttawaPaiutePakistaniPalestinianPanamanianParaguayanPennsylvania GermanPeruvianPimaPolishPortuguesePotawatomiPuebloPuerto RicanPuget Sound SalishRomanianRussianSalvadoranSamoanScandinavianScotch-IrishScottishSeminoleSenegaleseSerbianShoshoneSierra LeoneanSiouxSlavicSlovakSloveneSomaliSouth AfricanSouth AmericanSouth American IndianSoviet UnionSpaniardSpanishSpanish AmericanSpanish American IndianSri LankanSubsaharan AfricanSudaneseSwedishSwissSyrianTaiwaneseThaiTlingit-HaidaTohono O'OdhamTonganTrinidadian and TobagonianTsimshianTurkishU.S. Virgin IslanderUgandanUkrainianUruguayanUteVenezuelanVietnameseWelshWest IndianYakamaYaquiYugoslavianYumanYup'ikZimbabwean
Immigration
NonimmigrantsImmigrantsAfghanistanAfricaAlbaniaArgentinaArmeniaAsiaAustraliaAustriaBahamasBangladeshBarbadosBelarusBelgiumBelizeBoliviaBosnia and HerzegovinaBrazilBulgariaBurma/MyanmarCabo VerdeCambodiaCameroonCanadaCaribbeanCentral AmericaChileChinaColombiaCongoCosta RicaCroatiaCubaCzechoslovakiaDenmarkDominicaDominican RepublicEastern AfricaEastern AsiaEastern EuropeEcuadorEgyptEl SalvadorEnglandEritreaEthiopiaEuropeFijiFranceGermanyGhanaGreeceGrenadaGuatemalaGuyanaHaitiHondurasHong KongHungaryIndiaIndonesiaIranIraqIrelandIsraelItalyJamaicaJapanJordanKazakhstanKenyaKoreaKuwaitLaosLatin AmericaLatviaLebanonLiberiaLithuaniaMalaysiaMexicoMicronesiaMiddle AfricaMoldovaMoroccoNepalNetherlandsNicaraguaNigeriaNorth AmericaNorth MacedoniaNorthern AfricaNorthern EuropeNorwayOceaniaPakistanPanamaPeruPhilippinesPolandPortugalRomaniaRussiaSaudi ArabiaScotlandSenegalSerbiaSierra LeoneSingaporeSomaliaSouth AfricaSouth AmericaSouth Central AsiaSouth Eastern AsiaSouthern EuropeSpainSri LankaSt. Vincent and the GrenadinesSudanSwedenSwitzerlandSyriaTaiwanThailandTrinidad and TobagoTurkeyUgandaUkraineUruguayUzbekistanVenezuelaVietnamWest IndiesWestern AfricaWestern AsiaWestern EuropeYemenZaireZimbabweAzores
Disability Age 5 to 17
Income
Poverty
Unemployment
Labor Participation
Family Structure
Vehicle Availability
Education Level
Disability

Kiowa Disability Age 5 to 17
Tragic

6.4%
DISABILITY | AGE 5 TO 17
0.0/ 100
METRIC RATING
317th/ 347
METRIC RANK

Kiowa Disability Age 5 to 17 Correlation Chart

The statistical analysis conducted on geographies consisting of 55,978,349 people shows a weak negative correlation between the proportion of Kiowa and percentage of population with a disability between the ages 5 and 17 in the United States with a correlation coefficient (R) of -0.212 and weighted average of 6.4%. On average, for every 1% (one percent) increase in Kiowa within a typical geography, there is a decrease of 0.16% in percentage of population with a disability between the ages 5 and 17.
Kiowa Disability Age 5 to 17
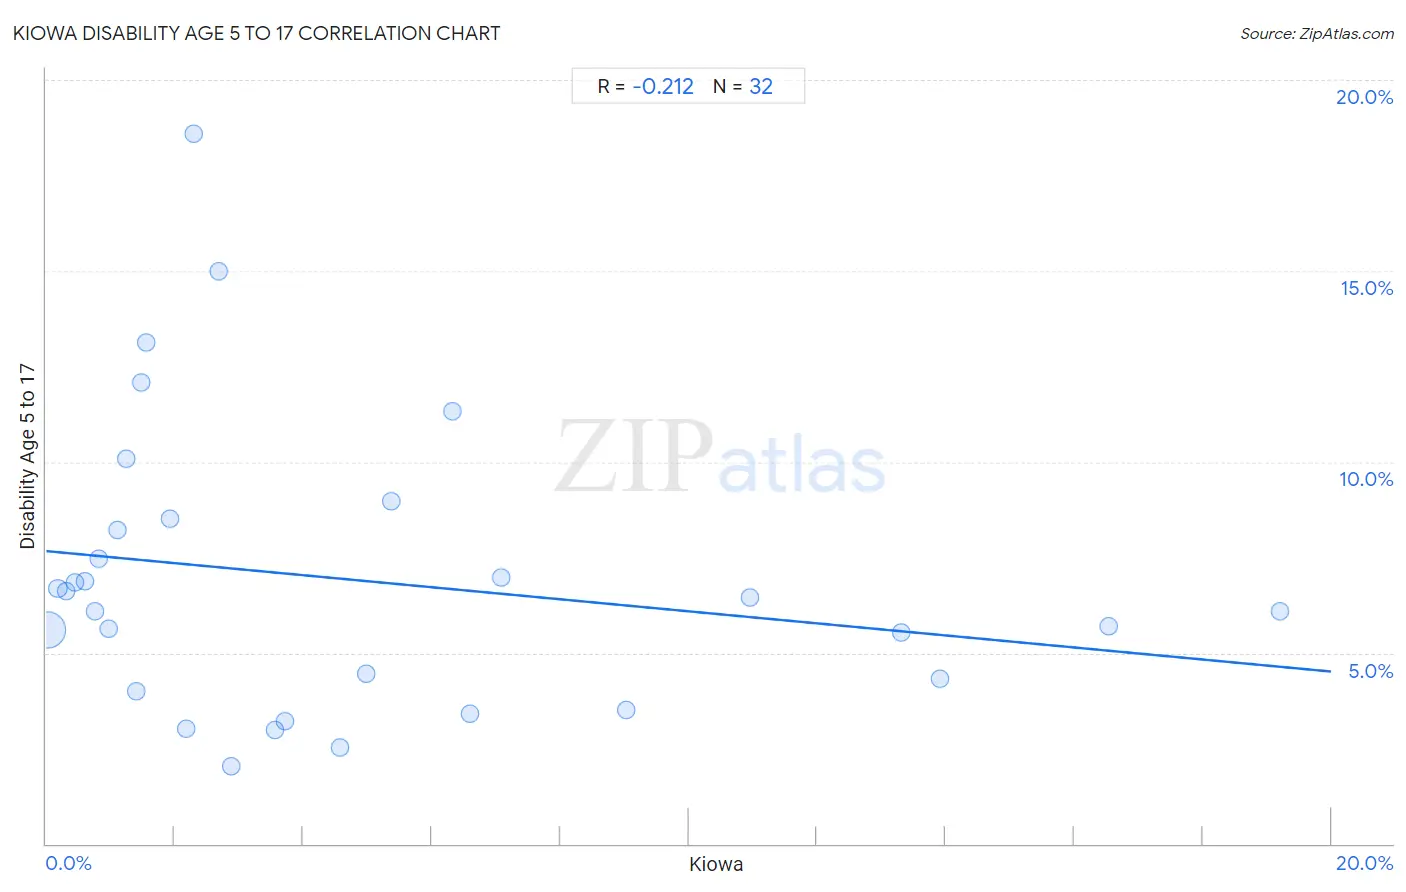
It is essential to understand that the correlation between the percentage of Kiowa and percentage of population with a disability between the ages 5 and 17 does not imply a direct cause-and-effect relationship. It remains uncertain whether the presence of Kiowa influences an upward or downward trend in the level of percentage of population with a disability between the ages 5 and 17 within an area, or if Kiowa simply ended up residing in those areas with higher or lower levels of percentage of population with a disability between the ages 5 and 17 due to other factors.

Demographics Similar to Kiowa by Disability Age 5 to 17

In terms of disability age 5 to 17, the demographic groups most similar to Kiowa are Comanche (6.4%, a difference of 0.030%), Immigrants from Dominican Republic (6.4%, a difference of 0.13%), Immigrants from Portugal (6.4%, a difference of 0.31%), French (6.4%, a difference of 0.48%), and Delaware (6.5%, a difference of 0.58%).
DemographicsRating | RankDisability Age 5 to 17
Alaskan Athabascans
0.0
/100
|
#310
Tragic
6.3%
Immigrants from Dominica
0.0
/100
|
#311
Tragic
6.3%
Bermudans
0.0
/100
|
#312
Tragic
6.4%
Apache
0.0
/100
|
#313
Tragic
6.4%
French
0.0
/100
|
#314
Tragic
6.4%
Immigrants from Portugal
0.0
/100
|
#315
Tragic
6.4%
Immigrants from Dominican Republic
0.0
/100
|
#316
Tragic
6.4%
Kiowa
0.0
/100
|
#317
Tragic
6.4%
Comanche
0.0
/100
|
#318
Tragic
6.4%
Delaware
0.0
/100
|
#319
Tragic
6.5%
Africans
0.0
/100
|
#320
Tragic
6.5%
Tohono O'odham
0.0
/100
|
#321
Tragic
6.5%
Slovaks
0.0
/100
|
#322
Tragic
6.5%
Osage
0.0
/100
|
#323
Tragic
6.5%
Dominicans
0.0
/100
|
#324
Tragic
6.5%

Kiowa Disability Age 5 to 17 Correlation Summary

MeasurementKiowa DataDisability Age 5 to 17 Data
Minimum0.014%2.0%
Maximum19.2%18.6%
Range19.2%16.6%
Mean4.6%6.9%
Median2.5%6.3%
Interquartile 25% (IQ1)1.0%4.2%
Interquartile 75% (IQ3)6.5%8.4%
Interquartile Range (IQR)5.4%4.2%
Standard Deviation (Sample)5.1%3.8%
Standard Deviation (Population)5.0%3.7%

Correlation Details

Kiowa PercentileSample SizeDisability Age 5 to 17
[
0.0%
-
0.5%
]
0.014%
53,131,1865.6%
[
0.0%
-
0.5%
]
0.18%
1,482,4796.7%
[
0.0%
-
0.5%
]
0.31%
595,3076.6%
[
0.0%
-
0.5%
]
0.45%
317,4976.8%
[
0.5%
-
1.0%
]
0.60%
90,0856.9%
[
0.5%
-
1.0%
]
0.75%
43,2816.1%
[
0.5%
-
1.0%
]
0.82%
111,8777.4%
[
0.5%
-
1.0%
]
0.98%
2,1455.6%
[
1.0%
-
1.5%
]
1.11%
116,9878.2%
[
1.0%
-
1.5%
]
1.24%
8,44610.1%
[
1.0%
-
1.5%
]
1.40%
1,7134.0%
[
1.0%
-
1.5%
]
1.48%
2,16112.1%
[
1.5%
-
2.0%
]
1.56%
21,42713.1%
[
1.5%
-
2.0%
]
1.93%
22,5948.5%
[
2.0%
-
2.5%
]
2.17%
1,1963.0%
[
2.0%
-
2.5%
]
2.29%
1,61318.6%
[
2.5%
-
3.0%
]
2.68%
78315.0%
[
2.5%
-
3.0%
]
2.88%
8002.0%
[
3.5%
-
4.0%
]
3.56%
4783.0%
[
3.5%
-
4.0%
]
3.72%
1,2633.2%
[
4.5%
-
5.0%
]
4.58%
9612.5%
[
4.5%
-
5.0%
]
4.97%
1,2074.5%
[
5.0%
-
5.5%
]
5.36%
3739.0%
[
6.0%
-
6.5%
]
6.32%
1,37711.3%
[
6.5%
-
7.0%
]
6.59%
1,1543.4%
[
7.0%
-
7.5%
]
7.08%
1,5267.0%
[
9.0%
-
9.5%
]
9.02%
4993.5%
[
10.5%
-
11.0%
]
10.96%
2926.5%
[
13.0%
-
13.5%
]
13.31%
1,5855.5%
[
13.5%
-
14.0%
]
13.91%
2,3014.3%
[
16.5%
-
17.0%
]
16.54%
8,0335.7%
[
19.0%
-
19.5%
]
19.20%
5,7236.1%