Immigrants from Latin America Disability Age 5 to 17
COMPARE
Immigrants from Latin America
Select to Compare
Disability Age 5 to 17
Immigrants from Latin America Disability Age 5 to 17
5.6%
DISABILITY | AGE 5 TO 17
34.3/ 100
METRIC RATING
183rd/ 347
METRIC RANK
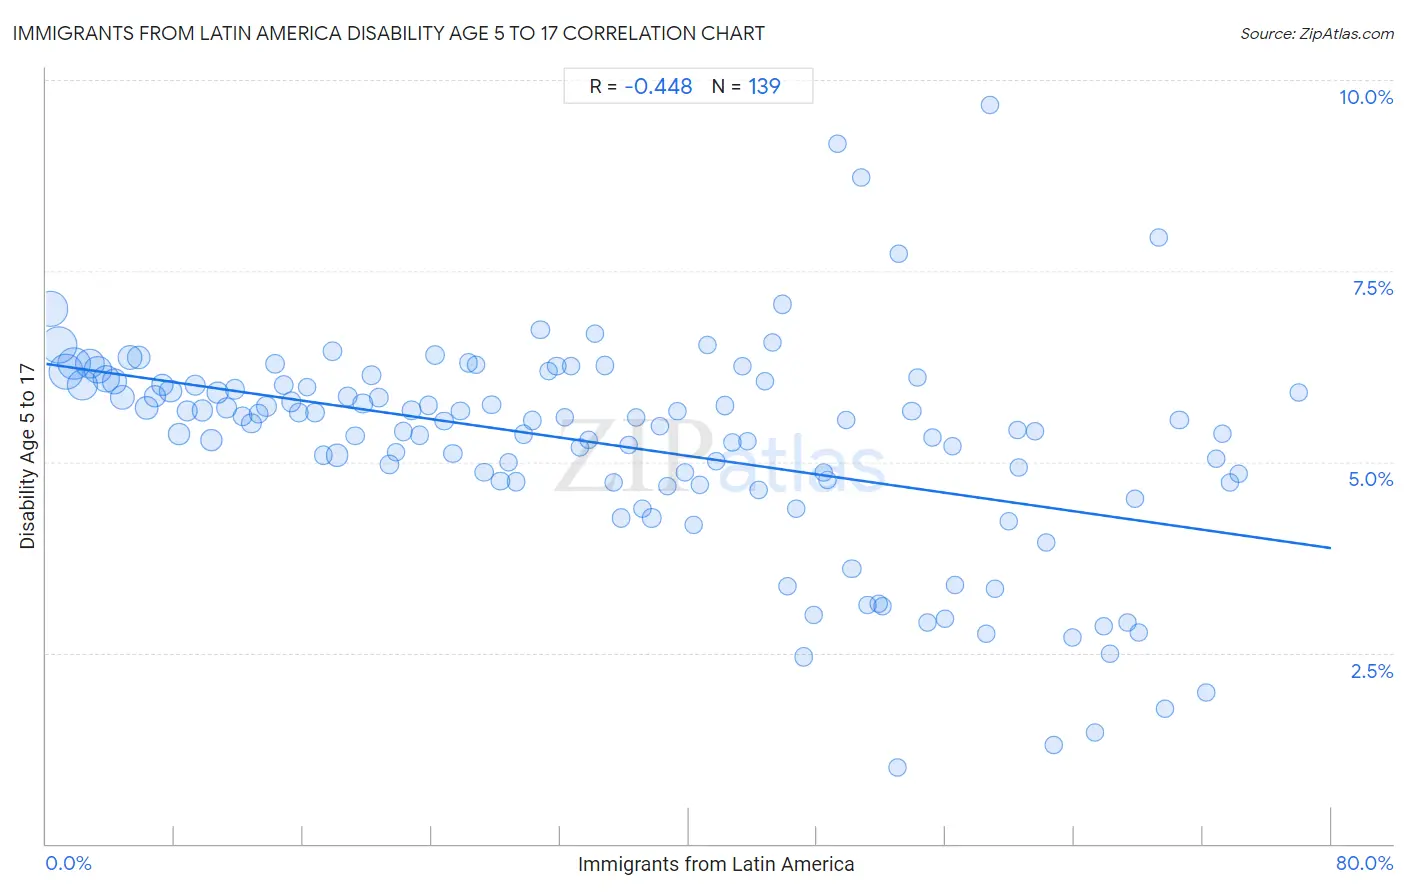
Immigrants from Latin America Disability Age 5 to 17 Correlation Chart
The statistical analysis conducted on geographies consisting of 547,403,428 people shows a moderate negative correlation between the proportion of Immigrants from Latin America and percentage of population with a disability between the ages 5 and 17 in the United States with a correlation coefficient (R) of -0.448 and weighted average of 5.6%. On average, for every 1% (one percent) increase in Immigrants from Latin America within a typical geography, there is a decrease of 0.030% in percentage of population with a disability between the ages 5 and 17.
It is essential to understand that the correlation between the percentage of Immigrants from Latin America and percentage of population with a disability between the ages 5 and 17 does not imply a direct cause-and-effect relationship. It remains uncertain whether the presence of Immigrants from Latin America influences an upward or downward trend in the level of percentage of population with a disability between the ages 5 and 17 within an area, or if Immigrants from Latin America simply ended up residing in those areas with higher or lower levels of percentage of population with a disability between the ages 5 and 17 due to other factors.
Demographics Similar to Immigrants from Latin America by Disability Age 5 to 17
In terms of disability age 5 to 17, the demographic groups most similar to Immigrants from Latin America are Syrian (5.6%, a difference of 0.020%), Immigrants from Mexico (5.6%, a difference of 0.030%), Mexican American Indian (5.6%, a difference of 0.050%), Immigrants from England (5.6%, a difference of 0.11%), and Fijian (5.7%, a difference of 0.14%).
| Demographics | Rating | Rank | Disability Age 5 to 17 |
| Immigrants from Central America | 49.4 /100 | #176 | Average 5.6% |
| Immigrants from Western Europe | 47.8 /100 | #177 | Average 5.6% |
| Immigrants from Trinidad and Tobago | 47.6 /100 | #178 | Average 5.6% |
| Immigrants from Barbados | 40.5 /100 | #179 | Average 5.6% |
| Immigrants from Uruguay | 37.7 /100 | #180 | Fair 5.6% |
| Immigrants from England | 36.4 /100 | #181 | Fair 5.6% |
| Mexican American Indians | 35.2 /100 | #182 | Fair 5.6% |
| Immigrants from Latin America | 34.3 /100 | #183 | Fair 5.6% |
| Syrians | 33.8 /100 | #184 | Fair 5.6% |
| Immigrants from Mexico | 33.7 /100 | #185 | Fair 5.6% |
| Fijians | 31.7 /100 | #186 | Fair 5.7% |
| Immigrants from Thailand | 30.2 /100 | #187 | Fair 5.7% |
| Marshallese | 28.1 /100 | #188 | Fair 5.7% |
| Pueblo | 27.5 /100 | #189 | Fair 5.7% |
| Immigrants from Eastern Africa | 27.3 /100 | #190 | Fair 5.7% |
Immigrants from Latin America Disability Age 5 to 17 Correlation Summary
| Measurement | Immigrants from Latin America Data | Disability Age 5 to 17 Data |
| Minimum | 0.27% | 1.0% |
| Maximum | 78.0% | 9.7% |
| Range | 77.7% | 8.7% |
| Mean | 35.3% | 5.2% |
| Median | 34.8% | 5.5% |
| Interquartile 25% (IQ1) | 17.2% | 4.7% |
| Interquartile 75% (IQ3) | 52.1% | 6.0% |
| Interquartile Range (IQR) | 34.8% | 1.3% |
| Standard Deviation (Sample) | 21.1% | 1.4% |
| Standard Deviation (Population) | 21.0% | 1.4% |
Correlation Details
| Immigrants from Latin America Percentile | Sample Size | Disability Age 5 to 17 |
[ 0.0% - 0.5% ] 0.27% | 43,608,730 | 7.0% |
[ 0.5% - 1.0% ] 0.75% | 47,287,185 | 6.5% |
[ 1.0% - 1.5% ] 1.24% | 41,946,322 | 6.2% |
[ 1.5% - 2.0% ] 1.75% | 35,742,267 | 6.3% |
[ 2.0% - 2.5% ] 2.25% | 32,016,323 | 6.0% |
[ 2.5% - 3.0% ] 2.75% | 28,857,802 | 6.3% |
[ 3.0% - 3.5% ] 3.22% | 23,348,448 | 6.2% |
[ 3.5% - 4.0% ] 3.75% | 21,908,498 | 6.1% |
[ 4.0% - 4.5% ] 4.25% | 18,226,913 | 6.1% |
[ 4.5% - 5.0% ] 4.75% | 16,538,419 | 5.8% |
[ 5.0% - 5.5% ] 5.23% | 15,871,553 | 6.4% |
[ 5.5% - 6.0% ] 5.74% | 12,790,136 | 6.4% |
[ 6.0% - 6.5% ] 6.24% | 10,624,971 | 5.7% |
[ 6.5% - 7.0% ] 6.74% | 9,419,946 | 5.9% |
[ 7.0% - 7.5% ] 7.24% | 9,932,847 | 6.0% |
[ 7.5% - 8.0% ] 7.74% | 10,002,603 | 5.9% |
[ 8.0% - 8.5% ] 8.26% | 7,971,117 | 5.4% |
[ 8.5% - 9.0% ] 8.78% | 7,919,064 | 5.7% |
[ 9.0% - 9.5% ] 9.25% | 5,349,155 | 6.0% |
[ 9.5% - 10.0% ] 9.71% | 7,060,640 | 5.7% |
[ 10.0% - 10.5% ] 10.29% | 8,761,192 | 5.3% |
[ 10.5% - 11.0% ] 10.68% | 8,858,098 | 5.9% |
[ 11.0% - 11.5% ] 11.23% | 4,246,229 | 5.7% |
[ 11.5% - 12.0% ] 11.77% | 3,723,531 | 5.9% |
[ 12.0% - 12.5% ] 12.23% | 3,060,632 | 5.6% |
[ 12.5% - 13.0% ] 12.77% | 5,357,575 | 5.5% |
[ 13.0% - 13.5% ] 13.25% | 3,780,648 | 5.6% |
[ 13.5% - 14.0% ] 13.70% | 5,356,949 | 5.7% |
[ 14.0% - 14.5% ] 14.25% | 2,773,956 | 6.3% |
[ 14.5% - 15.0% ] 14.77% | 3,163,223 | 6.0% |
[ 15.0% - 15.5% ] 15.26% | 3,367,103 | 5.8% |
[ 15.5% - 16.0% ] 15.72% | 2,857,880 | 5.6% |
[ 16.0% - 16.5% ] 16.24% | 2,102,465 | 6.0% |
[ 16.5% - 17.0% ] 16.74% | 2,926,040 | 5.6% |
[ 17.0% - 17.5% ] 17.24% | 2,107,272 | 5.1% |
[ 17.5% - 18.0% ] 17.80% | 3,350,083 | 6.5% |
[ 18.0% - 18.5% ] 18.12% | 11,246,829 | 5.1% |
[ 18.5% - 19.0% ] 18.78% | 2,048,827 | 5.9% |
[ 19.0% - 19.5% ] 19.24% | 2,190,833 | 5.3% |
[ 19.5% - 20.0% ] 19.71% | 4,700,022 | 5.8% |
[ 20.0% - 20.5% ] 20.25% | 2,009,947 | 6.1% |
[ 20.5% - 21.0% ] 20.71% | 2,714,156 | 5.8% |
[ 21.0% - 21.5% ] 21.37% | 5,940,825 | 5.0% |
[ 21.5% - 22.0% ] 21.77% | 1,372,081 | 5.1% |
[ 22.0% - 22.5% ] 22.24% | 2,003,192 | 5.4% |
[ 22.5% - 23.0% ] 22.74% | 1,542,985 | 5.7% |
[ 23.0% - 23.5% ] 23.24% | 1,792,964 | 5.3% |
[ 23.5% - 24.0% ] 23.78% | 1,475,496 | 5.7% |
[ 24.0% - 24.5% ] 24.24% | 2,955,929 | 6.4% |
[ 24.5% - 25.0% ] 24.76% | 1,181,190 | 5.5% |
[ 25.0% - 25.5% ] 25.30% | 1,241,933 | 5.1% |
[ 25.5% - 26.0% ] 25.78% | 1,382,080 | 5.7% |
[ 26.0% - 26.5% ] 26.30% | 1,346,649 | 6.3% |
[ 26.5% - 27.0% ] 26.73% | 1,206,592 | 6.3% |
[ 27.0% - 27.5% ] 27.25% | 1,191,069 | 4.9% |
[ 27.5% - 28.0% ] 27.73% | 1,350,849 | 5.7% |
[ 28.0% - 28.5% ] 28.29% | 1,049,022 | 4.7% |
[ 28.5% - 29.0% ] 28.79% | 962,484 | 5.0% |
[ 29.0% - 29.5% ] 29.27% | 834,736 | 4.7% |
[ 29.5% - 30.0% ] 29.74% | 772,103 | 5.4% |
[ 30.0% - 30.5% ] 30.25% | 869,323 | 5.5% |
[ 30.5% - 31.0% ] 30.76% | 1,316,879 | 6.7% |
[ 31.0% - 31.5% ] 31.26% | 829,703 | 6.2% |
[ 31.5% - 32.0% ] 31.78% | 756,864 | 6.3% |
[ 32.0% - 32.5% ] 32.30% | 1,081,995 | 5.6% |
[ 32.5% - 33.0% ] 32.70% | 854,762 | 6.2% |
[ 33.0% - 33.5% ] 33.25% | 668,241 | 5.2% |
[ 33.5% - 34.0% ] 33.75% | 622,838 | 5.3% |
[ 34.0% - 34.5% ] 34.19% | 355,615 | 6.7% |
[ 34.5% - 35.0% ] 34.77% | 706,407 | 6.3% |
[ 35.0% - 35.5% ] 35.31% | 501,312 | 4.7% |
[ 35.5% - 36.0% ] 35.81% | 718,251 | 4.3% |
[ 36.0% - 36.5% ] 36.23% | 318,053 | 5.2% |
[ 36.5% - 37.0% ] 36.71% | 447,971 | 5.6% |
[ 37.0% - 37.5% ] 37.13% | 490,073 | 4.4% |
[ 37.5% - 38.0% ] 37.69% | 670,536 | 4.3% |
[ 38.0% - 38.5% ] 38.22% | 505,225 | 5.5% |
[ 38.5% - 39.0% ] 38.69% | 505,029 | 4.7% |
[ 39.0% - 39.5% ] 39.27% | 289,933 | 5.7% |
[ 39.5% - 40.0% ] 39.77% | 406,502 | 4.9% |
[ 40.0% - 40.5% ] 40.27% | 519,565 | 4.2% |
[ 40.5% - 41.0% ] 40.67% | 733,948 | 4.7% |
[ 41.0% - 41.5% ] 41.20% | 169,623 | 6.5% |
[ 41.5% - 42.0% ] 41.73% | 166,450 | 5.0% |
[ 42.0% - 42.5% ] 42.24% | 430,844 | 5.7% |
[ 42.5% - 43.0% ] 42.73% | 415,333 | 5.3% |
[ 43.0% - 43.5% ] 43.31% | 236,431 | 6.3% |
[ 43.5% - 44.0% ] 43.68% | 203,239 | 5.3% |
[ 44.0% - 44.5% ] 44.35% | 326,674 | 4.6% |
[ 44.5% - 45.0% ] 44.72% | 287,331 | 6.1% |
[ 45.0% - 45.5% ] 45.24% | 126,571 | 6.6% |
[ 45.5% - 46.0% ] 45.86% | 158,927 | 7.1% |
[ 46.0% - 46.5% ] 46.17% | 106,576 | 3.4% |
[ 46.5% - 47.0% ] 46.72% | 219,077 | 4.4% |
[ 47.0% - 47.5% ] 47.16% | 201,590 | 2.4% |
[ 47.5% - 48.0% ] 47.81% | 156,830 | 3.0% |
[ 48.0% - 48.5% ] 48.38% | 46,439 | 4.9% |
[ 48.5% - 49.0% ] 48.65% | 260,540 | 4.8% |
[ 49.0% - 49.5% ] 49.23% | 94,749 | 9.2% |
[ 49.5% - 50.0% ] 49.81% | 247,255 | 5.6% |
[ 50.0% - 50.5% ] 50.15% | 86,921 | 3.6% |
[ 50.5% - 51.0% ] 50.71% | 109,938 | 8.7% |
[ 51.0% - 51.5% ] 51.11% | 21,106 | 3.1% |
[ 51.5% - 52.0% ] 51.81% | 132,300 | 3.1% |
[ 52.0% - 52.5% ] 52.06% | 44,594 | 3.1% |
[ 52.5% - 53.0% ] 52.98% | 13,877 | 1.0% |
[ 53.0% - 53.5% ] 53.09% | 52,760 | 7.7% |
[ 53.5% - 54.0% ] 53.89% | 443,665 | 5.7% |
[ 54.0% - 54.5% ] 54.26% | 33,101 | 6.1% |
[ 54.5% - 55.0% ] 54.90% | 37,977 | 2.9% |
[ 55.0% - 55.5% ] 55.19% | 11,069 | 5.3% |
[ 55.5% - 56.0% ] 55.93% | 55,604 | 2.9% |
[ 56.0% - 56.5% ] 56.46% | 13,137 | 5.2% |
[ 56.5% - 57.0% ] 56.59% | 68,517 | 3.4% |
[ 58.0% - 58.5% ] 58.49% | 24,969 | 2.8% |
[ 58.5% - 59.0% ] 58.77% | 7,689 | 9.7% |
[ 59.0% - 59.5% ] 59.08% | 50,975 | 3.3% |
[ 59.5% - 60.0% ] 59.91% | 94,504 | 4.2% |
[ 60.0% - 60.5% ] 60.45% | 24,597 | 5.4% |
[ 60.5% - 61.0% ] 60.52% | 83,491 | 4.9% |
[ 61.5% - 62.0% ] 61.54% | 10,725 | 5.4% |
[ 62.0% - 62.5% ] 62.24% | 107,902 | 3.9% |
[ 62.5% - 63.0% ] 62.70% | 13,163 | 1.3% |
[ 63.5% - 64.0% ] 63.90% | 167,031 | 2.7% |
[ 65.0% - 65.5% ] 65.32% | 109,226 | 1.5% |
[ 65.5% - 66.0% ] 65.81% | 52,851 | 2.9% |
[ 66.0% - 66.5% ] 66.26% | 44,595 | 2.5% |
[ 67.0% - 67.5% ] 67.28% | 40,278 | 2.9% |
[ 67.5% - 68.0% ] 67.74% | 54,873 | 4.5% |
[ 68.0% - 68.5% ] 68.02% | 20,850 | 2.8% |
[ 69.0% - 69.5% ] 69.27% | 26,596 | 7.9% |
[ 69.5% - 70.0% ] 69.67% | 57,066 | 1.8% |
[ 70.5% - 71.0% ] 70.54% | 68,435 | 5.6% |
[ 72.0% - 72.5% ] 72.20% | 19,399 | 2.0% |
[ 72.5% - 73.0% ] 72.82% | 64,572 | 5.0% |
[ 73.0% - 73.5% ] 73.24% | 222,996 | 5.4% |
[ 73.5% - 74.0% ] 73.72% | 46,798 | 4.7% |
[ 74.0% - 74.5% ] 74.26% | 71,088 | 4.8% |
[ 78.0% - 78.5% ] 78.01% | 42,081 | 5.9% |