Cree College, Under 1 year
COMPARE
Cree
Select to Compare
College, Under 1 year
Cree College, Under 1 year
63.3%
COLLEGE, UNDER 1 YEAR
5.2/ 100
METRIC RATING
221st/ 347
METRIC RANK
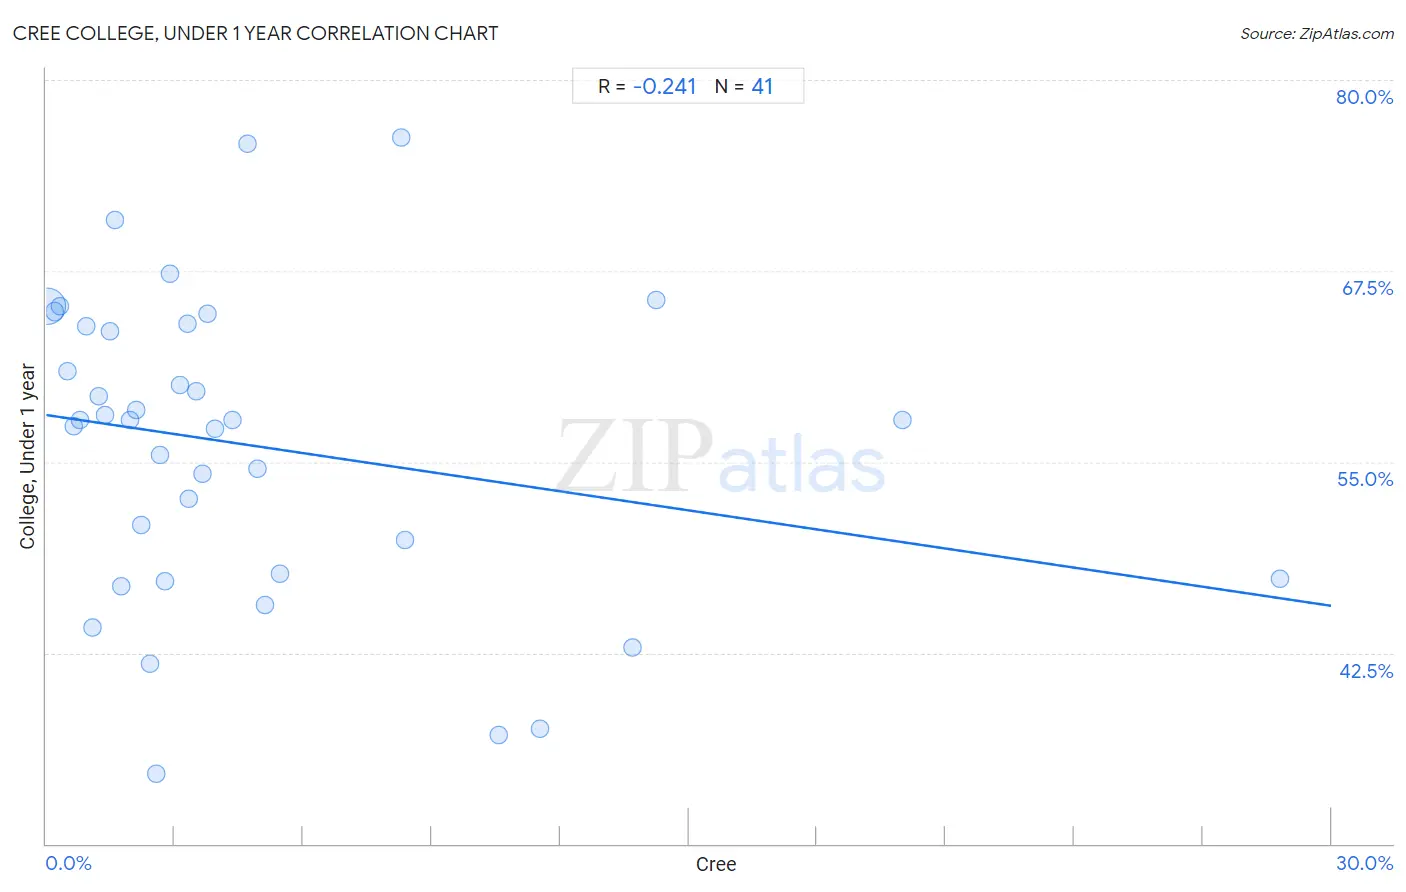
Cree College, Under 1 year Correlation Chart
The statistical analysis conducted on geographies consisting of 76,211,744 people shows a weak negative correlation between the proportion of Cree and percentage of population with at least college, under 1 year education in the United States with a correlation coefficient (R) of -0.241 and weighted average of 63.3%. On average, for every 1% (one percent) increase in Cree within a typical geography, there is a decrease of 0.42% in percentage of population with at least college, under 1 year education.
It is essential to understand that the correlation between the percentage of Cree and percentage of population with at least college, under 1 year education does not imply a direct cause-and-effect relationship. It remains uncertain whether the presence of Cree influences an upward or downward trend in the level of percentage of population with at least college, under 1 year education within an area, or if Cree simply ended up residing in those areas with higher or lower levels of percentage of population with at least college, under 1 year education due to other factors.
Demographics Similar to Cree by College, Under 1 year
In terms of college, under 1 year, the demographic groups most similar to Cree are Immigrants from Senegal (63.3%, a difference of 0.050%), Portuguese (63.4%, a difference of 0.090%), Immigrants from Panama (63.4%, a difference of 0.11%), Immigrants from Fiji (63.4%, a difference of 0.11%), and Immigrants from Uruguay (63.4%, a difference of 0.14%).
| Demographics | Rating | Rank | College, Under 1 year |
| Immigrants from Nigeria | 8.8 /100 | #214 | Tragic 63.7% |
| Senegalese | 7.7 /100 | #215 | Tragic 63.6% |
| Hmong | 6.8 /100 | #216 | Tragic 63.5% |
| Immigrants from Uruguay | 5.8 /100 | #217 | Tragic 63.4% |
| Immigrants from Panama | 5.7 /100 | #218 | Tragic 63.4% |
| Immigrants from Fiji | 5.7 /100 | #219 | Tragic 63.4% |
| Portuguese | 5.6 /100 | #220 | Tragic 63.4% |
| Cree | 5.2 /100 | #221 | Tragic 63.3% |
| Immigrants from Senegal | 5.0 /100 | #222 | Tragic 63.3% |
| Immigrants from Costa Rica | 4.5 /100 | #223 | Tragic 63.2% |
| Sub-Saharan Africans | 4.4 /100 | #224 | Tragic 63.2% |
| Immigrants from Peru | 4.0 /100 | #225 | Tragic 63.1% |
| Immigrants from Colombia | 4.0 /100 | #226 | Tragic 63.1% |
| Immigrants from Ghana | 3.7 /100 | #227 | Tragic 63.1% |
| Samoans | 3.3 /100 | #228 | Tragic 63.0% |
Cree College, Under 1 year Correlation Summary
| Measurement | Cree Data | College, Under 1 year Data |
| Minimum | 0.016% | 34.5% |
| Maximum | 28.8% | 76.2% |
| Range | 28.8% | 41.7% |
| Mean | 4.8% | 56.1% |
| Median | 2.9% | 57.7% |
| Interquartile 25% (IQ1) | 1.4% | 47.5% |
| Interquartile 75% (IQ3) | 5.0% | 63.9% |
| Interquartile Range (IQR) | 3.6% | 16.4% |
| Standard Deviation (Sample) | 5.8% | 10.0% |
| Standard Deviation (Population) | 5.7% | 9.9% |
Correlation Details
| Cree Percentile | Sample Size | College, Under 1 year |
[ 0.0% - 0.5% ] 0.016% | 72,697,893 | 65.2% |
[ 0.0% - 0.5% ] 0.19% | 2,206,464 | 64.8% |
[ 0.0% - 0.5% ] 0.33% | 618,037 | 65.2% |
[ 0.0% - 0.5% ] 0.49% | 319,752 | 60.9% |
[ 0.5% - 1.0% ] 0.65% | 86,121 | 57.3% |
[ 0.5% - 1.0% ] 0.77% | 92,172 | 57.7% |
[ 0.5% - 1.0% ] 0.93% | 36,304 | 63.8% |
[ 1.0% - 1.5% ] 1.08% | 7,345 | 44.1% |
[ 1.0% - 1.5% ] 1.21% | 19,699 | 59.3% |
[ 1.0% - 1.5% ] 1.36% | 22,910 | 58.1% |
[ 1.0% - 1.5% ] 1.49% | 14,930 | 63.6% |
[ 1.5% - 2.0% ] 1.60% | 33,780 | 70.8% |
[ 1.5% - 2.0% ] 1.75% | 4,741 | 46.9% |
[ 1.5% - 2.0% ] 1.95% | 9,711 | 57.7% |
[ 2.0% - 2.5% ] 2.10% | 1,524 | 58.4% |
[ 2.0% - 2.5% ] 2.23% | 3,494 | 50.9% |
[ 2.0% - 2.5% ] 2.42% | 3,225 | 41.8% |
[ 2.5% - 3.0% ] 2.56% | 234 | 34.5% |
[ 2.5% - 3.0% ] 2.67% | 6,146 | 55.4% |
[ 2.5% - 3.0% ] 2.76% | 1,015 | 47.2% |
[ 2.5% - 3.0% ] 2.89% | 693 | 67.3% |
[ 3.0% - 3.5% ] 3.13% | 4,118 | 60.0% |
[ 3.0% - 3.5% ] 3.30% | 3,813 | 64.0% |
[ 3.0% - 3.5% ] 3.34% | 599 | 52.6% |
[ 3.5% - 4.0% ] 3.51% | 1,825 | 59.6% |
[ 3.5% - 4.0% ] 3.64% | 1,403 | 54.2% |
[ 3.5% - 4.0% ] 3.77% | 212 | 64.7% |
[ 3.5% - 4.0% ] 3.93% | 789 | 57.1% |
[ 4.0% - 4.5% ] 4.35% | 689 | 57.7% |
[ 4.5% - 5.0% ] 4.69% | 469 | 75.8% |
[ 4.5% - 5.0% ] 4.93% | 690 | 54.6% |
[ 5.0% - 5.5% ] 5.10% | 2,629 | 45.6% |
[ 5.0% - 5.5% ] 5.46% | 3,662 | 47.7% |
[ 8.0% - 8.5% ] 8.30% | 265 | 76.2% |
[ 8.0% - 8.5% ] 8.38% | 1,599 | 49.9% |
[ 10.5% - 11.0% ] 10.57% | 577 | 37.1% |
[ 11.5% - 12.0% ] 11.53% | 937 | 37.5% |
[ 13.5% - 14.0% ] 13.70% | 387 | 42.9% |
[ 14.0% - 14.5% ] 14.25% | 772 | 65.6% |
[ 20.0% - 20.5% ] 20.00% | 60 | 57.8% |
[ 28.5% - 29.0% ] 28.81% | 59 | 47.4% |