Western, NE Map & Demographics
Western Map
Western Overview
$25,053
PER CAPITA INCOME
$66,250
AVG FAMILY INCOME
$42,188
AVG HOUSEHOLD INCOME
41.2%
WAGE / INCOME GAP [ % ]
58.8¢/ $1
WAGE / INCOME GAP [ $ ]
0.37
INEQUALITY / GINI INDEX
213
TOTAL POPULATION
105
MALE POPULATION
108
FEMALE POPULATION
97.22
MALES / 100 FEMALES
102.86
FEMALES / 100 MALES
41.5
MEDIAN AGE
2.9
AVG FAMILY SIZE
2.0
AVG HOUSEHOLD SIZE
96
LABOR FORCE [ PEOPLE ]
57.5%
PERCENT IN LABOR FORCE
7.3%
UNEMPLOYMENT RATE
Western Zip Codes
Western Area Codes
Income in Western
Income Overview in Western
Per Capita Income in Western is $25,053, while median incomes of families and households are $66,250 and $42,188 respectively.
| Characteristic | Number | Measure |
| Per Capita Income | 213 | $25,053 |
| Median Family Income | 50 | $66,250 |
| Mean Family Income | 50 | $62,570 |
| Median Household Income | 104 | $42,188 |
| Mean Household Income | 104 | $50,931 |
| Income Deficit | 50 | $0 |
| Wage / Income Gap (%) | 213 | 41.15% |
| Wage / Income Gap ($) | 213 | 58.85¢ per $1 |
| Gini / Inequality Index | 213 | 0.37 |
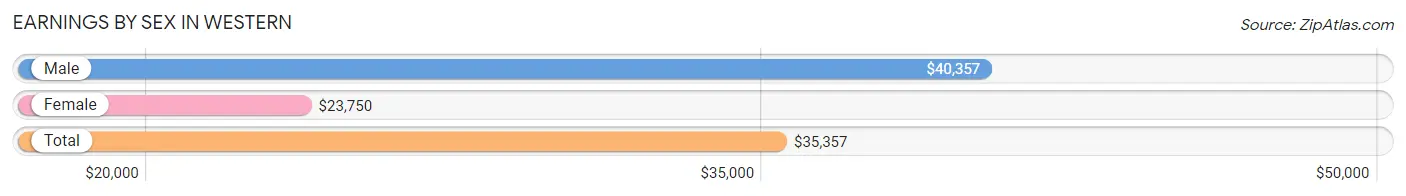
Earnings by Sex in Western
Average Earnings in Western are $35,357, $40,357 for men and $23,750 for women, a difference of 41.1%.
| Sex | Number | Average Earnings |
| Male | 60 (63.8%) | $40,357 |
| Female | 34 (36.2%) | $23,750 |
| Total | 94 (100.0%) | $35,357 |
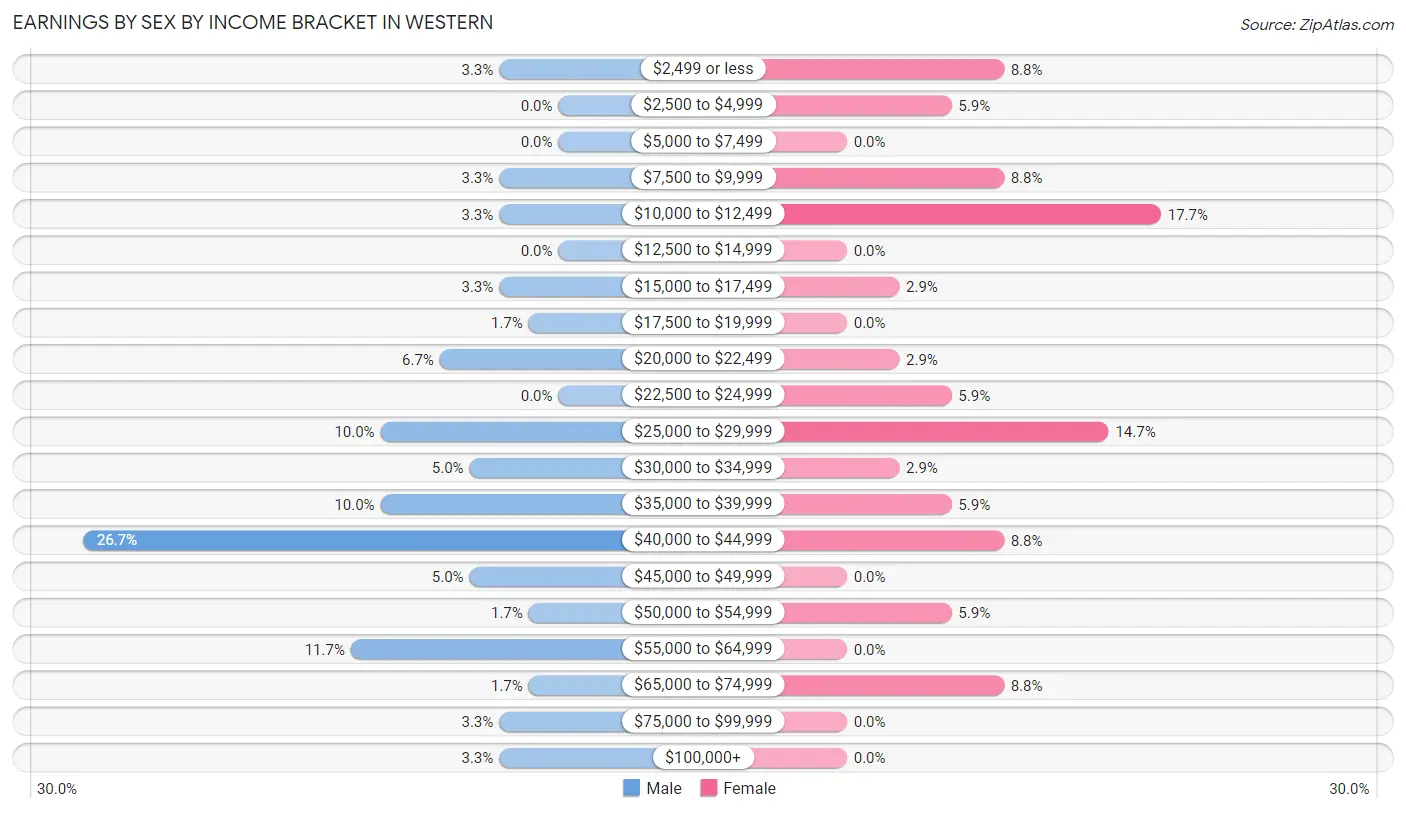
Earnings by Sex by Income Bracket in Western
The most common earnings brackets in Western are $40,000 to $44,999 for men (16 | 26.7%) and $10,000 to $12,499 for women (6 | 17.6%).
| Income | Male | Female |
| $2,499 or less | 2 (3.3%) | 3 (8.8%) |
| $2,500 to $4,999 | 0 (0.0%) | 2 (5.9%) |
| $5,000 to $7,499 | 0 (0.0%) | 0 (0.0%) |
| $7,500 to $9,999 | 2 (3.3%) | 3 (8.8%) |
| $10,000 to $12,499 | 2 (3.3%) | 6 (17.6%) |
| $12,500 to $14,999 | 0 (0.0%) | 0 (0.0%) |
| $15,000 to $17,499 | 2 (3.3%) | 1 (2.9%) |
| $17,500 to $19,999 | 1 (1.7%) | 0 (0.0%) |
| $20,000 to $22,499 | 4 (6.7%) | 1 (2.9%) |
| $22,500 to $24,999 | 0 (0.0%) | 2 (5.9%) |
| $25,000 to $29,999 | 6 (10.0%) | 5 (14.7%) |
| $30,000 to $34,999 | 3 (5.0%) | 1 (2.9%) |
| $35,000 to $39,999 | 6 (10.0%) | 2 (5.9%) |
| $40,000 to $44,999 | 16 (26.7%) | 3 (8.8%) |
| $45,000 to $49,999 | 3 (5.0%) | 0 (0.0%) |
| $50,000 to $54,999 | 1 (1.7%) | 2 (5.9%) |
| $55,000 to $64,999 | 7 (11.7%) | 0 (0.0%) |
| $65,000 to $74,999 | 1 (1.7%) | 3 (8.8%) |
| $75,000 to $99,999 | 2 (3.3%) | 0 (0.0%) |
| $100,000+ | 2 (3.3%) | 0 (0.0%) |
| Total | 60 (100.0%) | 34 (100.0%) |
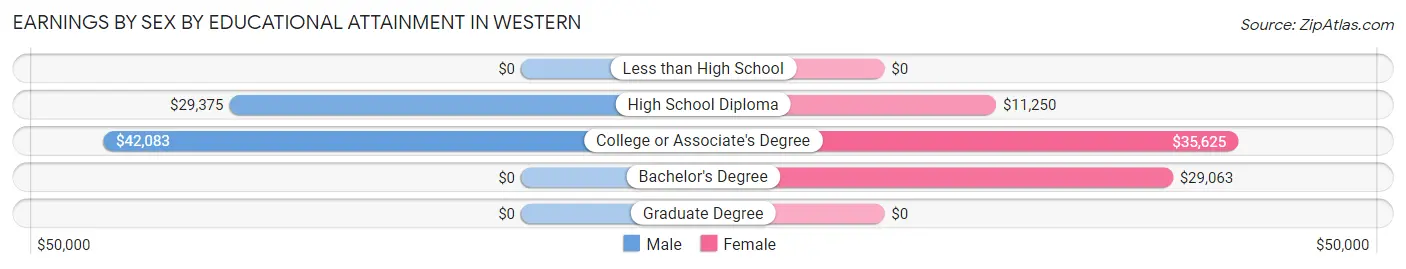
Earnings by Sex by Educational Attainment in Western
Average earnings in Western are $40,714 for men and $24,375 for women, a difference of 40.1%. Men with an educational attainment of college or associate's degree enjoy the highest average annual earnings of $42,083, while those with high school diploma education earn the least with $29,375. Women with an educational attainment of college or associate's degree earn the most with the average annual earnings of $35,625, while those with high school diploma education have the smallest earnings of $11,250.
| Educational Attainment | Male Income | Female Income |
| Less than High School | - | - |
| High School Diploma | $29,375 | $11,250 |
| College or Associate's Degree | $42,083 | $35,625 |
| Bachelor's Degree | - | - |
| Graduate Degree | - | - |
| Total | $40,714 | $24,375 |
Family Income in Western
Family Income Brackets in Western
According to the Western family income data, there are 13 families falling into the $75,000 to $99,999 income range, which is the most common income bracket and makes up 26.0% of all families.
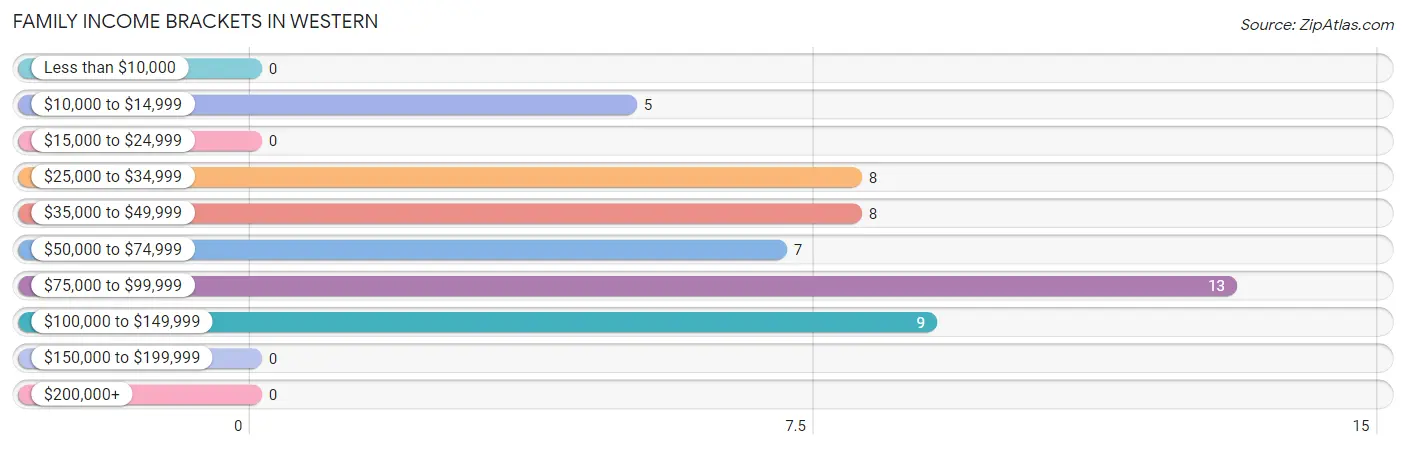
| Income Bracket | # Families | % Families |
| Less than $10,000 | 0 | 0.0% |
| $10,000 to $14,999 | 5 | 10.0% |
| $15,000 to $24,999 | 0 | 0.0% |
| $25,000 to $34,999 | 8 | 16.0% |
| $35,000 to $49,999 | 8 | 16.0% |
| $50,000 to $74,999 | 7 | 14.0% |
| $75,000 to $99,999 | 13 | 26.0% |
| $100,000 to $149,999 | 9 | 18.0% |
| $150,000 to $199,999 | 0 | 0.0% |
| $200,000+ | 0 | 0.0% |
Family Income by Famaliy Size in Western
4-person families (6 | 12.0%) account for the highest median family income in Western with $76,250 per family, while 2-person families (38 | 76.0%) have the highest median income of $30,000 per family member.
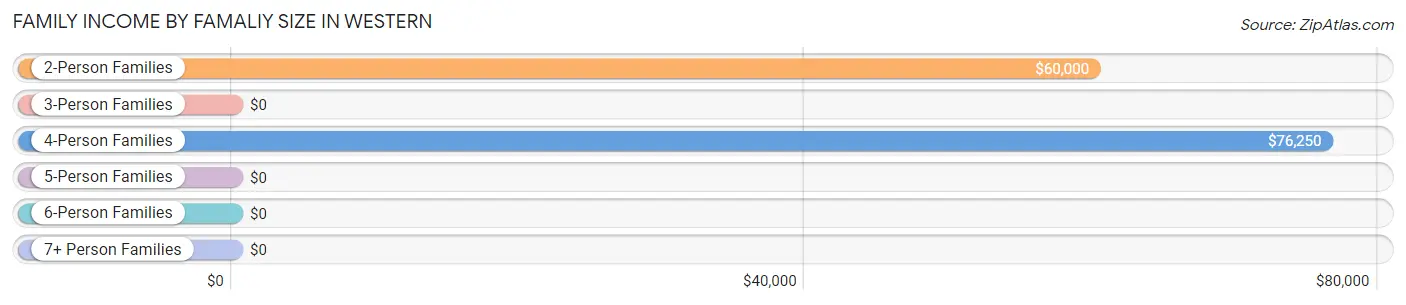
| Income Bracket | # Families | Median Income |
| 2-Person Families | 38 (76.0%) | $60,000 |
| 3-Person Families | 5 (10.0%) | $0 |
| 4-Person Families | 6 (12.0%) | $76,250 |
| 5-Person Families | 0 (0.0%) | $0 |
| 6-Person Families | 0 (0.0%) | $0 |
| 7+ Person Families | 1 (2.0%) | $0 |
| Total | 50 (100.0%) | $66,250 |
Family Income by Number of Earners in Western
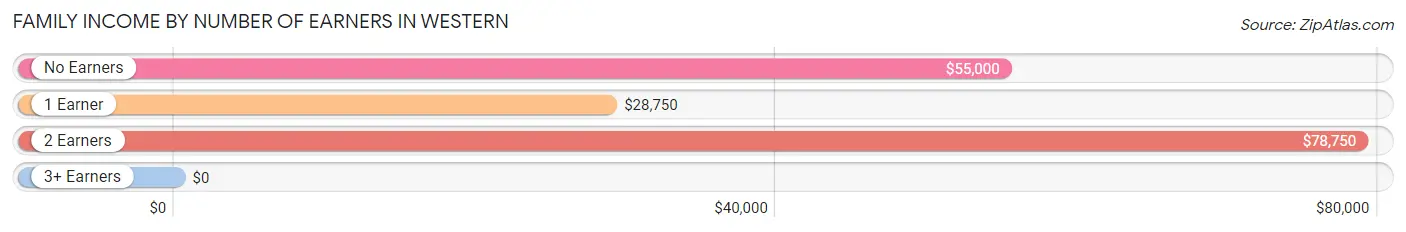
| Number of Earners | # Families | Median Income |
| No Earners | 14 (28.0%) | $55,000 |
| 1 Earner | 14 (28.0%) | $28,750 |
| 2 Earners | 21 (42.0%) | $78,750 |
| 3+ Earners | 1 (2.0%) | $0 |
| Total | 50 (100.0%) | $66,250 |
Household Income in Western
Household Income Brackets in Western
With 21 households falling in the category, the $75,000 to $99,999 income range is the most frequent in Western, accounting for 20.2% of all households.
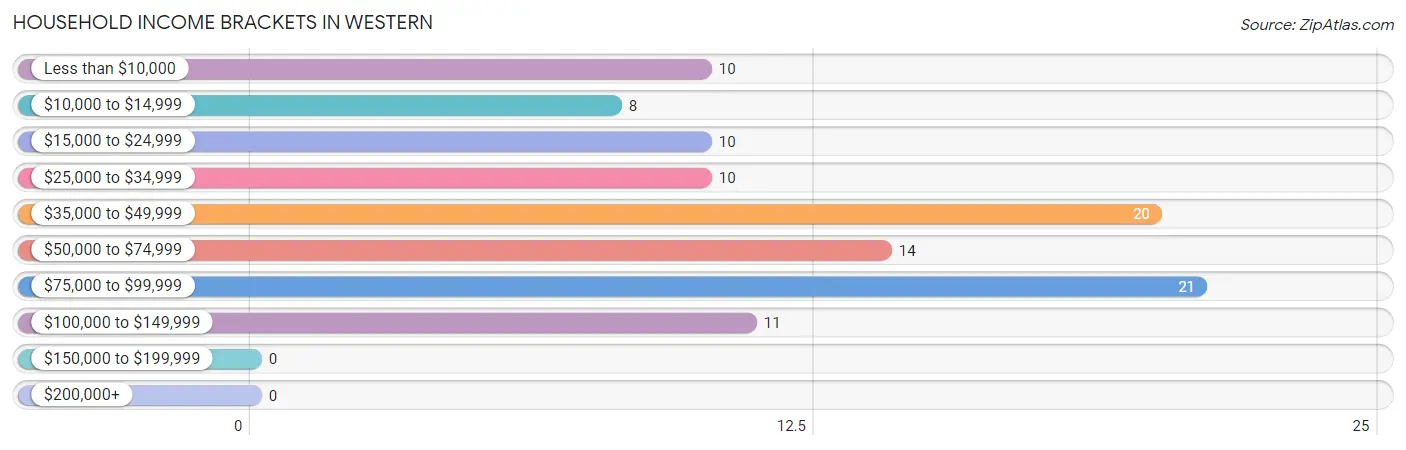
| Income Bracket | # Households | % Households |
| Less than $10,000 | 10 | 9.6% |
| $10,000 to $14,999 | 8 | 7.7% |
| $15,000 to $24,999 | 10 | 9.6% |
| $25,000 to $34,999 | 10 | 9.6% |
| $35,000 to $49,999 | 20 | 19.2% |
| $50,000 to $74,999 | 14 | 13.5% |
| $75,000 to $99,999 | 21 | 20.2% |
| $100,000 to $149,999 | 11 | 10.6% |
| $150,000 to $199,999 | 0 | 0.0% |
| $200,000+ | 0 | 0.0% |
Household Income by Householder Age in Western
The median household income in Western is $42,188, with the highest median household income of $43,750 found in the 45 to 64 years age bracket for the primary householder. A total of 24 households (23.1%) fall into this category. Meanwhile, the 15 to 24 years age bracket for the primary householder has the lowest median household income of $0, with 1 households (1.0%) in this group.
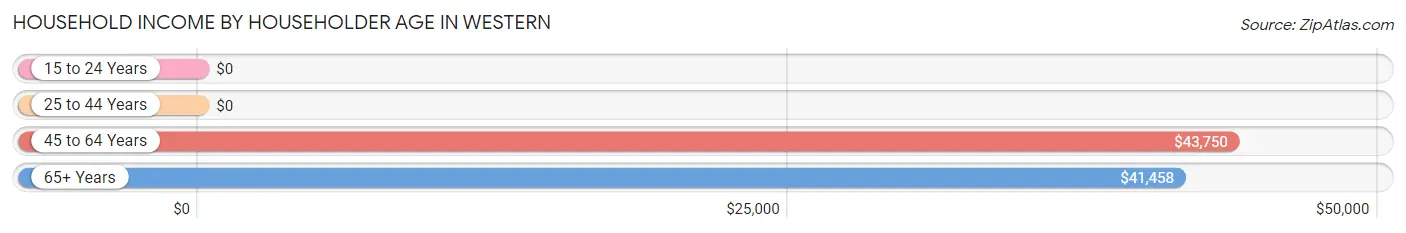
| Income Bracket | # Households | Median Income |
| 15 to 24 Years | 1 (1.0%) | $0 |
| 25 to 44 Years | 32 (30.8%) | $0 |
| 45 to 64 Years | 24 (23.1%) | $43,750 |
| 65+ Years | 47 (45.2%) | $41,458 |
| Total | 104 (100.0%) | $42,188 |
Poverty in Western
Income Below Poverty by Sex and Age in Western
With 18.1% poverty level for males and 11.1% for females among the residents of Western, 6 to 11 year old males and 25 to 34 year old females are the most vulnerable to poverty, with 3 males (60.0%) and 10 females (55.6%) in their respective age groups living below the poverty level.
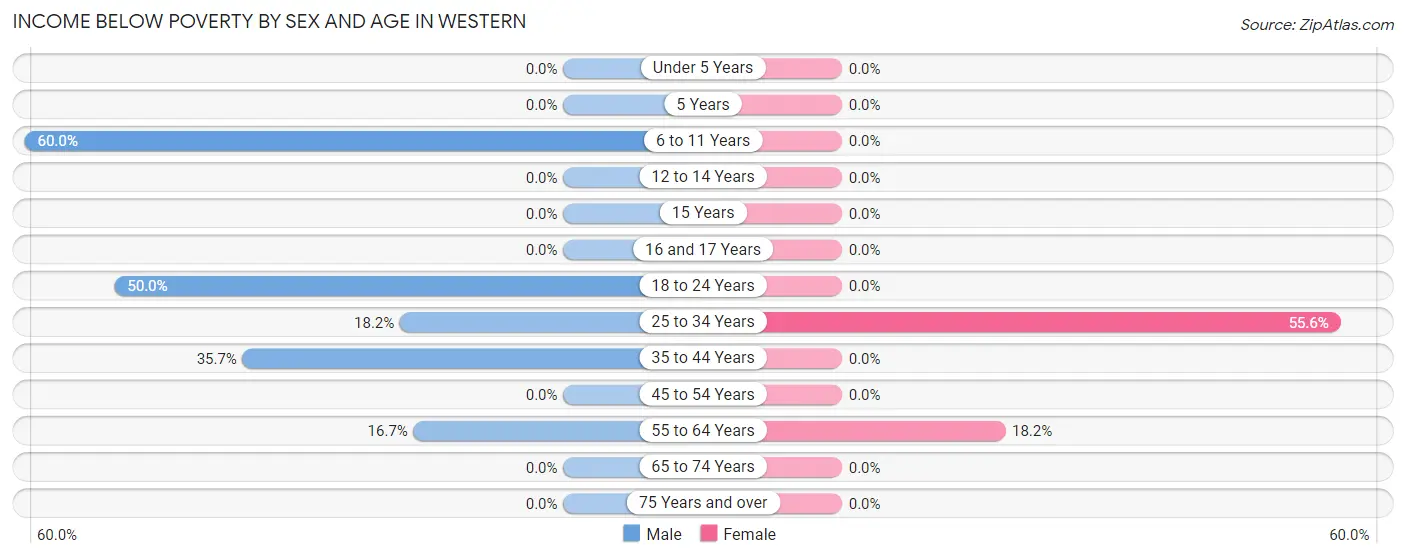
| Age Bracket | Male | Female |
| Under 5 Years | 0 (0.0%) | 0 (0.0%) |
| 5 Years | 0 (0.0%) | 0 (0.0%) |
| 6 to 11 Years | 3 (60.0%) | 0 (0.0%) |
| 12 to 14 Years | 0 (0.0%) | 0 (0.0%) |
| 15 Years | 0 (0.0%) | 0 (0.0%) |
| 16 and 17 Years | 0 (0.0%) | 0 (0.0%) |
| 18 to 24 Years | 2 (50.0%) | 0 (0.0%) |
| 25 to 34 Years | 2 (18.2%) | 10 (55.6%) |
| 35 to 44 Years | 10 (35.7%) | 0 (0.0%) |
| 45 to 54 Years | 0 (0.0%) | 0 (0.0%) |
| 55 to 64 Years | 2 (16.7%) | 2 (18.2%) |
| 65 to 74 Years | 0 (0.0%) | 0 (0.0%) |
| 75 Years and over | 0 (0.0%) | 0 (0.0%) |
| Total | 19 (18.1%) | 12 (11.1%) |
Income Above Poverty by Sex and Age in Western
According to the poverty statistics in Western, males aged under 5 years and females aged under 5 years are the age groups that are most secure financially, with 100.0% of males and 100.0% of females in these age groups living above the poverty line.
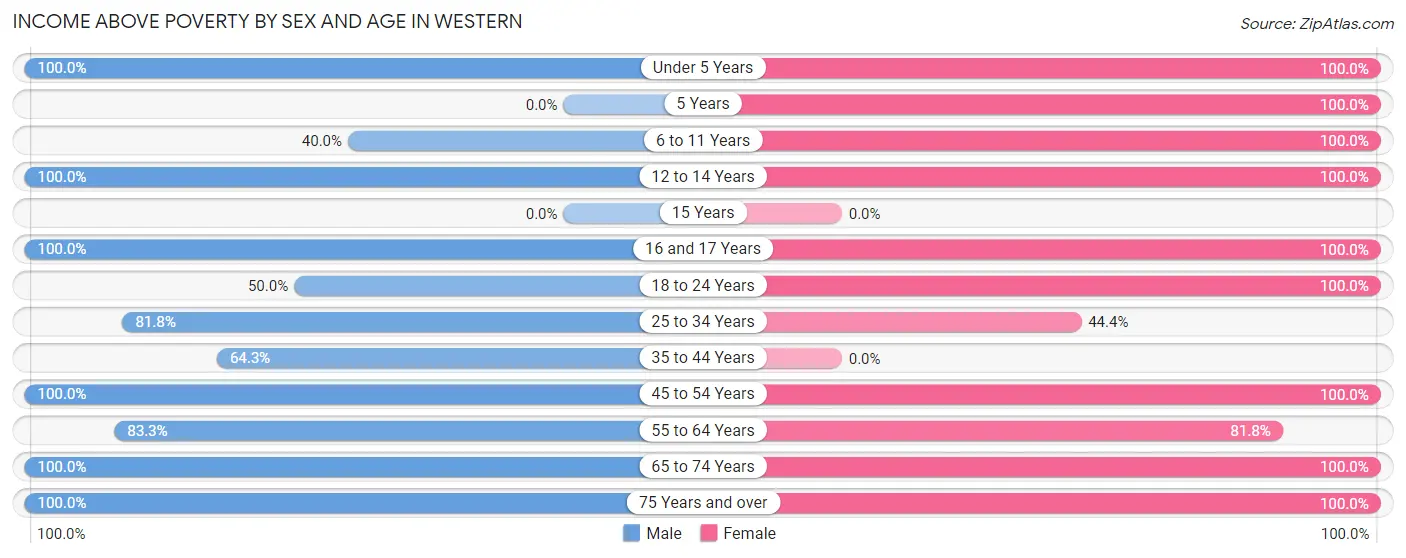
| Age Bracket | Male | Female |
| Under 5 Years | 5 (100.0%) | 2 (100.0%) |
| 5 Years | 0 (0.0%) | 1 (100.0%) |
| 6 to 11 Years | 2 (40.0%) | 25 (100.0%) |
| 12 to 14 Years | 5 (100.0%) | 3 (100.0%) |
| 15 Years | 0 (0.0%) | 0 (0.0%) |
| 16 and 17 Years | 1 (100.0%) | 1 (100.0%) |
| 18 to 24 Years | 2 (50.0%) | 5 (100.0%) |
| 25 to 34 Years | 9 (81.8%) | 8 (44.4%) |
| 35 to 44 Years | 18 (64.3%) | 0 (0.0%) |
| 45 to 54 Years | 5 (100.0%) | 10 (100.0%) |
| 55 to 64 Years | 10 (83.3%) | 9 (81.8%) |
| 65 to 74 Years | 21 (100.0%) | 14 (100.0%) |
| 75 Years and over | 8 (100.0%) | 18 (100.0%) |
| Total | 86 (81.9%) | 96 (88.9%) |
Income Below Poverty Among Married-Couple Families in Western
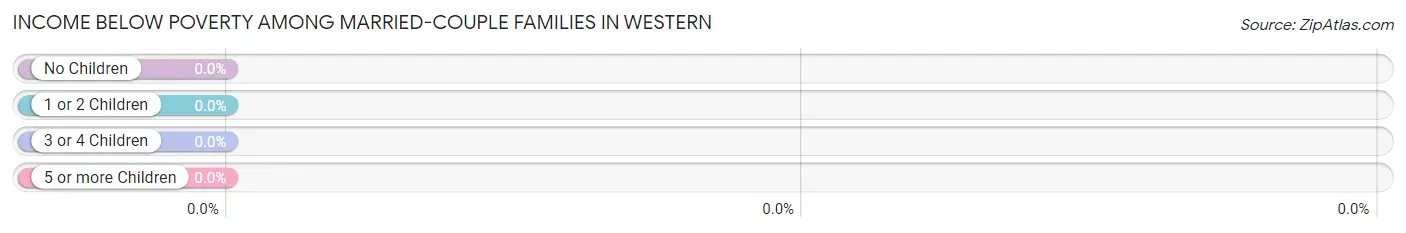
| Children | Above Poverty | Below Poverty |
| No Children | 30 (100.0%) | 0 (0.0%) |
| 1 or 2 Children | 6 (100.0%) | 0 (0.0%) |
| 3 or 4 Children | 0 (0.0%) | 0 (0.0%) |
| 5 or more Children | 1 (100.0%) | 0 (0.0%) |
| Total | 37 (100.0%) | 0 (0.0%) |
Income Below Poverty Among Single-Parent Households in Western
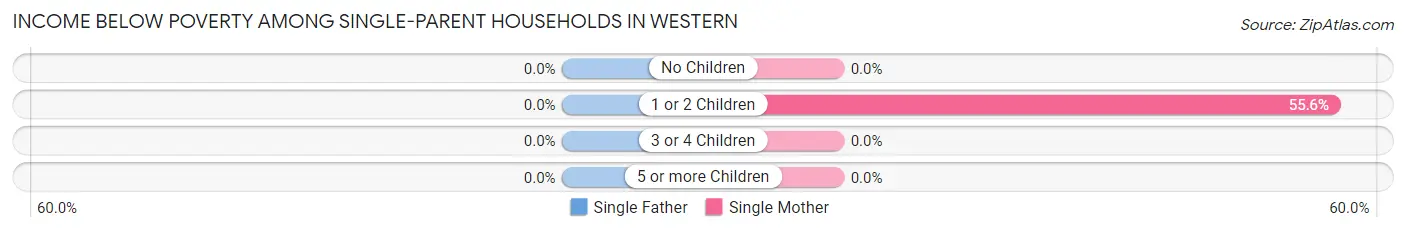
| Children | Single Father | Single Mother |
| No Children | 0 (0.0%) | 0 (0.0%) |
| 1 or 2 Children | 0 (0.0%) | 5 (55.6%) |
| 3 or 4 Children | 0 (0.0%) | 0 (0.0%) |
| 5 or more Children | 0 (0.0%) | 0 (0.0%) |
| Total | 0 (0.0%) | 5 (50.0%) |
Income Below Poverty Among Married-Couple vs Single-Parent Households in Western
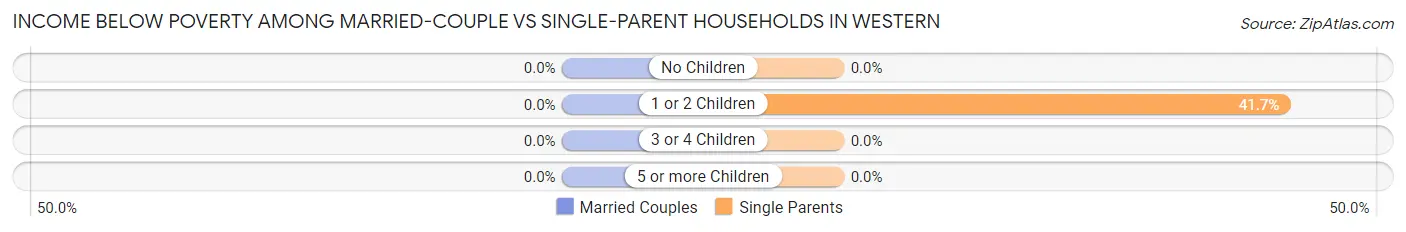
| Children | Married-Couple Families | Single-Parent Households |
| No Children | 0 (0.0%) | 0 (0.0%) |
| 1 or 2 Children | 0 (0.0%) | 5 (41.7%) |
| 3 or 4 Children | 0 (0.0%) | 0 (0.0%) |
| 5 or more Children | 0 (0.0%) | 0 (0.0%) |
| Total | 0 (0.0%) | 5 (38.5%) |
Race in Western
The most populous races in Western are White / Caucasian (196 | 92.0%), Hawaiian / Pacific (17 | 8.0%), and Hispanic or Latino (4 | 1.9%).
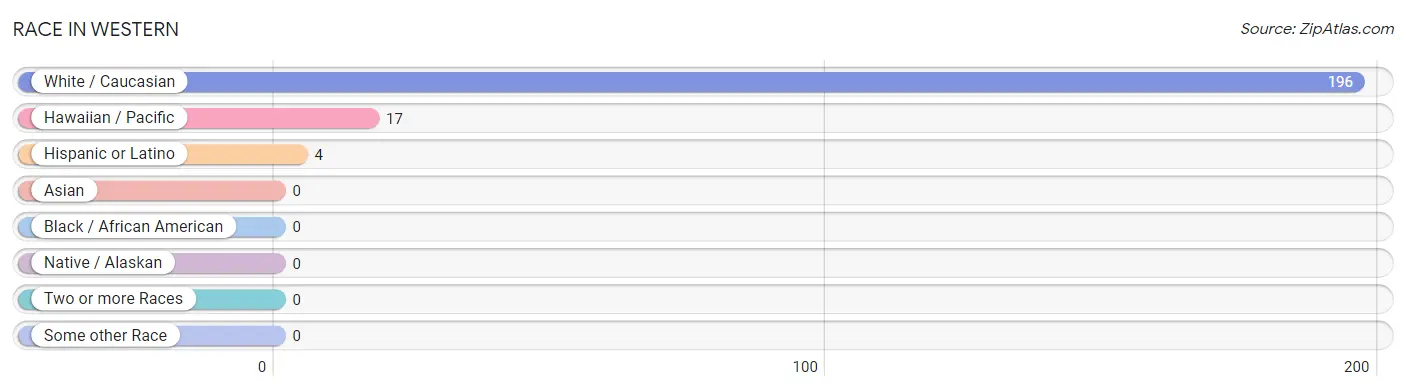
| Race | # Population | % Population |
| Asian | 0 | 0.0% |
| Black / African American | 0 | 0.0% |
| Hawaiian / Pacific | 17 | 8.0% |
| Hispanic or Latino | 4 | 1.9% |
| Native / Alaskan | 0 | 0.0% |
| White / Caucasian | 196 | 92.0% |
| Two or more Races | 0 | 0.0% |
| Some other Race | 0 | 0.0% |
| Total | 213 | 100.0% |
Ancestry in Western
The most populous ancestries reported in Western are German (100 | 46.9%), Czech (27 | 12.7%), Native Hawaiian (17 | 8.0%), Irish (12 | 5.6%), and Danish (10 | 4.7%), together accounting for 77.9% of all Western residents.
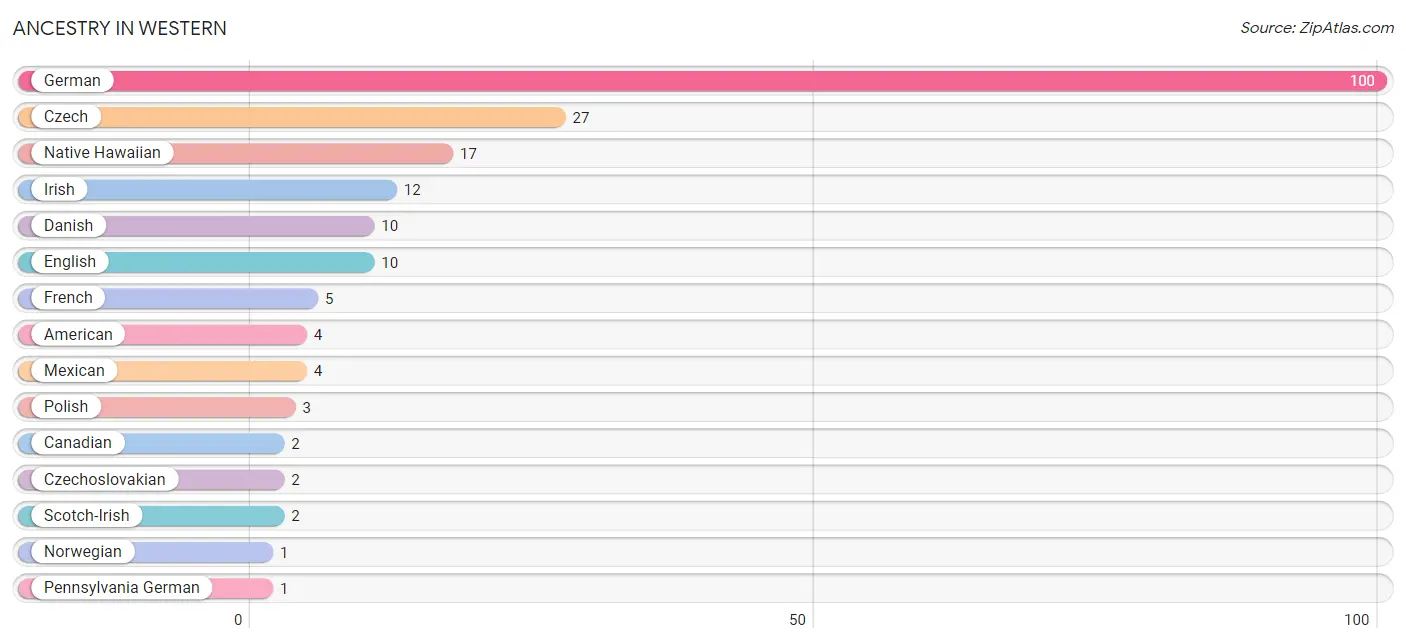
| Ancestry | # Population | % Population |
| American | 4 | 1.9% |
| Canadian | 2 | 0.9% |
| Czech | 27 | 12.7% |
| Czechoslovakian | 2 | 0.9% |
| Danish | 10 | 4.7% |
| English | 10 | 4.7% |
| French | 5 | 2.4% |
| German | 100 | 46.9% |
| Irish | 12 | 5.6% |
| Mexican | 4 | 1.9% |
| Native Hawaiian | 17 | 8.0% |
| Norwegian | 1 | 0.5% |
| Pennsylvania German | 1 | 0.5% |
| Polish | 3 | 1.4% |
| Scotch-Irish | 2 | 0.9% |
| Scottish | 1 | 0.5% |
| Swedish | 1 | 0.5% |
| Swiss | 1 | 0.5% | View All 18 Rows |
Immigrants in Western

| Immigration Origin | # Population | % Population | View All 0 Rows |
Sex and Age in Western
Sex and Age in Western
The most populous age groups in Western are 40 to 44 Years (15 | 14.3%) for men and 5 to 9 Years (19 | 17.6%) for women.
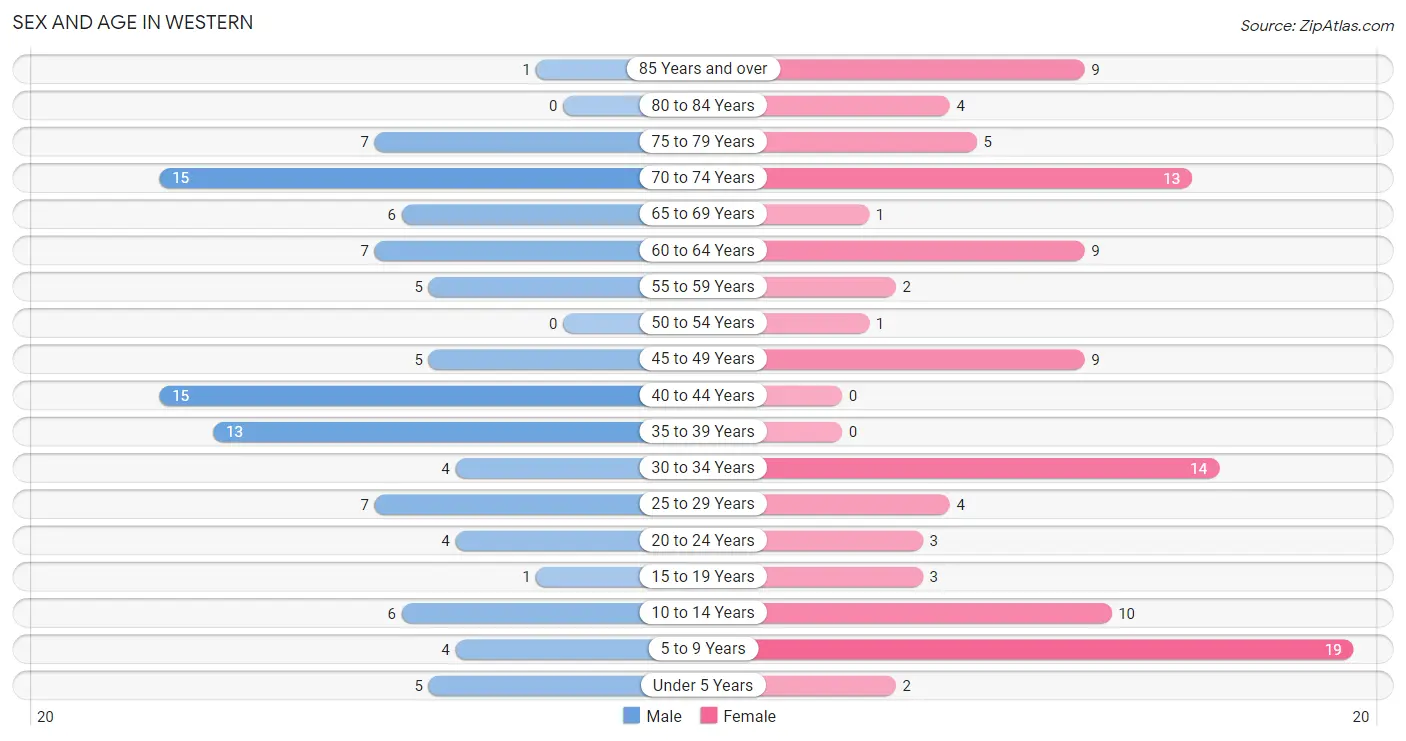
| Age Bracket | Male | Female |
| Under 5 Years | 5 (4.8%) | 2 (1.8%) |
| 5 to 9 Years | 4 (3.8%) | 19 (17.6%) |
| 10 to 14 Years | 6 (5.7%) | 10 (9.3%) |
| 15 to 19 Years | 1 (0.9%) | 3 (2.8%) |
| 20 to 24 Years | 4 (3.8%) | 3 (2.8%) |
| 25 to 29 Years | 7 (6.7%) | 4 (3.7%) |
| 30 to 34 Years | 4 (3.8%) | 14 (13.0%) |
| 35 to 39 Years | 13 (12.4%) | 0 (0.0%) |
| 40 to 44 Years | 15 (14.3%) | 0 (0.0%) |
| 45 to 49 Years | 5 (4.8%) | 9 (8.3%) |
| 50 to 54 Years | 0 (0.0%) | 1 (0.9%) |
| 55 to 59 Years | 5 (4.8%) | 2 (1.8%) |
| 60 to 64 Years | 7 (6.7%) | 9 (8.3%) |
| 65 to 69 Years | 6 (5.7%) | 1 (0.9%) |
| 70 to 74 Years | 15 (14.3%) | 13 (12.0%) |
| 75 to 79 Years | 7 (6.7%) | 5 (4.6%) |
| 80 to 84 Years | 0 (0.0%) | 4 (3.7%) |
| 85 Years and over | 1 (0.9%) | 9 (8.3%) |
| Total | 105 (100.0%) | 108 (100.0%) |
Families and Households in Western
Median Family Size in Western
The median family size in Western is 2.86 persons per family, with single female/mother families (10 | 20.0%) accounting for the largest median family size of 3.1 persons per family. On the other hand, single male/father families (3 | 6.0%) represent the smallest median family size with 2.33 persons per family.
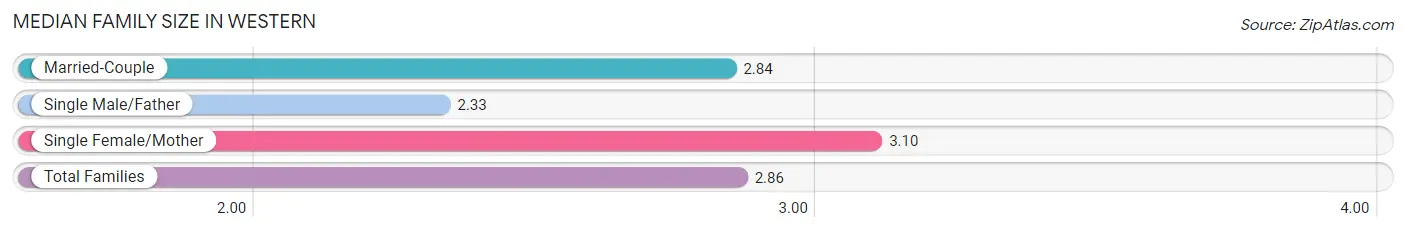
| Family Type | # Families | Family Size |
| Married-Couple | 37 (74.0%) | 2.84 |
| Single Male/Father | 3 (6.0%) | 2.33 |
| Single Female/Mother | 10 (20.0%) | 3.10 |
| Total Families | 50 (100.0%) | 2.86 |
Median Household Size in Western
The median household size in Western is 2.05 persons per household, with single female/mother households (10 | 9.6%) accounting for the largest median household size of 3.5 persons per household. non-family households (54 | 51.9%) represent the smallest median household size with 1.02 persons per household.
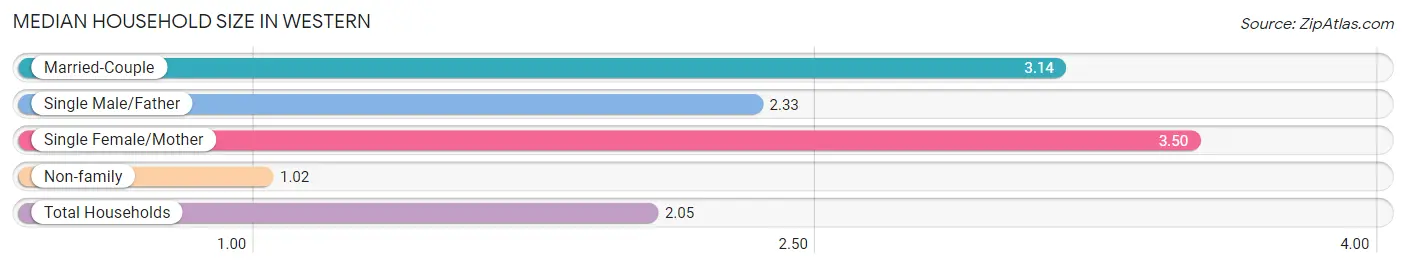
| Household Type | # Households | Household Size |
| Married-Couple | 37 (35.6%) | 3.14 |
| Single Male/Father | 3 (2.9%) | 2.33 |
| Single Female/Mother | 10 (9.6%) | 3.50 |
| Non-family | 54 (51.9%) | 1.02 |
| Total Households | 104 (100.0%) | 2.05 |
Household Size by Marriage Status in Western
Out of a total of 104 households in Western, 50 (48.1%) are family households, while 54 (51.9%) are nonfamily households. The most numerous type of family households are 2-person households, comprising 36, and the most common type of nonfamily households are 1-person households, comprising 51.
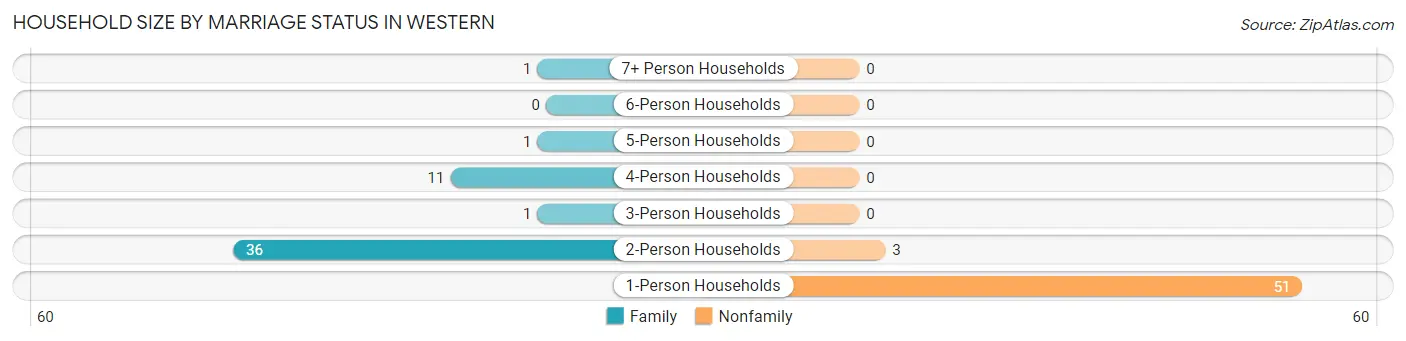
| Household Size | Family Households | Nonfamily Households |
| 1-Person Households | - | 51 (49.0%) |
| 2-Person Households | 36 (34.6%) | 3 (2.9%) |
| 3-Person Households | 1 (1.0%) | 0 (0.0%) |
| 4-Person Households | 11 (10.6%) | 0 (0.0%) |
| 5-Person Households | 1 (1.0%) | 0 (0.0%) |
| 6-Person Households | 0 (0.0%) | 0 (0.0%) |
| 7+ Person Households | 1 (1.0%) | 0 (0.0%) |
| Total | 50 (48.1%) | 54 (51.9%) |
Female Fertility in Western
Fertility by Age in Western
Average fertility rate in Western is 30.0 births per 1,000 women. Women in the age bracket of 20 to 34 years have the highest fertility rate with 48.0 births per 1,000 women. Women in the age bracket of 20 to 34 years acount for 100.0% of all women with births.
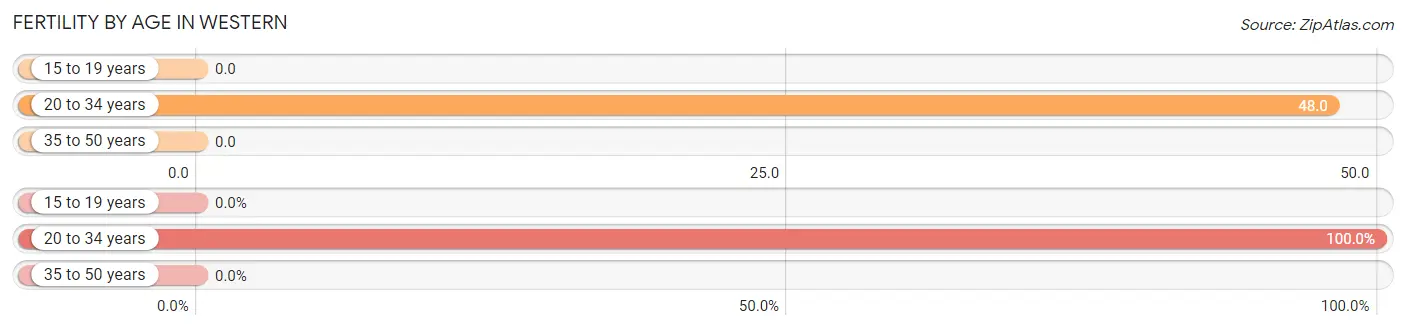
| Age Bracket | Women with Births | Births / 1,000 Women |
| 15 to 19 years | 0 (0.0%) | 0.0 |
| 20 to 34 years | 1 (100.0%) | 48.0 |
| 35 to 50 years | 0 (0.0%) | 0.0 |
| Total | 1 (100.0%) | 30.0 |
Fertility by Age by Marriage Status in Western
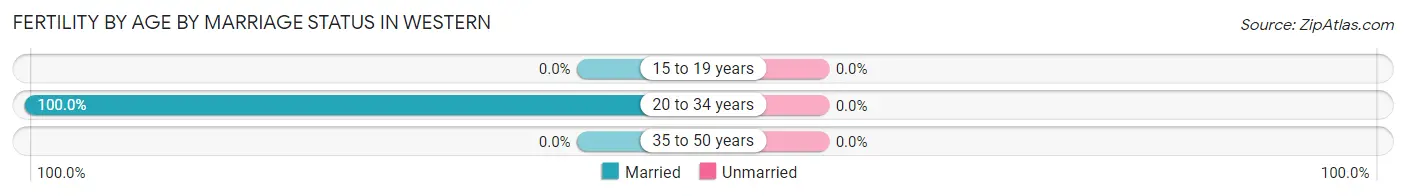
| Age Bracket | Married | Unmarried |
| 15 to 19 years | 0 (0.0%) | 0 (0.0%) |
| 20 to 34 years | 1 (100.0%) | 0 (0.0%) |
| 35 to 50 years | 0 (0.0%) | 0 (0.0%) |
| Total | 1 (100.0%) | 0 (0.0%) |
Fertility by Education in Western
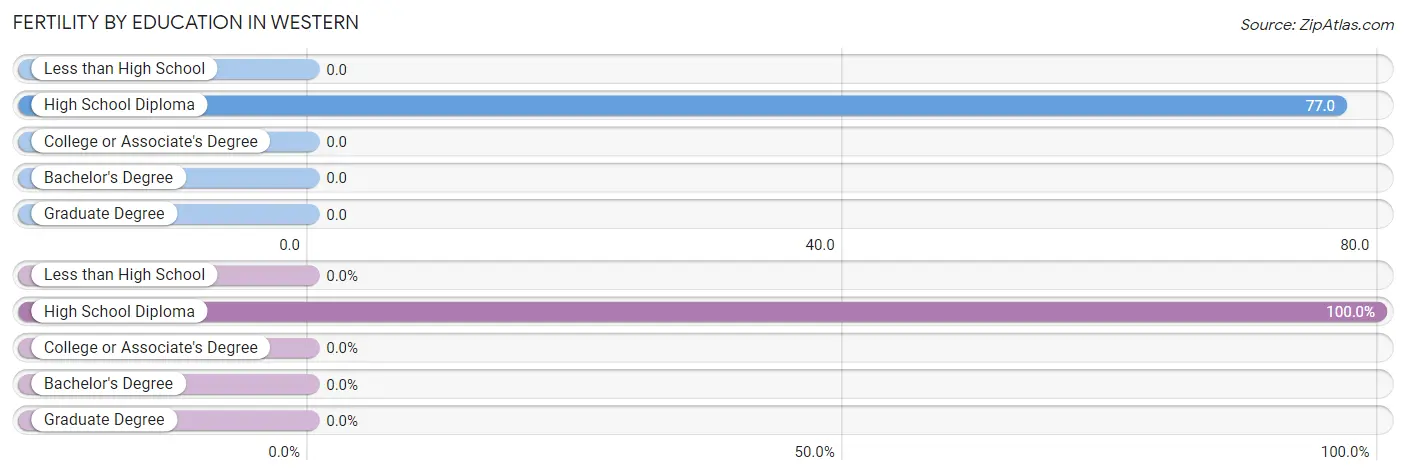
| Educational Attainment | Women with Births | Births / 1,000 Women |
| Less than High School | 0 (0.0%) | 0.0 |
| High School Diploma | 1 (100.0%) | 77.0 |
| College or Associate's Degree | 0 (0.0%) | 0.0 |
| Bachelor's Degree | 0 (0.0%) | 0.0 |
| Graduate Degree | 0 (0.0%) | 0.0 |
| Total | 1 (100.0%) | 30.0 |
Fertility by Education by Marriage Status in Western
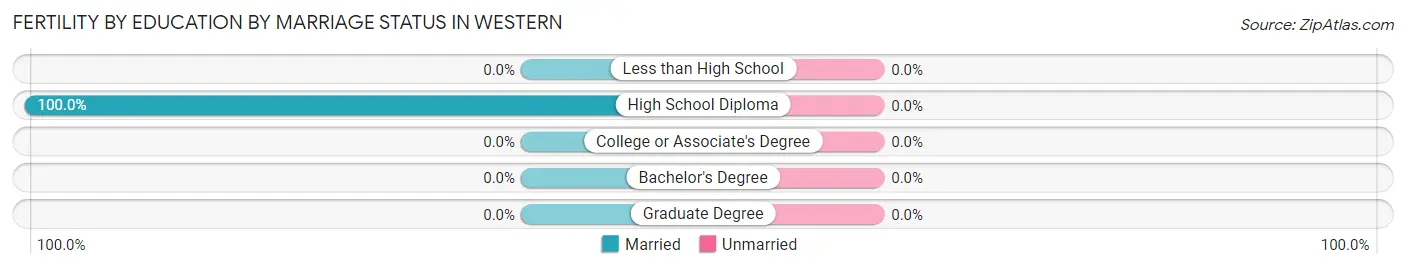
| Educational Attainment | Married | Unmarried |
| Less than High School | 0 (0.0%) | 0 (0.0%) |
| High School Diploma | 1 (100.0%) | 0 (0.0%) |
| College or Associate's Degree | 0 (0.0%) | 0 (0.0%) |
| Bachelor's Degree | 0 (0.0%) | 0 (0.0%) |
| Graduate Degree | 0 (0.0%) | 0 (0.0%) |
| Total | 1 (100.0%) | 0 (0.0%) |
Employment Characteristics in Western
Employment by Class of Employer in Western
Among the 87 employed individuals in Western, private company employees (68 | 78.2%), self-employed (not incorporated) (8 | 9.2%), and state government employees (3 | 3.5%) make up the most common classes of employment.
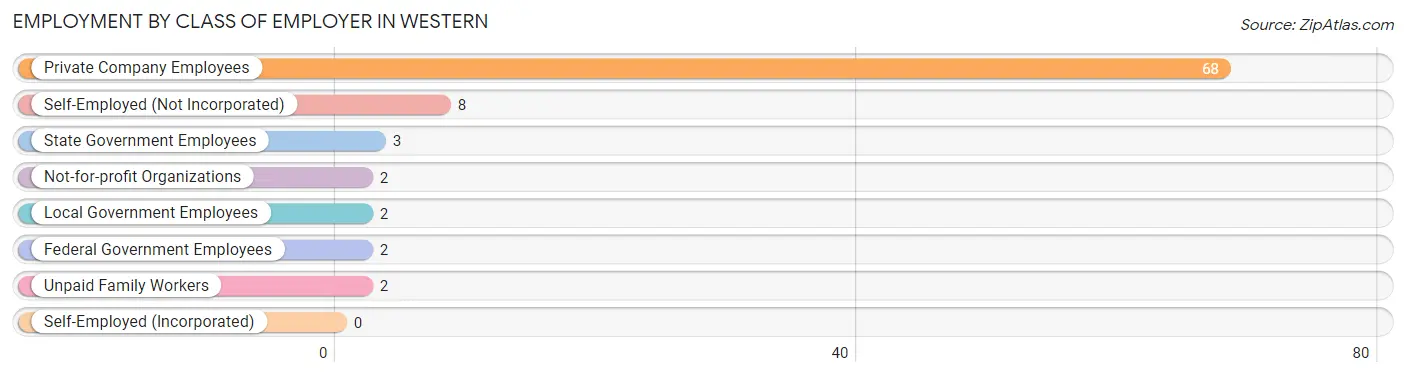
| Employer Class | # Employees | % Employees |
| Private Company Employees | 68 | 78.2% |
| Self-Employed (Incorporated) | 0 | 0.0% |
| Self-Employed (Not Incorporated) | 8 | 9.2% |
| Not-for-profit Organizations | 2 | 2.3% |
| Local Government Employees | 2 | 2.3% |
| State Government Employees | 3 | 3.5% |
| Federal Government Employees | 2 | 2.3% |
| Unpaid Family Workers | 2 | 2.3% |
| Total | 87 | 100.0% |
Employment Status by Age in Western
According to the labor force statistics for Western, out of the total population over 16 years of age (167), 57.5% or 96 individuals are in the labor force, with 7.3% or 7 of them unemployed. The age group with the highest labor force participation rate is 25 to 29 years, with 100.0% or 11 individuals in the labor force. Within the labor force, the 30 to 34 years age range has the highest percentage of unemployed individuals, with 27.8% or 5 of them being unemployed.
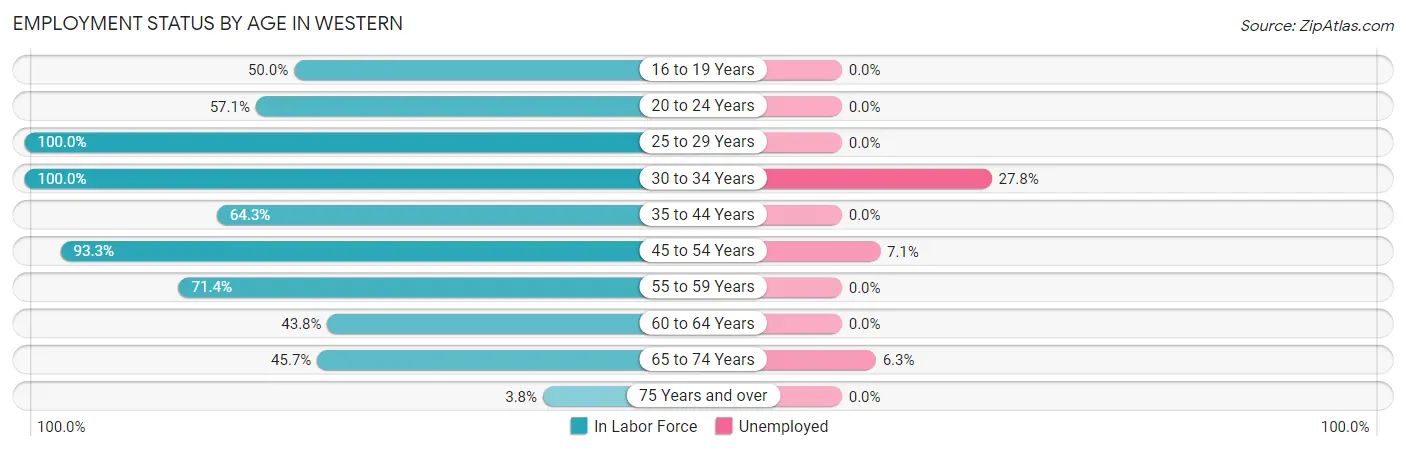
| Age Bracket | In Labor Force | Unemployed |
| 16 to 19 Years | 2 (50.0%) | 0 (0.0%) |
| 20 to 24 Years | 4 (57.1%) | 0 (0.0%) |
| 25 to 29 Years | 11 (100.0%) | 0 (0.0%) |
| 30 to 34 Years | 18 (100.0%) | 5 (27.8%) |
| 35 to 44 Years | 18 (64.3%) | 0 (0.0%) |
| 45 to 54 Years | 14 (93.3%) | 1 (7.1%) |
| 55 to 59 Years | 5 (71.4%) | 0 (0.0%) |
| 60 to 64 Years | 7 (43.8%) | 0 (0.0%) |
| 65 to 74 Years | 16 (45.7%) | 1 (6.3%) |
| 75 Years and over | 1 (3.8%) | 0 (0.0%) |
| Total | 96 (57.5%) | 7 (7.3%) |
Employment Status by Educational Attainment in Western
According to labor force statistics for Western, 76.8% of individuals (73) out of the total population between 25 and 64 years of age (95) are in the labor force, with 8.2% or 6 of them being unemployed. The group with the highest labor force participation rate are those with the educational attainment of bachelor's degree or higher, with 100.0% or 11 individuals in the labor force. Within the labor force, individuals with less than high school education have the highest percentage of unemployment, with 60.0% or 6 of them being unemployed.
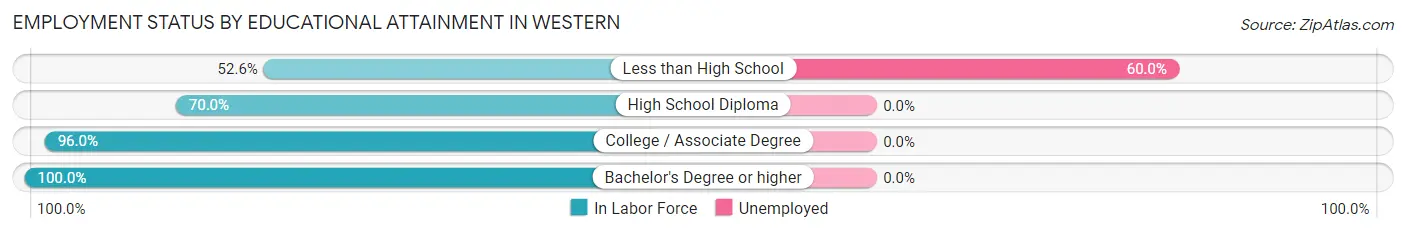
| Educational Attainment | In Labor Force | Unemployed |
| Less than High School | 10 (52.6%) | 11 (60.0%) |
| High School Diploma | 28 (70.0%) | 0 (0.0%) |
| College / Associate Degree | 24 (96.0%) | 0 (0.0%) |
| Bachelor's Degree or higher | 11 (100.0%) | 0 (0.0%) |
| Total | 73 (76.8%) | 8 (8.2%) |
Employment Occupations by Sex in Western
Management, Business, Science and Arts Occupations
The most common Management, Business, Science and Arts occupations in Western are Management (8 | 9.0%), Business & Financial (3 | 3.4%), Computers, Engineering & Science (3 | 3.4%), Life, Physical & Social Science (3 | 3.4%), and Community & Social Service (3 | 3.4%).
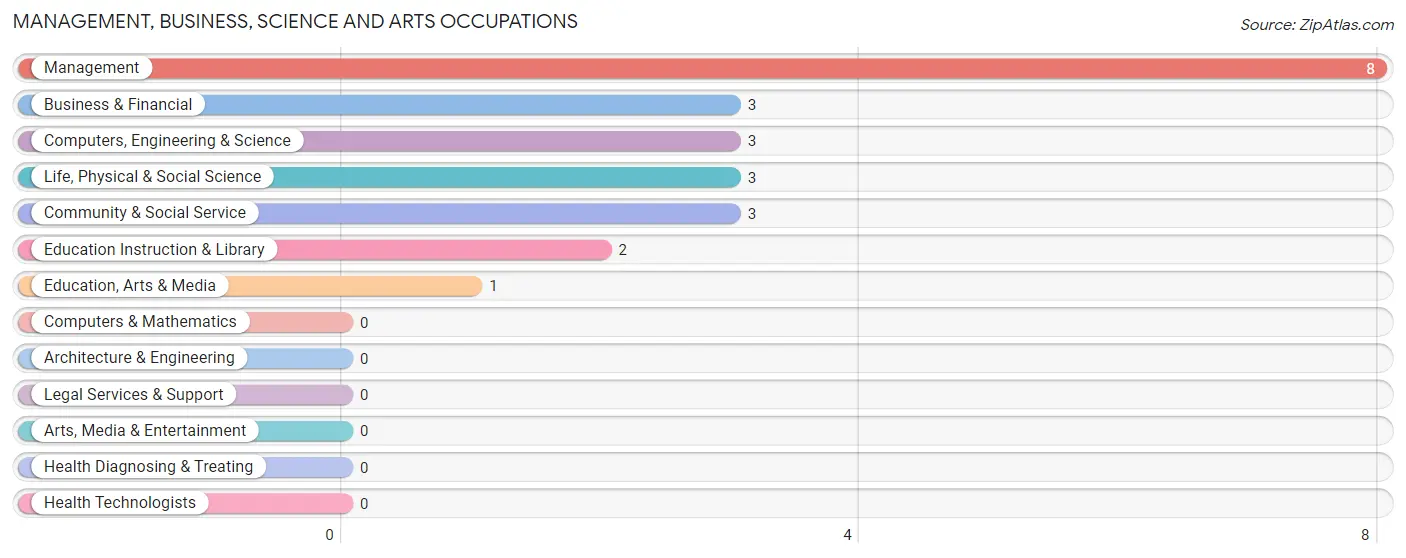
Management, Business, Science and Arts Occupations by Sex
Within the Management, Business, Science and Arts occupations in Western, the most male-oriented occupations are Business & Financial (100.0%), Computers, Engineering & Science (100.0%), and Life, Physical & Social Science (100.0%), while the most female-oriented occupations are Community & Social Service (100.0%), Education, Arts & Media (100.0%), and Education Instruction & Library (100.0%).
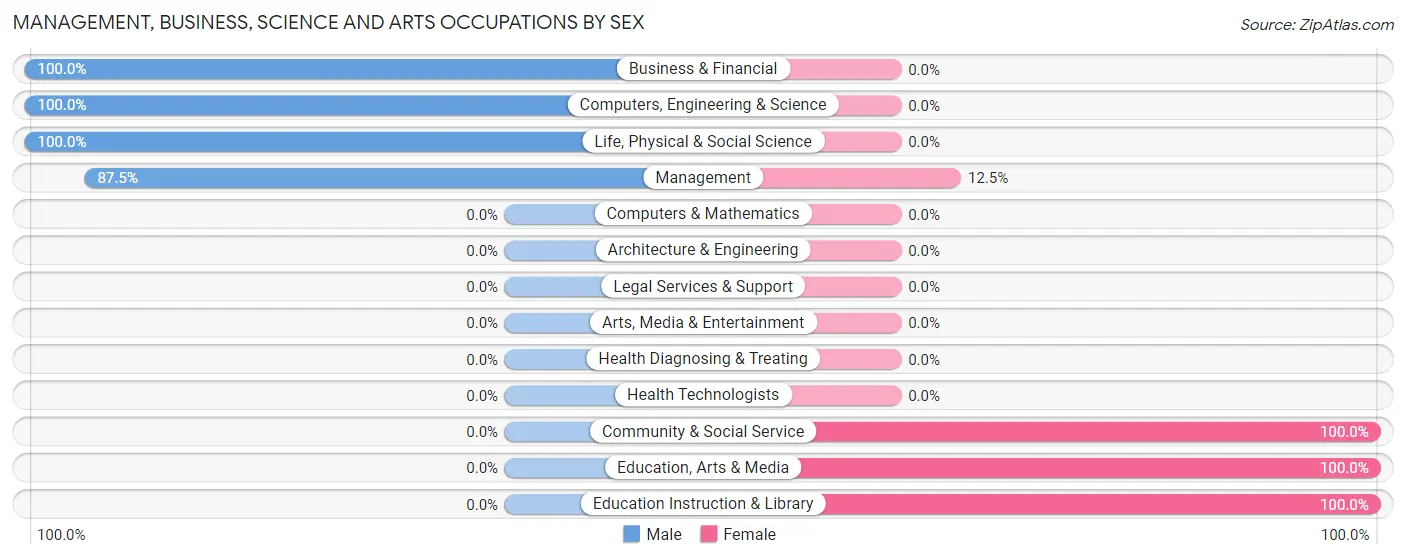
| Occupation | Male | Female |
| Management | 7 (87.5%) | 1 (12.5%) |
| Business & Financial | 3 (100.0%) | 0 (0.0%) |
| Computers, Engineering & Science | 3 (100.0%) | 0 (0.0%) |
| Computers & Mathematics | 0 (0.0%) | 0 (0.0%) |
| Architecture & Engineering | 0 (0.0%) | 0 (0.0%) |
| Life, Physical & Social Science | 3 (100.0%) | 0 (0.0%) |
| Community & Social Service | 0 (0.0%) | 3 (100.0%) |
| Education, Arts & Media | 0 (0.0%) | 1 (100.0%) |
| Legal Services & Support | 0 (0.0%) | 0 (0.0%) |
| Education Instruction & Library | 0 (0.0%) | 2 (100.0%) |
| Arts, Media & Entertainment | 0 (0.0%) | 0 (0.0%) |
| Health Diagnosing & Treating | 0 (0.0%) | 0 (0.0%) |
| Health Technologists | 0 (0.0%) | 0 (0.0%) |
| Total (Category) | 13 (76.5%) | 4 (23.5%) |
| Total (Overall) | 58 (65.2%) | 31 (34.8%) |
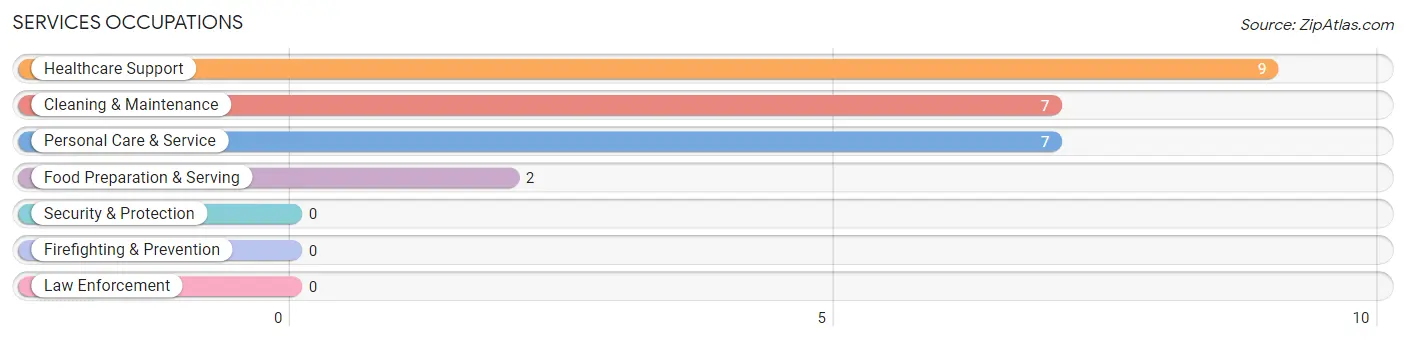
Services Occupations
The most common Services occupations in Western are Healthcare Support (9 | 10.1%), Cleaning & Maintenance (7 | 7.9%), Personal Care & Service (7 | 7.9%), and Food Preparation & Serving (2 | 2.2%).
Services Occupations by Sex
Within the Services occupations in Western, the most male-oriented occupations are Food Preparation & Serving (100.0%), Healthcare Support (88.9%), and Cleaning & Maintenance (85.7%), while the most female-oriented occupations are Personal Care & Service (100.0%), Cleaning & Maintenance (14.3%), and Healthcare Support (11.1%).
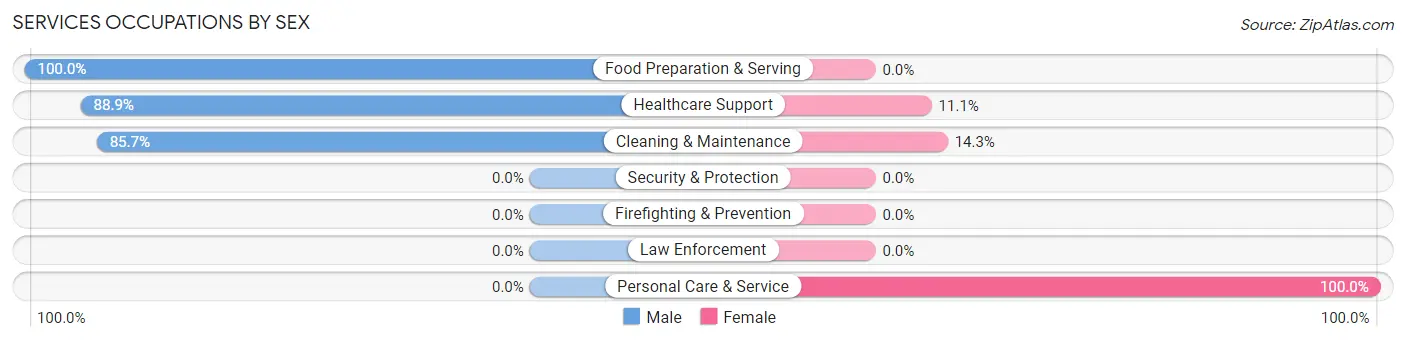
| Occupation | Male | Female |
| Healthcare Support | 8 (88.9%) | 1 (11.1%) |
| Security & Protection | 0 (0.0%) | 0 (0.0%) |
| Firefighting & Prevention | 0 (0.0%) | 0 (0.0%) |
| Law Enforcement | 0 (0.0%) | 0 (0.0%) |
| Food Preparation & Serving | 2 (100.0%) | 0 (0.0%) |
| Cleaning & Maintenance | 6 (85.7%) | 1 (14.3%) |
| Personal Care & Service | 0 (0.0%) | 7 (100.0%) |
| Total (Category) | 16 (64.0%) | 9 (36.0%) |
| Total (Overall) | 58 (65.2%) | 31 (34.8%) |
Sales and Office Occupations
The most common Sales and Office occupations in Western are Sales & Related (6 | 6.7%), and Office & Administration (2 | 2.2%).
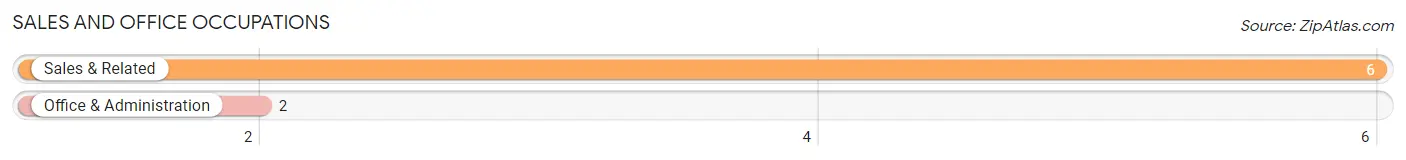
Sales and Office Occupations by Sex
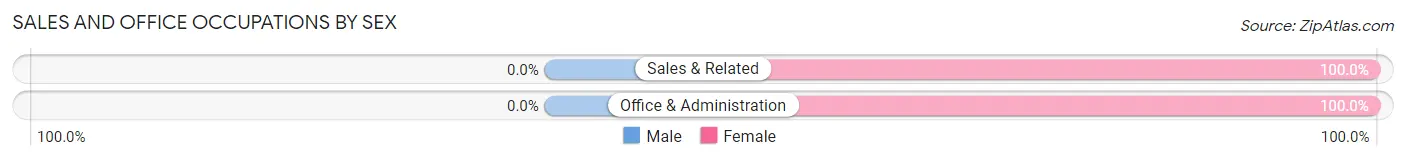
| Occupation | Male | Female |
| Sales & Related | 0 (0.0%) | 6 (100.0%) |
| Office & Administration | 0 (0.0%) | 2 (100.0%) |
| Total (Category) | 0 (0.0%) | 8 (100.0%) |
| Total (Overall) | 58 (65.2%) | 31 (34.8%) |
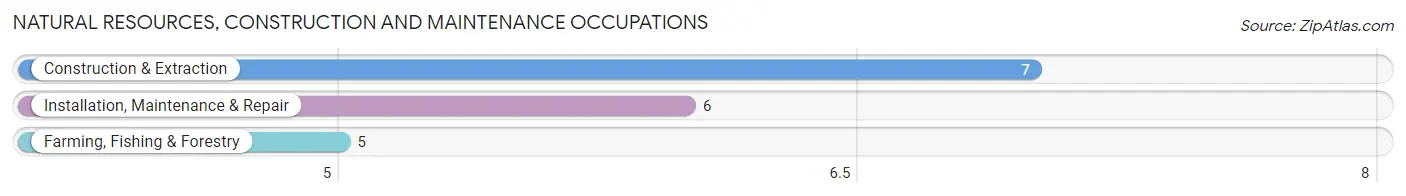
Natural Resources, Construction and Maintenance Occupations
The most common Natural Resources, Construction and Maintenance occupations in Western are Construction & Extraction (7 | 7.9%), Installation, Maintenance & Repair (6 | 6.7%), and Farming, Fishing & Forestry (5 | 5.6%).
Natural Resources, Construction and Maintenance Occupations by Sex
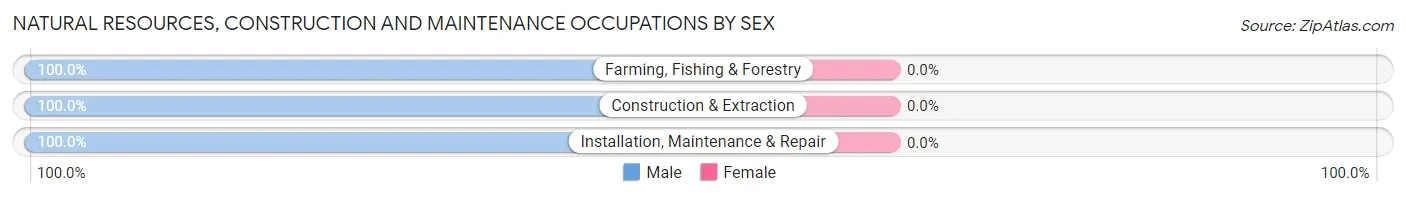
| Occupation | Male | Female |
| Farming, Fishing & Forestry | 5 (100.0%) | 0 (0.0%) |
| Construction & Extraction | 7 (100.0%) | 0 (0.0%) |
| Installation, Maintenance & Repair | 6 (100.0%) | 0 (0.0%) |
| Total (Category) | 18 (100.0%) | 0 (0.0%) |
| Total (Overall) | 58 (65.2%) | 31 (34.8%) |
Production, Transportation and Moving Occupations
The most common Production, Transportation and Moving occupations in Western are Production (13 | 14.6%), Material Moving (5 | 5.6%), and Transportation (3 | 3.4%).
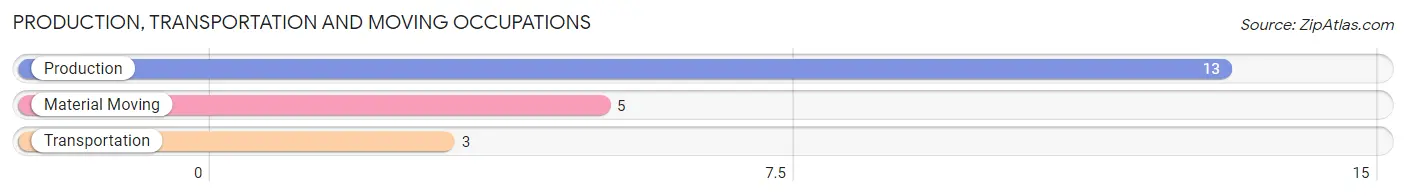
Production, Transportation and Moving Occupations by Sex
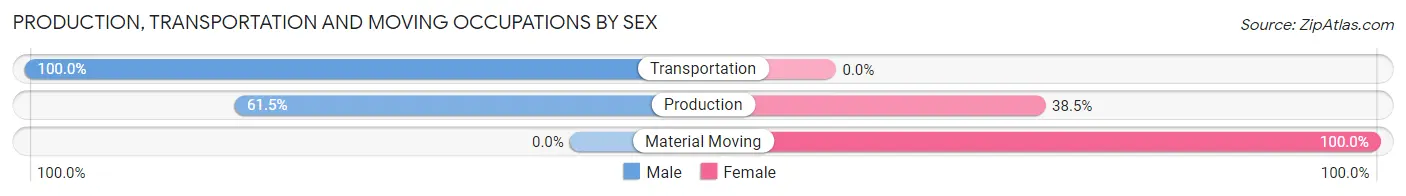
| Occupation | Male | Female |
| Production | 8 (61.5%) | 5 (38.5%) |
| Transportation | 3 (100.0%) | 0 (0.0%) |
| Material Moving | 0 (0.0%) | 5 (100.0%) |
| Total (Category) | 11 (52.4%) | 10 (47.6%) |
| Total (Overall) | 58 (65.2%) | 31 (34.8%) |
Employment Industries by Sex in Western
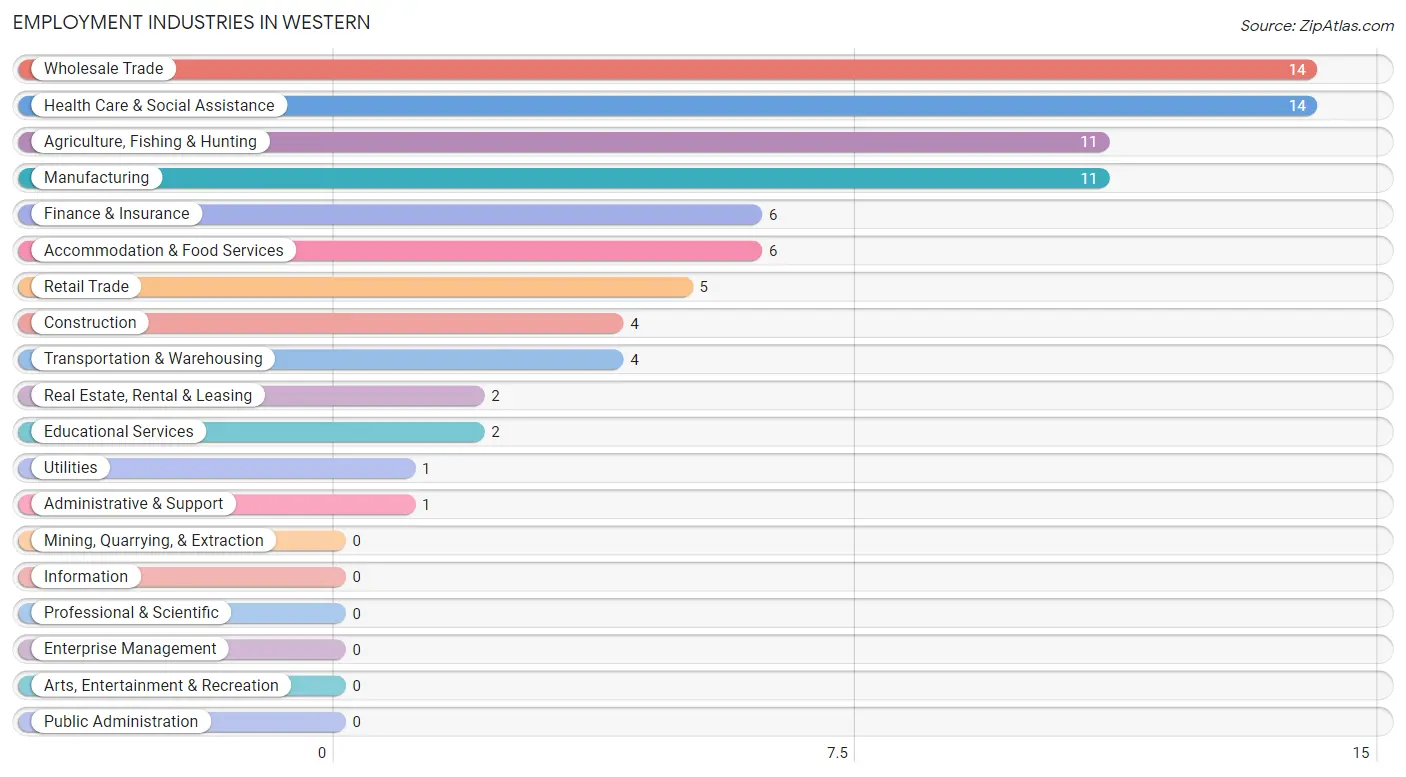
Employment Industries in Western
The major employment industries in Western include Wholesale Trade (14 | 15.7%), Health Care & Social Assistance (14 | 15.7%), Agriculture, Fishing & Hunting (11 | 12.4%), Manufacturing (11 | 12.4%), and Finance & Insurance (6 | 6.7%).
Employment Industries by Sex in Western
The Western industries that see more men than women are Agriculture, Fishing & Hunting (100.0%), Construction (100.0%), and Transportation & Warehousing (100.0%), whereas the industries that tend to have a higher number of women are Finance & Insurance (100.0%), Administrative & Support (100.0%), and Educational Services (100.0%).
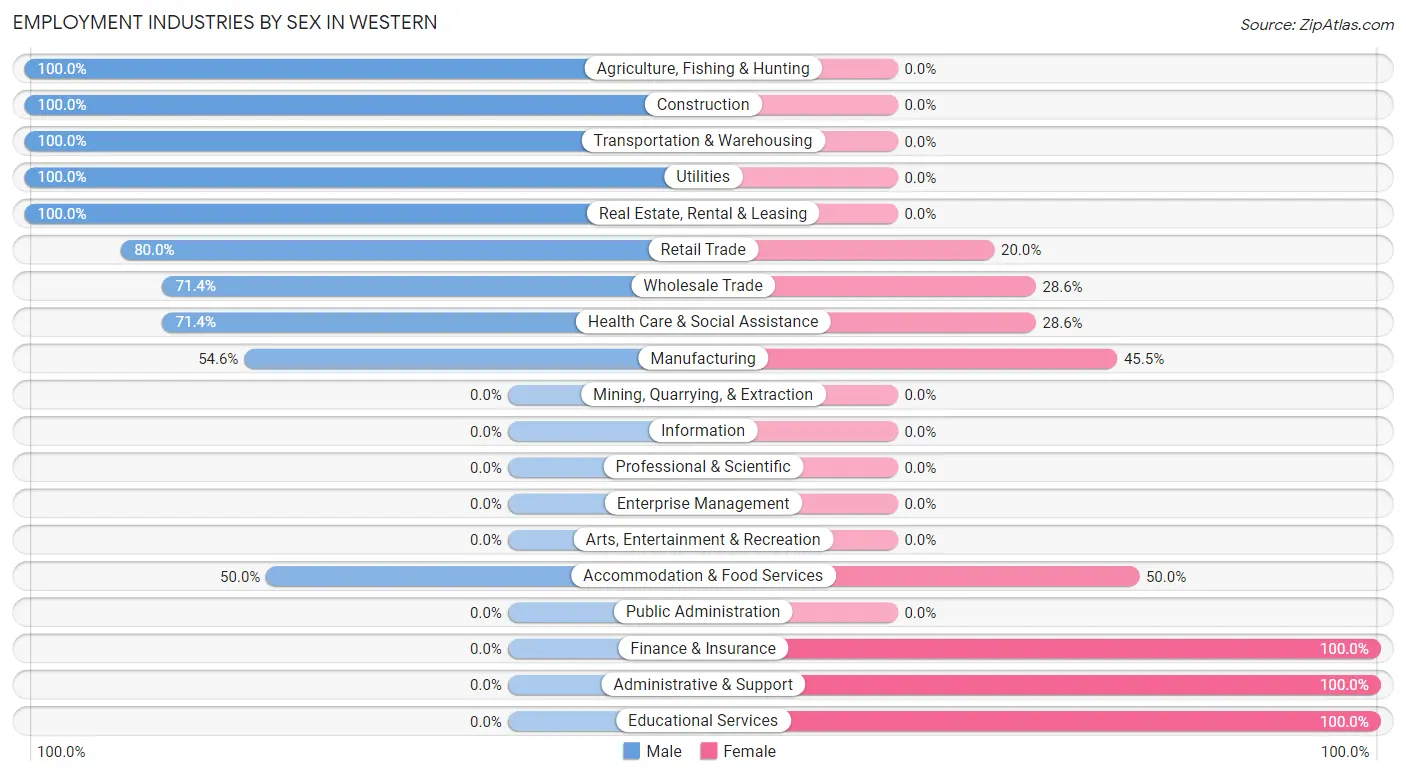
| Industry | Male | Female |
| Agriculture, Fishing & Hunting | 11 (100.0%) | 0 (0.0%) |
| Mining, Quarrying, & Extraction | 0 (0.0%) | 0 (0.0%) |
| Construction | 4 (100.0%) | 0 (0.0%) |
| Manufacturing | 6 (54.5%) | 5 (45.5%) |
| Wholesale Trade | 10 (71.4%) | 4 (28.6%) |
| Retail Trade | 4 (80.0%) | 1 (20.0%) |
| Transportation & Warehousing | 4 (100.0%) | 0 (0.0%) |
| Utilities | 1 (100.0%) | 0 (0.0%) |
| Information | 0 (0.0%) | 0 (0.0%) |
| Finance & Insurance | 0 (0.0%) | 6 (100.0%) |
| Real Estate, Rental & Leasing | 2 (100.0%) | 0 (0.0%) |
| Professional & Scientific | 0 (0.0%) | 0 (0.0%) |
| Enterprise Management | 0 (0.0%) | 0 (0.0%) |
| Administrative & Support | 0 (0.0%) | 1 (100.0%) |
| Educational Services | 0 (0.0%) | 2 (100.0%) |
| Health Care & Social Assistance | 10 (71.4%) | 4 (28.6%) |
| Arts, Entertainment & Recreation | 0 (0.0%) | 0 (0.0%) |
| Accommodation & Food Services | 3 (50.0%) | 3 (50.0%) |
| Public Administration | 0 (0.0%) | 0 (0.0%) |
| Total | 58 (65.2%) | 31 (34.8%) |
Education in Western
School Enrollment in Western
The most common levels of schooling among the 47 students in Western are elementary school (23 | 48.9%), middle school (14 | 29.8%), and college / undergraduate (5 | 10.6%).
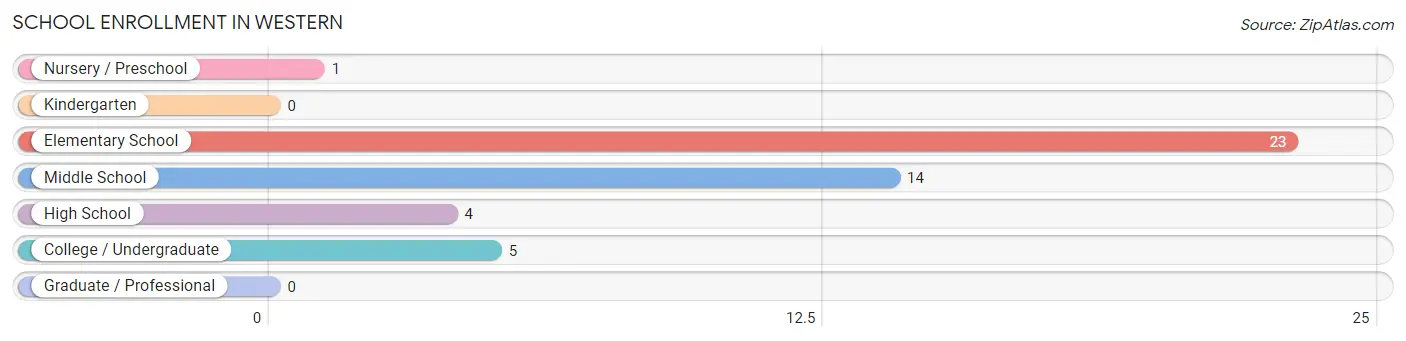
| School Level | # Students | % Students |
| Nursery / Preschool | 1 | 2.1% |
| Kindergarten | 0 | 0.0% |
| Elementary School | 23 | 48.9% |
| Middle School | 14 | 29.8% |
| High School | 4 | 8.5% |
| College / Undergraduate | 5 | 10.6% |
| Graduate / Professional | 0 | 0.0% |
| Total | 47 | 100.0% |
School Enrollment by Age by Funding Source in Western
Out of a total of 47 students who are enrolled in schools in Western, 6 (12.8%) attend a private institution, while the remaining 41 (87.2%) are enrolled in public schools. The age group of 15 to 17 year olds has the highest likelihood of being enrolled in private schools, with 2 (100.0% in the age bracket) enrolled. Conversely, the age group of 20 to 24 year olds has the lowest likelihood of being enrolled in a private school, with 3 (100.0% in the age bracket) attending a public institution.
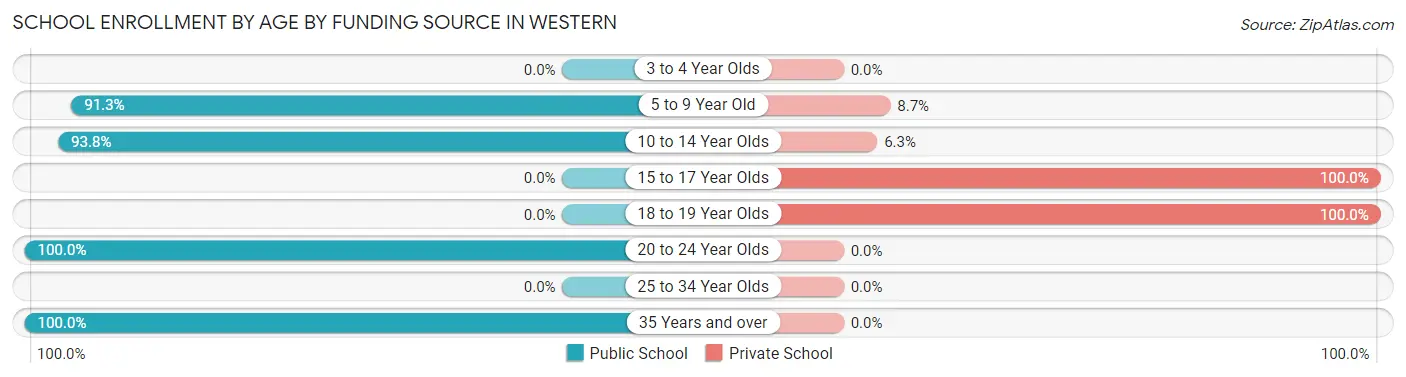
| Age Bracket | Public School | Private School |
| 3 to 4 Year Olds | 0 (0.0%) | 0 (0.0%) |
| 5 to 9 Year Old | 21 (91.3%) | 2 (8.7%) |
| 10 to 14 Year Olds | 15 (93.8%) | 1 (6.2%) |
| 15 to 17 Year Olds | 0 (0.0%) | 2 (100.0%) |
| 18 to 19 Year Olds | 0 (0.0%) | 1 (100.0%) |
| 20 to 24 Year Olds | 3 (100.0%) | 0 (0.0%) |
| 25 to 34 Year Olds | 0 (0.0%) | 0 (0.0%) |
| 35 Years and over | 2 (100.0%) | 0 (0.0%) |
| Total | 41 (87.2%) | 6 (12.8%) |
Educational Attainment by Field of Study in Western
Education (7 | 36.8%), psychology (4 | 21.0%), business (4 | 21.0%), bio, nature & agricultural (3 | 15.8%), and arts & humanities (1 | 5.3%) are the most common fields of study among 19 individuals in Western who have obtained a bachelor's degree or higher.
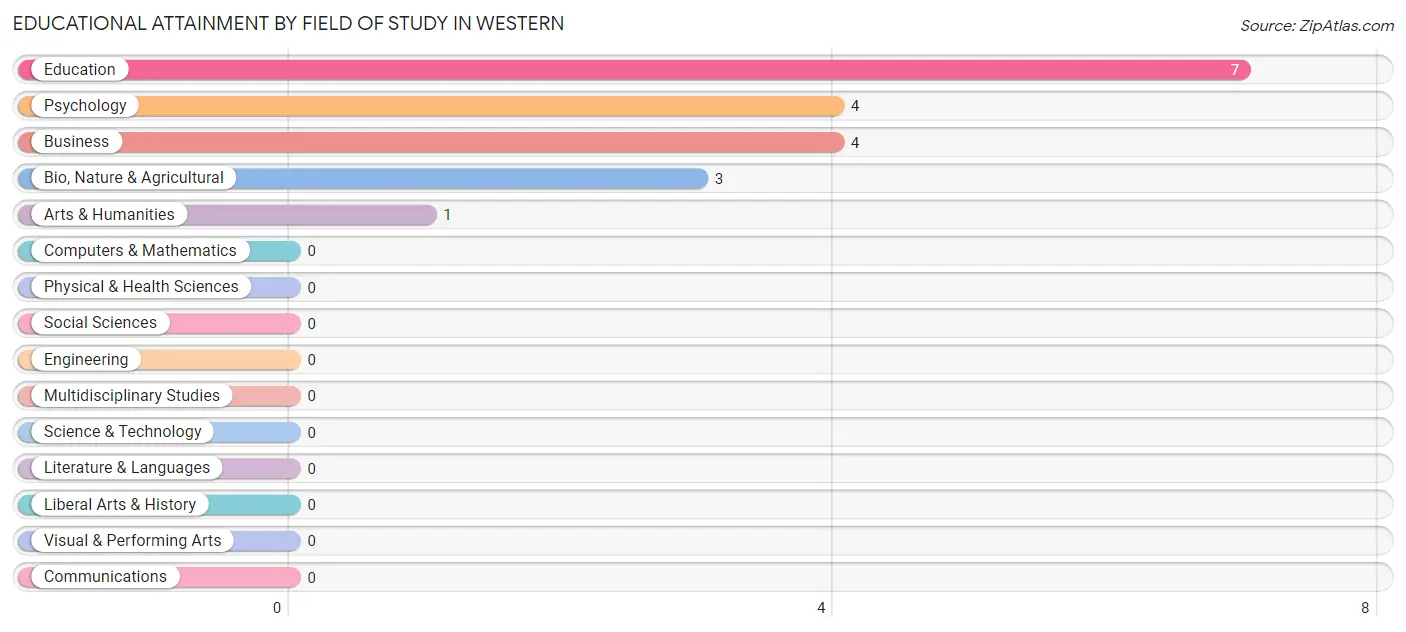
| Field of Study | # Graduates | % Graduates |
| Computers & Mathematics | 0 | 0.0% |
| Bio, Nature & Agricultural | 3 | 15.8% |
| Physical & Health Sciences | 0 | 0.0% |
| Psychology | 4 | 21.0% |
| Social Sciences | 0 | 0.0% |
| Engineering | 0 | 0.0% |
| Multidisciplinary Studies | 0 | 0.0% |
| Science & Technology | 0 | 0.0% |
| Business | 4 | 21.0% |
| Education | 7 | 36.8% |
| Literature & Languages | 0 | 0.0% |
| Liberal Arts & History | 0 | 0.0% |
| Visual & Performing Arts | 0 | 0.0% |
| Communications | 0 | 0.0% |
| Arts & Humanities | 1 | 5.3% |
| Total | 19 | 100.0% |
Transportation & Commute in Western
Vehicle Availability by Sex in Western
The most prevalent vehicle ownership categories in Western are males with 2 vehicles (21, accounting for 37.5%) and females with 2 vehicles (4, making up 67.7%).
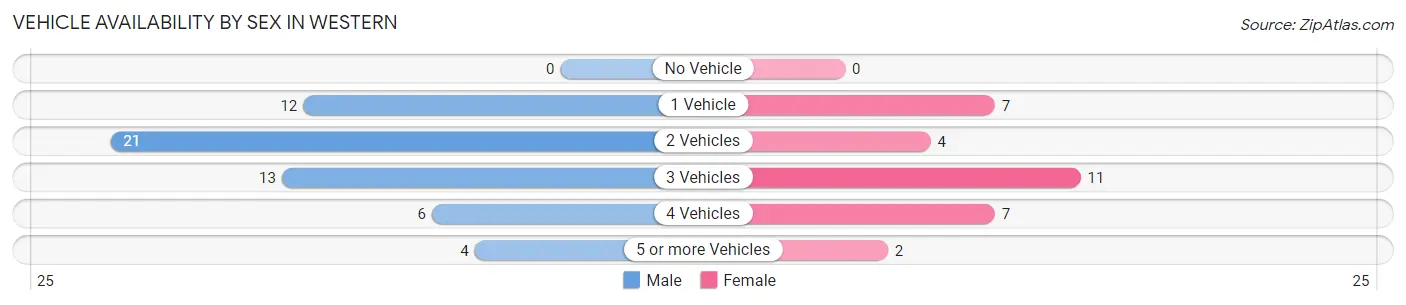
| Vehicles Available | Male | Female |
| No Vehicle | 0 (0.0%) | 0 (0.0%) |
| 1 Vehicle | 12 (21.4%) | 7 (22.6%) |
| 2 Vehicles | 21 (37.5%) | 4 (12.9%) |
| 3 Vehicles | 13 (23.2%) | 11 (35.5%) |
| 4 Vehicles | 6 (10.7%) | 7 (22.6%) |
| 5 or more Vehicles | 4 (7.1%) | 2 (6.5%) |
| Total | 56 (100.0%) | 31 (100.0%) |
Commute Time in Western
The most frequently occuring commute durations in Western are 45 to 59 minutes (30 commuters, 38.0%), less than 5 minutes (10 commuters, 12.7%), and 15 to 19 minutes (10 commuters, 12.7%).
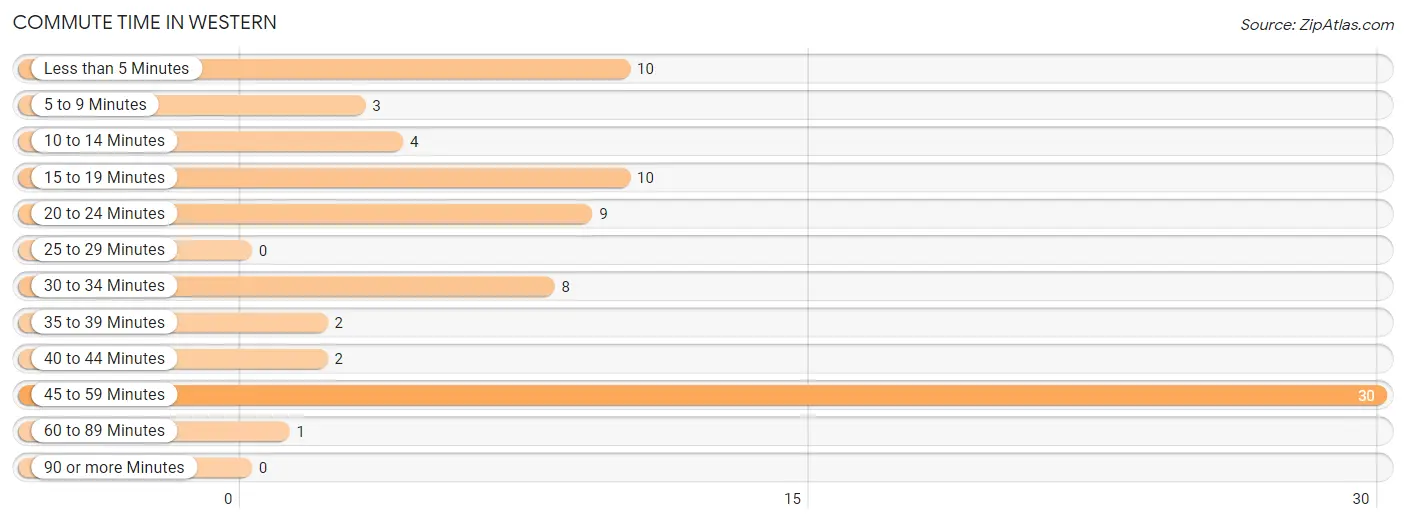
| Commute Time | # Commuters | % Commuters |
| Less than 5 Minutes | 10 | 12.7% |
| 5 to 9 Minutes | 3 | 3.8% |
| 10 to 14 Minutes | 4 | 5.1% |
| 15 to 19 Minutes | 10 | 12.7% |
| 20 to 24 Minutes | 9 | 11.4% |
| 25 to 29 Minutes | 0 | 0.0% |
| 30 to 34 Minutes | 8 | 10.1% |
| 35 to 39 Minutes | 2 | 2.5% |
| 40 to 44 Minutes | 2 | 2.5% |
| 45 to 59 Minutes | 30 | 38.0% |
| 60 to 89 Minutes | 1 | 1.3% |
| 90 or more Minutes | 0 | 0.0% |
Commute Time by Sex in Western
The most common commute times in Western are 45 to 59 minutes (20 commuters, 39.2%) for males and 45 to 59 minutes (10 commuters, 35.7%) for females.
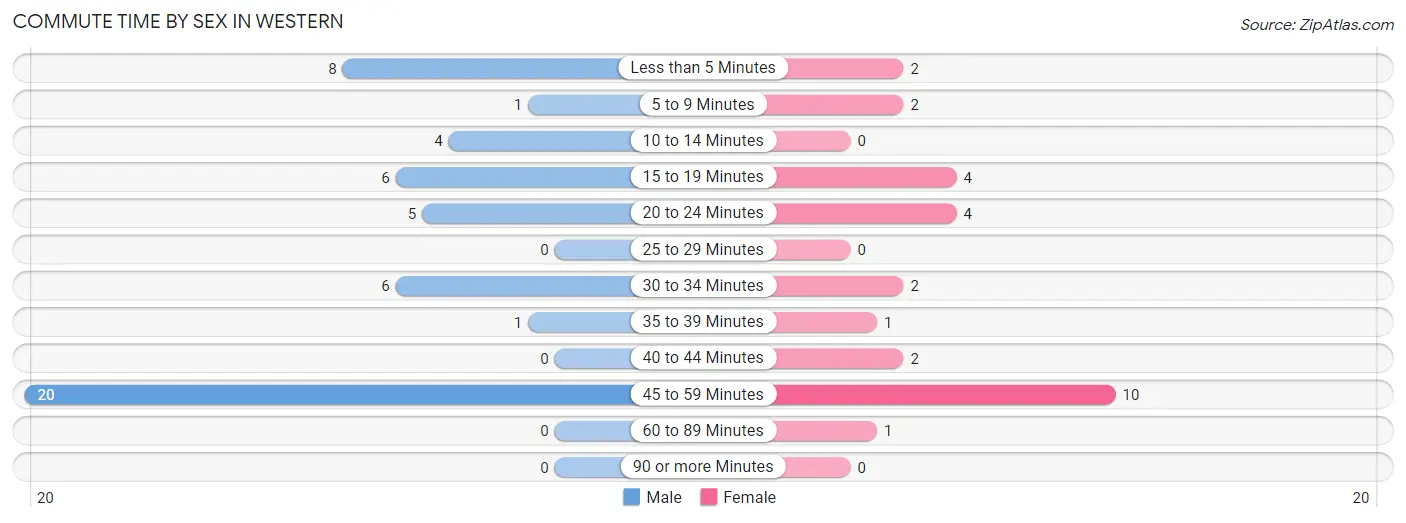
| Commute Time | Male | Female |
| Less than 5 Minutes | 8 (15.7%) | 2 (7.1%) |
| 5 to 9 Minutes | 1 (2.0%) | 2 (7.1%) |
| 10 to 14 Minutes | 4 (7.8%) | 0 (0.0%) |
| 15 to 19 Minutes | 6 (11.8%) | 4 (14.3%) |
| 20 to 24 Minutes | 5 (9.8%) | 4 (14.3%) |
| 25 to 29 Minutes | 0 (0.0%) | 0 (0.0%) |
| 30 to 34 Minutes | 6 (11.8%) | 2 (7.1%) |
| 35 to 39 Minutes | 1 (2.0%) | 1 (3.6%) |
| 40 to 44 Minutes | 0 (0.0%) | 2 (7.1%) |
| 45 to 59 Minutes | 20 (39.2%) | 10 (35.7%) |
| 60 to 89 Minutes | 0 (0.0%) | 1 (3.6%) |
| 90 or more Minutes | 0 (0.0%) | 0 (0.0%) |
Time of Departure to Work by Sex in Western
The most frequent times of departure to work in Western are 4:00 PM to 11:59 PM (8, 15.7%) for males and 7:30 AM to 7:59 AM (8, 28.6%) for females.
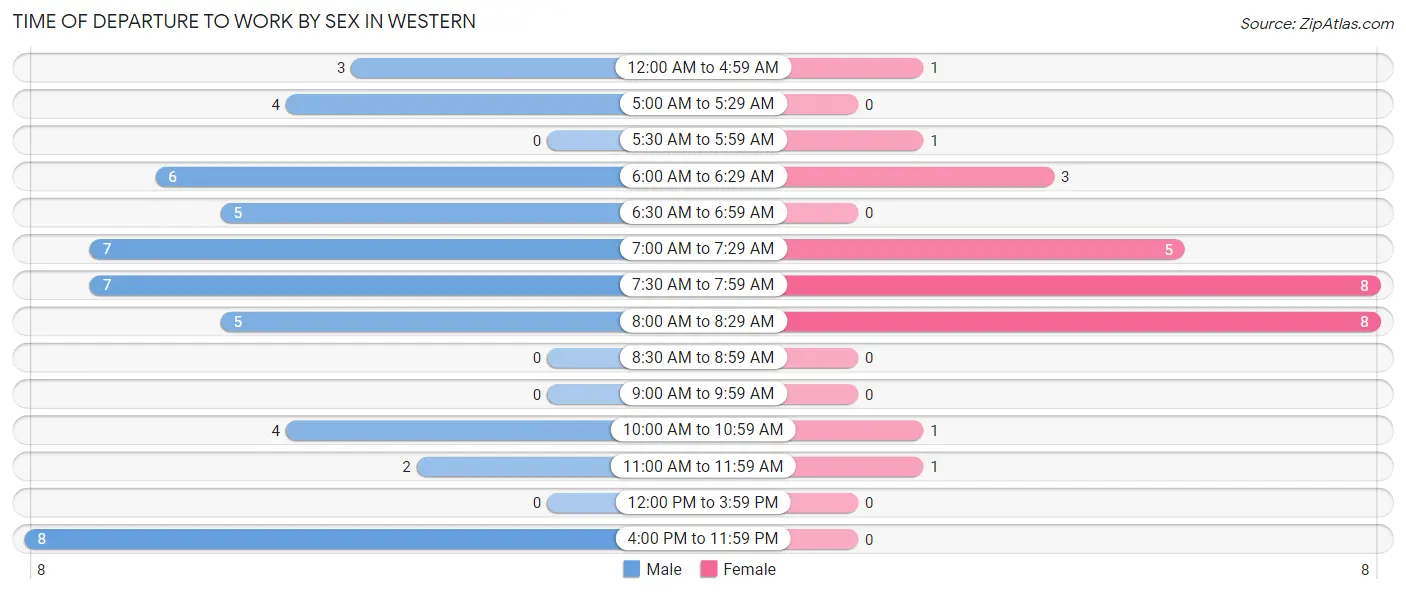
| Time of Departure | Male | Female |
| 12:00 AM to 4:59 AM | 3 (5.9%) | 1 (3.6%) |
| 5:00 AM to 5:29 AM | 4 (7.8%) | 0 (0.0%) |
| 5:30 AM to 5:59 AM | 0 (0.0%) | 1 (3.6%) |
| 6:00 AM to 6:29 AM | 6 (11.8%) | 3 (10.7%) |
| 6:30 AM to 6:59 AM | 5 (9.8%) | 0 (0.0%) |
| 7:00 AM to 7:29 AM | 7 (13.7%) | 5 (17.9%) |
| 7:30 AM to 7:59 AM | 7 (13.7%) | 8 (28.6%) |
| 8:00 AM to 8:29 AM | 5 (9.8%) | 8 (28.6%) |
| 8:30 AM to 8:59 AM | 0 (0.0%) | 0 (0.0%) |
| 9:00 AM to 9:59 AM | 0 (0.0%) | 0 (0.0%) |
| 10:00 AM to 10:59 AM | 4 (7.8%) | 1 (3.6%) |
| 11:00 AM to 11:59 AM | 2 (3.9%) | 1 (3.6%) |
| 12:00 PM to 3:59 PM | 0 (0.0%) | 0 (0.0%) |
| 4:00 PM to 11:59 PM | 8 (15.7%) | 0 (0.0%) |
| Total | 51 (100.0%) | 28 (100.0%) |
Housing Occupancy in Western
Occupancy by Ownership in Western
Of the total 104 dwellings in Western, owner-occupied units account for 92 (88.5%), while renter-occupied units make up 12 (11.5%).
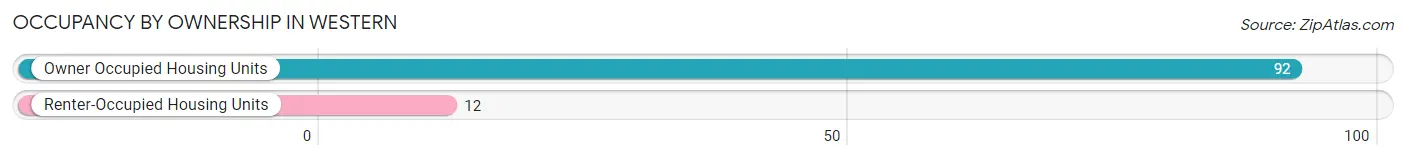
| Occupancy | # Housing Units | % Housing Units |
| Owner Occupied Housing Units | 92 | 88.5% |
| Renter-Occupied Housing Units | 12 | 11.5% |
| Total Occupied Housing Units | 104 | 100.0% |
Occupancy by Household Size in Western
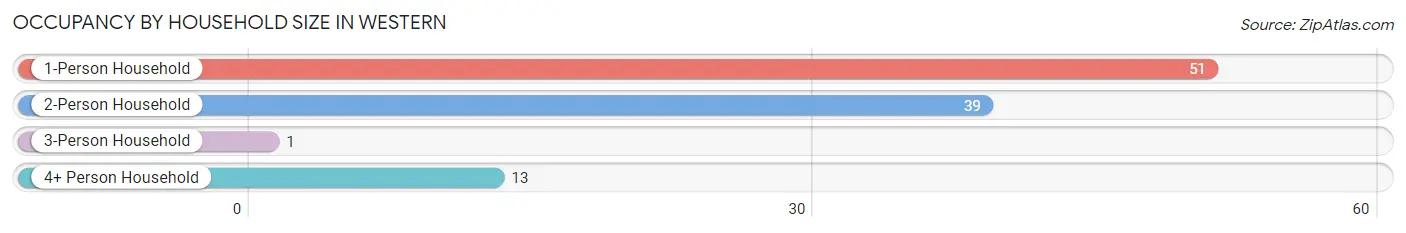
| Household Size | # Housing Units | % Housing Units |
| 1-Person Household | 51 | 49.0% |
| 2-Person Household | 39 | 37.5% |
| 3-Person Household | 1 | 1.0% |
| 4+ Person Household | 13 | 12.5% |
| Total Housing Units | 104 | 100.0% |
Occupancy by Ownership by Household Size in Western
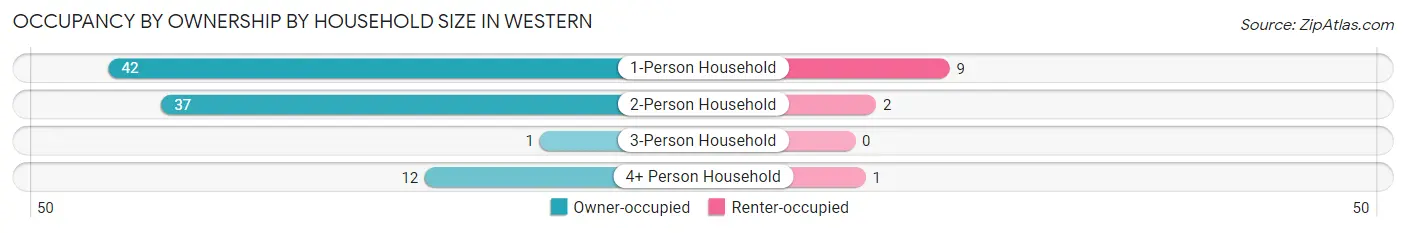
| Household Size | Owner-occupied | Renter-occupied |
| 1-Person Household | 42 (82.4%) | 9 (17.6%) |
| 2-Person Household | 37 (94.9%) | 2 (5.1%) |
| 3-Person Household | 1 (100.0%) | 0 (0.0%) |
| 4+ Person Household | 12 (92.3%) | 1 (7.7%) |
| Total Housing Units | 92 (88.5%) | 12 (11.5%) |
Occupancy by Educational Attainment in Western
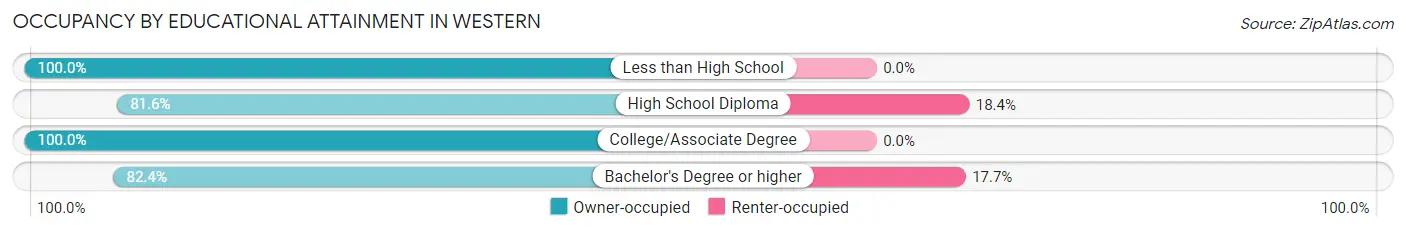
| Household Size | Owner-occupied | Renter-occupied |
| Less than High School | 7 (100.0%) | 0 (0.0%) |
| High School Diploma | 40 (81.6%) | 9 (18.4%) |
| College/Associate Degree | 31 (100.0%) | 0 (0.0%) |
| Bachelor's Degree or higher | 14 (82.4%) | 3 (17.6%) |
Occupancy by Age of Householder in Western
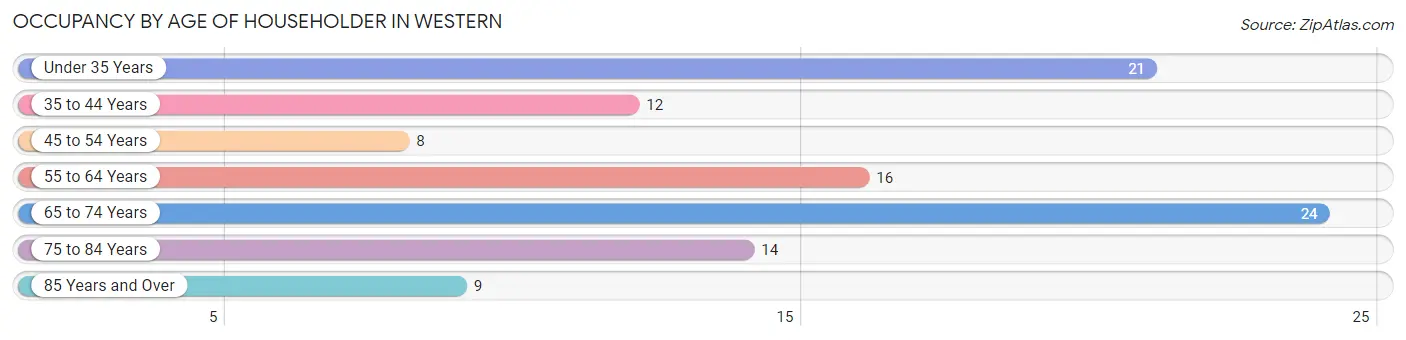
| Age Bracket | # Households | % Households |
| Under 35 Years | 21 | 20.2% |
| 35 to 44 Years | 12 | 11.5% |
| 45 to 54 Years | 8 | 7.7% |
| 55 to 64 Years | 16 | 15.4% |
| 65 to 74 Years | 24 | 23.1% |
| 75 to 84 Years | 14 | 13.5% |
| 85 Years and Over | 9 | 8.6% |
| Total | 104 | 100.0% |
Housing Finances in Western
Median Income by Occupancy in Western
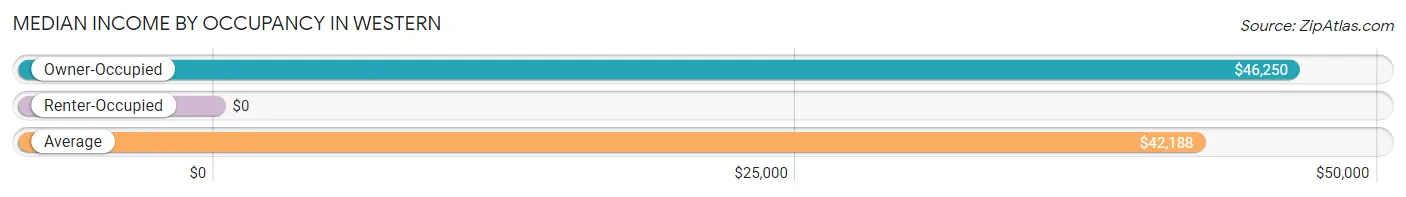
| Occupancy Type | # Households | Median Income |
| Owner-Occupied | 92 (88.5%) | $46,250 |
| Renter-Occupied | 12 (11.5%) | $0 |
| Average | 104 (100.0%) | $42,188 |
Occupancy by Householder Income Bracket in Western
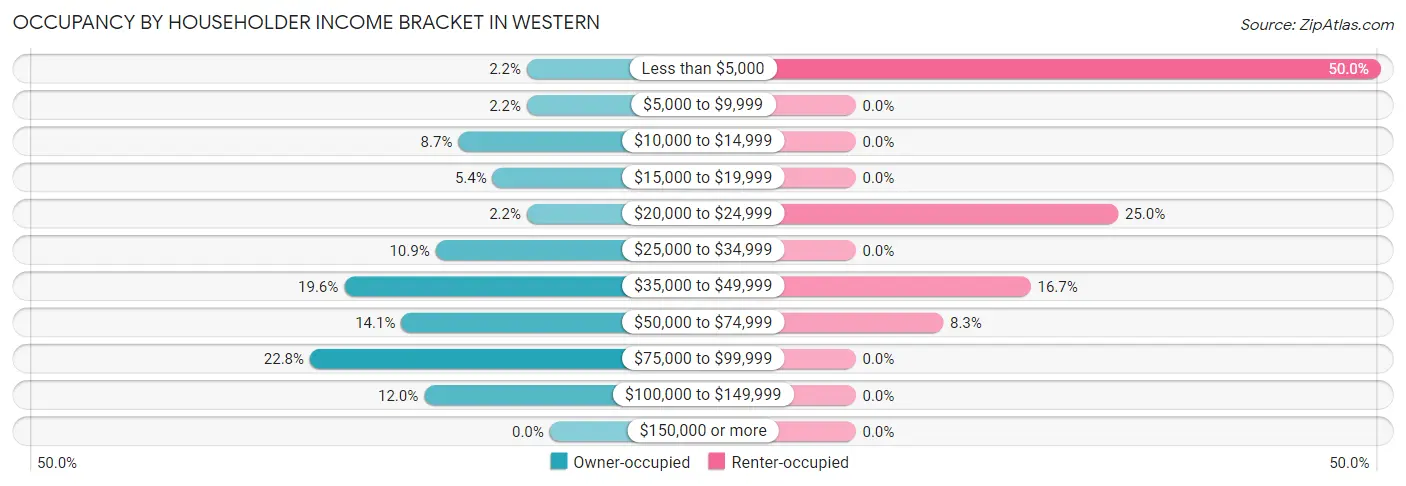
| Income Bracket | Owner-occupied | Renter-occupied |
| Less than $5,000 | 2 (2.2%) | 6 (50.0%) |
| $5,000 to $9,999 | 2 (2.2%) | 0 (0.0%) |
| $10,000 to $14,999 | 8 (8.7%) | 0 (0.0%) |
| $15,000 to $19,999 | 5 (5.4%) | 0 (0.0%) |
| $20,000 to $24,999 | 2 (2.2%) | 3 (25.0%) |
| $25,000 to $34,999 | 10 (10.9%) | 0 (0.0%) |
| $35,000 to $49,999 | 18 (19.6%) | 2 (16.7%) |
| $50,000 to $74,999 | 13 (14.1%) | 1 (8.3%) |
| $75,000 to $99,999 | 21 (22.8%) | 0 (0.0%) |
| $100,000 to $149,999 | 11 (12.0%) | 0 (0.0%) |
| $150,000 or more | 0 (0.0%) | 0 (0.0%) |
| Total | 92 (100.0%) | 12 (100.0%) |
Monthly Housing Cost Tiers in Western
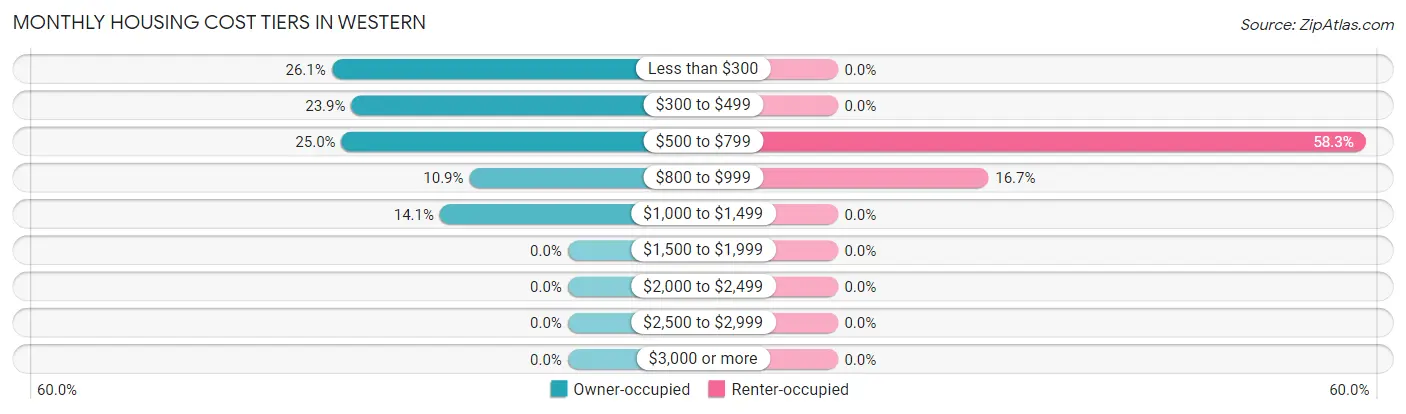
| Monthly Cost | Owner-occupied | Renter-occupied |
| Less than $300 | 24 (26.1%) | 0 (0.0%) |
| $300 to $499 | 22 (23.9%) | 0 (0.0%) |
| $500 to $799 | 23 (25.0%) | 7 (58.3%) |
| $800 to $999 | 10 (10.9%) | 2 (16.7%) |
| $1,000 to $1,499 | 13 (14.1%) | 0 (0.0%) |
| $1,500 to $1,999 | 0 (0.0%) | 0 (0.0%) |
| $2,000 to $2,499 | 0 (0.0%) | 0 (0.0%) |
| $2,500 to $2,999 | 0 (0.0%) | 0 (0.0%) |
| $3,000 or more | 0 (0.0%) | 0 (0.0%) |
| Total | 92 (100.0%) | 12 (100.0%) |
Physical Housing Characteristics in Western
Housing Structures in Western
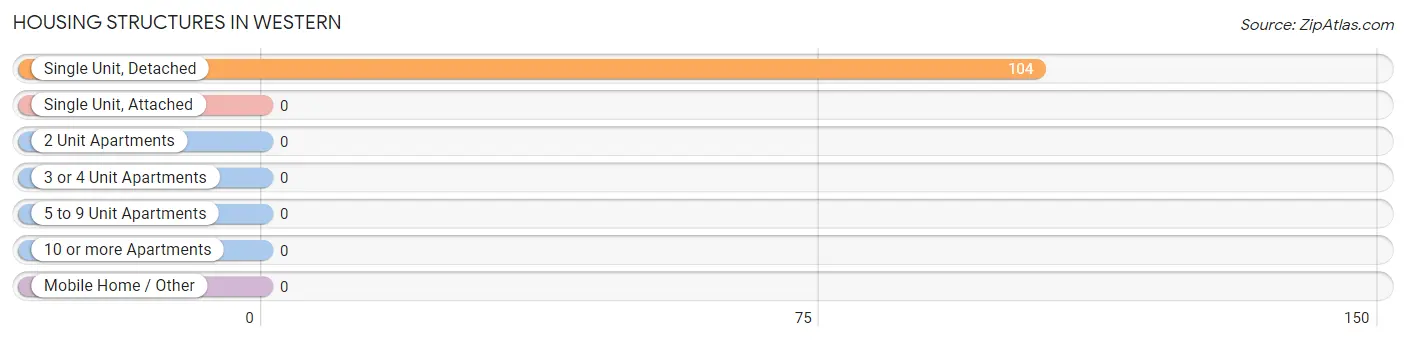
| Structure Type | # Housing Units | % Housing Units |
| Single Unit, Detached | 104 | 100.0% |
| Single Unit, Attached | 0 | 0.0% |
| 2 Unit Apartments | 0 | 0.0% |
| 3 or 4 Unit Apartments | 0 | 0.0% |
| 5 to 9 Unit Apartments | 0 | 0.0% |
| 10 or more Apartments | 0 | 0.0% |
| Mobile Home / Other | 0 | 0.0% |
| Total | 104 | 100.0% |
Housing Structures by Occupancy in Western
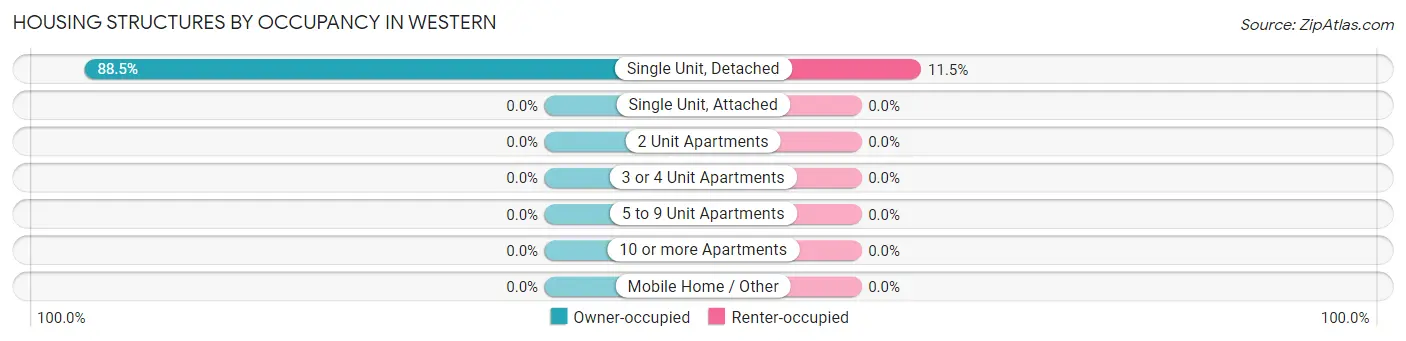
| Structure Type | Owner-occupied | Renter-occupied |
| Single Unit, Detached | 92 (88.5%) | 12 (11.5%) |
| Single Unit, Attached | 0 (0.0%) | 0 (0.0%) |
| 2 Unit Apartments | 0 (0.0%) | 0 (0.0%) |
| 3 or 4 Unit Apartments | 0 (0.0%) | 0 (0.0%) |
| 5 to 9 Unit Apartments | 0 (0.0%) | 0 (0.0%) |
| 10 or more Apartments | 0 (0.0%) | 0 (0.0%) |
| Mobile Home / Other | 0 (0.0%) | 0 (0.0%) |
| Total | 92 (88.5%) | 12 (11.5%) |
Housing Structures by Number of Rooms in Western
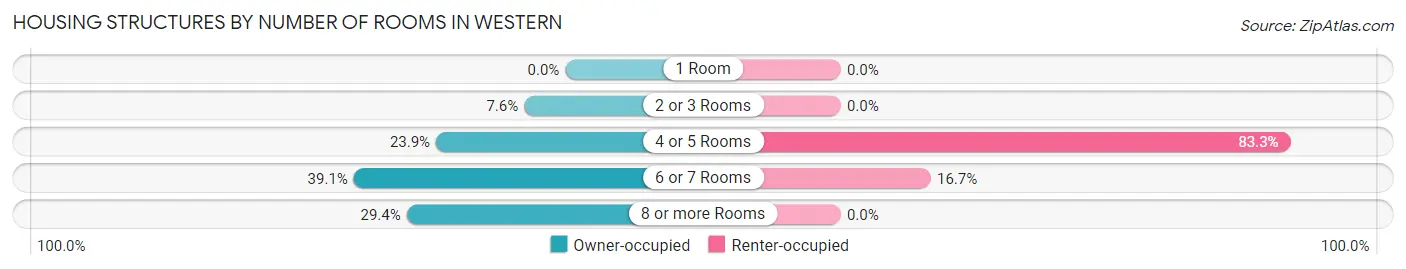
| Number of Rooms | Owner-occupied | Renter-occupied |
| 1 Room | 0 (0.0%) | 0 (0.0%) |
| 2 or 3 Rooms | 7 (7.6%) | 0 (0.0%) |
| 4 or 5 Rooms | 22 (23.9%) | 10 (83.3%) |
| 6 or 7 Rooms | 36 (39.1%) | 2 (16.7%) |
| 8 or more Rooms | 27 (29.3%) | 0 (0.0%) |
| Total | 92 (100.0%) | 12 (100.0%) |
Housing Structure by Heating Type in Western
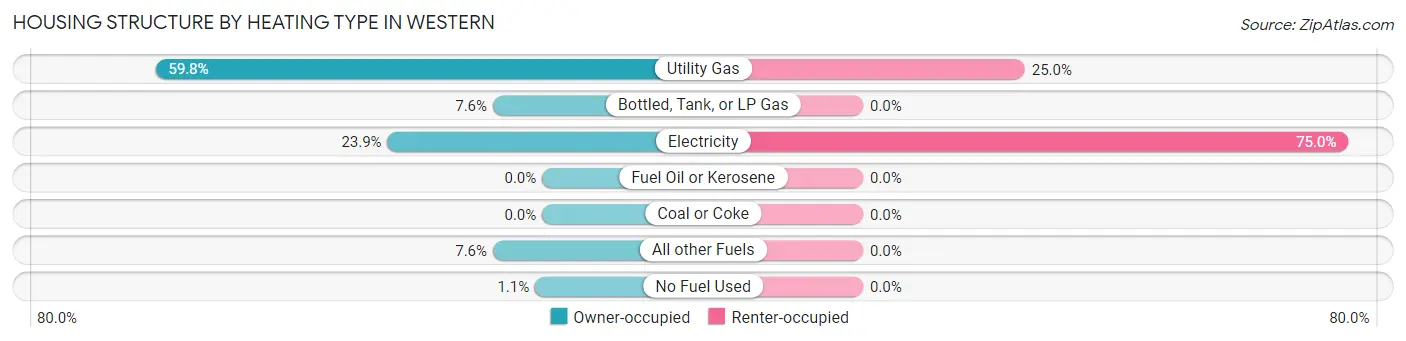
| Heating Type | Owner-occupied | Renter-occupied |
| Utility Gas | 55 (59.8%) | 3 (25.0%) |
| Bottled, Tank, or LP Gas | 7 (7.6%) | 0 (0.0%) |
| Electricity | 22 (23.9%) | 9 (75.0%) |
| Fuel Oil or Kerosene | 0 (0.0%) | 0 (0.0%) |
| Coal or Coke | 0 (0.0%) | 0 (0.0%) |
| All other Fuels | 7 (7.6%) | 0 (0.0%) |
| No Fuel Used | 1 (1.1%) | 0 (0.0%) |
| Total | 92 (100.0%) | 12 (100.0%) |
Household Vehicle Usage in Western
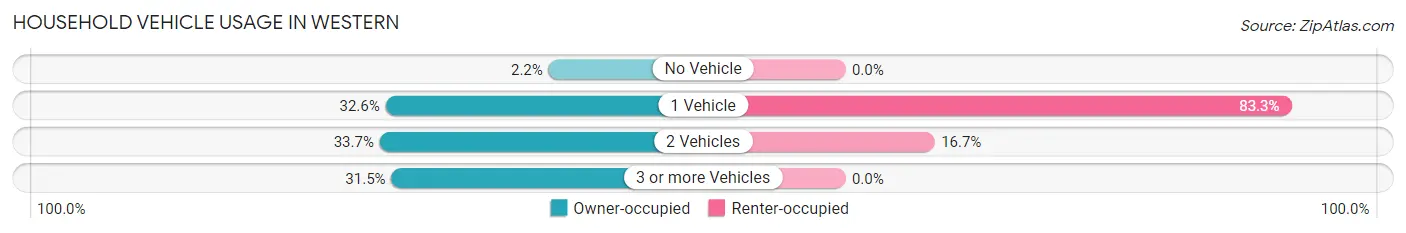
| Vehicles per Household | Owner-occupied | Renter-occupied |
| No Vehicle | 2 (2.2%) | 0 (0.0%) |
| 1 Vehicle | 30 (32.6%) | 10 (83.3%) |
| 2 Vehicles | 31 (33.7%) | 2 (16.7%) |
| 3 or more Vehicles | 29 (31.5%) | 0 (0.0%) |
| Total | 92 (100.0%) | 12 (100.0%) |
Real Estate & Mortgages in Western
Real Estate and Mortgage Overview in Western
| Characteristic | Without Mortgage | With Mortgage |
| Housing Units | 64 | 28 |
| Median Property Value | $43,300 | $0 |
| Median Household Income | $40,357 | $0 |
| Monthly Housing Costs | $378 | $0 |
| Real Estate Taxes | $575 | $0 |
Property Value by Mortgage Status in Western
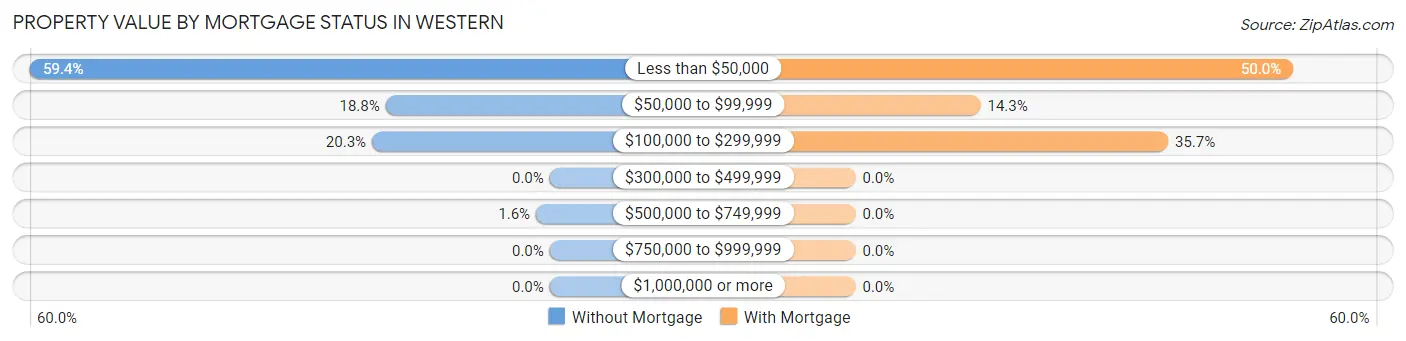
| Property Value | Without Mortgage | With Mortgage |
| Less than $50,000 | 38 (59.4%) | 14 (50.0%) |
| $50,000 to $99,999 | 12 (18.8%) | 4 (14.3%) |
| $100,000 to $299,999 | 13 (20.3%) | 10 (35.7%) |
| $300,000 to $499,999 | 0 (0.0%) | 0 (0.0%) |
| $500,000 to $749,999 | 1 (1.6%) | 0 (0.0%) |
| $750,000 to $999,999 | 0 (0.0%) | 0 (0.0%) |
| $1,000,000 or more | 0 (0.0%) | 0 (0.0%) |
| Total | 64 (100.0%) | 28 (100.0%) |
Household Income by Mortgage Status in Western
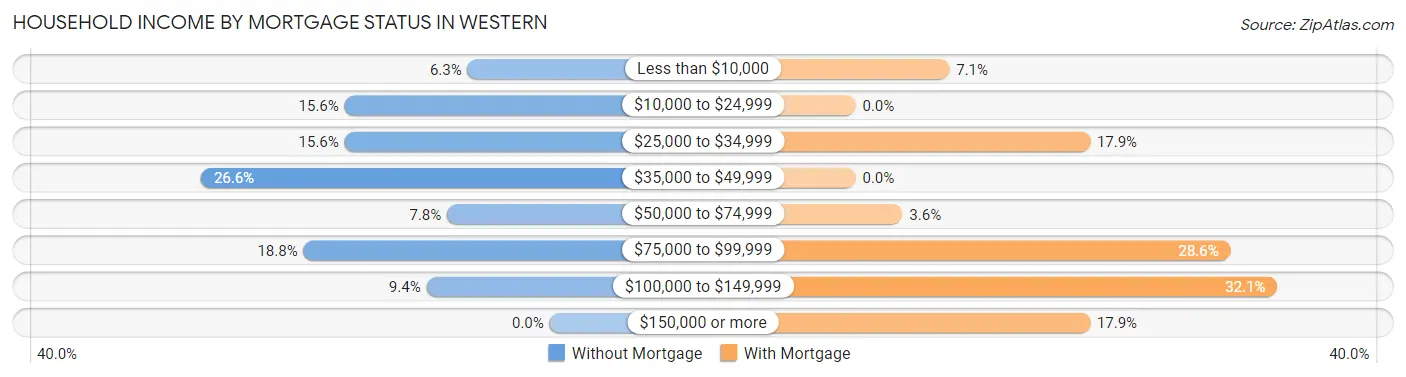
| Household Income | Without Mortgage | With Mortgage |
| Less than $10,000 | 4 (6.2%) | 2 (7.1%) |
| $10,000 to $24,999 | 10 (15.6%) | 0 (0.0%) |
| $25,000 to $34,999 | 10 (15.6%) | 5 (17.9%) |
| $35,000 to $49,999 | 17 (26.6%) | 0 (0.0%) |
| $50,000 to $74,999 | 5 (7.8%) | 1 (3.6%) |
| $75,000 to $99,999 | 12 (18.8%) | 8 (28.6%) |
| $100,000 to $149,999 | 6 (9.4%) | 9 (32.1%) |
| $150,000 or more | 0 (0.0%) | 5 (17.9%) |
| Total | 64 (100.0%) | 28 (100.0%) |
Property Value to Household Income Ratio in Western
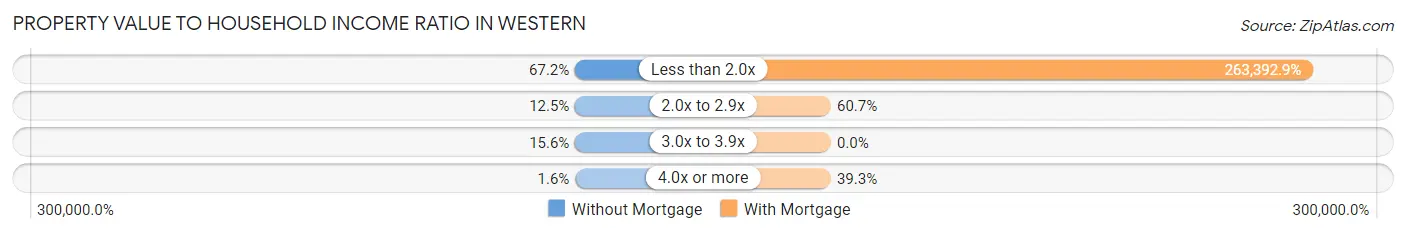
| Value-to-Income Ratio | Without Mortgage | With Mortgage |
| Less than 2.0x | 43 (67.2%) | 73,750 (263,392.9%) |
| 2.0x to 2.9x | 8 (12.5%) | 17 (60.7%) |
| 3.0x to 3.9x | 10 (15.6%) | 0 (0.0%) |
| 4.0x or more | 1 (1.6%) | 11 (39.3%) |
| Total | 64 (100.0%) | 28 (100.0%) |
Real Estate Taxes by Mortgage Status in Western
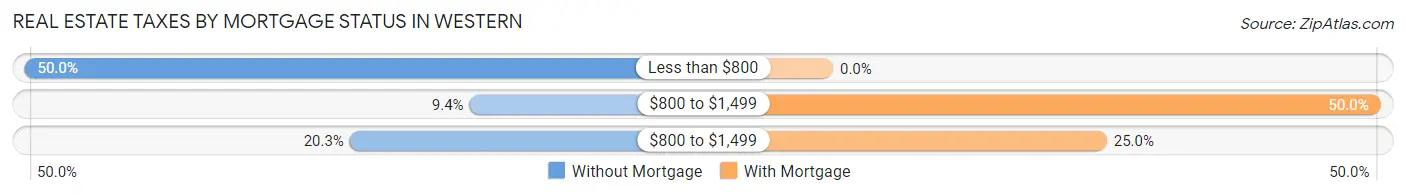
| Property Taxes | Without Mortgage | With Mortgage |
| Less than $800 | 32 (50.0%) | 0 (0.0%) |
| $800 to $1,499 | 6 (9.4%) | 14 (50.0%) |
| $800 to $1,499 | 13 (20.3%) | 7 (25.0%) |
| Total | 64 (100.0%) | 28 (100.0%) |
Health & Disability in Western
Health Insurance Coverage by Age in Western
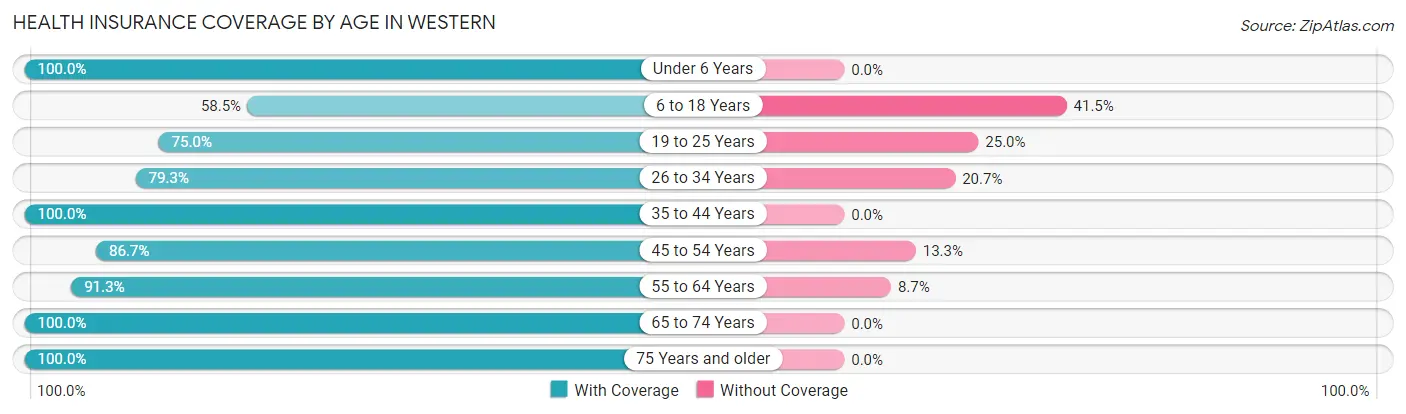
| Age Bracket | With Coverage | Without Coverage |
| Under 6 Years | 8 (100.0%) | 0 (0.0%) |
| 6 to 18 Years | 24 (58.5%) | 17 (41.5%) |
| 19 to 25 Years | 6 (75.0%) | 2 (25.0%) |
| 26 to 34 Years | 23 (79.3%) | 6 (20.7%) |
| 35 to 44 Years | 28 (100.0%) | 0 (0.0%) |
| 45 to 54 Years | 13 (86.7%) | 2 (13.3%) |
| 55 to 64 Years | 21 (91.3%) | 2 (8.7%) |
| 65 to 74 Years | 35 (100.0%) | 0 (0.0%) |
| 75 Years and older | 26 (100.0%) | 0 (0.0%) |
| Total | 184 (86.4%) | 29 (13.6%) |
Health Insurance Coverage by Citizenship Status in Western
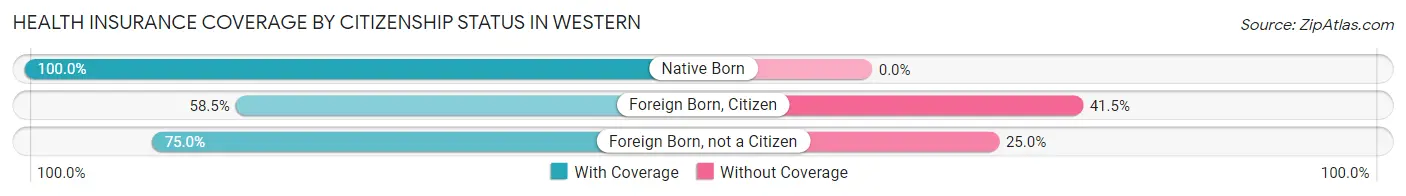
| Citizenship Status | With Coverage | Without Coverage |
| Native Born | 8 (100.0%) | 0 (0.0%) |
| Foreign Born, Citizen | 24 (58.5%) | 17 (41.5%) |
| Foreign Born, not a Citizen | 6 (75.0%) | 2 (25.0%) |
Health Insurance Coverage by Household Income in Western
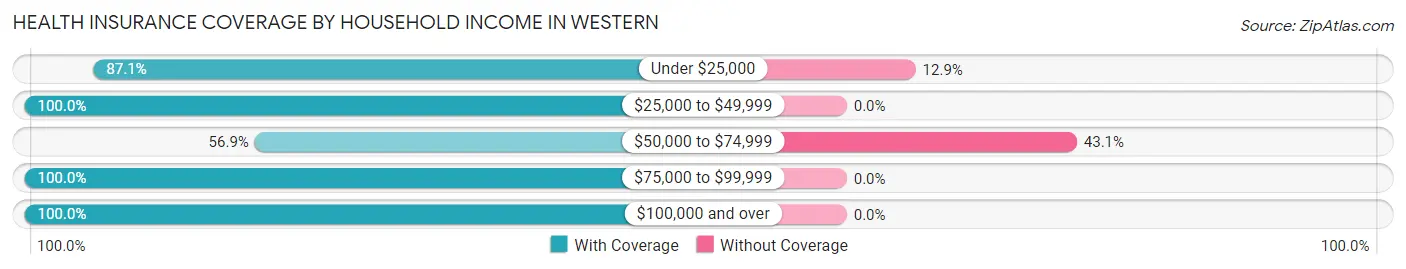
| Household Income | With Coverage | Without Coverage |
| Under $25,000 | 27 (87.1%) | 4 (12.9%) |
| $25,000 to $49,999 | 52 (100.0%) | 0 (0.0%) |
| $50,000 to $74,999 | 33 (56.9%) | 25 (43.1%) |
| $75,000 to $99,999 | 49 (100.0%) | 0 (0.0%) |
| $100,000 and over | 23 (100.0%) | 0 (0.0%) |
Public vs Private Health Insurance Coverage by Age in Western
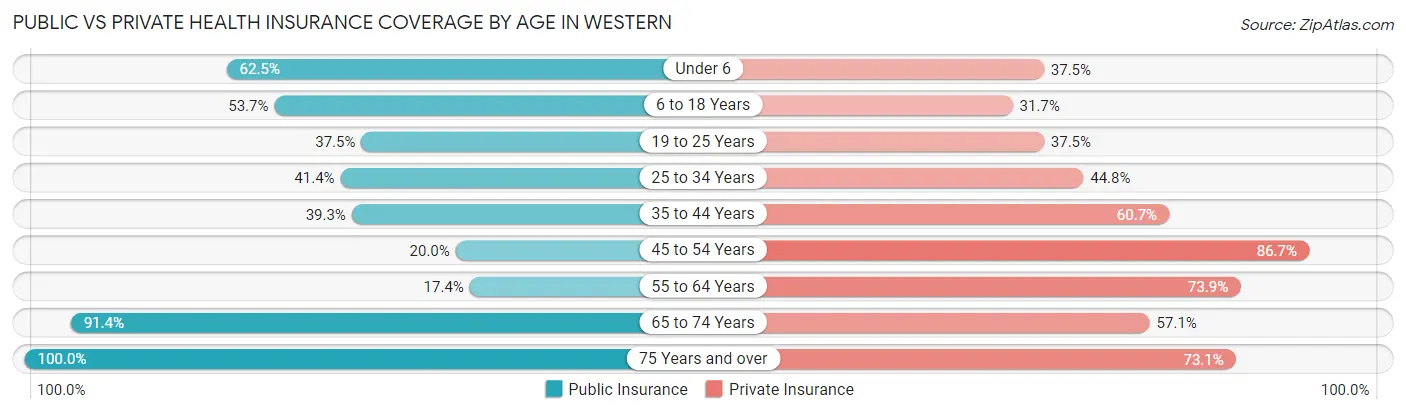
| Age Bracket | Public Insurance | Private Insurance |
| Under 6 | 5 (62.5%) | 3 (37.5%) |
| 6 to 18 Years | 22 (53.7%) | 13 (31.7%) |
| 19 to 25 Years | 3 (37.5%) | 3 (37.5%) |
| 25 to 34 Years | 12 (41.4%) | 13 (44.8%) |
| 35 to 44 Years | 11 (39.3%) | 17 (60.7%) |
| 45 to 54 Years | 3 (20.0%) | 13 (86.7%) |
| 55 to 64 Years | 4 (17.4%) | 17 (73.9%) |
| 65 to 74 Years | 32 (91.4%) | 20 (57.1%) |
| 75 Years and over | 26 (100.0%) | 19 (73.1%) |
| Total | 118 (55.4%) | 118 (55.4%) |
Disability Status by Sex by Age in Western
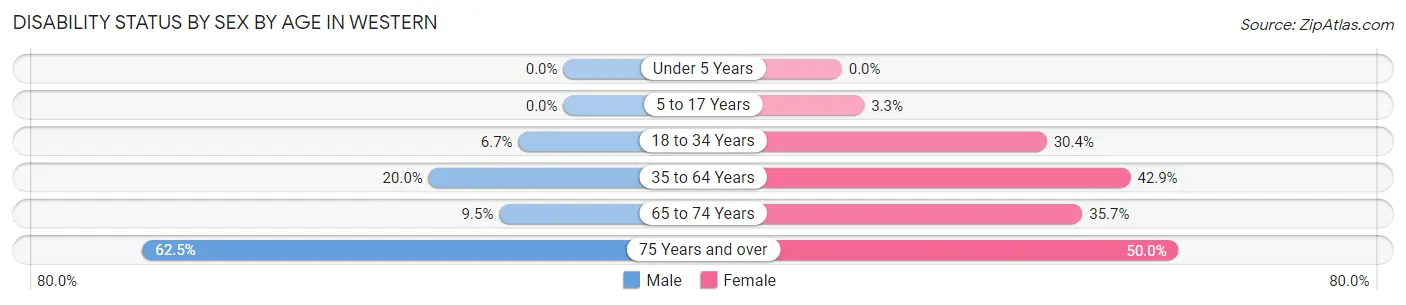
| Age Bracket | Male | Female |
| Under 5 Years | 0 (0.0%) | 0 (0.0%) |
| 5 to 17 Years | 0 (0.0%) | 1 (3.3%) |
| 18 to 34 Years | 1 (6.7%) | 7 (30.4%) |
| 35 to 64 Years | 9 (20.0%) | 9 (42.9%) |
| 65 to 74 Years | 2 (9.5%) | 5 (35.7%) |
| 75 Years and over | 5 (62.5%) | 9 (50.0%) |
Disability Class by Sex by Age in Western
Disability Class: Hearing Difficulty
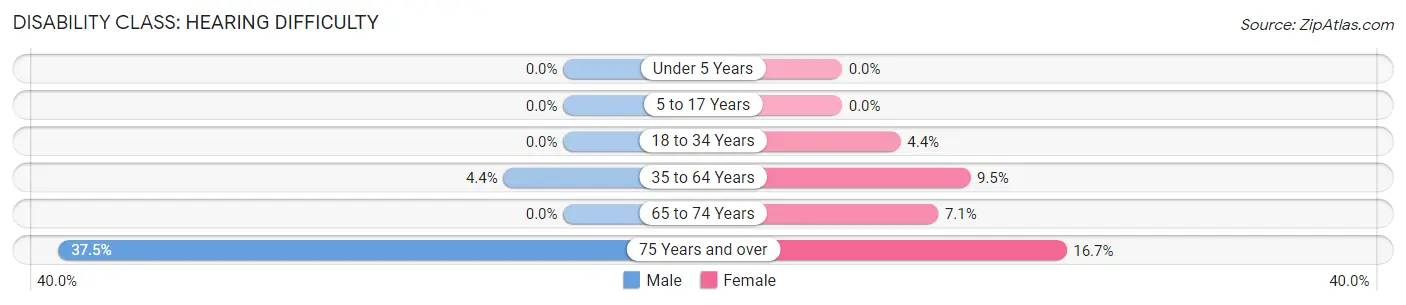
| Age Bracket | Male | Female |
| Under 5 Years | 0 (0.0%) | 0 (0.0%) |
| 5 to 17 Years | 0 (0.0%) | 0 (0.0%) |
| 18 to 34 Years | 0 (0.0%) | 1 (4.3%) |
| 35 to 64 Years | 2 (4.4%) | 2 (9.5%) |
| 65 to 74 Years | 0 (0.0%) | 1 (7.1%) |
| 75 Years and over | 3 (37.5%) | 3 (16.7%) |
Disability Class: Vision Difficulty
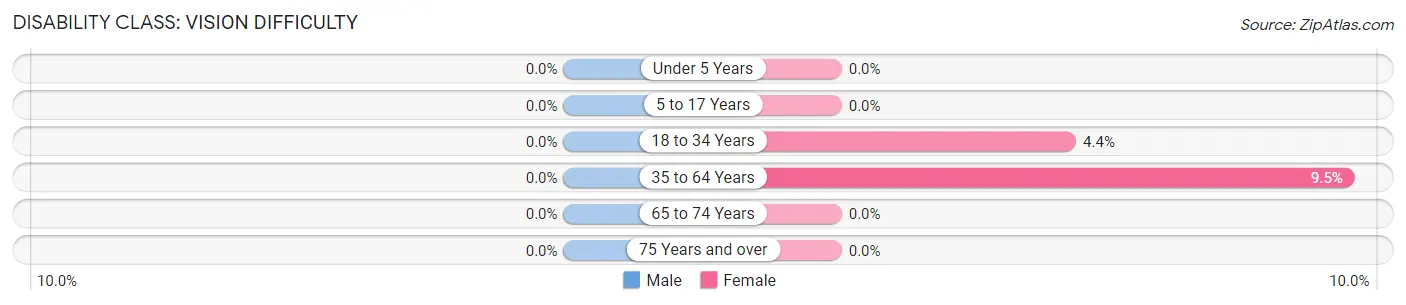
| Age Bracket | Male | Female |
| Under 5 Years | 0 (0.0%) | 0 (0.0%) |
| 5 to 17 Years | 0 (0.0%) | 0 (0.0%) |
| 18 to 34 Years | 0 (0.0%) | 1 (4.3%) |
| 35 to 64 Years | 0 (0.0%) | 2 (9.5%) |
| 65 to 74 Years | 0 (0.0%) | 0 (0.0%) |
| 75 Years and over | 0 (0.0%) | 0 (0.0%) |
Disability Class: Cognitive Difficulty
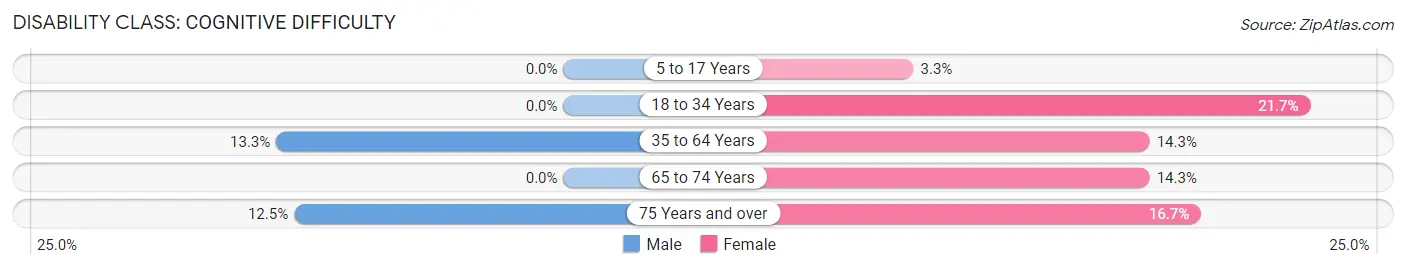
| Age Bracket | Male | Female |
| 5 to 17 Years | 0 (0.0%) | 1 (3.3%) |
| 18 to 34 Years | 0 (0.0%) | 5 (21.7%) |
| 35 to 64 Years | 6 (13.3%) | 3 (14.3%) |
| 65 to 74 Years | 0 (0.0%) | 2 (14.3%) |
| 75 Years and over | 1 (12.5%) | 3 (16.7%) |
Disability Class: Ambulatory Difficulty
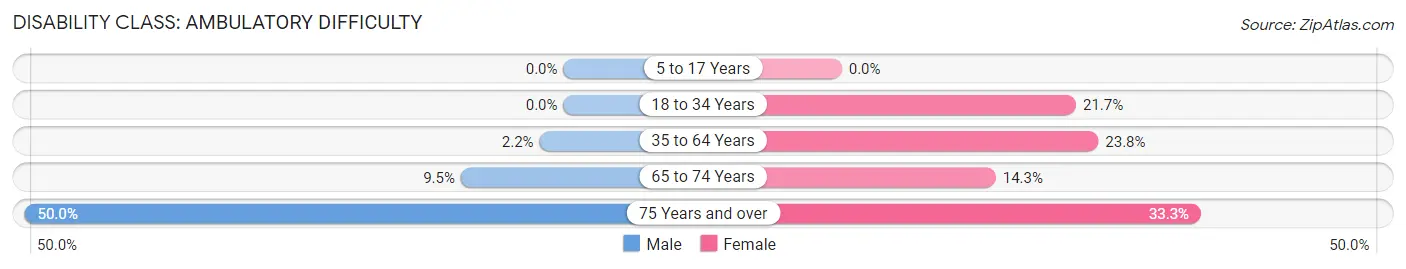
| Age Bracket | Male | Female |
| 5 to 17 Years | 0 (0.0%) | 0 (0.0%) |
| 18 to 34 Years | 0 (0.0%) | 5 (21.7%) |
| 35 to 64 Years | 1 (2.2%) | 5 (23.8%) |
| 65 to 74 Years | 2 (9.5%) | 2 (14.3%) |
| 75 Years and over | 4 (50.0%) | 6 (33.3%) |
Disability Class: Self-Care Difficulty
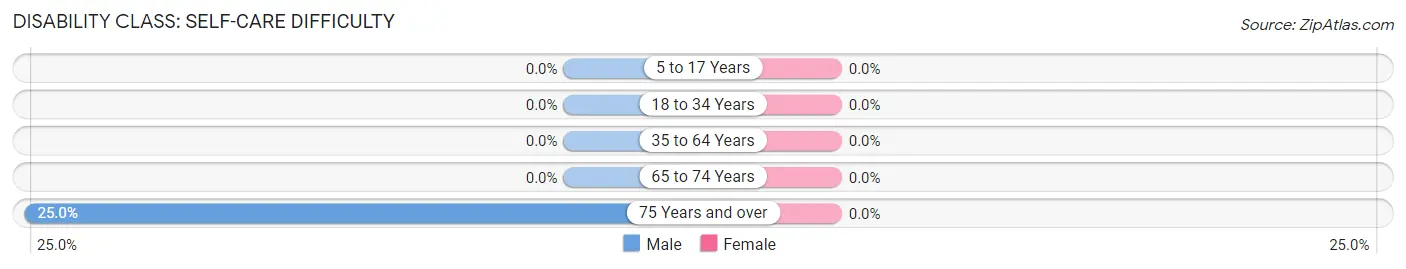
| Age Bracket | Male | Female |
| 5 to 17 Years | 0 (0.0%) | 0 (0.0%) |
| 18 to 34 Years | 0 (0.0%) | 0 (0.0%) |
| 35 to 64 Years | 0 (0.0%) | 0 (0.0%) |
| 65 to 74 Years | 0 (0.0%) | 0 (0.0%) |
| 75 Years and over | 2 (25.0%) | 0 (0.0%) |
Technology Access in Western
Computing Device Access in Western
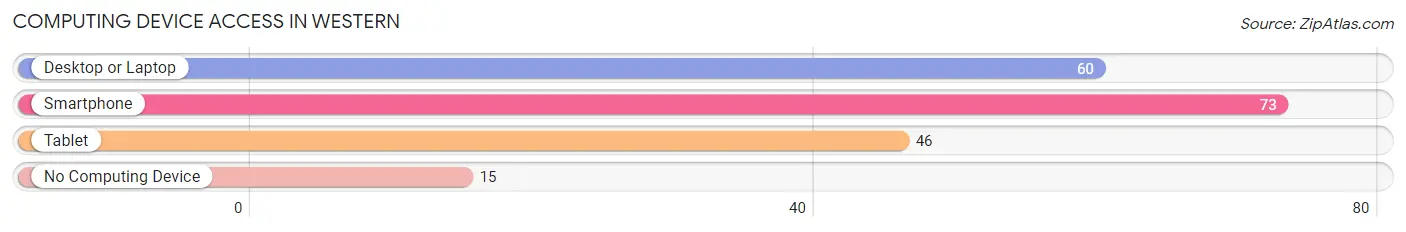
| Device Type | # Households | % Households |
| Desktop or Laptop | 60 | 57.7% |
| Smartphone | 73 | 70.2% |
| Tablet | 46 | 44.2% |
| No Computing Device | 15 | 14.4% |
| Total | 104 | 100.0% |
Internet Access in Western
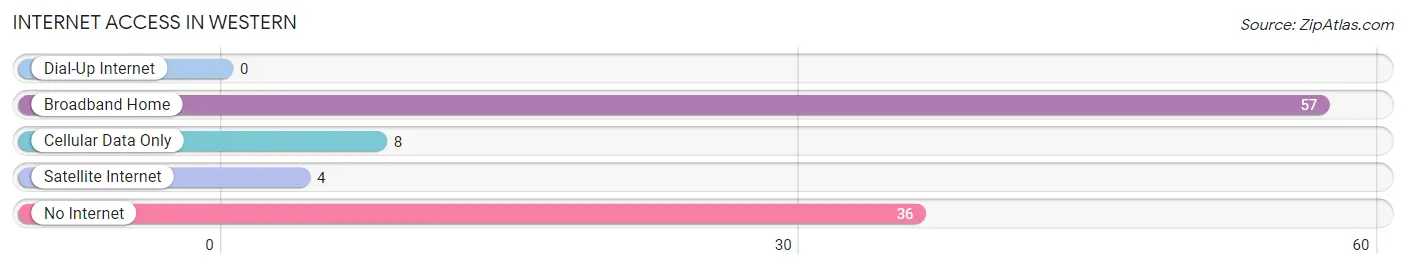
| Internet Type | # Households | % Households |
| Dial-Up Internet | 0 | 0.0% |
| Broadband Home | 57 | 54.8% |
| Cellular Data Only | 8 | 7.7% |
| Satellite Internet | 4 | 3.8% |
| No Internet | 36 | 34.6% |
| Total | 104 | 100.0% |
Western Summary
Western Nebraska is a region of the state of Nebraska located in the western part of the state. It is bordered by the states of Wyoming, South Dakota, and Colorado. The region is home to a variety of landscapes, from the rolling hills of the Sandhills to the rugged Badlands of the Panhandle. The region is also home to a variety of cultures, from the Native American tribes of the Great Plains to the diverse immigrant populations of the cities.
History
The history of Western Nebraska is closely tied to the history of the Great Plains. The region was first inhabited by Native American tribes, including the Sioux, Cheyenne, Arapaho, and Pawnee. These tribes were nomadic, following the buffalo herds across the plains. The first Europeans to explore the region were French fur traders, who established trading posts in the area in the late 1700s.
In the mid-1800s, the United States government began to encourage settlement of the Great Plains. The Homestead Act of 1862 offered free land to settlers, and many people moved to the region. The Union Pacific Railroad was built across the region in the late 1800s, connecting the area to the rest of the country.
The region experienced a period of economic growth in the early 1900s, as the population increased and new industries developed. The Great Depression of the 1930s hit the region hard, however, and many people left the area in search of work. The region experienced a resurgence in the 1950s and 1960s, as new industries and businesses developed.
Geography
Western Nebraska is located in the western part of the state, bordered by Wyoming, South Dakota, and Colorado. The region is divided into two distinct areas: the Sandhills and the Panhandle. The Sandhills are a region of rolling hills and grasslands, while the Panhandle is a region of rugged badlands and canyons.
The region is home to a variety of landscapes, from the rolling hills of the Sandhills to the rugged Badlands of the Panhandle. The region is also home to a variety of wildlife, including bison, elk, antelope, and prairie dogs.
Economy
The economy of Western Nebraska is largely based on agriculture and tourism. The region is home to a variety of crops, including corn, wheat, and soybeans. The region is also home to a variety of livestock, including cattle, sheep, and hogs.
Tourism is an important part of the economy of Western Nebraska. The region is home to a variety of attractions, including national parks, historic sites, and outdoor recreation areas. The region is also home to a variety of cultural attractions, including museums, art galleries, and theaters.
Demographics
The population of Western Nebraska is largely rural, with most of the population living in small towns and rural areas. The region is home to a variety of ethnic and racial groups, including Native Americans, Hispanics, and African Americans. The region is also home to a variety of immigrant populations, including those from Mexico, Vietnam, and Laos.
The region is home to a variety of religions, including Christianity, Judaism, and Islam. The region is also home to a variety of languages, including English, Spanish, and Vietnamese.
Conclusion
Western Nebraska is a region of the state of Nebraska located in the western part of the state. It is bordered by the states of Wyoming, South Dakota, and Colorado. The region is home to a variety of landscapes, from the rolling hills of the Sandhills to the rugged Badlands of the Panhandle. The region is also home to a variety of cultures, from the Native American tribes of the Great Plains to the diverse immigrant populations of the cities. The economy of Western Nebraska is largely based on agriculture and tourism, and the region is home to a variety of ethnic and racial groups. Western Nebraska is a unique and diverse region of the state, and it is an important part of the history and culture of Nebraska.
Common Questions
What is Per Capita Income in Western?
Per Capita income in Western is $25,053.
What is the Median Family Income in Western?
Median Family Income in Western is $66,250.
What is the Median Household income in Western?
Median Household Income in Western is $42,188.
What is Income or Wage Gap in Western?
Income or Wage Gap in Western is 41.2%.
Women in Western earn 58.8 cents for every dollar earned by a man.
What is Inequality or Gini Index in Western?
Inequality or Gini Index in Western is 0.37.
What is the Total Population of Western?
Total Population of Western is 213.
What is the Total Male Population of Western?
Total Male Population of Western is 105.
What is the Total Female Population of Western?
Total Female Population of Western is 108.
What is the Ratio of Males per 100 Females in Western?
There are 97.22 Males per 100 Females in Western.
What is the Ratio of Females per 100 Males in Western?
There are 102.86 Females per 100 Males in Western.
What is the Median Population Age in Western?
Median Population Age in Western is 41.5 Years.
What is the Average Family Size in Western
Average Family Size in Western is 2.9 People.
What is the Average Household Size in Western
Average Household Size in Western is 2.0 People.
How Large is the Labor Force in Western?
There are 96 People in the Labor Forcein in Western.
What is the Percentage of People in the Labor Force in Western?
57.5% of People are in the Labor Force in Western.
What is the Unemployment Rate in Western?
Unemployment Rate in Western is 7.3%.