Minden, NE Map & Demographics
Minden Map
Minden Overview
$33,225
PER CAPITA INCOME
$72,333
AVG FAMILY INCOME
$65,345
AVG HOUSEHOLD INCOME
31.5%
WAGE / INCOME GAP [ % ]
68.5¢/ $1
WAGE / INCOME GAP [ $ ]
0.42
INEQUALITY / GINI INDEX
3,099
TOTAL POPULATION
1,408
MALE POPULATION
1,691
FEMALE POPULATION
83.26
MALES / 100 FEMALES
120.10
FEMALES / 100 MALES
37.0
MEDIAN AGE
3.0
AVG FAMILY SIZE
2.5
AVG HOUSEHOLD SIZE
1,544
LABOR FORCE [ PEOPLE ]
65.4%
PERCENT IN LABOR FORCE
Minden Zip Codes
Minden Area Codes
Income in Minden
Income Overview in Minden
Per Capita Income in Minden is $33,225, while median incomes of families and households are $72,333 and $65,345 respectively.
| Characteristic | Number | Measure |
| Per Capita Income | 3,099 | $33,225 |
| Median Family Income | 824 | $72,333 |
| Mean Family Income | 824 | $89,343 |
| Median Household Income | 1,224 | $65,345 |
| Mean Household Income | 1,224 | $84,604 |
| Income Deficit | 824 | $0 |
| Wage / Income Gap (%) | 3,099 | 31.49% |
| Wage / Income Gap ($) | 3,099 | 68.51¢ per $1 |
| Gini / Inequality Index | 3,099 | 0.42 |
Earnings by Sex in Minden
Average Earnings in Minden are $33,906, $42,406 for men and $29,052 for women, a difference of 31.5%.
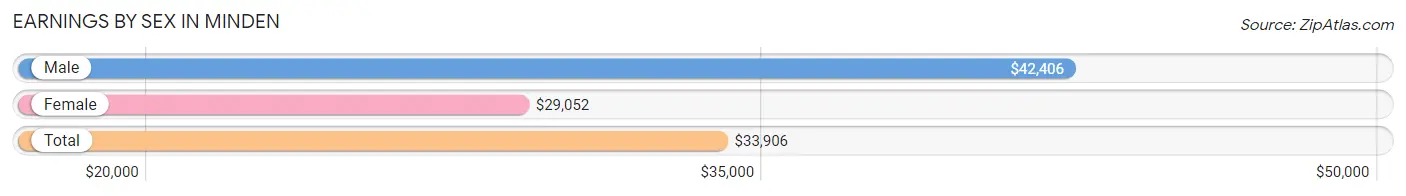
| Sex | Number | Average Earnings |
| Male | 786 (46.2%) | $42,406 |
| Female | 916 (53.8%) | $29,052 |
| Total | 1,702 (100.0%) | $33,906 |
Earnings by Sex by Income Bracket in Minden
The most common earnings brackets in Minden are $75,000 to $99,999 for men (104 | 13.2%) and $30,000 to $34,999 for women (130 | 14.2%).
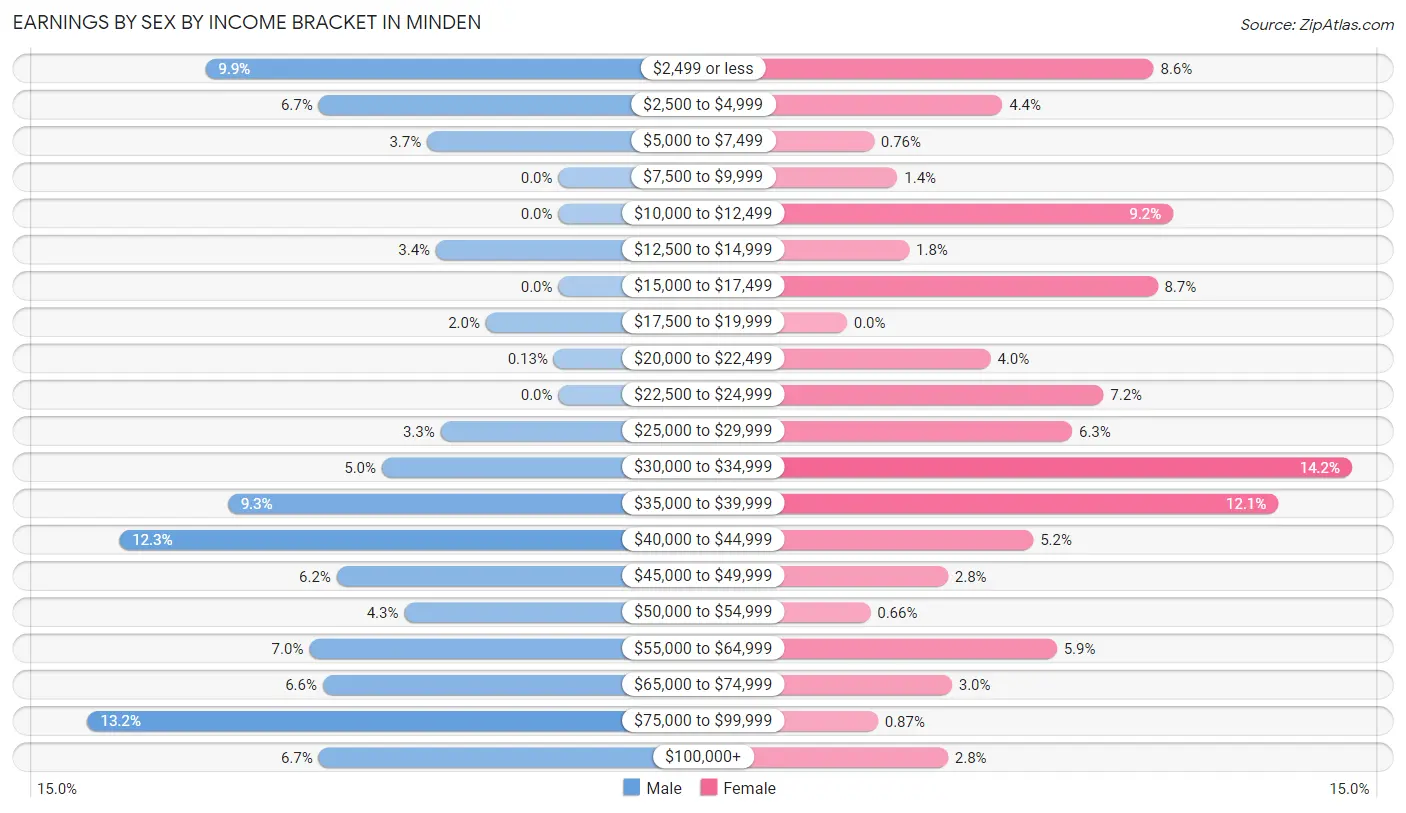
| Income | Male | Female |
| $2,499 or less | 78 (9.9%) | 79 (8.6%) |
| $2,500 to $4,999 | 53 (6.7%) | 40 (4.4%) |
| $5,000 to $7,499 | 29 (3.7%) | 7 (0.8%) |
| $7,500 to $9,999 | 0 (0.0%) | 13 (1.4%) |
| $10,000 to $12,499 | 0 (0.0%) | 84 (9.2%) |
| $12,500 to $14,999 | 27 (3.4%) | 16 (1.8%) |
| $15,000 to $17,499 | 0 (0.0%) | 80 (8.7%) |
| $17,500 to $19,999 | 16 (2.0%) | 0 (0.0%) |
| $20,000 to $22,499 | 1 (0.1%) | 37 (4.0%) |
| $22,500 to $24,999 | 0 (0.0%) | 66 (7.2%) |
| $25,000 to $29,999 | 26 (3.3%) | 58 (6.3%) |
| $30,000 to $34,999 | 39 (5.0%) | 130 (14.2%) |
| $35,000 to $39,999 | 73 (9.3%) | 111 (12.1%) |
| $40,000 to $44,999 | 97 (12.3%) | 48 (5.2%) |
| $45,000 to $49,999 | 49 (6.2%) | 26 (2.8%) |
| $50,000 to $54,999 | 34 (4.3%) | 6 (0.7%) |
| $55,000 to $64,999 | 55 (7.0%) | 54 (5.9%) |
| $65,000 to $74,999 | 52 (6.6%) | 27 (2.9%) |
| $75,000 to $99,999 | 104 (13.2%) | 8 (0.9%) |
| $100,000+ | 53 (6.7%) | 26 (2.8%) |
| Total | 786 (100.0%) | 916 (100.0%) |
Earnings by Sex by Educational Attainment in Minden
Average earnings in Minden are $48,814 for men and $30,633 for women, a difference of 37.2%. Men with an educational attainment of college or associate's degree enjoy the highest average annual earnings of $62,857, while those with bachelor's degree education earn the least with $37,782. Women with an educational attainment of bachelor's degree earn the most with the average annual earnings of $37,167, while those with less than high school education have the smallest earnings of $2,499.
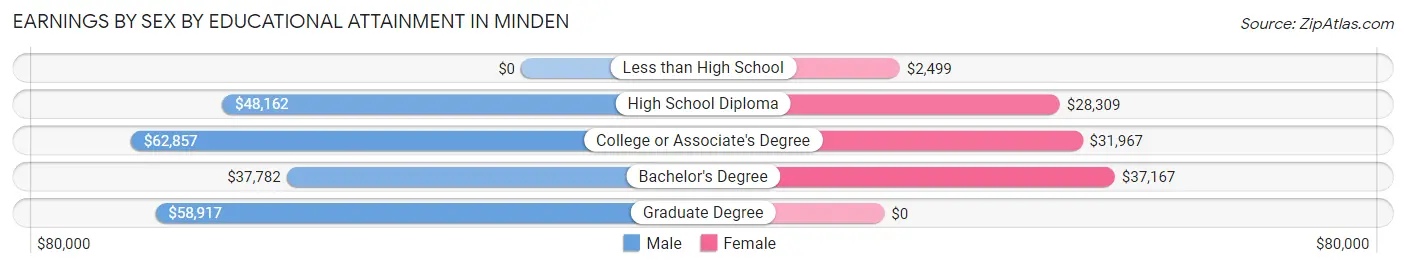
| Educational Attainment | Male Income | Female Income |
| Less than High School | - | - |
| High School Diploma | $48,162 | $28,309 |
| College or Associate's Degree | $62,857 | $31,967 |
| Bachelor's Degree | $37,782 | $37,167 |
| Graduate Degree | $58,917 | $0 |
| Total | $48,814 | $30,633 |
Family Income in Minden
Family Income Brackets in Minden
According to the Minden family income data, there are 191 families falling into the $100,000 to $149,999 income range, which is the most common income bracket and makes up 23.2% of all families.
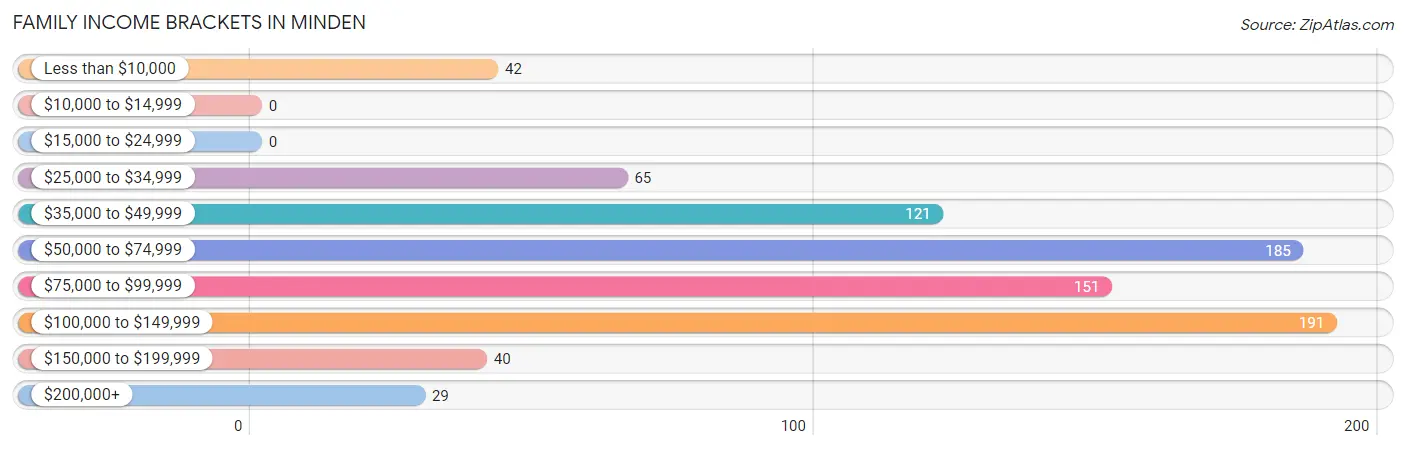
| Income Bracket | # Families | % Families |
| Less than $10,000 | 42 | 5.1% |
| $10,000 to $14,999 | 0 | 0.0% |
| $15,000 to $24,999 | 0 | 0.0% |
| $25,000 to $34,999 | 65 | 7.9% |
| $35,000 to $49,999 | 121 | 14.7% |
| $50,000 to $74,999 | 185 | 22.5% |
| $75,000 to $99,999 | 151 | 18.3% |
| $100,000 to $149,999 | 191 | 23.2% |
| $150,000 to $199,999 | 40 | 4.9% |
| $200,000+ | 29 | 3.5% |
Family Income by Famaliy Size in Minden
5-person families (54 | 6.6%) account for the highest median family income in Minden with $89,643 per family, while 2-person families (403 | 48.9%) have the highest median income of $43,125 per family member.
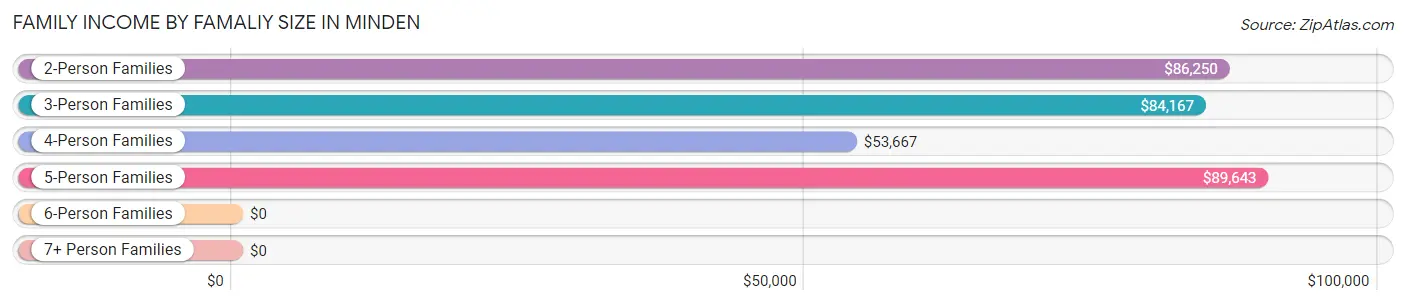
| Income Bracket | # Families | Median Income |
| 2-Person Families | 403 (48.9%) | $86,250 |
| 3-Person Families | 116 (14.1%) | $84,167 |
| 4-Person Families | 146 (17.7%) | $53,667 |
| 5-Person Families | 54 (6.6%) | $89,643 |
| 6-Person Families | 98 (11.9%) | $0 |
| 7+ Person Families | 7 (0.9%) | $0 |
| Total | 824 (100.0%) | $72,333 |
Family Income by Number of Earners in Minden
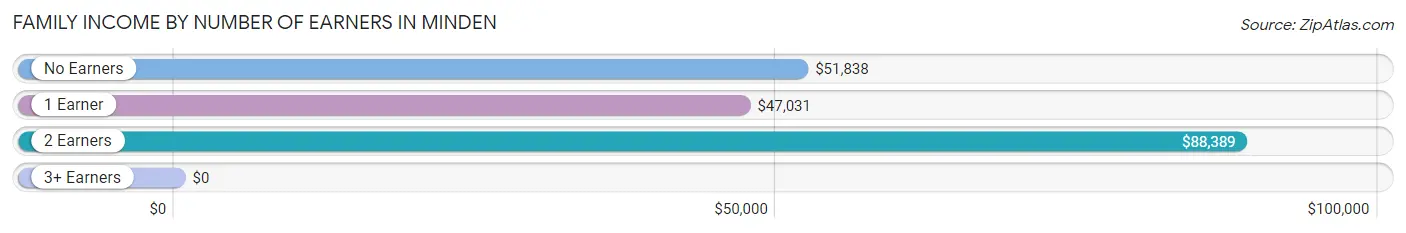
| Number of Earners | # Families | Median Income |
| No Earners | 63 (7.6%) | $51,838 |
| 1 Earner | 233 (28.3%) | $47,031 |
| 2 Earners | 490 (59.5%) | $88,389 |
| 3+ Earners | 38 (4.6%) | $0 |
| Total | 824 (100.0%) | $72,333 |
Household Income in Minden
Household Income Brackets in Minden
With 315 households falling in the category, the $50,000 to $74,999 income range is the most frequent in Minden, accounting for 25.7% of all households. In contrast, only 9 households (0.7%) fall into the $10,000 to $14,999 income bracket, making it the least populous group.
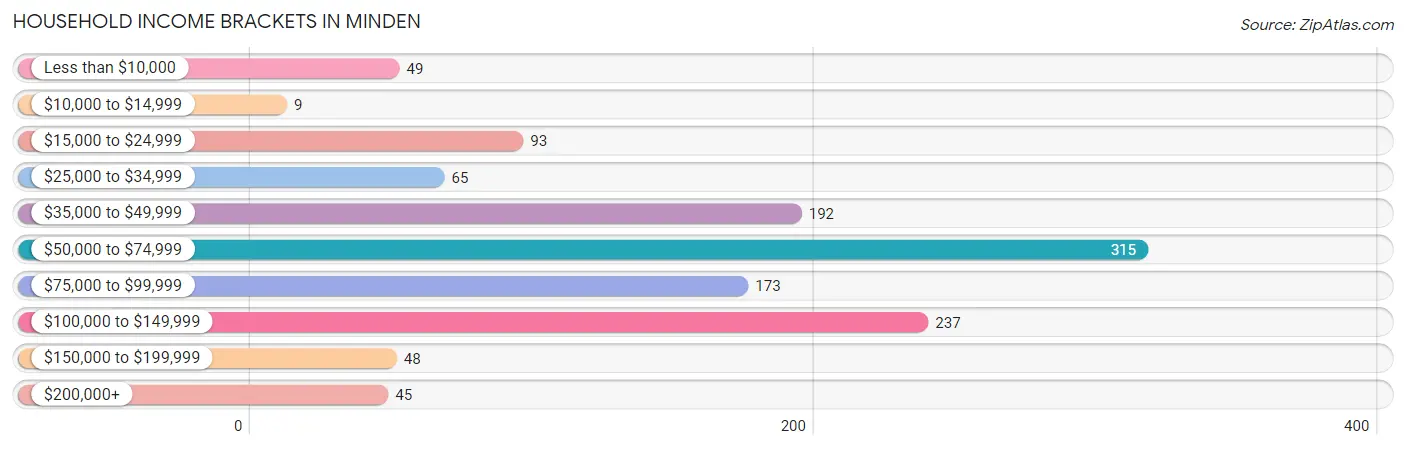
| Income Bracket | # Households | % Households |
| Less than $10,000 | 49 | 4.0% |
| $10,000 to $14,999 | 9 | 0.7% |
| $15,000 to $24,999 | 93 | 7.6% |
| $25,000 to $34,999 | 65 | 5.3% |
| $35,000 to $49,999 | 192 | 15.7% |
| $50,000 to $74,999 | 315 | 25.7% |
| $75,000 to $99,999 | 173 | 14.1% |
| $100,000 to $149,999 | 237 | 19.4% |
| $150,000 to $199,999 | 48 | 3.9% |
| $200,000+ | 45 | 3.7% |
Household Income by Householder Age in Minden
The median household income in Minden is $65,345, with the highest median household income of $87,065 found in the 45 to 64 years age bracket for the primary householder. A total of 390 households (31.9%) fall into this category. Meanwhile, the 65+ years age bracket for the primary householder has the lowest median household income of $51,771, with 445 households (36.4%) in this group.
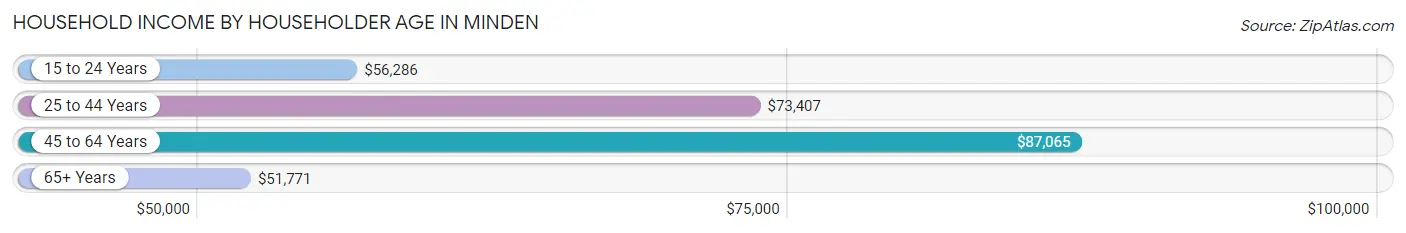
| Income Bracket | # Households | Median Income |
| 15 to 24 Years | 72 (5.9%) | $56,286 |
| 25 to 44 Years | 317 (25.9%) | $73,407 |
| 45 to 64 Years | 390 (31.9%) | $87,065 |
| 65+ Years | 445 (36.4%) | $51,771 |
| Total | 1,224 (100.0%) | $65,345 |
Poverty in Minden
Income Below Poverty by Sex and Age in Minden
With 12.0% poverty level for males and 10.5% for females among the residents of Minden, 16 and 17 year old males and 12 to 14 year old females are the most vulnerable to poverty, with 26 males (74.3%) and 25 females (35.7%) in their respective age groups living below the poverty level.
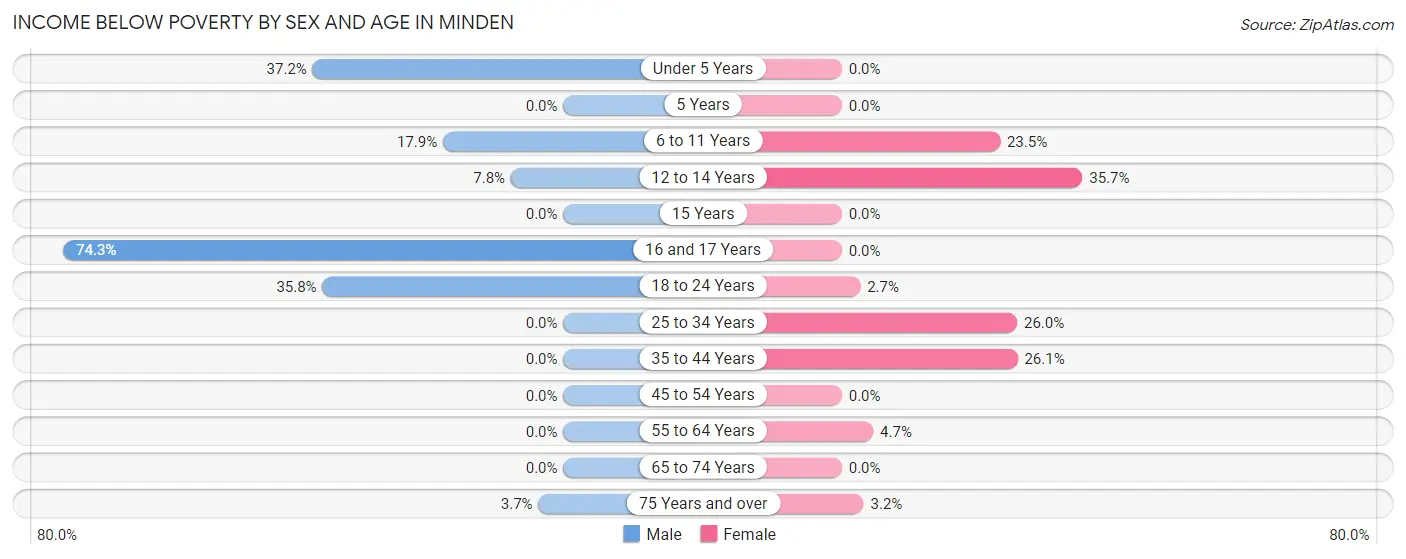
| Age Bracket | Male | Female |
| Under 5 Years | 51 (37.2%) | 0 (0.0%) |
| 5 Years | 0 (0.0%) | 0 (0.0%) |
| 6 to 11 Years | 25 (17.9%) | 35 (23.5%) |
| 12 to 14 Years | 6 (7.8%) | 25 (35.7%) |
| 15 Years | 0 (0.0%) | 0 (0.0%) |
| 16 and 17 Years | 26 (74.3%) | 0 (0.0%) |
| 18 to 24 Years | 49 (35.8%) | 4 (2.7%) |
| 25 to 34 Years | 0 (0.0%) | 51 (26.0%) |
| 35 to 44 Years | 0 (0.0%) | 42 (26.1%) |
| 45 to 54 Years | 0 (0.0%) | 0 (0.0%) |
| 55 to 64 Years | 0 (0.0%) | 9 (4.7%) |
| 65 to 74 Years | 0 (0.0%) | 0 (0.0%) |
| 75 Years and over | 7 (3.7%) | 7 (3.2%) |
| Total | 164 (12.0%) | 173 (10.5%) |
Income Above Poverty by Sex and Age in Minden
According to the poverty statistics in Minden, males aged 5 years and females aged under 5 years are the age groups that are most secure financially, with 100.0% of males and 100.0% of females in these age groups living above the poverty line.
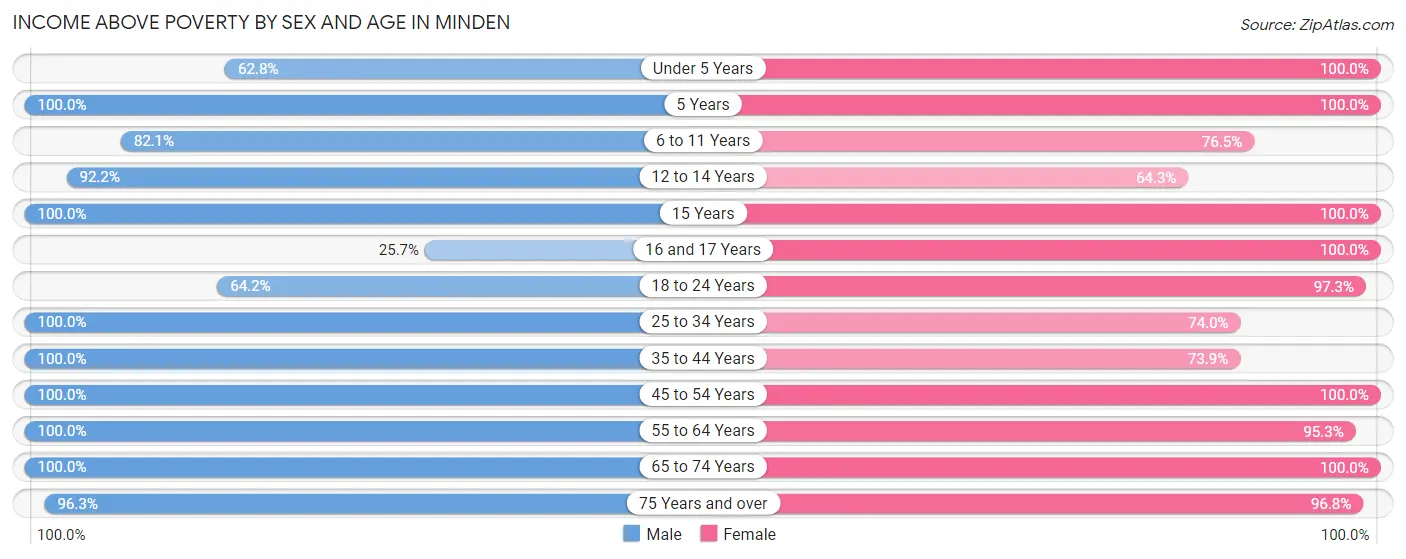
| Age Bracket | Male | Female |
| Under 5 Years | 86 (62.8%) | 50 (100.0%) |
| 5 Years | 8 (100.0%) | 21 (100.0%) |
| 6 to 11 Years | 115 (82.1%) | 114 (76.5%) |
| 12 to 14 Years | 71 (92.2%) | 45 (64.3%) |
| 15 Years | 17 (100.0%) | 47 (100.0%) |
| 16 and 17 Years | 9 (25.7%) | 74 (100.0%) |
| 18 to 24 Years | 88 (64.2%) | 142 (97.3%) |
| 25 to 34 Years | 154 (100.0%) | 145 (74.0%) |
| 35 to 44 Years | 132 (100.0%) | 119 (73.9%) |
| 45 to 54 Years | 95 (100.0%) | 157 (100.0%) |
| 55 to 64 Years | 143 (100.0%) | 184 (95.3%) |
| 65 to 74 Years | 102 (100.0%) | 166 (100.0%) |
| 75 Years and over | 182 (96.3%) | 209 (96.8%) |
| Total | 1,202 (88.0%) | 1,473 (89.5%) |
Income Below Poverty Among Married-Couple Families in Minden
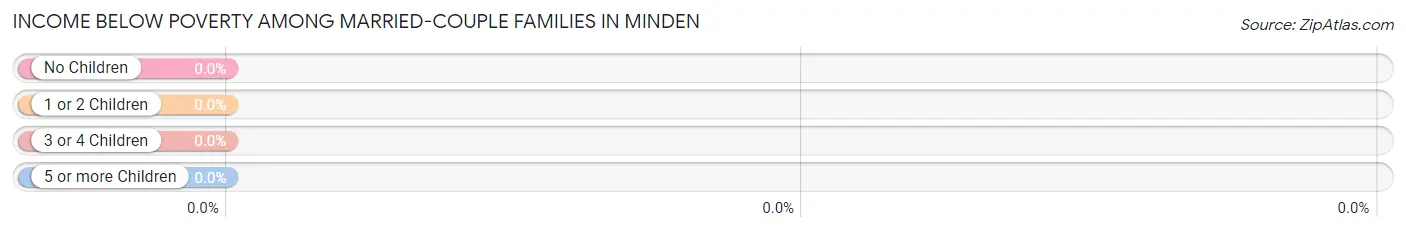
| Children | Above Poverty | Below Poverty |
| No Children | 385 (100.0%) | 0 (0.0%) |
| 1 or 2 Children | 131 (100.0%) | 0 (0.0%) |
| 3 or 4 Children | 92 (100.0%) | 0 (0.0%) |
| 5 or more Children | 7 (100.0%) | 0 (0.0%) |
| Total | 615 (100.0%) | 0 (0.0%) |
Income Below Poverty Among Single-Parent Households in Minden
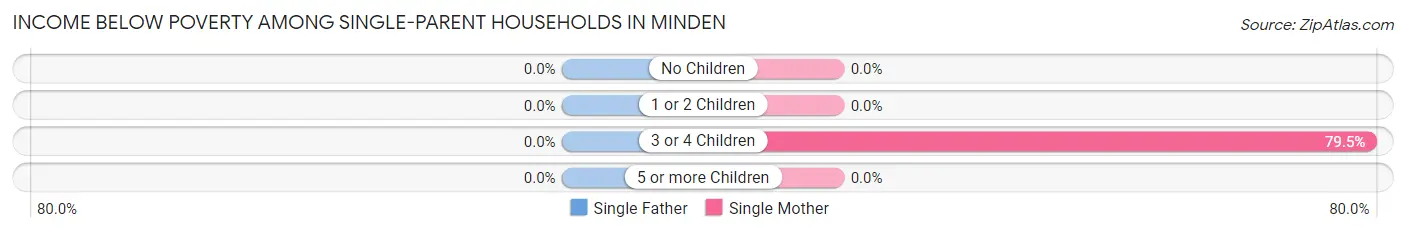
| Children | Single Father | Single Mother |
| No Children | 0 (0.0%) | 0 (0.0%) |
| 1 or 2 Children | 0 (0.0%) | 0 (0.0%) |
| 3 or 4 Children | 0 (0.0%) | 93 (79.5%) |
| 5 or more Children | 0 (0.0%) | 0 (0.0%) |
| Total | 0 (0.0%) | 93 (50.5%) |
Income Below Poverty Among Married-Couple vs Single-Parent Households in Minden
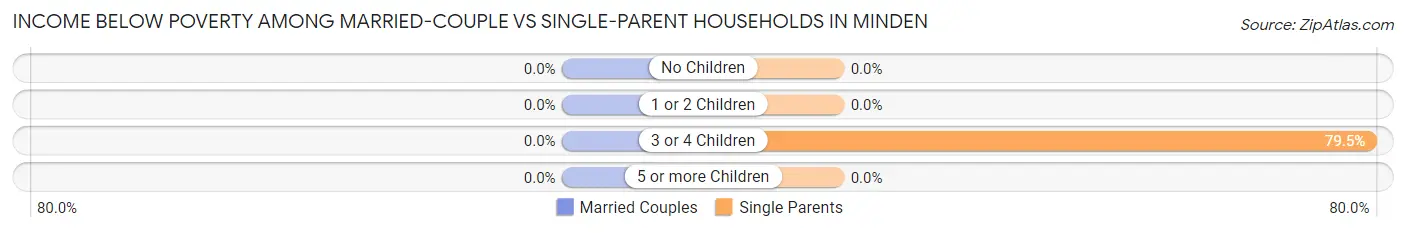
| Children | Married-Couple Families | Single-Parent Households |
| No Children | 0 (0.0%) | 0 (0.0%) |
| 1 or 2 Children | 0 (0.0%) | 0 (0.0%) |
| 3 or 4 Children | 0 (0.0%) | 93 (79.5%) |
| 5 or more Children | 0 (0.0%) | 0 (0.0%) |
| Total | 0 (0.0%) | 93 (44.5%) |
Race in Minden
The most populous races in Minden are White / Caucasian (2,879 | 92.9%), Hispanic or Latino (483 | 15.6%), and Two or more Races (198 | 6.4%).
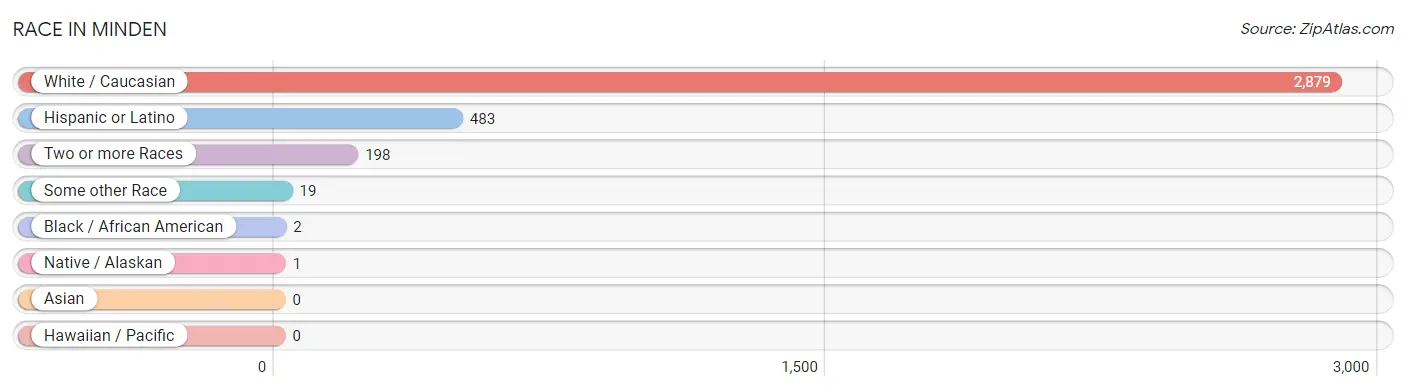
| Race | # Population | % Population |
| Asian | 0 | 0.0% |
| Black / African American | 2 | 0.1% |
| Hawaiian / Pacific | 0 | 0.0% |
| Hispanic or Latino | 483 | 15.6% |
| Native / Alaskan | 1 | 0.0% |
| White / Caucasian | 2,879 | 92.9% |
| Two or more Races | 198 | 6.4% |
| Some other Race | 19 | 0.6% |
| Total | 3,099 | 100.0% |
Ancestry in Minden
The most populous ancestries reported in Minden are German (1,135 | 36.6%), Mexican (462 | 14.9%), Swedish (354 | 11.4%), Irish (276 | 8.9%), and Danish (177 | 5.7%), together accounting for 77.6% of all Minden residents.
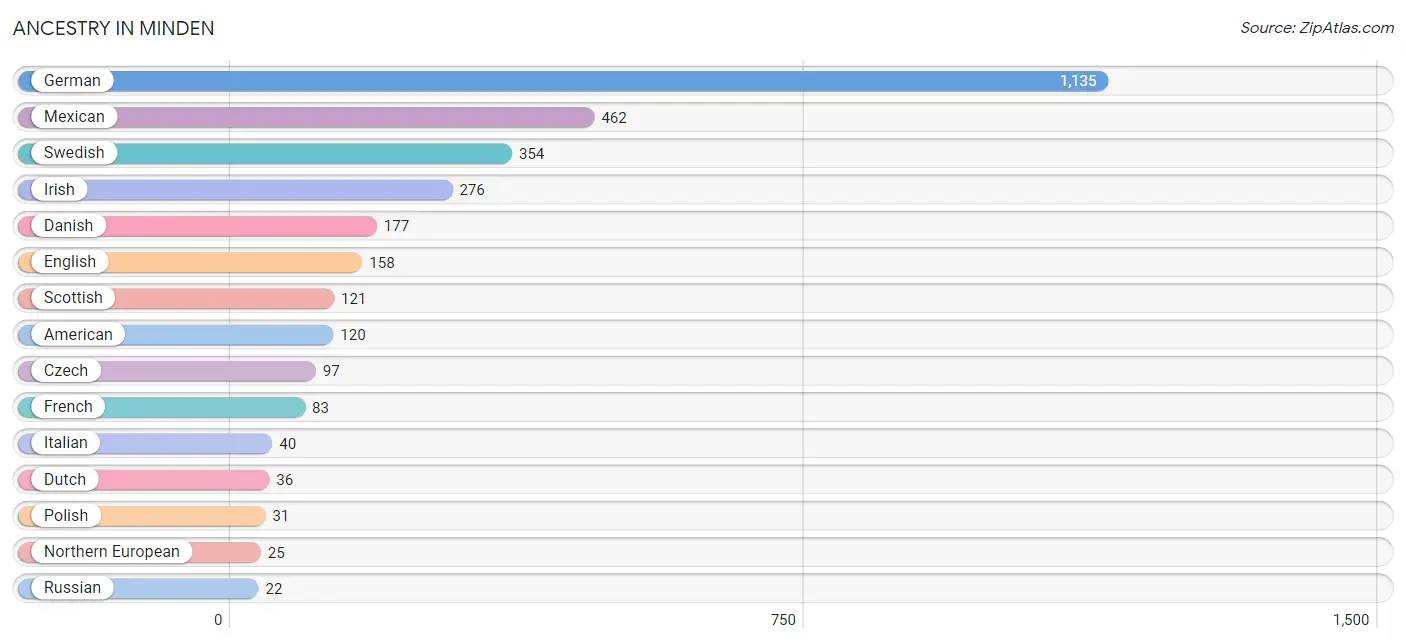
| Ancestry | # Population | % Population |
| American | 120 | 3.9% |
| Arab | 9 | 0.3% |
| Central American | 2 | 0.1% |
| Czech | 97 | 3.1% |
| Danish | 177 | 5.7% |
| Dutch | 36 | 1.2% |
| English | 158 | 5.1% |
| Finnish | 8 | 0.3% |
| French | 83 | 2.7% |
| German | 1,135 | 36.6% |
| Guatemalan | 1 | 0.0% |
| Honduran | 1 | 0.0% |
| Irish | 276 | 8.9% |
| Italian | 40 | 1.3% |
| Lebanese | 9 | 0.3% |
| Mexican | 462 | 14.9% |
| Northern European | 25 | 0.8% |
| Norwegian | 9 | 0.3% |
| Polish | 31 | 1.0% |
| Russian | 22 | 0.7% |
| Scandinavian | 16 | 0.5% |
| Scotch-Irish | 22 | 0.7% |
| Scottish | 121 | 3.9% |
| South American | 19 | 0.6% |
| Swedish | 354 | 11.4% |
| Venezuelan | 19 | 0.6% |
| Welsh | 18 | 0.6% | View All 27 Rows |
Immigrants in Minden
The most numerous immigrant groups reported in Minden came from Latin America (255 | 8.2%), South America (132 | 4.3%), Venezuela (132 | 4.3%), Central America (123 | 4.0%), and Mexico (121 | 3.9%), together accounting for 24.6% of all Minden residents.
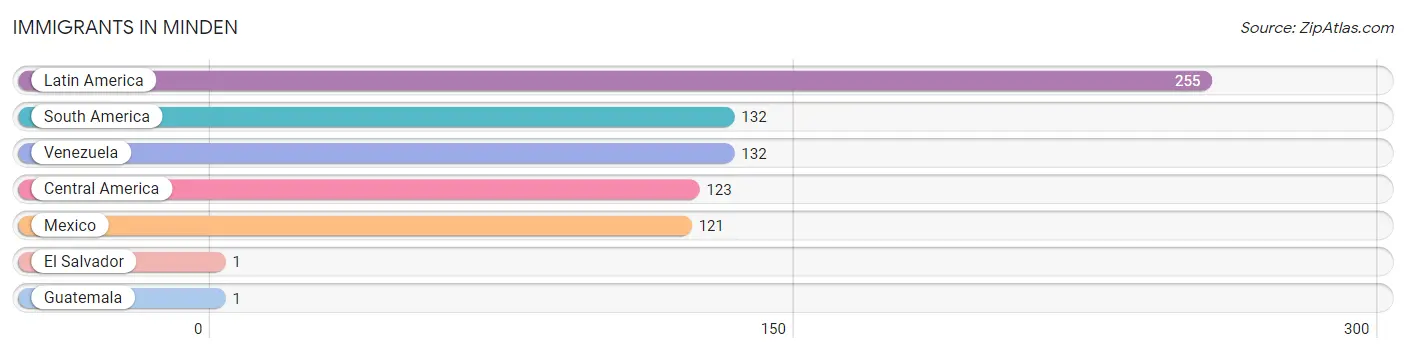
| Immigration Origin | # Population | % Population |
| Central America | 123 | 4.0% |
| El Salvador | 1 | 0.0% |
| Guatemala | 1 | 0.0% |
| Latin America | 255 | 8.2% |
| Mexico | 121 | 3.9% |
| South America | 132 | 4.3% |
| Venezuela | 132 | 4.3% | View All 7 Rows |
Sex and Age in Minden
Sex and Age in Minden
The most populous age groups in Minden are 10 to 14 Years (169 | 12.0%) for men and 10 to 14 Years (184 | 10.9%) for women.
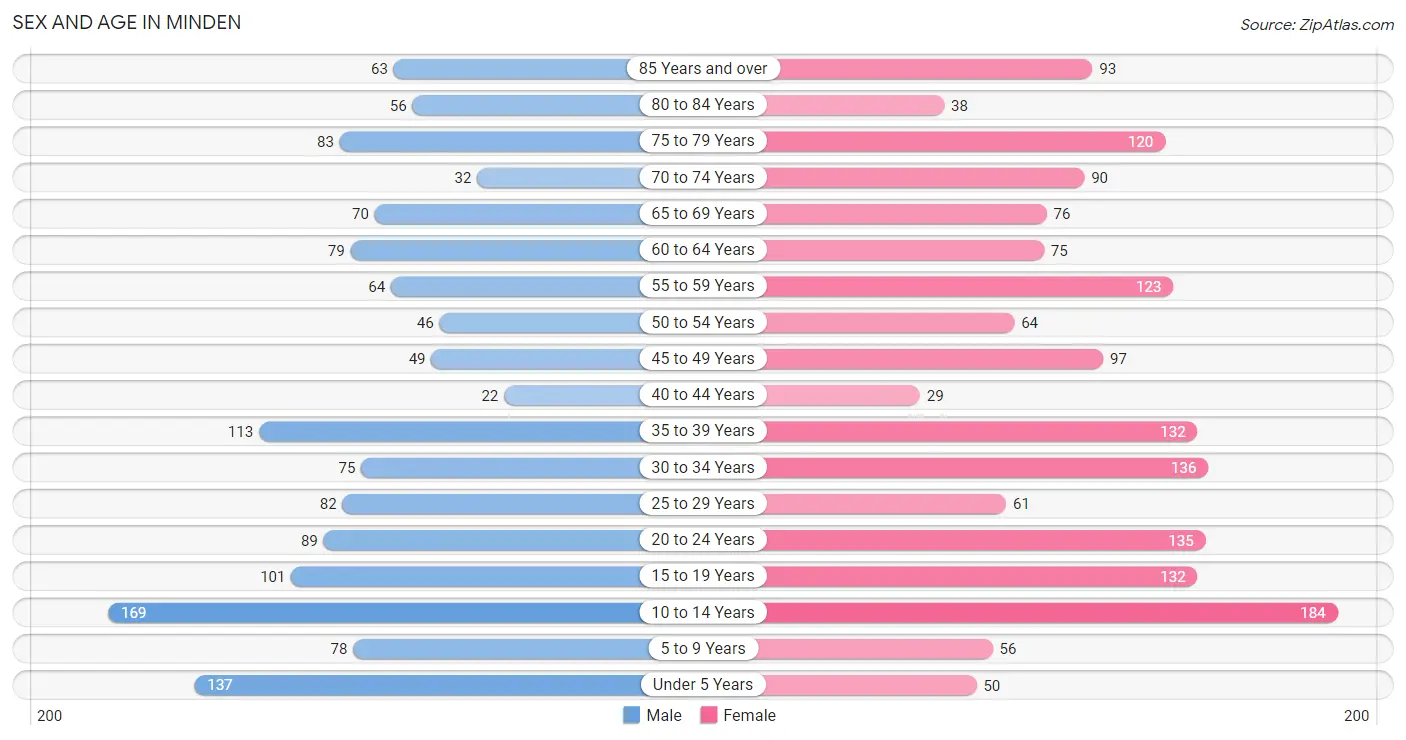
| Age Bracket | Male | Female |
| Under 5 Years | 137 (9.7%) | 50 (3.0%) |
| 5 to 9 Years | 78 (5.5%) | 56 (3.3%) |
| 10 to 14 Years | 169 (12.0%) | 184 (10.9%) |
| 15 to 19 Years | 101 (7.2%) | 132 (7.8%) |
| 20 to 24 Years | 89 (6.3%) | 135 (8.0%) |
| 25 to 29 Years | 82 (5.8%) | 61 (3.6%) |
| 30 to 34 Years | 75 (5.3%) | 136 (8.0%) |
| 35 to 39 Years | 113 (8.0%) | 132 (7.8%) |
| 40 to 44 Years | 22 (1.6%) | 29 (1.7%) |
| 45 to 49 Years | 49 (3.5%) | 97 (5.7%) |
| 50 to 54 Years | 46 (3.3%) | 64 (3.8%) |
| 55 to 59 Years | 64 (4.5%) | 123 (7.3%) |
| 60 to 64 Years | 79 (5.6%) | 75 (4.4%) |
| 65 to 69 Years | 70 (5.0%) | 76 (4.5%) |
| 70 to 74 Years | 32 (2.3%) | 90 (5.3%) |
| 75 to 79 Years | 83 (5.9%) | 120 (7.1%) |
| 80 to 84 Years | 56 (4.0%) | 38 (2.2%) |
| 85 Years and over | 63 (4.5%) | 93 (5.5%) |
| Total | 1,408 (100.0%) | 1,691 (100.0%) |
Families and Households in Minden
Median Family Size in Minden
The median family size in Minden is 3.02 persons per family, with single female/mother families (184 | 22.3%) accounting for the largest median family size of 3.85 persons per family. On the other hand, single male/father families (25 | 3.0%) represent the smallest median family size with 1.52 persons per family.
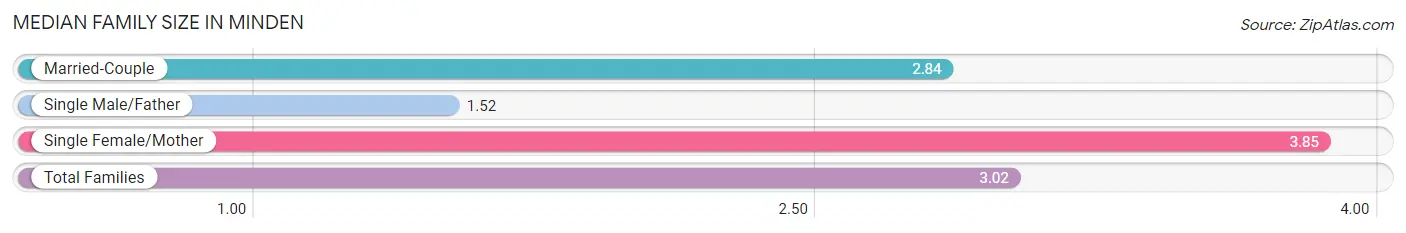
| Family Type | # Families | Family Size |
| Married-Couple | 615 (74.6%) | 2.84 |
| Single Male/Father | 25 (3.0%) | 1.52 |
| Single Female/Mother | 184 (22.3%) | 3.85 |
| Total Families | 824 (100.0%) | 3.02 |
Median Household Size in Minden
The median household size in Minden is 2.48 persons per household, with single female/mother households (184 | 15.0%) accounting for the largest median household size of 4.2 persons per household. non-family households (400 | 32.7%) represent the smallest median household size with 1.03 persons per household.
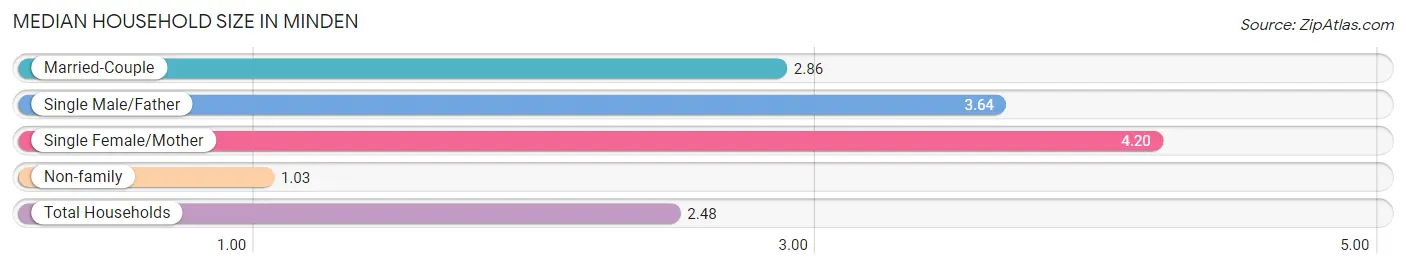
| Household Type | # Households | Household Size |
| Married-Couple | 615 (50.2%) | 2.86 |
| Single Male/Father | 25 (2.0%) | 3.64 |
| Single Female/Mother | 184 (15.0%) | 4.20 |
| Non-family | 400 (32.7%) | 1.03 |
| Total Households | 1,224 (100.0%) | 2.48 |
Household Size by Marriage Status in Minden
Out of a total of 1,224 households in Minden, 824 (67.3%) are family households, while 400 (32.7%) are nonfamily households. The most numerous type of family households are 2-person households, comprising 370, and the most common type of nonfamily households are 1-person households, comprising 375.
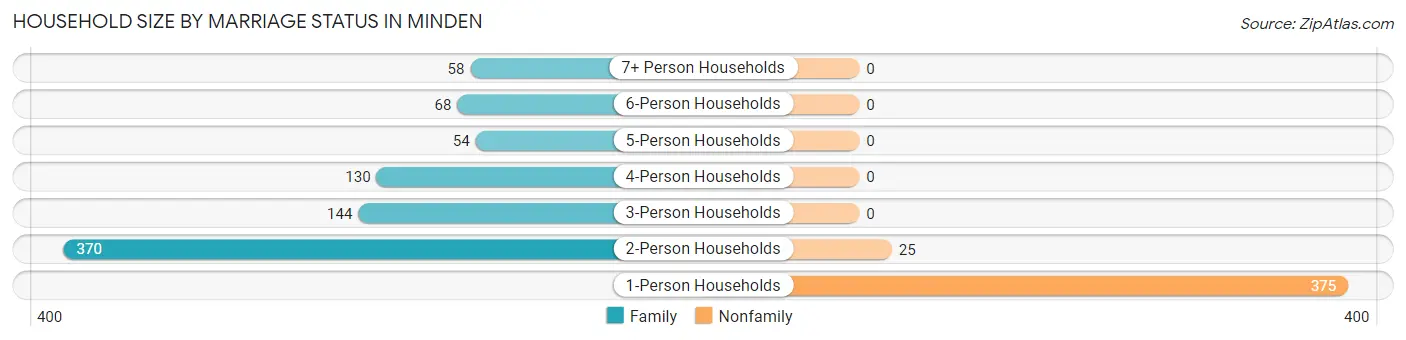
| Household Size | Family Households | Nonfamily Households |
| 1-Person Households | - | 375 (30.6%) |
| 2-Person Households | 370 (30.2%) | 25 (2.0%) |
| 3-Person Households | 144 (11.8%) | 0 (0.0%) |
| 4-Person Households | 130 (10.6%) | 0 (0.0%) |
| 5-Person Households | 54 (4.4%) | 0 (0.0%) |
| 6-Person Households | 68 (5.6%) | 0 (0.0%) |
| 7+ Person Households | 58 (4.7%) | 0 (0.0%) |
| Total | 824 (67.3%) | 400 (32.7%) |
Female Fertility in Minden
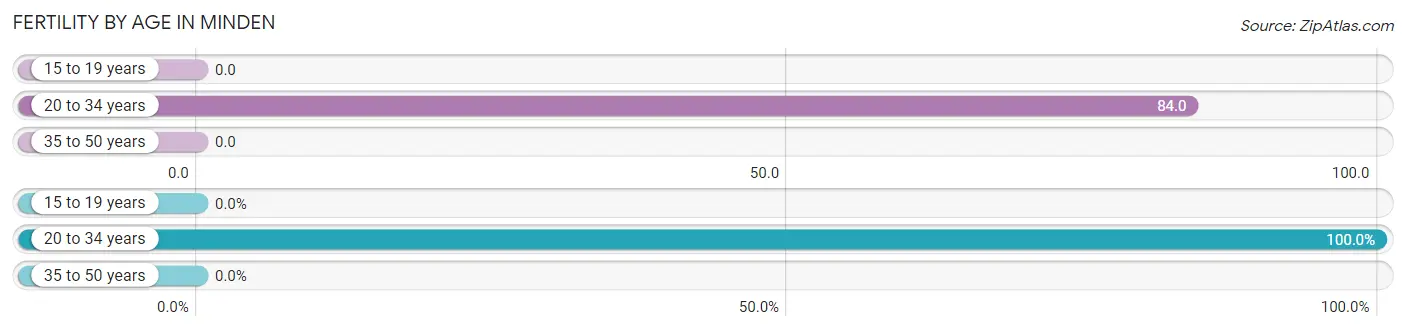
Fertility by Age in Minden
Average fertility rate in Minden is 38.0 births per 1,000 women. Women in the age bracket of 20 to 34 years have the highest fertility rate with 84.0 births per 1,000 women. Women in the age bracket of 20 to 34 years acount for 100.0% of all women with births.
| Age Bracket | Women with Births | Births / 1,000 Women |
| 15 to 19 years | 0 (0.0%) | 0.0 |
| 20 to 34 years | 28 (100.0%) | 84.0 |
| 35 to 50 years | 0 (0.0%) | 0.0 |
| Total | 28 (100.0%) | 38.0 |
Fertility by Age by Marriage Status in Minden
53.6% of women with births (28) in Minden are married. The highest percentage of unmarried women with births falls into 20 to 34 years age bracket with 46.4% of them unmarried at the time of birth, while the lowest percentage of unmarried women with births belong to 20 to 34 years age bracket with 46.4% of them unmarried.
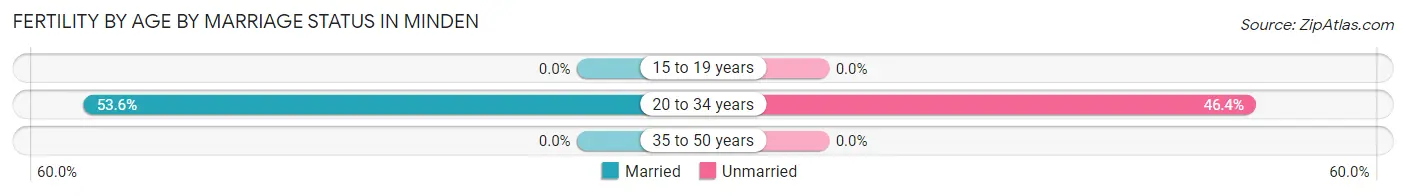
| Age Bracket | Married | Unmarried |
| 15 to 19 years | 0 (0.0%) | 0 (0.0%) |
| 20 to 34 years | 15 (53.6%) | 13 (46.4%) |
| 35 to 50 years | 0 (0.0%) | 0 (0.0%) |
| Total | 15 (53.6%) | 13 (46.4%) |
Fertility by Education in Minden
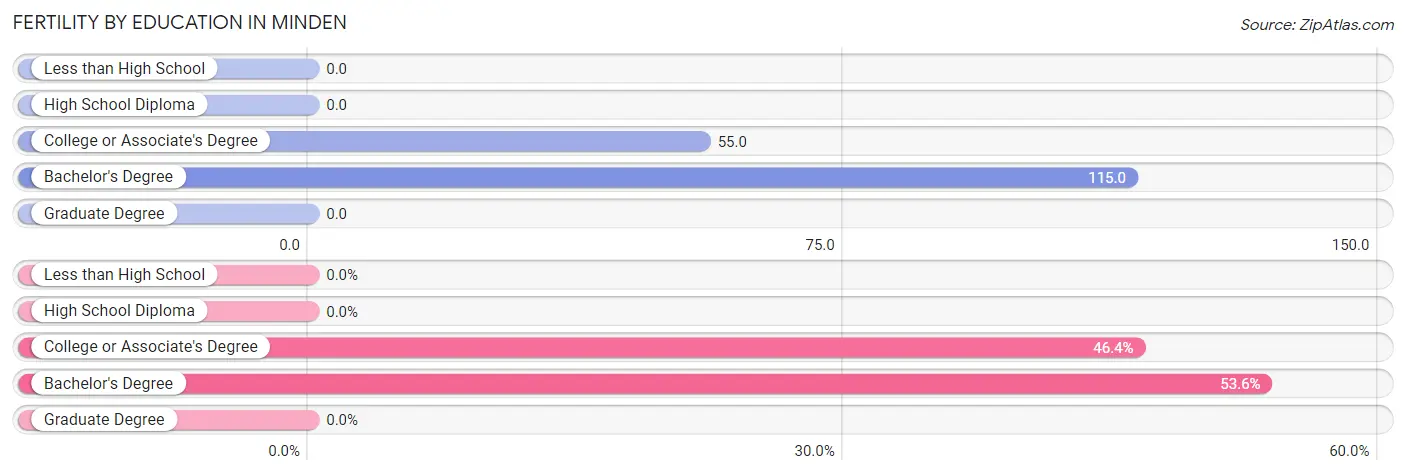
| Educational Attainment | Women with Births | Births / 1,000 Women |
| Less than High School | 0 (0.0%) | 0.0 |
| High School Diploma | 0 (0.0%) | 0.0 |
| College or Associate's Degree | 13 (46.4%) | 55.0 |
| Bachelor's Degree | 15 (53.6%) | 115.0 |
| Graduate Degree | 0 (0.0%) | 0.0 |
| Total | 28 (100.0%) | 38.0 |
Fertility by Education by Marriage Status in Minden
46.4% of women with births in Minden are unmarried. Women with the educational attainment of bachelor's degree are most likely to be married with 100.0% of them married at childbirth, while women with the educational attainment of college or associate's degree are least likely to be married with 100.0% of them unmarried at childbirth.
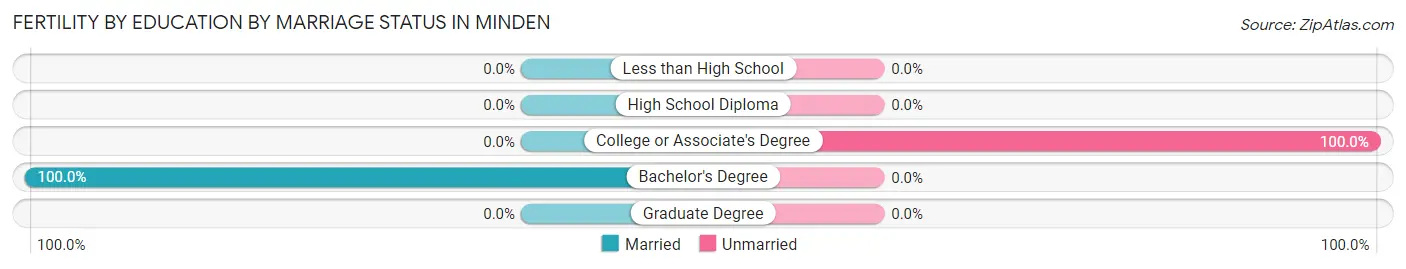
| Educational Attainment | Married | Unmarried |
| Less than High School | 0 (0.0%) | 0 (0.0%) |
| High School Diploma | 0 (0.0%) | 0 (0.0%) |
| College or Associate's Degree | 0 (0.0%) | 13 (100.0%) |
| Bachelor's Degree | 15 (100.0%) | 0 (0.0%) |
| Graduate Degree | 0 (0.0%) | 0 (0.0%) |
| Total | 15 (53.6%) | 13 (46.4%) |
Employment Characteristics in Minden
Employment by Class of Employer in Minden
Among the 1,545 employed individuals in Minden, private company employees (1,087 | 70.4%), not-for-profit organizations (188 | 12.2%), and local government employees (118 | 7.6%) make up the most common classes of employment.
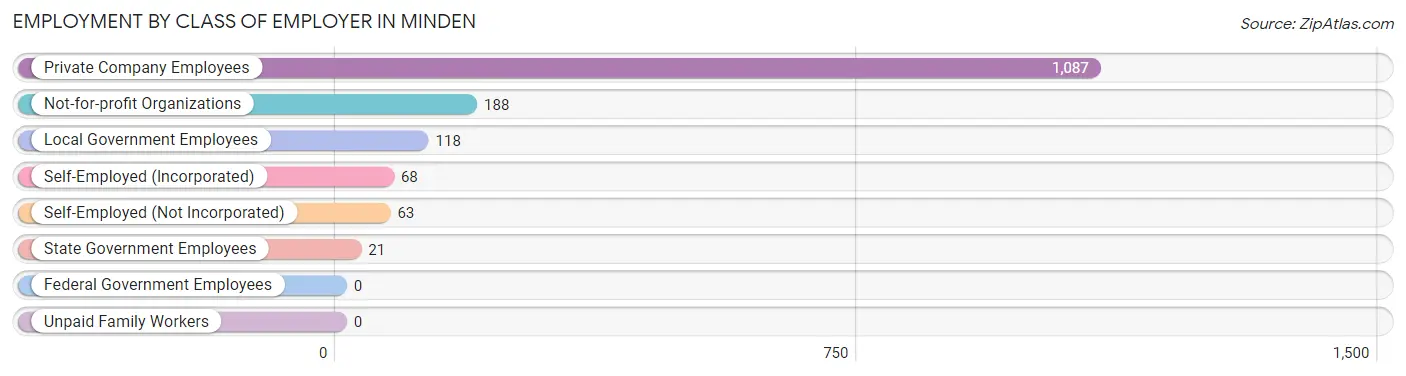
| Employer Class | # Employees | % Employees |
| Private Company Employees | 1,087 | 70.4% |
| Self-Employed (Incorporated) | 68 | 4.4% |
| Self-Employed (Not Incorporated) | 63 | 4.1% |
| Not-for-profit Organizations | 188 | 12.2% |
| Local Government Employees | 118 | 7.6% |
| State Government Employees | 21 | 1.4% |
| Federal Government Employees | 0 | 0.0% |
| Unpaid Family Workers | 0 | 0.0% |
| Total | 1,545 | 100.0% |
Employment Status by Age in Minden
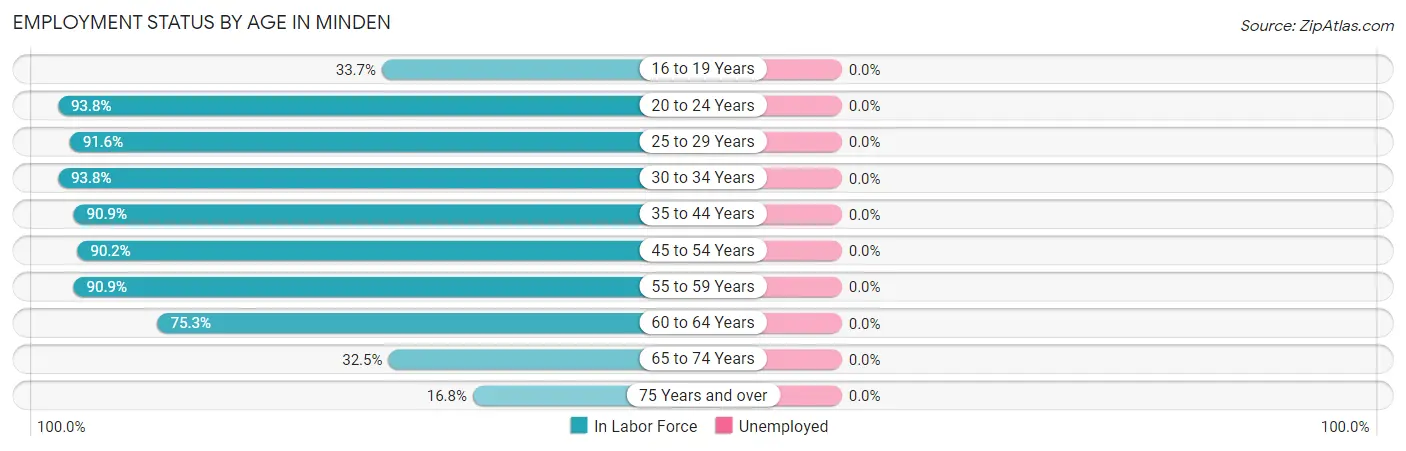
| Age Bracket | In Labor Force | Unemployed |
| 16 to 19 Years | 57 (33.7%) | 0 (0.0%) |
| 20 to 24 Years | 210 (93.8%) | 0 (0.0%) |
| 25 to 29 Years | 131 (91.6%) | 0 (0.0%) |
| 30 to 34 Years | 198 (93.8%) | 0 (0.0%) |
| 35 to 44 Years | 269 (90.9%) | 0 (0.0%) |
| 45 to 54 Years | 231 (90.2%) | 0 (0.0%) |
| 55 to 59 Years | 170 (90.9%) | 0 (0.0%) |
| 60 to 64 Years | 116 (75.3%) | 0 (0.0%) |
| 65 to 74 Years | 87 (32.5%) | 0 (0.0%) |
| 75 Years and over | 76 (16.8%) | 0 (0.0%) |
| Total | 1,544 (65.4%) | 0 (0.0%) |
Employment Status by Educational Attainment in Minden
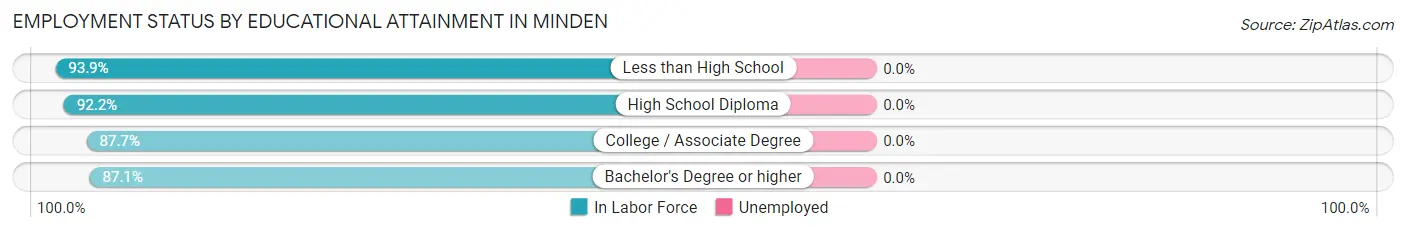
| Educational Attainment | In Labor Force | Unemployed |
| Less than High School | 77 (93.9%) | 0 (0.0%) |
| High School Diploma | 378 (92.2%) | 0 (0.0%) |
| College / Associate Degree | 363 (87.7%) | 0 (0.0%) |
| Bachelor's Degree or higher | 297 (87.1%) | 0 (0.0%) |
| Total | 1,115 (89.4%) | 0 (0.0%) |
Employment Occupations by Sex in Minden
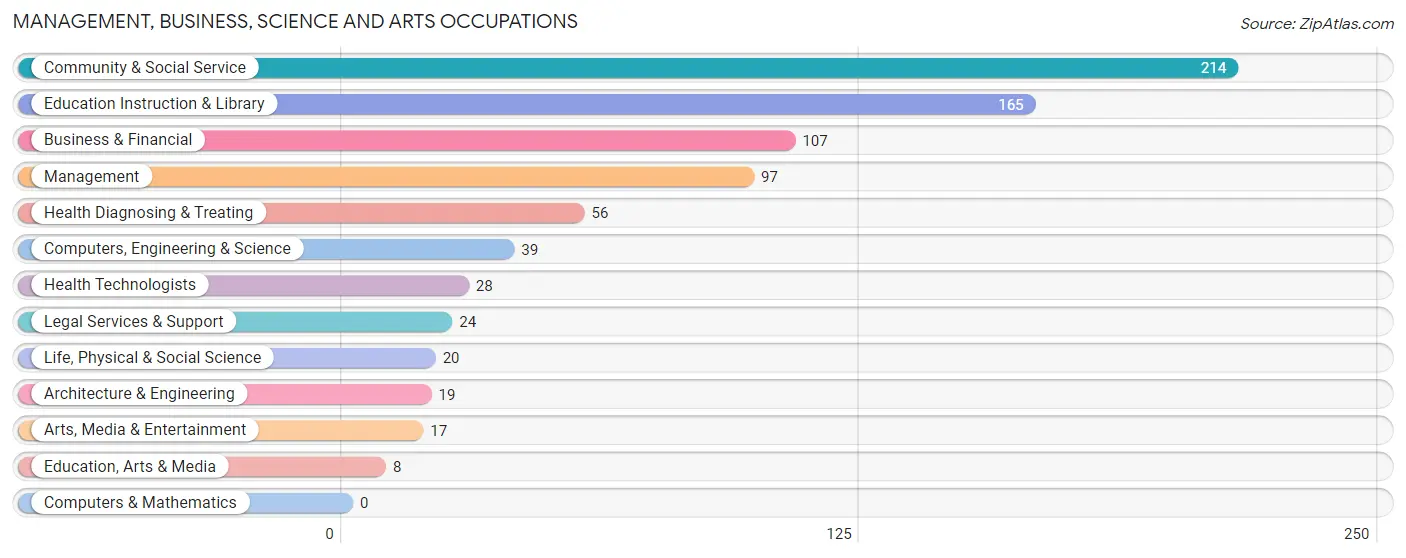
Management, Business, Science and Arts Occupations
The most common Management, Business, Science and Arts occupations in Minden are Community & Social Service (214 | 13.9%), Education Instruction & Library (165 | 10.7%), Business & Financial (107 | 6.9%), Management (97 | 6.3%), and Health Diagnosing & Treating (56 | 3.6%).
Management, Business, Science and Arts Occupations by Sex
Within the Management, Business, Science and Arts occupations in Minden, the most male-oriented occupations are Architecture & Engineering (100.0%), Computers, Engineering & Science (74.4%), and Arts, Media & Entertainment (52.9%), while the most female-oriented occupations are Education, Arts & Media (100.0%), Legal Services & Support (100.0%), and Health Technologists (100.0%).
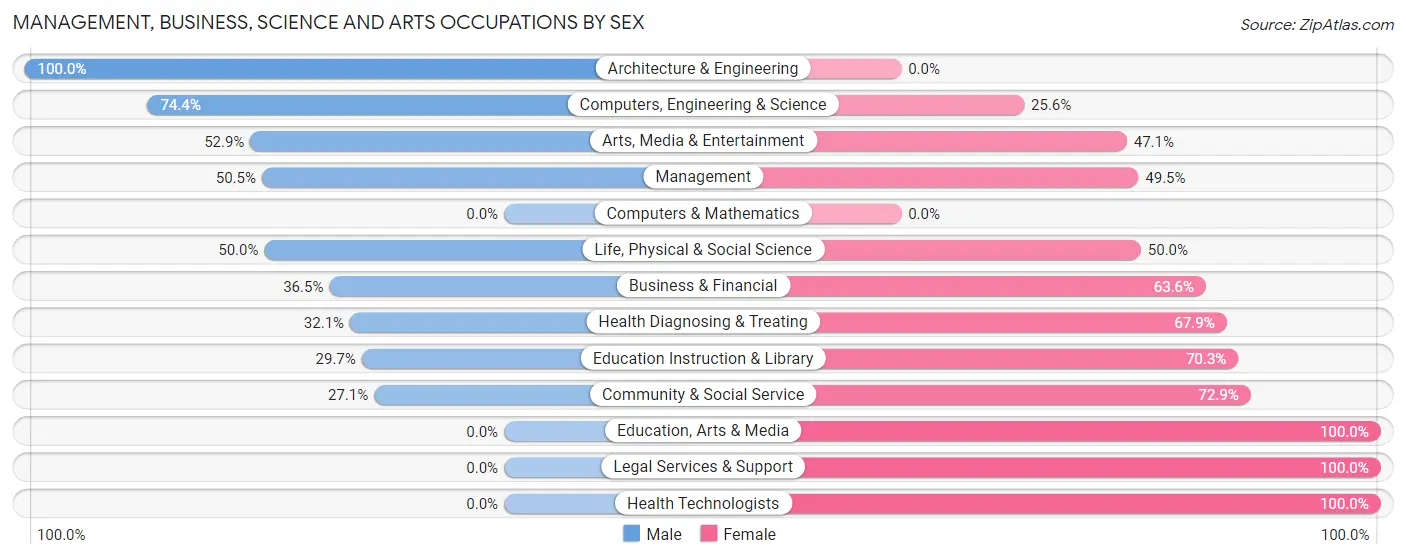
| Occupation | Male | Female |
| Management | 49 (50.5%) | 48 (49.5%) |
| Business & Financial | 39 (36.4%) | 68 (63.5%) |
| Computers, Engineering & Science | 29 (74.4%) | 10 (25.6%) |
| Computers & Mathematics | 0 (0.0%) | 0 (0.0%) |
| Architecture & Engineering | 19 (100.0%) | 0 (0.0%) |
| Life, Physical & Social Science | 10 (50.0%) | 10 (50.0%) |
| Community & Social Service | 58 (27.1%) | 156 (72.9%) |
| Education, Arts & Media | 0 (0.0%) | 8 (100.0%) |
| Legal Services & Support | 0 (0.0%) | 24 (100.0%) |
| Education Instruction & Library | 49 (29.7%) | 116 (70.3%) |
| Arts, Media & Entertainment | 9 (52.9%) | 8 (47.1%) |
| Health Diagnosing & Treating | 18 (32.1%) | 38 (67.9%) |
| Health Technologists | 0 (0.0%) | 28 (100.0%) |
| Total (Category) | 193 (37.6%) | 320 (62.4%) |
| Total (Overall) | 706 (45.7%) | 839 (54.3%) |
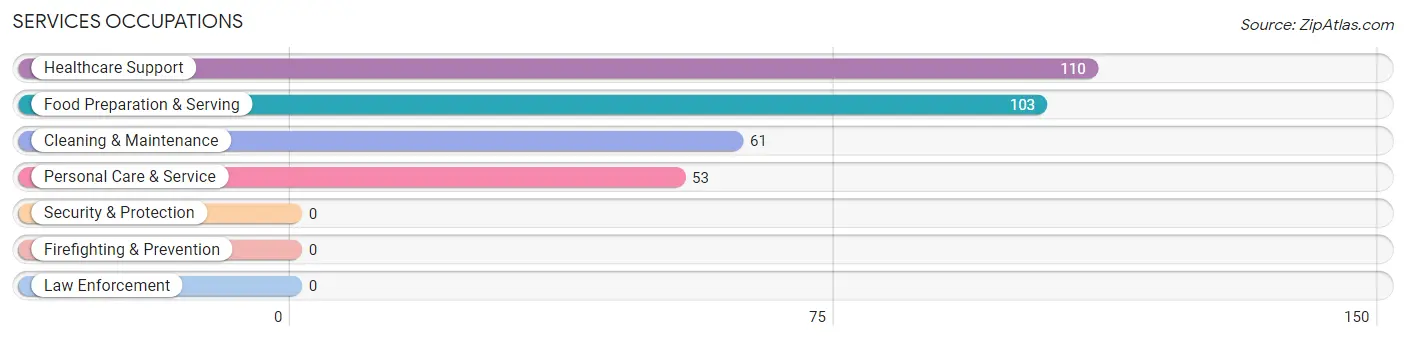
Services Occupations
The most common Services occupations in Minden are Healthcare Support (110 | 7.1%), Food Preparation & Serving (103 | 6.7%), Cleaning & Maintenance (61 | 4.0%), and Personal Care & Service (53 | 3.4%).
Services Occupations by Sex
Within the Services occupations in Minden, the most male-oriented occupations are Cleaning & Maintenance (62.3%), Healthcare Support (12.7%), and Personal Care & Service (11.3%), while the most female-oriented occupations are Food Preparation & Serving (89.3%), Personal Care & Service (88.7%), and Healthcare Support (87.3%).
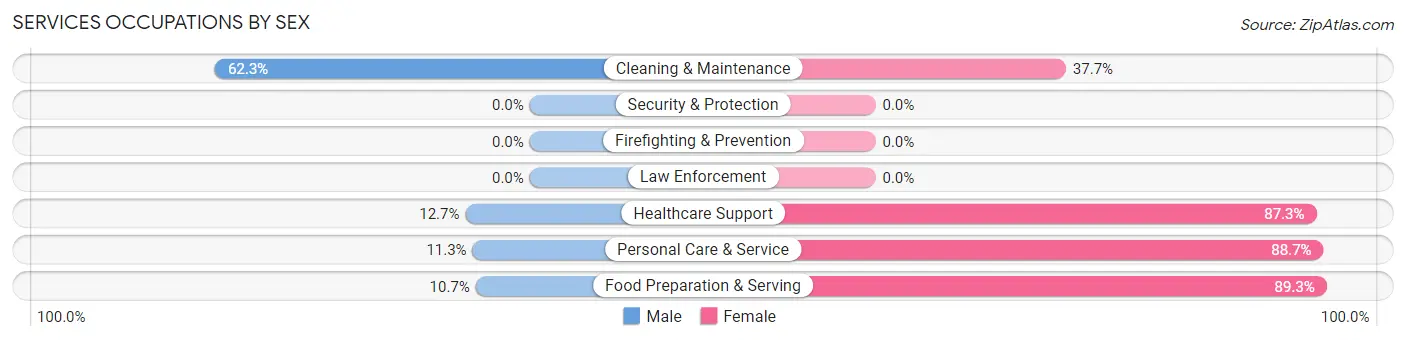
| Occupation | Male | Female |
| Healthcare Support | 14 (12.7%) | 96 (87.3%) |
| Security & Protection | 0 (0.0%) | 0 (0.0%) |
| Firefighting & Prevention | 0 (0.0%) | 0 (0.0%) |
| Law Enforcement | 0 (0.0%) | 0 (0.0%) |
| Food Preparation & Serving | 11 (10.7%) | 92 (89.3%) |
| Cleaning & Maintenance | 38 (62.3%) | 23 (37.7%) |
| Personal Care & Service | 6 (11.3%) | 47 (88.7%) |
| Total (Category) | 69 (21.1%) | 258 (78.9%) |
| Total (Overall) | 706 (45.7%) | 839 (54.3%) |
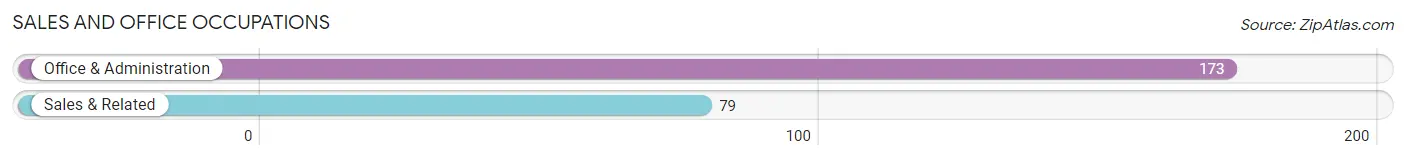
Sales and Office Occupations
The most common Sales and Office occupations in Minden are Office & Administration (173 | 11.2%), and Sales & Related (79 | 5.1%).
Sales and Office Occupations by Sex
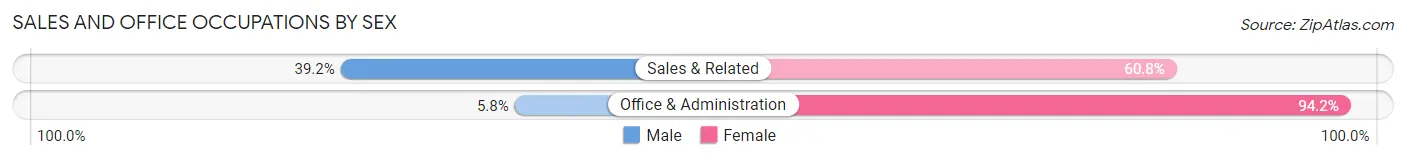
| Occupation | Male | Female |
| Sales & Related | 31 (39.2%) | 48 (60.8%) |
| Office & Administration | 10 (5.8%) | 163 (94.2%) |
| Total (Category) | 41 (16.3%) | 211 (83.7%) |
| Total (Overall) | 706 (45.7%) | 839 (54.3%) |
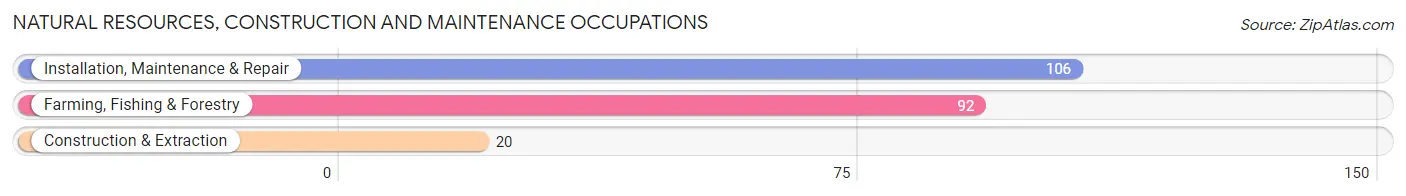
Natural Resources, Construction and Maintenance Occupations
The most common Natural Resources, Construction and Maintenance occupations in Minden are Installation, Maintenance & Repair (106 | 6.9%), Farming, Fishing & Forestry (92 | 5.9%), and Construction & Extraction (20 | 1.3%).
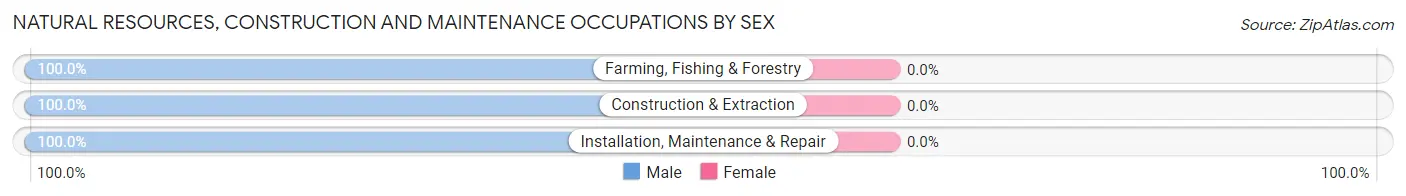
Natural Resources, Construction and Maintenance Occupations by Sex
| Occupation | Male | Female |
| Farming, Fishing & Forestry | 92 (100.0%) | 0 (0.0%) |
| Construction & Extraction | 20 (100.0%) | 0 (0.0%) |
| Installation, Maintenance & Repair | 106 (100.0%) | 0 (0.0%) |
| Total (Category) | 218 (100.0%) | 0 (0.0%) |
| Total (Overall) | 706 (45.7%) | 839 (54.3%) |
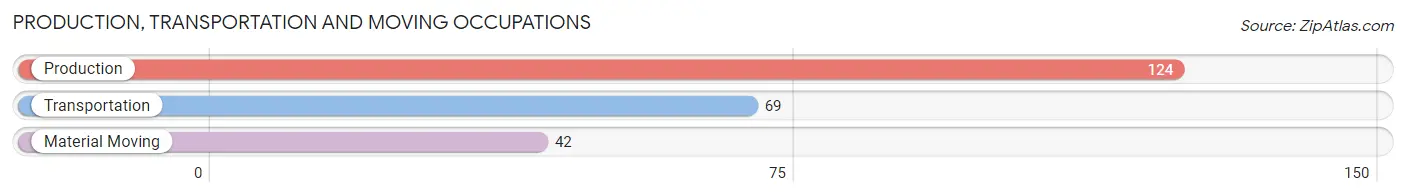
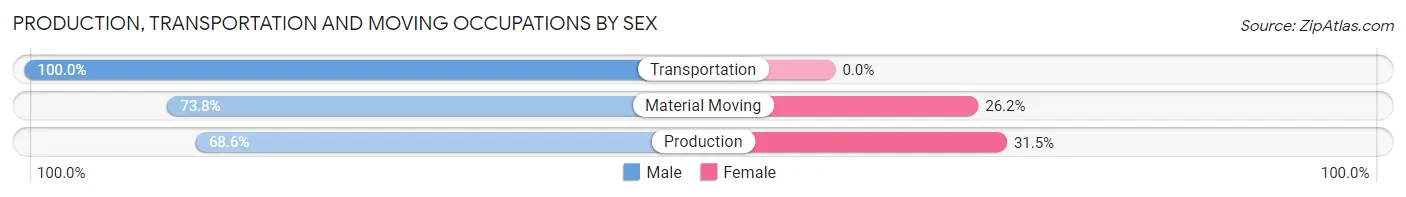
Production, Transportation and Moving Occupations
The most common Production, Transportation and Moving occupations in Minden are Production (124 | 8.0%), Transportation (69 | 4.5%), and Material Moving (42 | 2.7%).
Production, Transportation and Moving Occupations by Sex
| Occupation | Male | Female |
| Production | 85 (68.5%) | 39 (31.5%) |
| Transportation | 69 (100.0%) | 0 (0.0%) |
| Material Moving | 31 (73.8%) | 11 (26.2%) |
| Total (Category) | 185 (78.7%) | 50 (21.3%) |
| Total (Overall) | 706 (45.7%) | 839 (54.3%) |
Employment Industries by Sex in Minden
Employment Industries in Minden
The major employment industries in Minden include Health Care & Social Assistance (251 | 16.3%), Retail Trade (247 | 16.0%), Manufacturing (178 | 11.5%), Educational Services (120 | 7.8%), and Accommodation & Food Services (97 | 6.3%).
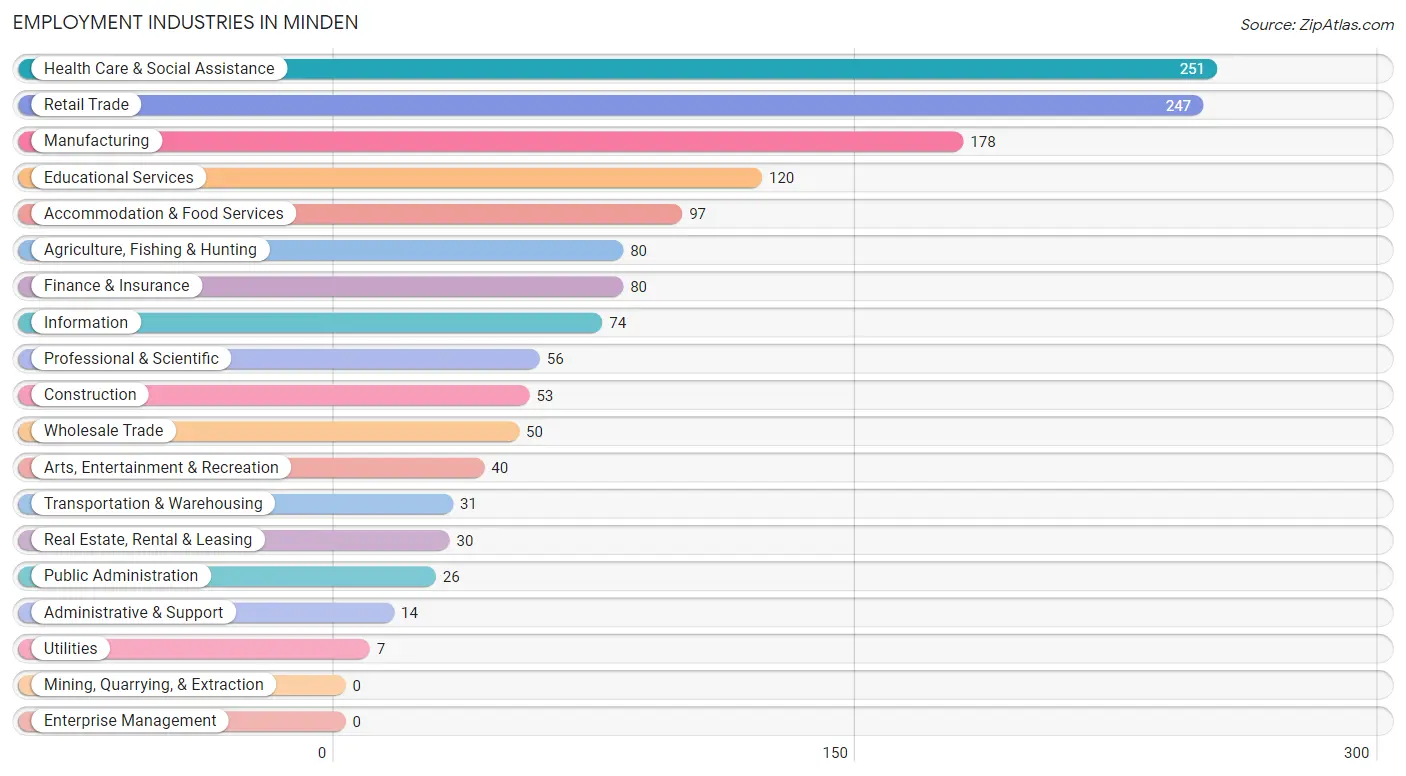
Employment Industries by Sex in Minden
The Minden industries that see more men than women are Agriculture, Fishing & Hunting (100.0%), Construction (100.0%), and Wholesale Trade (100.0%), whereas the industries that tend to have a higher number of women are Administrative & Support (100.0%), Health Care & Social Assistance (90.4%), and Accommodation & Food Services (88.7%).
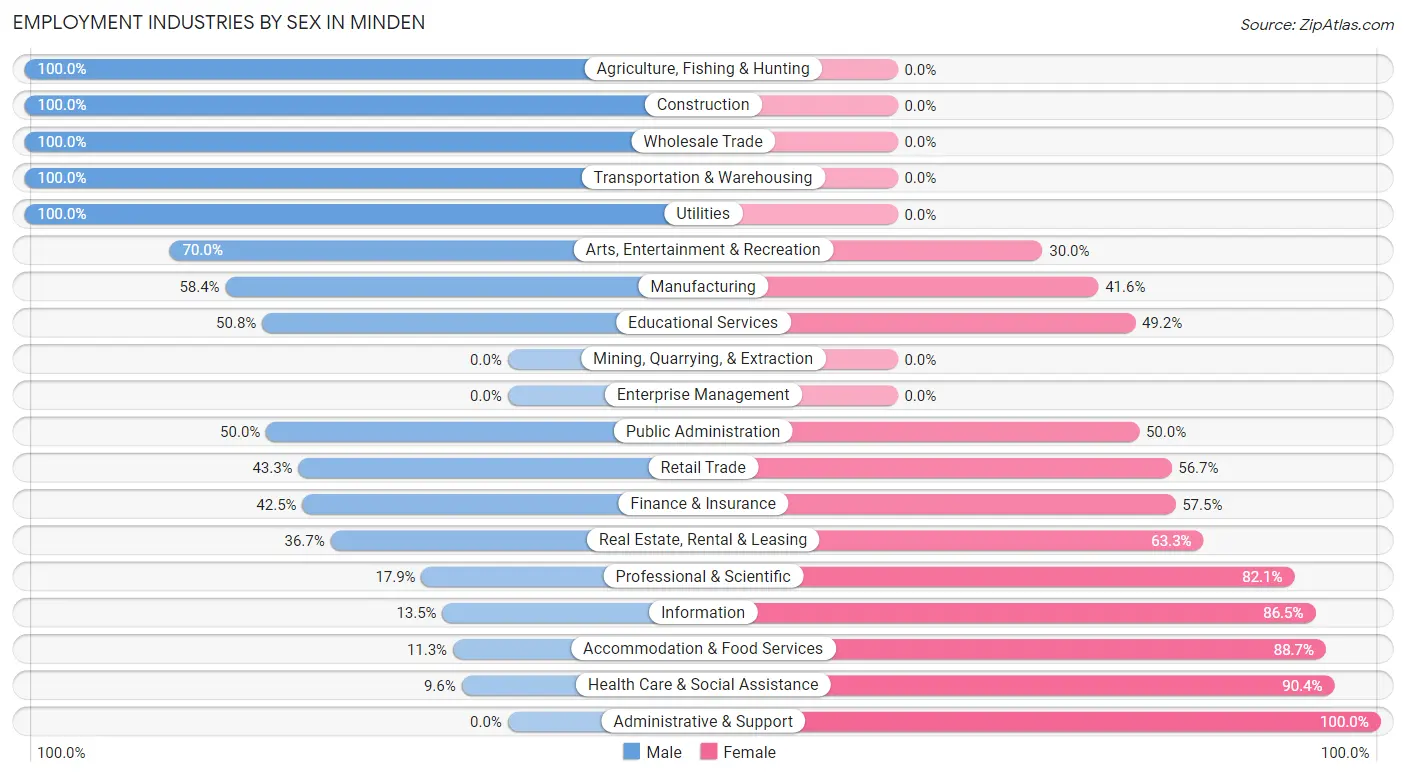
| Industry | Male | Female |
| Agriculture, Fishing & Hunting | 80 (100.0%) | 0 (0.0%) |
| Mining, Quarrying, & Extraction | 0 (0.0%) | 0 (0.0%) |
| Construction | 53 (100.0%) | 0 (0.0%) |
| Manufacturing | 104 (58.4%) | 74 (41.6%) |
| Wholesale Trade | 50 (100.0%) | 0 (0.0%) |
| Retail Trade | 107 (43.3%) | 140 (56.7%) |
| Transportation & Warehousing | 31 (100.0%) | 0 (0.0%) |
| Utilities | 7 (100.0%) | 0 (0.0%) |
| Information | 10 (13.5%) | 64 (86.5%) |
| Finance & Insurance | 34 (42.5%) | 46 (57.5%) |
| Real Estate, Rental & Leasing | 11 (36.7%) | 19 (63.3%) |
| Professional & Scientific | 10 (17.9%) | 46 (82.1%) |
| Enterprise Management | 0 (0.0%) | 0 (0.0%) |
| Administrative & Support | 0 (0.0%) | 14 (100.0%) |
| Educational Services | 61 (50.8%) | 59 (49.2%) |
| Health Care & Social Assistance | 24 (9.6%) | 227 (90.4%) |
| Arts, Entertainment & Recreation | 28 (70.0%) | 12 (30.0%) |
| Accommodation & Food Services | 11 (11.3%) | 86 (88.7%) |
| Public Administration | 13 (50.0%) | 13 (50.0%) |
| Total | 706 (45.7%) | 839 (54.3%) |
Education in Minden
School Enrollment in Minden
The most common levels of schooling among the 759 students in Minden are middle school (310 | 40.8%), high school (224 | 29.5%), and elementary school (116 | 15.3%).
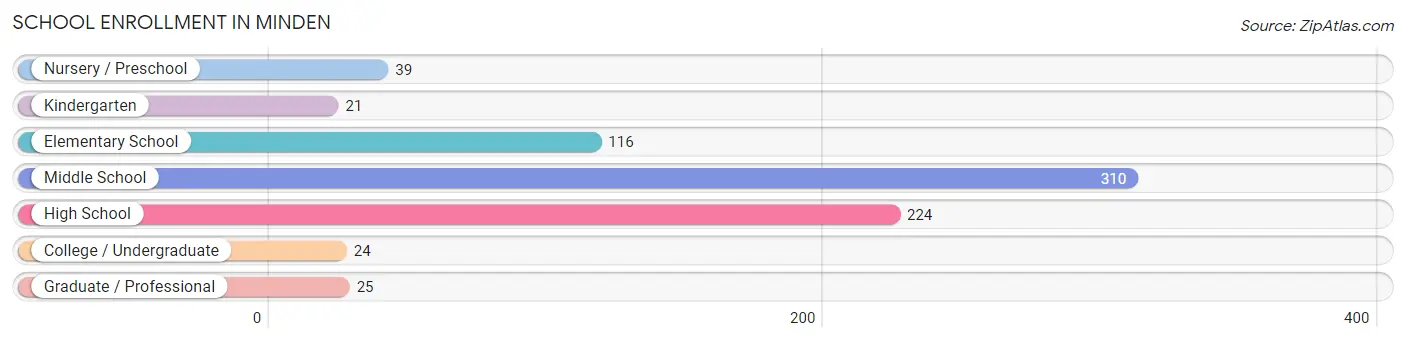
| School Level | # Students | % Students |
| Nursery / Preschool | 39 | 5.1% |
| Kindergarten | 21 | 2.8% |
| Elementary School | 116 | 15.3% |
| Middle School | 310 | 40.8% |
| High School | 224 | 29.5% |
| College / Undergraduate | 24 | 3.2% |
| Graduate / Professional | 25 | 3.3% |
| Total | 759 | 100.0% |
School Enrollment by Age by Funding Source in Minden
Out of a total of 759 students who are enrolled in schools in Minden, 83 (10.9%) attend a private institution, while the remaining 676 (89.1%) are enrolled in public schools. The age group of 15 to 17 year olds has the highest likelihood of being enrolled in private schools, with 36 (20.8% in the age bracket) enrolled. Conversely, the age group of 3 to 4 year olds has the lowest likelihood of being enrolled in a private school, with 10 (100.0% in the age bracket) attending a public institution.
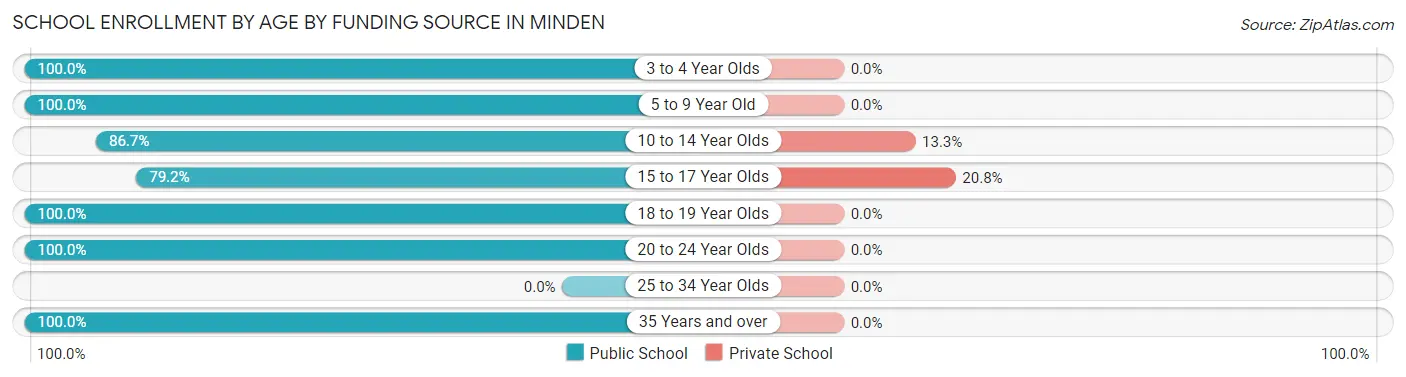
| Age Bracket | Public School | Private School |
| 3 to 4 Year Olds | 10 (100.0%) | 0 (0.0%) |
| 5 to 9 Year Old | 134 (100.0%) | 0 (0.0%) |
| 10 to 14 Year Olds | 306 (86.7%) | 47 (13.3%) |
| 15 to 17 Year Olds | 137 (79.2%) | 36 (20.8%) |
| 18 to 19 Year Olds | 29 (100.0%) | 0 (0.0%) |
| 20 to 24 Year Olds | 53 (100.0%) | 0 (0.0%) |
| 25 to 34 Year Olds | 0 (0.0%) | 0 (0.0%) |
| 35 Years and over | 7 (100.0%) | 0 (0.0%) |
| Total | 676 (89.1%) | 83 (10.9%) |
Educational Attainment by Field of Study in Minden
Education (173 | 32.5%), business (107 | 20.1%), science & technology (76 | 14.3%), arts & humanities (40 | 7.5%), and liberal arts & history (38 | 7.1%) are the most common fields of study among 532 individuals in Minden who have obtained a bachelor's degree or higher.
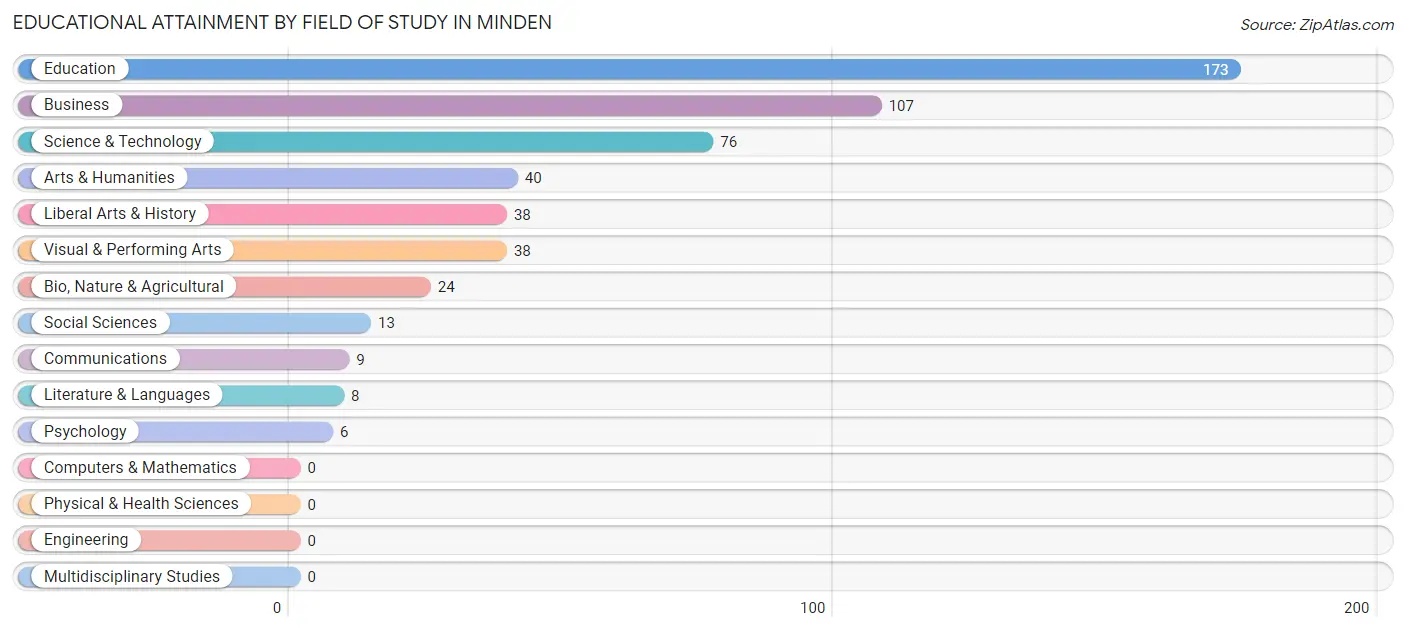
| Field of Study | # Graduates | % Graduates |
| Computers & Mathematics | 0 | 0.0% |
| Bio, Nature & Agricultural | 24 | 4.5% |
| Physical & Health Sciences | 0 | 0.0% |
| Psychology | 6 | 1.1% |
| Social Sciences | 13 | 2.4% |
| Engineering | 0 | 0.0% |
| Multidisciplinary Studies | 0 | 0.0% |
| Science & Technology | 76 | 14.3% |
| Business | 107 | 20.1% |
| Education | 173 | 32.5% |
| Literature & Languages | 8 | 1.5% |
| Liberal Arts & History | 38 | 7.1% |
| Visual & Performing Arts | 38 | 7.1% |
| Communications | 9 | 1.7% |
| Arts & Humanities | 40 | 7.5% |
| Total | 532 | 100.0% |
Transportation & Commute in Minden
Vehicle Availability by Sex in Minden
The most prevalent vehicle ownership categories in Minden are males with 2 vehicles (371, accounting for 52.5%) and females with 2 vehicles (432, making up 44.2%).
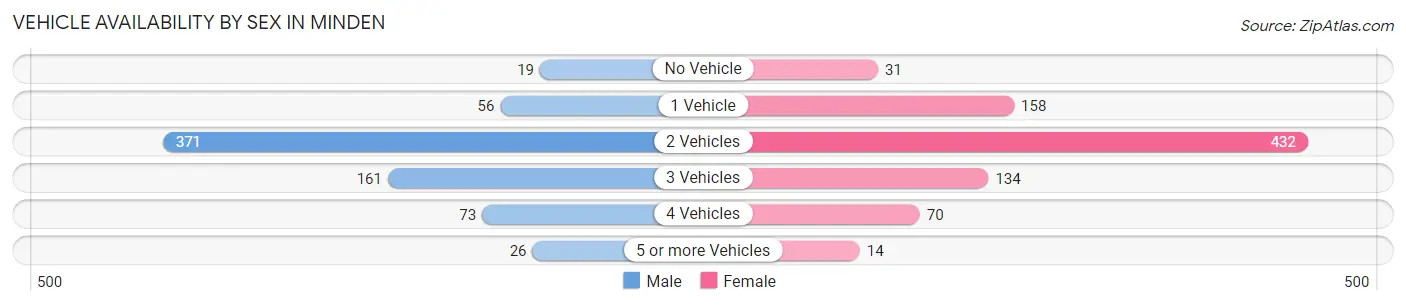
| Vehicles Available | Male | Female |
| No Vehicle | 19 (2.7%) | 31 (3.7%) |
| 1 Vehicle | 56 (7.9%) | 158 (18.8%) |
| 2 Vehicles | 371 (52.5%) | 432 (51.5%) |
| 3 Vehicles | 161 (22.8%) | 134 (16.0%) |
| 4 Vehicles | 73 (10.3%) | 70 (8.3%) |
| 5 or more Vehicles | 26 (3.7%) | 14 (1.7%) |
| Total | 706 (100.0%) | 839 (100.0%) |
Commute Time in Minden
The most frequently occuring commute durations in Minden are 5 to 9 minutes (378 commuters, 25.3%), 30 to 34 minutes (289 commuters, 19.3%), and less than 5 minutes (220 commuters, 14.7%).
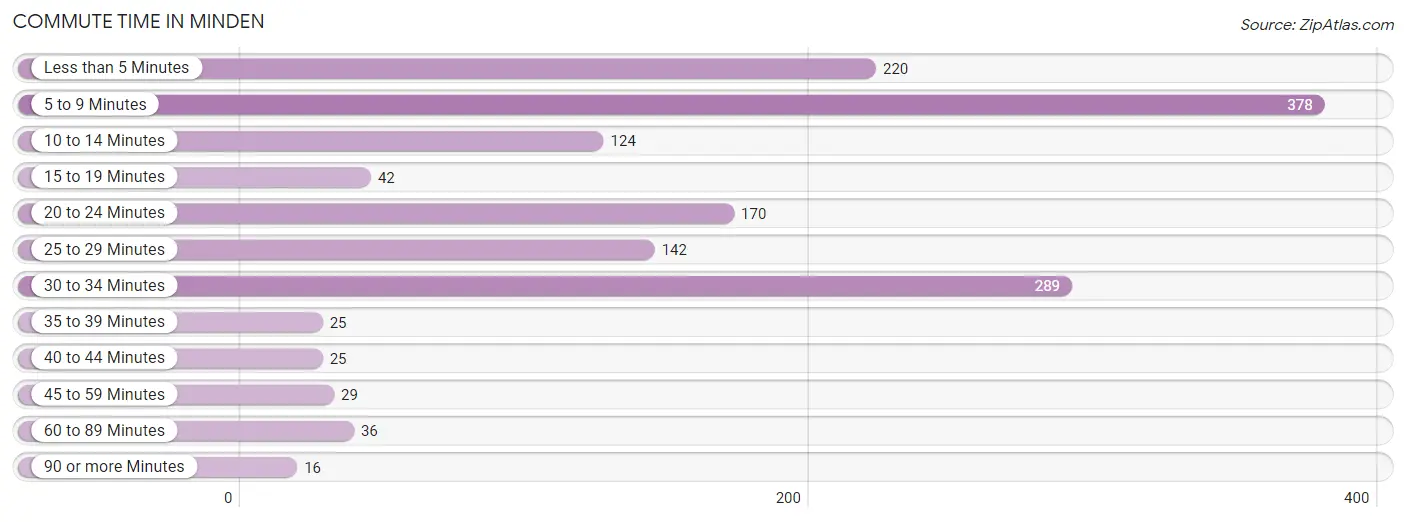
| Commute Time | # Commuters | % Commuters |
| Less than 5 Minutes | 220 | 14.7% |
| 5 to 9 Minutes | 378 | 25.3% |
| 10 to 14 Minutes | 124 | 8.3% |
| 15 to 19 Minutes | 42 | 2.8% |
| 20 to 24 Minutes | 170 | 11.4% |
| 25 to 29 Minutes | 142 | 9.5% |
| 30 to 34 Minutes | 289 | 19.3% |
| 35 to 39 Minutes | 25 | 1.7% |
| 40 to 44 Minutes | 25 | 1.7% |
| 45 to 59 Minutes | 29 | 1.9% |
| 60 to 89 Minutes | 36 | 2.4% |
| 90 or more Minutes | 16 | 1.1% |
Commute Time by Sex in Minden
The most common commute times in Minden are 5 to 9 minutes (189 commuters, 26.8%) for males and 5 to 9 minutes (189 commuters, 23.9%) for females.
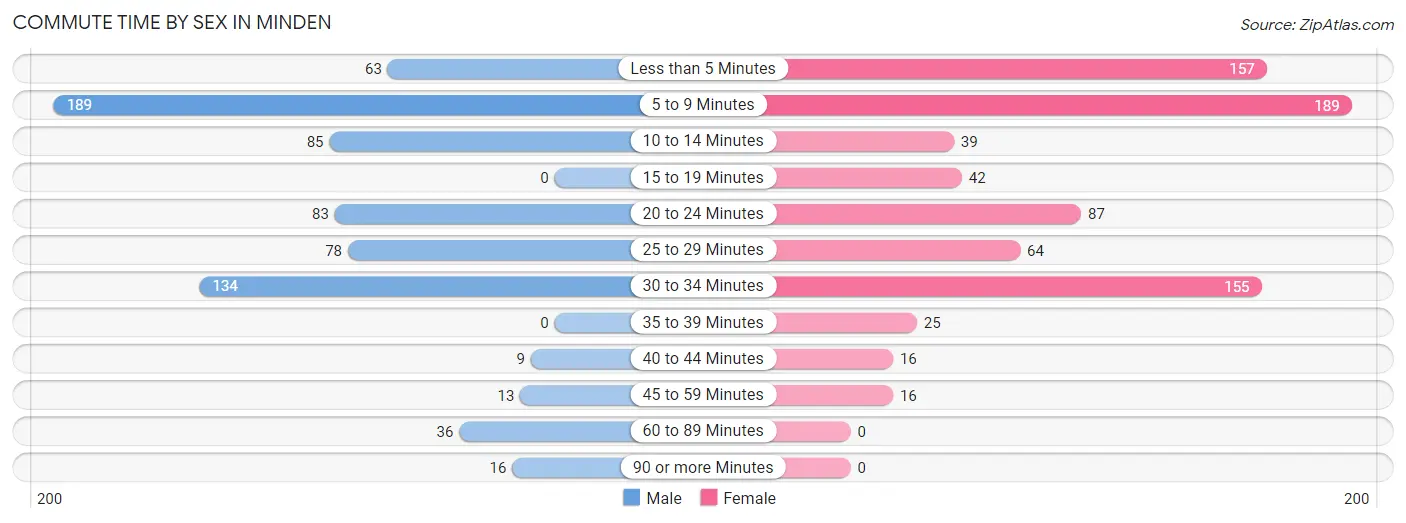
| Commute Time | Male | Female |
| Less than 5 Minutes | 63 (8.9%) | 157 (19.9%) |
| 5 to 9 Minutes | 189 (26.8%) | 189 (23.9%) |
| 10 to 14 Minutes | 85 (12.0%) | 39 (4.9%) |
| 15 to 19 Minutes | 0 (0.0%) | 42 (5.3%) |
| 20 to 24 Minutes | 83 (11.8%) | 87 (11.0%) |
| 25 to 29 Minutes | 78 (11.1%) | 64 (8.1%) |
| 30 to 34 Minutes | 134 (19.0%) | 155 (19.6%) |
| 35 to 39 Minutes | 0 (0.0%) | 25 (3.2%) |
| 40 to 44 Minutes | 9 (1.3%) | 16 (2.0%) |
| 45 to 59 Minutes | 13 (1.8%) | 16 (2.0%) |
| 60 to 89 Minutes | 36 (5.1%) | 0 (0.0%) |
| 90 or more Minutes | 16 (2.3%) | 0 (0.0%) |
Time of Departure to Work by Sex in Minden
The most frequent times of departure to work in Minden are 7:30 AM to 7:59 AM (126, 17.8%) for males and 7:30 AM to 7:59 AM (209, 26.5%) for females.
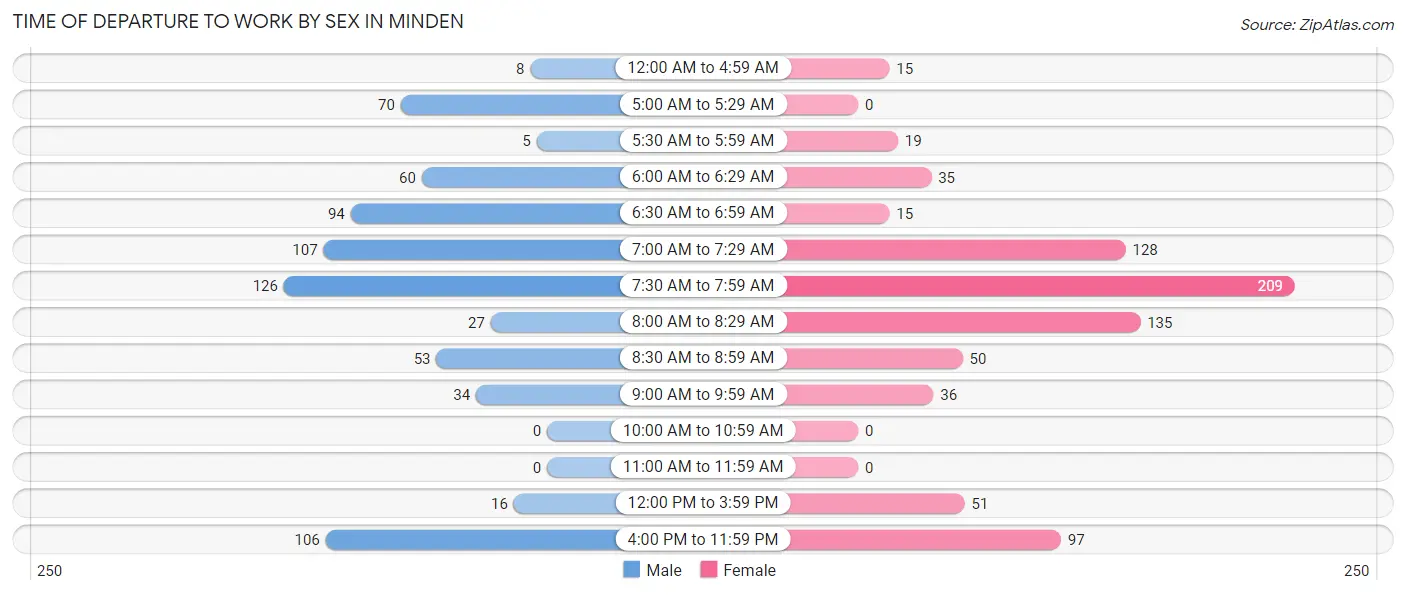
| Time of Departure | Male | Female |
| 12:00 AM to 4:59 AM | 8 (1.1%) | 15 (1.9%) |
| 5:00 AM to 5:29 AM | 70 (9.9%) | 0 (0.0%) |
| 5:30 AM to 5:59 AM | 5 (0.7%) | 19 (2.4%) |
| 6:00 AM to 6:29 AM | 60 (8.5%) | 35 (4.4%) |
| 6:30 AM to 6:59 AM | 94 (13.3%) | 15 (1.9%) |
| 7:00 AM to 7:29 AM | 107 (15.2%) | 128 (16.2%) |
| 7:30 AM to 7:59 AM | 126 (17.8%) | 209 (26.5%) |
| 8:00 AM to 8:29 AM | 27 (3.8%) | 135 (17.1%) |
| 8:30 AM to 8:59 AM | 53 (7.5%) | 50 (6.3%) |
| 9:00 AM to 9:59 AM | 34 (4.8%) | 36 (4.6%) |
| 10:00 AM to 10:59 AM | 0 (0.0%) | 0 (0.0%) |
| 11:00 AM to 11:59 AM | 0 (0.0%) | 0 (0.0%) |
| 12:00 PM to 3:59 PM | 16 (2.3%) | 51 (6.5%) |
| 4:00 PM to 11:59 PM | 106 (15.0%) | 97 (12.3%) |
| Total | 706 (100.0%) | 790 (100.0%) |
Housing Occupancy in Minden
Occupancy by Ownership in Minden
Of the total 1,224 dwellings in Minden, owner-occupied units account for 957 (78.2%), while renter-occupied units make up 267 (21.8%).
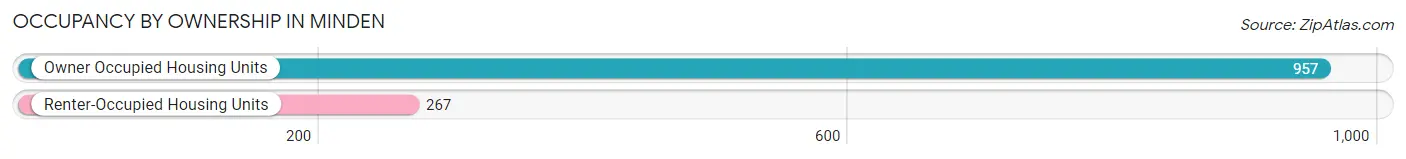
| Occupancy | # Housing Units | % Housing Units |
| Owner Occupied Housing Units | 957 | 78.2% |
| Renter-Occupied Housing Units | 267 | 21.8% |
| Total Occupied Housing Units | 1,224 | 100.0% |
Occupancy by Household Size in Minden
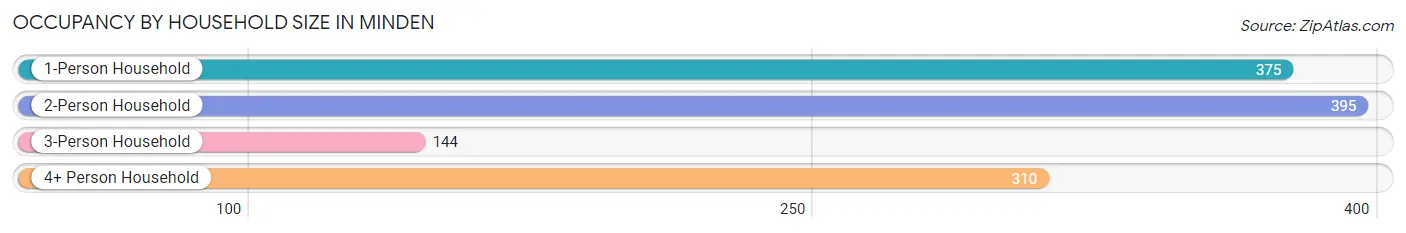
| Household Size | # Housing Units | % Housing Units |
| 1-Person Household | 375 | 30.6% |
| 2-Person Household | 395 | 32.3% |
| 3-Person Household | 144 | 11.8% |
| 4+ Person Household | 310 | 25.3% |
| Total Housing Units | 1,224 | 100.0% |
Occupancy by Ownership by Household Size in Minden
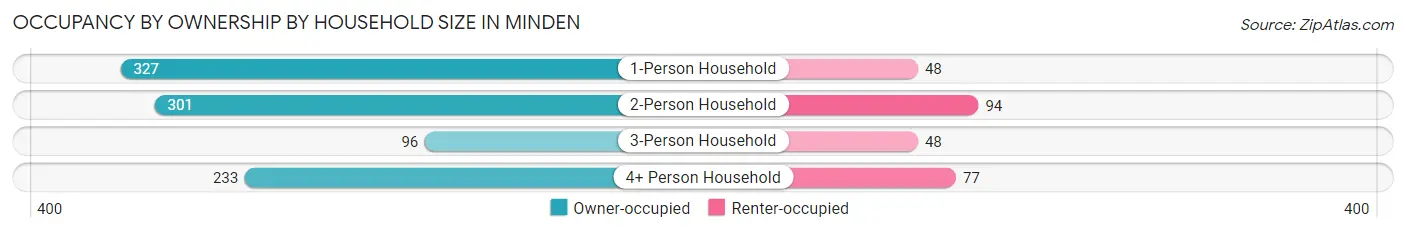
| Household Size | Owner-occupied | Renter-occupied |
| 1-Person Household | 327 (87.2%) | 48 (12.8%) |
| 2-Person Household | 301 (76.2%) | 94 (23.8%) |
| 3-Person Household | 96 (66.7%) | 48 (33.3%) |
| 4+ Person Household | 233 (75.2%) | 77 (24.8%) |
| Total Housing Units | 957 (78.2%) | 267 (21.8%) |
Occupancy by Educational Attainment in Minden
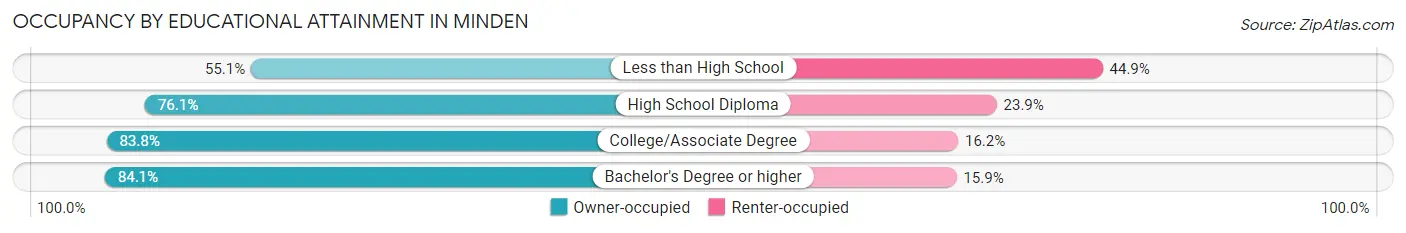
| Household Size | Owner-occupied | Renter-occupied |
| Less than High School | 81 (55.1%) | 66 (44.9%) |
| High School Diploma | 271 (76.1%) | 85 (23.9%) |
| College/Associate Degree | 325 (83.8%) | 63 (16.2%) |
| Bachelor's Degree or higher | 280 (84.1%) | 53 (15.9%) |
Occupancy by Age of Householder in Minden
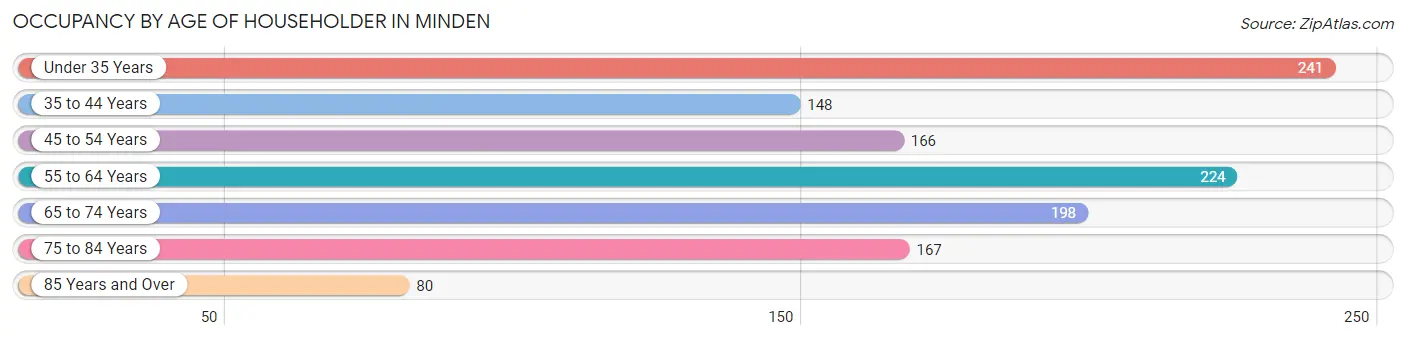
| Age Bracket | # Households | % Households |
| Under 35 Years | 241 | 19.7% |
| 35 to 44 Years | 148 | 12.1% |
| 45 to 54 Years | 166 | 13.6% |
| 55 to 64 Years | 224 | 18.3% |
| 65 to 74 Years | 198 | 16.2% |
| 75 to 84 Years | 167 | 13.6% |
| 85 Years and Over | 80 | 6.5% |
| Total | 1,224 | 100.0% |
Housing Finances in Minden
Median Income by Occupancy in Minden
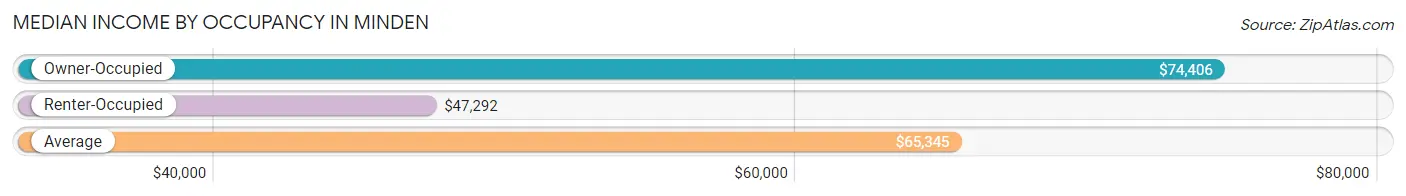
| Occupancy Type | # Households | Median Income |
| Owner-Occupied | 957 (78.2%) | $74,406 |
| Renter-Occupied | 267 (21.8%) | $47,292 |
| Average | 1,224 (100.0%) | $65,345 |
Occupancy by Householder Income Bracket in Minden
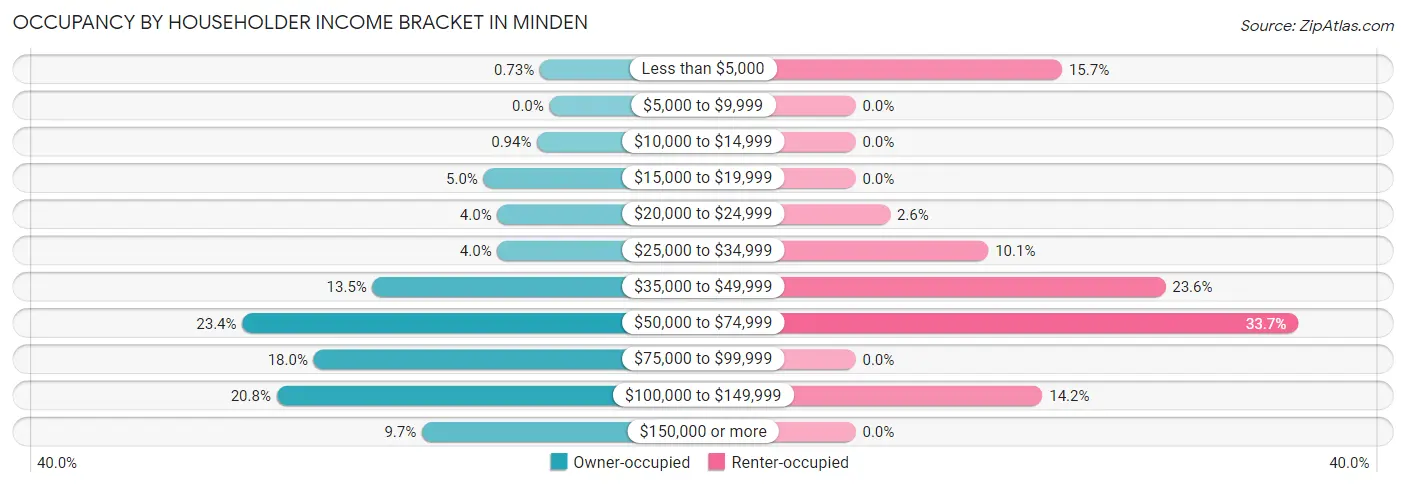
| Income Bracket | Owner-occupied | Renter-occupied |
| Less than $5,000 | 7 (0.7%) | 42 (15.7%) |
| $5,000 to $9,999 | 0 (0.0%) | 0 (0.0%) |
| $10,000 to $14,999 | 9 (0.9%) | 0 (0.0%) |
| $15,000 to $19,999 | 48 (5.0%) | 0 (0.0%) |
| $20,000 to $24,999 | 38 (4.0%) | 7 (2.6%) |
| $25,000 to $34,999 | 38 (4.0%) | 27 (10.1%) |
| $35,000 to $49,999 | 129 (13.5%) | 63 (23.6%) |
| $50,000 to $74,999 | 224 (23.4%) | 90 (33.7%) |
| $75,000 to $99,999 | 172 (18.0%) | 0 (0.0%) |
| $100,000 to $149,999 | 199 (20.8%) | 38 (14.2%) |
| $150,000 or more | 93 (9.7%) | 0 (0.0%) |
| Total | 957 (100.0%) | 267 (100.0%) |
Monthly Housing Cost Tiers in Minden
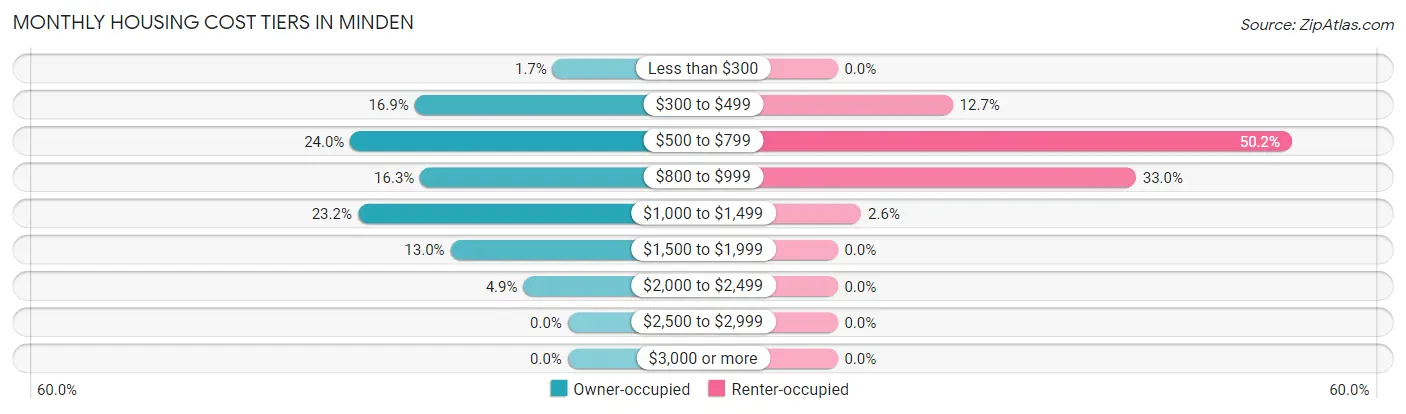
| Monthly Cost | Owner-occupied | Renter-occupied |
| Less than $300 | 16 (1.7%) | 0 (0.0%) |
| $300 to $499 | 162 (16.9%) | 34 (12.7%) |
| $500 to $799 | 230 (24.0%) | 134 (50.2%) |
| $800 to $999 | 156 (16.3%) | 88 (33.0%) |
| $1,000 to $1,499 | 222 (23.2%) | 7 (2.6%) |
| $1,500 to $1,999 | 124 (13.0%) | 0 (0.0%) |
| $2,000 to $2,499 | 47 (4.9%) | 0 (0.0%) |
| $2,500 to $2,999 | 0 (0.0%) | 0 (0.0%) |
| $3,000 or more | 0 (0.0%) | 0 (0.0%) |
| Total | 957 (100.0%) | 267 (100.0%) |
Physical Housing Characteristics in Minden
Housing Structures in Minden
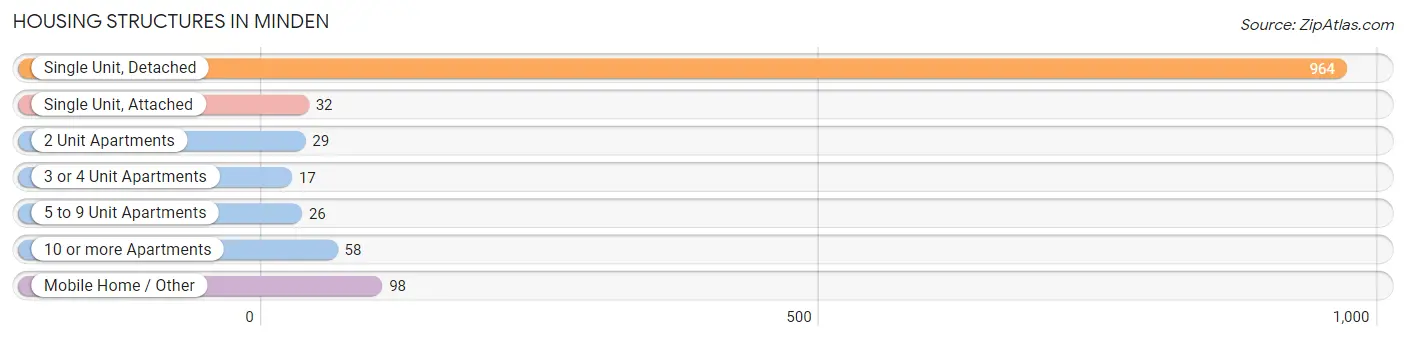
| Structure Type | # Housing Units | % Housing Units |
| Single Unit, Detached | 964 | 78.8% |
| Single Unit, Attached | 32 | 2.6% |
| 2 Unit Apartments | 29 | 2.4% |
| 3 or 4 Unit Apartments | 17 | 1.4% |
| 5 to 9 Unit Apartments | 26 | 2.1% |
| 10 or more Apartments | 58 | 4.7% |
| Mobile Home / Other | 98 | 8.0% |
| Total | 1,224 | 100.0% |
Housing Structures by Occupancy in Minden
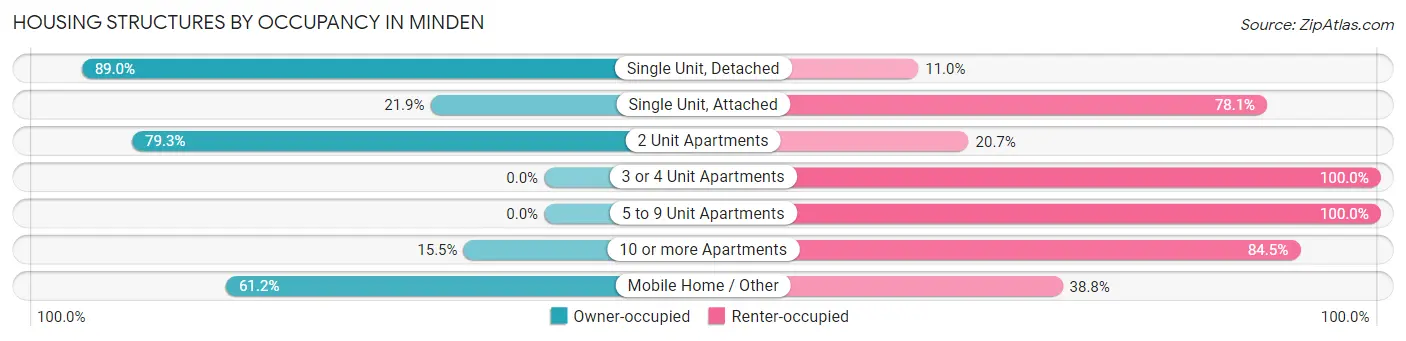
| Structure Type | Owner-occupied | Renter-occupied |
| Single Unit, Detached | 858 (89.0%) | 106 (11.0%) |
| Single Unit, Attached | 7 (21.9%) | 25 (78.1%) |
| 2 Unit Apartments | 23 (79.3%) | 6 (20.7%) |
| 3 or 4 Unit Apartments | 0 (0.0%) | 17 (100.0%) |
| 5 to 9 Unit Apartments | 0 (0.0%) | 26 (100.0%) |
| 10 or more Apartments | 9 (15.5%) | 49 (84.5%) |
| Mobile Home / Other | 60 (61.2%) | 38 (38.8%) |
| Total | 957 (78.2%) | 267 (21.8%) |
Housing Structures by Number of Rooms in Minden
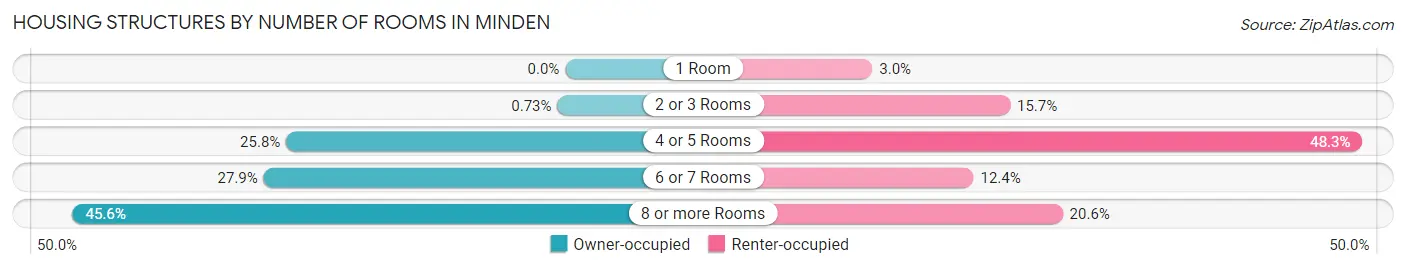
| Number of Rooms | Owner-occupied | Renter-occupied |
| 1 Room | 0 (0.0%) | 8 (3.0%) |
| 2 or 3 Rooms | 7 (0.7%) | 42 (15.7%) |
| 4 or 5 Rooms | 247 (25.8%) | 129 (48.3%) |
| 6 or 7 Rooms | 267 (27.9%) | 33 (12.4%) |
| 8 or more Rooms | 436 (45.6%) | 55 (20.6%) |
| Total | 957 (100.0%) | 267 (100.0%) |
Housing Structure by Heating Type in Minden
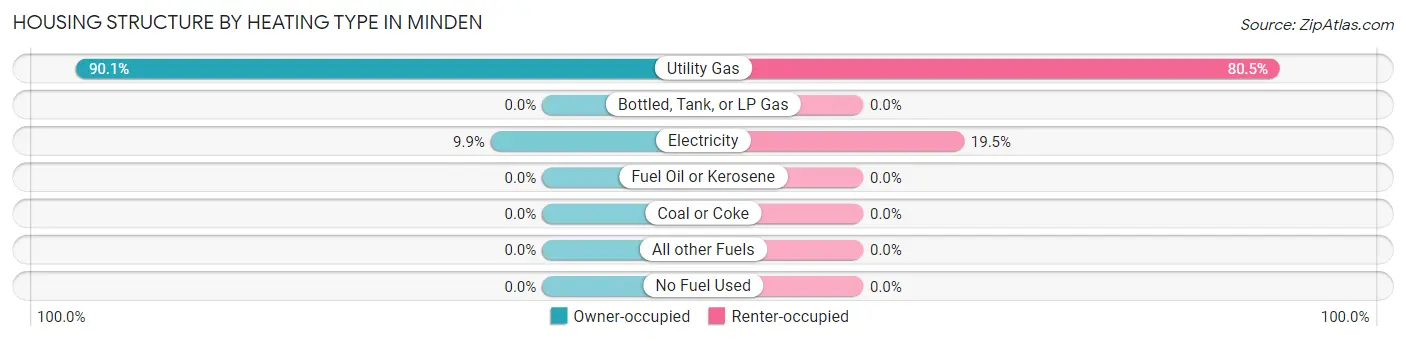
| Heating Type | Owner-occupied | Renter-occupied |
| Utility Gas | 862 (90.1%) | 215 (80.5%) |
| Bottled, Tank, or LP Gas | 0 (0.0%) | 0 (0.0%) |
| Electricity | 95 (9.9%) | 52 (19.5%) |
| Fuel Oil or Kerosene | 0 (0.0%) | 0 (0.0%) |
| Coal or Coke | 0 (0.0%) | 0 (0.0%) |
| All other Fuels | 0 (0.0%) | 0 (0.0%) |
| No Fuel Used | 0 (0.0%) | 0 (0.0%) |
| Total | 957 (100.0%) | 267 (100.0%) |
Household Vehicle Usage in Minden
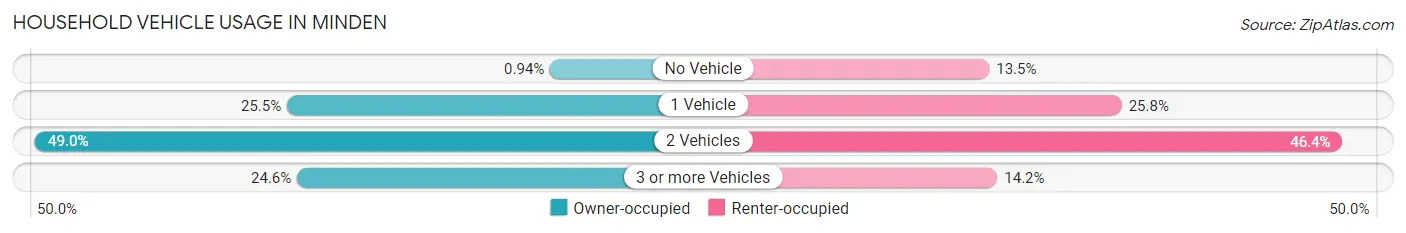
| Vehicles per Household | Owner-occupied | Renter-occupied |
| No Vehicle | 9 (0.9%) | 36 (13.5%) |
| 1 Vehicle | 244 (25.5%) | 69 (25.8%) |
| 2 Vehicles | 469 (49.0%) | 124 (46.4%) |
| 3 or more Vehicles | 235 (24.6%) | 38 (14.2%) |
| Total | 957 (100.0%) | 267 (100.0%) |
Real Estate & Mortgages in Minden
Real Estate and Mortgage Overview in Minden
| Characteristic | Without Mortgage | With Mortgage |
| Housing Units | 492 | 465 |
| Median Property Value | $187,200 | $170,800 |
| Median Household Income | $58,382 | $74 |
| Monthly Housing Costs | $628 | $0 |
| Real Estate Taxes | $2,323 | $14 |
Property Value by Mortgage Status in Minden
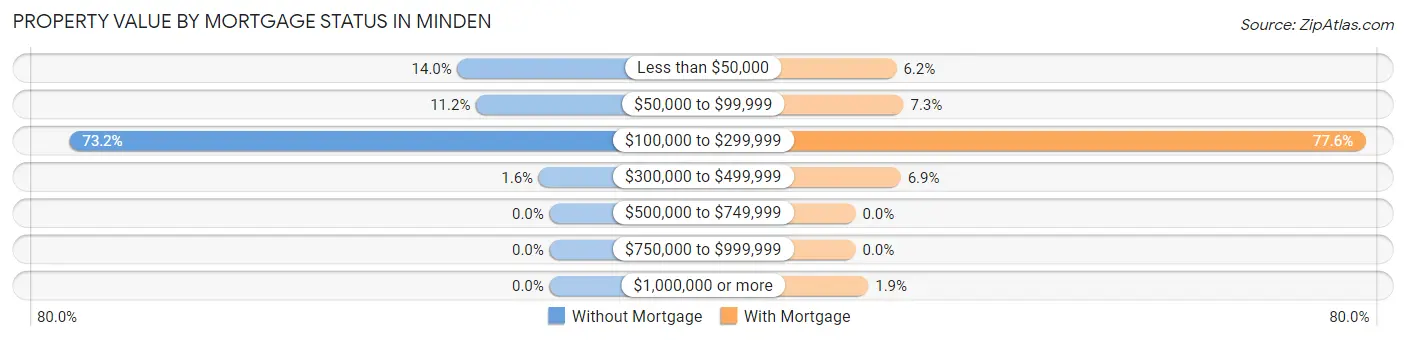
| Property Value | Without Mortgage | With Mortgage |
| Less than $50,000 | 69 (14.0%) | 29 (6.2%) |
| $50,000 to $99,999 | 55 (11.2%) | 34 (7.3%) |
| $100,000 to $299,999 | 360 (73.2%) | 361 (77.6%) |
| $300,000 to $499,999 | 8 (1.6%) | 32 (6.9%) |
| $500,000 to $749,999 | 0 (0.0%) | 0 (0.0%) |
| $750,000 to $999,999 | 0 (0.0%) | 0 (0.0%) |
| $1,000,000 or more | 0 (0.0%) | 9 (1.9%) |
| Total | 492 (100.0%) | 465 (100.0%) |
Household Income by Mortgage Status in Minden
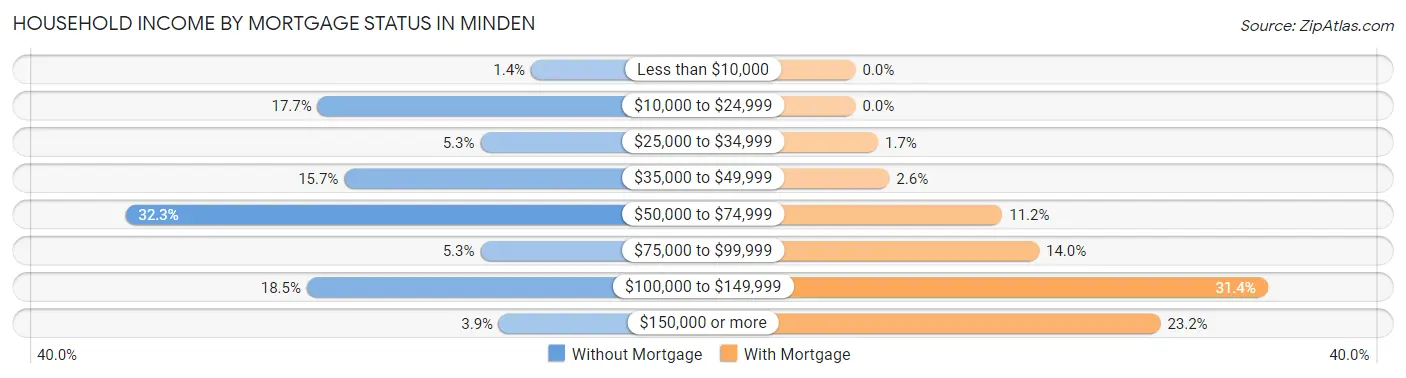
| Household Income | Without Mortgage | With Mortgage |
| Less than $10,000 | 7 (1.4%) | 0 (0.0%) |
| $10,000 to $24,999 | 87 (17.7%) | 0 (0.0%) |
| $25,000 to $34,999 | 26 (5.3%) | 8 (1.7%) |
| $35,000 to $49,999 | 77 (15.7%) | 12 (2.6%) |
| $50,000 to $74,999 | 159 (32.3%) | 52 (11.2%) |
| $75,000 to $99,999 | 26 (5.3%) | 65 (14.0%) |
| $100,000 to $149,999 | 91 (18.5%) | 146 (31.4%) |
| $150,000 or more | 19 (3.9%) | 108 (23.2%) |
| Total | 492 (100.0%) | 465 (100.0%) |
Property Value to Household Income Ratio in Minden
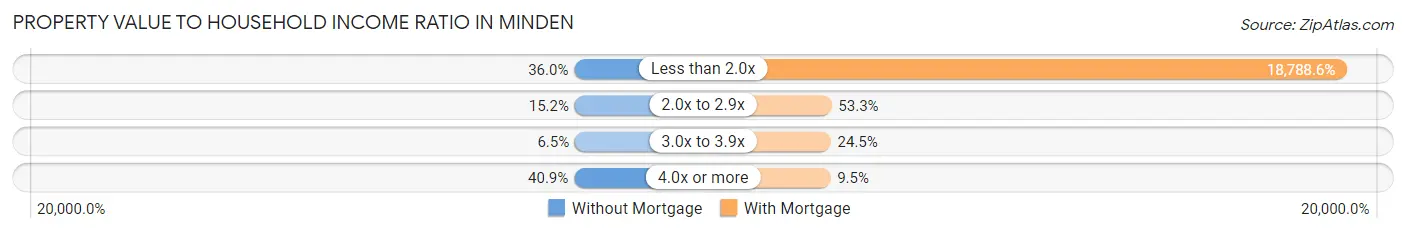
| Value-to-Income Ratio | Without Mortgage | With Mortgage |
| Less than 2.0x | 177 (36.0%) | 87,367 (18,788.6%) |
| 2.0x to 2.9x | 75 (15.2%) | 248 (53.3%) |
| 3.0x to 3.9x | 32 (6.5%) | 114 (24.5%) |
| 4.0x or more | 201 (40.8%) | 44 (9.5%) |
| Total | 492 (100.0%) | 465 (100.0%) |
Real Estate Taxes by Mortgage Status in Minden
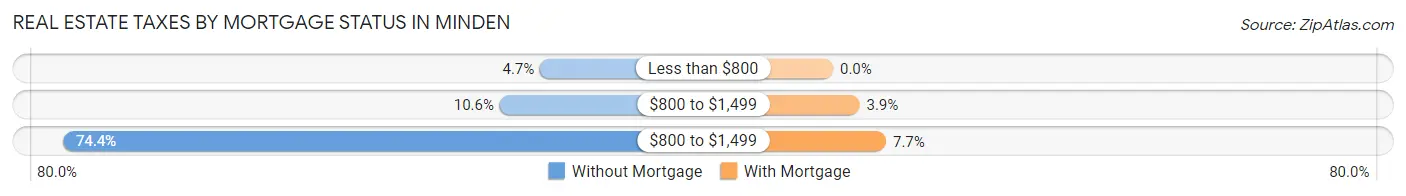
| Property Taxes | Without Mortgage | With Mortgage |
| Less than $800 | 23 (4.7%) | 0 (0.0%) |
| $800 to $1,499 | 52 (10.6%) | 18 (3.9%) |
| $800 to $1,499 | 366 (74.4%) | 36 (7.7%) |
| Total | 492 (100.0%) | 465 (100.0%) |
Health & Disability in Minden
Health Insurance Coverage by Age in Minden
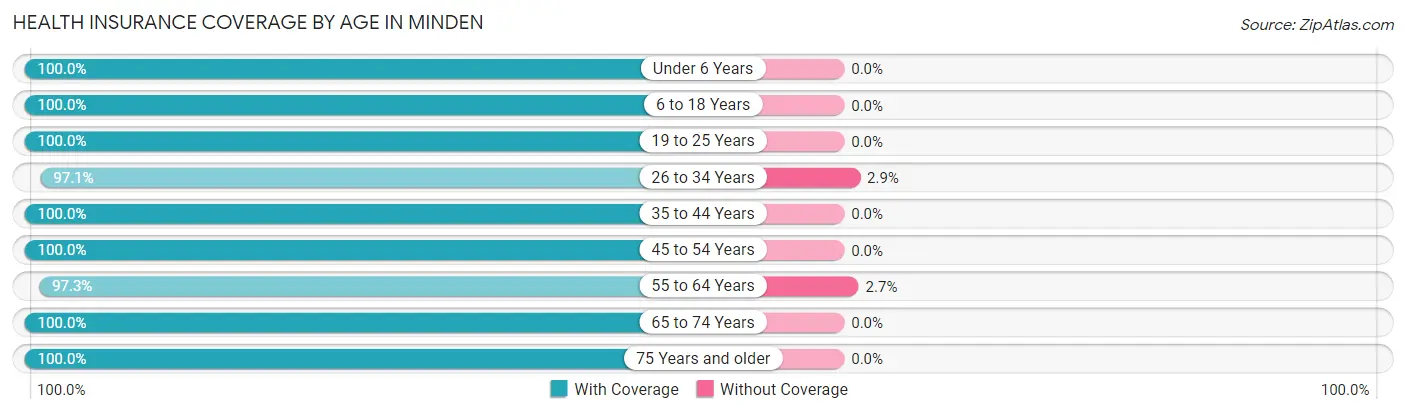
| Age Bracket | With Coverage | Without Coverage |
| Under 6 Years | 216 (100.0%) | 0 (0.0%) |
| 6 to 18 Years | 691 (100.0%) | 0 (0.0%) |
| 19 to 25 Years | 267 (100.0%) | 0 (0.0%) |
| 26 to 34 Years | 297 (97.1%) | 9 (2.9%) |
| 35 to 44 Years | 293 (100.0%) | 0 (0.0%) |
| 45 to 54 Years | 252 (100.0%) | 0 (0.0%) |
| 55 to 64 Years | 327 (97.3%) | 9 (2.7%) |
| 65 to 74 Years | 268 (100.0%) | 0 (0.0%) |
| 75 Years and older | 405 (100.0%) | 0 (0.0%) |
| Total | 3,016 (99.4%) | 18 (0.6%) |
Health Insurance Coverage by Citizenship Status in Minden
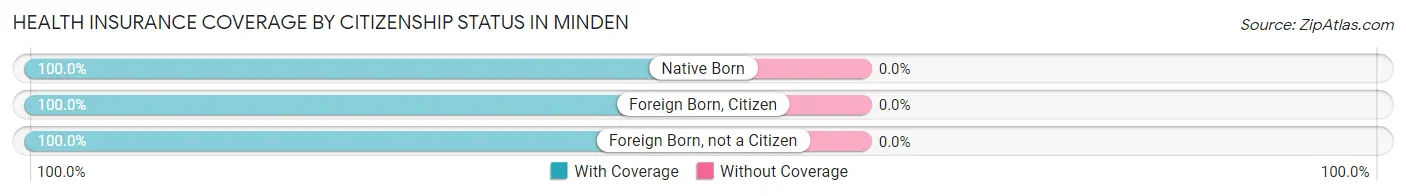
| Citizenship Status | With Coverage | Without Coverage |
| Native Born | 216 (100.0%) | 0 (0.0%) |
| Foreign Born, Citizen | 691 (100.0%) | 0 (0.0%) |
| Foreign Born, not a Citizen | 267 (100.0%) | 0 (0.0%) |
Health Insurance Coverage by Household Income in Minden
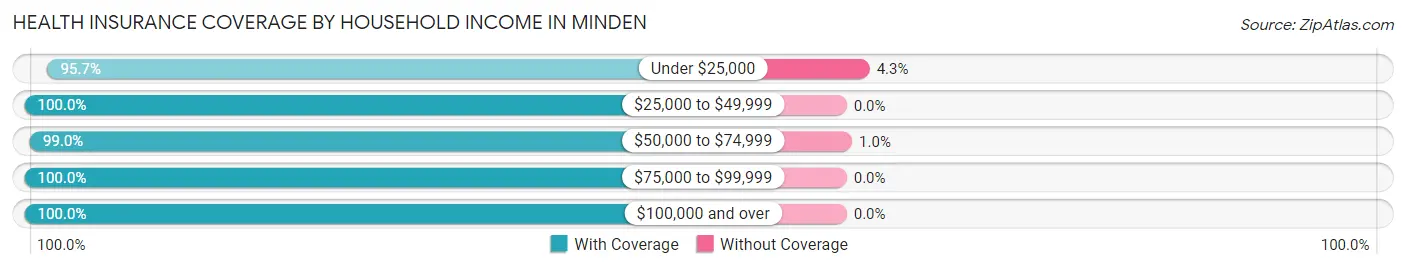
| Household Income | With Coverage | Without Coverage |
| Under $25,000 | 201 (95.7%) | 9 (4.3%) |
| $25,000 to $49,999 | 471 (100.0%) | 0 (0.0%) |
| $50,000 to $74,999 | 891 (99.0%) | 9 (1.0%) |
| $75,000 to $99,999 | 677 (100.0%) | 0 (0.0%) |
| $100,000 and over | 776 (100.0%) | 0 (0.0%) |
Public vs Private Health Insurance Coverage by Age in Minden
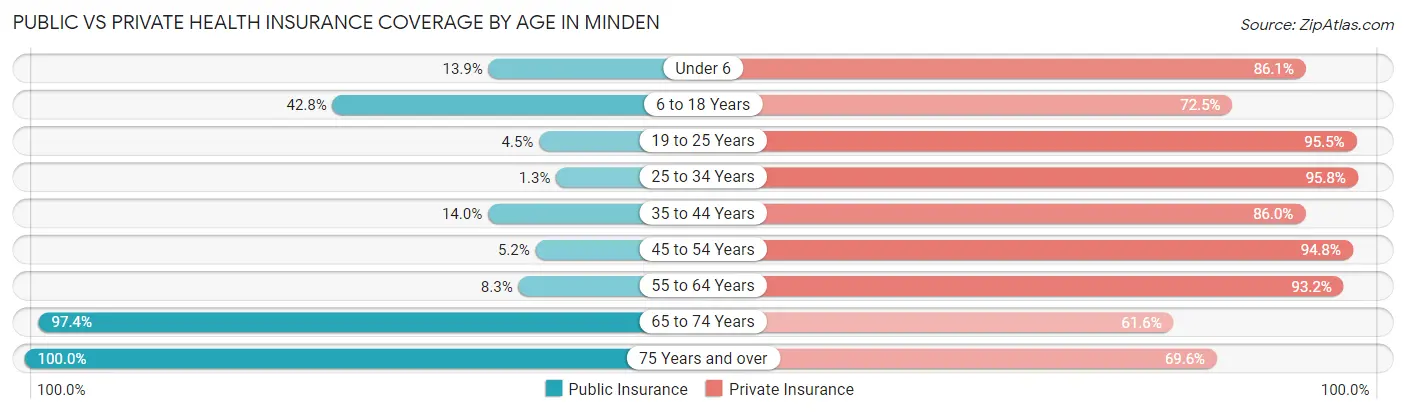
| Age Bracket | Public Insurance | Private Insurance |
| Under 6 | 30 (13.9%) | 186 (86.1%) |
| 6 to 18 Years | 296 (42.8%) | 501 (72.5%) |
| 19 to 25 Years | 12 (4.5%) | 255 (95.5%) |
| 25 to 34 Years | 4 (1.3%) | 293 (95.8%) |
| 35 to 44 Years | 41 (14.0%) | 252 (86.0%) |
| 45 to 54 Years | 13 (5.2%) | 239 (94.8%) |
| 55 to 64 Years | 28 (8.3%) | 313 (93.1%) |
| 65 to 74 Years | 261 (97.4%) | 165 (61.6%) |
| 75 Years and over | 405 (100.0%) | 282 (69.6%) |
| Total | 1,090 (35.9%) | 2,486 (81.9%) |
Disability Status by Sex by Age in Minden
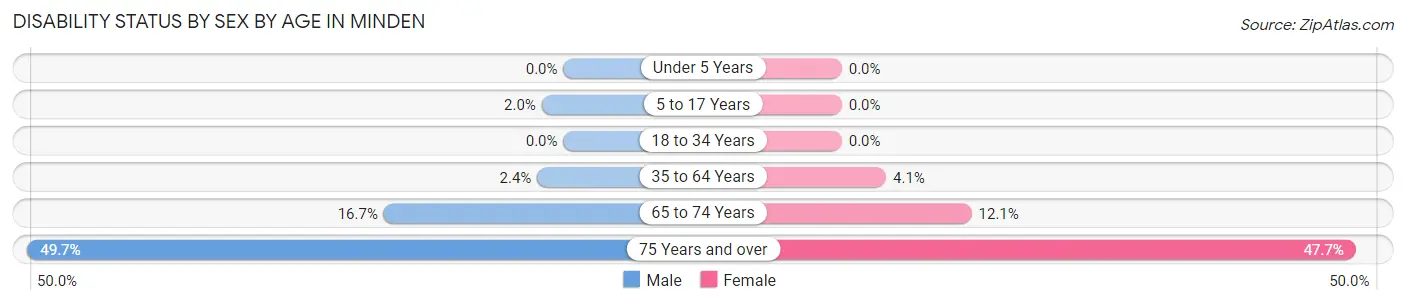
| Age Bracket | Male | Female |
| Under 5 Years | 0 (0.0%) | 0 (0.0%) |
| 5 to 17 Years | 6 (2.0%) | 0 (0.0%) |
| 18 to 34 Years | 0 (0.0%) | 0 (0.0%) |
| 35 to 64 Years | 9 (2.4%) | 21 (4.1%) |
| 65 to 74 Years | 17 (16.7%) | 20 (12.0%) |
| 75 Years and over | 94 (49.7%) | 103 (47.7%) |
Disability Class by Sex by Age in Minden
Disability Class: Hearing Difficulty
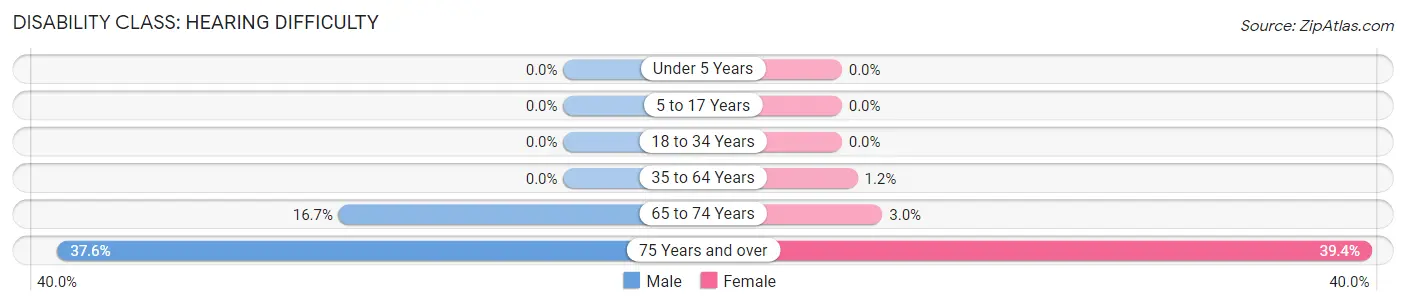
| Age Bracket | Male | Female |
| Under 5 Years | 0 (0.0%) | 0 (0.0%) |
| 5 to 17 Years | 0 (0.0%) | 0 (0.0%) |
| 18 to 34 Years | 0 (0.0%) | 0 (0.0%) |
| 35 to 64 Years | 0 (0.0%) | 6 (1.2%) |
| 65 to 74 Years | 17 (16.7%) | 5 (3.0%) |
| 75 Years and over | 71 (37.6%) | 85 (39.4%) |
Disability Class: Vision Difficulty
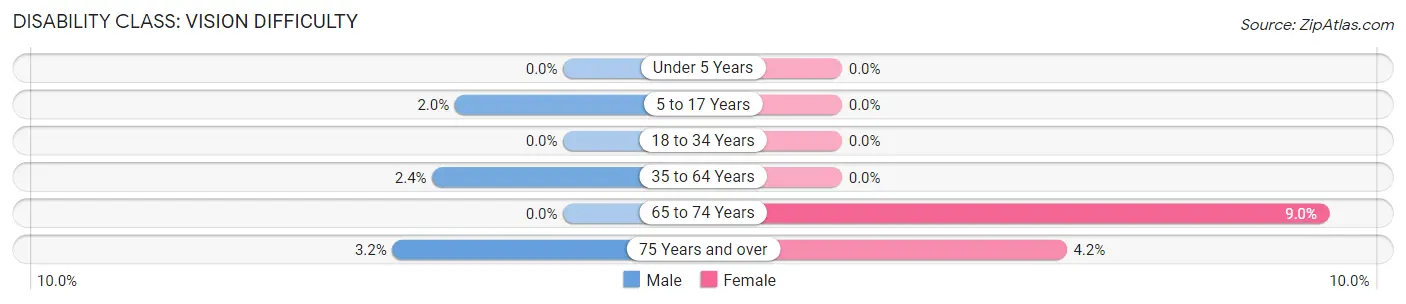
| Age Bracket | Male | Female |
| Under 5 Years | 0 (0.0%) | 0 (0.0%) |
| 5 to 17 Years | 6 (2.0%) | 0 (0.0%) |
| 18 to 34 Years | 0 (0.0%) | 0 (0.0%) |
| 35 to 64 Years | 9 (2.4%) | 0 (0.0%) |
| 65 to 74 Years | 0 (0.0%) | 15 (9.0%) |
| 75 Years and over | 6 (3.2%) | 9 (4.2%) |
Disability Class: Cognitive Difficulty
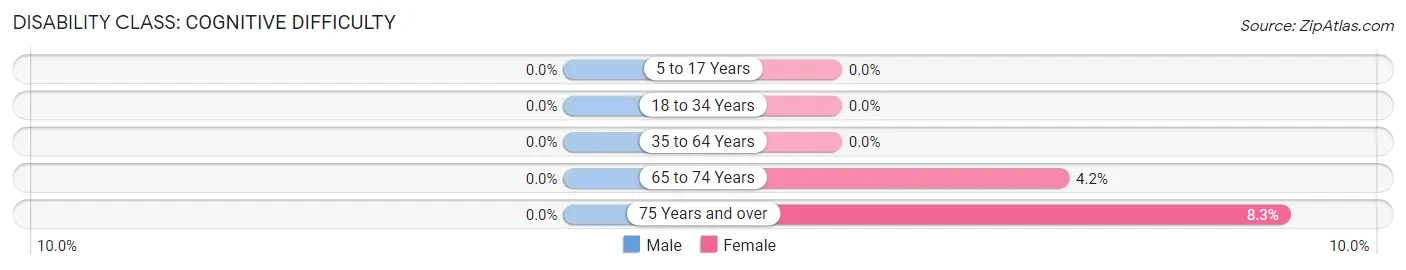
| Age Bracket | Male | Female |
| 5 to 17 Years | 0 (0.0%) | 0 (0.0%) |
| 18 to 34 Years | 0 (0.0%) | 0 (0.0%) |
| 35 to 64 Years | 0 (0.0%) | 0 (0.0%) |
| 65 to 74 Years | 0 (0.0%) | 7 (4.2%) |
| 75 Years and over | 0 (0.0%) | 18 (8.3%) |
Disability Class: Ambulatory Difficulty
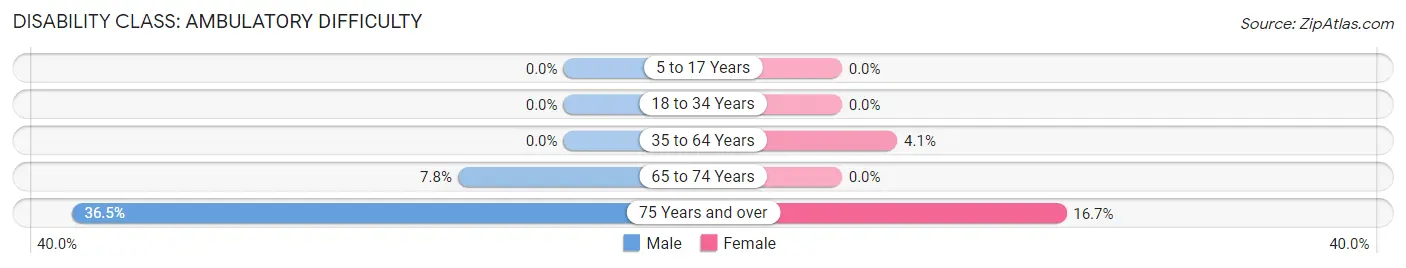
| Age Bracket | Male | Female |
| 5 to 17 Years | 0 (0.0%) | 0 (0.0%) |
| 18 to 34 Years | 0 (0.0%) | 0 (0.0%) |
| 35 to 64 Years | 0 (0.0%) | 21 (4.1%) |
| 65 to 74 Years | 8 (7.8%) | 0 (0.0%) |
| 75 Years and over | 69 (36.5%) | 36 (16.7%) |
Disability Class: Self-Care Difficulty

| Age Bracket | Male | Female |
| 5 to 17 Years | 0 (0.0%) | 0 (0.0%) |
| 18 to 34 Years | 0 (0.0%) | 0 (0.0%) |
| 35 to 64 Years | 0 (0.0%) | 0 (0.0%) |
| 65 to 74 Years | 0 (0.0%) | 7 (4.2%) |
| 75 Years and over | 0 (0.0%) | 18 (8.3%) |
Technology Access in Minden
Computing Device Access in Minden
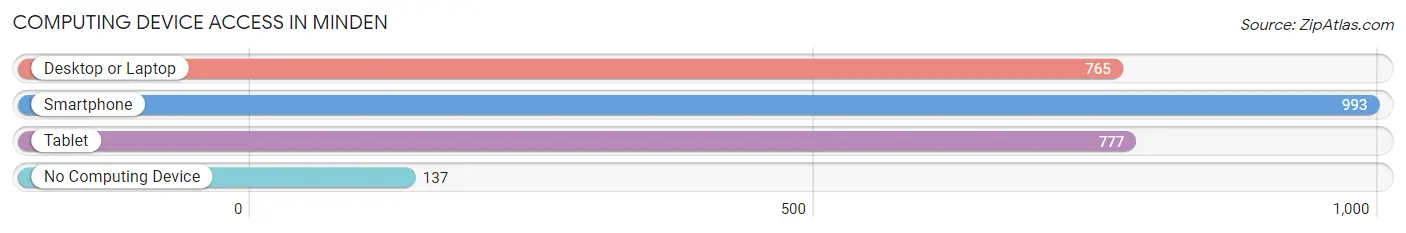
| Device Type | # Households | % Households |
| Desktop or Laptop | 765 | 62.5% |
| Smartphone | 993 | 81.1% |
| Tablet | 777 | 63.5% |
| No Computing Device | 137 | 11.2% |
| Total | 1,224 | 100.0% |
Internet Access in Minden
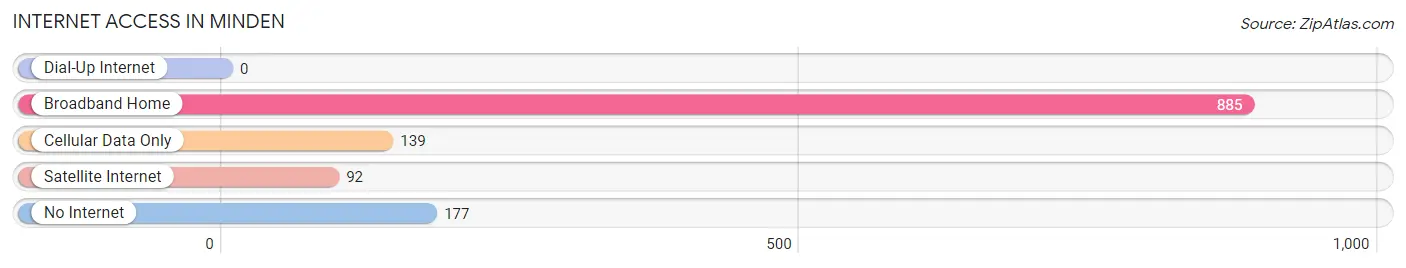
| Internet Type | # Households | % Households |
| Dial-Up Internet | 0 | 0.0% |
| Broadband Home | 885 | 72.3% |
| Cellular Data Only | 139 | 11.4% |
| Satellite Internet | 92 | 7.5% |
| No Internet | 177 | 14.5% |
| Total | 1,224 | 100.0% |
Minden Summary
History
The town of Minden, Nebraska is located in Kearney County in the south-central part of the state. It was founded in 1871 by a group of settlers from Minden, Germany, who were looking for a place to settle and start a new life. The town was named after the German city of Minden, and the settlers brought with them many of the customs and traditions of their homeland.
The first settlers in Minden were mostly farmers, and the town quickly grew to become an important agricultural center. The town was incorporated in 1873, and the first mayor was elected in 1874. The town was also home to a number of businesses, including a flour mill, a sawmill, a blacksmith shop, and a general store.
In the late 19th century, Minden was a thriving community with a population of over 1,000 people. The town was home to a number of churches, schools, and other businesses. The town also had a number of newspapers, including the Minden Herald, which was published from 1876 to 1891.
In the early 20th century, Minden continued to grow and prosper. The town was home to a number of businesses, including a bank, a hotel, a movie theater, and a number of stores. The town also had a number of churches, schools, and other organizations.
In the 1950s, Minden began to decline as many of the businesses and industries in the town closed or moved away. The population of the town also began to decline, and by the 1970s, the population had dropped to just over 500 people.
Geography
Minden is located in south-central Nebraska, in Kearney County. The town is situated on the banks of the Platte River, and is surrounded by rolling hills and farmland. The town is located about 30 miles south of Grand Island, and about 50 miles north of Lincoln.
The climate in Minden is generally mild, with hot summers and cold winters. The average temperature in the summer is around 80 degrees Fahrenheit, and the average temperature in the winter is around 20 degrees Fahrenheit.
Economy
The economy of Minden is largely based on agriculture. The town is home to a number of farms, and the surrounding area is known for its production of corn, soybeans, and wheat. The town is also home to a number of businesses, including a bank, a hotel, a movie theater, and a number of stores.
Demographics
As of the 2010 census, the population of Minden was 545 people. The racial makeup of the town was 97.3% White, 0.2% African American, 0.2% Native American, 0.4% Asian, 0.2% from other races, and 1.9% from two or more races. Hispanic or Latino of any race were 1.3% of the population.
The median income for a household in Minden was $41,250, and the median income for a family was $45,000. The per capita income for the town was $18,945. About 8.3% of families and 10.2% of the population were below the poverty line, including 11.3% of those under age 18 and 8.3% of those age 65 or over.
Common Questions
What is Per Capita Income in Minden?
Per Capita income in Minden is $33,225.
What is the Median Family Income in Minden?
Median Family Income in Minden is $72,333.
What is the Median Household income in Minden?
Median Household Income in Minden is $65,345.
What is Income or Wage Gap in Minden?
Income or Wage Gap in Minden is 31.5%.
Women in Minden earn 68.5 cents for every dollar earned by a man.
What is Inequality or Gini Index in Minden?
Inequality or Gini Index in Minden is 0.42.
What is the Total Population of Minden?
Total Population of Minden is 3,099.
What is the Total Male Population of Minden?
Total Male Population of Minden is 1,408.
What is the Total Female Population of Minden?
Total Female Population of Minden is 1,691.
What is the Ratio of Males per 100 Females in Minden?
There are 83.26 Males per 100 Females in Minden.
What is the Ratio of Females per 100 Males in Minden?
There are 120.10 Females per 100 Males in Minden.
What is the Median Population Age in Minden?
Median Population Age in Minden is 37.0 Years.
What is the Average Family Size in Minden
Average Family Size in Minden is 3.0 People.
What is the Average Household Size in Minden
Average Household Size in Minden is 2.5 People.
How Large is the Labor Force in Minden?
There are 1,544 People in the Labor Forcein in Minden.
What is the Percentage of People in the Labor Force in Minden?
65.4% of People are in the Labor Force in Minden.