Howells, NE Map & Demographics
Howells Map
Howells Overview
$31,783
PER CAPITA INCOME
$86,000
AVG FAMILY INCOME
$68,264
AVG HOUSEHOLD INCOME
28.6%
WAGE / INCOME GAP [ % ]
71.4¢/ $1
WAGE / INCOME GAP [ $ ]
0.41
INEQUALITY / GINI INDEX
699
TOTAL POPULATION
326
MALE POPULATION
373
FEMALE POPULATION
87.40
MALES / 100 FEMALES
114.42
FEMALES / 100 MALES
43.7
MEDIAN AGE
3.2
AVG FAMILY SIZE
2.4
AVG HOUSEHOLD SIZE
348
LABOR FORCE [ PEOPLE ]
62.0%
PERCENT IN LABOR FORCE
Howells Zip Codes
Howells Area Codes
Income in Howells
Income Overview in Howells
Per Capita Income in Howells is $31,783, while median incomes of families and households are $86,000 and $68,264 respectively.
| Characteristic | Number | Measure |
| Per Capita Income | 699 | $31,783 |
| Median Family Income | 174 | $86,000 |
| Mean Family Income | 174 | $99,931 |
| Median Household Income | 287 | $68,264 |
| Mean Household Income | 287 | $76,608 |
| Income Deficit | 174 | $0 |
| Wage / Income Gap (%) | 699 | 28.61% |
| Wage / Income Gap ($) | 699 | 71.39¢ per $1 |
| Gini / Inequality Index | 699 | 0.41 |
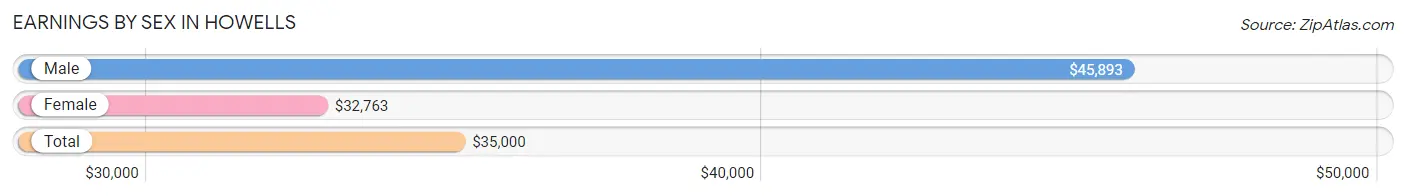
Earnings by Sex in Howells
Average Earnings in Howells are $35,000, $45,893 for men and $32,763 for women, a difference of 28.6%.
| Sex | Number | Average Earnings |
| Male | 216 (57.1%) | $45,893 |
| Female | 162 (42.9%) | $32,763 |
| Total | 378 (100.0%) | $35,000 |
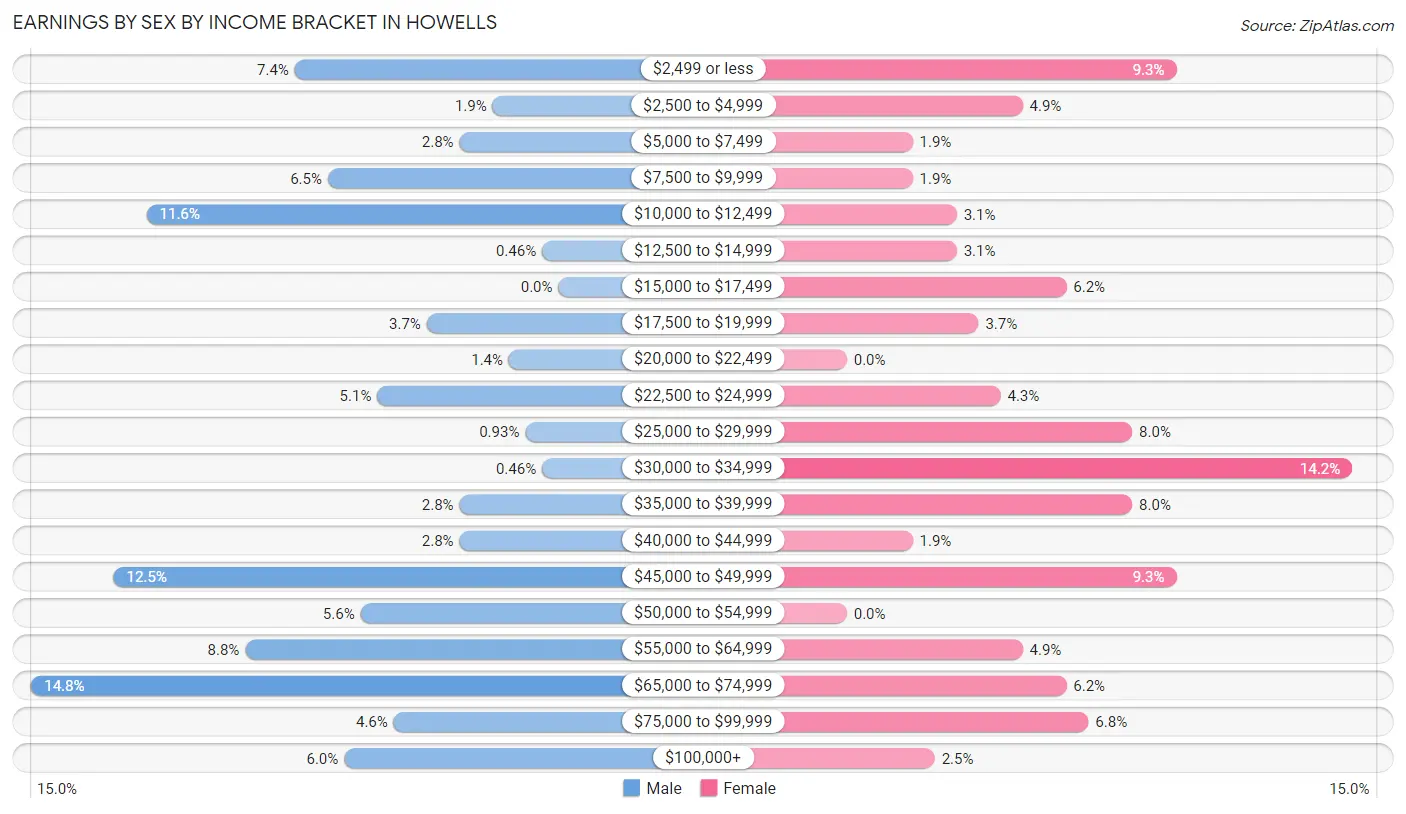
Earnings by Sex by Income Bracket in Howells
The most common earnings brackets in Howells are $65,000 to $74,999 for men (32 | 14.8%) and $30,000 to $34,999 for women (23 | 14.2%).
| Income | Male | Female |
| $2,499 or less | 16 (7.4%) | 15 (9.3%) |
| $2,500 to $4,999 | 4 (1.8%) | 8 (4.9%) |
| $5,000 to $7,499 | 6 (2.8%) | 3 (1.8%) |
| $7,500 to $9,999 | 14 (6.5%) | 3 (1.8%) |
| $10,000 to $12,499 | 25 (11.6%) | 5 (3.1%) |
| $12,500 to $14,999 | 1 (0.5%) | 5 (3.1%) |
| $15,000 to $17,499 | 0 (0.0%) | 10 (6.2%) |
| $17,500 to $19,999 | 8 (3.7%) | 6 (3.7%) |
| $20,000 to $22,499 | 3 (1.4%) | 0 (0.0%) |
| $22,500 to $24,999 | 11 (5.1%) | 7 (4.3%) |
| $25,000 to $29,999 | 2 (0.9%) | 13 (8.0%) |
| $30,000 to $34,999 | 1 (0.5%) | 23 (14.2%) |
| $35,000 to $39,999 | 6 (2.8%) | 13 (8.0%) |
| $40,000 to $44,999 | 6 (2.8%) | 3 (1.8%) |
| $45,000 to $49,999 | 27 (12.5%) | 15 (9.3%) |
| $50,000 to $54,999 | 12 (5.6%) | 0 (0.0%) |
| $55,000 to $64,999 | 19 (8.8%) | 8 (4.9%) |
| $65,000 to $74,999 | 32 (14.8%) | 10 (6.2%) |
| $75,000 to $99,999 | 10 (4.6%) | 11 (6.8%) |
| $100,000+ | 13 (6.0%) | 4 (2.5%) |
| Total | 216 (100.0%) | 162 (100.0%) |
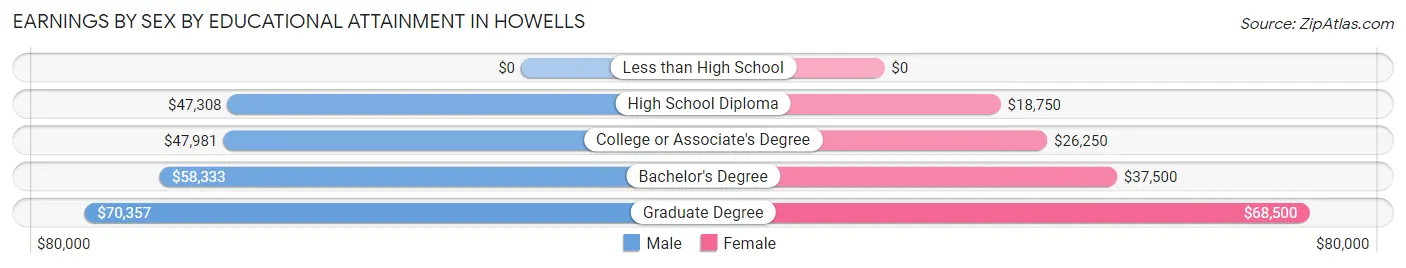
Earnings by Sex by Educational Attainment in Howells
Average earnings in Howells are $49,231 for men and $33,618 for women, a difference of 31.7%. Men with an educational attainment of graduate degree enjoy the highest average annual earnings of $70,357, while those with high school diploma education earn the least with $47,308. Women with an educational attainment of graduate degree earn the most with the average annual earnings of $68,500, while those with high school diploma education have the smallest earnings of $18,750.
| Educational Attainment | Male Income | Female Income |
| Less than High School | - | - |
| High School Diploma | $47,308 | $18,750 |
| College or Associate's Degree | $47,981 | $26,250 |
| Bachelor's Degree | $58,333 | $37,500 |
| Graduate Degree | $70,357 | $68,500 |
| Total | $49,231 | $33,618 |
Family Income in Howells
Family Income Brackets in Howells
According to the Howells family income data, there are 55 families falling into the $50,000 to $74,999 income range, which is the most common income bracket and makes up 31.6% of all families.
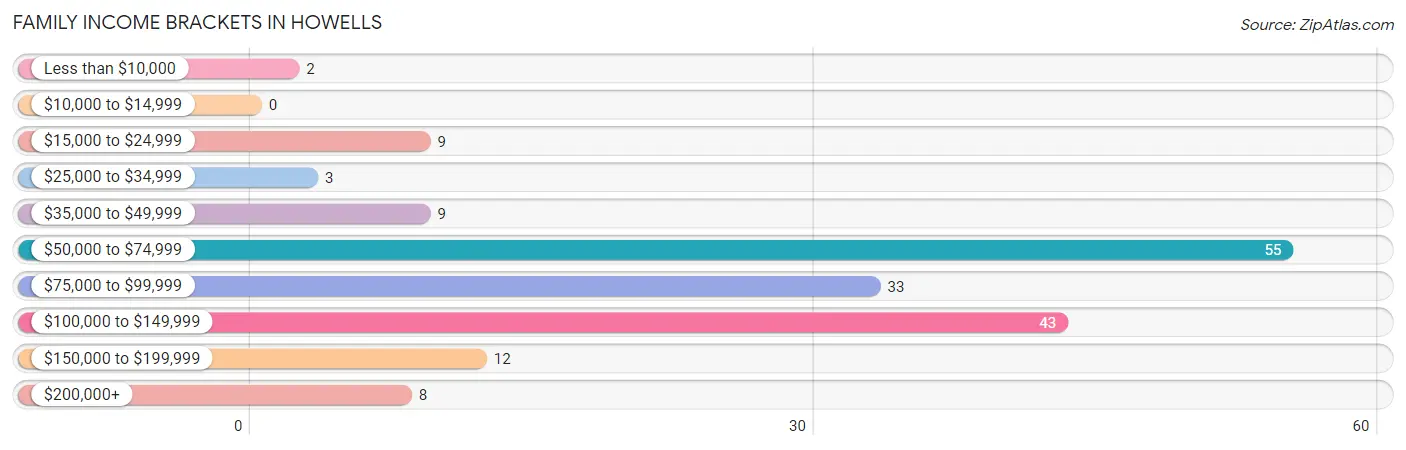
| Income Bracket | # Families | % Families |
| Less than $10,000 | 2 | 1.1% |
| $10,000 to $14,999 | 0 | 0.0% |
| $15,000 to $24,999 | 9 | 5.2% |
| $25,000 to $34,999 | 3 | 1.7% |
| $35,000 to $49,999 | 9 | 5.2% |
| $50,000 to $74,999 | 55 | 31.6% |
| $75,000 to $99,999 | 33 | 19.0% |
| $100,000 to $149,999 | 43 | 24.7% |
| $150,000 to $199,999 | 12 | 6.9% |
| $200,000+ | 8 | 4.6% |
Family Income by Famaliy Size in Howells
6-person families (6 | 3.5%) account for the highest median family income in Howells with $147,500 per family, while 2-person families (86 | 49.4%) have the highest median income of $36,000 per family member.
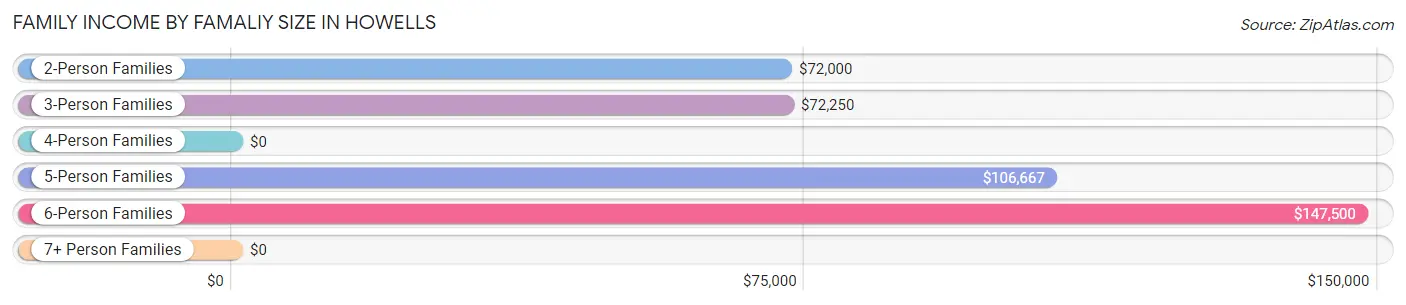
| Income Bracket | # Families | Median Income |
| 2-Person Families | 86 (49.4%) | $72,000 |
| 3-Person Families | 50 (28.7%) | $72,250 |
| 4-Person Families | 4 (2.3%) | $0 |
| 5-Person Families | 28 (16.1%) | $106,667 |
| 6-Person Families | 6 (3.5%) | $147,500 |
| 7+ Person Families | 0 (0.0%) | $0 |
| Total | 174 (100.0%) | $86,000 |
Family Income by Number of Earners in Howells
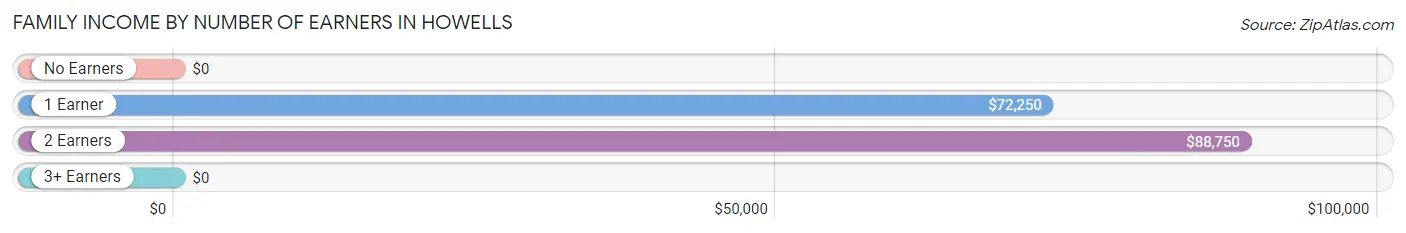
| Number of Earners | # Families | Median Income |
| No Earners | 20 (11.5%) | $0 |
| 1 Earner | 31 (17.8%) | $72,250 |
| 2 Earners | 98 (56.3%) | $88,750 |
| 3+ Earners | 25 (14.4%) | $0 |
| Total | 174 (100.0%) | $86,000 |
Household Income in Howells
Household Income Brackets in Howells
With 67 households falling in the category, the $50,000 to $74,999 income range is the most frequent in Howells, accounting for 23.3% of all households. In contrast, only 8 households (2.8%) fall into the $200,000+ income bracket, making it the least populous group.
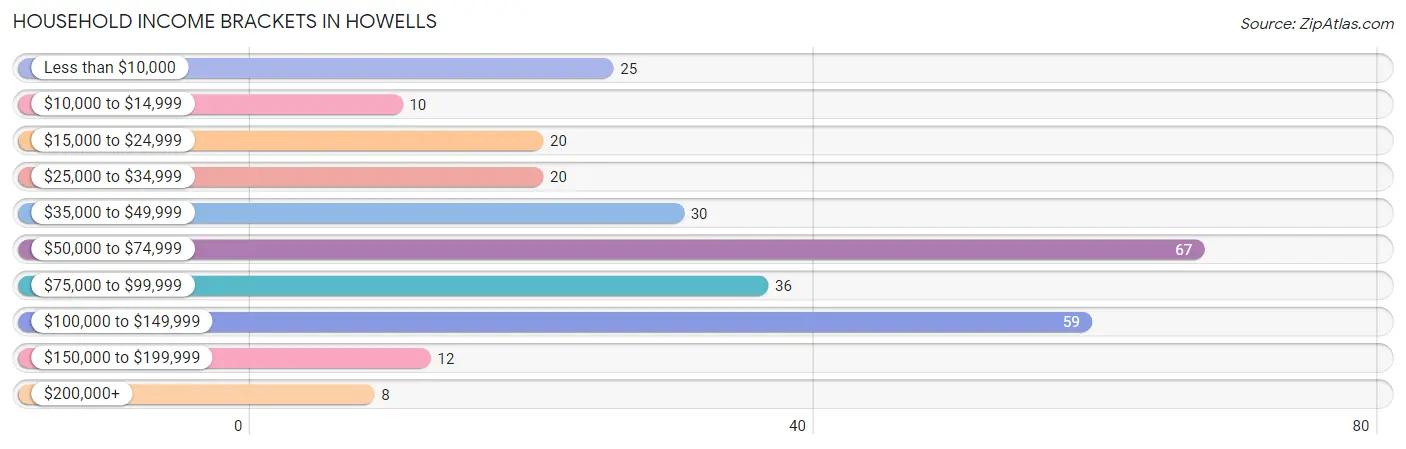
| Income Bracket | # Households | % Households |
| Less than $10,000 | 25 | 8.7% |
| $10,000 to $14,999 | 10 | 3.5% |
| $15,000 to $24,999 | 20 | 7.0% |
| $25,000 to $34,999 | 20 | 7.0% |
| $35,000 to $49,999 | 30 | 10.5% |
| $50,000 to $74,999 | 67 | 23.3% |
| $75,000 to $99,999 | 36 | 12.5% |
| $100,000 to $149,999 | 59 | 20.6% |
| $150,000 to $199,999 | 12 | 4.2% |
| $200,000+ | 8 | 2.8% |
Household Income by Householder Age in Howells
The median household income in Howells is $68,264, with the highest median household income of $95,313 found in the 25 to 44 years age bracket for the primary householder. A total of 66 households (23.0%) fall into this category. Meanwhile, the 65+ years age bracket for the primary householder has the lowest median household income of $42,083, with 119 households (41.5%) in this group.
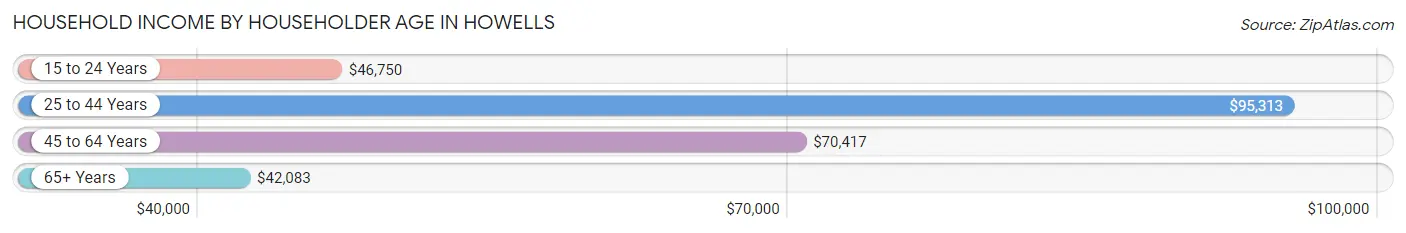
| Income Bracket | # Households | Median Income |
| 15 to 24 Years | 7 (2.4%) | $46,750 |
| 25 to 44 Years | 66 (23.0%) | $95,313 |
| 45 to 64 Years | 95 (33.1%) | $70,417 |
| 65+ Years | 119 (41.5%) | $42,083 |
| Total | 287 (100.0%) | $68,264 |
Poverty in Howells
Income Below Poverty by Sex and Age in Howells
With 3.7% poverty level for males and 15.3% for females among the residents of Howells, 65 to 74 year old males and 75 year old and over females are the most vulnerable to poverty, with 3 males (16.7%) and 46 females (56.1%) in their respective age groups living below the poverty level.
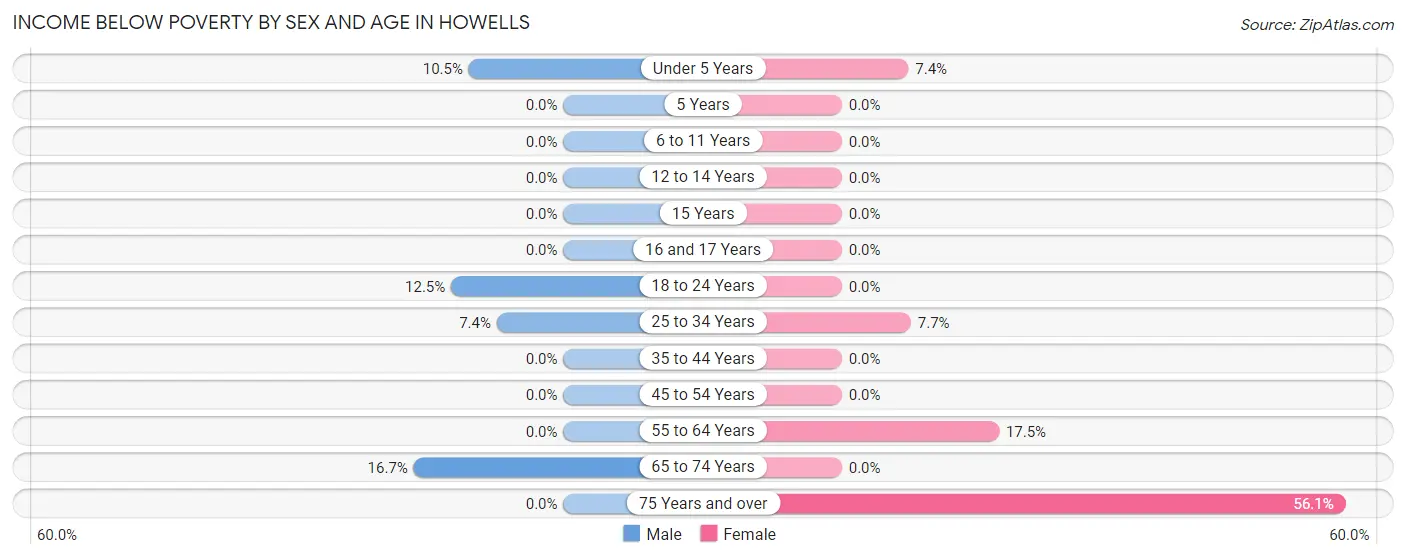
| Age Bracket | Male | Female |
| Under 5 Years | 2 (10.5%) | 2 (7.4%) |
| 5 Years | 0 (0.0%) | 0 (0.0%) |
| 6 to 11 Years | 0 (0.0%) | 0 (0.0%) |
| 12 to 14 Years | 0 (0.0%) | 0 (0.0%) |
| 15 Years | 0 (0.0%) | 0 (0.0%) |
| 16 and 17 Years | 0 (0.0%) | 0 (0.0%) |
| 18 to 24 Years | 5 (12.5%) | 0 (0.0%) |
| 25 to 34 Years | 2 (7.4%) | 2 (7.7%) |
| 35 to 44 Years | 0 (0.0%) | 0 (0.0%) |
| 45 to 54 Years | 0 (0.0%) | 0 (0.0%) |
| 55 to 64 Years | 0 (0.0%) | 7 (17.5%) |
| 65 to 74 Years | 3 (16.7%) | 0 (0.0%) |
| 75 Years and over | 0 (0.0%) | 46 (56.1%) |
| Total | 12 (3.7%) | 57 (15.3%) |
Income Above Poverty by Sex and Age in Howells
According to the poverty statistics in Howells, males aged 5 years and females aged 5 years are the age groups that are most secure financially, with 100.0% of males and 100.0% of females in these age groups living above the poverty line.
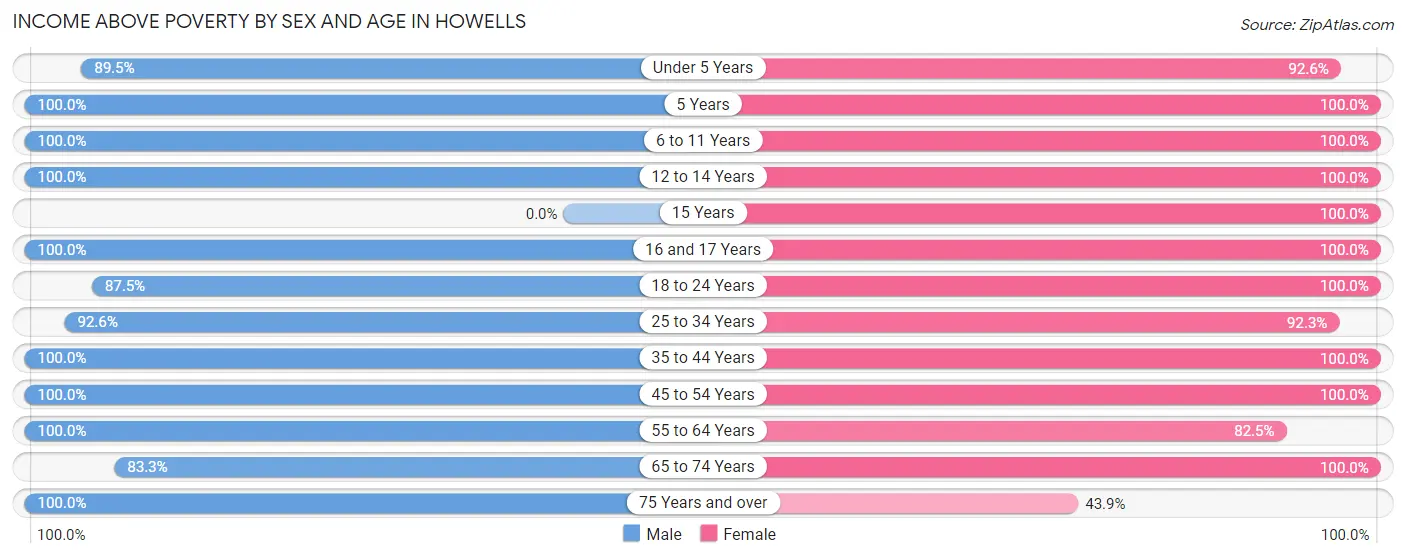
| Age Bracket | Male | Female |
| Under 5 Years | 17 (89.5%) | 25 (92.6%) |
| 5 Years | 7 (100.0%) | 2 (100.0%) |
| 6 to 11 Years | 27 (100.0%) | 13 (100.0%) |
| 12 to 14 Years | 17 (100.0%) | 18 (100.0%) |
| 15 Years | 0 (0.0%) | 8 (100.0%) |
| 16 and 17 Years | 10 (100.0%) | 21 (100.0%) |
| 18 to 24 Years | 35 (87.5%) | 15 (100.0%) |
| 25 to 34 Years | 25 (92.6%) | 24 (92.3%) |
| 35 to 44 Years | 41 (100.0%) | 35 (100.0%) |
| 45 to 54 Years | 21 (100.0%) | 41 (100.0%) |
| 55 to 64 Years | 57 (100.0%) | 33 (82.5%) |
| 65 to 74 Years | 15 (83.3%) | 45 (100.0%) |
| 75 Years and over | 42 (100.0%) | 36 (43.9%) |
| Total | 314 (96.3%) | 316 (84.7%) |
Income Below Poverty Among Married-Couple Families in Howells
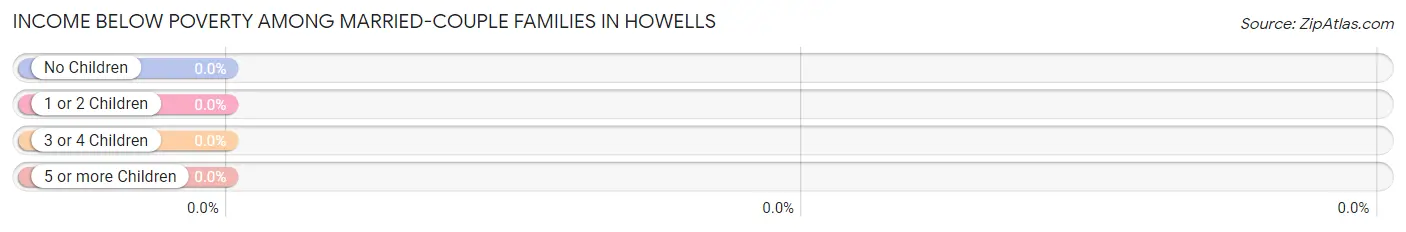
| Children | Above Poverty | Below Poverty |
| No Children | 104 (100.0%) | 0 (0.0%) |
| 1 or 2 Children | 34 (100.0%) | 0 (0.0%) |
| 3 or 4 Children | 26 (100.0%) | 0 (0.0%) |
| 5 or more Children | 0 (0.0%) | 0 (0.0%) |
| Total | 164 (100.0%) | 0 (0.0%) |
Income Below Poverty Among Single-Parent Households in Howells
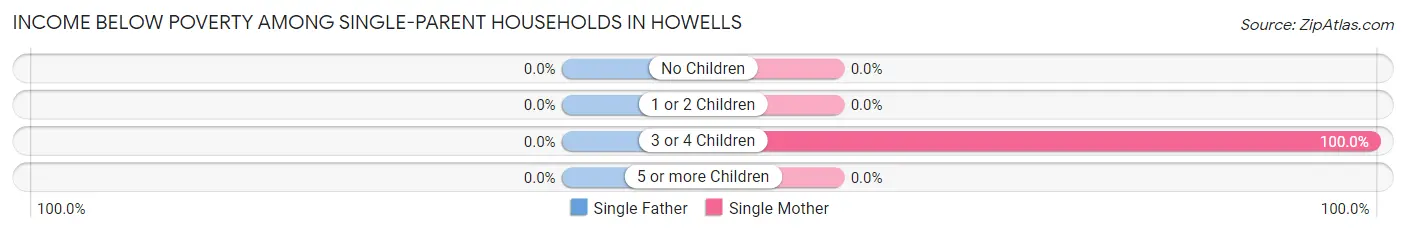
| Children | Single Father | Single Mother |
| No Children | 0 (0.0%) | 0 (0.0%) |
| 1 or 2 Children | 0 (0.0%) | 0 (0.0%) |
| 3 or 4 Children | 0 (0.0%) | 2 (100.0%) |
| 5 or more Children | 0 (0.0%) | 0 (0.0%) |
| Total | 0 (0.0%) | 2 (20.0%) |
Income Below Poverty Among Married-Couple vs Single-Parent Households in Howells
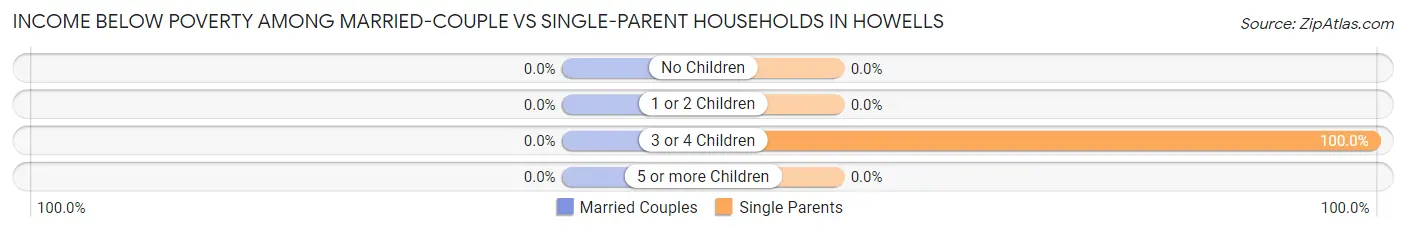
| Children | Married-Couple Families | Single-Parent Households |
| No Children | 0 (0.0%) | 0 (0.0%) |
| 1 or 2 Children | 0 (0.0%) | 0 (0.0%) |
| 3 or 4 Children | 0 (0.0%) | 2 (100.0%) |
| 5 or more Children | 0 (0.0%) | 0 (0.0%) |
| Total | 0 (0.0%) | 2 (20.0%) |
Race in Howells
The most populous races in Howells are White / Caucasian (659 | 94.3%), Hispanic or Latino (46 | 6.6%), and Black / African American (16 | 2.3%).
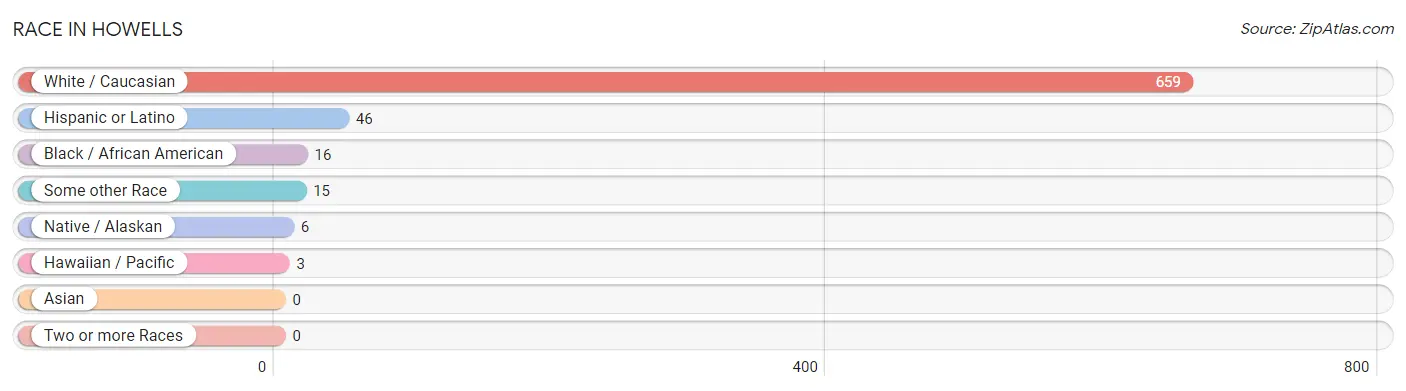
| Race | # Population | % Population |
| Asian | 0 | 0.0% |
| Black / African American | 16 | 2.3% |
| Hawaiian / Pacific | 3 | 0.4% |
| Hispanic or Latino | 46 | 6.6% |
| Native / Alaskan | 6 | 0.9% |
| White / Caucasian | 659 | 94.3% |
| Two or more Races | 0 | 0.0% |
| Some other Race | 15 | 2.1% |
| Total | 699 | 100.0% |
Ancestry in Howells
The most populous ancestries reported in Howells are German (317 | 45.4%), Czech (214 | 30.6%), Irish (65 | 9.3%), American (55 | 7.9%), and Polish (36 | 5.1%), together accounting for 98.3% of all Howells residents.
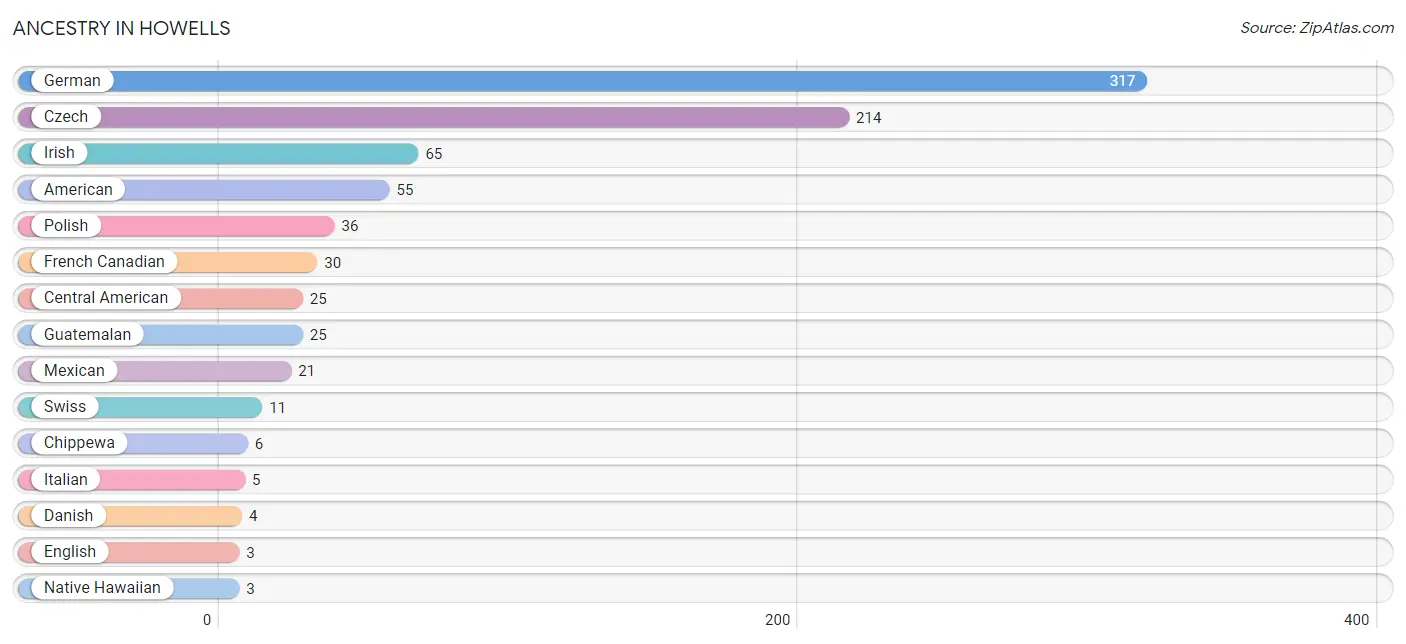
| Ancestry | # Population | % Population |
| American | 55 | 7.9% |
| Central American | 25 | 3.6% |
| Chippewa | 6 | 0.9% |
| Czech | 214 | 30.6% |
| Danish | 4 | 0.6% |
| English | 3 | 0.4% |
| French | 2 | 0.3% |
| French Canadian | 30 | 4.3% |
| German | 317 | 45.4% |
| Guatemalan | 25 | 3.6% |
| Irish | 65 | 9.3% |
| Italian | 5 | 0.7% |
| Mexican | 21 | 3.0% |
| Native Hawaiian | 3 | 0.4% |
| Norwegian | 2 | 0.3% |
| Polish | 36 | 5.1% |
| Scottish | 2 | 0.3% |
| Swedish | 2 | 0.3% |
| Swiss | 11 | 1.6% | View All 19 Rows |
Immigrants in Howells
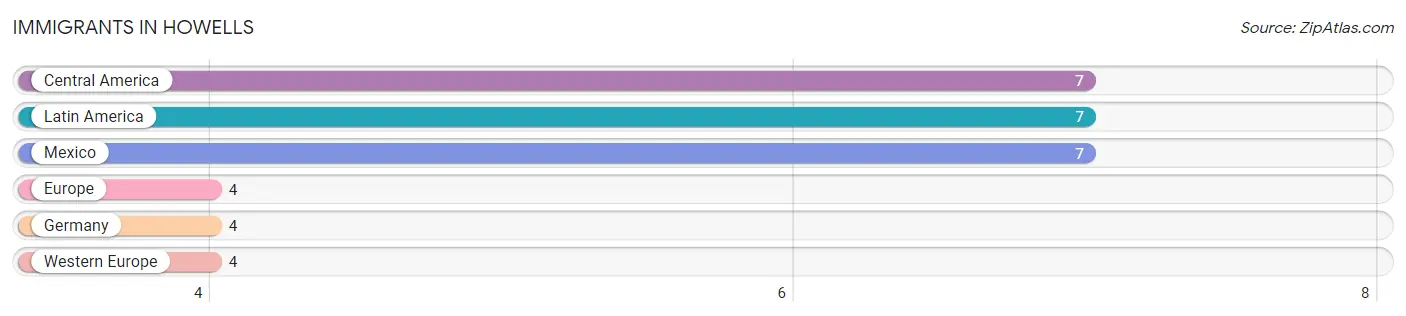
The most numerous immigrant groups reported in Howells came from Central America (7 | 1.0%), Latin America (7 | 1.0%), Mexico (7 | 1.0%), Europe (4 | 0.6%), and Germany (4 | 0.6%), together accounting for 4.1% of all Howells residents.
| Immigration Origin | # Population | % Population |
| Central America | 7 | 1.0% |
| Europe | 4 | 0.6% |
| Germany | 4 | 0.6% |
| Latin America | 7 | 1.0% |
| Mexico | 7 | 1.0% |
| Western Europe | 4 | 0.6% | View All 6 Rows |
Sex and Age in Howells
Sex and Age in Howells
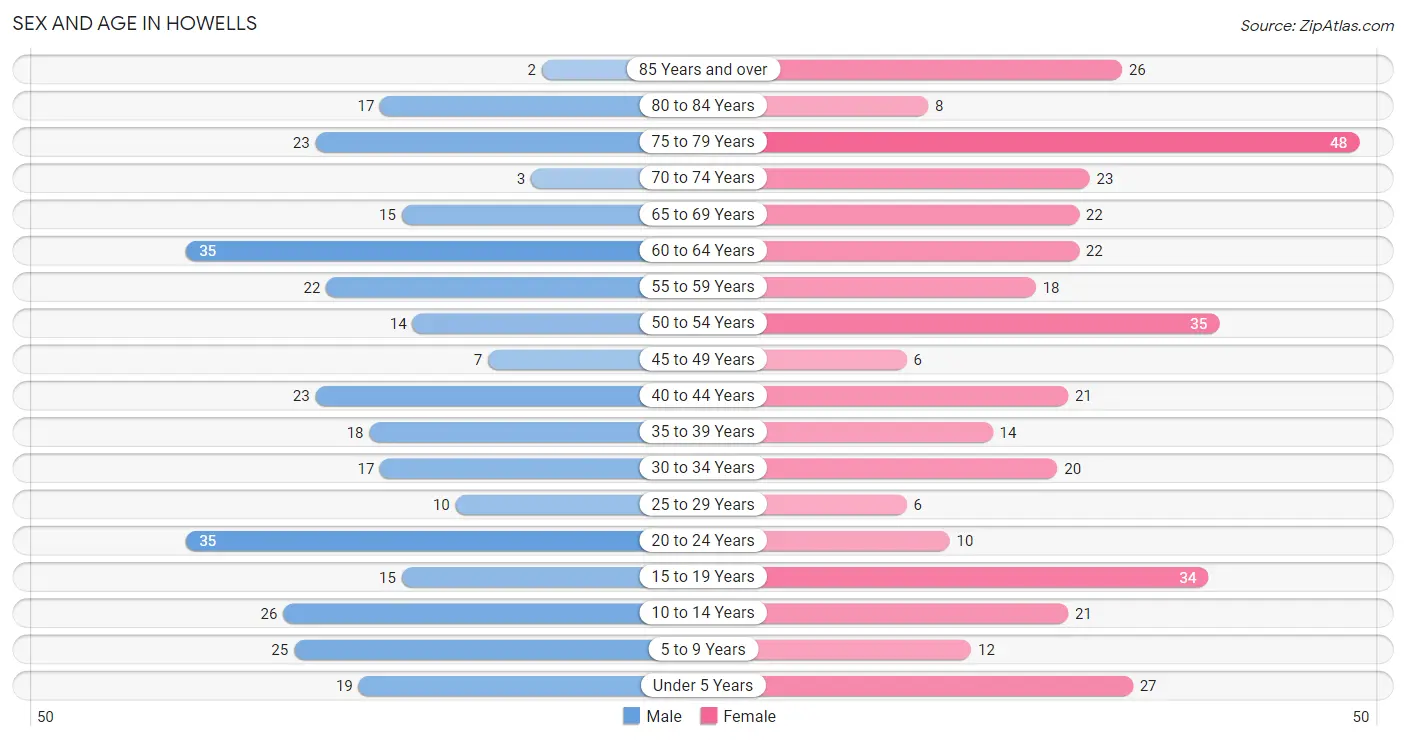
The most populous age groups in Howells are 20 to 24 Years (35 | 10.7%) for men and 75 to 79 Years (48 | 12.9%) for women.
| Age Bracket | Male | Female |
| Under 5 Years | 19 (5.8%) | 27 (7.2%) |
| 5 to 9 Years | 25 (7.7%) | 12 (3.2%) |
| 10 to 14 Years | 26 (8.0%) | 21 (5.6%) |
| 15 to 19 Years | 15 (4.6%) | 34 (9.1%) |
| 20 to 24 Years | 35 (10.7%) | 10 (2.7%) |
| 25 to 29 Years | 10 (3.1%) | 6 (1.6%) |
| 30 to 34 Years | 17 (5.2%) | 20 (5.4%) |
| 35 to 39 Years | 18 (5.5%) | 14 (3.7%) |
| 40 to 44 Years | 23 (7.1%) | 21 (5.6%) |
| 45 to 49 Years | 7 (2.1%) | 6 (1.6%) |
| 50 to 54 Years | 14 (4.3%) | 35 (9.4%) |
| 55 to 59 Years | 22 (6.8%) | 18 (4.8%) |
| 60 to 64 Years | 35 (10.7%) | 22 (5.9%) |
| 65 to 69 Years | 15 (4.6%) | 22 (5.9%) |
| 70 to 74 Years | 3 (0.9%) | 23 (6.2%) |
| 75 to 79 Years | 23 (7.1%) | 48 (12.9%) |
| 80 to 84 Years | 17 (5.2%) | 8 (2.1%) |
| 85 Years and over | 2 (0.6%) | 26 (7.0%) |
| Total | 326 (100.0%) | 373 (100.0%) |
Families and Households in Howells
Median Family Size in Howells
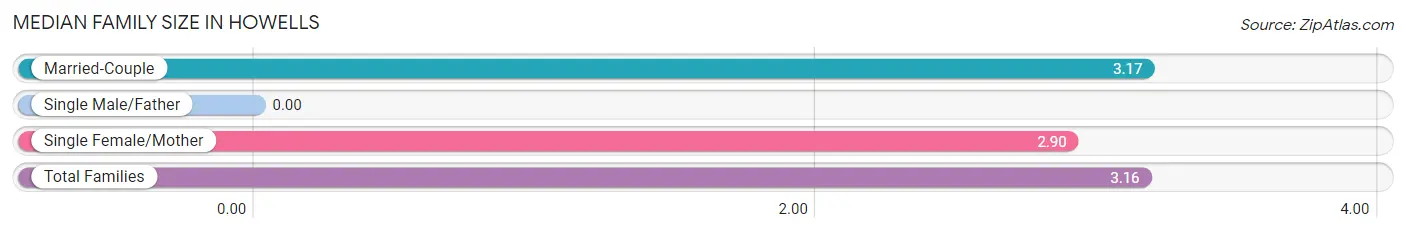
| Family Type | # Families | Family Size |
| Married-Couple | 164 (94.3%) | 3.17 |
| Single Male/Father | 0 (0.0%) | - |
| Single Female/Mother | 10 (5.8%) | 2.90 |
| Total Families | 174 (100.0%) | 3.16 |
Median Household Size in Howells
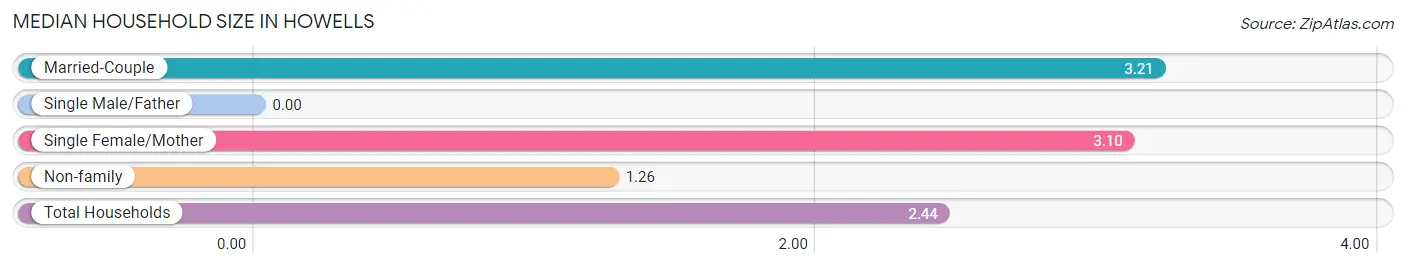
| Household Type | # Households | Household Size |
| Married-Couple | 164 (57.1%) | 3.21 |
| Single Male/Father | 0 (0.0%) | - |
| Single Female/Mother | 10 (3.5%) | 3.10 |
| Non-family | 113 (39.4%) | 1.26 |
| Total Households | 287 (100.0%) | 2.44 |
Household Size by Marriage Status in Howells
Out of a total of 287 households in Howells, 174 (60.6%) are family households, while 113 (39.4%) are nonfamily households. The most numerous type of family households are 2-person households, comprising 83, and the most common type of nonfamily households are 1-person households, comprising 100.
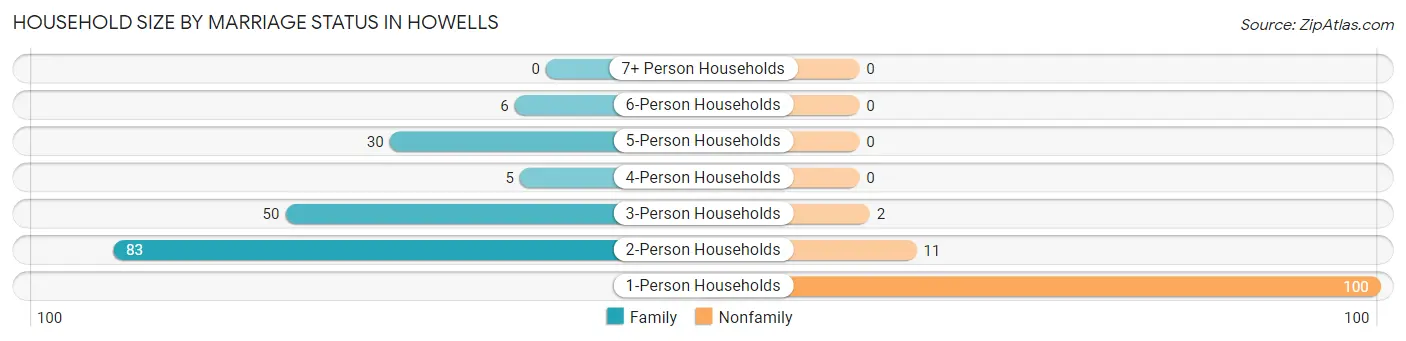
| Household Size | Family Households | Nonfamily Households |
| 1-Person Households | - | 100 (34.8%) |
| 2-Person Households | 83 (28.9%) | 11 (3.8%) |
| 3-Person Households | 50 (17.4%) | 2 (0.7%) |
| 4-Person Households | 5 (1.7%) | 0 (0.0%) |
| 5-Person Households | 30 (10.4%) | 0 (0.0%) |
| 6-Person Households | 6 (2.1%) | 0 (0.0%) |
| 7+ Person Households | 0 (0.0%) | 0 (0.0%) |
| Total | 174 (60.6%) | 113 (39.4%) |
Female Fertility in Howells
Fertility by Age in Howells
Average fertility rate in Howells is 27.0 births per 1,000 women. Women in the age bracket of 20 to 34 years have the highest fertility rate with 83.0 births per 1,000 women. Women in the age bracket of 20 to 34 years acount for 100.0% of all women with births.
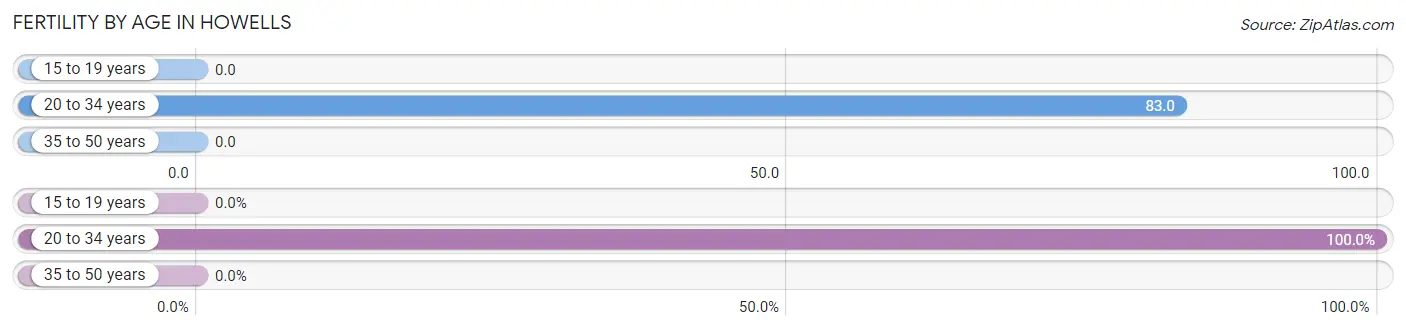
| Age Bracket | Women with Births | Births / 1,000 Women |
| 15 to 19 years | 0 (0.0%) | 0.0 |
| 20 to 34 years | 3 (100.0%) | 83.0 |
| 35 to 50 years | 0 (0.0%) | 0.0 |
| Total | 3 (100.0%) | 27.0 |
Fertility by Age by Marriage Status in Howells
33.3% of women with births (3) in Howells are married. The highest percentage of unmarried women with births falls into 20 to 34 years age bracket with 66.7% of them unmarried at the time of birth, while the lowest percentage of unmarried women with births belong to 20 to 34 years age bracket with 66.7% of them unmarried.
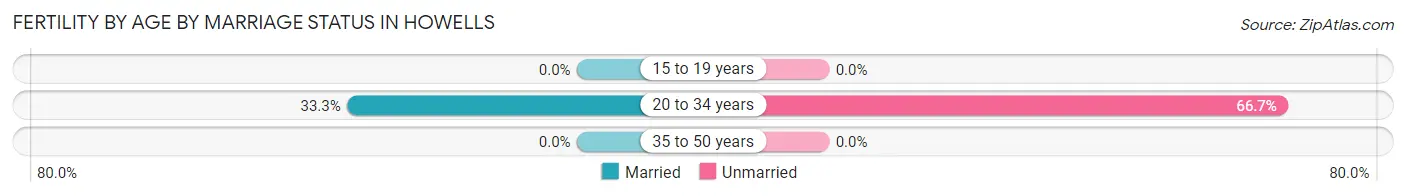
| Age Bracket | Married | Unmarried |
| 15 to 19 years | 0 (0.0%) | 0 (0.0%) |
| 20 to 34 years | 1 (33.3%) | 2 (66.7%) |
| 35 to 50 years | 0 (0.0%) | 0 (0.0%) |
| Total | 1 (33.3%) | 2 (66.7%) |
Fertility by Education in Howells
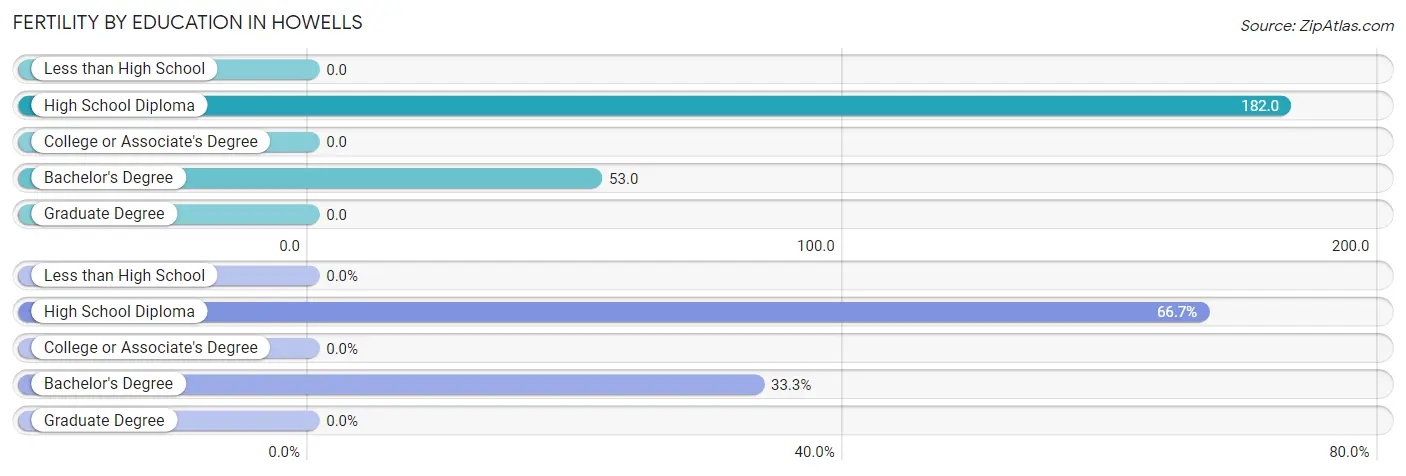
| Educational Attainment | Women with Births | Births / 1,000 Women |
| Less than High School | 0 (0.0%) | 0.0 |
| High School Diploma | 2 (66.7%) | 182.0 |
| College or Associate's Degree | 0 (0.0%) | 0.0 |
| Bachelor's Degree | 1 (33.3%) | 53.0 |
| Graduate Degree | 0 (0.0%) | 0.0 |
| Total | 3 (100.0%) | 27.0 |
Fertility by Education by Marriage Status in Howells
66.7% of women with births in Howells are unmarried. Women with the educational attainment of bachelor's degree are most likely to be married with 100.0% of them married at childbirth, while women with the educational attainment of high school diploma are least likely to be married with 100.0% of them unmarried at childbirth.
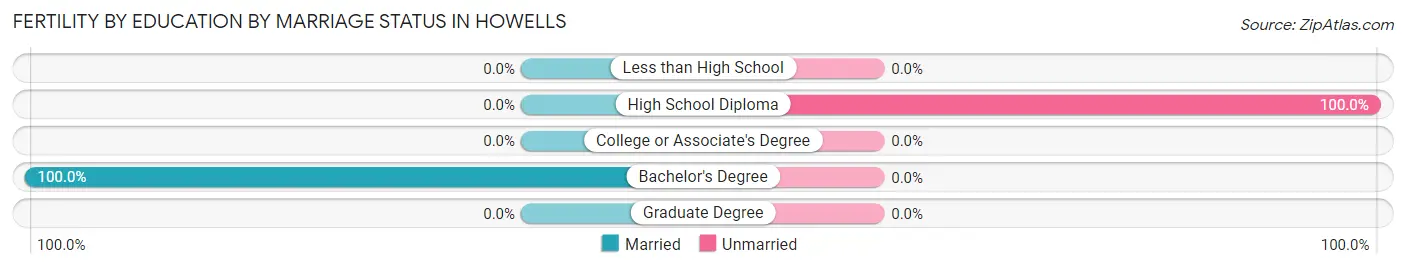
| Educational Attainment | Married | Unmarried |
| Less than High School | 0 (0.0%) | 0 (0.0%) |
| High School Diploma | 0 (0.0%) | 2 (100.0%) |
| College or Associate's Degree | 0 (0.0%) | 0 (0.0%) |
| Bachelor's Degree | 1 (100.0%) | 0 (0.0%) |
| Graduate Degree | 0 (0.0%) | 0 (0.0%) |
| Total | 1 (33.3%) | 2 (66.7%) |
Employment Characteristics in Howells
Employment by Class of Employer in Howells
Among the 348 employed individuals in Howells, private company employees (194 | 55.7%), local government employees (68 | 19.5%), and self-employed (incorporated) (37 | 10.6%) make up the most common classes of employment.
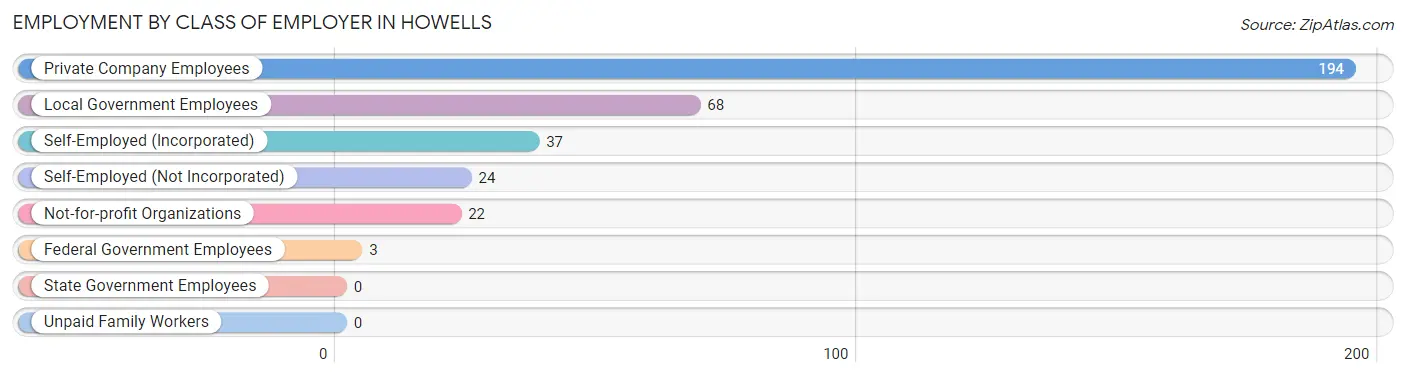
| Employer Class | # Employees | % Employees |
| Private Company Employees | 194 | 55.7% |
| Self-Employed (Incorporated) | 37 | 10.6% |
| Self-Employed (Not Incorporated) | 24 | 6.9% |
| Not-for-profit Organizations | 22 | 6.3% |
| Local Government Employees | 68 | 19.5% |
| State Government Employees | 0 | 0.0% |
| Federal Government Employees | 3 | 0.9% |
| Unpaid Family Workers | 0 | 0.0% |
| Total | 348 | 100.0% |
Employment Status by Age in Howells
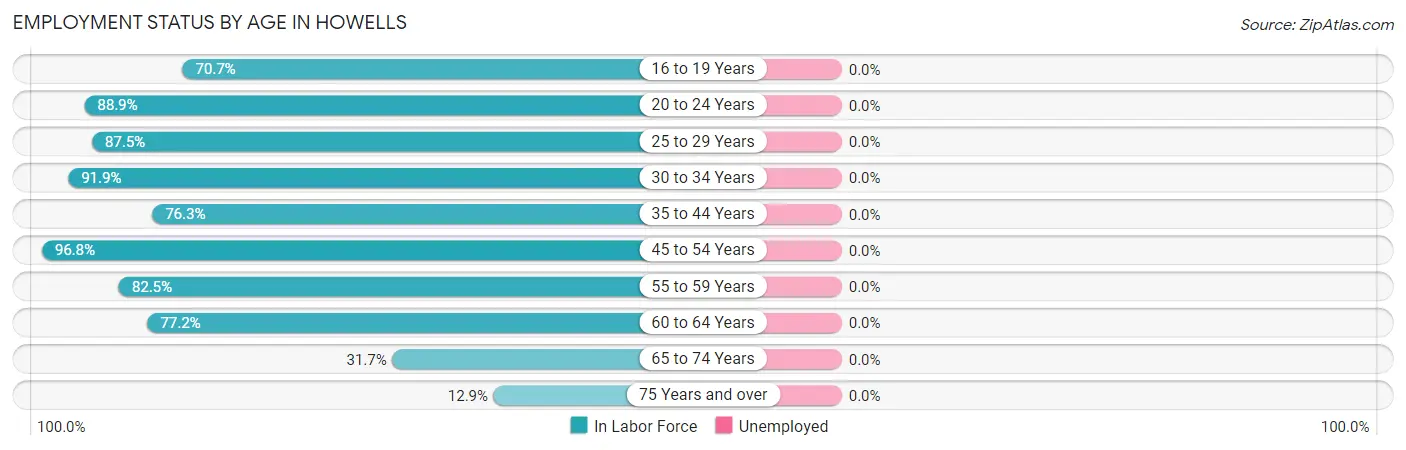
| Age Bracket | In Labor Force | Unemployed |
| 16 to 19 Years | 29 (70.7%) | 0 (0.0%) |
| 20 to 24 Years | 40 (88.9%) | 0 (0.0%) |
| 25 to 29 Years | 14 (87.5%) | 0 (0.0%) |
| 30 to 34 Years | 34 (91.9%) | 0 (0.0%) |
| 35 to 44 Years | 58 (76.3%) | 0 (0.0%) |
| 45 to 54 Years | 60 (96.8%) | 0 (0.0%) |
| 55 to 59 Years | 33 (82.5%) | 0 (0.0%) |
| 60 to 64 Years | 44 (77.2%) | 0 (0.0%) |
| 65 to 74 Years | 20 (31.7%) | 0 (0.0%) |
| 75 Years and over | 16 (12.9%) | 0 (0.0%) |
| Total | 348 (62.0%) | 0 (0.0%) |
Employment Status by Educational Attainment in Howells
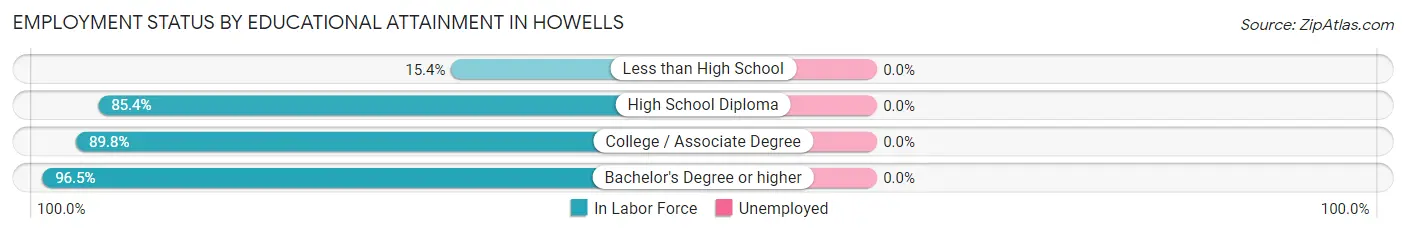
| Educational Attainment | In Labor Force | Unemployed |
| Less than High School | 4 (15.4%) | 0 (0.0%) |
| High School Diploma | 41 (85.4%) | 0 (0.0%) |
| College / Associate Degree | 115 (89.8%) | 0 (0.0%) |
| Bachelor's Degree or higher | 83 (96.5%) | 0 (0.0%) |
| Total | 243 (84.4%) | 0 (0.0%) |
Employment Occupations by Sex in Howells
Management, Business, Science and Arts Occupations
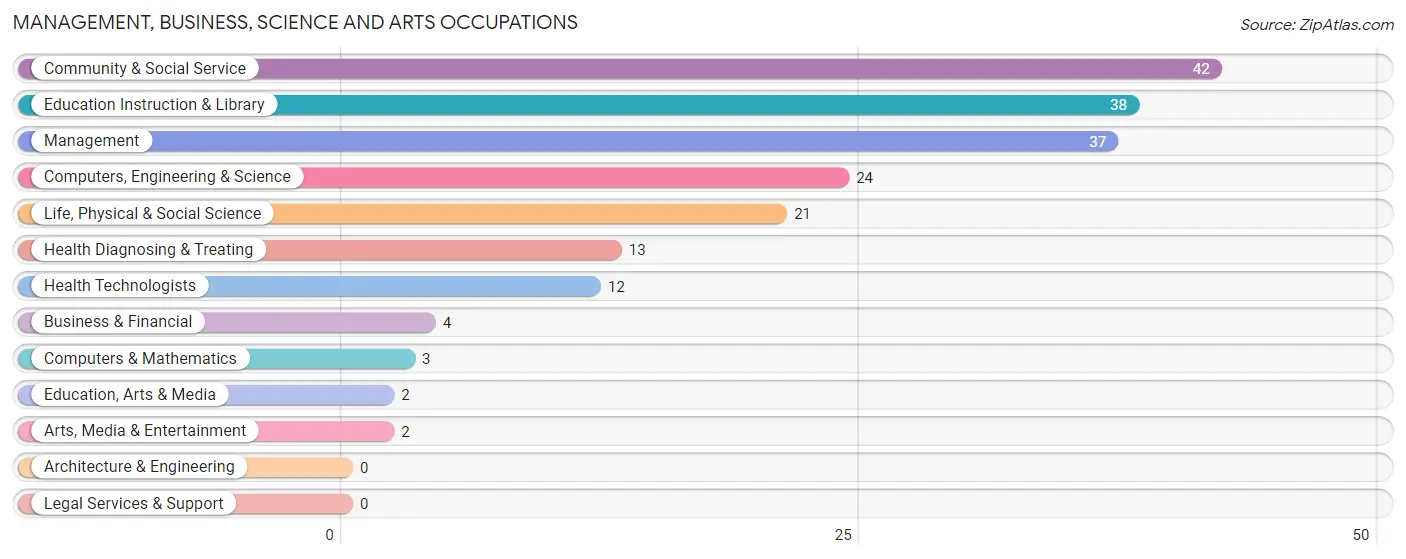
The most common Management, Business, Science and Arts occupations in Howells are Community & Social Service (42 | 12.1%), Education Instruction & Library (38 | 10.9%), Management (37 | 10.6%), Computers, Engineering & Science (24 | 6.9%), and Life, Physical & Social Science (21 | 6.0%).
Management, Business, Science and Arts Occupations by Sex
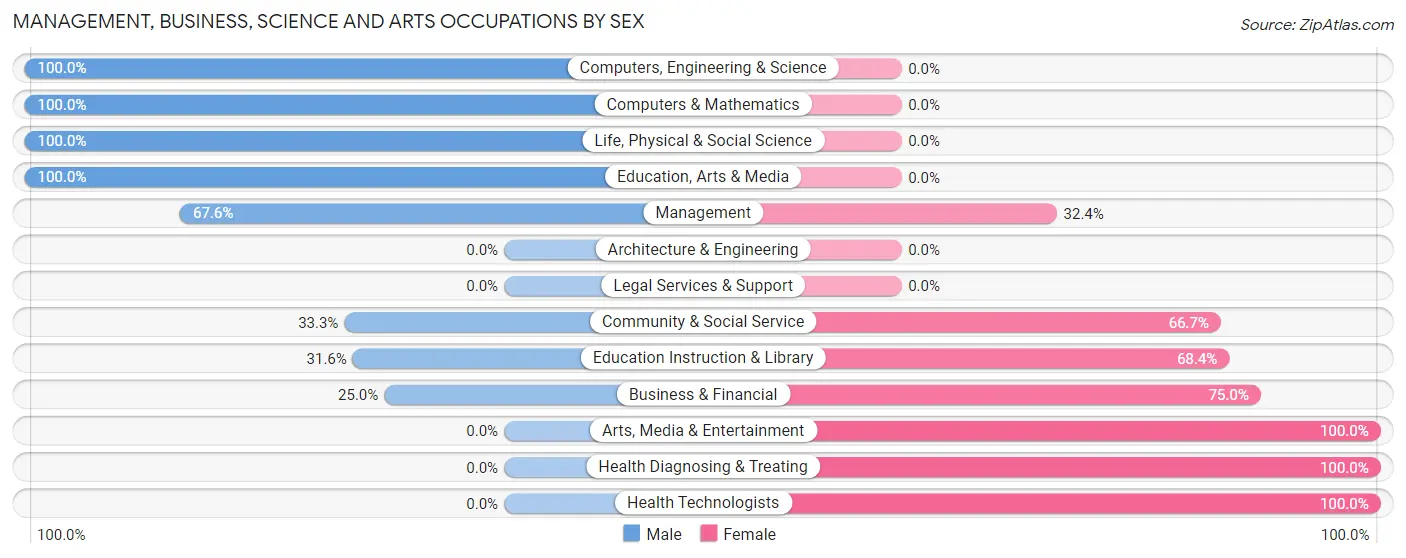
Within the Management, Business, Science and Arts occupations in Howells, the most male-oriented occupations are Computers, Engineering & Science (100.0%), Computers & Mathematics (100.0%), and Life, Physical & Social Science (100.0%), while the most female-oriented occupations are Arts, Media & Entertainment (100.0%), Health Diagnosing & Treating (100.0%), and Health Technologists (100.0%).
| Occupation | Male | Female |
| Management | 25 (67.6%) | 12 (32.4%) |
| Business & Financial | 1 (25.0%) | 3 (75.0%) |
| Computers, Engineering & Science | 24 (100.0%) | 0 (0.0%) |
| Computers & Mathematics | 3 (100.0%) | 0 (0.0%) |
| Architecture & Engineering | 0 (0.0%) | 0 (0.0%) |
| Life, Physical & Social Science | 21 (100.0%) | 0 (0.0%) |
| Community & Social Service | 14 (33.3%) | 28 (66.7%) |
| Education, Arts & Media | 2 (100.0%) | 0 (0.0%) |
| Legal Services & Support | 0 (0.0%) | 0 (0.0%) |
| Education Instruction & Library | 12 (31.6%) | 26 (68.4%) |
| Arts, Media & Entertainment | 0 (0.0%) | 2 (100.0%) |
| Health Diagnosing & Treating | 0 (0.0%) | 13 (100.0%) |
| Health Technologists | 0 (0.0%) | 12 (100.0%) |
| Total (Category) | 64 (53.3%) | 56 (46.7%) |
| Total (Overall) | 189 (54.3%) | 159 (45.7%) |
Services Occupations
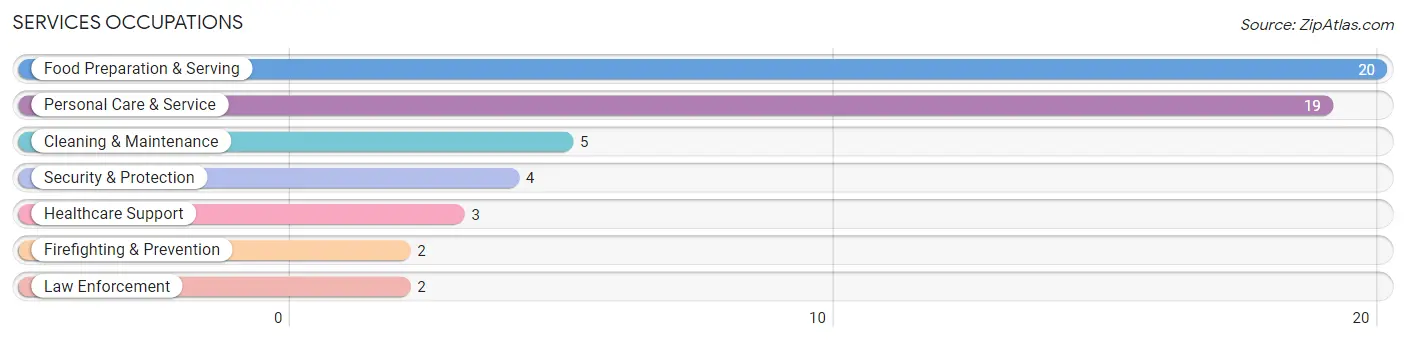
The most common Services occupations in Howells are Food Preparation & Serving (20 | 5.8%), Personal Care & Service (19 | 5.5%), Cleaning & Maintenance (5 | 1.4%), Security & Protection (4 | 1.1%), and Healthcare Support (3 | 0.9%).
Services Occupations by Sex
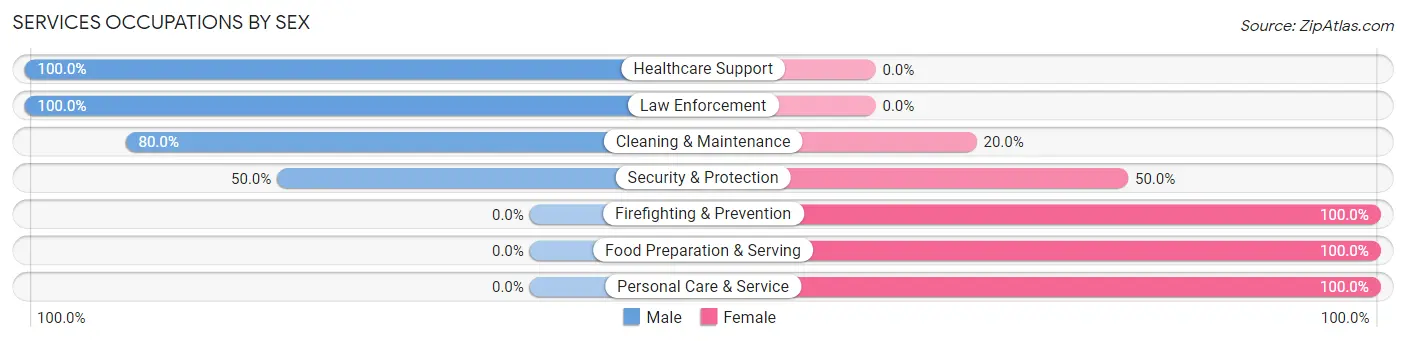
Within the Services occupations in Howells, the most male-oriented occupations are Healthcare Support (100.0%), Law Enforcement (100.0%), and Cleaning & Maintenance (80.0%), while the most female-oriented occupations are Firefighting & Prevention (100.0%), Food Preparation & Serving (100.0%), and Personal Care & Service (100.0%).
| Occupation | Male | Female |
| Healthcare Support | 3 (100.0%) | 0 (0.0%) |
| Security & Protection | 2 (50.0%) | 2 (50.0%) |
| Firefighting & Prevention | 0 (0.0%) | 2 (100.0%) |
| Law Enforcement | 2 (100.0%) | 0 (0.0%) |
| Food Preparation & Serving | 0 (0.0%) | 20 (100.0%) |
| Cleaning & Maintenance | 4 (80.0%) | 1 (20.0%) |
| Personal Care & Service | 0 (0.0%) | 19 (100.0%) |
| Total (Category) | 9 (17.6%) | 42 (82.4%) |
| Total (Overall) | 189 (54.3%) | 159 (45.7%) |
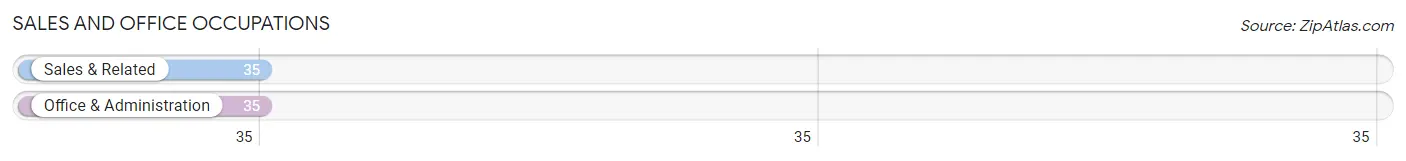
Sales and Office Occupations
The most common Sales and Office occupations in Howells are Sales & Related (35 | 10.1%), and Office & Administration (35 | 10.1%).
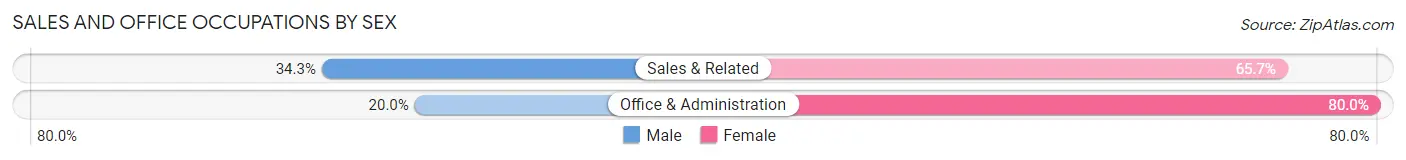
Sales and Office Occupations by Sex
| Occupation | Male | Female |
| Sales & Related | 12 (34.3%) | 23 (65.7%) |
| Office & Administration | 7 (20.0%) | 28 (80.0%) |
| Total (Category) | 19 (27.1%) | 51 (72.9%) |
| Total (Overall) | 189 (54.3%) | 159 (45.7%) |
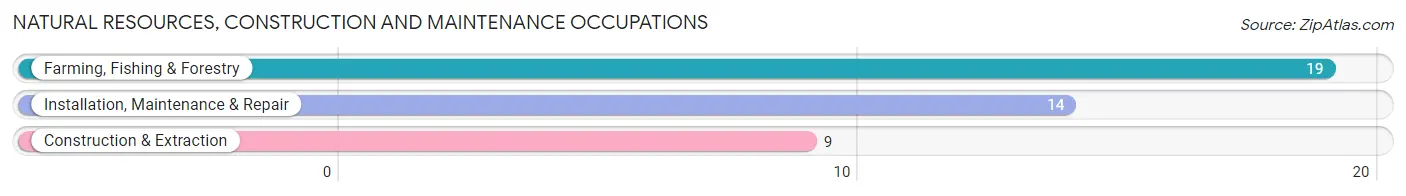
Natural Resources, Construction and Maintenance Occupations
The most common Natural Resources, Construction and Maintenance occupations in Howells are Farming, Fishing & Forestry (19 | 5.5%), Installation, Maintenance & Repair (14 | 4.0%), and Construction & Extraction (9 | 2.6%).
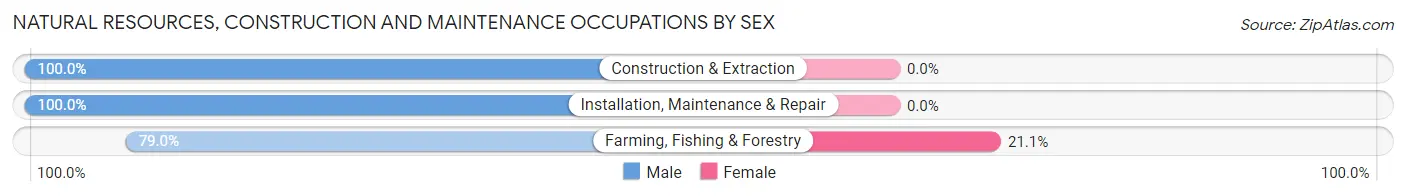
Natural Resources, Construction and Maintenance Occupations by Sex
| Occupation | Male | Female |
| Farming, Fishing & Forestry | 15 (78.9%) | 4 (21.0%) |
| Construction & Extraction | 9 (100.0%) | 0 (0.0%) |
| Installation, Maintenance & Repair | 14 (100.0%) | 0 (0.0%) |
| Total (Category) | 38 (90.5%) | 4 (9.5%) |
| Total (Overall) | 189 (54.3%) | 159 (45.7%) |
Production, Transportation and Moving Occupations
The most common Production, Transportation and Moving occupations in Howells are Production (29 | 8.3%), Transportation (27 | 7.8%), and Material Moving (9 | 2.6%).
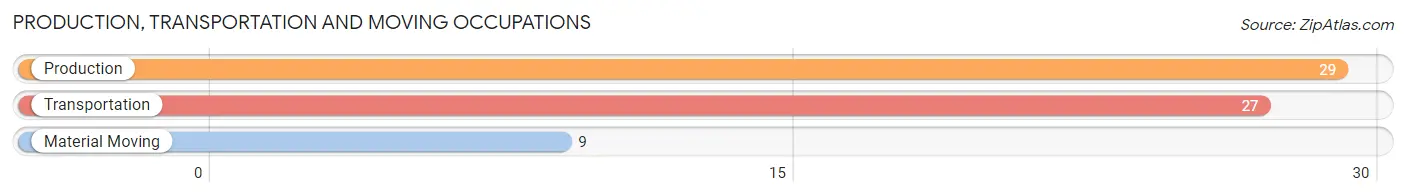
Production, Transportation and Moving Occupations by Sex
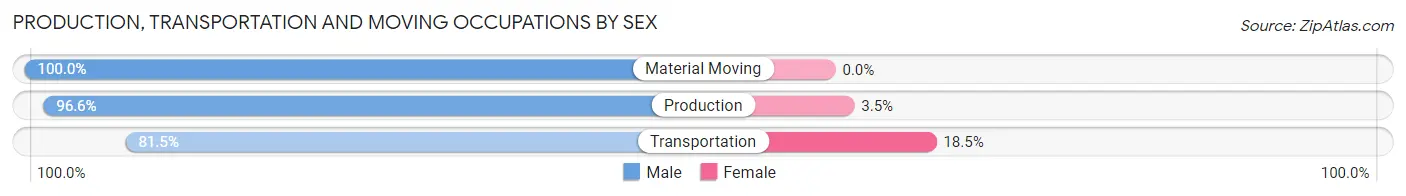
| Occupation | Male | Female |
| Production | 28 (96.6%) | 1 (3.5%) |
| Transportation | 22 (81.5%) | 5 (18.5%) |
| Material Moving | 9 (100.0%) | 0 (0.0%) |
| Total (Category) | 59 (90.8%) | 6 (9.2%) |
| Total (Overall) | 189 (54.3%) | 159 (45.7%) |
Employment Industries by Sex in Howells
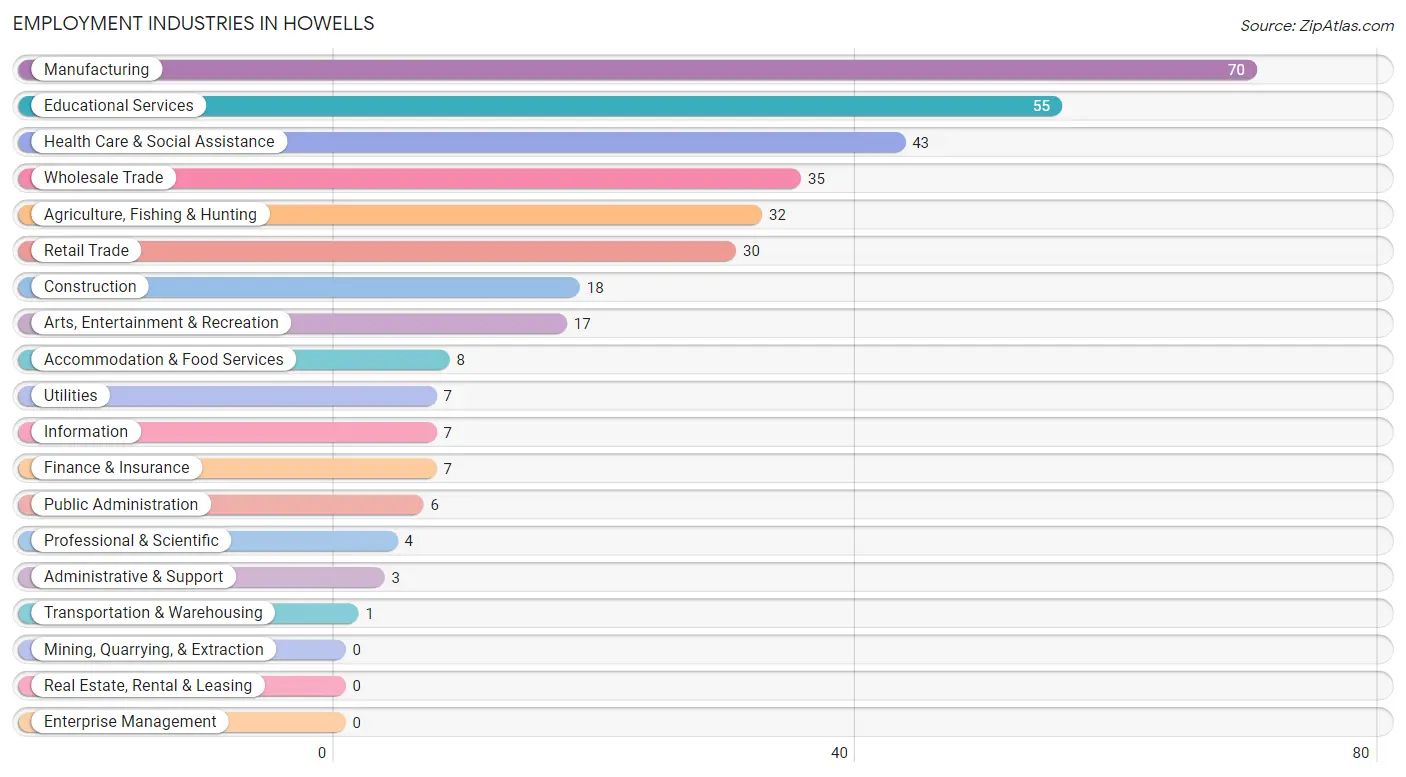
Employment Industries in Howells
The major employment industries in Howells include Manufacturing (70 | 20.1%), Educational Services (55 | 15.8%), Health Care & Social Assistance (43 | 12.4%), Wholesale Trade (35 | 10.1%), and Agriculture, Fishing & Hunting (32 | 9.2%).
Employment Industries by Sex in Howells
The Howells industries that see more men than women are Construction (100.0%), Transportation & Warehousing (100.0%), and Utilities (100.0%), whereas the industries that tend to have a higher number of women are Information (100.0%), Professional & Scientific (100.0%), and Administrative & Support (100.0%).
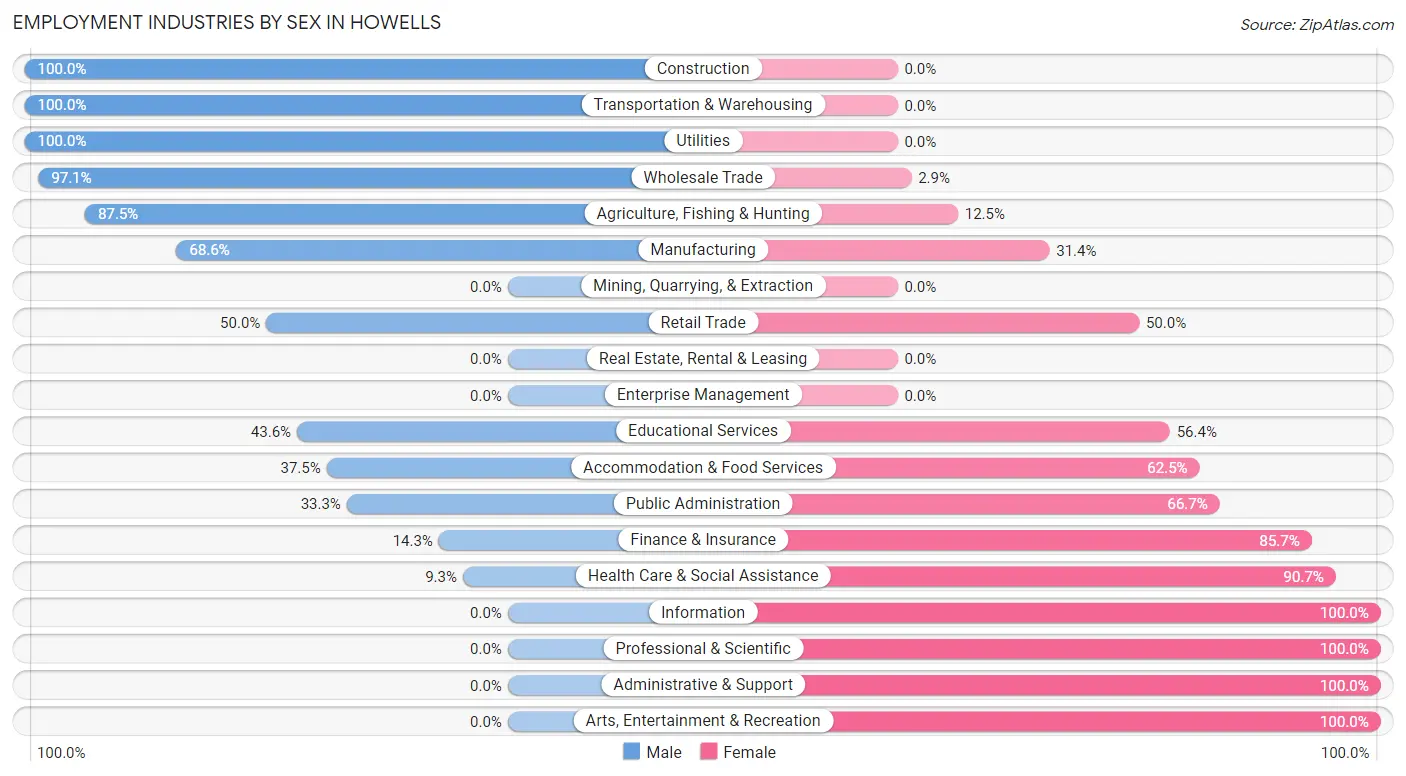
| Industry | Male | Female |
| Agriculture, Fishing & Hunting | 28 (87.5%) | 4 (12.5%) |
| Mining, Quarrying, & Extraction | 0 (0.0%) | 0 (0.0%) |
| Construction | 18 (100.0%) | 0 (0.0%) |
| Manufacturing | 48 (68.6%) | 22 (31.4%) |
| Wholesale Trade | 34 (97.1%) | 1 (2.9%) |
| Retail Trade | 15 (50.0%) | 15 (50.0%) |
| Transportation & Warehousing | 1 (100.0%) | 0 (0.0%) |
| Utilities | 7 (100.0%) | 0 (0.0%) |
| Information | 0 (0.0%) | 7 (100.0%) |
| Finance & Insurance | 1 (14.3%) | 6 (85.7%) |
| Real Estate, Rental & Leasing | 0 (0.0%) | 0 (0.0%) |
| Professional & Scientific | 0 (0.0%) | 4 (100.0%) |
| Enterprise Management | 0 (0.0%) | 0 (0.0%) |
| Administrative & Support | 0 (0.0%) | 3 (100.0%) |
| Educational Services | 24 (43.6%) | 31 (56.4%) |
| Health Care & Social Assistance | 4 (9.3%) | 39 (90.7%) |
| Arts, Entertainment & Recreation | 0 (0.0%) | 17 (100.0%) |
| Accommodation & Food Services | 3 (37.5%) | 5 (62.5%) |
| Public Administration | 2 (33.3%) | 4 (66.7%) |
| Total | 189 (54.3%) | 159 (45.7%) |
Education in Howells
School Enrollment in Howells
The most common levels of schooling among the 190 students in Howells are high school (47 | 24.7%), middle school (42 | 22.1%), and elementary school (33 | 17.4%).
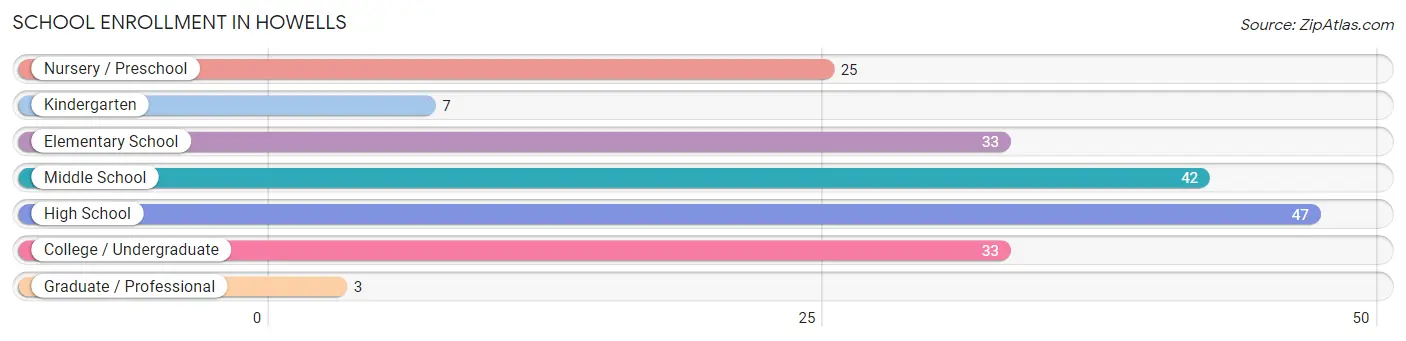
| School Level | # Students | % Students |
| Nursery / Preschool | 25 | 13.2% |
| Kindergarten | 7 | 3.7% |
| Elementary School | 33 | 17.4% |
| Middle School | 42 | 22.1% |
| High School | 47 | 24.7% |
| College / Undergraduate | 33 | 17.4% |
| Graduate / Professional | 3 | 1.6% |
| Total | 190 | 100.0% |
School Enrollment by Age by Funding Source in Howells
Out of a total of 190 students who are enrolled in schools in Howells, 22 (11.6%) attend a private institution, while the remaining 168 (88.4%) are enrolled in public schools. The age group of 3 to 4 year olds has the highest likelihood of being enrolled in private schools, with 17 (73.9% in the age bracket) enrolled. Conversely, the age group of 10 to 14 year olds has the lowest likelihood of being enrolled in a private school, with 47 (100.0% in the age bracket) attending a public institution.
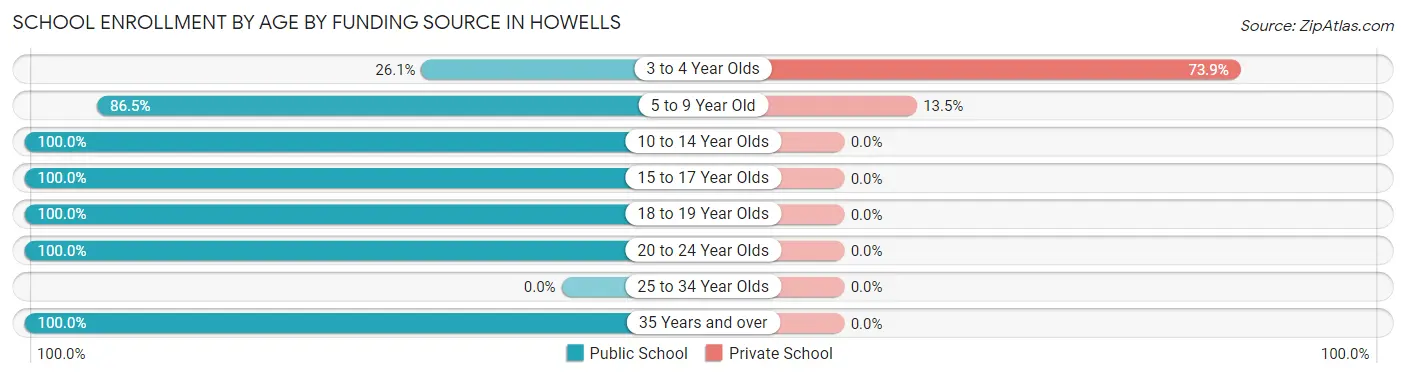
| Age Bracket | Public School | Private School |
| 3 to 4 Year Olds | 6 (26.1%) | 17 (73.9%) |
| 5 to 9 Year Old | 32 (86.5%) | 5 (13.5%) |
| 10 to 14 Year Olds | 47 (100.0%) | 0 (0.0%) |
| 15 to 17 Year Olds | 39 (100.0%) | 0 (0.0%) |
| 18 to 19 Year Olds | 7 (100.0%) | 0 (0.0%) |
| 20 to 24 Year Olds | 26 (100.0%) | 0 (0.0%) |
| 25 to 34 Year Olds | 0 (0.0%) | 0 (0.0%) |
| 35 Years and over | 11 (100.0%) | 0 (0.0%) |
| Total | 168 (88.4%) | 22 (11.6%) |
Educational Attainment by Field of Study in Howells
Education (102 | 67.5%), business (17 | 11.3%), science & technology (13 | 8.6%), arts & humanities (7 | 4.6%), and psychology (5 | 3.3%) are the most common fields of study among 151 individuals in Howells who have obtained a bachelor's degree or higher.
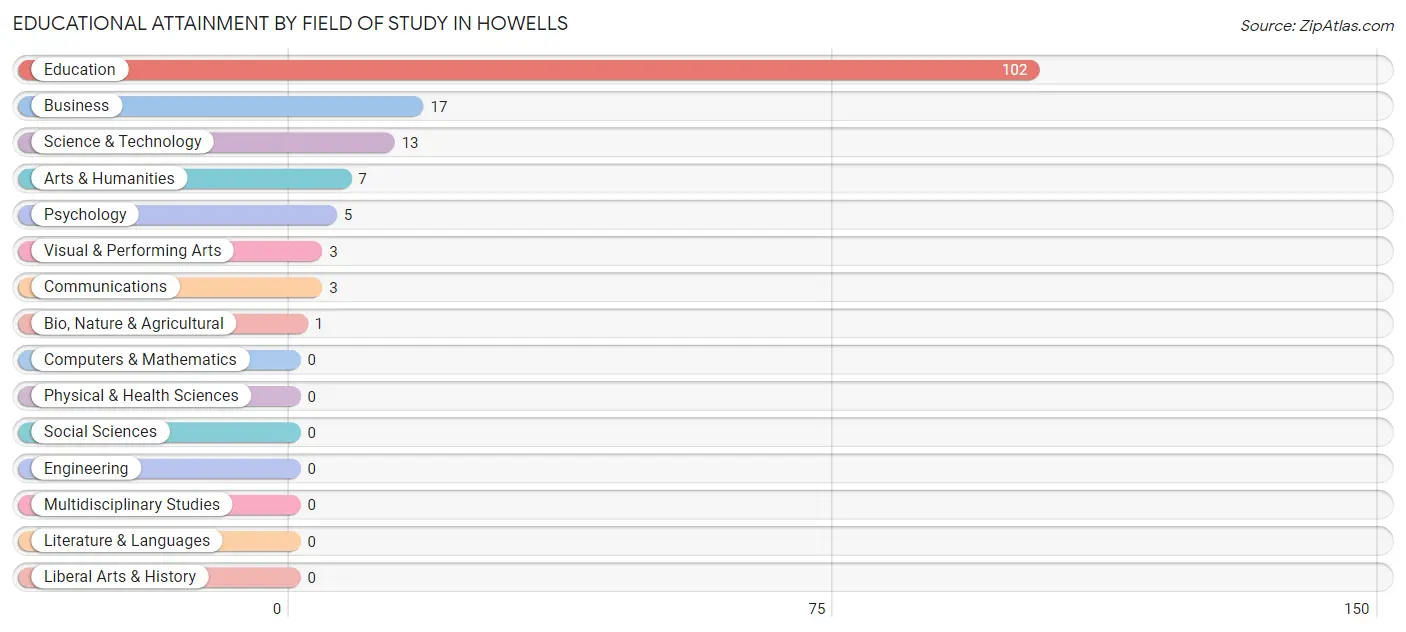
| Field of Study | # Graduates | % Graduates |
| Computers & Mathematics | 0 | 0.0% |
| Bio, Nature & Agricultural | 1 | 0.7% |
| Physical & Health Sciences | 0 | 0.0% |
| Psychology | 5 | 3.3% |
| Social Sciences | 0 | 0.0% |
| Engineering | 0 | 0.0% |
| Multidisciplinary Studies | 0 | 0.0% |
| Science & Technology | 13 | 8.6% |
| Business | 17 | 11.3% |
| Education | 102 | 67.5% |
| Literature & Languages | 0 | 0.0% |
| Liberal Arts & History | 0 | 0.0% |
| Visual & Performing Arts | 3 | 2.0% |
| Communications | 3 | 2.0% |
| Arts & Humanities | 7 | 4.6% |
| Total | 151 | 100.0% |
Transportation & Commute in Howells
Vehicle Availability by Sex in Howells
The most prevalent vehicle ownership categories in Howells are males with 3 vehicles (79, accounting for 41.8%) and females with 3 vehicles (61, making up 49.7%).
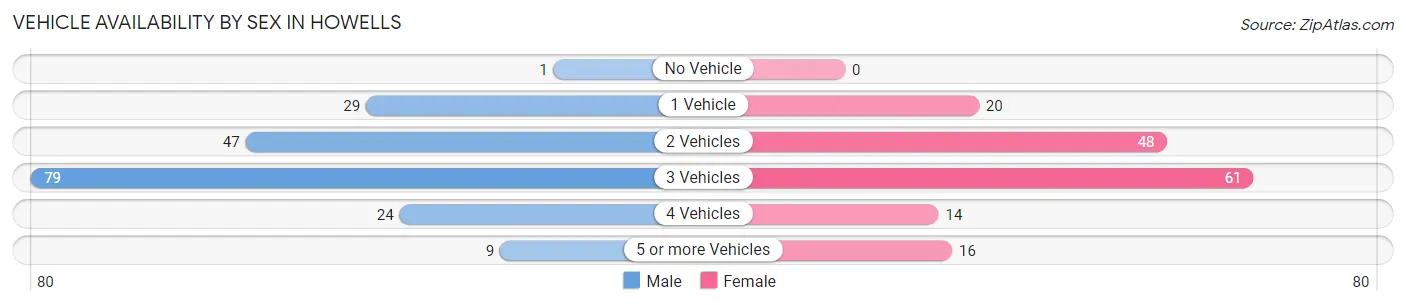
| Vehicles Available | Male | Female |
| No Vehicle | 1 (0.5%) | 0 (0.0%) |
| 1 Vehicle | 29 (15.3%) | 20 (12.6%) |
| 2 Vehicles | 47 (24.9%) | 48 (30.2%) |
| 3 Vehicles | 79 (41.8%) | 61 (38.4%) |
| 4 Vehicles | 24 (12.7%) | 14 (8.8%) |
| 5 or more Vehicles | 9 (4.8%) | 16 (10.1%) |
| Total | 189 (100.0%) | 159 (100.0%) |
Commute Time in Howells
The most frequently occuring commute durations in Howells are 5 to 9 minutes (64 commuters, 19.5%), less than 5 minutes (52 commuters, 15.8%), and 10 to 14 minutes (50 commuters, 15.2%).
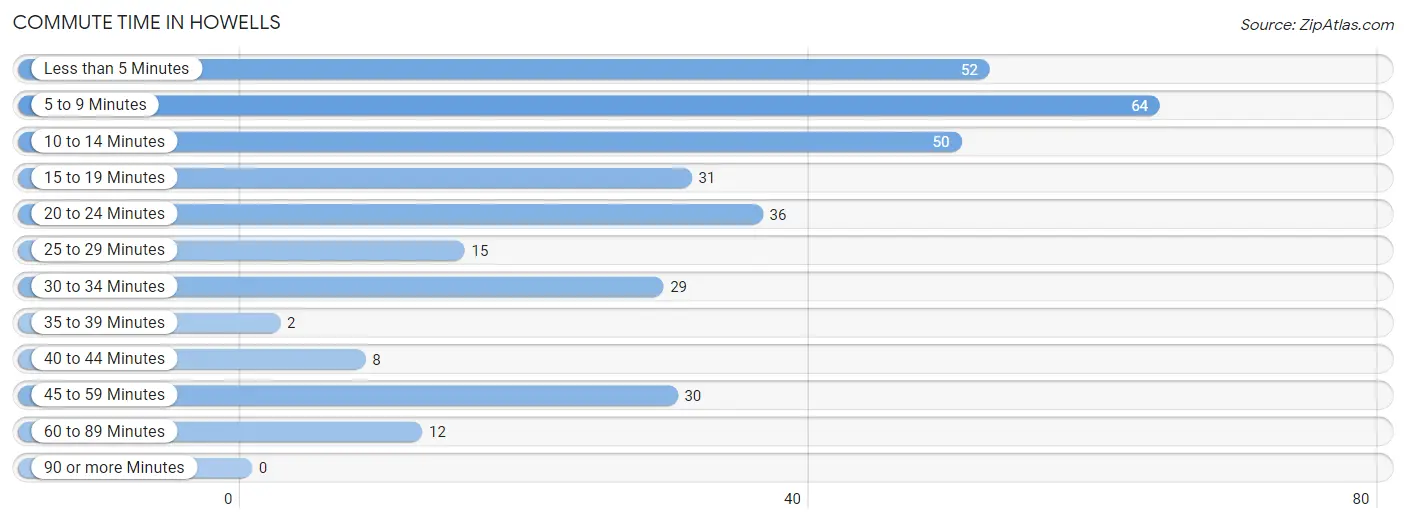
| Commute Time | # Commuters | % Commuters |
| Less than 5 Minutes | 52 | 15.8% |
| 5 to 9 Minutes | 64 | 19.5% |
| 10 to 14 Minutes | 50 | 15.2% |
| 15 to 19 Minutes | 31 | 9.4% |
| 20 to 24 Minutes | 36 | 10.9% |
| 25 to 29 Minutes | 15 | 4.6% |
| 30 to 34 Minutes | 29 | 8.8% |
| 35 to 39 Minutes | 2 | 0.6% |
| 40 to 44 Minutes | 8 | 2.4% |
| 45 to 59 Minutes | 30 | 9.1% |
| 60 to 89 Minutes | 12 | 3.6% |
| 90 or more Minutes | 0 | 0.0% |
Commute Time by Sex in Howells
The most common commute times in Howells are 10 to 14 minutes (43 commuters, 23.8%) for males and 5 to 9 minutes (29 commuters, 19.6%) for females.
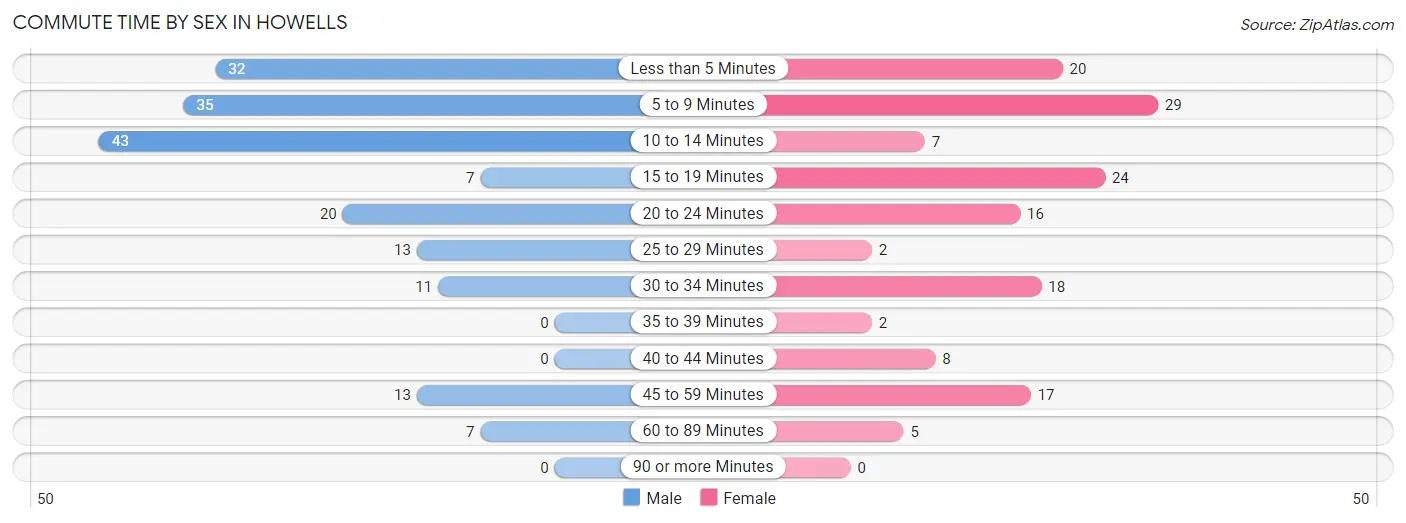
| Commute Time | Male | Female |
| Less than 5 Minutes | 32 (17.7%) | 20 (13.5%) |
| 5 to 9 Minutes | 35 (19.3%) | 29 (19.6%) |
| 10 to 14 Minutes | 43 (23.8%) | 7 (4.7%) |
| 15 to 19 Minutes | 7 (3.9%) | 24 (16.2%) |
| 20 to 24 Minutes | 20 (11.1%) | 16 (10.8%) |
| 25 to 29 Minutes | 13 (7.2%) | 2 (1.3%) |
| 30 to 34 Minutes | 11 (6.1%) | 18 (12.2%) |
| 35 to 39 Minutes | 0 (0.0%) | 2 (1.3%) |
| 40 to 44 Minutes | 0 (0.0%) | 8 (5.4%) |
| 45 to 59 Minutes | 13 (7.2%) | 17 (11.5%) |
| 60 to 89 Minutes | 7 (3.9%) | 5 (3.4%) |
| 90 or more Minutes | 0 (0.0%) | 0 (0.0%) |
Time of Departure to Work by Sex in Howells
The most frequent times of departure to work in Howells are 7:00 AM to 7:29 AM (38, 21.0%) for males and 7:30 AM to 7:59 AM (48, 32.4%) for females.
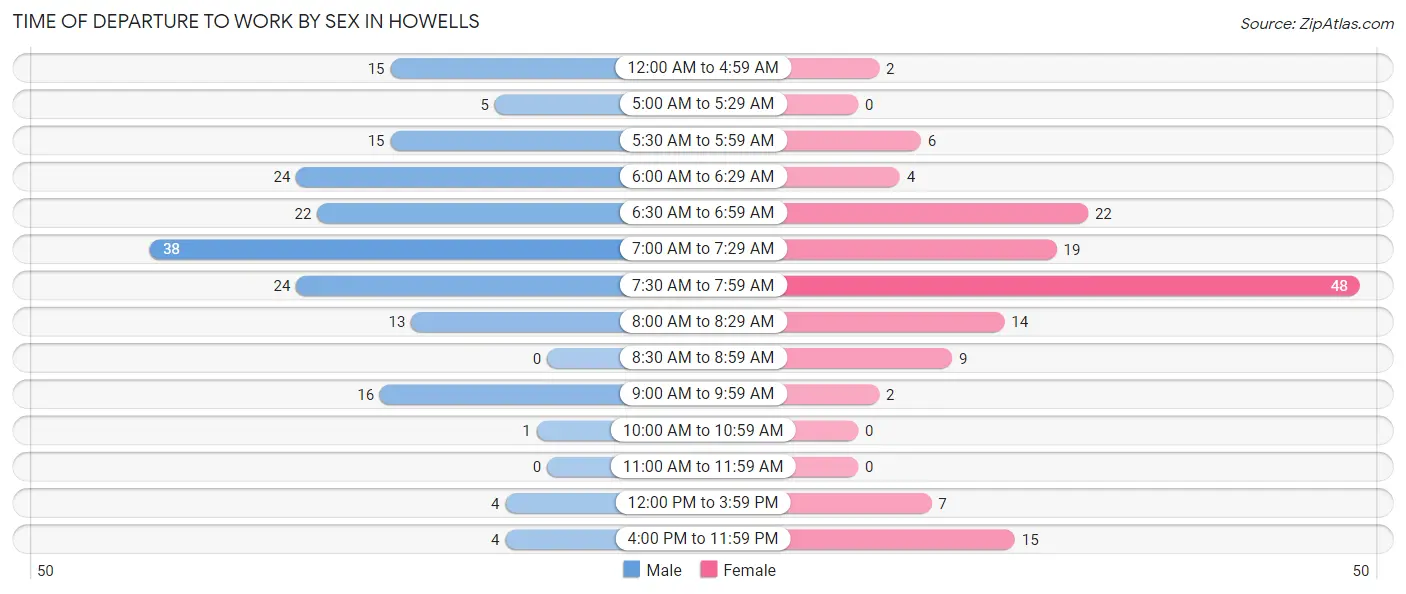
| Time of Departure | Male | Female |
| 12:00 AM to 4:59 AM | 15 (8.3%) | 2 (1.3%) |
| 5:00 AM to 5:29 AM | 5 (2.8%) | 0 (0.0%) |
| 5:30 AM to 5:59 AM | 15 (8.3%) | 6 (4.1%) |
| 6:00 AM to 6:29 AM | 24 (13.3%) | 4 (2.7%) |
| 6:30 AM to 6:59 AM | 22 (12.1%) | 22 (14.9%) |
| 7:00 AM to 7:29 AM | 38 (21.0%) | 19 (12.8%) |
| 7:30 AM to 7:59 AM | 24 (13.3%) | 48 (32.4%) |
| 8:00 AM to 8:29 AM | 13 (7.2%) | 14 (9.5%) |
| 8:30 AM to 8:59 AM | 0 (0.0%) | 9 (6.1%) |
| 9:00 AM to 9:59 AM | 16 (8.8%) | 2 (1.3%) |
| 10:00 AM to 10:59 AM | 1 (0.5%) | 0 (0.0%) |
| 11:00 AM to 11:59 AM | 0 (0.0%) | 0 (0.0%) |
| 12:00 PM to 3:59 PM | 4 (2.2%) | 7 (4.7%) |
| 4:00 PM to 11:59 PM | 4 (2.2%) | 15 (10.1%) |
| Total | 181 (100.0%) | 148 (100.0%) |
Housing Occupancy in Howells
Occupancy by Ownership in Howells
Of the total 287 dwellings in Howells, owner-occupied units account for 261 (90.9%), while renter-occupied units make up 26 (9.1%).
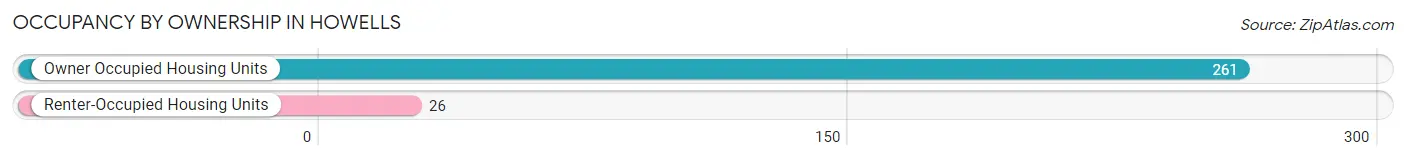
| Occupancy | # Housing Units | % Housing Units |
| Owner Occupied Housing Units | 261 | 90.9% |
| Renter-Occupied Housing Units | 26 | 9.1% |
| Total Occupied Housing Units | 287 | 100.0% |
Occupancy by Household Size in Howells
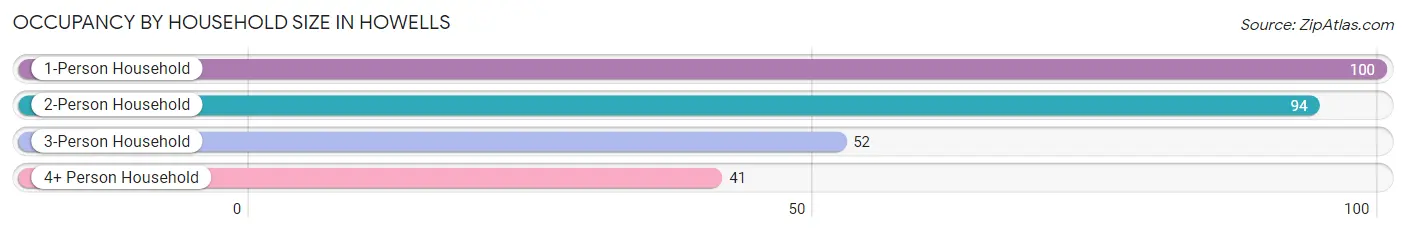
| Household Size | # Housing Units | % Housing Units |
| 1-Person Household | 100 | 34.8% |
| 2-Person Household | 94 | 32.8% |
| 3-Person Household | 52 | 18.1% |
| 4+ Person Household | 41 | 14.3% |
| Total Housing Units | 287 | 100.0% |
Occupancy by Ownership by Household Size in Howells
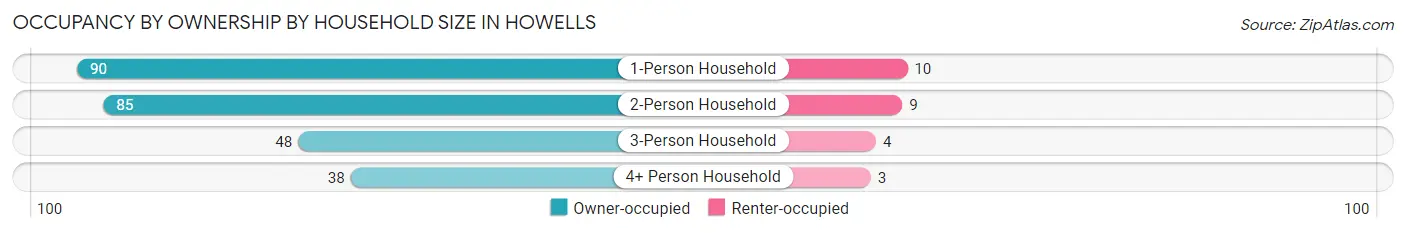
| Household Size | Owner-occupied | Renter-occupied |
| 1-Person Household | 90 (90.0%) | 10 (10.0%) |
| 2-Person Household | 85 (90.4%) | 9 (9.6%) |
| 3-Person Household | 48 (92.3%) | 4 (7.7%) |
| 4+ Person Household | 38 (92.7%) | 3 (7.3%) |
| Total Housing Units | 261 (90.9%) | 26 (9.1%) |
Occupancy by Educational Attainment in Howells
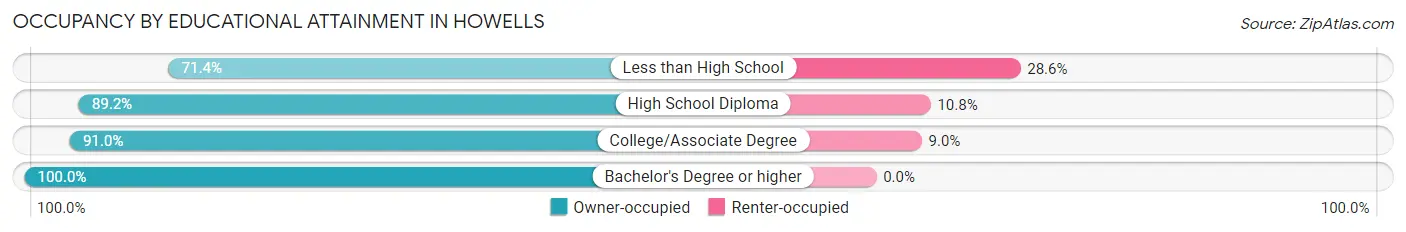
| Household Size | Owner-occupied | Renter-occupied |
| Less than High School | 25 (71.4%) | 10 (28.6%) |
| High School Diploma | 58 (89.2%) | 7 (10.8%) |
| College/Associate Degree | 91 (91.0%) | 9 (9.0%) |
| Bachelor's Degree or higher | 87 (100.0%) | 0 (0.0%) |
Occupancy by Age of Householder in Howells
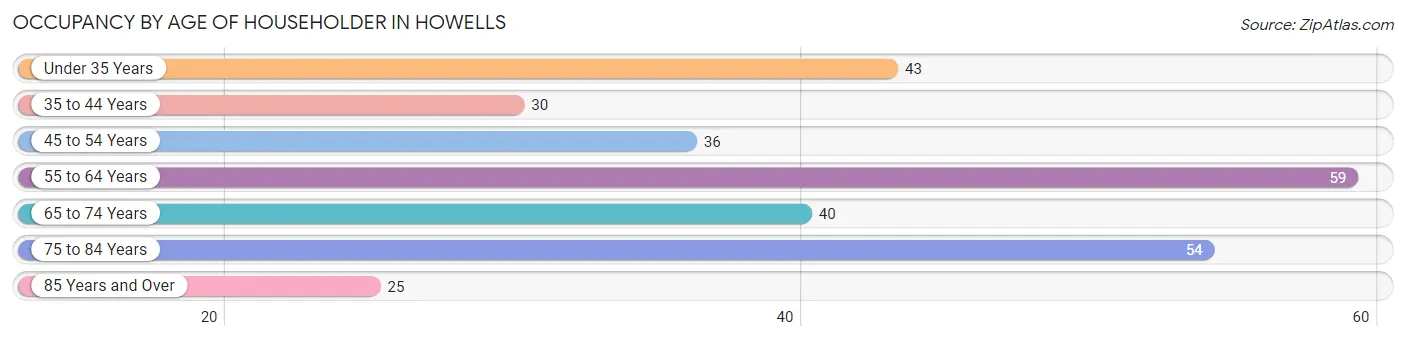
| Age Bracket | # Households | % Households |
| Under 35 Years | 43 | 15.0% |
| 35 to 44 Years | 30 | 10.4% |
| 45 to 54 Years | 36 | 12.5% |
| 55 to 64 Years | 59 | 20.6% |
| 65 to 74 Years | 40 | 13.9% |
| 75 to 84 Years | 54 | 18.8% |
| 85 Years and Over | 25 | 8.7% |
| Total | 287 | 100.0% |
Housing Finances in Howells
Median Income by Occupancy in Howells
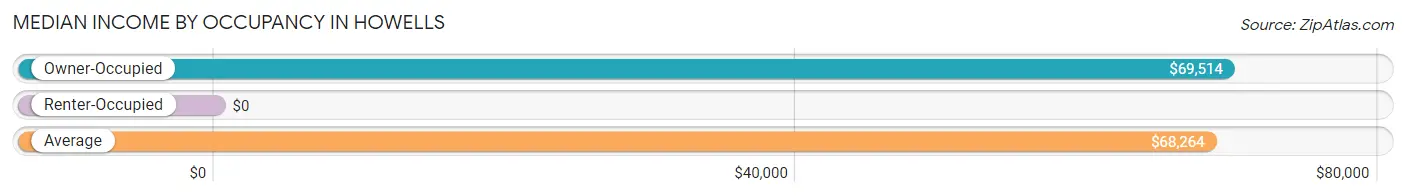
| Occupancy Type | # Households | Median Income |
| Owner-Occupied | 261 (90.9%) | $69,514 |
| Renter-Occupied | 26 (9.1%) | $0 |
| Average | 287 (100.0%) | $68,264 |
Occupancy by Householder Income Bracket in Howells
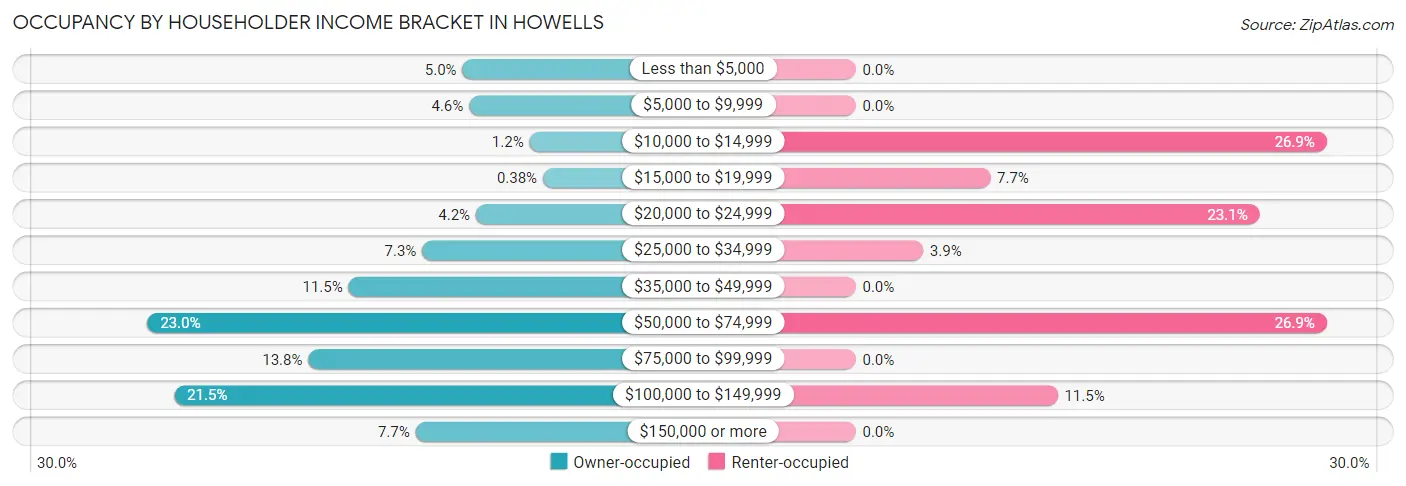
| Income Bracket | Owner-occupied | Renter-occupied |
| Less than $5,000 | 13 (5.0%) | 0 (0.0%) |
| $5,000 to $9,999 | 12 (4.6%) | 0 (0.0%) |
| $10,000 to $14,999 | 3 (1.1%) | 7 (26.9%) |
| $15,000 to $19,999 | 1 (0.4%) | 2 (7.7%) |
| $20,000 to $24,999 | 11 (4.2%) | 6 (23.1%) |
| $25,000 to $34,999 | 19 (7.3%) | 1 (3.8%) |
| $35,000 to $49,999 | 30 (11.5%) | 0 (0.0%) |
| $50,000 to $74,999 | 60 (23.0%) | 7 (26.9%) |
| $75,000 to $99,999 | 36 (13.8%) | 0 (0.0%) |
| $100,000 to $149,999 | 56 (21.5%) | 3 (11.5%) |
| $150,000 or more | 20 (7.7%) | 0 (0.0%) |
| Total | 261 (100.0%) | 26 (100.0%) |
Monthly Housing Cost Tiers in Howells
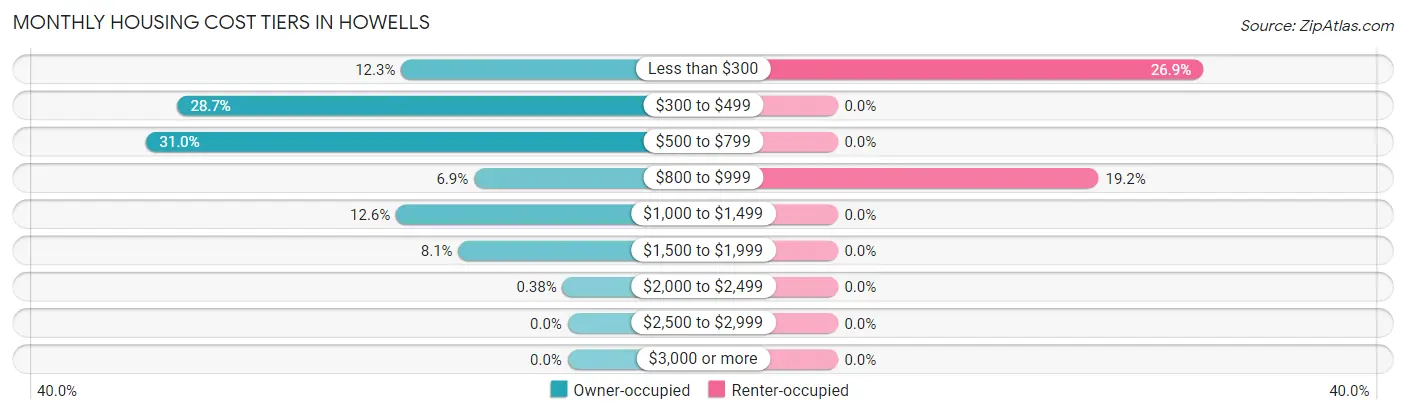
| Monthly Cost | Owner-occupied | Renter-occupied |
| Less than $300 | 32 (12.3%) | 7 (26.9%) |
| $300 to $499 | 75 (28.7%) | 0 (0.0%) |
| $500 to $799 | 81 (31.0%) | 0 (0.0%) |
| $800 to $999 | 18 (6.9%) | 5 (19.2%) |
| $1,000 to $1,499 | 33 (12.6%) | 0 (0.0%) |
| $1,500 to $1,999 | 21 (8.1%) | 0 (0.0%) |
| $2,000 to $2,499 | 1 (0.4%) | 0 (0.0%) |
| $2,500 to $2,999 | 0 (0.0%) | 0 (0.0%) |
| $3,000 or more | 0 (0.0%) | 0 (0.0%) |
| Total | 261 (100.0%) | 26 (100.0%) |
Physical Housing Characteristics in Howells
Housing Structures in Howells
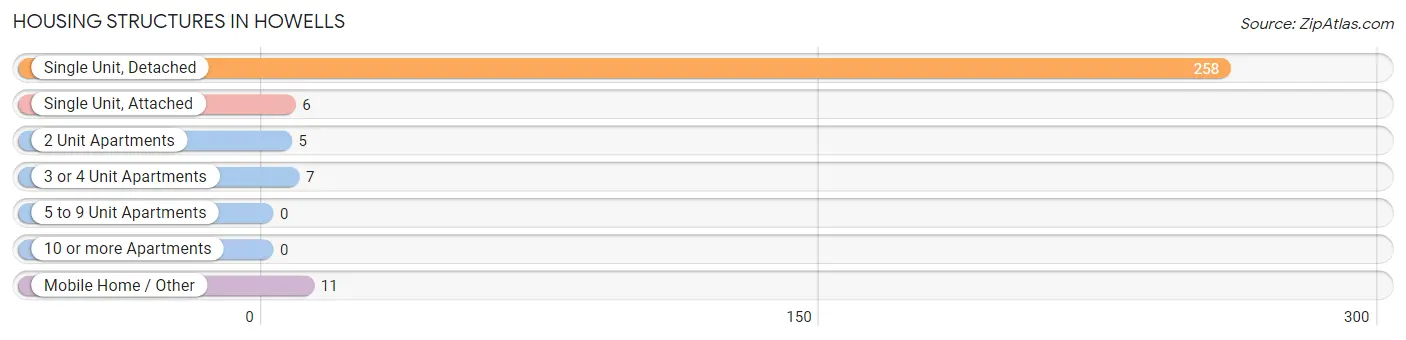
| Structure Type | # Housing Units | % Housing Units |
| Single Unit, Detached | 258 | 89.9% |
| Single Unit, Attached | 6 | 2.1% |
| 2 Unit Apartments | 5 | 1.7% |
| 3 or 4 Unit Apartments | 7 | 2.4% |
| 5 to 9 Unit Apartments | 0 | 0.0% |
| 10 or more Apartments | 0 | 0.0% |
| Mobile Home / Other | 11 | 3.8% |
| Total | 287 | 100.0% |
Housing Structures by Occupancy in Howells
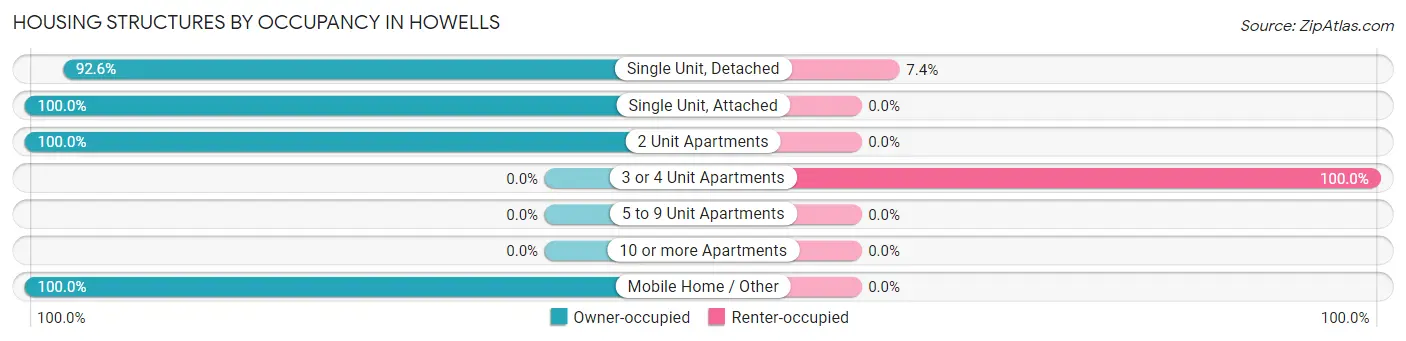
| Structure Type | Owner-occupied | Renter-occupied |
| Single Unit, Detached | 239 (92.6%) | 19 (7.4%) |
| Single Unit, Attached | 6 (100.0%) | 0 (0.0%) |
| 2 Unit Apartments | 5 (100.0%) | 0 (0.0%) |
| 3 or 4 Unit Apartments | 0 (0.0%) | 7 (100.0%) |
| 5 to 9 Unit Apartments | 0 (0.0%) | 0 (0.0%) |
| 10 or more Apartments | 0 (0.0%) | 0 (0.0%) |
| Mobile Home / Other | 11 (100.0%) | 0 (0.0%) |
| Total | 261 (90.9%) | 26 (9.1%) |
Housing Structures by Number of Rooms in Howells
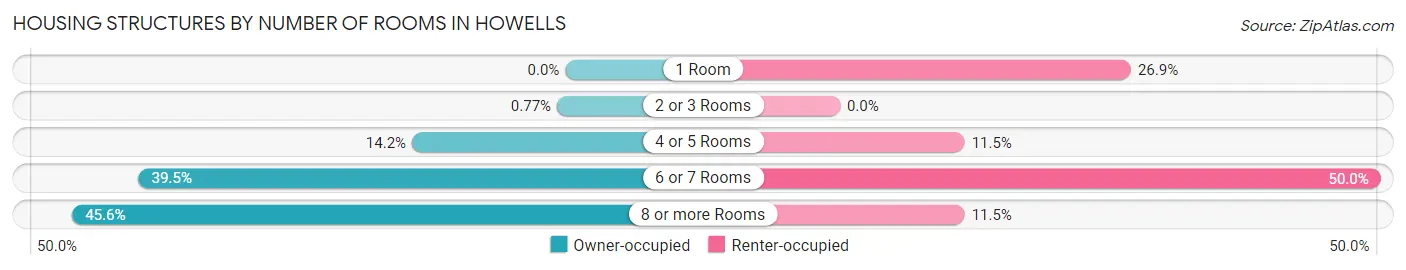
| Number of Rooms | Owner-occupied | Renter-occupied |
| 1 Room | 0 (0.0%) | 7 (26.9%) |
| 2 or 3 Rooms | 2 (0.8%) | 0 (0.0%) |
| 4 or 5 Rooms | 37 (14.2%) | 3 (11.5%) |
| 6 or 7 Rooms | 103 (39.5%) | 13 (50.0%) |
| 8 or more Rooms | 119 (45.6%) | 3 (11.5%) |
| Total | 261 (100.0%) | 26 (100.0%) |
Housing Structure by Heating Type in Howells
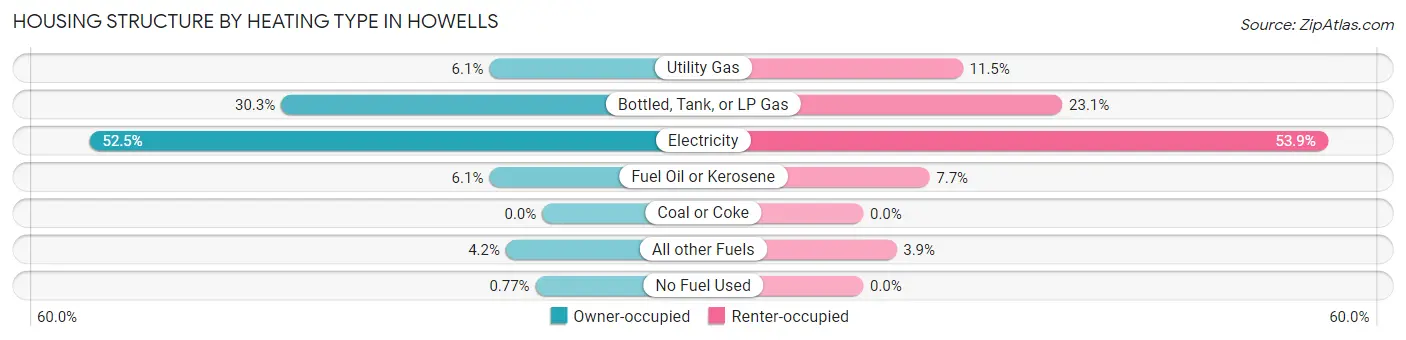
| Heating Type | Owner-occupied | Renter-occupied |
| Utility Gas | 16 (6.1%) | 3 (11.5%) |
| Bottled, Tank, or LP Gas | 79 (30.3%) | 6 (23.1%) |
| Electricity | 137 (52.5%) | 14 (53.8%) |
| Fuel Oil or Kerosene | 16 (6.1%) | 2 (7.7%) |
| Coal or Coke | 0 (0.0%) | 0 (0.0%) |
| All other Fuels | 11 (4.2%) | 1 (3.8%) |
| No Fuel Used | 2 (0.8%) | 0 (0.0%) |
| Total | 261 (100.0%) | 26 (100.0%) |
Household Vehicle Usage in Howells
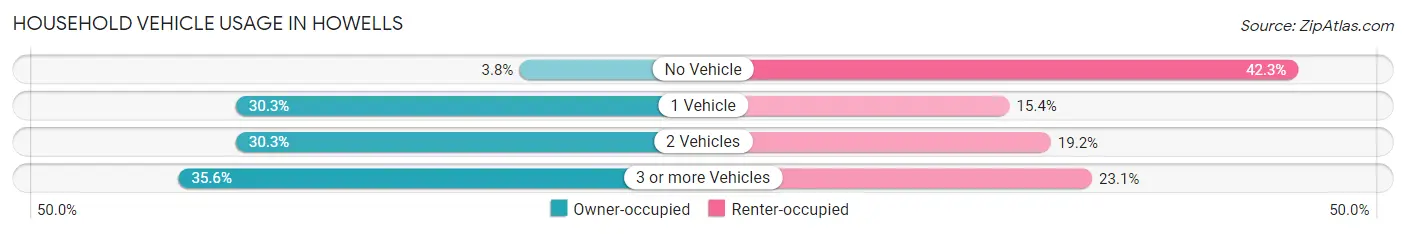
| Vehicles per Household | Owner-occupied | Renter-occupied |
| No Vehicle | 10 (3.8%) | 11 (42.3%) |
| 1 Vehicle | 79 (30.3%) | 4 (15.4%) |
| 2 Vehicles | 79 (30.3%) | 5 (19.2%) |
| 3 or more Vehicles | 93 (35.6%) | 6 (23.1%) |
| Total | 261 (100.0%) | 26 (100.0%) |
Real Estate & Mortgages in Howells
Real Estate and Mortgage Overview in Howells
| Characteristic | Without Mortgage | With Mortgage |
| Housing Units | 167 | 94 |
| Median Property Value | $79,200 | $119,400 |
| Median Household Income | $57,604 | $15 |
| Monthly Housing Costs | $474 | $0 |
| Real Estate Taxes | $982 | $0 |
Property Value by Mortgage Status in Howells
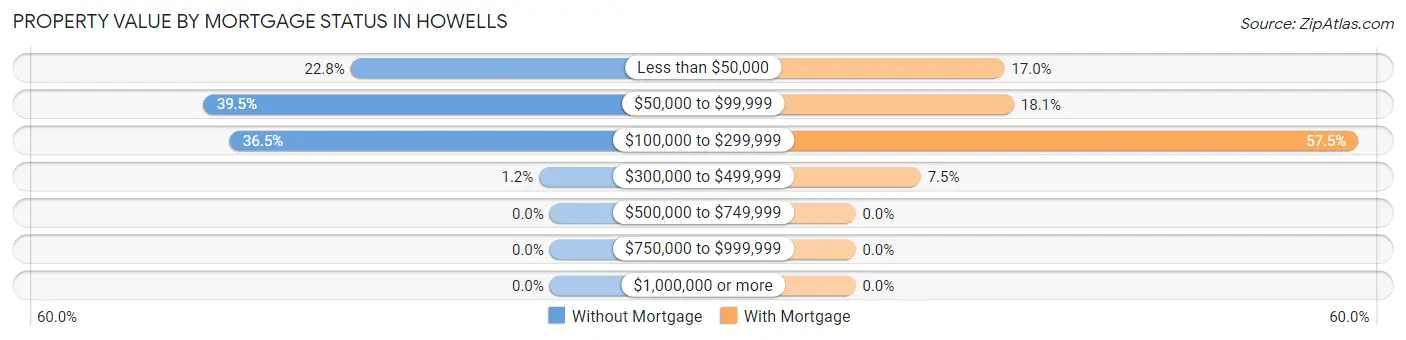
| Property Value | Without Mortgage | With Mortgage |
| Less than $50,000 | 38 (22.8%) | 16 (17.0%) |
| $50,000 to $99,999 | 66 (39.5%) | 17 (18.1%) |
| $100,000 to $299,999 | 61 (36.5%) | 54 (57.5%) |
| $300,000 to $499,999 | 2 (1.2%) | 7 (7.4%) |
| $500,000 to $749,999 | 0 (0.0%) | 0 (0.0%) |
| $750,000 to $999,999 | 0 (0.0%) | 0 (0.0%) |
| $1,000,000 or more | 0 (0.0%) | 0 (0.0%) |
| Total | 167 (100.0%) | 94 (100.0%) |
Household Income by Mortgage Status in Howells
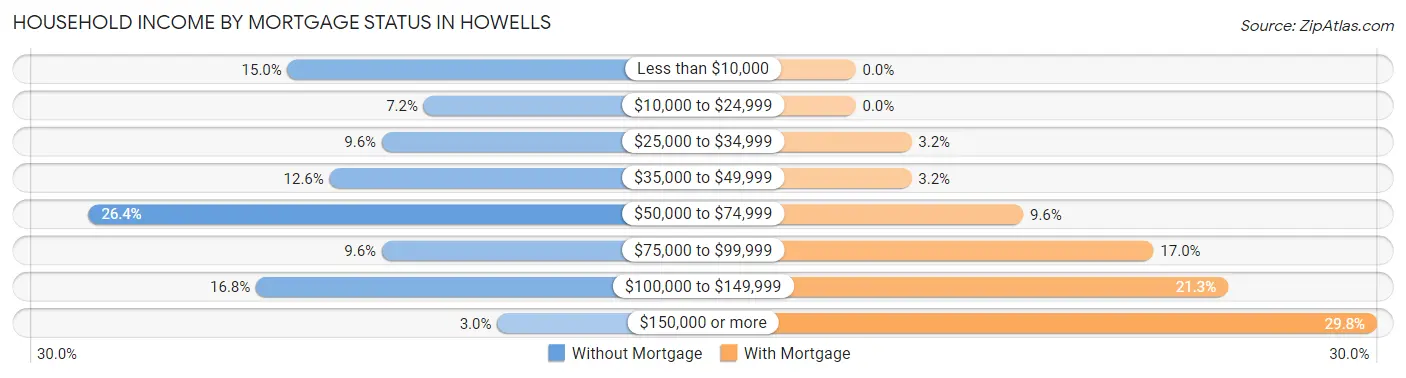
| Household Income | Without Mortgage | With Mortgage |
| Less than $10,000 | 25 (15.0%) | 0 (0.0%) |
| $10,000 to $24,999 | 12 (7.2%) | 0 (0.0%) |
| $25,000 to $34,999 | 16 (9.6%) | 3 (3.2%) |
| $35,000 to $49,999 | 21 (12.6%) | 3 (3.2%) |
| $50,000 to $74,999 | 44 (26.4%) | 9 (9.6%) |
| $75,000 to $99,999 | 16 (9.6%) | 16 (17.0%) |
| $100,000 to $149,999 | 28 (16.8%) | 20 (21.3%) |
| $150,000 or more | 5 (3.0%) | 28 (29.8%) |
| Total | 167 (100.0%) | 94 (100.0%) |
Property Value to Household Income Ratio in Howells
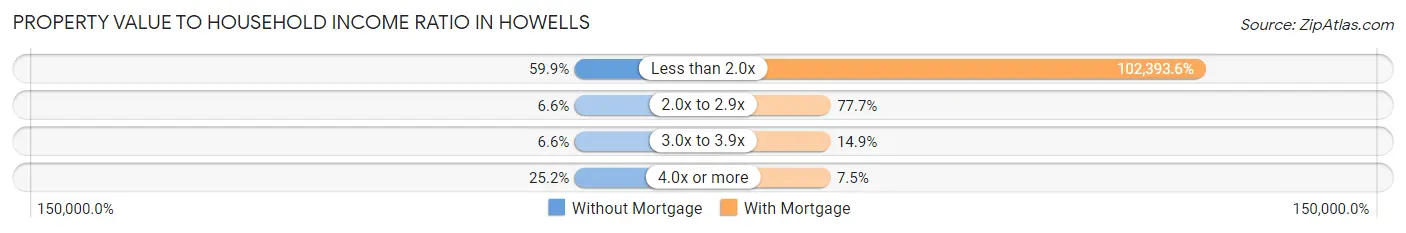
| Value-to-Income Ratio | Without Mortgage | With Mortgage |
| Less than 2.0x | 100 (59.9%) | 96,250 (102,393.6%) |
| 2.0x to 2.9x | 11 (6.6%) | 73 (77.7%) |
| 3.0x to 3.9x | 11 (6.6%) | 14 (14.9%) |
| 4.0x or more | 42 (25.2%) | 7 (7.4%) |
| Total | 167 (100.0%) | 94 (100.0%) |
Real Estate Taxes by Mortgage Status in Howells
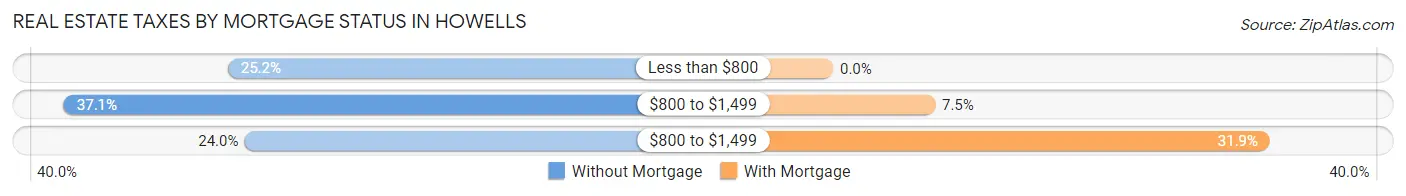
| Property Taxes | Without Mortgage | With Mortgage |
| Less than $800 | 42 (25.2%) | 0 (0.0%) |
| $800 to $1,499 | 62 (37.1%) | 7 (7.4%) |
| $800 to $1,499 | 40 (23.9%) | 30 (31.9%) |
| Total | 167 (100.0%) | 94 (100.0%) |
Health & Disability in Howells
Health Insurance Coverage by Age in Howells
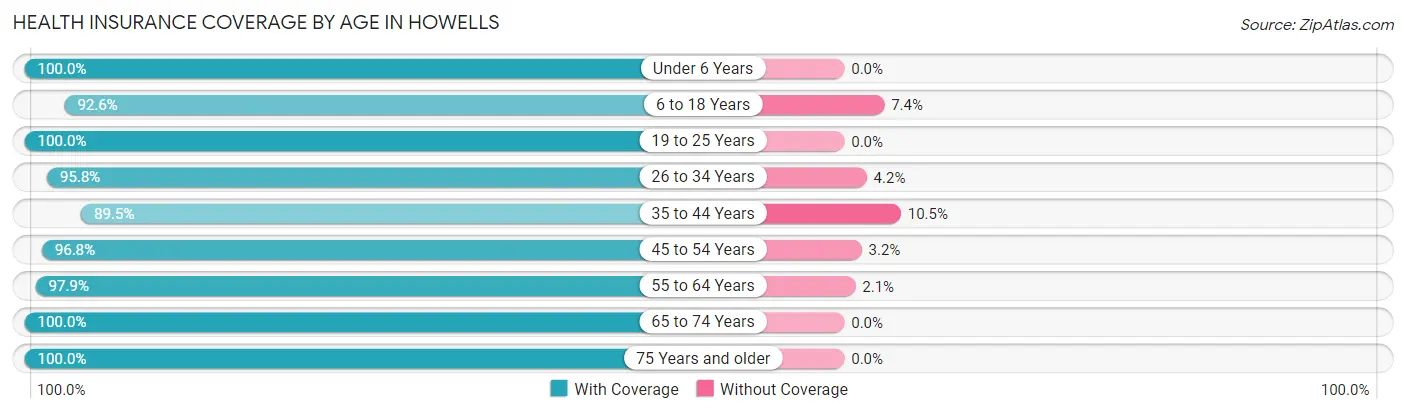
| Age Bracket | With Coverage | Without Coverage |
| Under 6 Years | 55 (100.0%) | 0 (0.0%) |
| 6 to 18 Years | 112 (92.6%) | 9 (7.4%) |
| 19 to 25 Years | 53 (100.0%) | 0 (0.0%) |
| 26 to 34 Years | 46 (95.8%) | 2 (4.2%) |
| 35 to 44 Years | 68 (89.5%) | 8 (10.5%) |
| 45 to 54 Years | 60 (96.8%) | 2 (3.2%) |
| 55 to 64 Years | 95 (97.9%) | 2 (2.1%) |
| 65 to 74 Years | 63 (100.0%) | 0 (0.0%) |
| 75 Years and older | 124 (100.0%) | 0 (0.0%) |
| Total | 676 (96.7%) | 23 (3.3%) |
Health Insurance Coverage by Citizenship Status in Howells
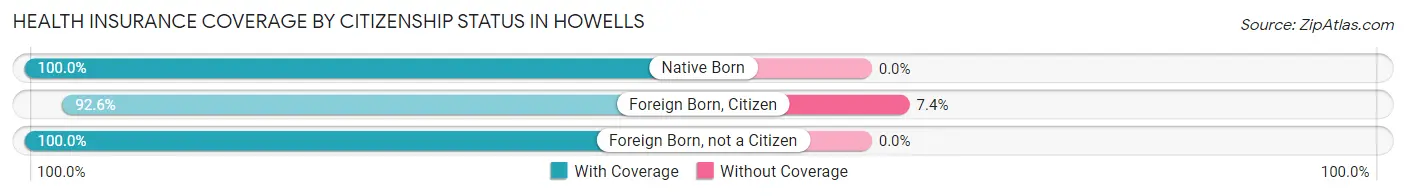
| Citizenship Status | With Coverage | Without Coverage |
| Native Born | 55 (100.0%) | 0 (0.0%) |
| Foreign Born, Citizen | 112 (92.6%) | 9 (7.4%) |
| Foreign Born, not a Citizen | 53 (100.0%) | 0 (0.0%) |
Health Insurance Coverage by Household Income in Howells
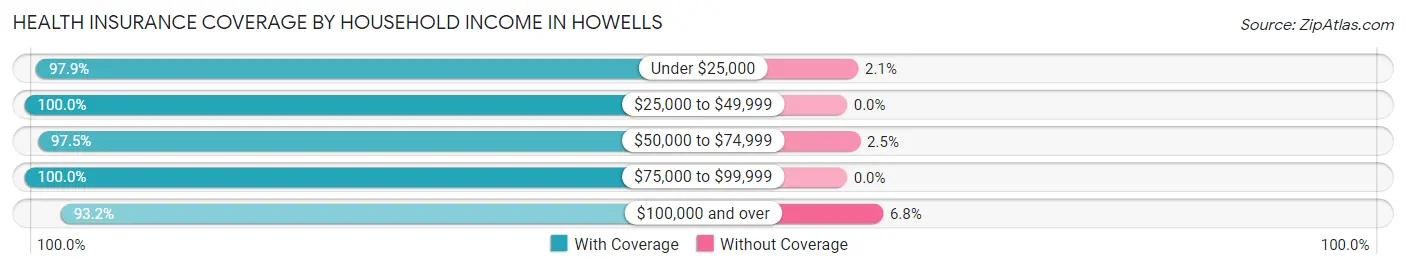
| Household Income | With Coverage | Without Coverage |
| Under $25,000 | 92 (97.9%) | 2 (2.1%) |
| $25,000 to $49,999 | 78 (100.0%) | 0 (0.0%) |
| $50,000 to $74,999 | 156 (97.5%) | 4 (2.5%) |
| $75,000 to $99,999 | 116 (100.0%) | 0 (0.0%) |
| $100,000 and over | 234 (93.2%) | 17 (6.8%) |
Public vs Private Health Insurance Coverage by Age in Howells
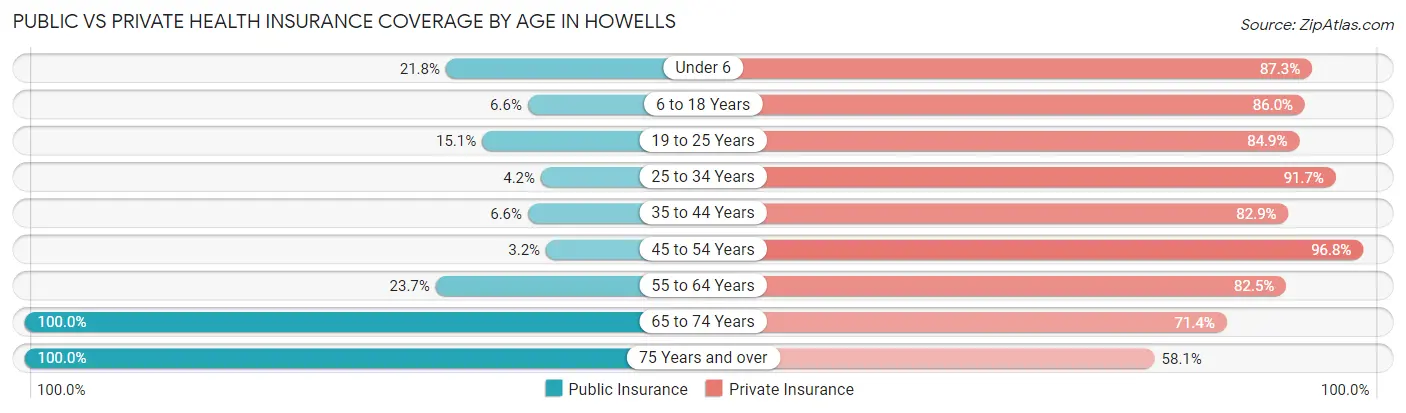
| Age Bracket | Public Insurance | Private Insurance |
| Under 6 | 12 (21.8%) | 48 (87.3%) |
| 6 to 18 Years | 8 (6.6%) | 104 (86.0%) |
| 19 to 25 Years | 8 (15.1%) | 45 (84.9%) |
| 25 to 34 Years | 2 (4.2%) | 44 (91.7%) |
| 35 to 44 Years | 5 (6.6%) | 63 (82.9%) |
| 45 to 54 Years | 2 (3.2%) | 60 (96.8%) |
| 55 to 64 Years | 23 (23.7%) | 80 (82.5%) |
| 65 to 74 Years | 63 (100.0%) | 45 (71.4%) |
| 75 Years and over | 124 (100.0%) | 72 (58.1%) |
| Total | 247 (35.3%) | 561 (80.3%) |
Disability Status by Sex by Age in Howells
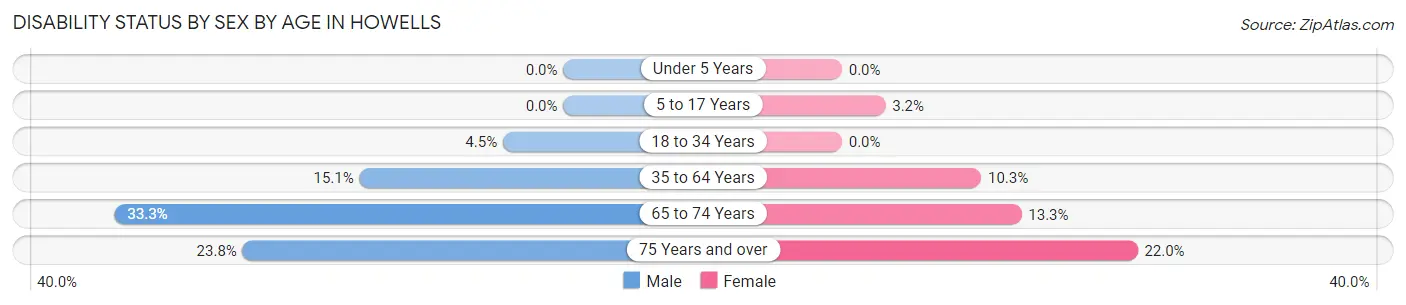
| Age Bracket | Male | Female |
| Under 5 Years | 0 (0.0%) | 0 (0.0%) |
| 5 to 17 Years | 0 (0.0%) | 2 (3.2%) |
| 18 to 34 Years | 3 (4.5%) | 0 (0.0%) |
| 35 to 64 Years | 18 (15.1%) | 12 (10.3%) |
| 65 to 74 Years | 6 (33.3%) | 6 (13.3%) |
| 75 Years and over | 10 (23.8%) | 18 (22.0%) |
Disability Class by Sex by Age in Howells
Disability Class: Hearing Difficulty
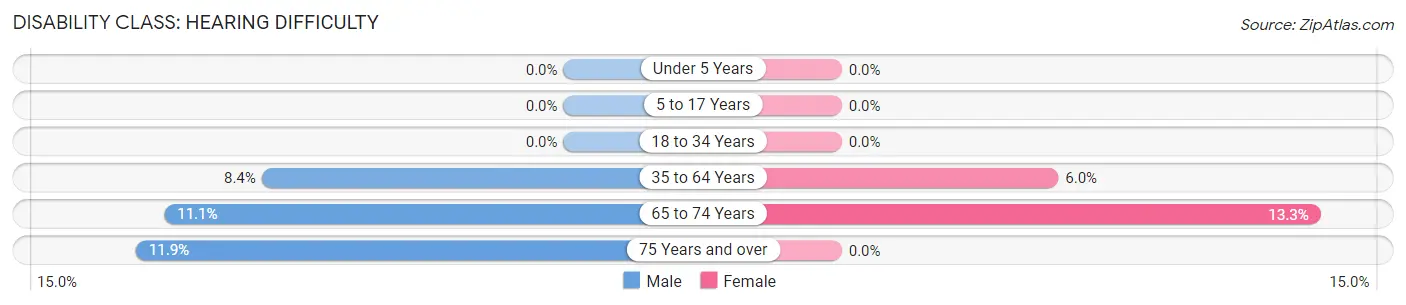
| Age Bracket | Male | Female |
| Under 5 Years | 0 (0.0%) | 0 (0.0%) |
| 5 to 17 Years | 0 (0.0%) | 0 (0.0%) |
| 18 to 34 Years | 0 (0.0%) | 0 (0.0%) |
| 35 to 64 Years | 10 (8.4%) | 7 (6.0%) |
| 65 to 74 Years | 2 (11.1%) | 6 (13.3%) |
| 75 Years and over | 5 (11.9%) | 0 (0.0%) |
Disability Class: Vision Difficulty
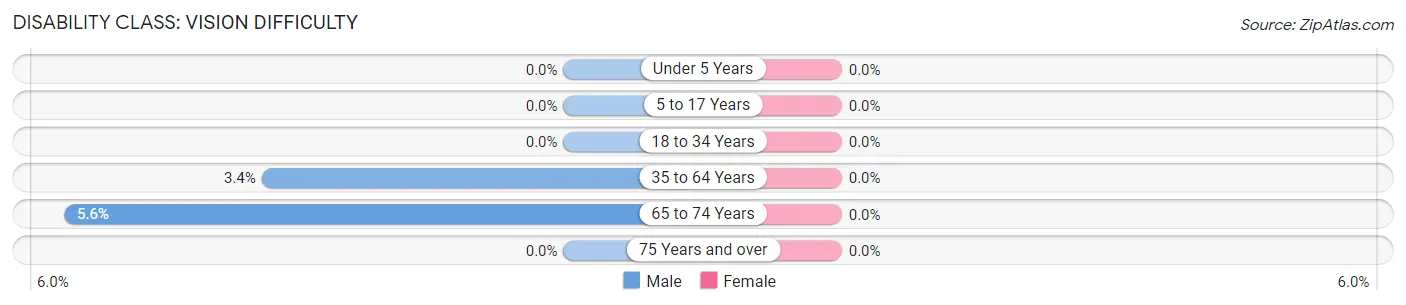
| Age Bracket | Male | Female |
| Under 5 Years | 0 (0.0%) | 0 (0.0%) |
| 5 to 17 Years | 0 (0.0%) | 0 (0.0%) |
| 18 to 34 Years | 0 (0.0%) | 0 (0.0%) |
| 35 to 64 Years | 4 (3.4%) | 0 (0.0%) |
| 65 to 74 Years | 1 (5.6%) | 0 (0.0%) |
| 75 Years and over | 0 (0.0%) | 0 (0.0%) |
Disability Class: Cognitive Difficulty
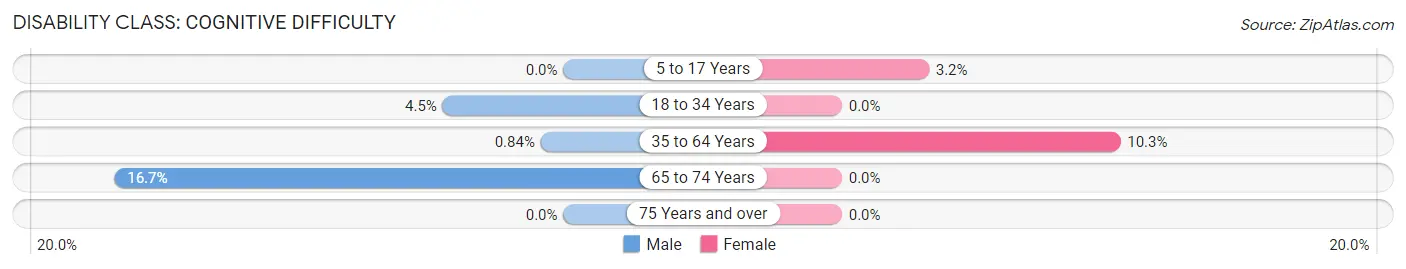
| Age Bracket | Male | Female |
| 5 to 17 Years | 0 (0.0%) | 2 (3.2%) |
| 18 to 34 Years | 3 (4.5%) | 0 (0.0%) |
| 35 to 64 Years | 1 (0.8%) | 12 (10.3%) |
| 65 to 74 Years | 3 (16.7%) | 0 (0.0%) |
| 75 Years and over | 0 (0.0%) | 0 (0.0%) |
Disability Class: Ambulatory Difficulty
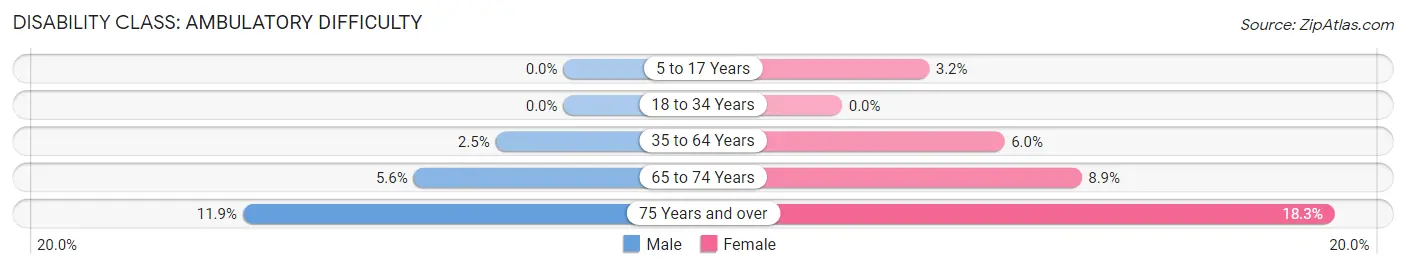
| Age Bracket | Male | Female |
| 5 to 17 Years | 0 (0.0%) | 2 (3.2%) |
| 18 to 34 Years | 0 (0.0%) | 0 (0.0%) |
| 35 to 64 Years | 3 (2.5%) | 7 (6.0%) |
| 65 to 74 Years | 1 (5.6%) | 4 (8.9%) |
| 75 Years and over | 5 (11.9%) | 15 (18.3%) |
Disability Class: Self-Care Difficulty
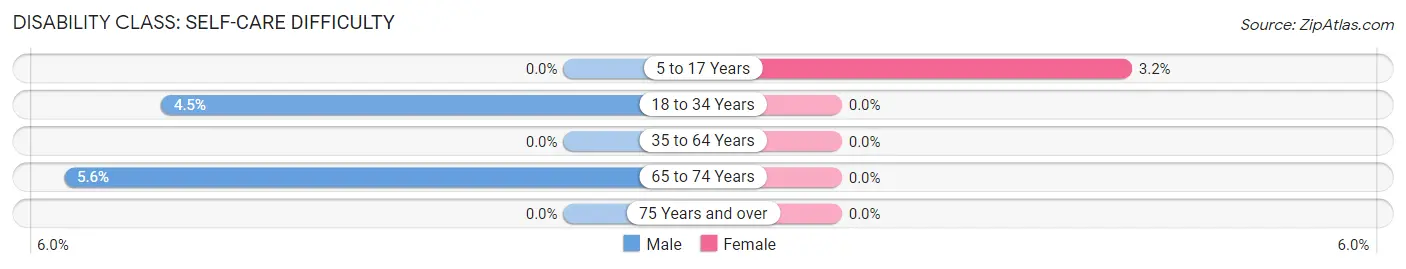
| Age Bracket | Male | Female |
| 5 to 17 Years | 0 (0.0%) | 2 (3.2%) |
| 18 to 34 Years | 3 (4.5%) | 0 (0.0%) |
| 35 to 64 Years | 0 (0.0%) | 0 (0.0%) |
| 65 to 74 Years | 1 (5.6%) | 0 (0.0%) |
| 75 Years and over | 0 (0.0%) | 0 (0.0%) |
Technology Access in Howells
Computing Device Access in Howells
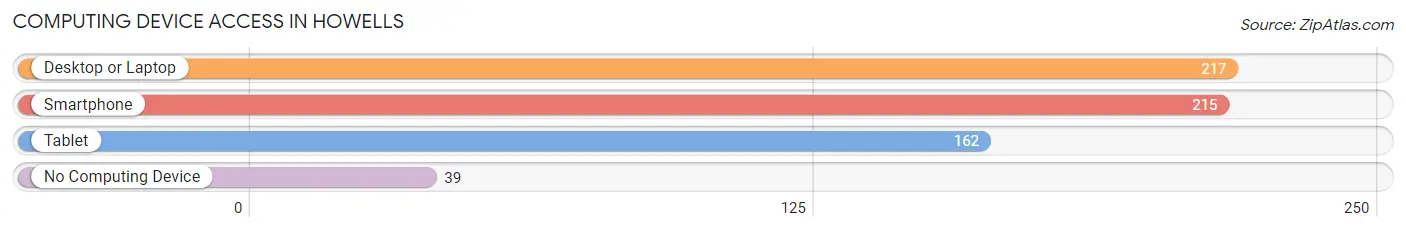
| Device Type | # Households | % Households |
| Desktop or Laptop | 217 | 75.6% |
| Smartphone | 215 | 74.9% |
| Tablet | 162 | 56.5% |
| No Computing Device | 39 | 13.6% |
| Total | 287 | 100.0% |
Internet Access in Howells
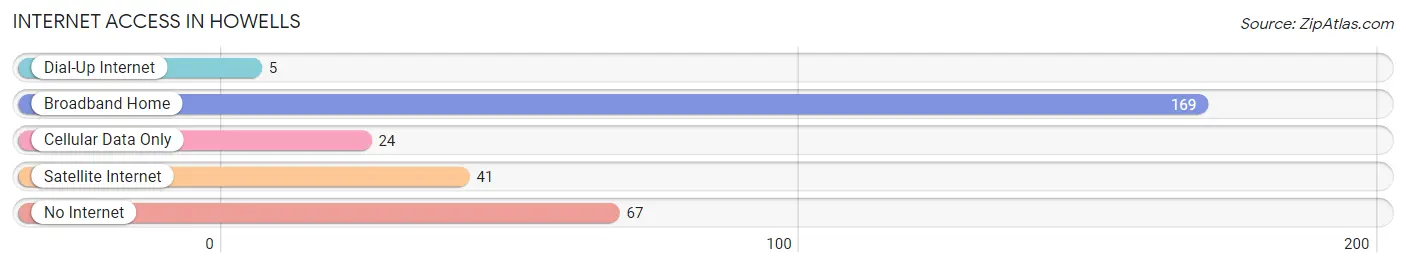
| Internet Type | # Households | % Households |
| Dial-Up Internet | 5 | 1.7% |
| Broadband Home | 169 | 58.9% |
| Cellular Data Only | 24 | 8.4% |
| Satellite Internet | 41 | 14.3% |
| No Internet | 67 | 23.3% |
| Total | 287 | 100.0% |
Howells Summary
Howells, Nebraska is a small village located in Colfax County, Nebraska. It is situated on the banks of the Elkhorn River, approximately 20 miles northwest of Norfolk. The village was founded in 1887 and has a population of approximately 500 people.
History
The area that is now Howells was first settled in the late 1800s by German immigrants. The village was named after the first postmaster, John Howells. The first post office was established in 1887 and the village was officially incorporated in 1891.
The village was originally a farming community, but in the early 1900s, the railroad came through and the village began to grow. The railroad brought new businesses and industries to the area, including a flour mill, a creamery, and a brickyard.
In the 1920s, the village was home to a number of businesses, including a bank, a hotel, a movie theater, and a variety of stores. The village also had a school, a library, and a number of churches.
Geography
Howells is located in Colfax County, Nebraska, approximately 20 miles northwest of Norfolk. The village is situated on the banks of the Elkhorn River. The village is surrounded by rolling hills and farmland.
The climate in Howells is typical of the Midwest, with hot summers and cold winters. The average temperature in the summer is around 80 degrees Fahrenheit, and the average temperature in the winter is around 20 degrees Fahrenheit.
Economy
The economy of Howells is largely based on agriculture. The village is home to a number of farms, which produce corn, soybeans, and other crops. The village also has a number of businesses, including a grocery store, a hardware store, and a variety of other stores.
Demographics
As of the 2010 census, the population of Howells was 498. The racial makeup of the village was 97.2% White, 0.2% African American, 0.2% Native American, 0.2% Asian, 0.2% from other races, and 1.8% from two or more races. Hispanic or Latino of any race were 0.8% of the population.
The median income for a household in Howells was $41,250, and the median income for a family was $45,000. The per capita income for the village was $17,845. About 8.2% of families and 10.2% of the population were below the poverty line, including 11.2% of those under age 18 and 8.2% of those age 65 or over.
Common Questions
What is Per Capita Income in Howells?
Per Capita income in Howells is $31,783.
What is the Median Family Income in Howells?
Median Family Income in Howells is $86,000.
What is the Median Household income in Howells?
Median Household Income in Howells is $68,264.
What is Income or Wage Gap in Howells?
Income or Wage Gap in Howells is 28.6%.
Women in Howells earn 71.4 cents for every dollar earned by a man.
What is Inequality or Gini Index in Howells?
Inequality or Gini Index in Howells is 0.41.
What is the Total Population of Howells?
Total Population of Howells is 699.
What is the Total Male Population of Howells?
Total Male Population of Howells is 326.
What is the Total Female Population of Howells?
Total Female Population of Howells is 373.
What is the Ratio of Males per 100 Females in Howells?
There are 87.40 Males per 100 Females in Howells.
What is the Ratio of Females per 100 Males in Howells?
There are 114.42 Females per 100 Males in Howells.
What is the Median Population Age in Howells?
Median Population Age in Howells is 43.7 Years.
What is the Average Family Size in Howells
Average Family Size in Howells is 3.2 People.
What is the Average Household Size in Howells
Average Household Size in Howells is 2.4 People.
How Large is the Labor Force in Howells?
There are 348 People in the Labor Forcein in Howells.
What is the Percentage of People in the Labor Force in Howells?
62.0% of People are in the Labor Force in Howells.