Beatrice, NE Map & Demographics
Beatrice Map
Beatrice Overview
$29,369
PER CAPITA INCOME
$69,417
AVG FAMILY INCOME
$49,537
AVG HOUSEHOLD INCOME
30.6%
WAGE / INCOME GAP [ % ]
69.4¢/ $1
WAGE / INCOME GAP [ $ ]
$11,037
FAMILY INCOME DEFICIT
0.44
INEQUALITY / GINI INDEX
12,237
TOTAL POPULATION
5,935
MALE POPULATION
6,302
FEMALE POPULATION
94.18
MALES / 100 FEMALES
106.18
FEMALES / 100 MALES
42.9
MEDIAN AGE
2.9
AVG FAMILY SIZE
2.1
AVG HOUSEHOLD SIZE
6,009
LABOR FORCE [ PEOPLE ]
60.6%
PERCENT IN LABOR FORCE
3.0%
UNEMPLOYMENT RATE
Beatrice Zip Codes
Beatrice Area Codes
Income in Beatrice
Income Overview in Beatrice
Per Capita Income in Beatrice is $29,369, while median incomes of families and households are $69,417 and $49,537 respectively.
| Characteristic | Number | Measure |
| Per Capita Income | 12,237 | $29,369 |
| Median Family Income | 2,861 | $69,417 |
| Mean Family Income | 2,861 | $82,418 |
| Median Household Income | 5,482 | $49,537 |
| Mean Household Income | 5,482 | $62,370 |
| Income Deficit | 2,861 | $11,037 |
| Wage / Income Gap (%) | 12,237 | 30.64% |
| Wage / Income Gap ($) | 12,237 | 69.36¢ per $1 |
| Gini / Inequality Index | 12,237 | 0.44 |
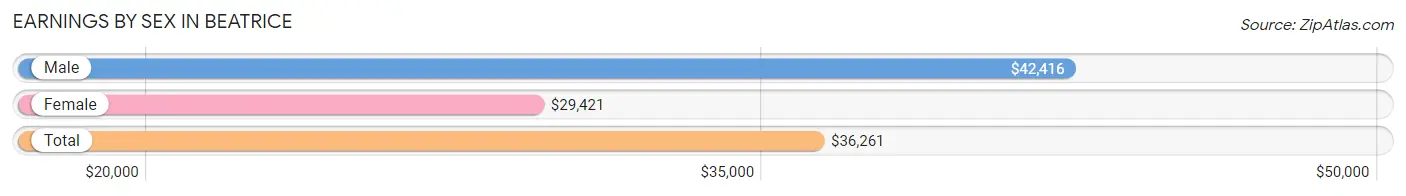
Earnings by Sex in Beatrice
Average Earnings in Beatrice are $36,261, $42,416 for men and $29,421 for women, a difference of 30.6%.
| Sex | Number | Average Earnings |
| Male | 3,235 (50.9%) | $42,416 |
| Female | 3,115 (49.1%) | $29,421 |
| Total | 6,350 (100.0%) | $36,261 |
Earnings by Sex by Income Bracket in Beatrice
The most common earnings brackets in Beatrice are $75,000 to $99,999 for men (385 | 11.9%) and $30,000 to $34,999 for women (288 | 9.2%).
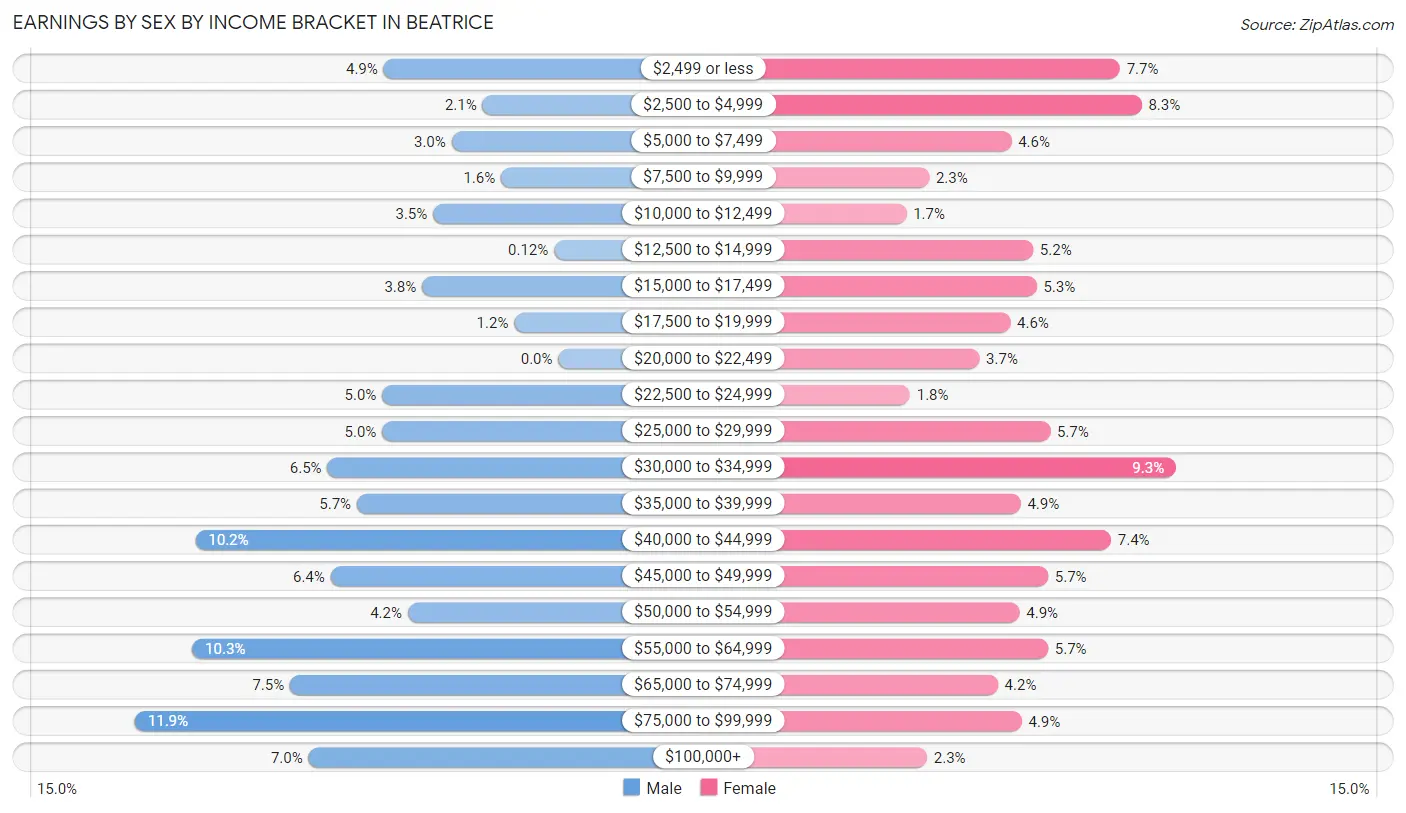
| Income | Male | Female |
| $2,499 or less | 159 (4.9%) | 239 (7.7%) |
| $2,500 to $4,999 | 69 (2.1%) | 258 (8.3%) |
| $5,000 to $7,499 | 97 (3.0%) | 144 (4.6%) |
| $7,500 to $9,999 | 52 (1.6%) | 72 (2.3%) |
| $10,000 to $12,499 | 114 (3.5%) | 52 (1.7%) |
| $12,500 to $14,999 | 4 (0.1%) | 163 (5.2%) |
| $15,000 to $17,499 | 124 (3.8%) | 166 (5.3%) |
| $17,500 to $19,999 | 40 (1.2%) | 143 (4.6%) |
| $20,000 to $22,499 | 0 (0.0%) | 116 (3.7%) |
| $22,500 to $24,999 | 160 (5.0%) | 55 (1.8%) |
| $25,000 to $29,999 | 160 (5.0%) | 178 (5.7%) |
| $30,000 to $34,999 | 210 (6.5%) | 288 (9.2%) |
| $35,000 to $39,999 | 183 (5.7%) | 152 (4.9%) |
| $40,000 to $44,999 | 330 (10.2%) | 231 (7.4%) |
| $45,000 to $49,999 | 207 (6.4%) | 176 (5.7%) |
| $50,000 to $54,999 | 137 (4.2%) | 151 (4.9%) |
| $55,000 to $64,999 | 333 (10.3%) | 176 (5.7%) |
| $65,000 to $74,999 | 244 (7.5%) | 132 (4.2%) |
| $75,000 to $99,999 | 385 (11.9%) | 153 (4.9%) |
| $100,000+ | 227 (7.0%) | 70 (2.2%) |
| Total | 3,235 (100.0%) | 3,115 (100.0%) |
Earnings by Sex by Educational Attainment in Beatrice
Average earnings in Beatrice are $47,773 for men and $33,459 for women, a difference of 30.0%. Men with an educational attainment of graduate degree enjoy the highest average annual earnings of $93,750, while those with less than high school education earn the least with $33,542. Women with an educational attainment of graduate degree earn the most with the average annual earnings of $79,625, while those with high school diploma education have the smallest earnings of $20,208.
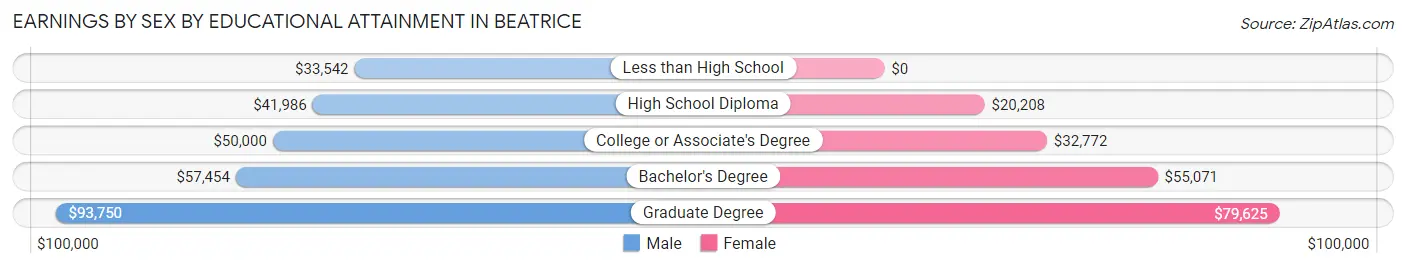
| Educational Attainment | Male Income | Female Income |
| Less than High School | $33,542 | $0 |
| High School Diploma | $41,986 | $20,208 |
| College or Associate's Degree | $50,000 | $32,772 |
| Bachelor's Degree | $57,454 | $55,071 |
| Graduate Degree | $93,750 | $79,625 |
| Total | $47,773 | $33,459 |
Family Income in Beatrice
Family Income Brackets in Beatrice
According to the Beatrice family income data, there are 584 families falling into the $100,000 to $149,999 income range, which is the most common income bracket and makes up 20.4% of all families. Conversely, the $10,000 to $14,999 income bracket is the least frequent group with only 40 families (1.4%) belonging to this category.
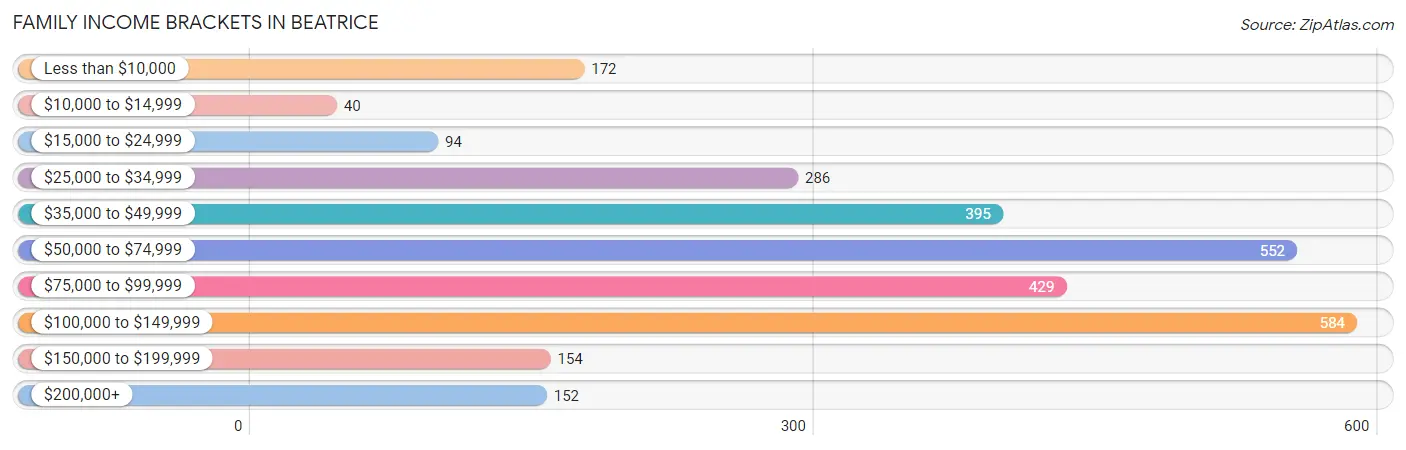
| Income Bracket | # Families | % Families |
| Less than $10,000 | 172 | 6.0% |
| $10,000 to $14,999 | 40 | 1.4% |
| $15,000 to $24,999 | 94 | 3.3% |
| $25,000 to $34,999 | 286 | 10.0% |
| $35,000 to $49,999 | 395 | 13.8% |
| $50,000 to $74,999 | 552 | 19.3% |
| $75,000 to $99,999 | 429 | 15.0% |
| $100,000 to $149,999 | 584 | 20.4% |
| $150,000 to $199,999 | 154 | 5.4% |
| $200,000+ | 152 | 5.3% |
Family Income by Famaliy Size in Beatrice
4-person families (436 | 15.2%) account for the highest median family income in Beatrice with $86,667 per family, while 2-person families (1,614 | 56.4%) have the highest median income of $31,307 per family member.
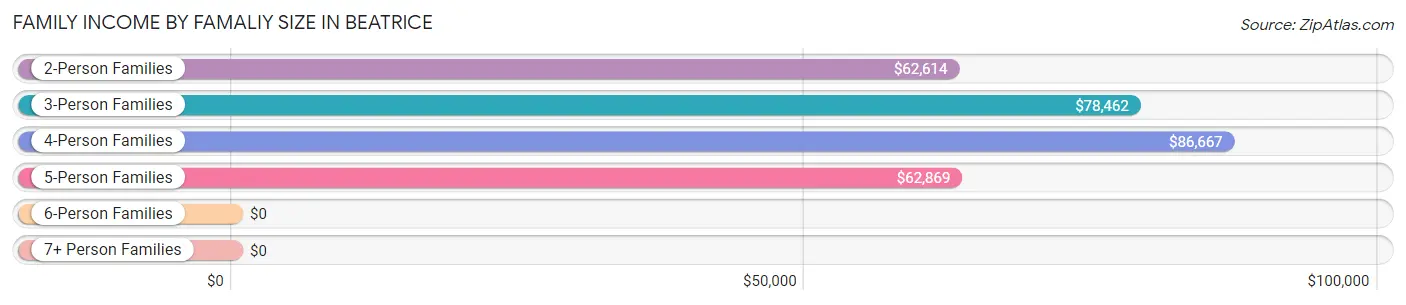
| Income Bracket | # Families | Median Income |
| 2-Person Families | 1,614 (56.4%) | $62,614 |
| 3-Person Families | 538 (18.8%) | $78,462 |
| 4-Person Families | 436 (15.2%) | $86,667 |
| 5-Person Families | 167 (5.8%) | $62,869 |
| 6-Person Families | 86 (3.0%) | $0 |
| 7+ Person Families | 20 (0.7%) | $0 |
| Total | 2,861 (100.0%) | $69,417 |
Family Income by Number of Earners in Beatrice
The median family income in Beatrice is $69,417, with families comprising 3+ earners (203) having the highest median family income of $133,194, while families with no earners (446) have the lowest median family income of $35,658, accounting for 7.1% and 15.6% of families, respectively.
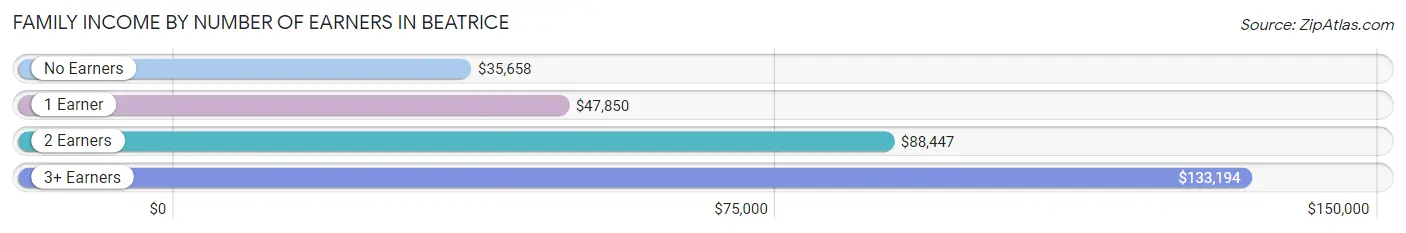
| Number of Earners | # Families | Median Income |
| No Earners | 446 (15.6%) | $35,658 |
| 1 Earner | 863 (30.2%) | $47,850 |
| 2 Earners | 1,349 (47.1%) | $88,447 |
| 3+ Earners | 203 (7.1%) | $133,194 |
| Total | 2,861 (100.0%) | $69,417 |
Household Income in Beatrice
Household Income Brackets in Beatrice
With 1,009 households falling in the category, the $50,000 to $74,999 income range is the most frequent in Beatrice, accounting for 18.4% of all households. In contrast, only 159 households (2.9%) fall into the $200,000+ income bracket, making it the least populous group.
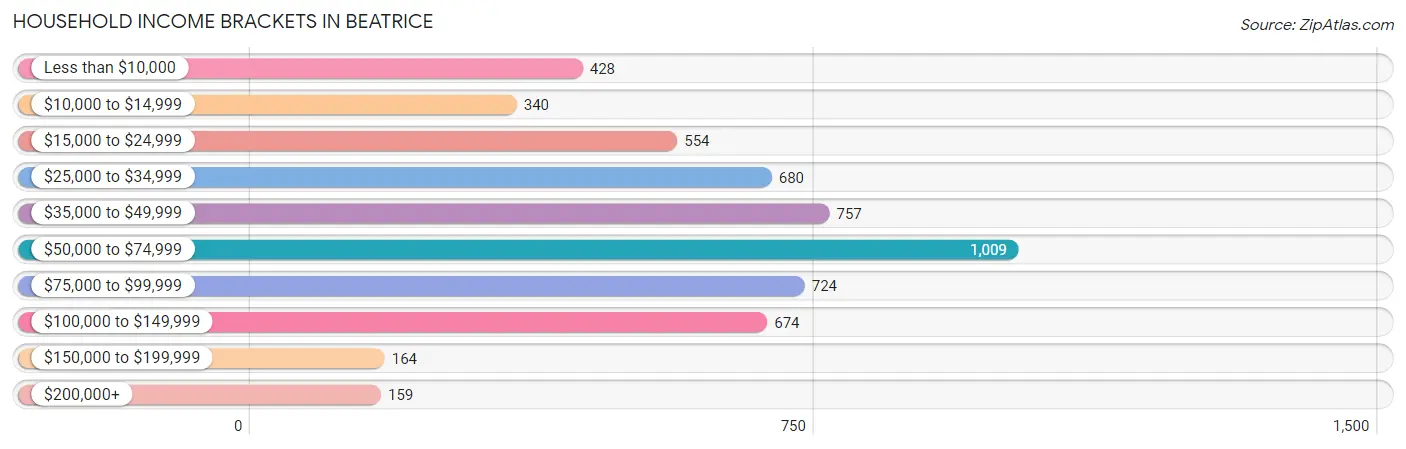
| Income Bracket | # Households | % Households |
| Less than $10,000 | 428 | 7.8% |
| $10,000 to $14,999 | 340 | 6.2% |
| $15,000 to $24,999 | 554 | 10.1% |
| $25,000 to $34,999 | 680 | 12.4% |
| $35,000 to $49,999 | 757 | 13.8% |
| $50,000 to $74,999 | 1,009 | 18.4% |
| $75,000 to $99,999 | 724 | 13.2% |
| $100,000 to $149,999 | 674 | 12.3% |
| $150,000 to $199,999 | 164 | 3.0% |
| $200,000+ | 159 | 2.9% |
Household Income by Householder Age in Beatrice
The median household income in Beatrice is $49,537, with the highest median household income of $62,760 found in the 45 to 64 years age bracket for the primary householder. A total of 1,921 households (35.0%) fall into this category. Meanwhile, the 15 to 24 years age bracket for the primary householder has the lowest median household income of $0, with 197 households (3.6%) in this group.
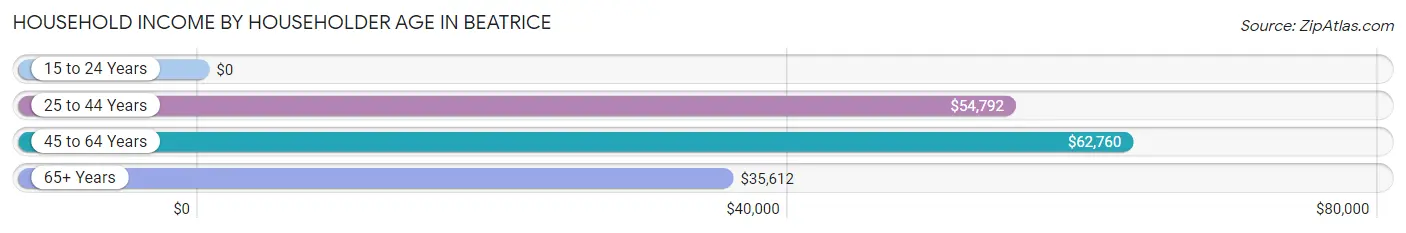
| Income Bracket | # Households | Median Income |
| 15 to 24 Years | 197 (3.6%) | $0 |
| 25 to 44 Years | 1,462 (26.7%) | $54,792 |
| 45 to 64 Years | 1,921 (35.0%) | $62,760 |
| 65+ Years | 1,902 (34.7%) | $35,612 |
| Total | 5,482 (100.0%) | $49,537 |
Poverty in Beatrice
Income Below Poverty by Sex and Age in Beatrice
With 16.8% poverty level for males and 23.3% for females among the residents of Beatrice, under 5 year old males and under 5 year old females are the most vulnerable to poverty, with 147 males (35.1%) and 153 females (52.9%) in their respective age groups living below the poverty level.
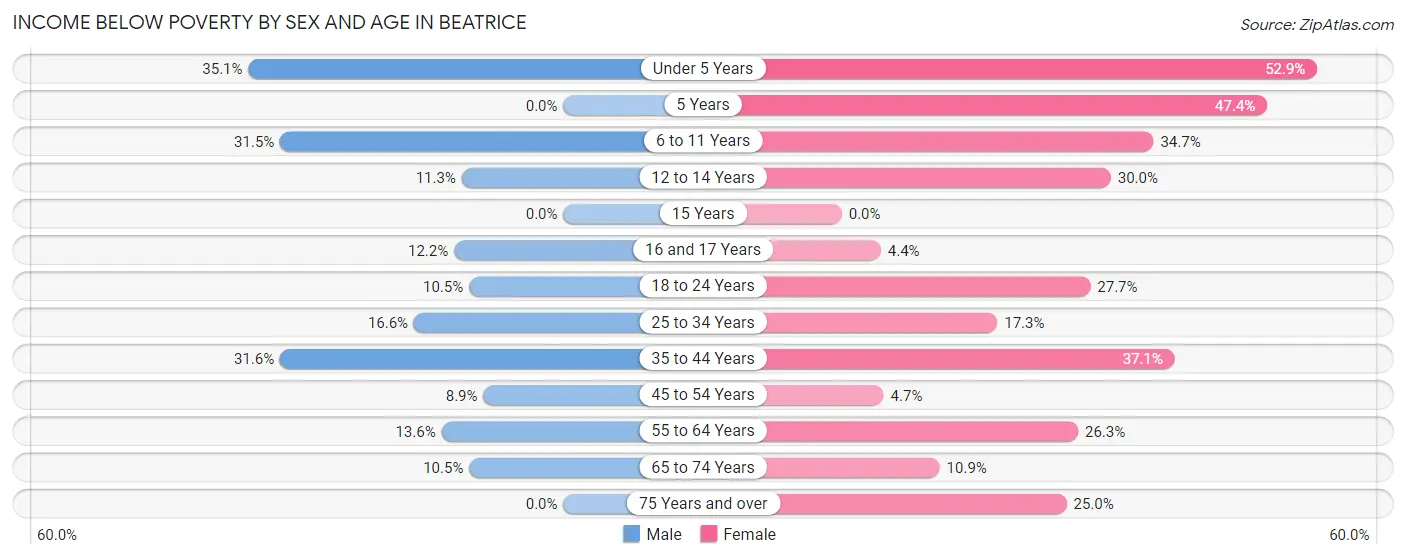
| Age Bracket | Male | Female |
| Under 5 Years | 147 (35.1%) | 153 (52.9%) |
| 5 Years | 0 (0.0%) | 27 (47.4%) |
| 6 to 11 Years | 123 (31.5%) | 143 (34.7%) |
| 12 to 14 Years | 30 (11.3%) | 71 (30.0%) |
| 15 Years | 0 (0.0%) | 0 (0.0%) |
| 16 and 17 Years | 23 (12.2%) | 7 (4.3%) |
| 18 to 24 Years | 38 (10.5%) | 116 (27.7%) |
| 25 to 34 Years | 106 (16.6%) | 124 (17.3%) |
| 35 to 44 Years | 265 (31.6%) | 241 (37.1%) |
| 45 to 54 Years | 58 (8.9%) | 36 (4.7%) |
| 55 to 64 Years | 119 (13.6%) | 236 (26.3%) |
| 65 to 74 Years | 65 (10.5%) | 76 (10.9%) |
| 75 Years and over | 0 (0.0%) | 189 (25.0%) |
| Total | 974 (16.8%) | 1,419 (23.3%) |
Income Above Poverty by Sex and Age in Beatrice
According to the poverty statistics in Beatrice, males aged 5 years and females aged 15 years are the age groups that are most secure financially, with 100.0% of males and 100.0% of females in these age groups living above the poverty line.
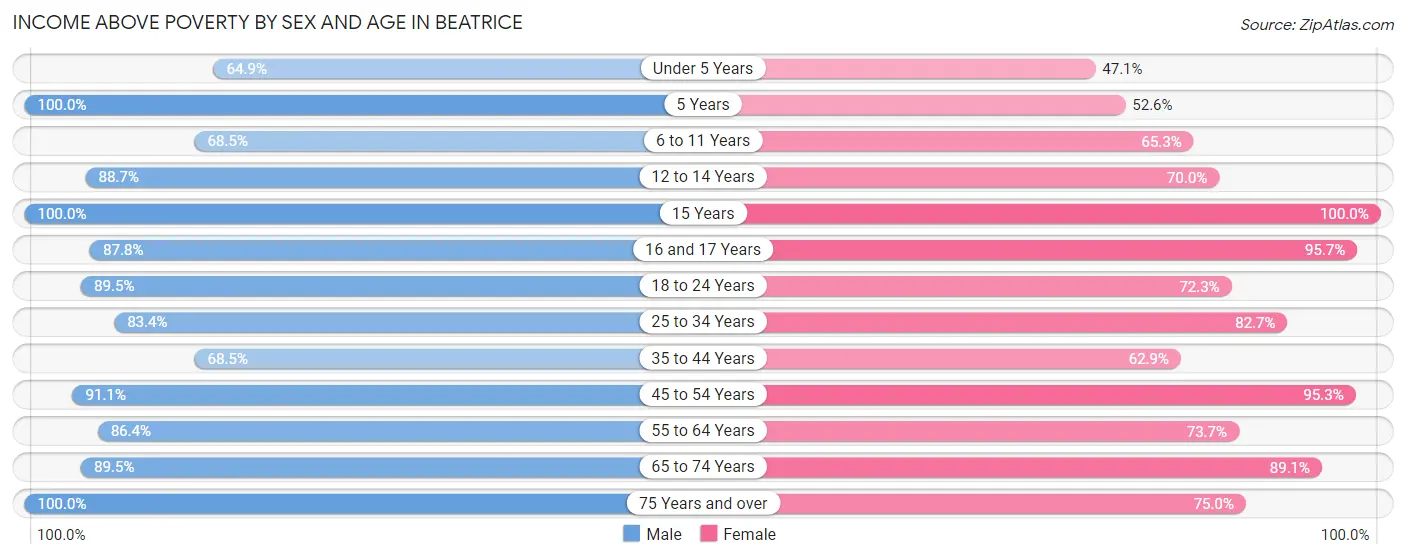
| Age Bracket | Male | Female |
| Under 5 Years | 272 (64.9%) | 136 (47.1%) |
| 5 Years | 36 (100.0%) | 30 (52.6%) |
| 6 to 11 Years | 267 (68.5%) | 269 (65.3%) |
| 12 to 14 Years | 235 (88.7%) | 166 (70.0%) |
| 15 Years | 55 (100.0%) | 42 (100.0%) |
| 16 and 17 Years | 166 (87.8%) | 154 (95.7%) |
| 18 to 24 Years | 324 (89.5%) | 303 (72.3%) |
| 25 to 34 Years | 531 (83.4%) | 592 (82.7%) |
| 35 to 44 Years | 575 (68.4%) | 409 (62.9%) |
| 45 to 54 Years | 593 (91.1%) | 736 (95.3%) |
| 55 to 64 Years | 758 (86.4%) | 661 (73.7%) |
| 65 to 74 Years | 555 (89.5%) | 621 (89.1%) |
| 75 Years and over | 471 (100.0%) | 566 (75.0%) |
| Total | 4,838 (83.2%) | 4,685 (76.7%) |
Income Below Poverty Among Married-Couple Families in Beatrice
The poverty statistics for married-couple families in Beatrice show that 7.1% or 152 of the total 2,136 families live below the poverty line. Families with 3 or 4 children have the highest poverty rate of 42.0%, comprising of 79 families. On the other hand, families with 5 or more children have the lowest poverty rate of 0.0%, which includes 0 families.
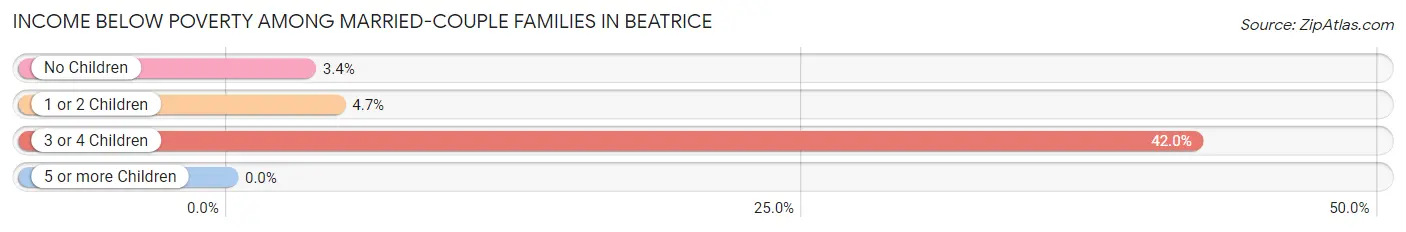
| Children | Above Poverty | Below Poverty |
| No Children | 1,283 (96.6%) | 45 (3.4%) |
| 1 or 2 Children | 572 (95.3%) | 28 (4.7%) |
| 3 or 4 Children | 109 (58.0%) | 79 (42.0%) |
| 5 or more Children | 20 (100.0%) | 0 (0.0%) |
| Total | 1,984 (92.9%) | 152 (7.1%) |
Income Below Poverty Among Single-Parent Households in Beatrice
According to the poverty data in Beatrice, 21.7% or 38 single-father households and 35.6% or 196 single-mother households are living below the poverty line. Among single-father households, those with no children have the highest poverty rate, with 9 households (22.5%) experiencing poverty. Likewise, among single-mother households, those with 3 or 4 children have the highest poverty rate, with 102 households (71.3%) falling below the poverty line.
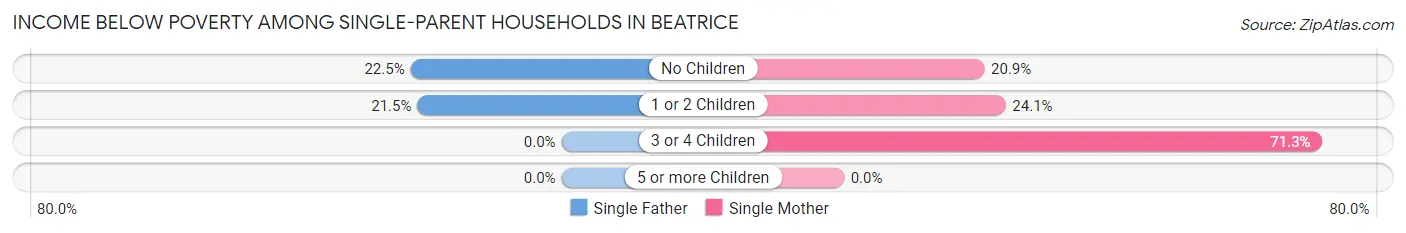
| Children | Single Father | Single Mother |
| No Children | 9 (22.5%) | 27 (20.9%) |
| 1 or 2 Children | 29 (21.5%) | 67 (24.1%) |
| 3 or 4 Children | 0 (0.0%) | 102 (71.3%) |
| 5 or more Children | 0 (0.0%) | 0 (0.0%) |
| Total | 38 (21.7%) | 196 (35.6%) |
Income Below Poverty Among Married-Couple vs Single-Parent Households in Beatrice
The poverty data for Beatrice shows that 152 of the married-couple family households (7.1%) and 234 of the single-parent households (32.3%) are living below the poverty level. Within the married-couple family households, those with 3 or 4 children have the highest poverty rate, with 79 households (42.0%) falling below the poverty line. Among the single-parent households, those with 3 or 4 children have the highest poverty rate, with 102 household (71.3%) living below poverty.
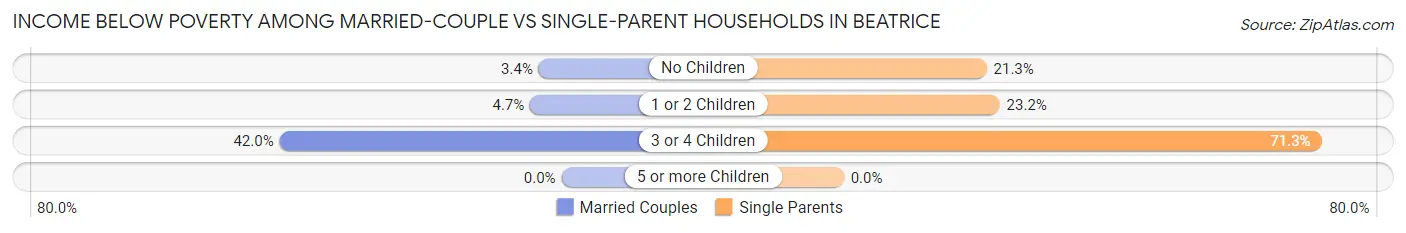
| Children | Married-Couple Families | Single-Parent Households |
| No Children | 45 (3.4%) | 36 (21.3%) |
| 1 or 2 Children | 28 (4.7%) | 96 (23.2%) |
| 3 or 4 Children | 79 (42.0%) | 102 (71.3%) |
| 5 or more Children | 0 (0.0%) | 0 (0.0%) |
| Total | 152 (7.1%) | 234 (32.3%) |
Race in Beatrice
The most populous races in Beatrice are White / Caucasian (11,654 | 95.2%), Hispanic or Latino (464 | 3.8%), and Two or more Races (251 | 2.1%).
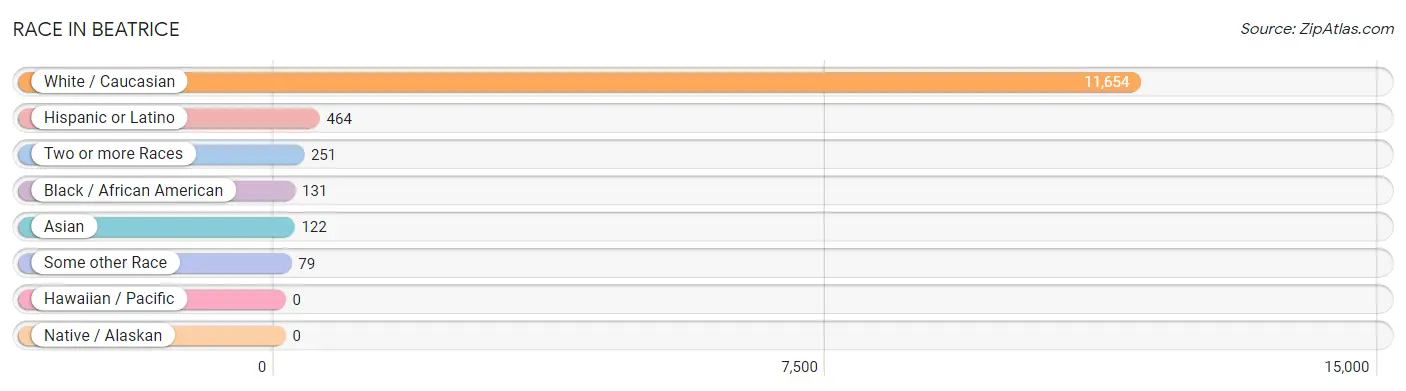
| Race | # Population | % Population |
| Asian | 122 | 1.0% |
| Black / African American | 131 | 1.1% |
| Hawaiian / Pacific | 0 | 0.0% |
| Hispanic or Latino | 464 | 3.8% |
| Native / Alaskan | 0 | 0.0% |
| White / Caucasian | 11,654 | 95.2% |
| Two or more Races | 251 | 2.1% |
| Some other Race | 79 | 0.6% |
| Total | 12,237 | 100.0% |
Ancestry in Beatrice
The most populous ancestries reported in Beatrice are German (4,359 | 35.6%), Irish (1,310 | 10.7%), English (1,097 | 9.0%), American (781 | 6.4%), and Czech (486 | 4.0%), together accounting for 65.6% of all Beatrice residents.
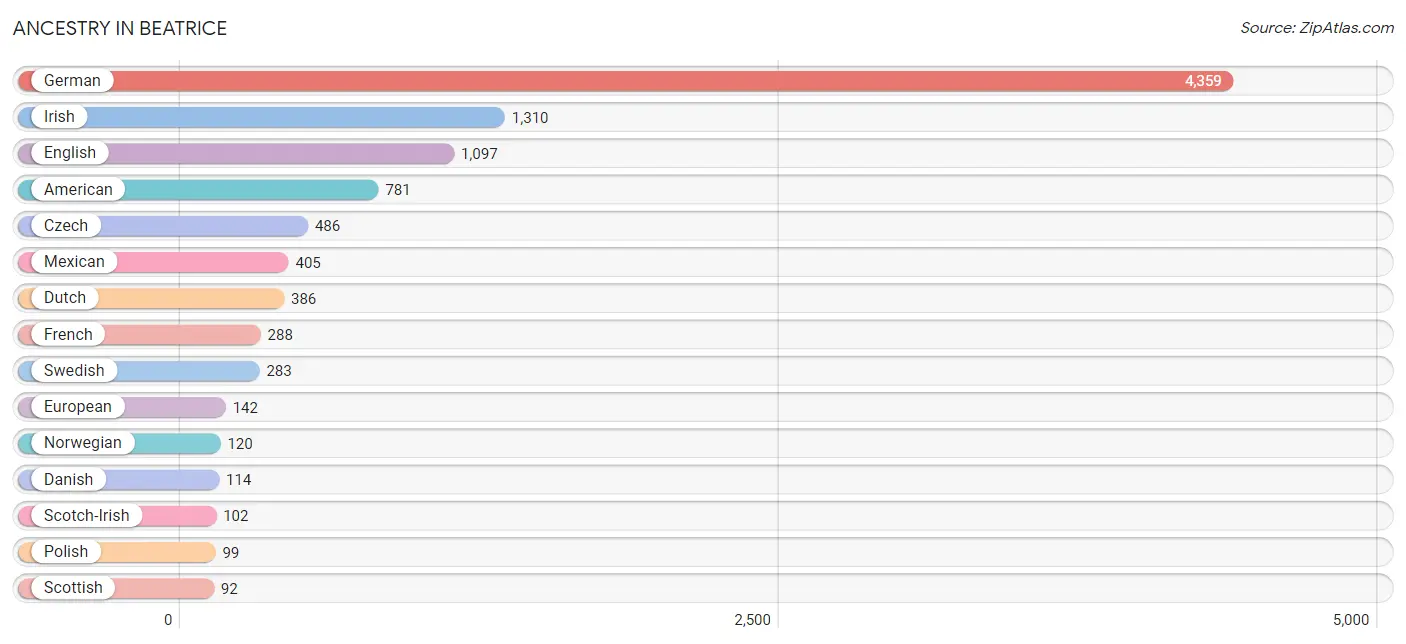
| Ancestry | # Population | % Population |
| American | 781 | 6.4% |
| Bhutanese | 21 | 0.2% |
| British | 50 | 0.4% |
| Canadian | 33 | 0.3% |
| Celtic | 15 | 0.1% |
| Cherokee | 8 | 0.1% |
| Choctaw | 8 | 0.1% |
| Croatian | 10 | 0.1% |
| Czech | 486 | 4.0% |
| Czechoslovakian | 61 | 0.5% |
| Danish | 114 | 0.9% |
| Dominican | 11 | 0.1% |
| Dutch | 386 | 3.2% |
| Eastern European | 11 | 0.1% |
| English | 1,097 | 9.0% |
| European | 142 | 1.2% |
| French | 288 | 2.4% |
| French Canadian | 7 | 0.1% |
| German | 4,359 | 35.6% |
| Hungarian | 9 | 0.1% |
| Indian (Asian) | 69 | 0.6% |
| Inupiat | 25 | 0.2% |
| Irish | 1,310 | 10.7% |
| Italian | 82 | 0.7% |
| Lithuanian | 10 | 0.1% |
| Malaysian | 41 | 0.3% |
| Mexican | 405 | 3.3% |
| Norwegian | 120 | 1.0% |
| Pennsylvania German | 3 | 0.0% |
| Polish | 99 | 0.8% |
| Portuguese | 9 | 0.1% |
| Puerto Rican | 23 | 0.2% |
| Russian | 47 | 0.4% |
| Samoan | 6 | 0.1% |
| Scandinavian | 27 | 0.2% |
| Scotch-Irish | 102 | 0.8% |
| Scottish | 92 | 0.7% |
| Sioux | 9 | 0.1% |
| South African | 18 | 0.2% |
| Spaniard | 25 | 0.2% |
| Subsaharan African | 18 | 0.2% |
| Swedish | 283 | 2.3% |
| Swiss | 36 | 0.3% |
| Welsh | 30 | 0.3% | View All 44 Rows |
Immigrants in Beatrice
The most numerous immigrant groups reported in Beatrice came from Asia (60 | 0.5%), Central America (50 | 0.4%), Latin America (50 | 0.4%), Mexico (50 | 0.4%), and Eastern Asia (48 | 0.4%), together accounting for 2.1% of all Beatrice residents.
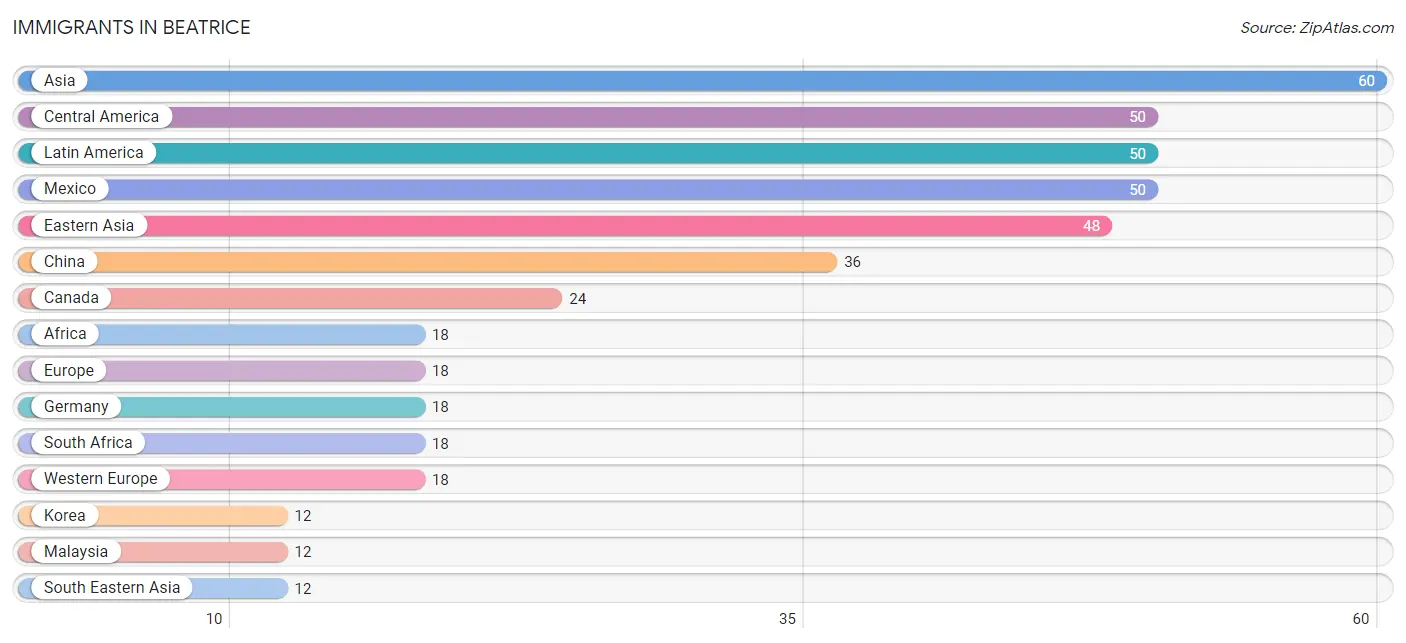
| Immigration Origin | # Population | % Population |
| Africa | 18 | 0.2% |
| Asia | 60 | 0.5% |
| Canada | 24 | 0.2% |
| Central America | 50 | 0.4% |
| China | 36 | 0.3% |
| Eastern Asia | 48 | 0.4% |
| Europe | 18 | 0.2% |
| Germany | 18 | 0.2% |
| Korea | 12 | 0.1% |
| Latin America | 50 | 0.4% |
| Malaysia | 12 | 0.1% |
| Mexico | 50 | 0.4% |
| South Africa | 18 | 0.2% |
| South Eastern Asia | 12 | 0.1% |
| Western Europe | 18 | 0.2% | View All 15 Rows |
Sex and Age in Beatrice
Sex and Age in Beatrice
The most populous age groups in Beatrice are 55 to 59 Years (486 | 8.2%) for men and 55 to 59 Years (561 | 8.9%) for women.
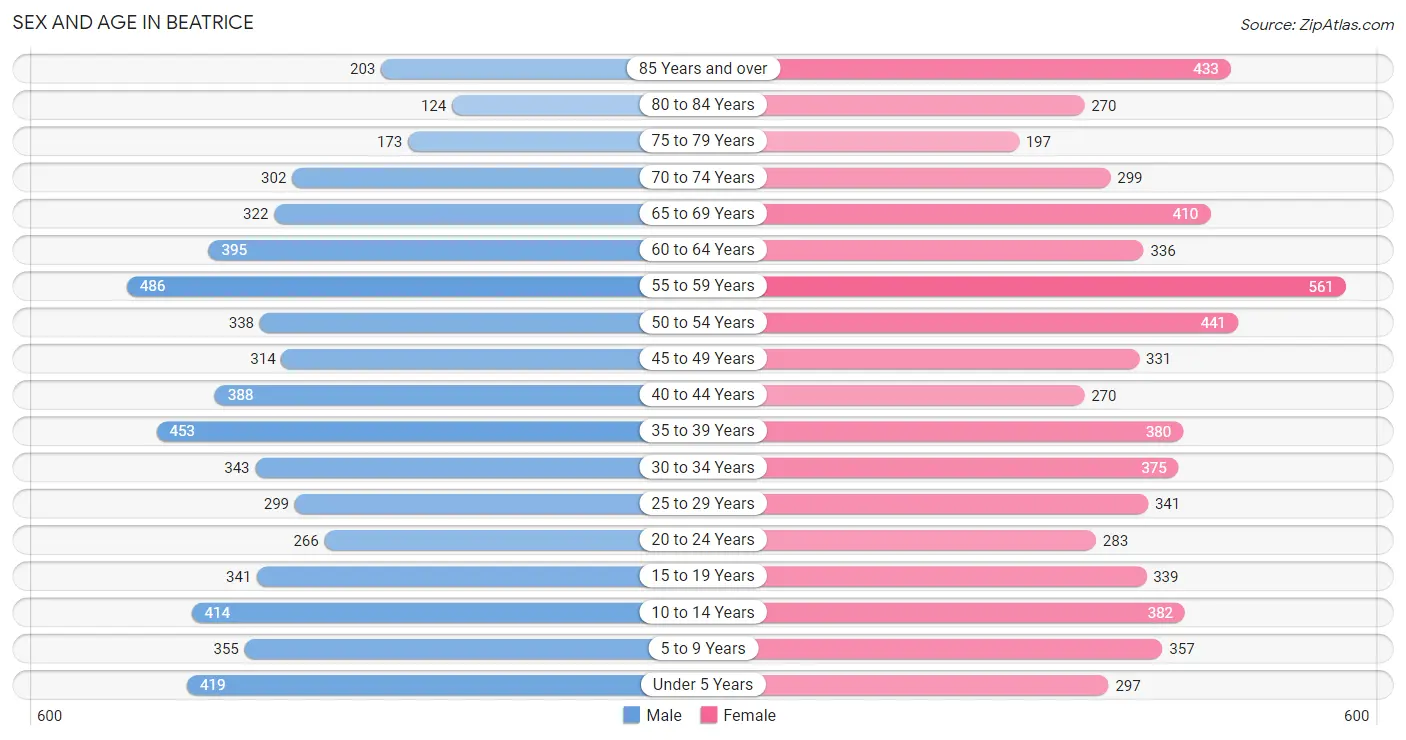
| Age Bracket | Male | Female |
| Under 5 Years | 419 (7.1%) | 297 (4.7%) |
| 5 to 9 Years | 355 (6.0%) | 357 (5.7%) |
| 10 to 14 Years | 414 (7.0%) | 382 (6.1%) |
| 15 to 19 Years | 341 (5.8%) | 339 (5.4%) |
| 20 to 24 Years | 266 (4.5%) | 283 (4.5%) |
| 25 to 29 Years | 299 (5.0%) | 341 (5.4%) |
| 30 to 34 Years | 343 (5.8%) | 375 (5.9%) |
| 35 to 39 Years | 453 (7.6%) | 380 (6.0%) |
| 40 to 44 Years | 388 (6.5%) | 270 (4.3%) |
| 45 to 49 Years | 314 (5.3%) | 331 (5.2%) |
| 50 to 54 Years | 338 (5.7%) | 441 (7.0%) |
| 55 to 59 Years | 486 (8.2%) | 561 (8.9%) |
| 60 to 64 Years | 395 (6.7%) | 336 (5.3%) |
| 65 to 69 Years | 322 (5.4%) | 410 (6.5%) |
| 70 to 74 Years | 302 (5.1%) | 299 (4.7%) |
| 75 to 79 Years | 173 (2.9%) | 197 (3.1%) |
| 80 to 84 Years | 124 (2.1%) | 270 (4.3%) |
| 85 Years and over | 203 (3.4%) | 433 (6.9%) |
| Total | 5,935 (100.0%) | 6,302 (100.0%) |
Families and Households in Beatrice
Median Family Size in Beatrice
The median family size in Beatrice is 2.85 persons per family, with single female/mother families (550 | 19.2%) accounting for the largest median family size of 3.02 persons per family. On the other hand, single male/father families (175 | 6.1%) represent the smallest median family size with 2.43 persons per family.
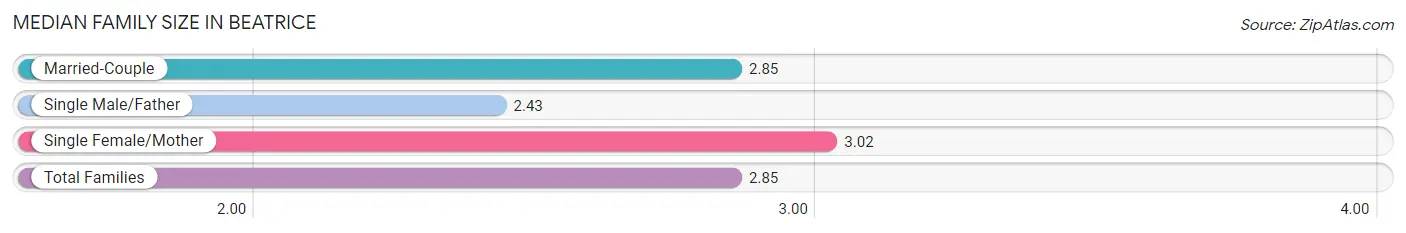
| Family Type | # Families | Family Size |
| Married-Couple | 2,136 (74.7%) | 2.85 |
| Single Male/Father | 175 (6.1%) | 2.43 |
| Single Female/Mother | 550 (19.2%) | 3.02 |
| Total Families | 2,861 (100.0%) | 2.85 |
Median Household Size in Beatrice
The median household size in Beatrice is 2.14 persons per household, with single male/father households (175 | 3.2%) accounting for the largest median household size of 3.31 persons per household. non-family households (2,621 | 47.8%) represent the smallest median household size with 1.23 persons per household.
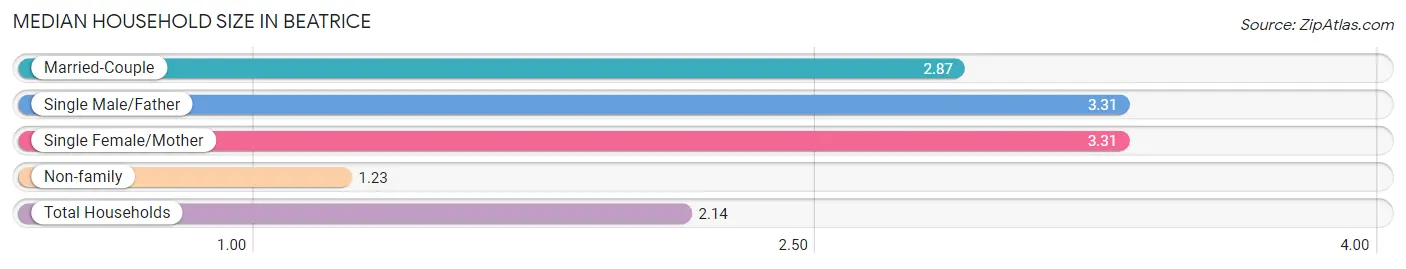
| Household Type | # Households | Household Size |
| Married-Couple | 2,136 (39.0%) | 2.87 |
| Single Male/Father | 175 (3.2%) | 3.31 |
| Single Female/Mother | 550 (10.0%) | 3.31 |
| Non-family | 2,621 (47.8%) | 1.23 |
| Total Households | 5,482 (100.0%) | 2.14 |
Household Size by Marriage Status in Beatrice
Out of a total of 5,482 households in Beatrice, 2,861 (52.2%) are family households, while 2,621 (47.8%) are nonfamily households. The most numerous type of family households are 2-person households, comprising 1,481, and the most common type of nonfamily households are 1-person households, comprising 2,295.
| Household Size | Family Households | Nonfamily Households |
| 1-Person Households | - | 2,295 (41.9%) |
| 2-Person Households | 1,481 (27.0%) | 290 (5.3%) |
| 3-Person Households | 579 (10.6%) | 0 (0.0%) |
| 4-Person Households | 467 (8.5%) | 31 (0.6%) |
| 5-Person Households | 188 (3.4%) | 0 (0.0%) |
| 6-Person Households | 126 (2.3%) | 0 (0.0%) |
| 7+ Person Households | 20 (0.4%) | 5 (0.1%) |
| Total | 2,861 (52.2%) | 2,621 (47.8%) |
Female Fertility in Beatrice
Fertility by Age in Beatrice
Average fertility rate in Beatrice is 62.0 births per 1,000 women. Women in the age bracket of 20 to 34 years have the highest fertility rate with 96.0 births per 1,000 women. Women in the age bracket of 20 to 34 years acount for 63.2% of all women with births.
| Age Bracket | Women with Births | Births / 1,000 Women |
| 15 to 19 years | 0 (0.0%) | 0.0 |
| 20 to 34 years | 96 (63.2%) | 96.0 |
| 35 to 50 years | 56 (36.8%) | 51.0 |
| Total | 152 (100.0%) | 62.0 |
Fertility by Age by Marriage Status in Beatrice
59.9% of women with births (152) in Beatrice are married. The highest percentage of unmarried women with births falls into 35 to 50 years age bracket with 69.6% of them unmarried at the time of birth, while the lowest percentage of unmarried women with births belong to 20 to 34 years age bracket with 22.9% of them unmarried.
| Age Bracket | Married | Unmarried |
| 15 to 19 years | 0 (0.0%) | 0 (0.0%) |
| 20 to 34 years | 74 (77.1%) | 22 (22.9%) |
| 35 to 50 years | 17 (30.4%) | 39 (69.6%) |
| Total | 91 (59.9%) | 61 (40.1%) |
Fertility by Education in Beatrice
| Educational Attainment | Women with Births | Births / 1,000 Women |
| Less than High School | 0 (0.0%) | 0.0 |
| High School Diploma | 42 (27.6%) | 71.0 |
| College or Associate's Degree | 85 (55.9%) | 86.0 |
| Bachelor's Degree | 17 (11.2%) | 42.0 |
| Graduate Degree | 8 (5.3%) | 123.0 |
| Total | 152 (100.0%) | 62.0 |
Fertility by Education by Marriage Status in Beatrice
40.1% of women with births in Beatrice are unmarried. Women with the educational attainment of bachelor's degree are most likely to be married with 100.0% of them married at childbirth, while women with the educational attainment of high school diploma are least likely to be married with 100.0% of them unmarried at childbirth.
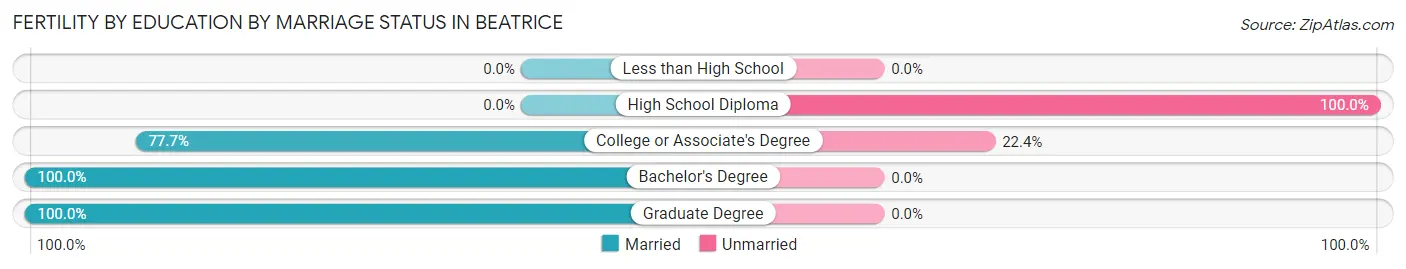
| Educational Attainment | Married | Unmarried |
| Less than High School | 0 (0.0%) | 0 (0.0%) |
| High School Diploma | 0 (0.0%) | 42 (100.0%) |
| College or Associate's Degree | 66 (77.6%) | 19 (22.4%) |
| Bachelor's Degree | 17 (100.0%) | 0 (0.0%) |
| Graduate Degree | 8 (100.0%) | 0 (0.0%) |
| Total | 91 (59.9%) | 61 (40.1%) |
Employment Characteristics in Beatrice
Employment by Class of Employer in Beatrice
Among the 5,616 employed individuals in Beatrice, private company employees (3,415 | 60.8%), not-for-profit organizations (664 | 11.8%), and self-employed (incorporated) (493 | 8.8%) make up the most common classes of employment.
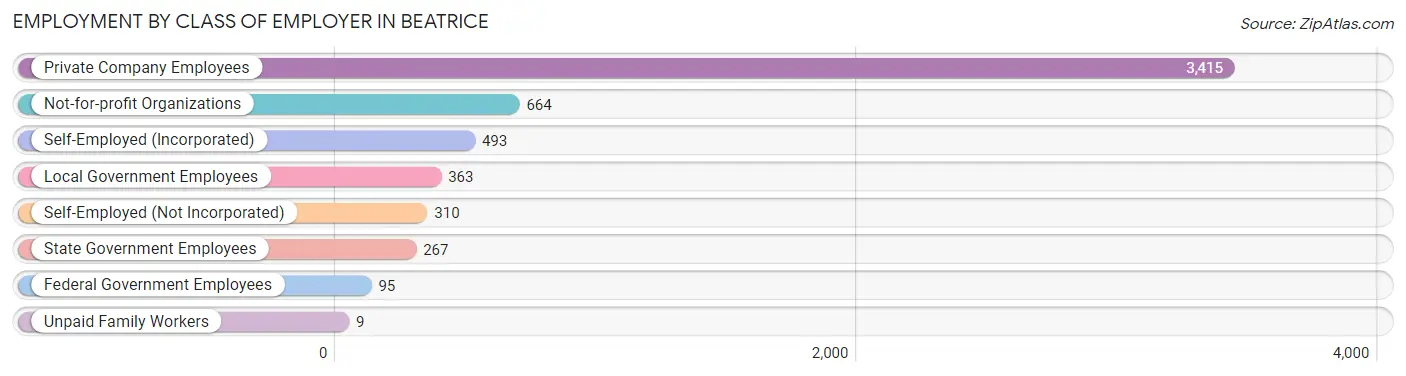
| Employer Class | # Employees | % Employees |
| Private Company Employees | 3,415 | 60.8% |
| Self-Employed (Incorporated) | 493 | 8.8% |
| Self-Employed (Not Incorporated) | 310 | 5.5% |
| Not-for-profit Organizations | 664 | 11.8% |
| Local Government Employees | 363 | 6.5% |
| State Government Employees | 267 | 4.8% |
| Federal Government Employees | 95 | 1.7% |
| Unpaid Family Workers | 9 | 0.2% |
| Total | 5,616 | 100.0% |
Employment Status by Age in Beatrice
According to the labor force statistics for Beatrice, out of the total population over 16 years of age (9,916), 60.6% or 6,009 individuals are in the labor force, with 3.0% or 180 of them unemployed. The age group with the highest labor force participation rate is 45 to 54 years, with 90.7% or 1,292 individuals in the labor force. Within the labor force, the 20 to 24 years age range has the highest percentage of unemployed individuals, with 13.6% or 57 of them being unemployed.
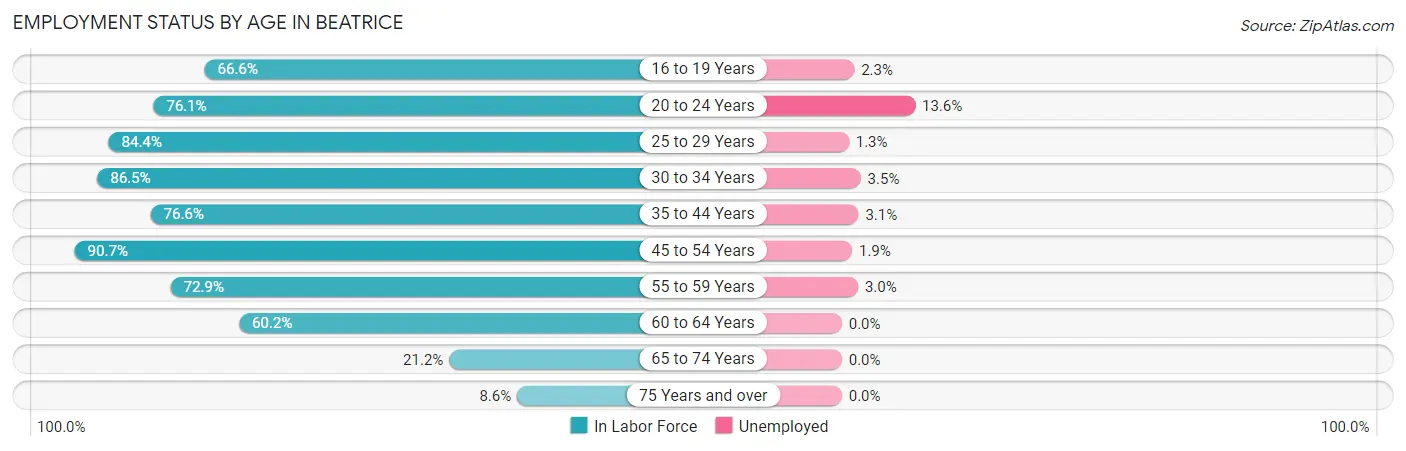
| Age Bracket | In Labor Force | Unemployed |
| 16 to 19 Years | 388 (66.6%) | 9 (2.3%) |
| 20 to 24 Years | 418 (76.1%) | 57 (13.6%) |
| 25 to 29 Years | 540 (84.4%) | 7 (1.3%) |
| 30 to 34 Years | 621 (86.5%) | 22 (3.5%) |
| 35 to 44 Years | 1,142 (76.6%) | 35 (3.1%) |
| 45 to 54 Years | 1,292 (90.7%) | 25 (1.9%) |
| 55 to 59 Years | 763 (72.9%) | 23 (3.0%) |
| 60 to 64 Years | 440 (60.2%) | 0 (0.0%) |
| 65 to 74 Years | 283 (21.2%) | 0 (0.0%) |
| 75 Years and over | 120 (8.6%) | 0 (0.0%) |
| Total | 6,009 (60.6%) | 180 (3.0%) |
Employment Status by Educational Attainment in Beatrice
According to labor force statistics for Beatrice, 79.3% of individuals (4,798) out of the total population between 25 and 64 years of age (6,051) are in the labor force, with 2.3% or 110 of them being unemployed. The group with the highest labor force participation rate are those with the educational attainment of bachelor's degree or higher, with 92.5% or 1,003 individuals in the labor force. Within the labor force, individuals with high school diploma education have the highest percentage of unemployment, with 3.3% or 56 of them being unemployed.
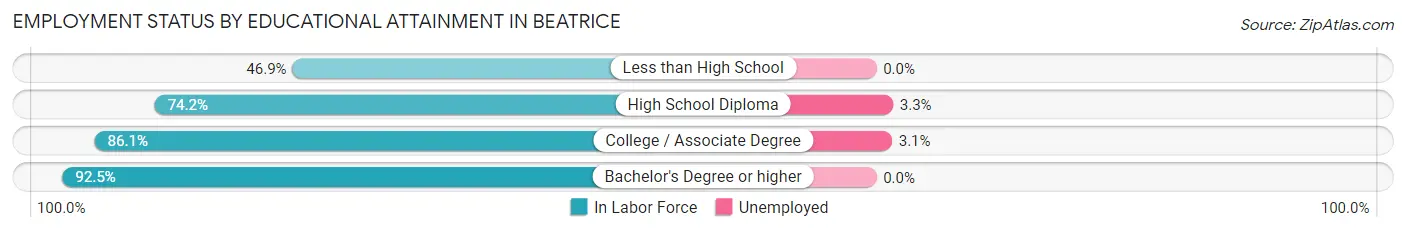
| Educational Attainment | In Labor Force | Unemployed |
| Less than High School | 251 (46.9%) | 0 (0.0%) |
| High School Diploma | 1,699 (74.2%) | 76 (3.3%) |
| College / Associate Degree | 1,844 (86.1%) | 66 (3.1%) |
| Bachelor's Degree or higher | 1,003 (92.5%) | 0 (0.0%) |
| Total | 4,798 (79.3%) | 139 (2.3%) |
Employment Occupations by Sex in Beatrice
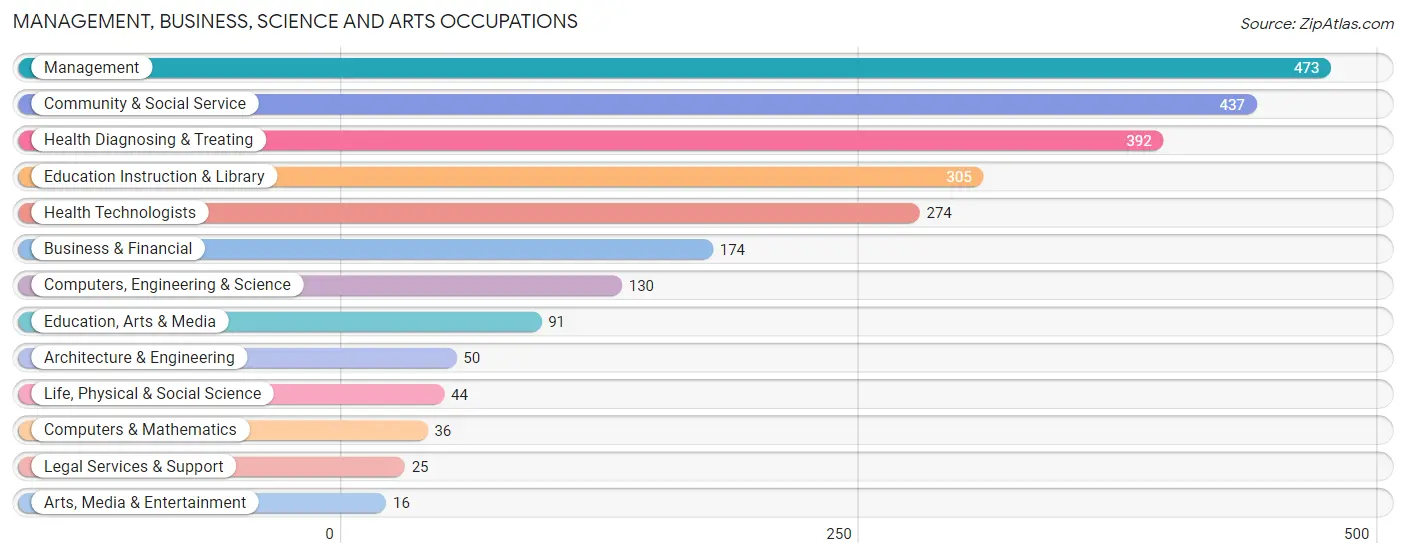
Management, Business, Science and Arts Occupations
The most common Management, Business, Science and Arts occupations in Beatrice are Management (473 | 8.1%), Community & Social Service (437 | 7.5%), Health Diagnosing & Treating (392 | 6.7%), Education Instruction & Library (305 | 5.2%), and Health Technologists (274 | 4.7%).
Management, Business, Science and Arts Occupations by Sex
Within the Management, Business, Science and Arts occupations in Beatrice, the most male-oriented occupations are Architecture & Engineering (82.0%), Computers & Mathematics (72.2%), and Legal Services & Support (72.0%), while the most female-oriented occupations are Arts, Media & Entertainment (100.0%), Education Instruction & Library (79.7%), and Health Diagnosing & Treating (77.8%).
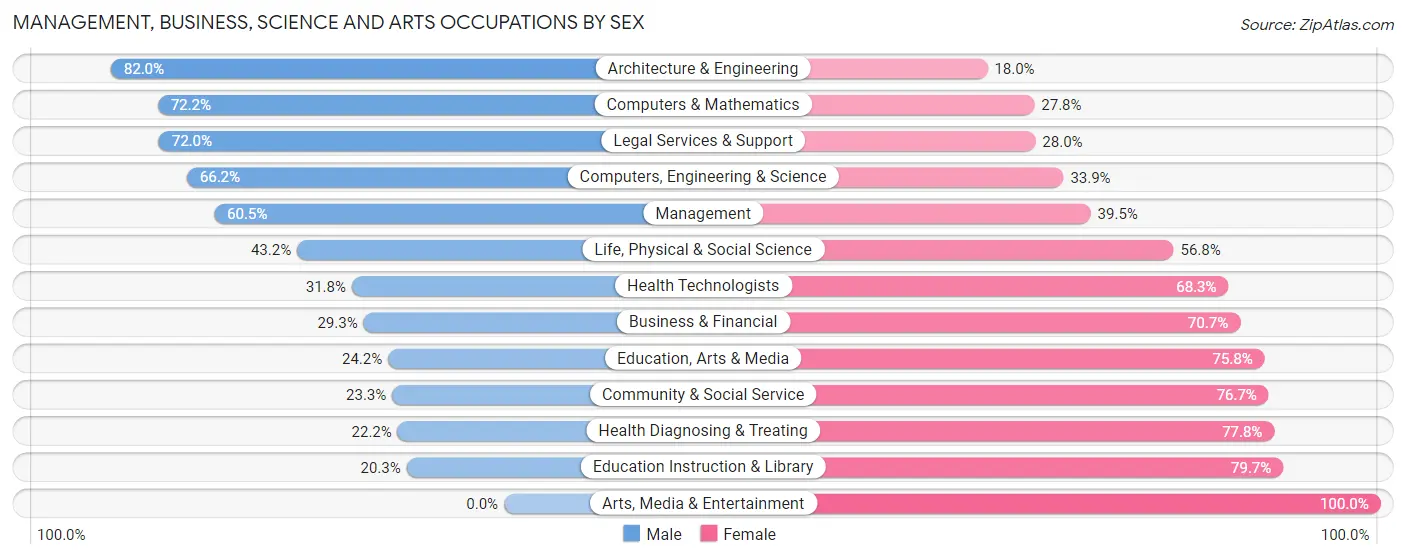
| Occupation | Male | Female |
| Management | 286 (60.5%) | 187 (39.5%) |
| Business & Financial | 51 (29.3%) | 123 (70.7%) |
| Computers, Engineering & Science | 86 (66.1%) | 44 (33.9%) |
| Computers & Mathematics | 26 (72.2%) | 10 (27.8%) |
| Architecture & Engineering | 41 (82.0%) | 9 (18.0%) |
| Life, Physical & Social Science | 19 (43.2%) | 25 (56.8%) |
| Community & Social Service | 102 (23.3%) | 335 (76.7%) |
| Education, Arts & Media | 22 (24.2%) | 69 (75.8%) |
| Legal Services & Support | 18 (72.0%) | 7 (28.0%) |
| Education Instruction & Library | 62 (20.3%) | 243 (79.7%) |
| Arts, Media & Entertainment | 0 (0.0%) | 16 (100.0%) |
| Health Diagnosing & Treating | 87 (22.2%) | 305 (77.8%) |
| Health Technologists | 87 (31.8%) | 187 (68.2%) |
| Total (Category) | 612 (38.1%) | 994 (61.9%) |
| Total (Overall) | 2,935 (50.5%) | 2,882 (49.5%) |
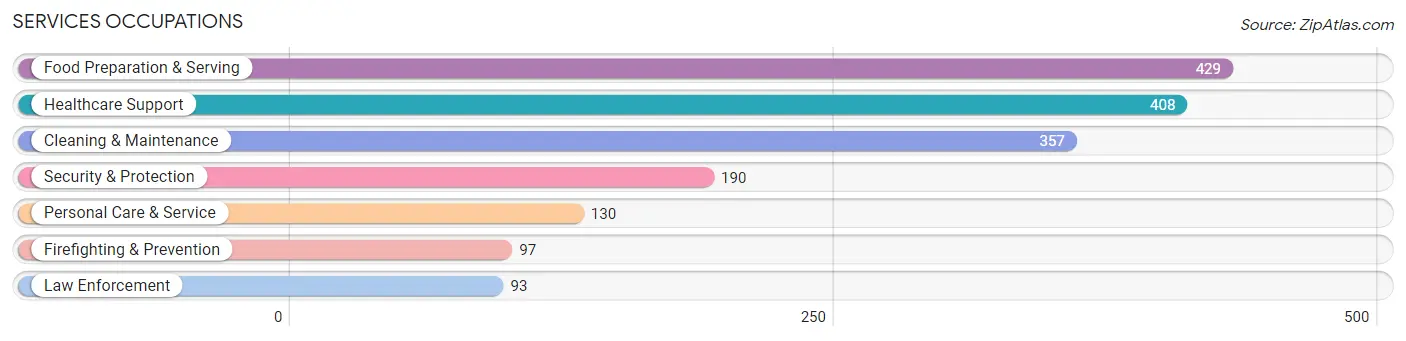
Services Occupations
The most common Services occupations in Beatrice are Food Preparation & Serving (429 | 7.4%), Healthcare Support (408 | 7.0%), Cleaning & Maintenance (357 | 6.1%), Security & Protection (190 | 3.3%), and Personal Care & Service (130 | 2.2%).
Services Occupations by Sex
Within the Services occupations in Beatrice, the most male-oriented occupations are Firefighting & Prevention (100.0%), Security & Protection (94.2%), and Law Enforcement (88.2%), while the most female-oriented occupations are Personal Care & Service (93.9%), Food Preparation & Serving (78.5%), and Healthcare Support (75.2%).
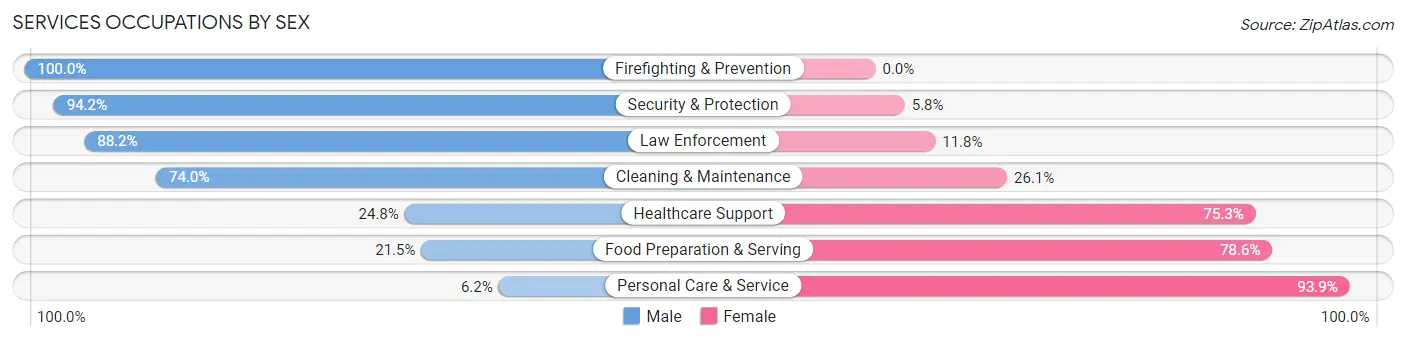
| Occupation | Male | Female |
| Healthcare Support | 101 (24.7%) | 307 (75.2%) |
| Security & Protection | 179 (94.2%) | 11 (5.8%) |
| Firefighting & Prevention | 97 (100.0%) | 0 (0.0%) |
| Law Enforcement | 82 (88.2%) | 11 (11.8%) |
| Food Preparation & Serving | 92 (21.4%) | 337 (78.5%) |
| Cleaning & Maintenance | 264 (74.0%) | 93 (26.1%) |
| Personal Care & Service | 8 (6.1%) | 122 (93.9%) |
| Total (Category) | 644 (42.5%) | 870 (57.5%) |
| Total (Overall) | 2,935 (50.5%) | 2,882 (49.5%) |
Sales and Office Occupations
The most common Sales and Office occupations in Beatrice are Office & Administration (594 | 10.2%), and Sales & Related (452 | 7.8%).
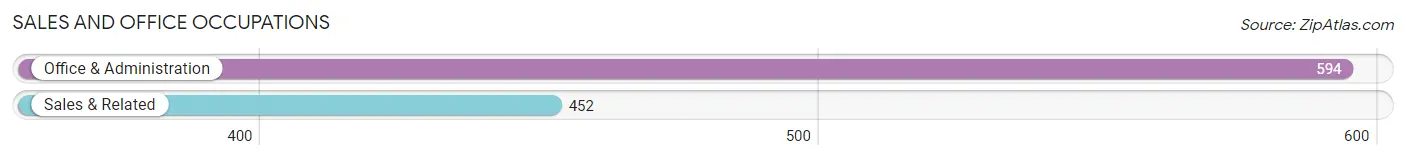
Sales and Office Occupations by Sex
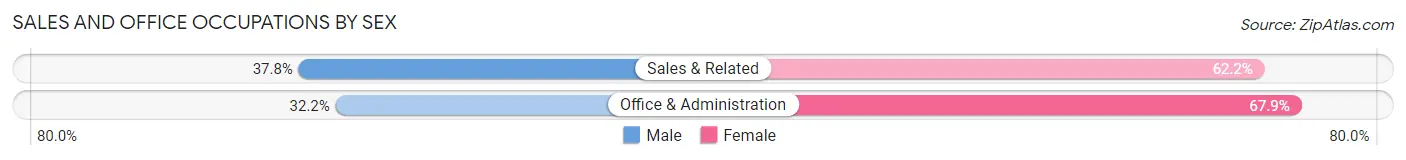
| Occupation | Male | Female |
| Sales & Related | 171 (37.8%) | 281 (62.2%) |
| Office & Administration | 191 (32.2%) | 403 (67.8%) |
| Total (Category) | 362 (34.6%) | 684 (65.4%) |
| Total (Overall) | 2,935 (50.5%) | 2,882 (49.5%) |
Natural Resources, Construction and Maintenance Occupations
The most common Natural Resources, Construction and Maintenance occupations in Beatrice are Construction & Extraction (297 | 5.1%), Installation, Maintenance & Repair (187 | 3.2%), and Farming, Fishing & Forestry (78 | 1.3%).
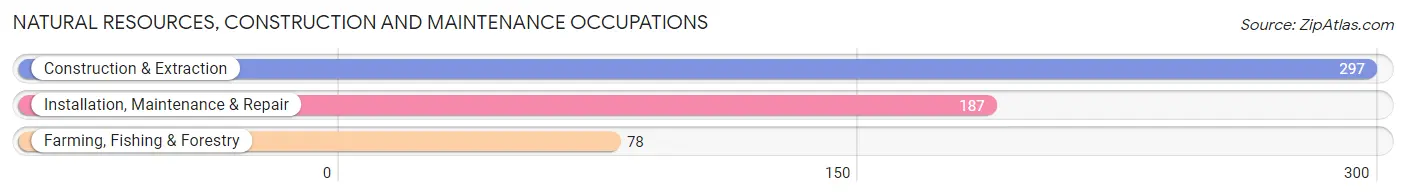
Natural Resources, Construction and Maintenance Occupations by Sex
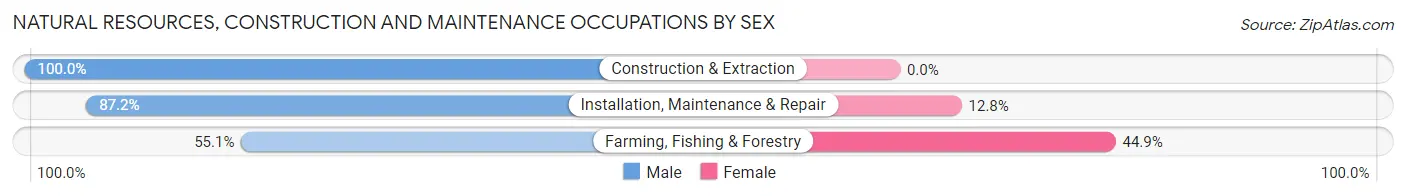
| Occupation | Male | Female |
| Farming, Fishing & Forestry | 43 (55.1%) | 35 (44.9%) |
| Construction & Extraction | 297 (100.0%) | 0 (0.0%) |
| Installation, Maintenance & Repair | 163 (87.2%) | 24 (12.8%) |
| Total (Category) | 503 (89.5%) | 59 (10.5%) |
| Total (Overall) | 2,935 (50.5%) | 2,882 (49.5%) |
Production, Transportation and Moving Occupations
The most common Production, Transportation and Moving occupations in Beatrice are Production (657 | 11.3%), Material Moving (222 | 3.8%), and Transportation (210 | 3.6%).
Production, Transportation and Moving Occupations by Sex
| Occupation | Male | Female |
| Production | 451 (68.6%) | 206 (31.4%) |
| Transportation | 210 (100.0%) | 0 (0.0%) |
| Material Moving | 153 (68.9%) | 69 (31.1%) |
| Total (Category) | 814 (74.8%) | 275 (25.3%) |
| Total (Overall) | 2,935 (50.5%) | 2,882 (49.5%) |
Employment Industries by Sex in Beatrice
Employment Industries in Beatrice
The major employment industries in Beatrice include Health Care & Social Assistance (1,278 | 22.0%), Manufacturing (959 | 16.5%), Retail Trade (674 | 11.6%), Construction (444 | 7.6%), and Educational Services (393 | 6.8%).
Employment Industries by Sex in Beatrice
The Beatrice industries that see more men than women are Utilities (100.0%), Arts, Entertainment & Recreation (100.0%), and Wholesale Trade (91.3%), whereas the industries that tend to have a higher number of women are Health Care & Social Assistance (84.6%), Finance & Insurance (75.0%), and Educational Services (71.5%).
| Industry | Male | Female |
| Agriculture, Fishing & Hunting | 110 (67.9%) | 52 (32.1%) |
| Mining, Quarrying, & Extraction | 0 (0.0%) | 0 (0.0%) |
| Construction | 366 (82.4%) | 78 (17.6%) |
| Manufacturing | 621 (64.7%) | 338 (35.2%) |
| Wholesale Trade | 94 (91.3%) | 9 (8.7%) |
| Retail Trade | 415 (61.6%) | 259 (38.4%) |
| Transportation & Warehousing | 118 (77.6%) | 34 (22.4%) |
| Utilities | 65 (100.0%) | 0 (0.0%) |
| Information | 83 (68.6%) | 38 (31.4%) |
| Finance & Insurance | 22 (25.0%) | 66 (75.0%) |
| Real Estate, Rental & Leasing | 45 (66.2%) | 23 (33.8%) |
| Professional & Scientific | 53 (44.9%) | 65 (55.1%) |
| Enterprise Management | 0 (0.0%) | 0 (0.0%) |
| Administrative & Support | 75 (39.3%) | 116 (60.7%) |
| Educational Services | 112 (28.5%) | 281 (71.5%) |
| Health Care & Social Assistance | 197 (15.4%) | 1,081 (84.6%) |
| Arts, Entertainment & Recreation | 12 (100.0%) | 0 (0.0%) |
| Accommodation & Food Services | 192 (51.5%) | 181 (48.5%) |
| Public Administration | 190 (58.8%) | 133 (41.2%) |
| Total | 2,935 (50.5%) | 2,882 (49.5%) |
Education in Beatrice
School Enrollment in Beatrice
The most common levels of schooling among the 2,488 students in Beatrice are middle school (729 | 29.3%), high school (604 | 24.3%), and elementary school (449 | 18.0%).
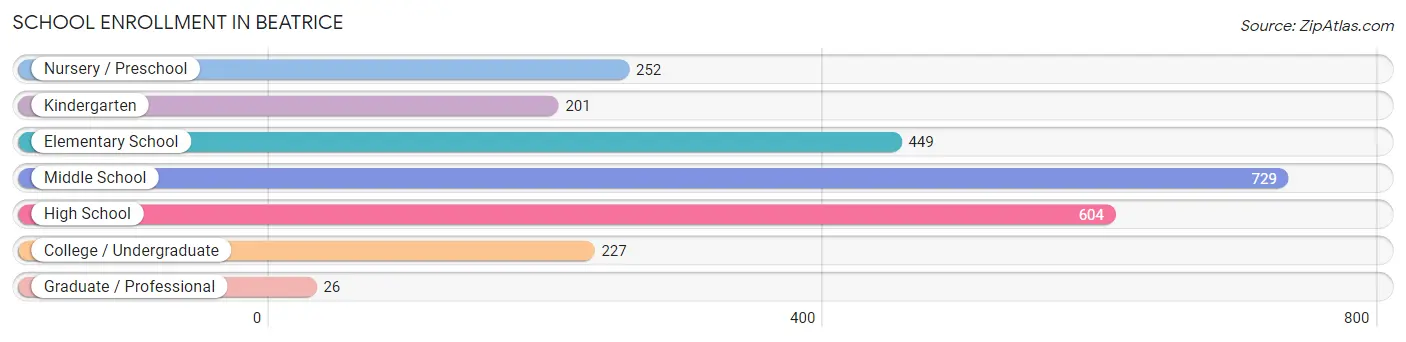
| School Level | # Students | % Students |
| Nursery / Preschool | 252 | 10.1% |
| Kindergarten | 201 | 8.1% |
| Elementary School | 449 | 18.0% |
| Middle School | 729 | 29.3% |
| High School | 604 | 24.3% |
| College / Undergraduate | 227 | 9.1% |
| Graduate / Professional | 26 | 1.1% |
| Total | 2,488 | 100.0% |
School Enrollment by Age by Funding Source in Beatrice
Out of a total of 2,488 students who are enrolled in schools in Beatrice, 246 (9.9%) attend a private institution, while the remaining 2,242 (90.1%) are enrolled in public schools. The age group of 3 to 4 year olds has the highest likelihood of being enrolled in private schools, with 47 (21.7% in the age bracket) enrolled. Conversely, the age group of 20 to 24 year olds has the lowest likelihood of being enrolled in a private school, with 114 (100.0% in the age bracket) attending a public institution.
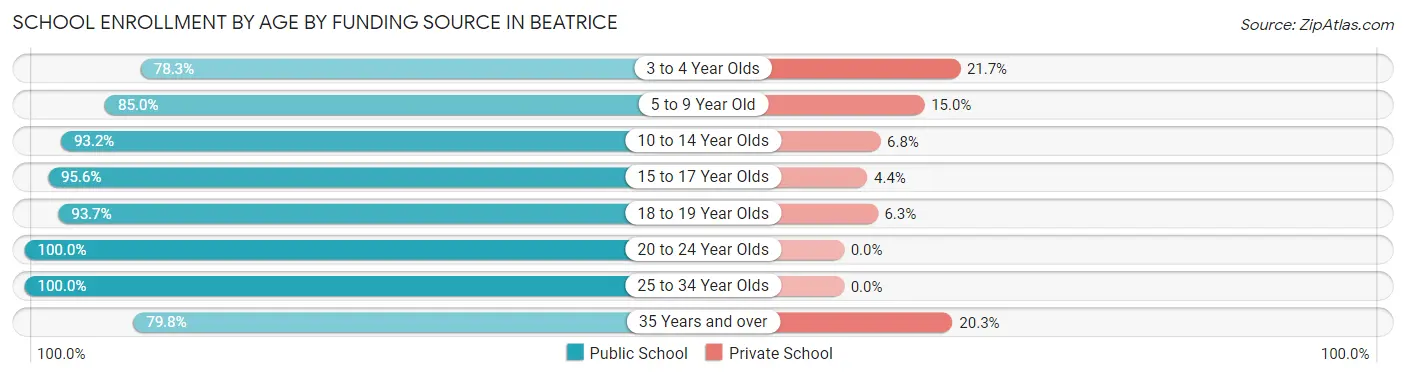
| Age Bracket | Public School | Private School |
| 3 to 4 Year Olds | 170 (78.3%) | 47 (21.7%) |
| 5 to 9 Year Old | 578 (85.0%) | 102 (15.0%) |
| 10 to 14 Year Olds | 742 (93.2%) | 54 (6.8%) |
| 15 to 17 Year Olds | 395 (95.6%) | 18 (4.4%) |
| 18 to 19 Year Olds | 134 (93.7%) | 9 (6.3%) |
| 20 to 24 Year Olds | 114 (100.0%) | 0 (0.0%) |
| 25 to 34 Year Olds | 46 (100.0%) | 0 (0.0%) |
| 35 Years and over | 63 (79.7%) | 16 (20.3%) |
| Total | 2,242 (90.1%) | 246 (9.9%) |
Educational Attainment by Field of Study in Beatrice
Education (347 | 20.9%), business (316 | 19.1%), science & technology (251 | 15.1%), bio, nature & agricultural (169 | 10.2%), and psychology (118 | 7.1%) are the most common fields of study among 1,657 individuals in Beatrice who have obtained a bachelor's degree or higher.
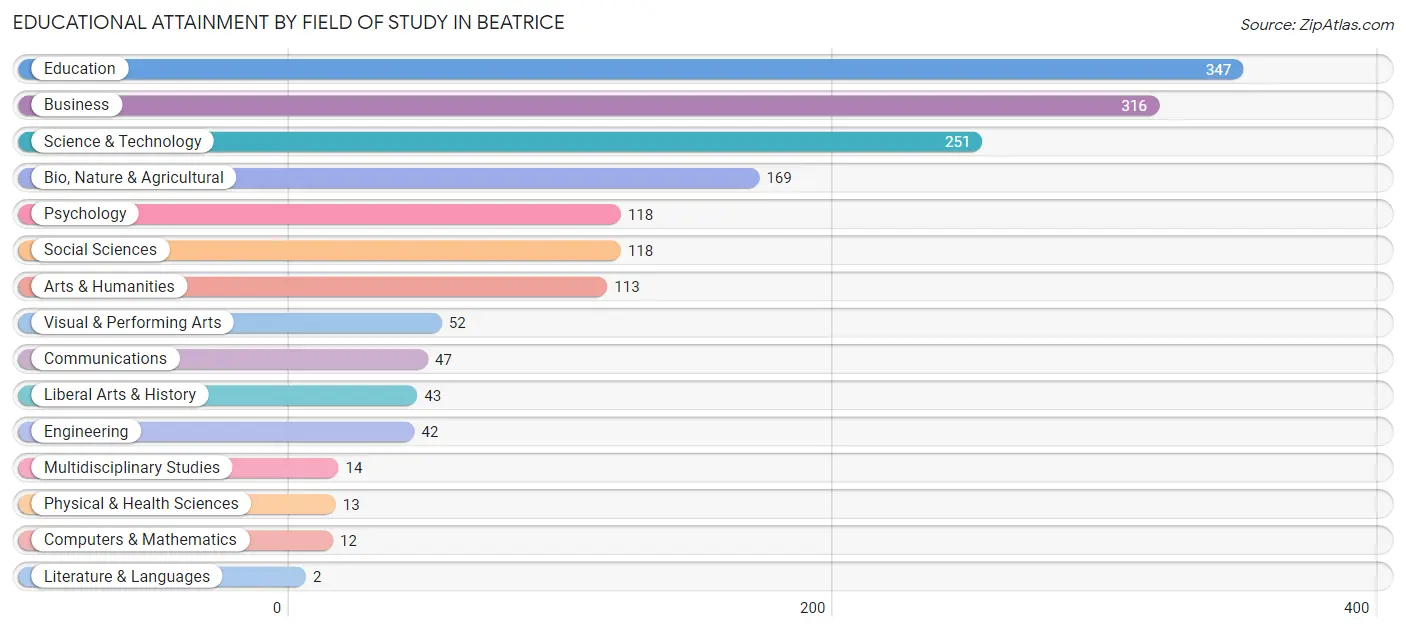
| Field of Study | # Graduates | % Graduates |
| Computers & Mathematics | 12 | 0.7% |
| Bio, Nature & Agricultural | 169 | 10.2% |
| Physical & Health Sciences | 13 | 0.8% |
| Psychology | 118 | 7.1% |
| Social Sciences | 118 | 7.1% |
| Engineering | 42 | 2.5% |
| Multidisciplinary Studies | 14 | 0.8% |
| Science & Technology | 251 | 15.1% |
| Business | 316 | 19.1% |
| Education | 347 | 20.9% |
| Literature & Languages | 2 | 0.1% |
| Liberal Arts & History | 43 | 2.6% |
| Visual & Performing Arts | 52 | 3.1% |
| Communications | 47 | 2.8% |
| Arts & Humanities | 113 | 6.8% |
| Total | 1,657 | 100.0% |
Transportation & Commute in Beatrice
Vehicle Availability by Sex in Beatrice
The most prevalent vehicle ownership categories in Beatrice are males with 2 vehicles (1,013, accounting for 36.4%) and females with 2 vehicles (1,032, making up 36.0%).
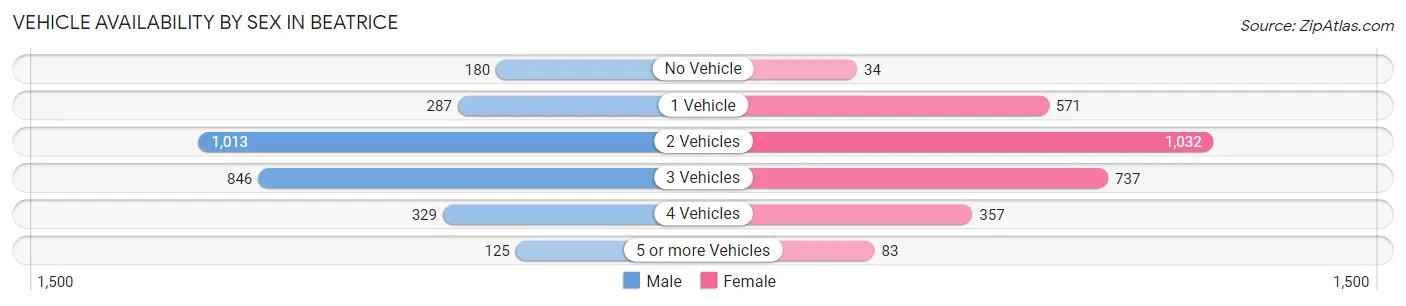
| Vehicles Available | Male | Female |
| No Vehicle | 180 (6.5%) | 34 (1.2%) |
| 1 Vehicle | 287 (10.3%) | 571 (20.3%) |
| 2 Vehicles | 1,013 (36.4%) | 1,032 (36.7%) |
| 3 Vehicles | 846 (30.4%) | 737 (26.2%) |
| 4 Vehicles | 329 (11.8%) | 357 (12.7%) |
| 5 or more Vehicles | 125 (4.5%) | 83 (2.9%) |
| Total | 2,780 (100.0%) | 2,814 (100.0%) |
Commute Time in Beatrice
The most frequently occuring commute durations in Beatrice are 5 to 9 minutes (1,821 commuters, 34.1%), 10 to 14 minutes (1,114 commuters, 20.9%), and less than 5 minutes (550 commuters, 10.3%).
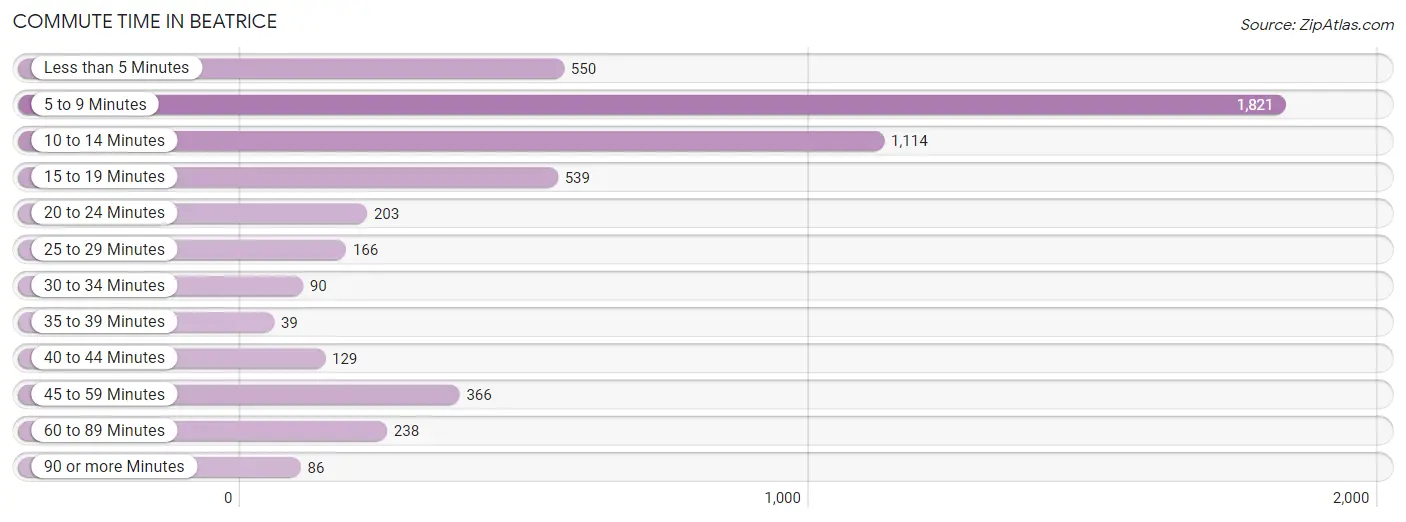
| Commute Time | # Commuters | % Commuters |
| Less than 5 Minutes | 550 | 10.3% |
| 5 to 9 Minutes | 1,821 | 34.1% |
| 10 to 14 Minutes | 1,114 | 20.9% |
| 15 to 19 Minutes | 539 | 10.1% |
| 20 to 24 Minutes | 203 | 3.8% |
| 25 to 29 Minutes | 166 | 3.1% |
| 30 to 34 Minutes | 90 | 1.7% |
| 35 to 39 Minutes | 39 | 0.7% |
| 40 to 44 Minutes | 129 | 2.4% |
| 45 to 59 Minutes | 366 | 6.9% |
| 60 to 89 Minutes | 238 | 4.5% |
| 90 or more Minutes | 86 | 1.6% |
Commute Time by Sex in Beatrice
The most common commute times in Beatrice are 5 to 9 minutes (917 commuters, 33.2%) for males and 5 to 9 minutes (904 commuters, 35.0%) for females.
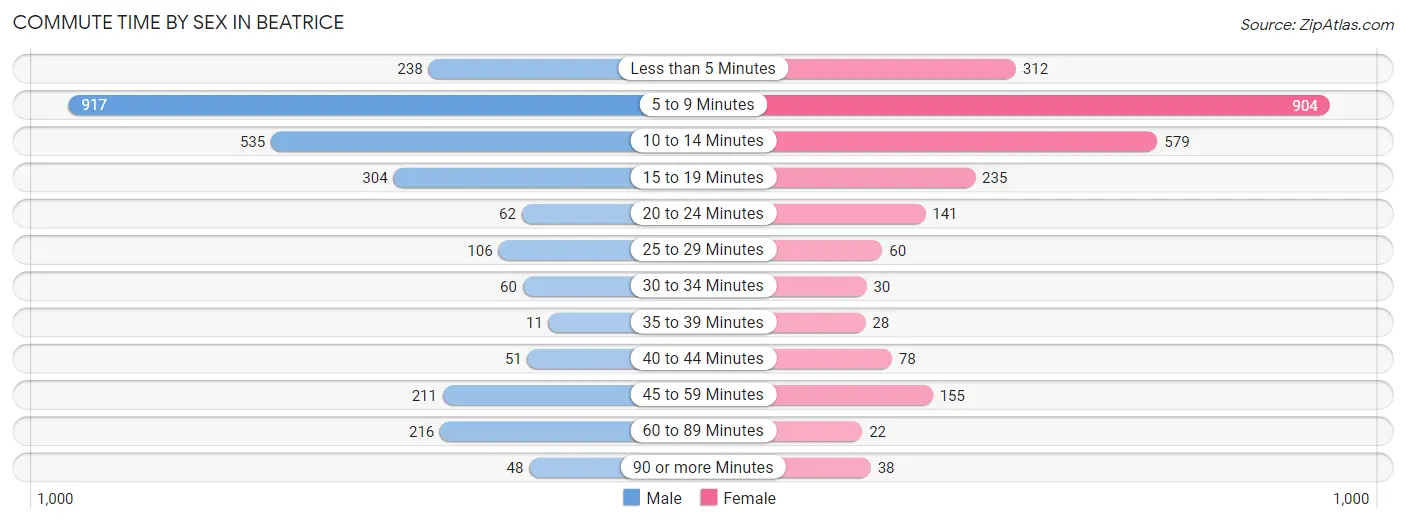
| Commute Time | Male | Female |
| Less than 5 Minutes | 238 (8.6%) | 312 (12.1%) |
| 5 to 9 Minutes | 917 (33.2%) | 904 (35.0%) |
| 10 to 14 Minutes | 535 (19.4%) | 579 (22.4%) |
| 15 to 19 Minutes | 304 (11.0%) | 235 (9.1%) |
| 20 to 24 Minutes | 62 (2.2%) | 141 (5.5%) |
| 25 to 29 Minutes | 106 (3.8%) | 60 (2.3%) |
| 30 to 34 Minutes | 60 (2.2%) | 30 (1.2%) |
| 35 to 39 Minutes | 11 (0.4%) | 28 (1.1%) |
| 40 to 44 Minutes | 51 (1.8%) | 78 (3.0%) |
| 45 to 59 Minutes | 211 (7.6%) | 155 (6.0%) |
| 60 to 89 Minutes | 216 (7.8%) | 22 (0.9%) |
| 90 or more Minutes | 48 (1.7%) | 38 (1.5%) |
Time of Departure to Work by Sex in Beatrice
The most frequent times of departure to work in Beatrice are 6:30 AM to 6:59 AM (579, 21.0%) for males and 7:30 AM to 7:59 AM (426, 16.5%) for females.
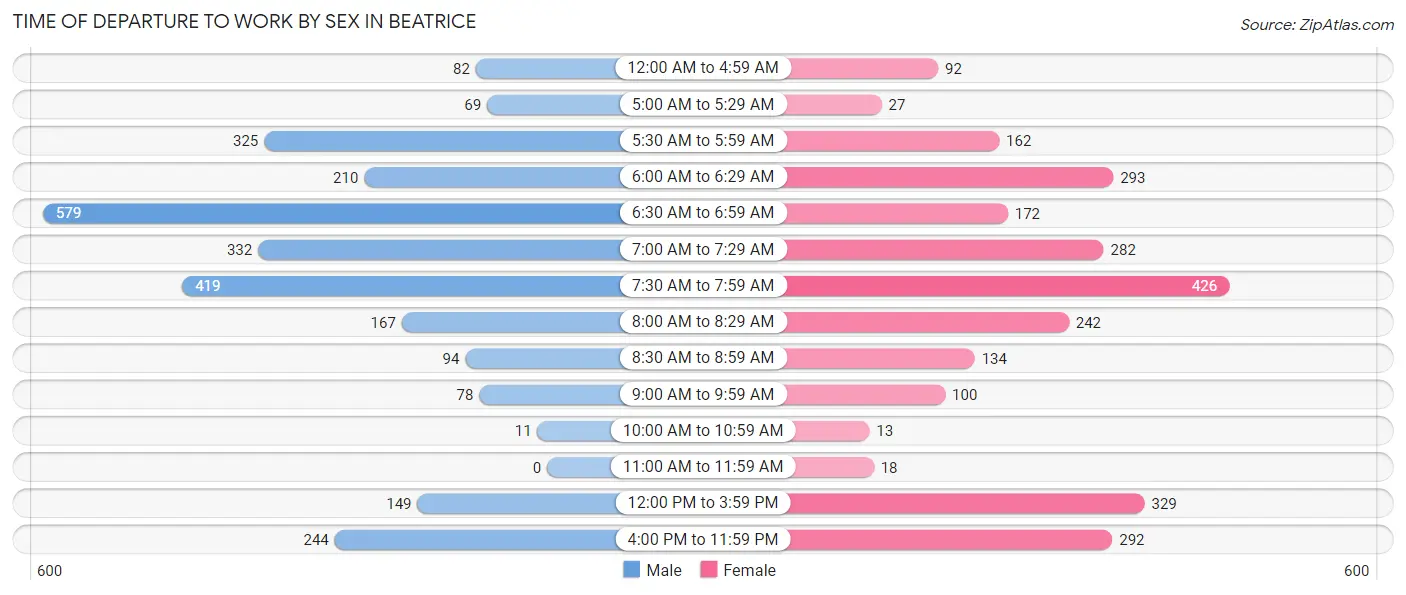
| Time of Departure | Male | Female |
| 12:00 AM to 4:59 AM | 82 (3.0%) | 92 (3.6%) |
| 5:00 AM to 5:29 AM | 69 (2.5%) | 27 (1.1%) |
| 5:30 AM to 5:59 AM | 325 (11.8%) | 162 (6.3%) |
| 6:00 AM to 6:29 AM | 210 (7.6%) | 293 (11.4%) |
| 6:30 AM to 6:59 AM | 579 (21.0%) | 172 (6.7%) |
| 7:00 AM to 7:29 AM | 332 (12.0%) | 282 (10.9%) |
| 7:30 AM to 7:59 AM | 419 (15.2%) | 426 (16.5%) |
| 8:00 AM to 8:29 AM | 167 (6.0%) | 242 (9.4%) |
| 8:30 AM to 8:59 AM | 94 (3.4%) | 134 (5.2%) |
| 9:00 AM to 9:59 AM | 78 (2.8%) | 100 (3.9%) |
| 10:00 AM to 10:59 AM | 11 (0.4%) | 13 (0.5%) |
| 11:00 AM to 11:59 AM | 0 (0.0%) | 18 (0.7%) |
| 12:00 PM to 3:59 PM | 149 (5.4%) | 329 (12.7%) |
| 4:00 PM to 11:59 PM | 244 (8.8%) | 292 (11.3%) |
| Total | 2,759 (100.0%) | 2,582 (100.0%) |
Housing Occupancy in Beatrice
Occupancy by Ownership in Beatrice
Of the total 5,482 dwellings in Beatrice, owner-occupied units account for 3,420 (62.4%), while renter-occupied units make up 2,062 (37.6%).
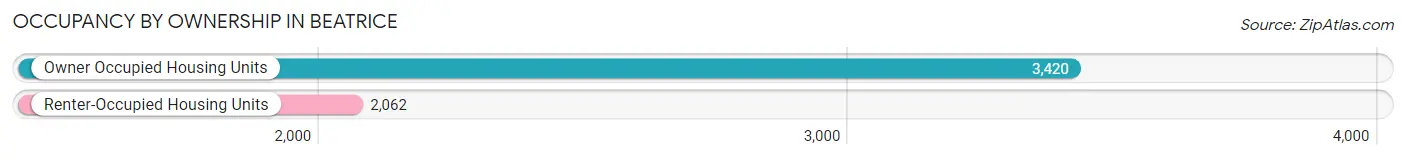
| Occupancy | # Housing Units | % Housing Units |
| Owner Occupied Housing Units | 3,420 | 62.4% |
| Renter-Occupied Housing Units | 2,062 | 37.6% |
| Total Occupied Housing Units | 5,482 | 100.0% |
Occupancy by Household Size in Beatrice
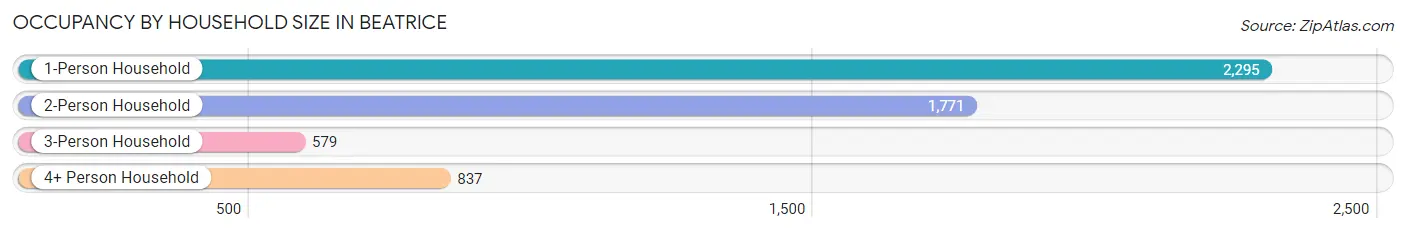
| Household Size | # Housing Units | % Housing Units |
| 1-Person Household | 2,295 | 41.9% |
| 2-Person Household | 1,771 | 32.3% |
| 3-Person Household | 579 | 10.6% |
| 4+ Person Household | 837 | 15.3% |
| Total Housing Units | 5,482 | 100.0% |
Occupancy by Ownership by Household Size in Beatrice
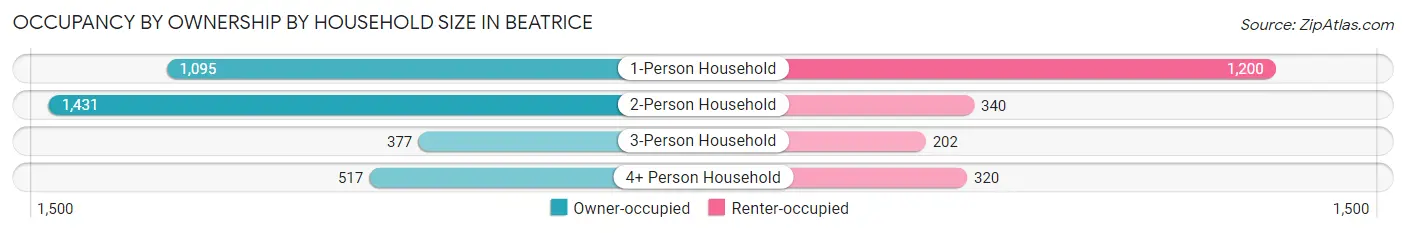
| Household Size | Owner-occupied | Renter-occupied |
| 1-Person Household | 1,095 (47.7%) | 1,200 (52.3%) |
| 2-Person Household | 1,431 (80.8%) | 340 (19.2%) |
| 3-Person Household | 377 (65.1%) | 202 (34.9%) |
| 4+ Person Household | 517 (61.8%) | 320 (38.2%) |
| Total Housing Units | 3,420 (62.4%) | 2,062 (37.6%) |
Occupancy by Educational Attainment in Beatrice
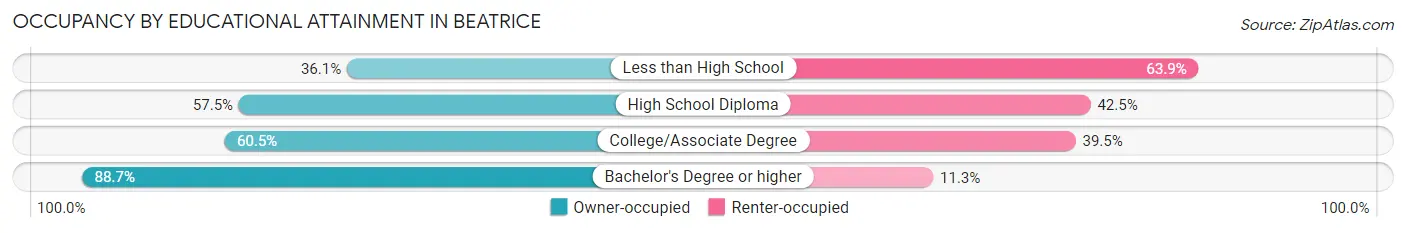
| Household Size | Owner-occupied | Renter-occupied |
| Less than High School | 149 (36.1%) | 264 (63.9%) |
| High School Diploma | 1,156 (57.5%) | 854 (42.5%) |
| College/Associate Degree | 1,282 (60.5%) | 838 (39.5%) |
| Bachelor's Degree or higher | 833 (88.7%) | 106 (11.3%) |
Occupancy by Age of Householder in Beatrice
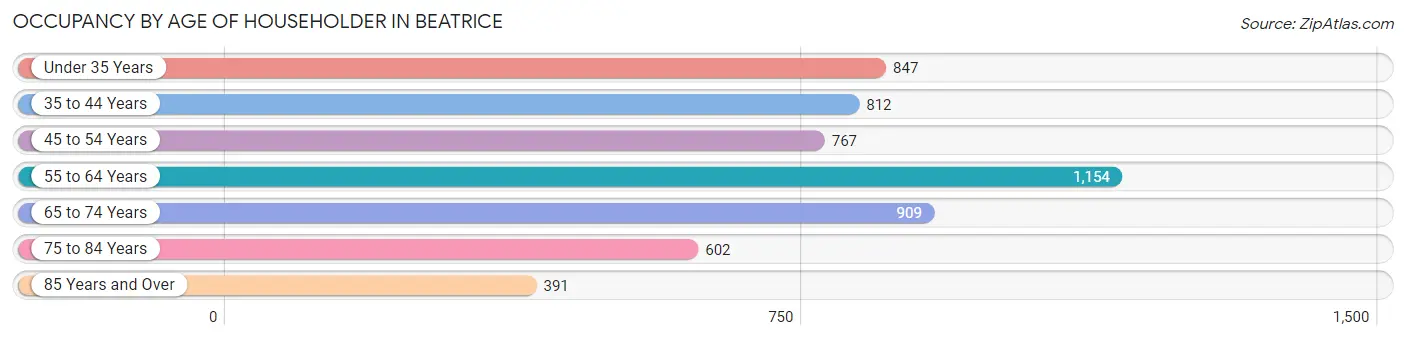
| Age Bracket | # Households | % Households |
| Under 35 Years | 847 | 15.4% |
| 35 to 44 Years | 812 | 14.8% |
| 45 to 54 Years | 767 | 14.0% |
| 55 to 64 Years | 1,154 | 21.0% |
| 65 to 74 Years | 909 | 16.6% |
| 75 to 84 Years | 602 | 11.0% |
| 85 Years and Over | 391 | 7.1% |
| Total | 5,482 | 100.0% |
Housing Finances in Beatrice
Median Income by Occupancy in Beatrice
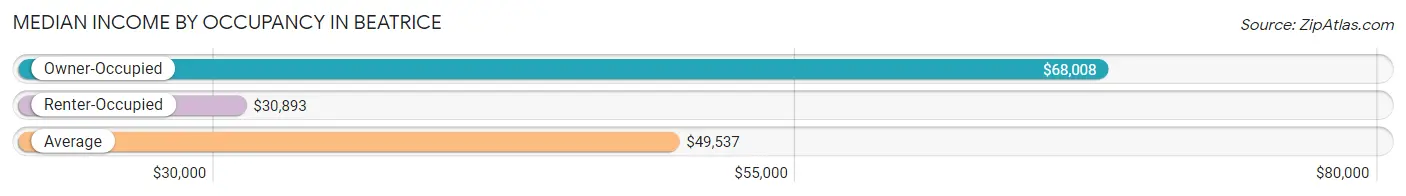
| Occupancy Type | # Households | Median Income |
| Owner-Occupied | 3,420 (62.4%) | $68,008 |
| Renter-Occupied | 2,062 (37.6%) | $30,893 |
| Average | 5,482 (100.0%) | $49,537 |
Occupancy by Householder Income Bracket in Beatrice
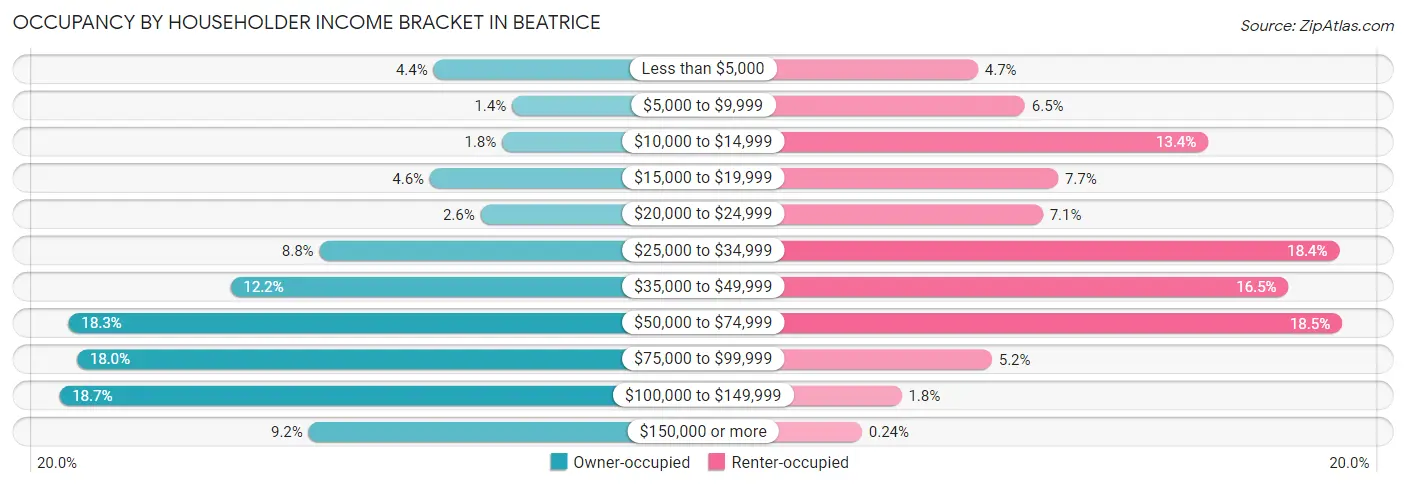
| Income Bracket | Owner-occupied | Renter-occupied |
| Less than $5,000 | 151 (4.4%) | 96 (4.7%) |
| $5,000 to $9,999 | 49 (1.4%) | 133 (6.5%) |
| $10,000 to $14,999 | 62 (1.8%) | 277 (13.4%) |
| $15,000 to $19,999 | 156 (4.6%) | 159 (7.7%) |
| $20,000 to $24,999 | 90 (2.6%) | 147 (7.1%) |
| $25,000 to $34,999 | 300 (8.8%) | 380 (18.4%) |
| $35,000 to $49,999 | 416 (12.2%) | 340 (16.5%) |
| $50,000 to $74,999 | 627 (18.3%) | 382 (18.5%) |
| $75,000 to $99,999 | 616 (18.0%) | 107 (5.2%) |
| $100,000 to $149,999 | 639 (18.7%) | 36 (1.8%) |
| $150,000 or more | 314 (9.2%) | 5 (0.2%) |
| Total | 3,420 (100.0%) | 2,062 (100.0%) |
Monthly Housing Cost Tiers in Beatrice
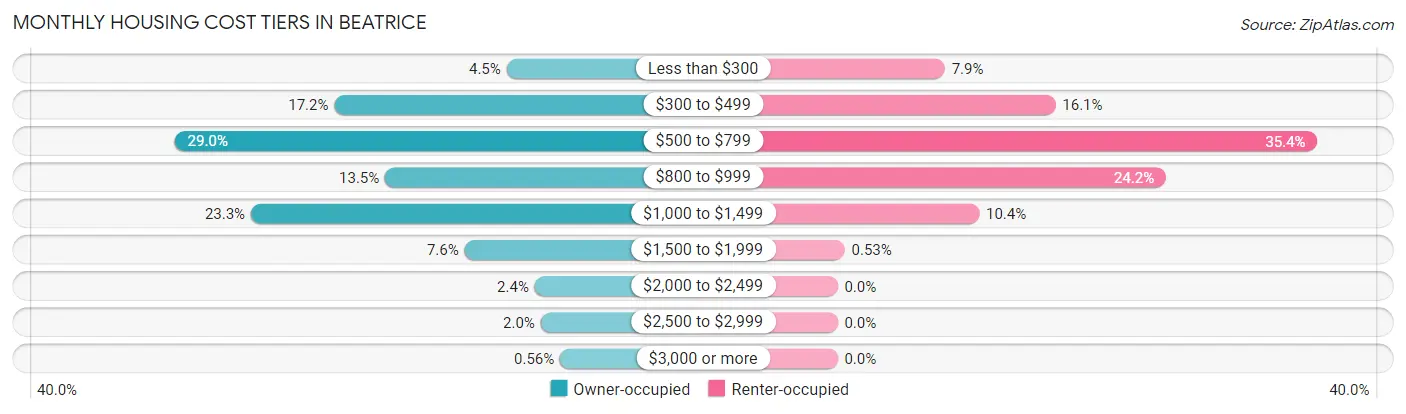
| Monthly Cost | Owner-occupied | Renter-occupied |
| Less than $300 | 154 (4.5%) | 163 (7.9%) |
| $300 to $499 | 588 (17.2%) | 331 (16.1%) |
| $500 to $799 | 990 (28.9%) | 729 (35.3%) |
| $800 to $999 | 460 (13.5%) | 499 (24.2%) |
| $1,000 to $1,499 | 798 (23.3%) | 215 (10.4%) |
| $1,500 to $1,999 | 260 (7.6%) | 11 (0.5%) |
| $2,000 to $2,499 | 83 (2.4%) | 0 (0.0%) |
| $2,500 to $2,999 | 68 (2.0%) | 0 (0.0%) |
| $3,000 or more | 19 (0.6%) | 0 (0.0%) |
| Total | 3,420 (100.0%) | 2,062 (100.0%) |
Physical Housing Characteristics in Beatrice
Housing Structures in Beatrice
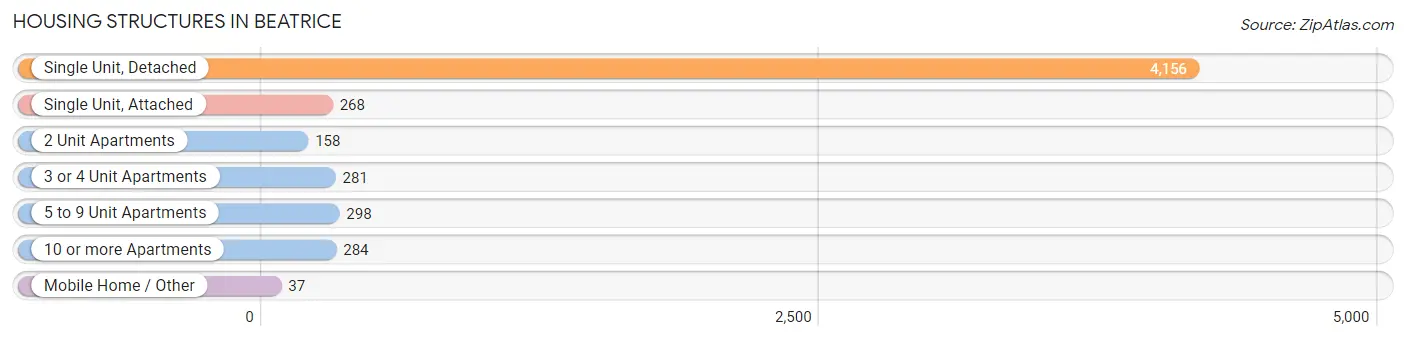
| Structure Type | # Housing Units | % Housing Units |
| Single Unit, Detached | 4,156 | 75.8% |
| Single Unit, Attached | 268 | 4.9% |
| 2 Unit Apartments | 158 | 2.9% |
| 3 or 4 Unit Apartments | 281 | 5.1% |
| 5 to 9 Unit Apartments | 298 | 5.4% |
| 10 or more Apartments | 284 | 5.2% |
| Mobile Home / Other | 37 | 0.7% |
| Total | 5,482 | 100.0% |
Housing Structures by Occupancy in Beatrice
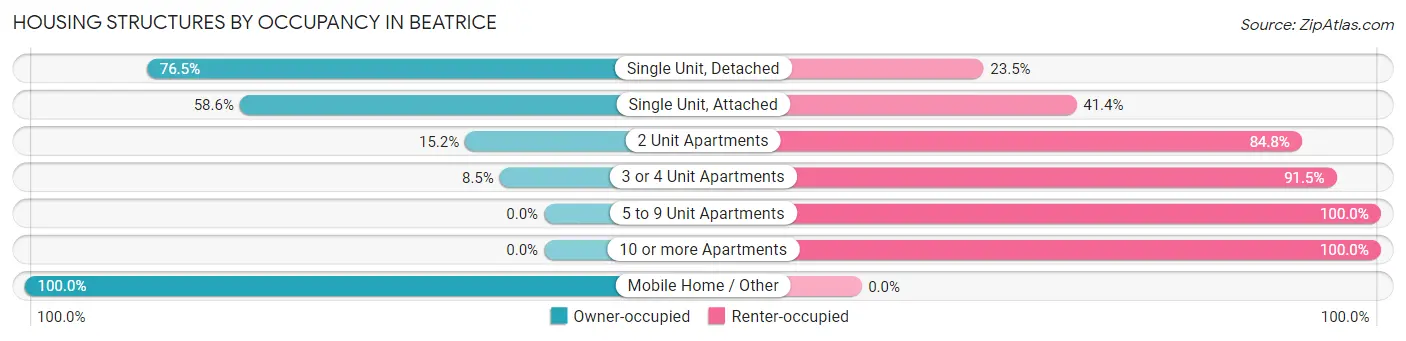
| Structure Type | Owner-occupied | Renter-occupied |
| Single Unit, Detached | 3,178 (76.5%) | 978 (23.5%) |
| Single Unit, Attached | 157 (58.6%) | 111 (41.4%) |
| 2 Unit Apartments | 24 (15.2%) | 134 (84.8%) |
| 3 or 4 Unit Apartments | 24 (8.5%) | 257 (91.5%) |
| 5 to 9 Unit Apartments | 0 (0.0%) | 298 (100.0%) |
| 10 or more Apartments | 0 (0.0%) | 284 (100.0%) |
| Mobile Home / Other | 37 (100.0%) | 0 (0.0%) |
| Total | 3,420 (62.4%) | 2,062 (37.6%) |
Housing Structures by Number of Rooms in Beatrice
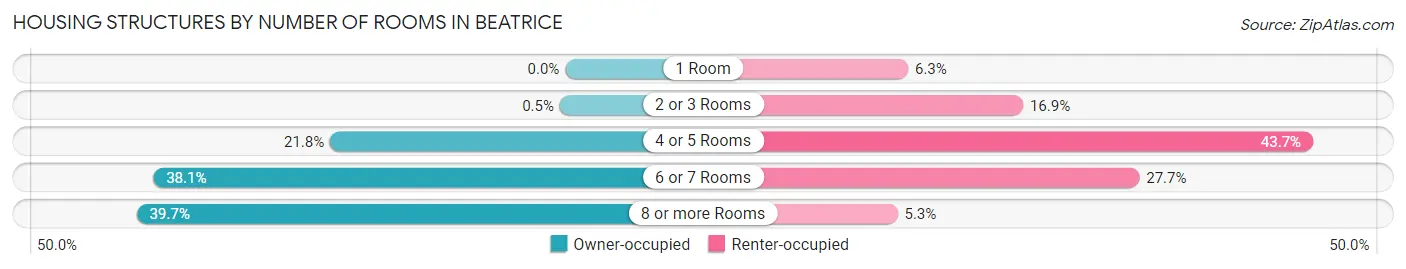
| Number of Rooms | Owner-occupied | Renter-occupied |
| 1 Room | 0 (0.0%) | 130 (6.3%) |
| 2 or 3 Rooms | 17 (0.5%) | 349 (16.9%) |
| 4 or 5 Rooms | 744 (21.7%) | 902 (43.7%) |
| 6 or 7 Rooms | 1,303 (38.1%) | 571 (27.7%) |
| 8 or more Rooms | 1,356 (39.7%) | 110 (5.3%) |
| Total | 3,420 (100.0%) | 2,062 (100.0%) |
Housing Structure by Heating Type in Beatrice
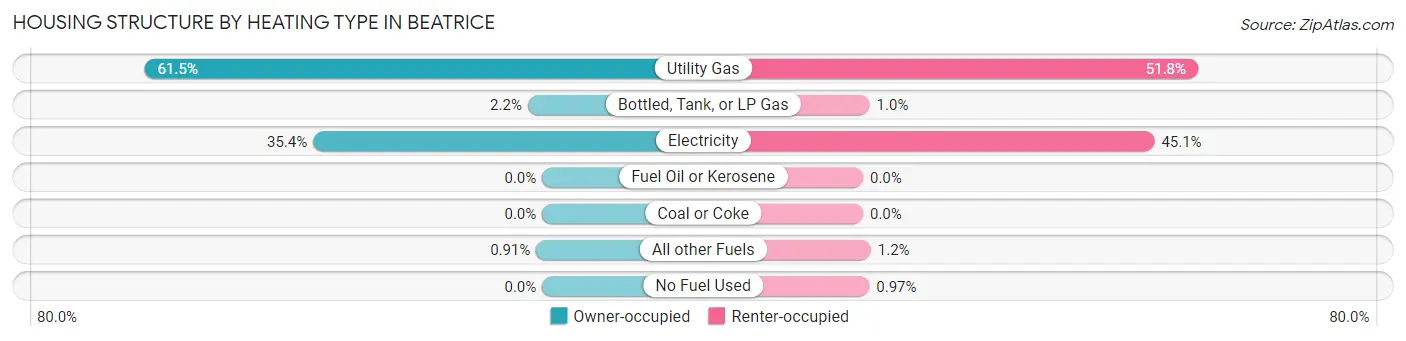
| Heating Type | Owner-occupied | Renter-occupied |
| Utility Gas | 2,102 (61.5%) | 1,067 (51.7%) |
| Bottled, Tank, or LP Gas | 76 (2.2%) | 21 (1.0%) |
| Electricity | 1,211 (35.4%) | 929 (45.1%) |
| Fuel Oil or Kerosene | 0 (0.0%) | 0 (0.0%) |
| Coal or Coke | 0 (0.0%) | 0 (0.0%) |
| All other Fuels | 31 (0.9%) | 25 (1.2%) |
| No Fuel Used | 0 (0.0%) | 20 (1.0%) |
| Total | 3,420 (100.0%) | 2,062 (100.0%) |
Household Vehicle Usage in Beatrice
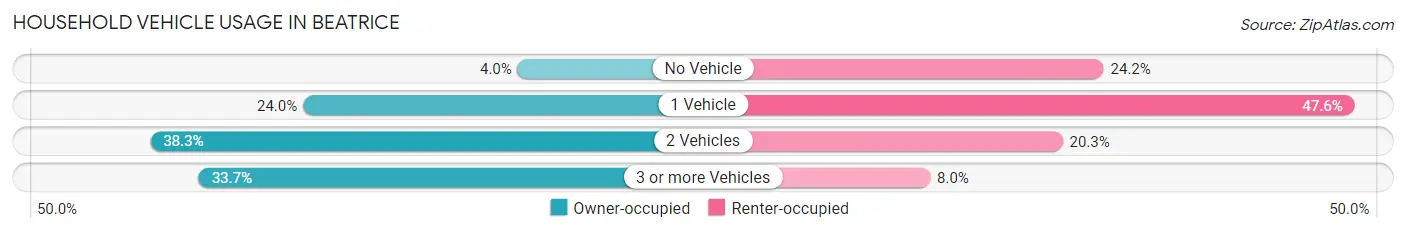
| Vehicles per Household | Owner-occupied | Renter-occupied |
| No Vehicle | 136 (4.0%) | 498 (24.1%) |
| 1 Vehicle | 821 (24.0%) | 981 (47.6%) |
| 2 Vehicles | 1,309 (38.3%) | 419 (20.3%) |
| 3 or more Vehicles | 1,154 (33.7%) | 164 (8.0%) |
| Total | 3,420 (100.0%) | 2,062 (100.0%) |
Real Estate & Mortgages in Beatrice
Real Estate and Mortgage Overview in Beatrice
| Characteristic | Without Mortgage | With Mortgage |
| Housing Units | 1,800 | 1,620 |
| Median Property Value | $145,300 | $134,000 |
| Median Household Income | $52,763 | $219 |
| Monthly Housing Costs | $549 | $19 |
| Real Estate Taxes | $2,326 | $24 |
Property Value by Mortgage Status in Beatrice
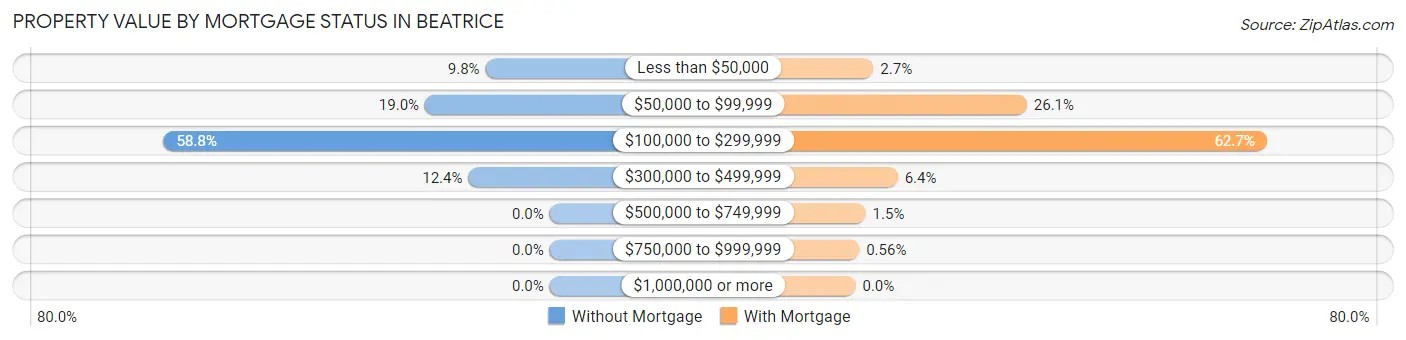
| Property Value | Without Mortgage | With Mortgage |
| Less than $50,000 | 176 (9.8%) | 44 (2.7%) |
| $50,000 to $99,999 | 342 (19.0%) | 423 (26.1%) |
| $100,000 to $299,999 | 1,059 (58.8%) | 1,015 (62.6%) |
| $300,000 to $499,999 | 223 (12.4%) | 104 (6.4%) |
| $500,000 to $749,999 | 0 (0.0%) | 25 (1.5%) |
| $750,000 to $999,999 | 0 (0.0%) | 9 (0.6%) |
| $1,000,000 or more | 0 (0.0%) | 0 (0.0%) |
| Total | 1,800 (100.0%) | 1,620 (100.0%) |
Household Income by Mortgage Status in Beatrice
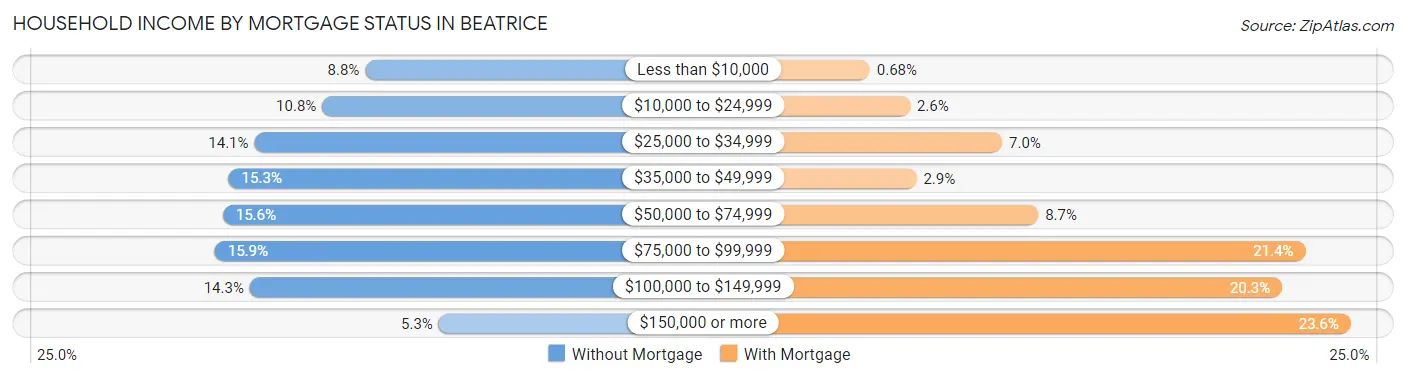
| Household Income | Without Mortgage | With Mortgage |
| Less than $10,000 | 158 (8.8%) | 11 (0.7%) |
| $10,000 to $24,999 | 195 (10.8%) | 42 (2.6%) |
| $25,000 to $34,999 | 253 (14.1%) | 113 (7.0%) |
| $35,000 to $49,999 | 275 (15.3%) | 47 (2.9%) |
| $50,000 to $74,999 | 280 (15.6%) | 141 (8.7%) |
| $75,000 to $99,999 | 287 (15.9%) | 347 (21.4%) |
| $100,000 to $149,999 | 257 (14.3%) | 329 (20.3%) |
| $150,000 or more | 95 (5.3%) | 382 (23.6%) |
| Total | 1,800 (100.0%) | 1,620 (100.0%) |
Property Value to Household Income Ratio in Beatrice
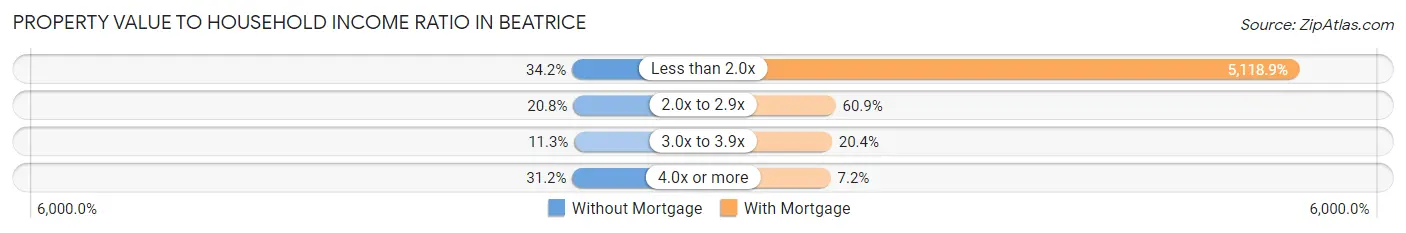
| Value-to-Income Ratio | Without Mortgage | With Mortgage |
| Less than 2.0x | 616 (34.2%) | 82,926 (5,118.9%) |
| 2.0x to 2.9x | 375 (20.8%) | 987 (60.9%) |
| 3.0x to 3.9x | 204 (11.3%) | 331 (20.4%) |
| 4.0x or more | 562 (31.2%) | 117 (7.2%) |
| Total | 1,800 (100.0%) | 1,620 (100.0%) |
Real Estate Taxes by Mortgage Status in Beatrice
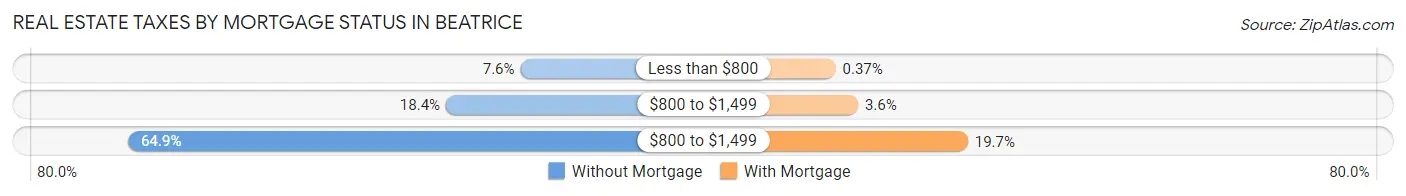
| Property Taxes | Without Mortgage | With Mortgage |
| Less than $800 | 136 (7.6%) | 6 (0.4%) |
| $800 to $1,499 | 332 (18.4%) | 59 (3.6%) |
| $800 to $1,499 | 1,168 (64.9%) | 319 (19.7%) |
| Total | 1,800 (100.0%) | 1,620 (100.0%) |
Health & Disability in Beatrice
Health Insurance Coverage by Age in Beatrice
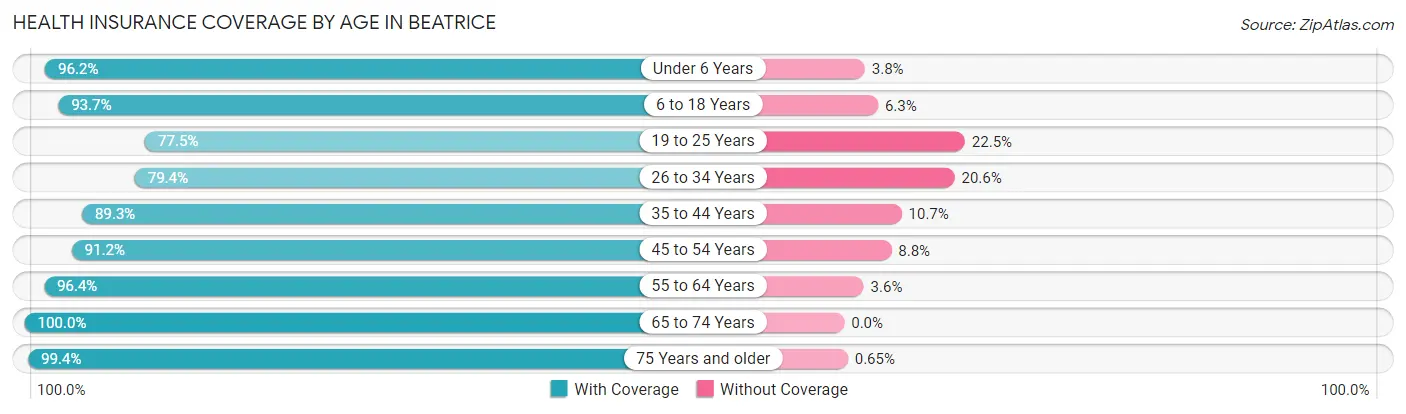
| Age Bracket | With Coverage | Without Coverage |
| Under 6 Years | 778 (96.2%) | 31 (3.8%) |
| 6 to 18 Years | 1,879 (93.7%) | 126 (6.3%) |
| 19 to 25 Years | 548 (77.5%) | 159 (22.5%) |
| 26 to 34 Years | 1,020 (79.4%) | 264 (20.6%) |
| 35 to 44 Years | 1,320 (89.3%) | 158 (10.7%) |
| 45 to 54 Years | 1,298 (91.2%) | 125 (8.8%) |
| 55 to 64 Years | 1,710 (96.4%) | 64 (3.6%) |
| 65 to 74 Years | 1,317 (100.0%) | 0 (0.0%) |
| 75 Years and older | 1,218 (99.4%) | 8 (0.6%) |
| Total | 11,088 (92.2%) | 935 (7.8%) |
Health Insurance Coverage by Citizenship Status in Beatrice
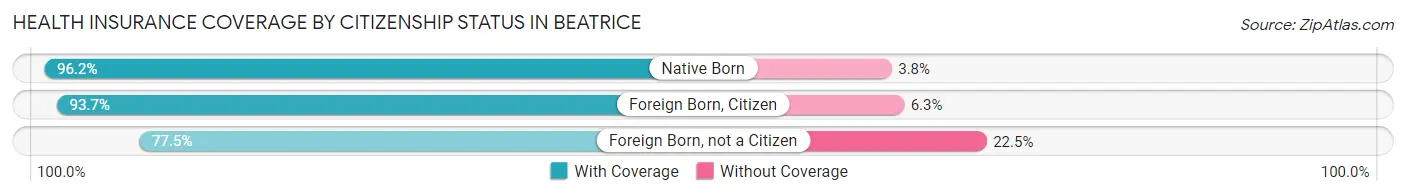
| Citizenship Status | With Coverage | Without Coverage |
| Native Born | 778 (96.2%) | 31 (3.8%) |
| Foreign Born, Citizen | 1,879 (93.7%) | 126 (6.3%) |
| Foreign Born, not a Citizen | 548 (77.5%) | 159 (22.5%) |
Health Insurance Coverage by Household Income in Beatrice
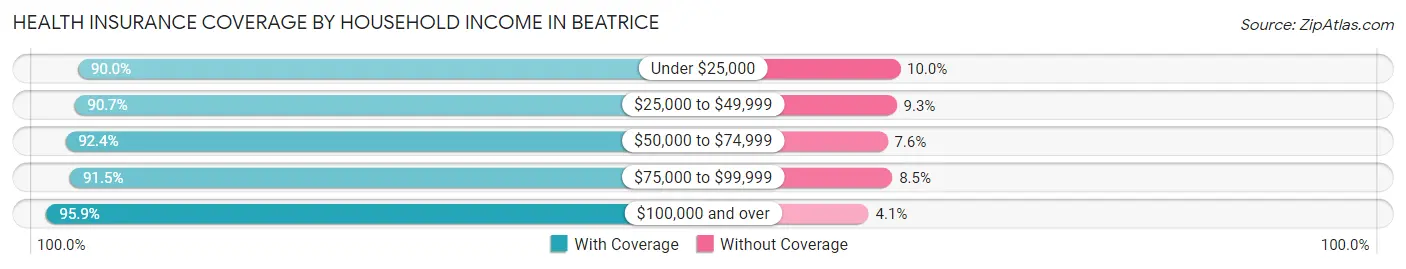
| Household Income | With Coverage | Without Coverage |
| Under $25,000 | 1,623 (90.0%) | 180 (10.0%) |
| $25,000 to $49,999 | 2,459 (90.7%) | 253 (9.3%) |
| $50,000 to $74,999 | 1,903 (92.4%) | 157 (7.6%) |
| $75,000 to $99,999 | 1,828 (91.5%) | 170 (8.5%) |
| $100,000 and over | 3,027 (95.9%) | 129 (4.1%) |
Public vs Private Health Insurance Coverage by Age in Beatrice
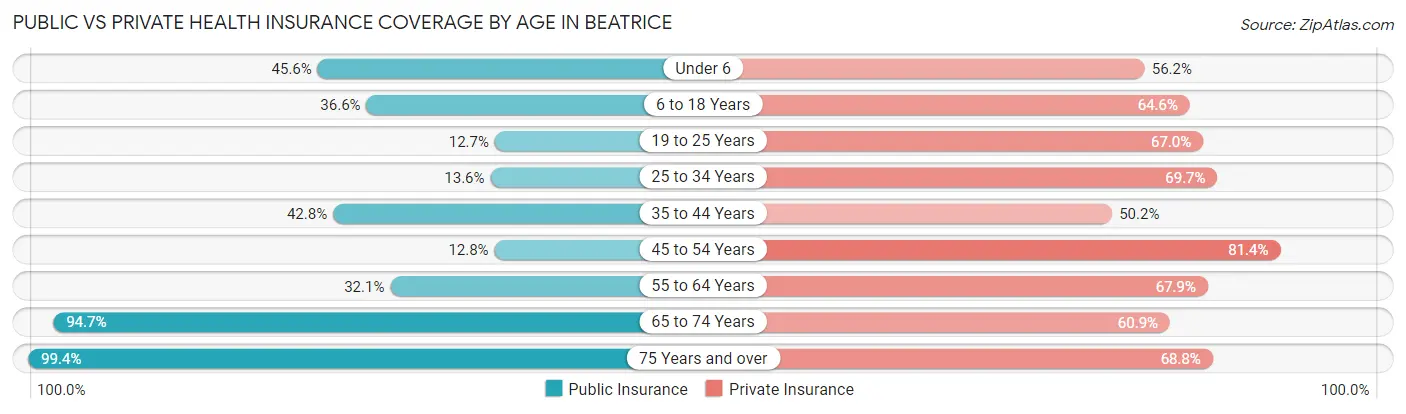
| Age Bracket | Public Insurance | Private Insurance |
| Under 6 | 369 (45.6%) | 455 (56.2%) |
| 6 to 18 Years | 733 (36.6%) | 1,295 (64.6%) |
| 19 to 25 Years | 90 (12.7%) | 474 (67.0%) |
| 25 to 34 Years | 174 (13.6%) | 895 (69.7%) |
| 35 to 44 Years | 632 (42.8%) | 742 (50.2%) |
| 45 to 54 Years | 182 (12.8%) | 1,158 (81.4%) |
| 55 to 64 Years | 570 (32.1%) | 1,205 (67.9%) |
| 65 to 74 Years | 1,247 (94.7%) | 802 (60.9%) |
| 75 Years and over | 1,218 (99.4%) | 844 (68.8%) |
| Total | 5,215 (43.4%) | 7,870 (65.5%) |
Disability Status by Sex by Age in Beatrice
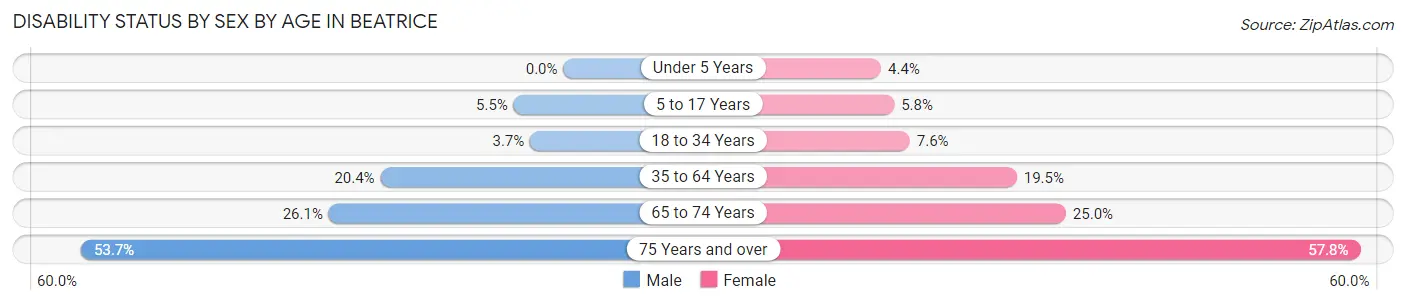
| Age Bracket | Male | Female |
| Under 5 Years | 0 (0.0%) | 13 (4.4%) |
| 5 to 17 Years | 56 (5.5%) | 55 (5.8%) |
| 18 to 34 Years | 37 (3.7%) | 86 (7.6%) |
| 35 to 64 Years | 480 (20.4%) | 452 (19.5%) |
| 65 to 74 Years | 162 (26.1%) | 174 (25.0%) |
| 75 Years and over | 253 (53.7%) | 436 (57.8%) |
Disability Class by Sex by Age in Beatrice
Disability Class: Hearing Difficulty
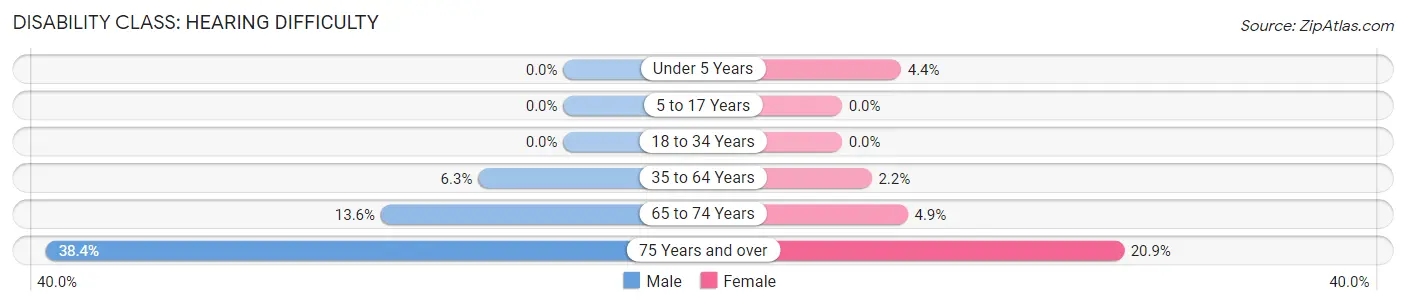
| Age Bracket | Male | Female |
| Under 5 Years | 0 (0.0%) | 13 (4.4%) |
| 5 to 17 Years | 0 (0.0%) | 0 (0.0%) |
| 18 to 34 Years | 0 (0.0%) | 0 (0.0%) |
| 35 to 64 Years | 149 (6.3%) | 51 (2.2%) |
| 65 to 74 Years | 84 (13.6%) | 34 (4.9%) |
| 75 Years and over | 181 (38.4%) | 158 (20.9%) |
Disability Class: Vision Difficulty
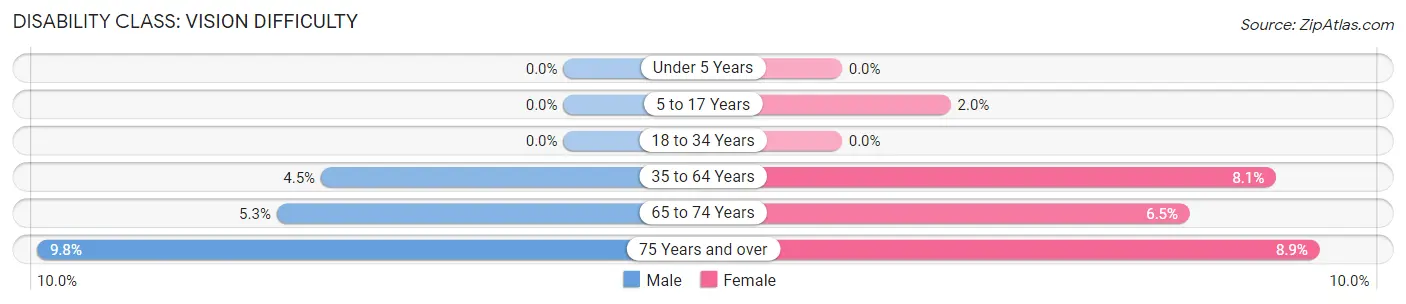
| Age Bracket | Male | Female |
| Under 5 Years | 0 (0.0%) | 0 (0.0%) |
| 5 to 17 Years | 0 (0.0%) | 19 (2.0%) |
| 18 to 34 Years | 0 (0.0%) | 0 (0.0%) |
| 35 to 64 Years | 106 (4.5%) | 187 (8.1%) |
| 65 to 74 Years | 33 (5.3%) | 45 (6.5%) |
| 75 Years and over | 46 (9.8%) | 67 (8.9%) |
Disability Class: Cognitive Difficulty
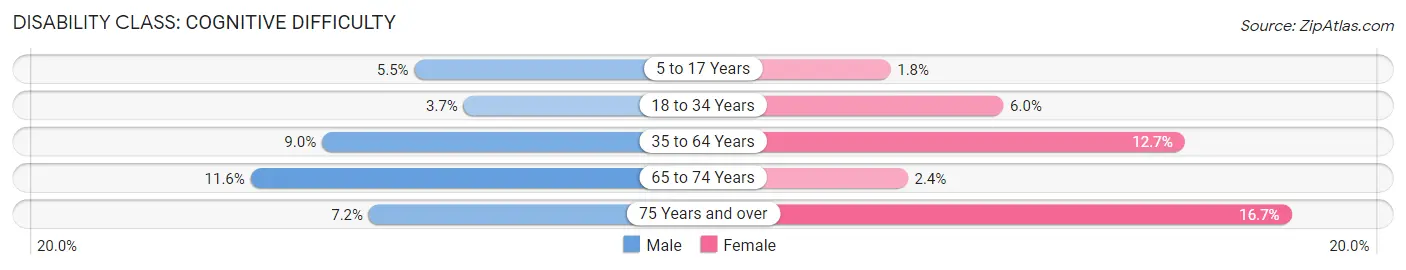
| Age Bracket | Male | Female |
| 5 to 17 Years | 56 (5.5%) | 17 (1.8%) |
| 18 to 34 Years | 37 (3.7%) | 68 (6.0%) |
| 35 to 64 Years | 211 (9.0%) | 295 (12.7%) |
| 65 to 74 Years | 72 (11.6%) | 17 (2.4%) |
| 75 Years and over | 34 (7.2%) | 126 (16.7%) |
Disability Class: Ambulatory Difficulty
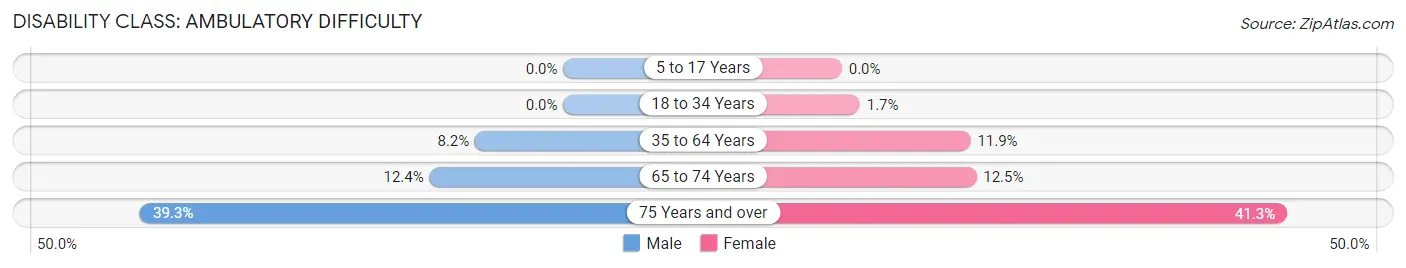
| Age Bracket | Male | Female |
| 5 to 17 Years | 0 (0.0%) | 0 (0.0%) |
| 18 to 34 Years | 0 (0.0%) | 19 (1.7%) |
| 35 to 64 Years | 193 (8.2%) | 277 (11.9%) |
| 65 to 74 Years | 77 (12.4%) | 87 (12.5%) |
| 75 Years and over | 185 (39.3%) | 312 (41.3%) |
Disability Class: Self-Care Difficulty
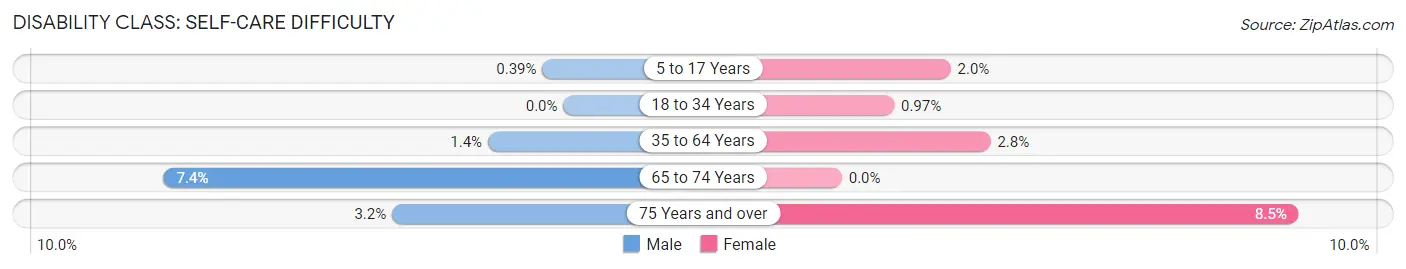
| Age Bracket | Male | Female |
| 5 to 17 Years | 4 (0.4%) | 19 (2.0%) |
| 18 to 34 Years | 0 (0.0%) | 11 (1.0%) |
| 35 to 64 Years | 33 (1.4%) | 64 (2.8%) |
| 65 to 74 Years | 46 (7.4%) | 0 (0.0%) |
| 75 Years and over | 15 (3.2%) | 64 (8.5%) |
Technology Access in Beatrice
Computing Device Access in Beatrice
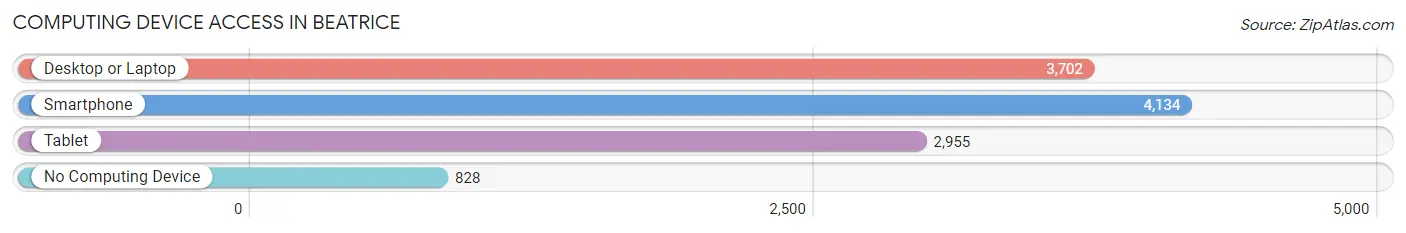
| Device Type | # Households | % Households |
| Desktop or Laptop | 3,702 | 67.5% |
| Smartphone | 4,134 | 75.4% |
| Tablet | 2,955 | 53.9% |
| No Computing Device | 828 | 15.1% |
| Total | 5,482 | 100.0% |
Internet Access in Beatrice
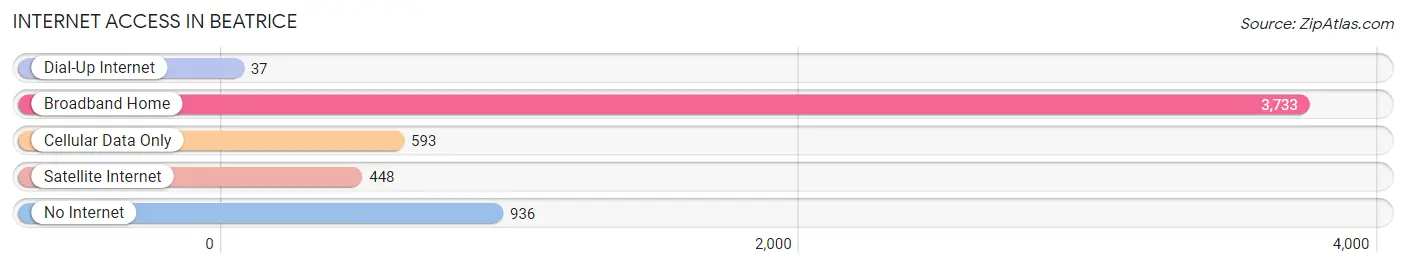
| Internet Type | # Households | % Households |
| Dial-Up Internet | 37 | 0.7% |
| Broadband Home | 3,733 | 68.1% |
| Cellular Data Only | 593 | 10.8% |
| Satellite Internet | 448 | 8.2% |
| No Internet | 936 | 17.1% |
| Total | 5,482 | 100.0% |
Beatrice Summary
History
Beatrice, Nebraska is a city located in Gage County, Nebraska. It is the county seat of Gage County and is located along the Big Blue River. The city was founded in 1857 and was named after Beatrice LaForce, the daughter of a prominent early settler. The city was incorporated in 1873 and has a population of 12,459 as of the 2010 census.
The city of Beatrice has a rich history that dates back to the early days of the American West. The city was founded by a group of settlers from Ohio who were looking for a place to settle and start a new life. The settlers chose the area because of its fertile soil and abundant water supply. The city was originally called LaForce, after Beatrice LaForce, the daughter of one of the settlers. The name was changed to Beatrice in 1873 when the city was incorporated.
The city of Beatrice has been an important part of the history of Nebraska. It was the site of the first state fair in 1872 and was the home of the first state university, the University of Nebraska-Lincoln. The city was also the site of the first state capitol building, which was built in 1867.
The city of Beatrice has also been an important part of the history of the United States. During World War II, the city was the site of a prisoner of war camp. The camp housed German prisoners of war and was the site of the first German-American exchange of prisoners of war.
Geography
Beatrice is located in Gage County, Nebraska. It is situated along the Big Blue River and is located about 50 miles south of Lincoln, the state capital. The city has a total area of 5.3 square miles, all of which is land. The city has a humid continental climate, with hot summers and cold winters.
The city of Beatrice is home to several parks and recreational areas, including the Beatrice State Recreation Area, which is located along the Big Blue River. The city also has several golf courses, including the Beatrice Country Club and the Beatrice Municipal Golf Course.
Economy
The economy of Beatrice is largely based on agriculture and manufacturing. The city is home to several large agricultural companies, including the Beatrice Creamery Company, which produces dairy products, and the Beatrice Canning Company, which produces canned vegetables. The city is also home to several manufacturing companies, including the Beatrice Manufacturing Company, which produces furniture, and the Beatrice Tool and Die Company, which produces tools and dies.
The city of Beatrice is also home to several retail stores, including the Beatrice Mall, which is the largest shopping center in the city. The city also has several restaurants, bars, and other entertainment venues.
Demographics
As of the 2010 census, the population of Beatrice was 12,459. The racial makeup of the city was 91.3% White, 0.7% African American, 0.3% Native American, 0.7% Asian, 0.1% Pacific Islander, 4.7% from other races, and 2.1% from two or more races. Hispanic or Latino of any race were 8.2% of the population.
The median income for a household in Beatrice was $41,945, and the median income for a family was $50,945. The per capita income for the city was $20,945. About 8.2% of families and 10.7% of the population were below the poverty line, including 14.2% of those under age 18 and 8.2% of those age 65 or over.
Common Questions
What is Per Capita Income in Beatrice?
Per Capita income in Beatrice is $29,369.
What is the Median Family Income in Beatrice?
Median Family Income in Beatrice is $69,417.
What is the Median Household income in Beatrice?
Median Household Income in Beatrice is $49,537.
What is Income or Wage Gap in Beatrice?
Income or Wage Gap in Beatrice is 30.6%.
Women in Beatrice earn 69.4 cents for every dollar earned by a man.
What is Family Income Deficit in Beatrice?
Family Income Deficit in Beatrice is $11,037.
Families that are below poverty line in Beatrice earn $11,037 less on average than the poverty threshold level.
What is Inequality or Gini Index in Beatrice?
Inequality or Gini Index in Beatrice is 0.44.
What is the Total Population of Beatrice?
Total Population of Beatrice is 12,237.
What is the Total Male Population of Beatrice?
Total Male Population of Beatrice is 5,935.
What is the Total Female Population of Beatrice?
Total Female Population of Beatrice is 6,302.
What is the Ratio of Males per 100 Females in Beatrice?
There are 94.18 Males per 100 Females in Beatrice.
What is the Ratio of Females per 100 Males in Beatrice?
There are 106.18 Females per 100 Males in Beatrice.
What is the Median Population Age in Beatrice?
Median Population Age in Beatrice is 42.9 Years.
What is the Average Family Size in Beatrice
Average Family Size in Beatrice is 2.9 People.
What is the Average Household Size in Beatrice
Average Household Size in Beatrice is 2.1 People.
How Large is the Labor Force in Beatrice?
There are 6,009 People in the Labor Forcein in Beatrice.
What is the Percentage of People in the Labor Force in Beatrice?
60.6% of People are in the Labor Force in Beatrice.
What is the Unemployment Rate in Beatrice?
Unemployment Rate in Beatrice is 3.0%.