Kearney, NE Map & Demographics
Kearney Map
Kearney Overview
$35,507
PER CAPITA INCOME
$93,765
AVG FAMILY INCOME
$66,843
AVG HOUSEHOLD INCOME
34.3%
WAGE / INCOME GAP [ % ]
65.7¢/ $1
WAGE / INCOME GAP [ $ ]
$8,815
FAMILY INCOME DEFICIT
0.45
INEQUALITY / GINI INDEX
33,809
TOTAL POPULATION
16,921
MALE POPULATION
16,888
FEMALE POPULATION
100.20
MALES / 100 FEMALES
99.80
FEMALES / 100 MALES
31.9
MEDIAN AGE
2.9
AVG FAMILY SIZE
2.4
AVG HOUSEHOLD SIZE
19,616
LABOR FORCE [ PEOPLE ]
71.2%
PERCENT IN LABOR FORCE
2.9%
UNEMPLOYMENT RATE
Kearney Area Codes
Income in Kearney
Income Overview in Kearney
Per Capita Income in Kearney is $35,507, while median incomes of families and households are $93,765 and $66,843 respectively.
| Characteristic | Number | Measure |
| Per Capita Income | 33,809 | $35,507 |
| Median Family Income | 7,706 | $93,765 |
| Mean Family Income | 7,706 | $109,663 |
| Median Household Income | 13,579 | $66,843 |
| Mean Household Income | 13,579 | $85,354 |
| Income Deficit | 7,706 | $8,815 |
| Wage / Income Gap (%) | 33,809 | 34.33% |
| Wage / Income Gap ($) | 33,809 | 65.67¢ per $1 |
| Gini / Inequality Index | 33,809 | 0.45 |
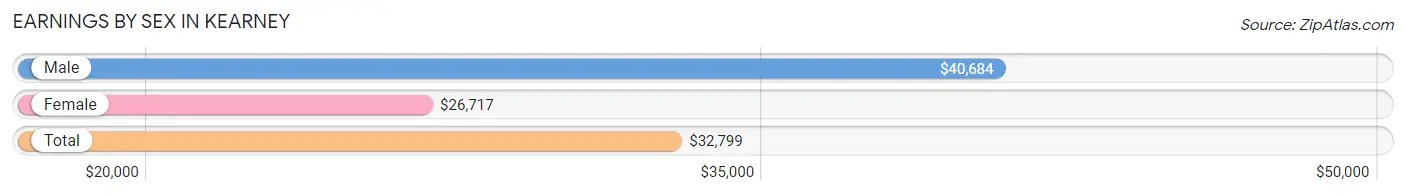
Earnings by Sex in Kearney
Average Earnings in Kearney are $32,799, $40,684 for men and $26,717 for women, a difference of 34.3%.
| Sex | Number | Average Earnings |
| Male | 11,090 (53.0%) | $40,684 |
| Female | 9,824 (47.0%) | $26,717 |
| Total | 20,914 (100.0%) | $32,799 |
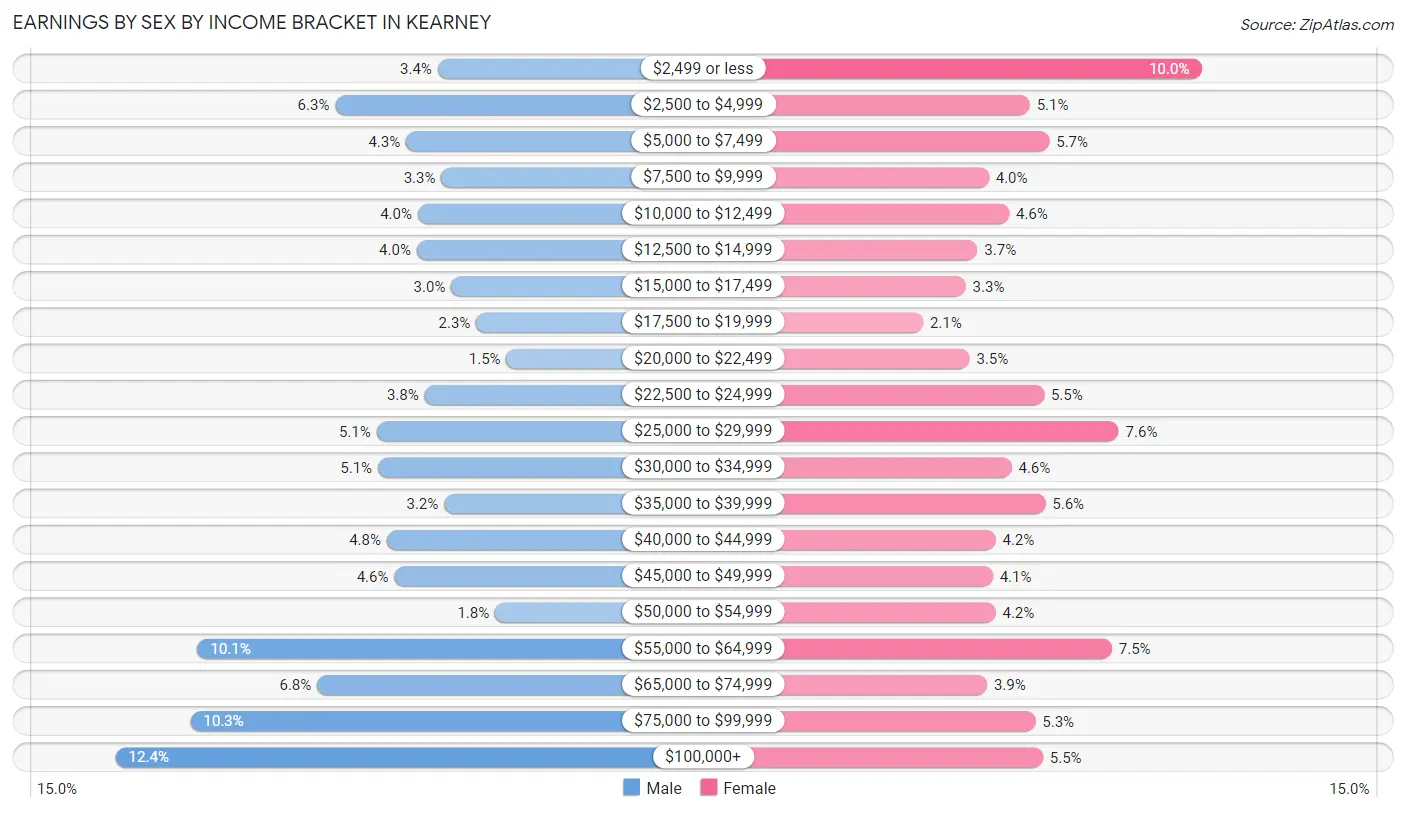
Earnings by Sex by Income Bracket in Kearney
The most common earnings brackets in Kearney are $100,000+ for men (1,380 | 12.4%) and $2,499 or less for women (978 | 10.0%).
| Income | Male | Female |
| $2,499 or less | 376 (3.4%) | 978 (10.0%) |
| $2,500 to $4,999 | 695 (6.3%) | 505 (5.1%) |
| $5,000 to $7,499 | 475 (4.3%) | 559 (5.7%) |
| $7,500 to $9,999 | 365 (3.3%) | 392 (4.0%) |
| $10,000 to $12,499 | 438 (4.0%) | 448 (4.6%) |
| $12,500 to $14,999 | 441 (4.0%) | 361 (3.7%) |
| $15,000 to $17,499 | 334 (3.0%) | 328 (3.3%) |
| $17,500 to $19,999 | 256 (2.3%) | 210 (2.1%) |
| $20,000 to $22,499 | 162 (1.5%) | 339 (3.5%) |
| $22,500 to $24,999 | 417 (3.8%) | 544 (5.5%) |
| $25,000 to $29,999 | 567 (5.1%) | 751 (7.6%) |
| $30,000 to $34,999 | 562 (5.1%) | 455 (4.6%) |
| $35,000 to $39,999 | 356 (3.2%) | 548 (5.6%) |
| $40,000 to $44,999 | 534 (4.8%) | 411 (4.2%) |
| $45,000 to $49,999 | 511 (4.6%) | 403 (4.1%) |
| $50,000 to $54,999 | 197 (1.8%) | 411 (4.2%) |
| $55,000 to $64,999 | 1,125 (10.1%) | 732 (7.4%) |
| $65,000 to $74,999 | 752 (6.8%) | 387 (3.9%) |
| $75,000 to $99,999 | 1,147 (10.3%) | 521 (5.3%) |
| $100,000+ | 1,380 (12.4%) | 541 (5.5%) |
| Total | 11,090 (100.0%) | 9,824 (100.0%) |
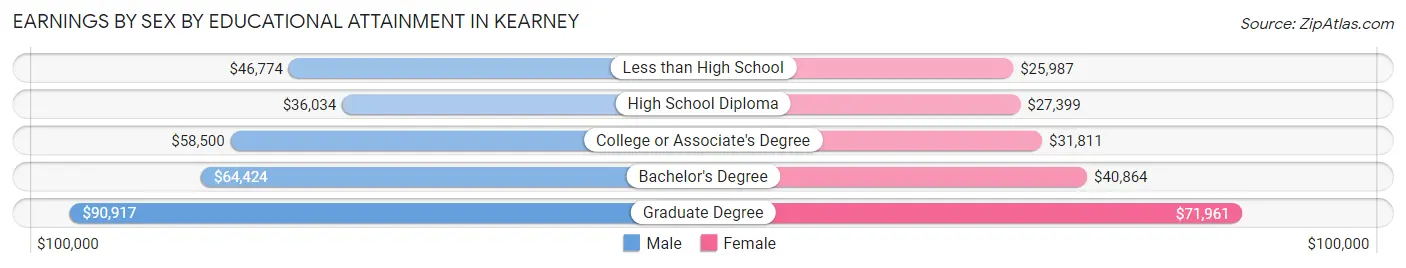
Earnings by Sex by Educational Attainment in Kearney
Average earnings in Kearney are $59,713 for men and $40,176 for women, a difference of 32.7%. Men with an educational attainment of graduate degree enjoy the highest average annual earnings of $90,917, while those with high school diploma education earn the least with $36,034. Women with an educational attainment of graduate degree earn the most with the average annual earnings of $71,961, while those with less than high school education have the smallest earnings of $25,987.
| Educational Attainment | Male Income | Female Income |
| Less than High School | $46,774 | $25,987 |
| High School Diploma | $36,034 | $27,399 |
| College or Associate's Degree | $58,500 | $31,811 |
| Bachelor's Degree | $64,424 | $40,864 |
| Graduate Degree | $90,917 | $71,961 |
| Total | $59,713 | $40,176 |
Family Income in Kearney
Family Income Brackets in Kearney
According to the Kearney family income data, there are 1,996 families falling into the $100,000 to $149,999 income range, which is the most common income bracket and makes up 25.9% of all families. Conversely, the $10,000 to $14,999 income bracket is the least frequent group with only 31 families (0.4%) belonging to this category.
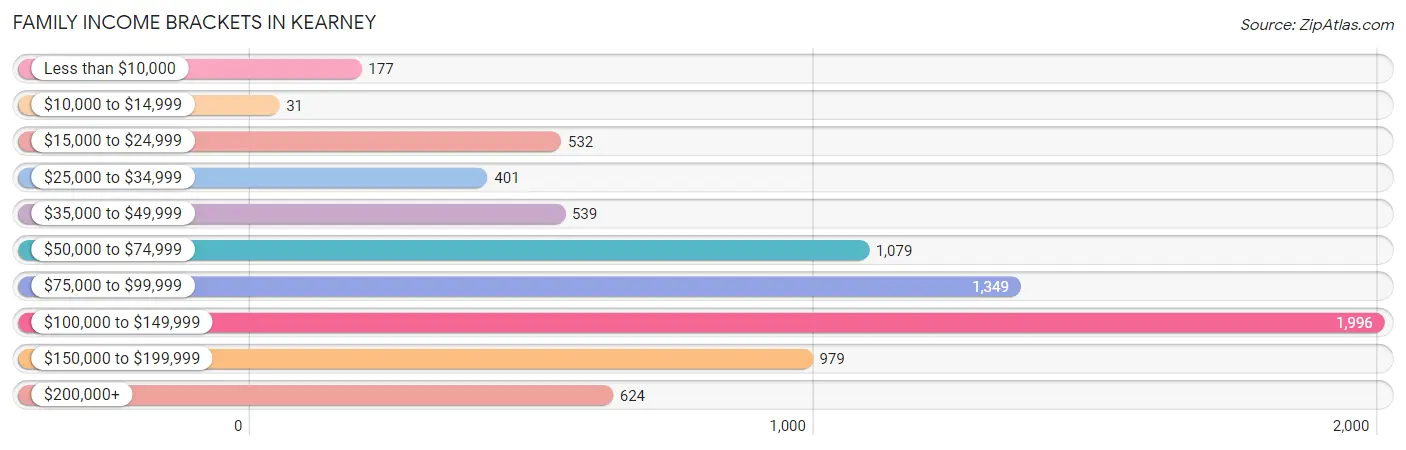
| Income Bracket | # Families | % Families |
| Less than $10,000 | 177 | 2.3% |
| $10,000 to $14,999 | 31 | 0.4% |
| $15,000 to $24,999 | 532 | 6.9% |
| $25,000 to $34,999 | 401 | 5.2% |
| $35,000 to $49,999 | 539 | 7.0% |
| $50,000 to $74,999 | 1,079 | 14.0% |
| $75,000 to $99,999 | 1,349 | 17.5% |
| $100,000 to $149,999 | 1,996 | 25.9% |
| $150,000 to $199,999 | 979 | 12.7% |
| $200,000+ | 624 | 8.1% |
Family Income by Famaliy Size in Kearney
6-person families (97 | 1.3%) account for the highest median family income in Kearney with $122,946 per family, while 2-person families (4,091 | 53.1%) have the highest median income of $43,433 per family member.
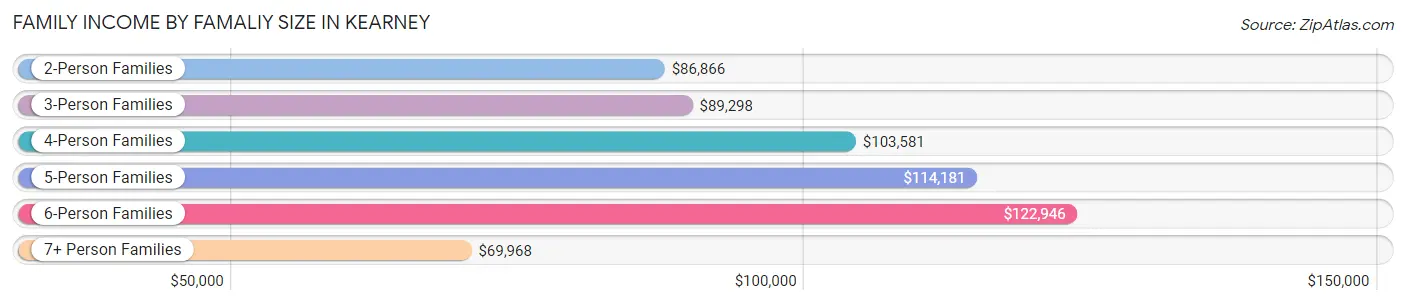
| Income Bracket | # Families | Median Income |
| 2-Person Families | 4,091 (53.1%) | $86,866 |
| 3-Person Families | 1,601 (20.8%) | $89,298 |
| 4-Person Families | 1,285 (16.7%) | $103,581 |
| 5-Person Families | 527 (6.8%) | $114,181 |
| 6-Person Families | 97 (1.3%) | $122,946 |
| 7+ Person Families | 105 (1.4%) | $69,968 |
| Total | 7,706 (100.0%) | $93,765 |
Family Income by Number of Earners in Kearney
The median family income in Kearney is $93,765, with families comprising 2 earners (3,604) having the highest median family income of $122,371, while families with 1 earner (2,311) have the lowest median family income of $63,991, accounting for 46.8% and 30.0% of families, respectively.
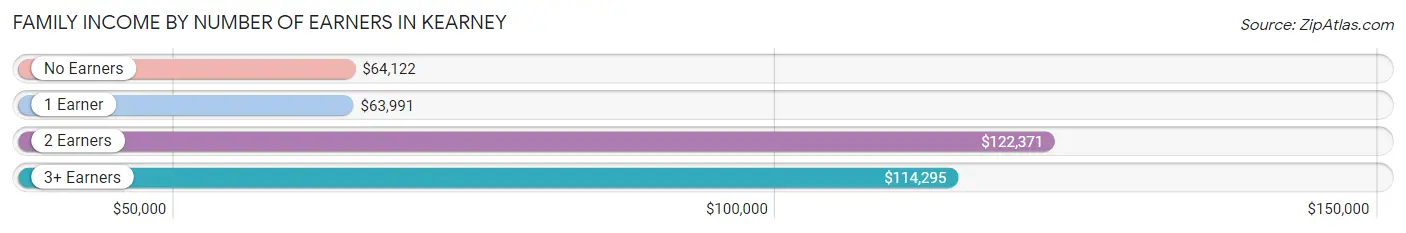
| Number of Earners | # Families | Median Income |
| No Earners | 1,049 (13.6%) | $64,122 |
| 1 Earner | 2,311 (30.0%) | $63,991 |
| 2 Earners | 3,604 (46.8%) | $122,371 |
| 3+ Earners | 742 (9.6%) | $114,295 |
| Total | 7,706 (100.0%) | $93,765 |
Household Income in Kearney
Household Income Brackets in Kearney
With 2,363 households falling in the category, the $100,000 to $149,999 income range is the most frequent in Kearney, accounting for 17.4% of all households. In contrast, only 367 households (2.7%) fall into the $10,000 to $14,999 income bracket, making it the least populous group.
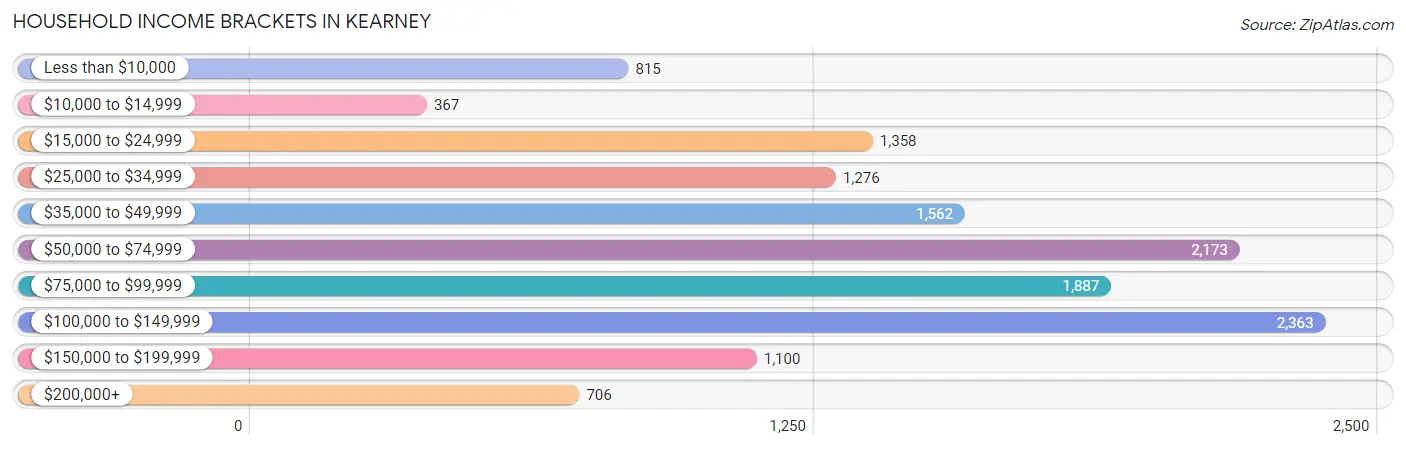
| Income Bracket | # Households | % Households |
| Less than $10,000 | 815 | 6.0% |
| $10,000 to $14,999 | 367 | 2.7% |
| $15,000 to $24,999 | 1,358 | 10.0% |
| $25,000 to $34,999 | 1,276 | 9.4% |
| $35,000 to $49,999 | 1,562 | 11.5% |
| $50,000 to $74,999 | 2,173 | 16.0% |
| $75,000 to $99,999 | 1,887 | 13.9% |
| $100,000 to $149,999 | 2,363 | 17.4% |
| $150,000 to $199,999 | 1,100 | 8.1% |
| $200,000+ | 706 | 5.2% |
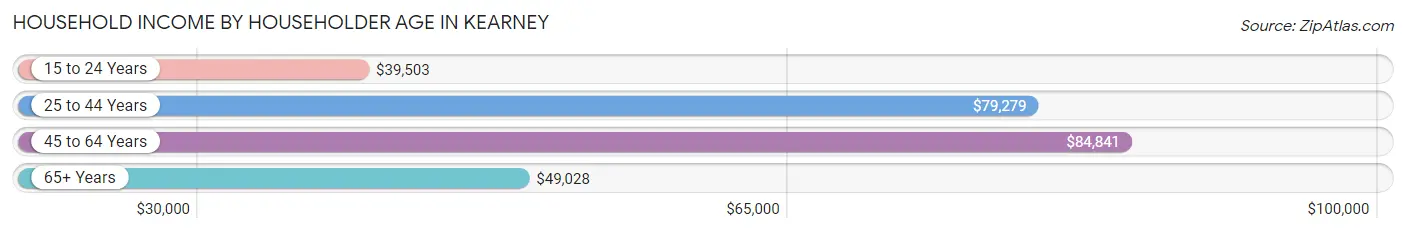
Household Income by Householder Age in Kearney
The median household income in Kearney is $66,843, with the highest median household income of $84,841 found in the 45 to 64 years age bracket for the primary householder. A total of 3,617 households (26.6%) fall into this category. Meanwhile, the 15 to 24 years age bracket for the primary householder has the lowest median household income of $39,503, with 1,729 households (12.7%) in this group.
| Income Bracket | # Households | Median Income |
| 15 to 24 Years | 1,729 (12.7%) | $39,503 |
| 25 to 44 Years | 4,911 (36.2%) | $79,279 |
| 45 to 64 Years | 3,617 (26.6%) | $84,841 |
| 65+ Years | 3,322 (24.5%) | $49,028 |
| Total | 13,579 (100.0%) | $66,843 |
Poverty in Kearney
Income Below Poverty by Sex and Age in Kearney
With 13.1% poverty level for males and 17.1% for females among the residents of Kearney, 5 year old males and 18 to 24 year old females are the most vulnerable to poverty, with 54 males (30.7%) and 973 females (42.1%) in their respective age groups living below the poverty level.
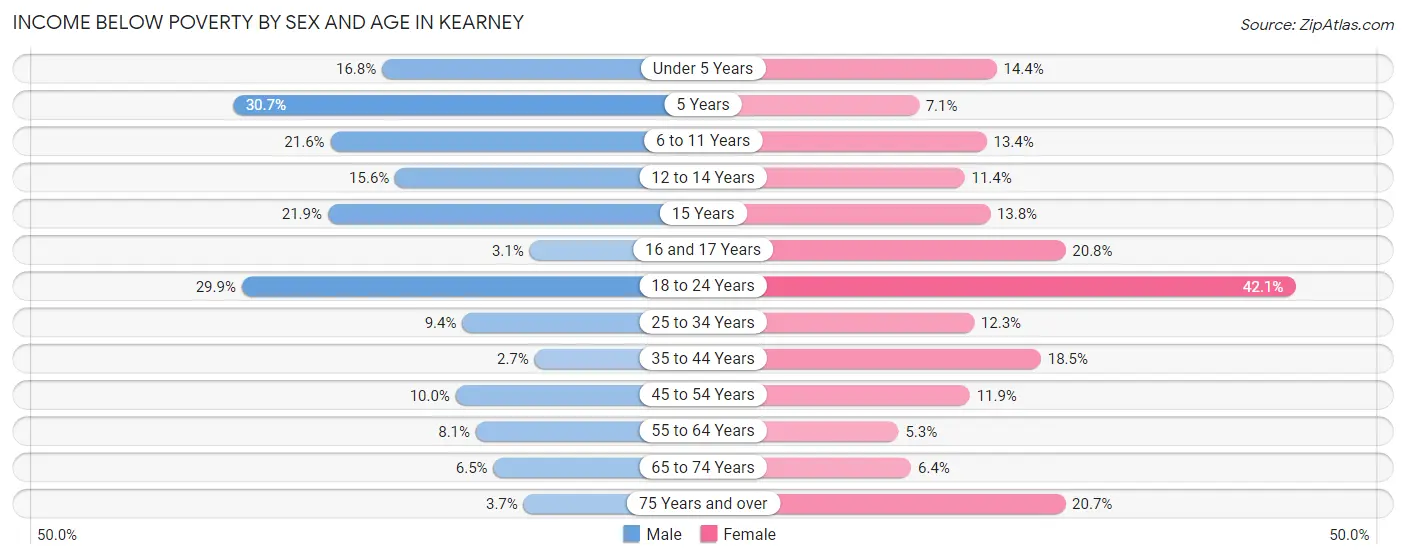
| Age Bracket | Male | Female |
| Under 5 Years | 188 (16.8%) | 143 (14.4%) |
| 5 Years | 54 (30.7%) | 10 (7.1%) |
| 6 to 11 Years | 245 (21.6%) | 155 (13.4%) |
| 12 to 14 Years | 89 (15.6%) | 67 (11.4%) |
| 15 Years | 40 (21.9%) | 22 (13.8%) |
| 16 and 17 Years | 16 (3.1%) | 55 (20.7%) |
| 18 to 24 Years | 819 (29.8%) | 973 (42.1%) |
| 25 to 34 Years | 221 (9.4%) | 257 (12.3%) |
| 35 to 44 Years | 60 (2.7%) | 374 (18.5%) |
| 45 to 54 Years | 152 (10.0%) | 170 (11.9%) |
| 55 to 64 Years | 122 (8.1%) | 91 (5.3%) |
| 65 to 74 Years | 92 (6.5%) | 96 (6.4%) |
| 75 Years and over | 27 (3.7%) | 283 (20.7%) |
| Total | 2,125 (13.1%) | 2,696 (17.1%) |
Income Above Poverty by Sex and Age in Kearney
According to the poverty statistics in Kearney, males aged 35 to 44 years and females aged 55 to 64 years are the age groups that are most secure financially, with 97.3% of males and 94.7% of females in these age groups living above the poverty line.
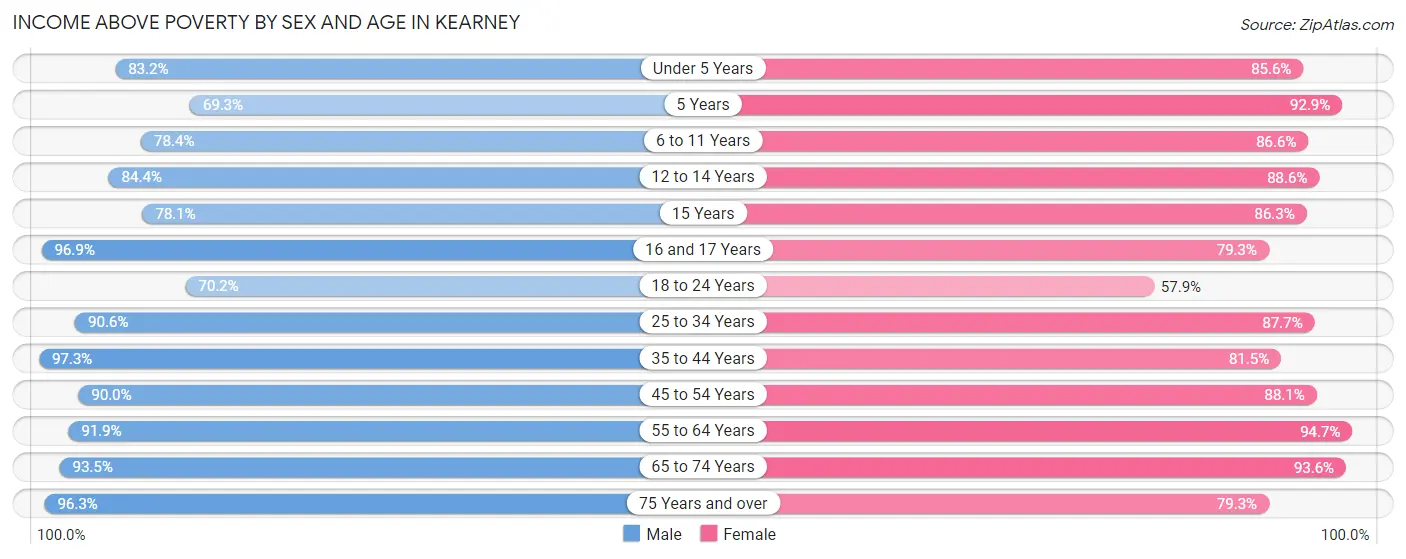
| Age Bracket | Male | Female |
| Under 5 Years | 929 (83.2%) | 853 (85.6%) |
| 5 Years | 122 (69.3%) | 130 (92.9%) |
| 6 to 11 Years | 888 (78.4%) | 999 (86.6%) |
| 12 to 14 Years | 481 (84.4%) | 521 (88.6%) |
| 15 Years | 143 (78.1%) | 138 (86.3%) |
| 16 and 17 Years | 494 (96.9%) | 210 (79.2%) |
| 18 to 24 Years | 1,925 (70.2%) | 1,340 (57.9%) |
| 25 to 34 Years | 2,135 (90.6%) | 1,839 (87.7%) |
| 35 to 44 Years | 2,189 (97.3%) | 1,651 (81.5%) |
| 45 to 54 Years | 1,369 (90.0%) | 1,262 (88.1%) |
| 55 to 64 Years | 1,381 (91.9%) | 1,639 (94.7%) |
| 65 to 74 Years | 1,326 (93.5%) | 1,397 (93.6%) |
| 75 Years and over | 704 (96.3%) | 1,082 (79.3%) |
| Total | 14,086 (86.9%) | 13,061 (82.9%) |
Income Below Poverty Among Married-Couple Families in Kearney
The poverty statistics for married-couple families in Kearney show that 2.5% or 139 of the total 5,660 families live below the poverty line. Families with 3 or 4 children have the highest poverty rate of 3.6%, comprising of 14 families. On the other hand, families with 5 or more children have the lowest poverty rate of 0.0%, which includes 0 families.
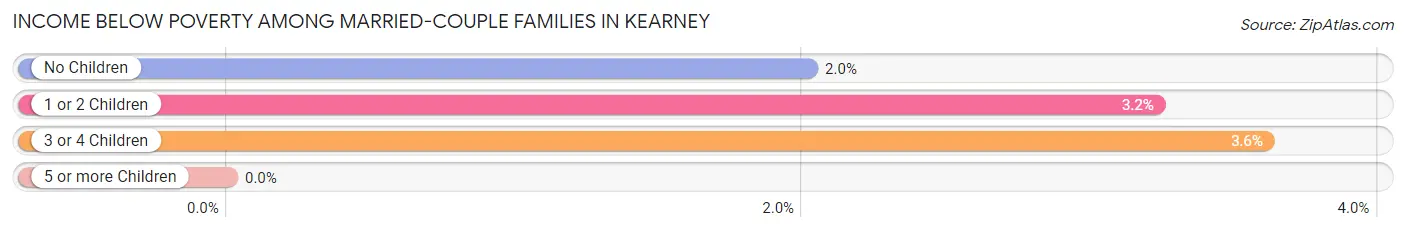
| Children | Above Poverty | Below Poverty |
| No Children | 3,437 (98.0%) | 71 (2.0%) |
| 1 or 2 Children | 1,619 (96.8%) | 54 (3.2%) |
| 3 or 4 Children | 374 (96.4%) | 14 (3.6%) |
| 5 or more Children | 91 (100.0%) | 0 (0.0%) |
| Total | 5,521 (97.5%) | 139 (2.5%) |
Income Below Poverty Among Single-Parent Households in Kearney
According to the poverty data in Kearney, 11.5% or 60 single-father households and 30.9% or 472 single-mother households are living below the poverty line. Among single-father households, those with 1 or 2 children have the highest poverty rate, with 44 households (16.8%) experiencing poverty. Likewise, among single-mother households, those with 5 or more children have the highest poverty rate, with 15 households (100.0%) falling below the poverty line.
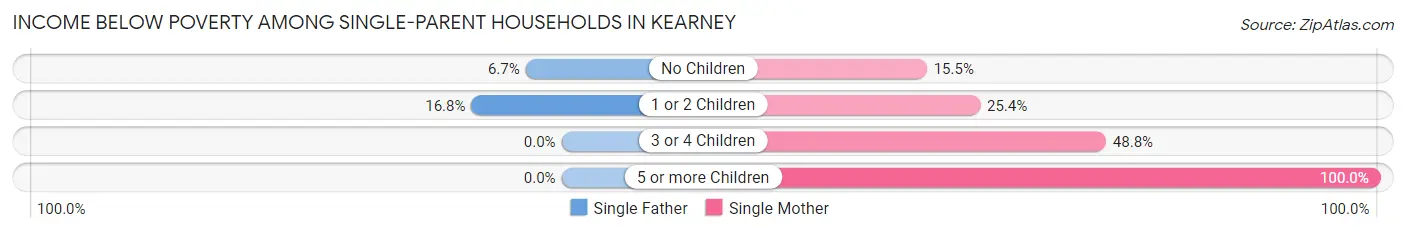
| Children | Single Father | Single Mother |
| No Children | 16 (6.7%) | 43 (15.5%) |
| 1 or 2 Children | 44 (16.8%) | 204 (25.4%) |
| 3 or 4 Children | 0 (0.0%) | 210 (48.8%) |
| 5 or more Children | 0 (0.0%) | 15 (100.0%) |
| Total | 60 (11.5%) | 472 (30.9%) |
Income Below Poverty Among Married-Couple vs Single-Parent Households in Kearney
The poverty data for Kearney shows that 139 of the married-couple family households (2.5%) and 532 of the single-parent households (26.0%) are living below the poverty level. Within the married-couple family households, those with 3 or 4 children have the highest poverty rate, with 14 households (3.6%) falling below the poverty line. Among the single-parent households, those with 5 or more children have the highest poverty rate, with 15 household (100.0%) living below poverty.
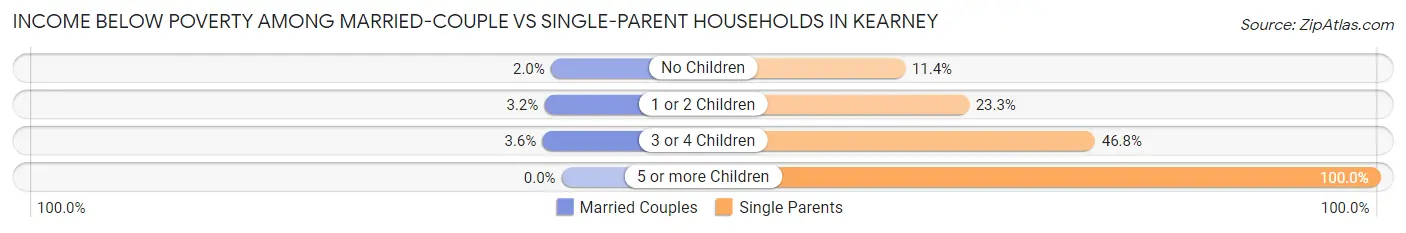
| Children | Married-Couple Families | Single-Parent Households |
| No Children | 71 (2.0%) | 59 (11.4%) |
| 1 or 2 Children | 54 (3.2%) | 248 (23.3%) |
| 3 or 4 Children | 14 (3.6%) | 210 (46.8%) |
| 5 or more Children | 0 (0.0%) | 15 (100.0%) |
| Total | 139 (2.5%) | 532 (26.0%) |
Race in Kearney
The most populous races in Kearney are White / Caucasian (29,353 | 86.8%), Hispanic or Latino (3,532 | 10.4%), and Some other Race (1,592 | 4.7%).
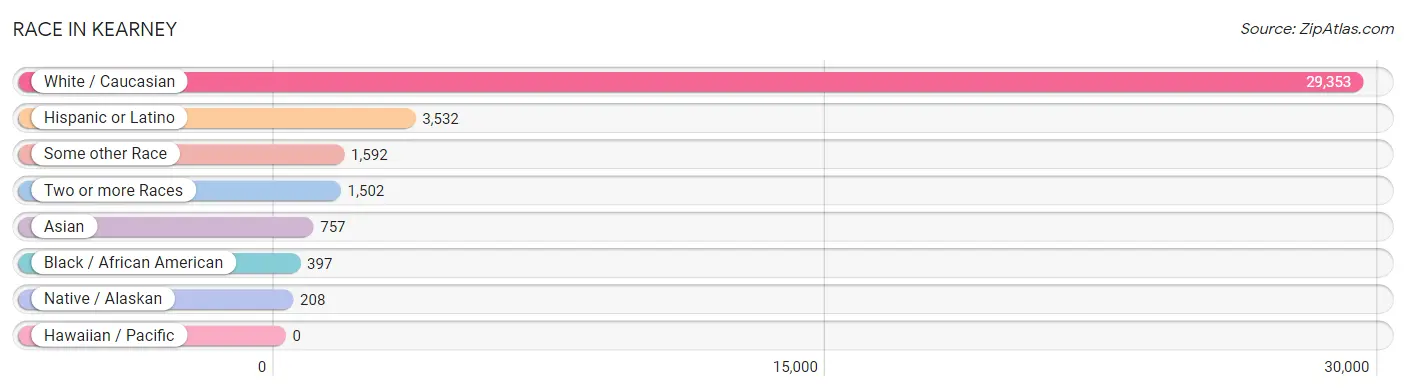
| Race | # Population | % Population |
| Asian | 757 | 2.2% |
| Black / African American | 397 | 1.2% |
| Hawaiian / Pacific | 0 | 0.0% |
| Hispanic or Latino | 3,532 | 10.4% |
| Native / Alaskan | 208 | 0.6% |
| White / Caucasian | 29,353 | 86.8% |
| Two or more Races | 1,502 | 4.4% |
| Some other Race | 1,592 | 4.7% |
| Total | 33,809 | 100.0% |
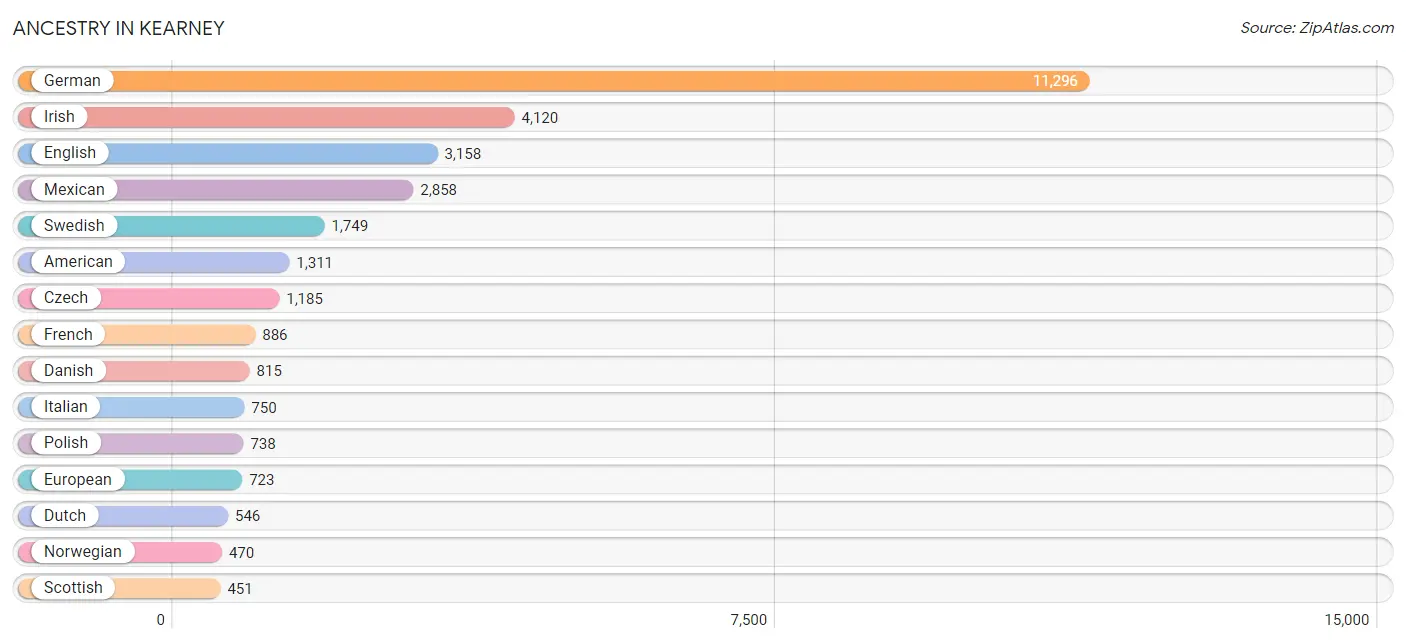
Ancestry in Kearney
The most populous ancestries reported in Kearney are German (11,296 | 33.4%), Irish (4,120 | 12.2%), English (3,158 | 9.3%), Mexican (2,858 | 8.5%), and Swedish (1,749 | 5.2%), together accounting for 68.6% of all Kearney residents.
| Ancestry | # Population | % Population |
| African | 114 | 0.3% |
| American | 1,311 | 3.9% |
| Arab | 71 | 0.2% |
| Argentinean | 5 | 0.0% |
| Armenian | 12 | 0.0% |
| Assyrian / Chaldean / Syriac | 8 | 0.0% |
| Australian | 59 | 0.2% |
| Austrian | 43 | 0.1% |
| Belgian | 32 | 0.1% |
| Bhutanese | 184 | 0.5% |
| Bolivian | 72 | 0.2% |
| British | 273 | 0.8% |
| Burmese | 242 | 0.7% |
| Cajun | 10 | 0.0% |
| Central American | 342 | 1.0% |
| Central American Indian | 3 | 0.0% |
| Cherokee | 71 | 0.2% |
| Colombian | 39 | 0.1% |
| Czech | 1,185 | 3.5% |
| Czechoslovakian | 137 | 0.4% |
| Danish | 815 | 2.4% |
| Dutch | 546 | 1.6% |
| Eastern European | 7 | 0.0% |
| English | 3,158 | 9.3% |
| European | 723 | 2.1% |
| Finnish | 27 | 0.1% |
| French | 886 | 2.6% |
| French Canadian | 81 | 0.2% |
| German | 11,296 | 33.4% |
| German Russian | 9 | 0.0% |
| Greek | 30 | 0.1% |
| Guatemalan | 223 | 0.7% |
| Haitian | 10 | 0.0% |
| Honduran | 18 | 0.1% |
| Hungarian | 14 | 0.0% |
| Indian (Asian) | 368 | 1.1% |
| Irish | 4,120 | 12.2% |
| Italian | 750 | 2.2% |
| Lebanese | 36 | 0.1% |
| Lumbee | 1 | 0.0% |
| Luxembourger | 15 | 0.0% |
| Mexican | 2,858 | 8.5% |
| Mexican American Indian | 88 | 0.3% |
| Mongolian | 7 | 0.0% |
| Native Hawaiian | 30 | 0.1% |
| Navajo | 3 | 0.0% |
| Northern European | 12 | 0.0% |
| Norwegian | 470 | 1.4% |
| Osage | 14 | 0.0% |
| Pakistani | 19 | 0.1% |
| Palestinian | 35 | 0.1% |
| Pennsylvania German | 6 | 0.0% |
| Polish | 738 | 2.2% |
| Portuguese | 63 | 0.2% |
| Puerto Rican | 81 | 0.2% |
| Russian | 139 | 0.4% |
| Salvadoran | 101 | 0.3% |
| Scandinavian | 286 | 0.9% |
| Scotch-Irish | 245 | 0.7% |
| Scottish | 451 | 1.3% |
| Sioux | 110 | 0.3% |
| South American | 179 | 0.5% |
| Spanish | 11 | 0.0% |
| Sri Lankan | 68 | 0.2% |
| Subsaharan African | 126 | 0.4% |
| Swedish | 1,749 | 5.2% |
| Swiss | 82 | 0.2% |
| Thai | 41 | 0.1% |
| Trinidadian and Tobagonian | 16 | 0.1% |
| Venezuelan | 63 | 0.2% |
| Vietnamese | 25 | 0.1% |
| Welsh | 173 | 0.5% | View All 72 Rows |
Immigrants in Kearney
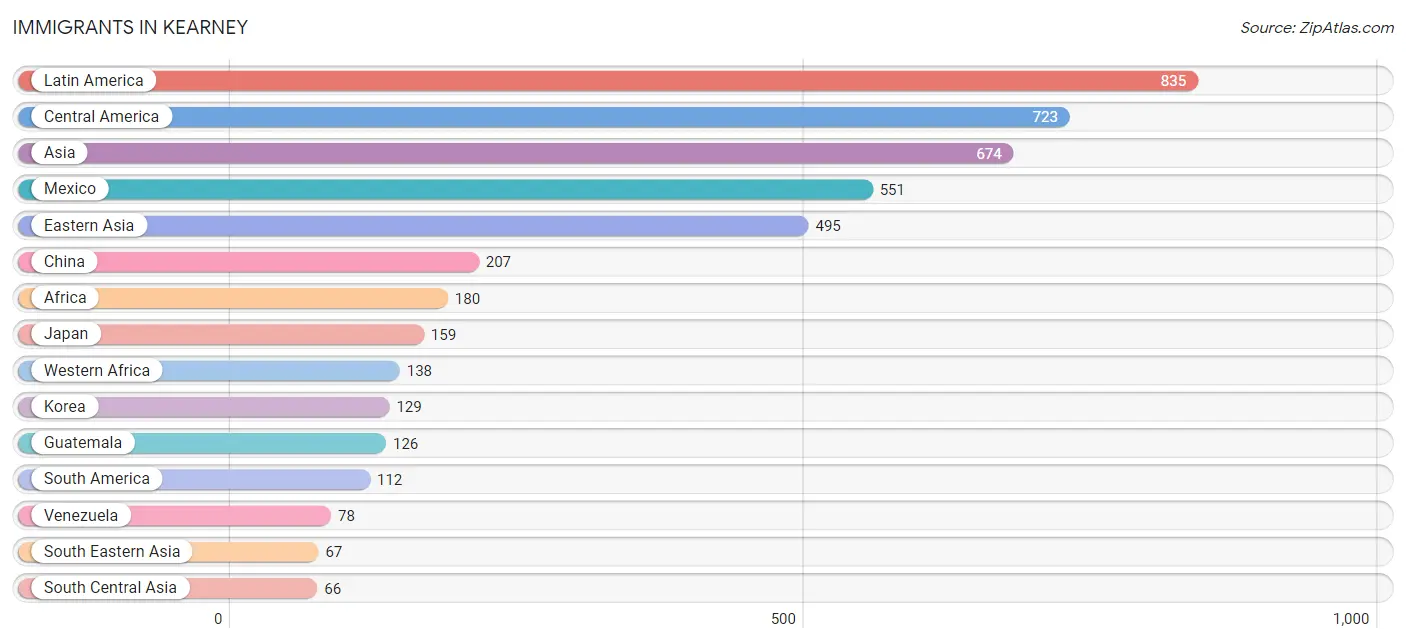
The most numerous immigrant groups reported in Kearney came from Latin America (835 | 2.5%), Central America (723 | 2.1%), Asia (674 | 2.0%), Mexico (551 | 1.6%), and Eastern Asia (495 | 1.5%), together accounting for 9.7% of all Kearney residents.
| Immigration Origin | # Population | % Population |
| Africa | 180 | 0.5% |
| Asia | 674 | 2.0% |
| Austria | 19 | 0.1% |
| Bangladesh | 25 | 0.1% |
| Bolivia | 11 | 0.0% |
| Canada | 22 | 0.1% |
| Central America | 723 | 2.1% |
| China | 207 | 0.6% |
| Colombia | 23 | 0.1% |
| Congo | 22 | 0.1% |
| Eastern Africa | 20 | 0.1% |
| Eastern Asia | 495 | 1.5% |
| El Salvador | 46 | 0.1% |
| Europe | 37 | 0.1% |
| Germany | 10 | 0.0% |
| Guatemala | 126 | 0.4% |
| India | 41 | 0.1% |
| Iraq | 8 | 0.0% |
| Israel | 22 | 0.1% |
| Japan | 159 | 0.5% |
| Korea | 129 | 0.4% |
| Latin America | 835 | 2.5% |
| Mexico | 551 | 1.6% |
| Middle Africa | 22 | 0.1% |
| Nigeria | 55 | 0.2% |
| Northern Europe | 8 | 0.0% |
| Scotland | 8 | 0.0% |
| South America | 112 | 0.3% |
| South Central Asia | 66 | 0.2% |
| South Eastern Asia | 67 | 0.2% |
| Taiwan | 6 | 0.0% |
| Thailand | 19 | 0.1% |
| Turkey | 16 | 0.1% |
| Venezuela | 78 | 0.2% |
| Vietnam | 48 | 0.1% |
| Western Africa | 138 | 0.4% |
| Western Asia | 46 | 0.1% |
| Western Europe | 29 | 0.1% | View All 38 Rows |
Sex and Age in Kearney
Sex and Age in Kearney
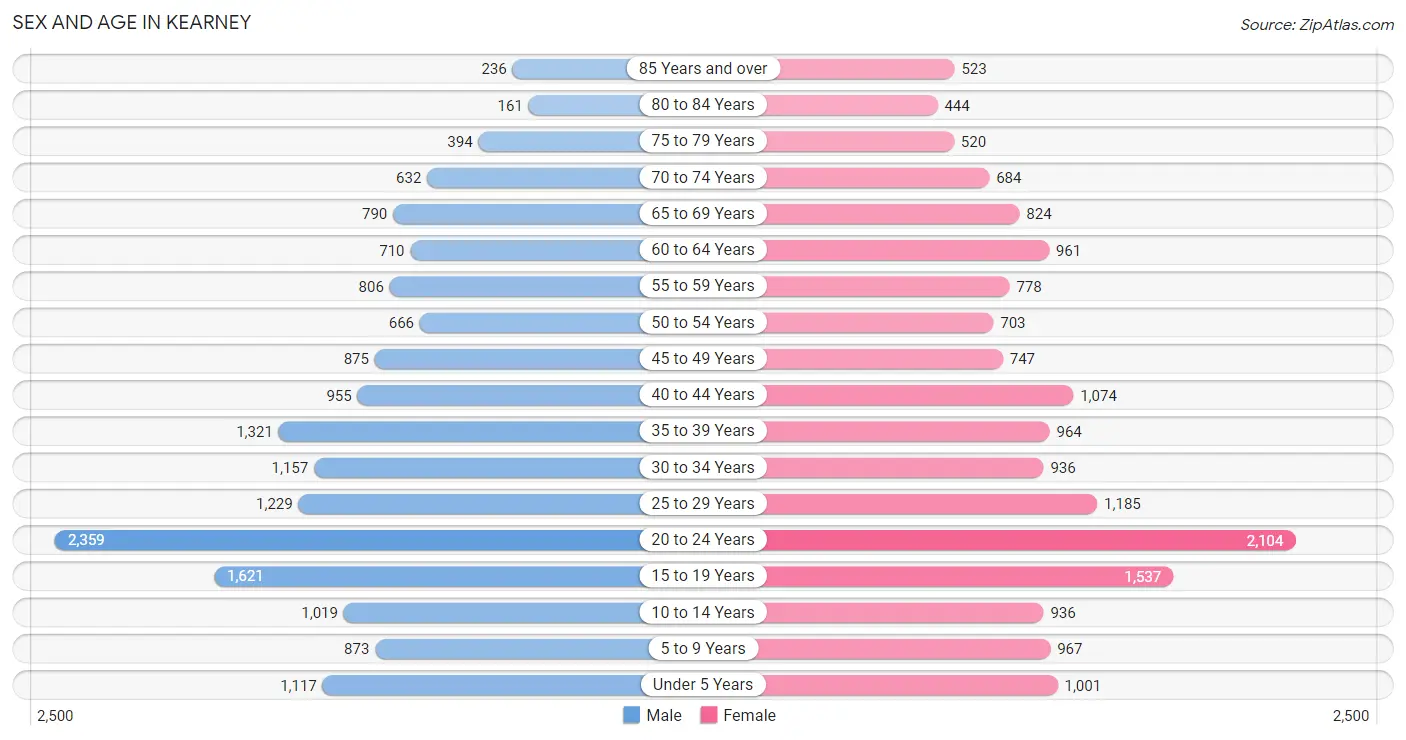
The most populous age groups in Kearney are 20 to 24 Years (2,359 | 13.9%) for men and 20 to 24 Years (2,104 | 12.5%) for women.
| Age Bracket | Male | Female |
| Under 5 Years | 1,117 (6.6%) | 1,001 (5.9%) |
| 5 to 9 Years | 873 (5.2%) | 967 (5.7%) |
| 10 to 14 Years | 1,019 (6.0%) | 936 (5.5%) |
| 15 to 19 Years | 1,621 (9.6%) | 1,537 (9.1%) |
| 20 to 24 Years | 2,359 (13.9%) | 2,104 (12.5%) |
| 25 to 29 Years | 1,229 (7.3%) | 1,185 (7.0%) |
| 30 to 34 Years | 1,157 (6.8%) | 936 (5.5%) |
| 35 to 39 Years | 1,321 (7.8%) | 964 (5.7%) |
| 40 to 44 Years | 955 (5.6%) | 1,074 (6.4%) |
| 45 to 49 Years | 875 (5.2%) | 747 (4.4%) |
| 50 to 54 Years | 666 (3.9%) | 703 (4.2%) |
| 55 to 59 Years | 806 (4.8%) | 778 (4.6%) |
| 60 to 64 Years | 710 (4.2%) | 961 (5.7%) |
| 65 to 69 Years | 790 (4.7%) | 824 (4.9%) |
| 70 to 74 Years | 632 (3.7%) | 684 (4.1%) |
| 75 to 79 Years | 394 (2.3%) | 520 (3.1%) |
| 80 to 84 Years | 161 (0.9%) | 444 (2.6%) |
| 85 Years and over | 236 (1.4%) | 523 (3.1%) |
| Total | 16,921 (100.0%) | 16,888 (100.0%) |
Families and Households in Kearney
Median Family Size in Kearney
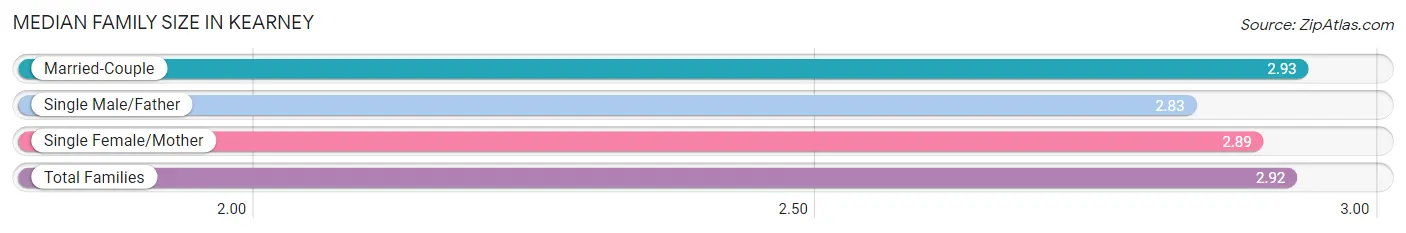
The median family size in Kearney is 2.92 persons per family, with married-couple families (5,660 | 73.5%) accounting for the largest median family size of 2.93 persons per family. On the other hand, single male/father families (520 | 6.8%) represent the smallest median family size with 2.83 persons per family.
| Family Type | # Families | Family Size |
| Married-Couple | 5,660 (73.5%) | 2.93 |
| Single Male/Father | 520 (6.8%) | 2.83 |
| Single Female/Mother | 1,526 (19.8%) | 2.89 |
| Total Families | 7,706 (100.0%) | 2.92 |
Median Household Size in Kearney
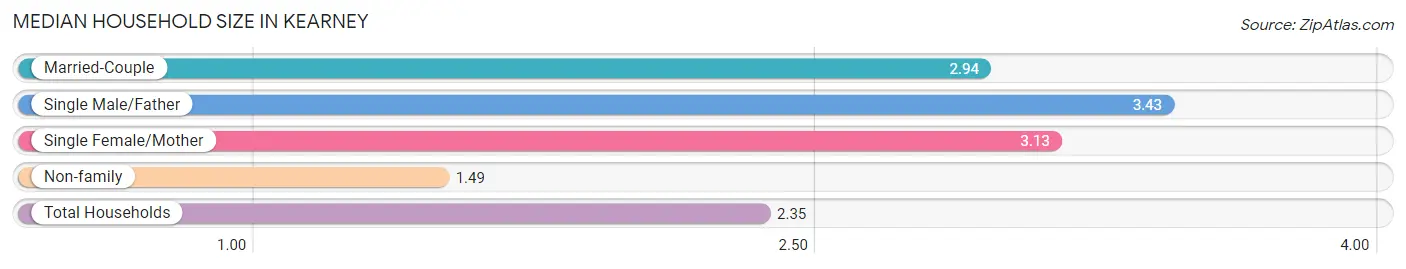
The median household size in Kearney is 2.35 persons per household, with single male/father households (520 | 3.8%) accounting for the largest median household size of 3.43 persons per household. non-family households (5,873 | 43.2%) represent the smallest median household size with 1.49 persons per household.
| Household Type | # Households | Household Size |
| Married-Couple | 5,660 (41.7%) | 2.94 |
| Single Male/Father | 520 (3.8%) | 3.43 |
| Single Female/Mother | 1,526 (11.2%) | 3.13 |
| Non-family | 5,873 (43.2%) | 1.49 |
| Total Households | 13,579 (100.0%) | 2.35 |
Household Size by Marriage Status in Kearney
Out of a total of 13,579 households in Kearney, 7,706 (56.8%) are family households, while 5,873 (43.2%) are nonfamily households. The most numerous type of family households are 2-person households, comprising 3,805, and the most common type of nonfamily households are 1-person households, comprising 4,316.
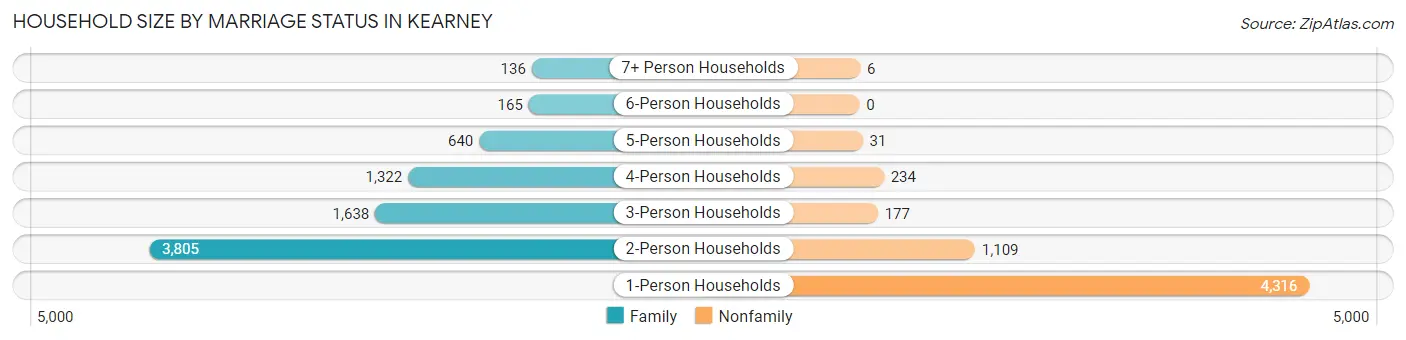
| Household Size | Family Households | Nonfamily Households |
| 1-Person Households | - | 4,316 (31.8%) |
| 2-Person Households | 3,805 (28.0%) | 1,109 (8.2%) |
| 3-Person Households | 1,638 (12.1%) | 177 (1.3%) |
| 4-Person Households | 1,322 (9.7%) | 234 (1.7%) |
| 5-Person Households | 640 (4.7%) | 31 (0.2%) |
| 6-Person Households | 165 (1.2%) | 0 (0.0%) |
| 7+ Person Households | 136 (1.0%) | 6 (0.0%) |
| Total | 7,706 (56.8%) | 5,873 (43.2%) |
Female Fertility in Kearney
Fertility by Age in Kearney
Average fertility rate in Kearney is 63.0 births per 1,000 women. Women in the age bracket of 20 to 34 years have the highest fertility rate with 84.0 births per 1,000 women. Women in the age bracket of 20 to 34 years acount for 64.5% of all women with births.
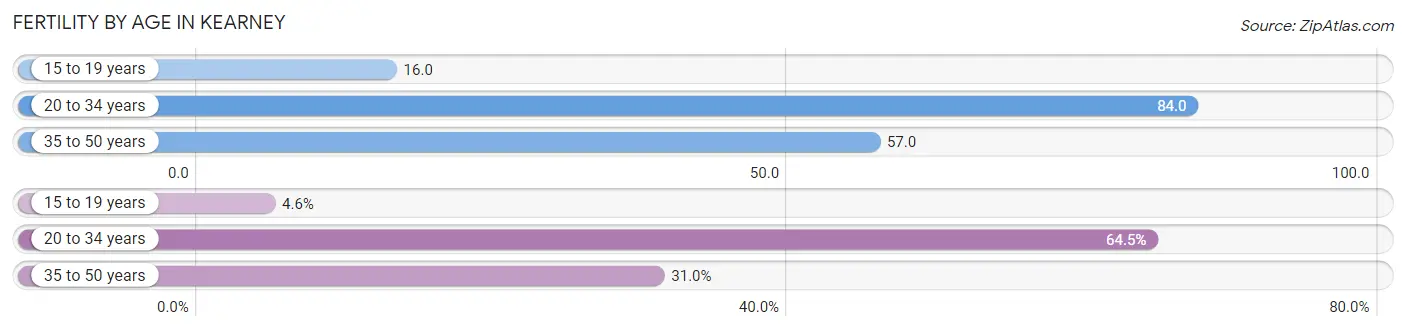
| Age Bracket | Women with Births | Births / 1,000 Women |
| 15 to 19 years | 25 (4.5%) | 16.0 |
| 20 to 34 years | 354 (64.5%) | 84.0 |
| 35 to 50 years | 170 (31.0%) | 57.0 |
| Total | 549 (100.0%) | 63.0 |
Fertility by Age by Marriage Status in Kearney
48.8% of women with births (549) in Kearney are married. The highest percentage of unmarried women with births falls into 15 to 19 years age bracket with 100.0% of them unmarried at the time of birth, while the lowest percentage of unmarried women with births belong to 20 to 34 years age bracket with 32.5% of them unmarried.
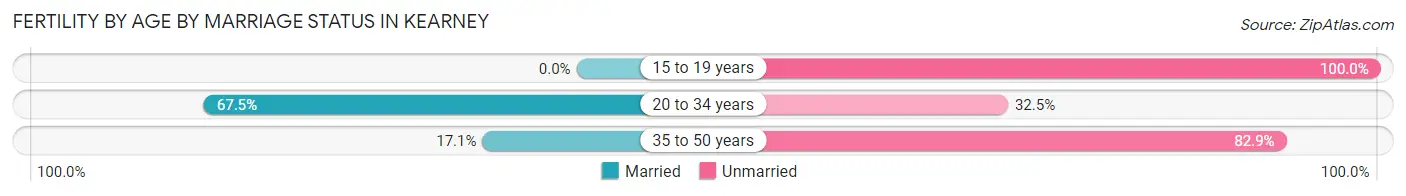
| Age Bracket | Married | Unmarried |
| 15 to 19 years | 0 (0.0%) | 25 (100.0%) |
| 20 to 34 years | 239 (67.5%) | 115 (32.5%) |
| 35 to 50 years | 29 (17.1%) | 141 (82.9%) |
| Total | 268 (48.8%) | 281 (51.2%) |
Fertility by Education in Kearney
Average fertility rate in Kearney is 63.0 births per 1,000 women. Women with the education attainment of graduate degree have the highest fertility rate of 208.0 births per 1,000 women, while women with the education attainment of high school diploma have the lowest fertility at 11.0 births per 1,000 women. Women with the education attainment of graduate degree represent 37.9% of all women with births.
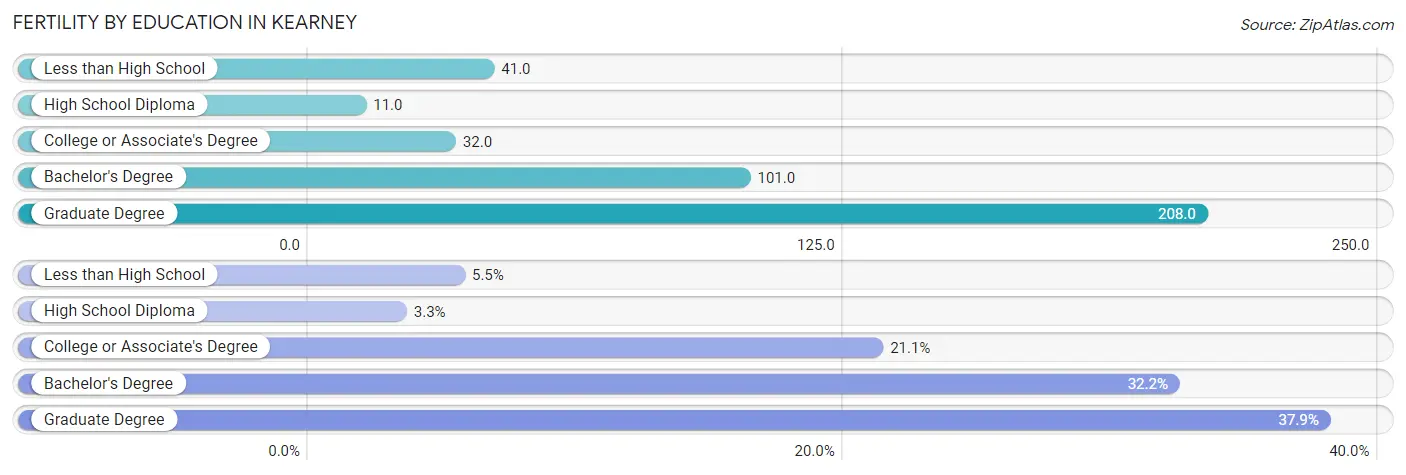
| Educational Attainment | Women with Births | Births / 1,000 Women |
| Less than High School | 30 (5.5%) | 41.0 |
| High School Diploma | 18 (3.3%) | 11.0 |
| College or Associate's Degree | 116 (21.1%) | 32.0 |
| Bachelor's Degree | 177 (32.2%) | 101.0 |
| Graduate Degree | 208 (37.9%) | 208.0 |
| Total | 549 (100.0%) | 63.0 |
Fertility by Education by Marriage Status in Kearney
51.2% of women with births in Kearney are unmarried. Women with the educational attainment of bachelor's degree are most likely to be married with 76.8% of them married at childbirth, while women with the educational attainment of less than high school are least likely to be married with 100.0% of them unmarried at childbirth.
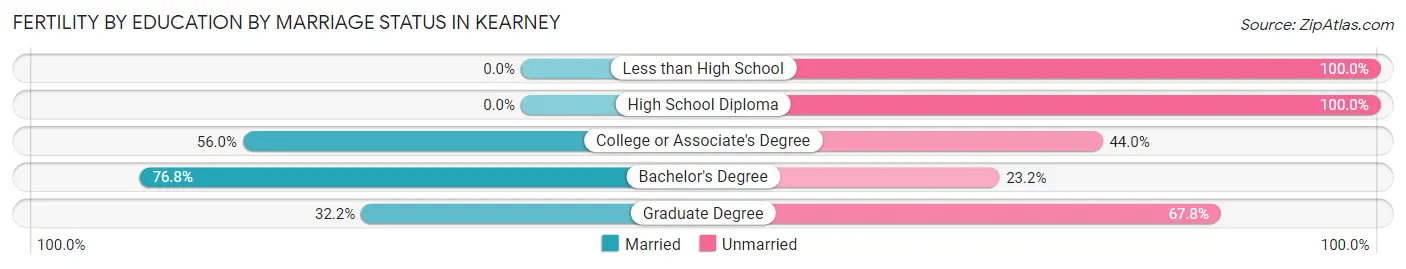
| Educational Attainment | Married | Unmarried |
| Less than High School | 0 (0.0%) | 30 (100.0%) |
| High School Diploma | 0 (0.0%) | 18 (100.0%) |
| College or Associate's Degree | 65 (56.0%) | 51 (44.0%) |
| Bachelor's Degree | 136 (76.8%) | 41 (23.2%) |
| Graduate Degree | 67 (32.2%) | 141 (67.8%) |
| Total | 268 (48.8%) | 281 (51.2%) |
Employment Characteristics in Kearney
Employment by Class of Employer in Kearney
Among the 18,784 employed individuals in Kearney, private company employees (12,704 | 67.6%), not-for-profit organizations (1,877 | 10.0%), and local government employees (1,262 | 6.7%) make up the most common classes of employment.
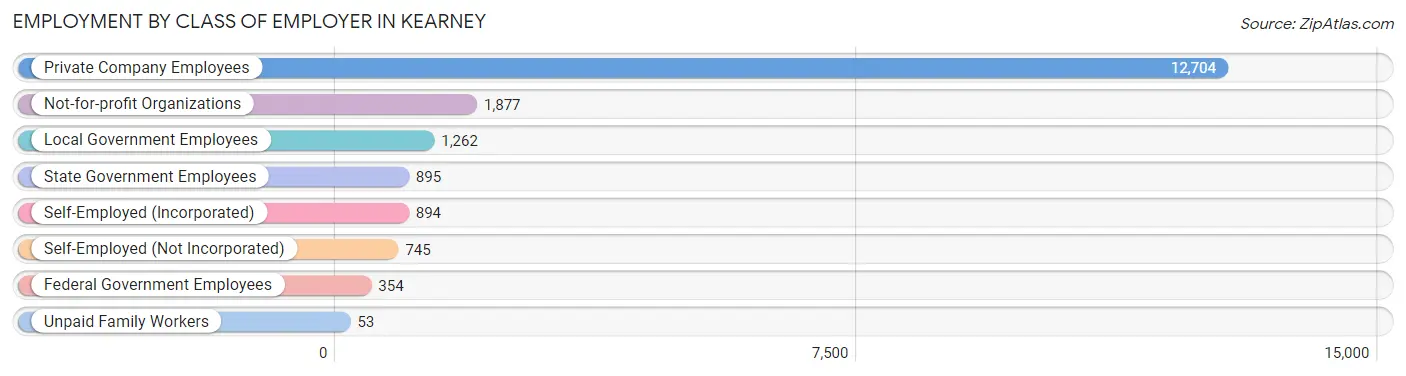
| Employer Class | # Employees | % Employees |
| Private Company Employees | 12,704 | 67.6% |
| Self-Employed (Incorporated) | 894 | 4.8% |
| Self-Employed (Not Incorporated) | 745 | 4.0% |
| Not-for-profit Organizations | 1,877 | 10.0% |
| Local Government Employees | 1,262 | 6.7% |
| State Government Employees | 895 | 4.8% |
| Federal Government Employees | 354 | 1.9% |
| Unpaid Family Workers | 53 | 0.3% |
| Total | 18,784 | 100.0% |
Employment Status by Age in Kearney
According to the labor force statistics for Kearney, out of the total population over 16 years of age (27,551), 71.2% or 19,616 individuals are in the labor force, with 2.9% or 569 of them unemployed. The age group with the highest labor force participation rate is 30 to 34 years, with 93.1% or 1,949 individuals in the labor force. Within the labor force, the 16 to 19 years age range has the highest percentage of unemployed individuals, with 12.2% or 206 of them being unemployed.
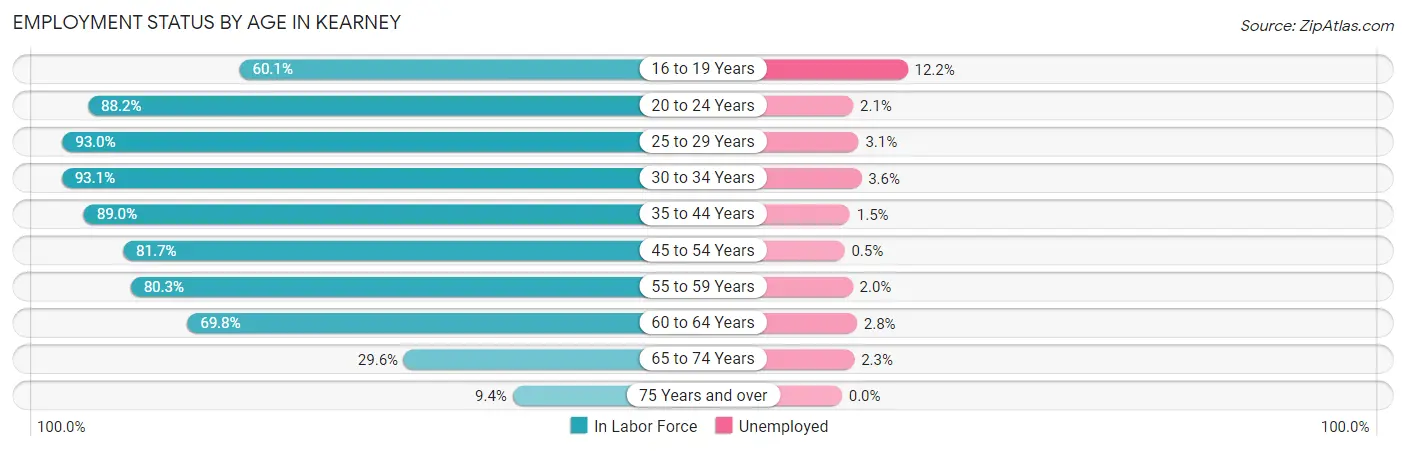
| Age Bracket | In Labor Force | Unemployed |
| 16 to 19 Years | 1,691 (60.1%) | 206 (12.2%) |
| 20 to 24 Years | 3,936 (88.2%) | 83 (2.1%) |
| 25 to 29 Years | 2,245 (93.0%) | 70 (3.1%) |
| 30 to 34 Years | 1,949 (93.1%) | 70 (3.6%) |
| 35 to 44 Years | 3,839 (89.0%) | 58 (1.5%) |
| 45 to 54 Years | 2,444 (81.7%) | 12 (0.5%) |
| 55 to 59 Years | 1,272 (80.3%) | 25 (2.0%) |
| 60 to 64 Years | 1,166 (69.8%) | 33 (2.8%) |
| 65 to 74 Years | 867 (29.6%) | 20 (2.3%) |
| 75 Years and over | 214 (9.4%) | 0 (0.0%) |
| Total | 19,616 (71.2%) | 569 (2.9%) |
Employment Status by Educational Attainment in Kearney
According to labor force statistics for Kearney, 85.7% of individuals (12,912) out of the total population between 25 and 64 years of age (15,067) are in the labor force, with 2.1% or 271 of them being unemployed. The group with the highest labor force participation rate are those with the educational attainment of bachelor's degree or higher, with 93.0% or 5,592 individuals in the labor force. Within the labor force, individuals with high school diploma education have the highest percentage of unemployment, with 5.0% or 133 of them being unemployed.
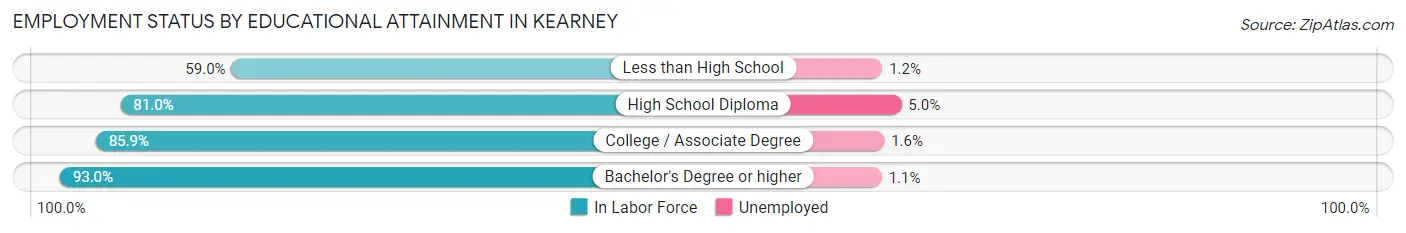
| Educational Attainment | In Labor Force | Unemployed |
| Less than High School | 648 (59.0%) | 13 (1.2%) |
| High School Diploma | 2,662 (81.0%) | 164 (5.0%) |
| College / Associate Degree | 4,011 (85.9%) | 75 (1.6%) |
| Bachelor's Degree or higher | 5,592 (93.0%) | 66 (1.1%) |
| Total | 12,912 (85.7%) | 316 (2.1%) |
Employment Occupations by Sex in Kearney
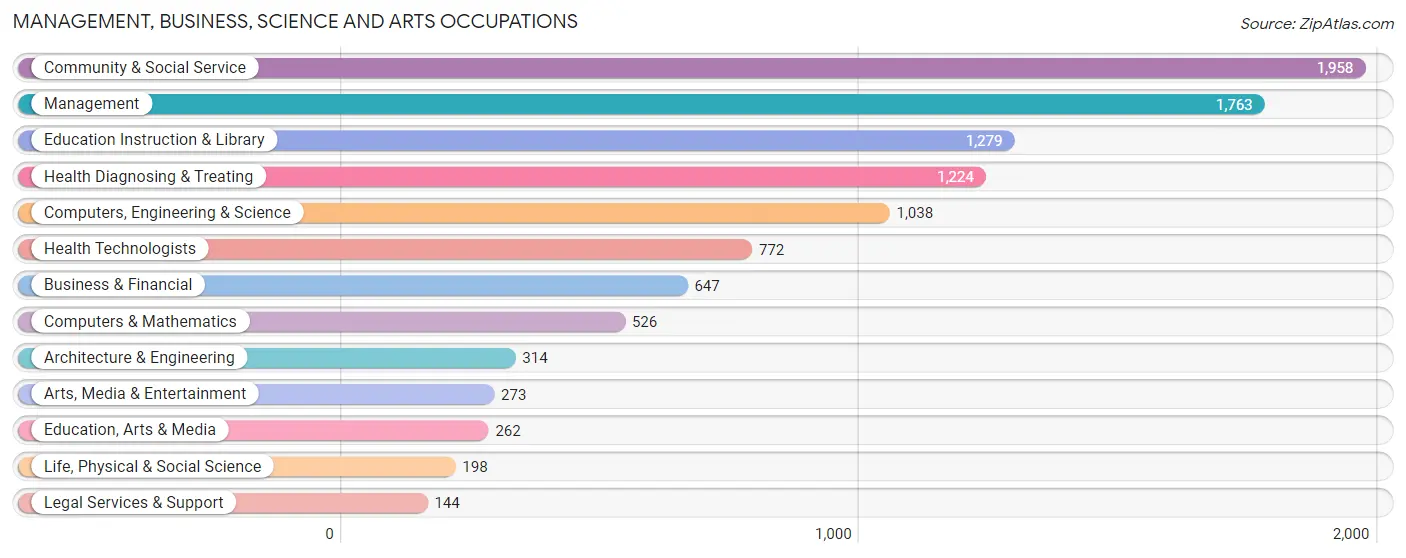
Management, Business, Science and Arts Occupations
The most common Management, Business, Science and Arts occupations in Kearney are Community & Social Service (1,958 | 10.3%), Management (1,763 | 9.3%), Education Instruction & Library (1,279 | 6.7%), Health Diagnosing & Treating (1,224 | 6.5%), and Computers, Engineering & Science (1,038 | 5.5%).
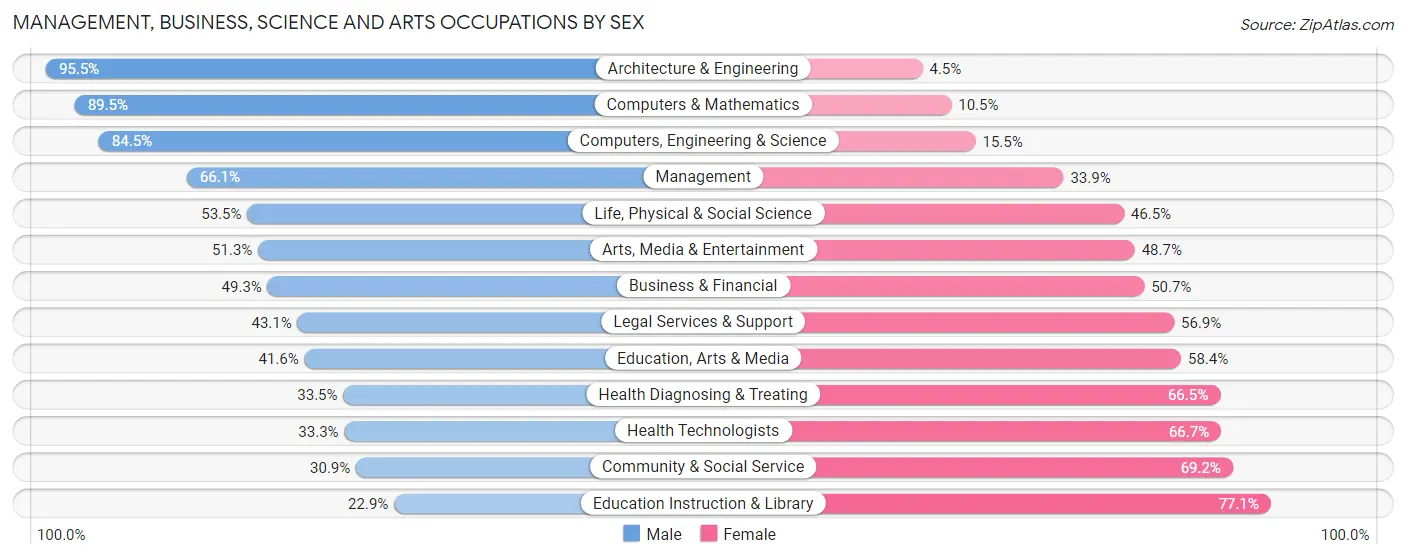
Management, Business, Science and Arts Occupations by Sex
Within the Management, Business, Science and Arts occupations in Kearney, the most male-oriented occupations are Architecture & Engineering (95.5%), Computers & Mathematics (89.5%), and Computers, Engineering & Science (84.5%), while the most female-oriented occupations are Education Instruction & Library (77.1%), Community & Social Service (69.2%), and Health Technologists (66.7%).
| Occupation | Male | Female |
| Management | 1,166 (66.1%) | 597 (33.9%) |
| Business & Financial | 319 (49.3%) | 328 (50.7%) |
| Computers, Engineering & Science | 877 (84.5%) | 161 (15.5%) |
| Computers & Mathematics | 471 (89.5%) | 55 (10.5%) |
| Architecture & Engineering | 300 (95.5%) | 14 (4.5%) |
| Life, Physical & Social Science | 106 (53.5%) | 92 (46.5%) |
| Community & Social Service | 604 (30.8%) | 1,354 (69.2%) |
| Education, Arts & Media | 109 (41.6%) | 153 (58.4%) |
| Legal Services & Support | 62 (43.1%) | 82 (56.9%) |
| Education Instruction & Library | 293 (22.9%) | 986 (77.1%) |
| Arts, Media & Entertainment | 140 (51.3%) | 133 (48.7%) |
| Health Diagnosing & Treating | 410 (33.5%) | 814 (66.5%) |
| Health Technologists | 257 (33.3%) | 515 (66.7%) |
| Total (Category) | 3,376 (50.9%) | 3,254 (49.1%) |
| Total (Overall) | 10,038 (52.9%) | 8,928 (47.1%) |
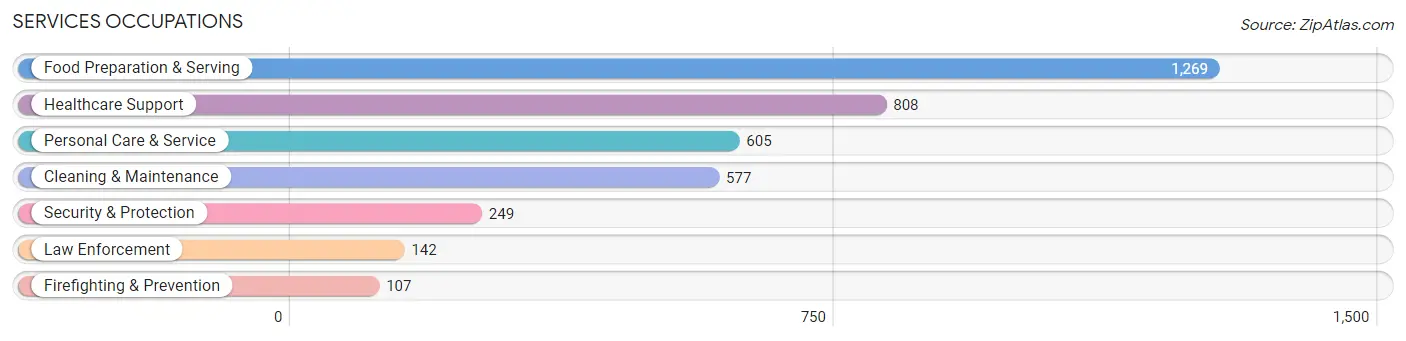
Services Occupations
The most common Services occupations in Kearney are Food Preparation & Serving (1,269 | 6.7%), Healthcare Support (808 | 4.3%), Personal Care & Service (605 | 3.2%), Cleaning & Maintenance (577 | 3.0%), and Security & Protection (249 | 1.3%).
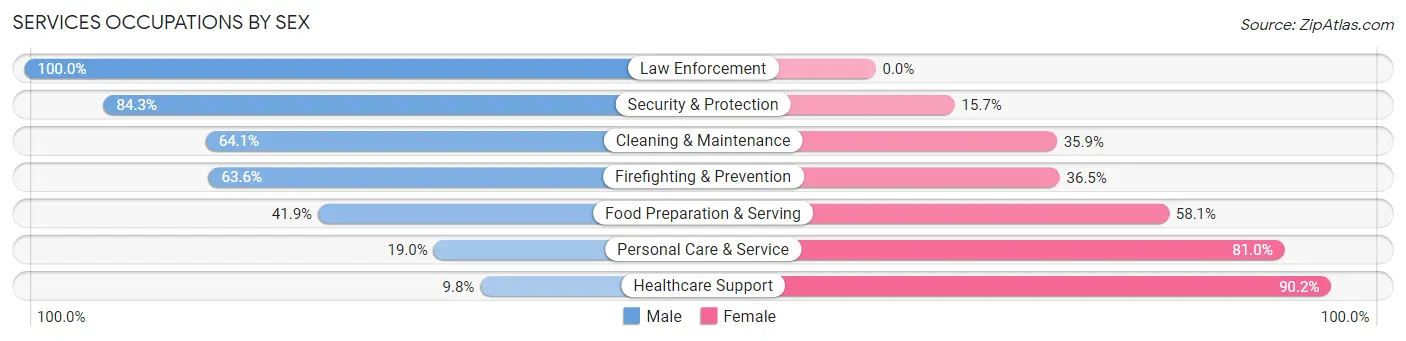
Services Occupations by Sex
Within the Services occupations in Kearney, the most male-oriented occupations are Law Enforcement (100.0%), Security & Protection (84.3%), and Cleaning & Maintenance (64.1%), while the most female-oriented occupations are Healthcare Support (90.2%), Personal Care & Service (81.0%), and Food Preparation & Serving (58.1%).
| Occupation | Male | Female |
| Healthcare Support | 79 (9.8%) | 729 (90.2%) |
| Security & Protection | 210 (84.3%) | 39 (15.7%) |
| Firefighting & Prevention | 68 (63.5%) | 39 (36.4%) |
| Law Enforcement | 142 (100.0%) | 0 (0.0%) |
| Food Preparation & Serving | 532 (41.9%) | 737 (58.1%) |
| Cleaning & Maintenance | 370 (64.1%) | 207 (35.9%) |
| Personal Care & Service | 115 (19.0%) | 490 (81.0%) |
| Total (Category) | 1,306 (37.2%) | 2,202 (62.8%) |
| Total (Overall) | 10,038 (52.9%) | 8,928 (47.1%) |
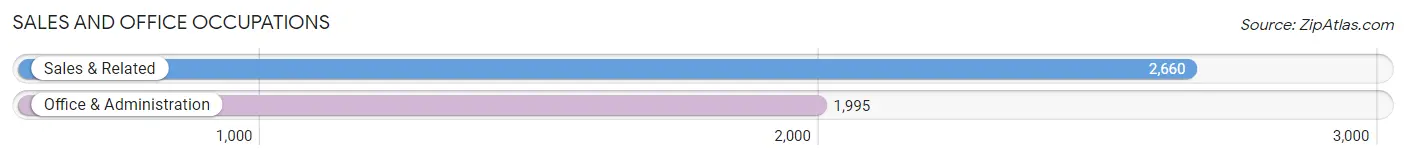
Sales and Office Occupations
The most common Sales and Office occupations in Kearney are Sales & Related (2,660 | 14.0%), and Office & Administration (1,995 | 10.5%).
Sales and Office Occupations by Sex
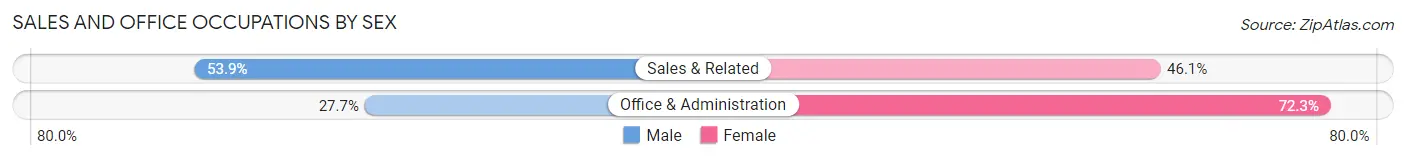
| Occupation | Male | Female |
| Sales & Related | 1,434 (53.9%) | 1,226 (46.1%) |
| Office & Administration | 552 (27.7%) | 1,443 (72.3%) |
| Total (Category) | 1,986 (42.7%) | 2,669 (57.3%) |
| Total (Overall) | 10,038 (52.9%) | 8,928 (47.1%) |
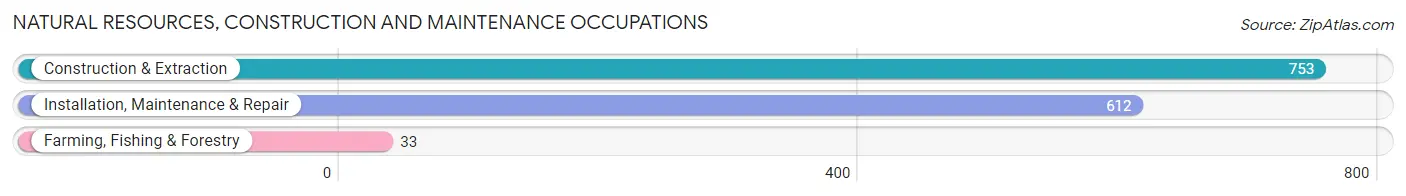
Natural Resources, Construction and Maintenance Occupations
The most common Natural Resources, Construction and Maintenance occupations in Kearney are Construction & Extraction (753 | 4.0%), Installation, Maintenance & Repair (612 | 3.2%), and Farming, Fishing & Forestry (33 | 0.2%).
Natural Resources, Construction and Maintenance Occupations by Sex
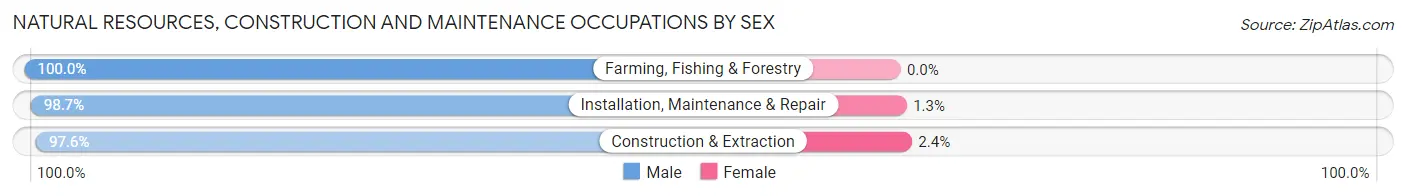
| Occupation | Male | Female |
| Farming, Fishing & Forestry | 33 (100.0%) | 0 (0.0%) |
| Construction & Extraction | 735 (97.6%) | 18 (2.4%) |
| Installation, Maintenance & Repair | 604 (98.7%) | 8 (1.3%) |
| Total (Category) | 1,372 (98.1%) | 26 (1.9%) |
| Total (Overall) | 10,038 (52.9%) | 8,928 (47.1%) |
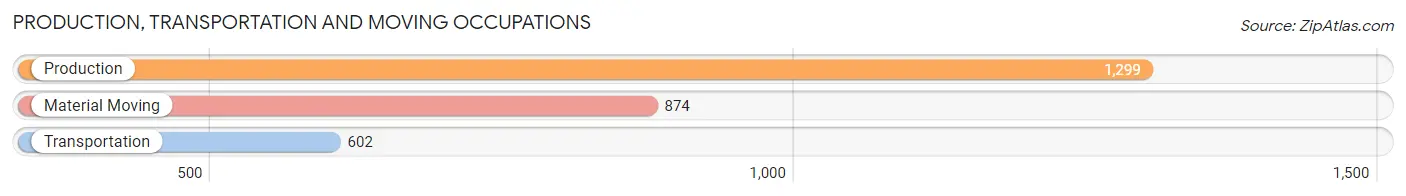
Production, Transportation and Moving Occupations
The most common Production, Transportation and Moving occupations in Kearney are Production (1,299 | 6.9%), Material Moving (874 | 4.6%), and Transportation (602 | 3.2%).
Production, Transportation and Moving Occupations by Sex
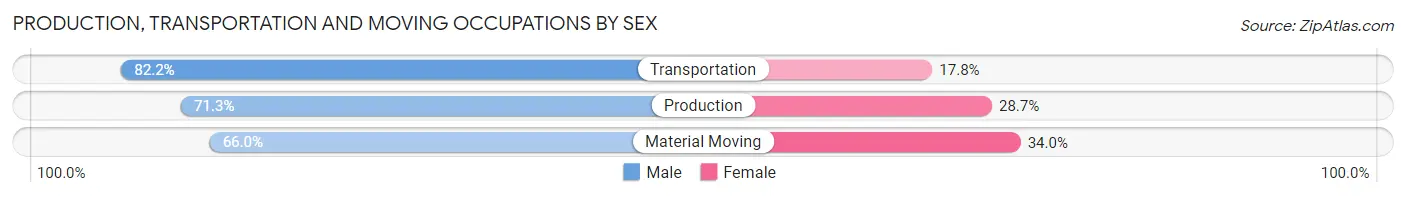
| Occupation | Male | Female |
| Production | 926 (71.3%) | 373 (28.7%) |
| Transportation | 495 (82.2%) | 107 (17.8%) |
| Material Moving | 577 (66.0%) | 297 (34.0%) |
| Total (Category) | 1,998 (72.0%) | 777 (28.0%) |
| Total (Overall) | 10,038 (52.9%) | 8,928 (47.1%) |
Employment Industries by Sex in Kearney
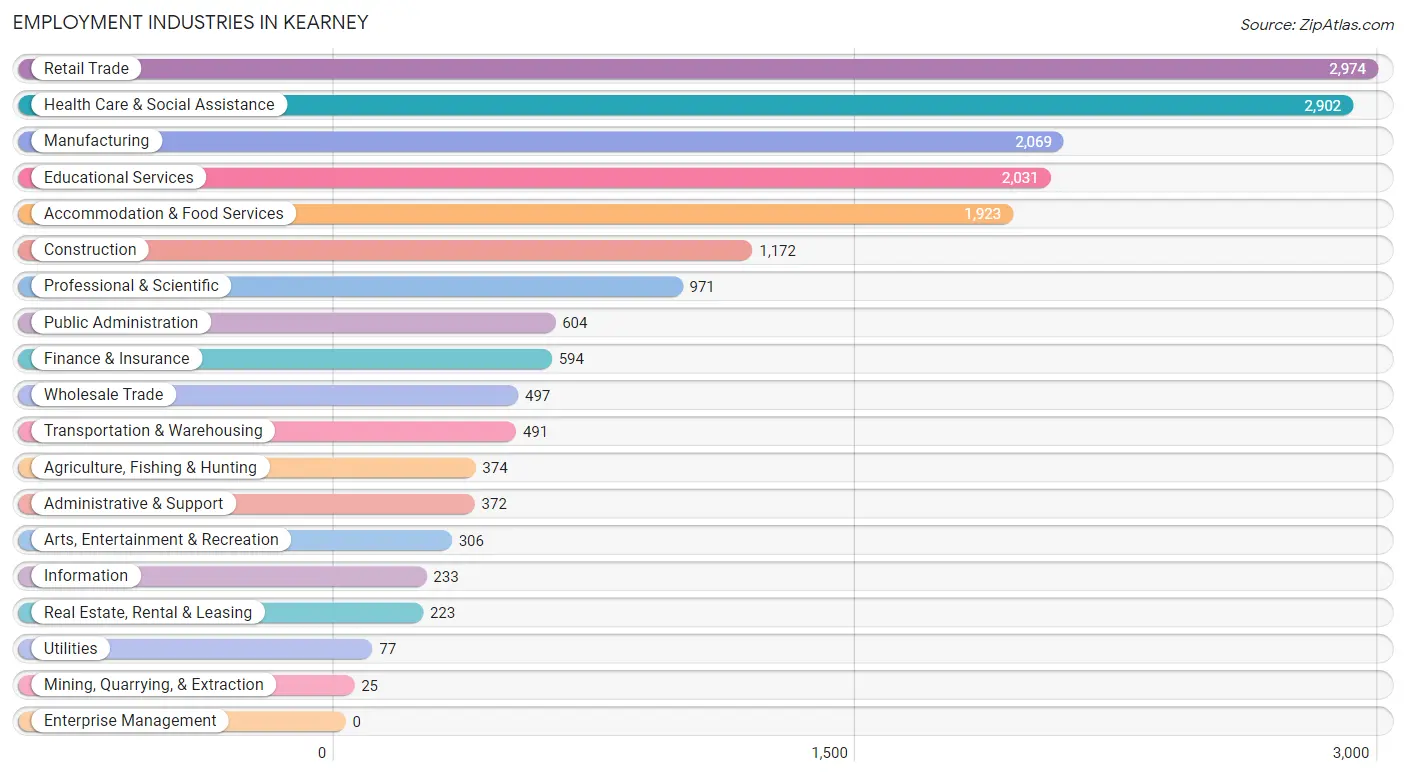
Employment Industries in Kearney
The major employment industries in Kearney include Retail Trade (2,974 | 15.7%), Health Care & Social Assistance (2,902 | 15.3%), Manufacturing (2,069 | 10.9%), Educational Services (2,031 | 10.7%), and Accommodation & Food Services (1,923 | 10.1%).
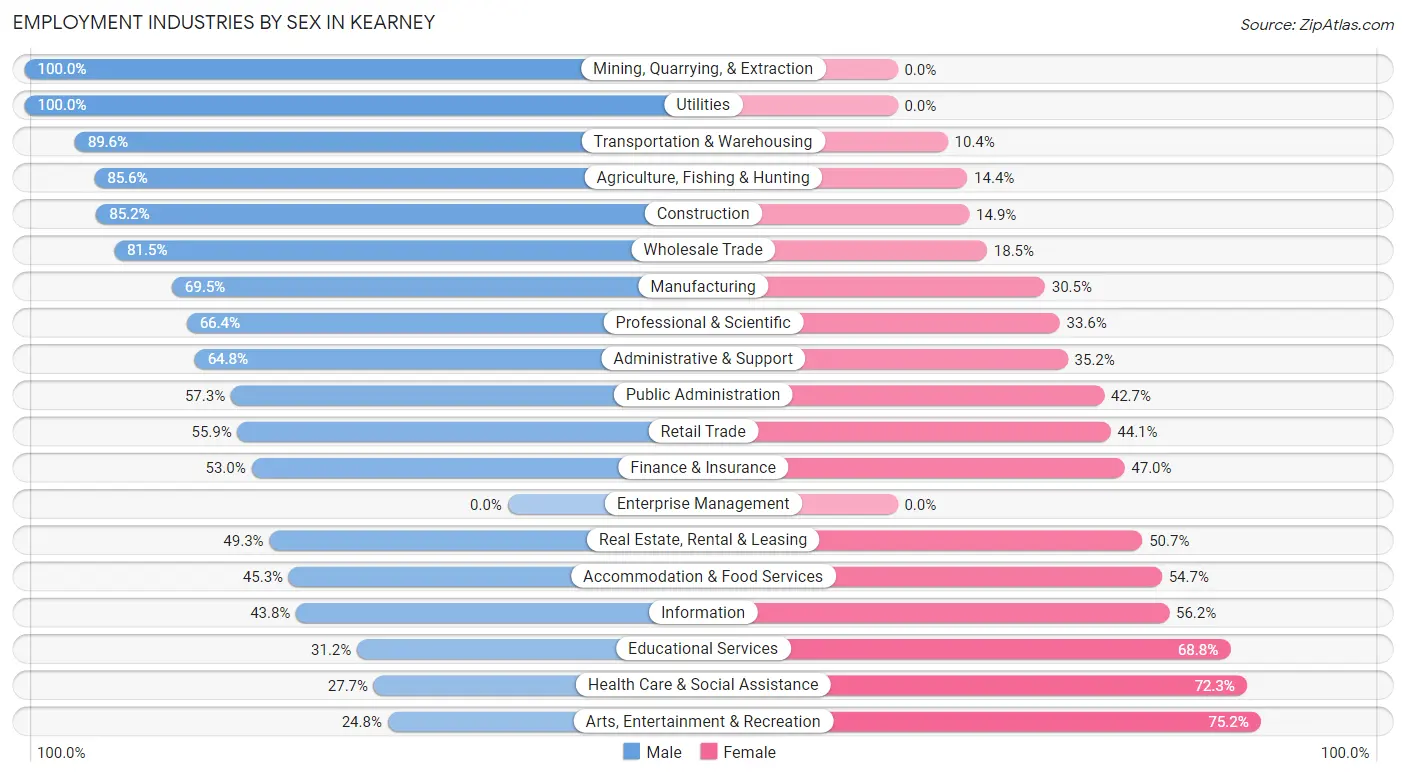
Employment Industries by Sex in Kearney
The Kearney industries that see more men than women are Mining, Quarrying, & Extraction (100.0%), Utilities (100.0%), and Transportation & Warehousing (89.6%), whereas the industries that tend to have a higher number of women are Arts, Entertainment & Recreation (75.2%), Health Care & Social Assistance (72.3%), and Educational Services (68.8%).
| Industry | Male | Female |
| Agriculture, Fishing & Hunting | 320 (85.6%) | 54 (14.4%) |
| Mining, Quarrying, & Extraction | 25 (100.0%) | 0 (0.0%) |
| Construction | 998 (85.2%) | 174 (14.8%) |
| Manufacturing | 1,438 (69.5%) | 631 (30.5%) |
| Wholesale Trade | 405 (81.5%) | 92 (18.5%) |
| Retail Trade | 1,663 (55.9%) | 1,311 (44.1%) |
| Transportation & Warehousing | 440 (89.6%) | 51 (10.4%) |
| Utilities | 77 (100.0%) | 0 (0.0%) |
| Information | 102 (43.8%) | 131 (56.2%) |
| Finance & Insurance | 315 (53.0%) | 279 (47.0%) |
| Real Estate, Rental & Leasing | 110 (49.3%) | 113 (50.7%) |
| Professional & Scientific | 645 (66.4%) | 326 (33.6%) |
| Enterprise Management | 0 (0.0%) | 0 (0.0%) |
| Administrative & Support | 241 (64.8%) | 131 (35.2%) |
| Educational Services | 633 (31.2%) | 1,398 (68.8%) |
| Health Care & Social Assistance | 804 (27.7%) | 2,098 (72.3%) |
| Arts, Entertainment & Recreation | 76 (24.8%) | 230 (75.2%) |
| Accommodation & Food Services | 871 (45.3%) | 1,052 (54.7%) |
| Public Administration | 346 (57.3%) | 258 (42.7%) |
| Total | 10,038 (52.9%) | 8,928 (47.1%) |
Education in Kearney
School Enrollment in Kearney
The most common levels of schooling among the 10,192 students in Kearney are college / undergraduate (4,403 | 43.2%), middle school (1,680 | 16.5%), and high school (1,442 | 14.1%).
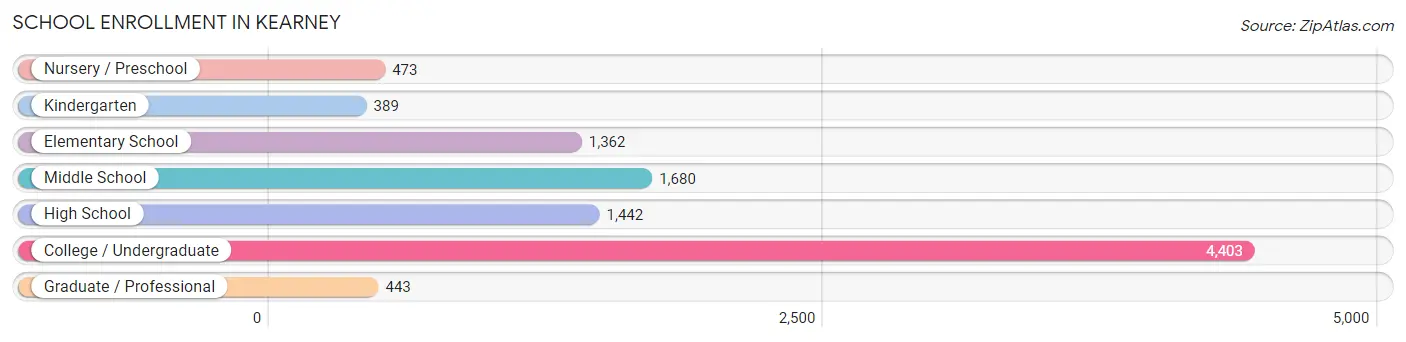
| School Level | # Students | % Students |
| Nursery / Preschool | 473 | 4.6% |
| Kindergarten | 389 | 3.8% |
| Elementary School | 1,362 | 13.4% |
| Middle School | 1,680 | 16.5% |
| High School | 1,442 | 14.1% |
| College / Undergraduate | 4,403 | 43.2% |
| Graduate / Professional | 443 | 4.3% |
| Total | 10,192 | 100.0% |
School Enrollment by Age by Funding Source in Kearney
Out of a total of 10,192 students who are enrolled in schools in Kearney, 927 (9.1%) attend a private institution, while the remaining 9,265 (90.9%) are enrolled in public schools. The age group of 3 to 4 year olds has the highest likelihood of being enrolled in private schools, with 107 (32.1% in the age bracket) enrolled. Conversely, the age group of 18 to 19 year olds has the lowest likelihood of being enrolled in a private school, with 1,629 (98.7% in the age bracket) attending a public institution.
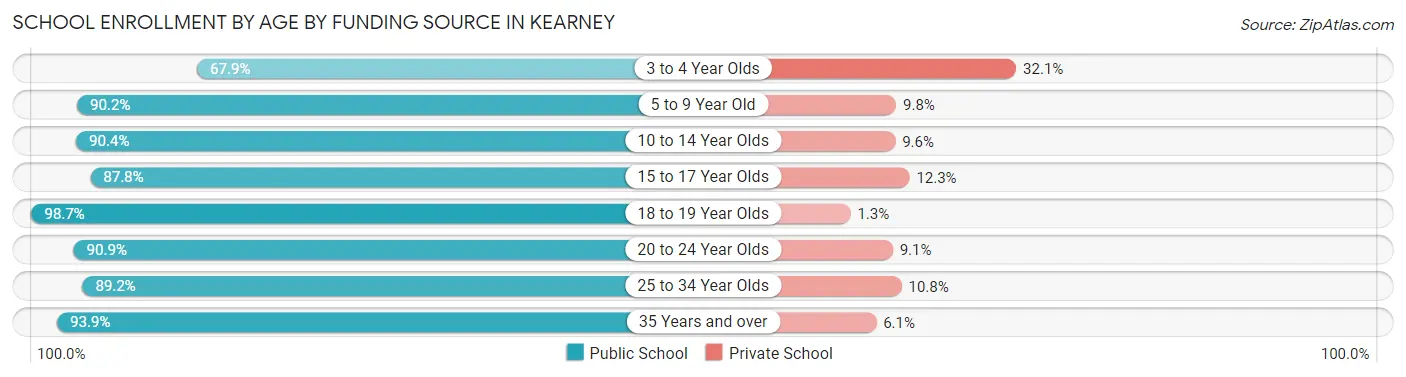
| Age Bracket | Public School | Private School |
| 3 to 4 Year Olds | 226 (67.9%) | 107 (32.1%) |
| 5 to 9 Year Old | 1,551 (90.2%) | 168 (9.8%) |
| 10 to 14 Year Olds | 1,732 (90.4%) | 184 (9.6%) |
| 15 to 17 Year Olds | 981 (87.7%) | 137 (12.2%) |
| 18 to 19 Year Olds | 1,629 (98.7%) | 21 (1.3%) |
| 20 to 24 Year Olds | 2,407 (90.9%) | 242 (9.1%) |
| 25 to 34 Year Olds | 455 (89.2%) | 55 (10.8%) |
| 35 Years and over | 279 (93.9%) | 18 (6.1%) |
| Total | 9,265 (90.9%) | 927 (9.1%) |
Educational Attainment by Field of Study in Kearney
Education (1,871 | 21.9%), business (1,670 | 19.5%), science & technology (872 | 10.2%), bio, nature & agricultural (654 | 7.6%), and arts & humanities (617 | 7.2%) are the most common fields of study among 8,545 individuals in Kearney who have obtained a bachelor's degree or higher.
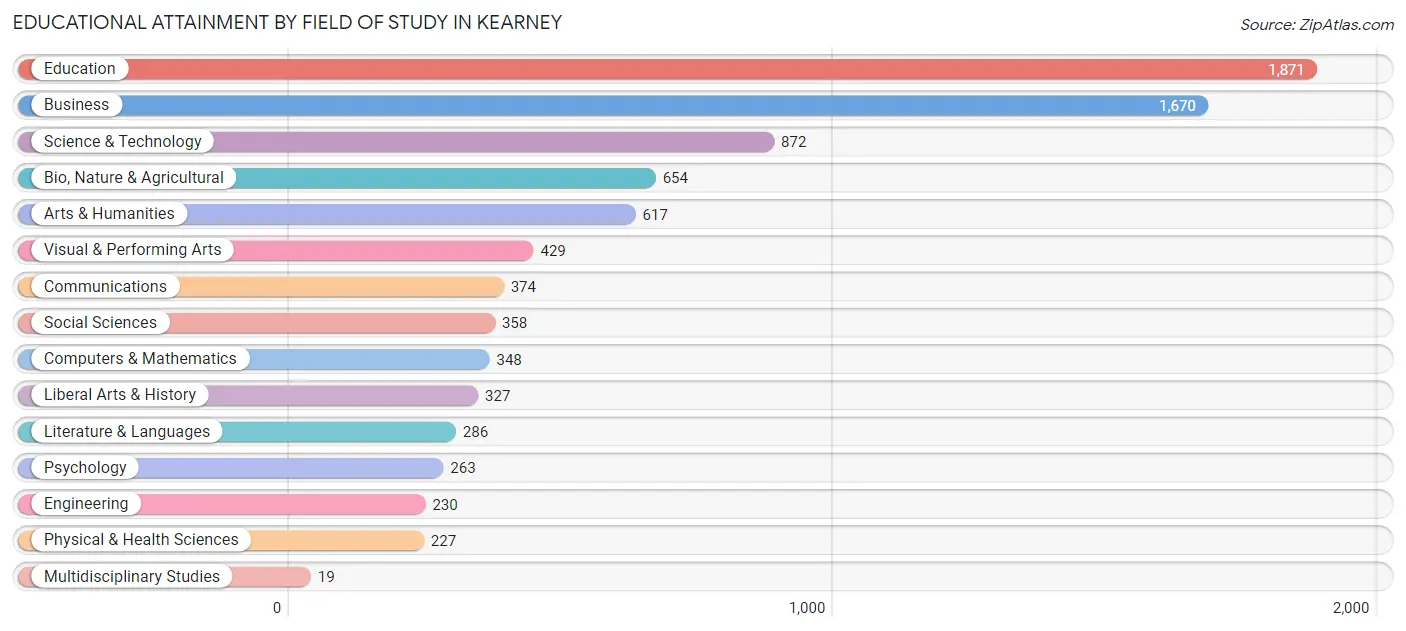
| Field of Study | # Graduates | % Graduates |
| Computers & Mathematics | 348 | 4.1% |
| Bio, Nature & Agricultural | 654 | 7.6% |
| Physical & Health Sciences | 227 | 2.7% |
| Psychology | 263 | 3.1% |
| Social Sciences | 358 | 4.2% |
| Engineering | 230 | 2.7% |
| Multidisciplinary Studies | 19 | 0.2% |
| Science & Technology | 872 | 10.2% |
| Business | 1,670 | 19.5% |
| Education | 1,871 | 21.9% |
| Literature & Languages | 286 | 3.4% |
| Liberal Arts & History | 327 | 3.8% |
| Visual & Performing Arts | 429 | 5.0% |
| Communications | 374 | 4.4% |
| Arts & Humanities | 617 | 7.2% |
| Total | 8,545 | 100.0% |
Transportation & Commute in Kearney
Vehicle Availability by Sex in Kearney
The most prevalent vehicle ownership categories in Kearney are males with 2 vehicles (4,160, accounting for 42.2%) and females with 2 vehicles (3,560, making up 50.7%).
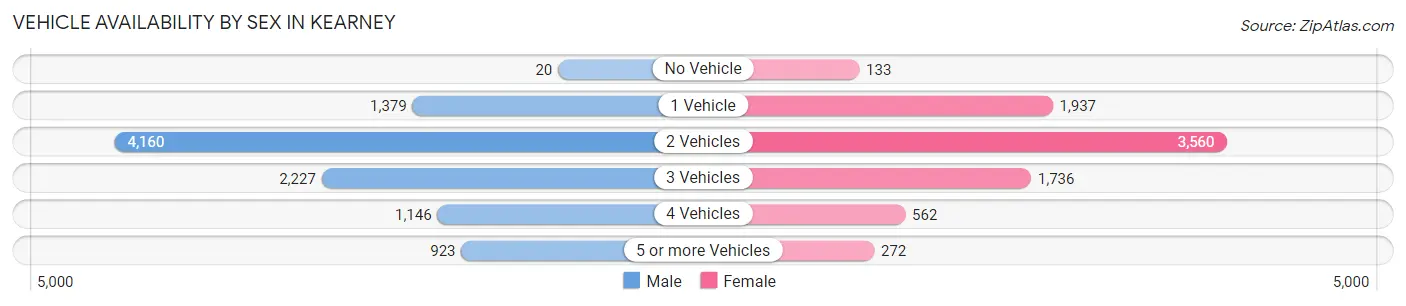
| Vehicles Available | Male | Female |
| No Vehicle | 20 (0.2%) | 133 (1.6%) |
| 1 Vehicle | 1,379 (14.0%) | 1,937 (23.6%) |
| 2 Vehicles | 4,160 (42.2%) | 3,560 (43.4%) |
| 3 Vehicles | 2,227 (22.6%) | 1,736 (21.2%) |
| 4 Vehicles | 1,146 (11.6%) | 562 (6.9%) |
| 5 or more Vehicles | 923 (9.4%) | 272 (3.3%) |
| Total | 9,855 (100.0%) | 8,200 (100.0%) |
Commute Time in Kearney
The most frequently occuring commute durations in Kearney are 10 to 14 minutes (6,653 commuters, 37.0%), 5 to 9 minutes (5,482 commuters, 30.5%), and 15 to 19 minutes (1,891 commuters, 10.5%).
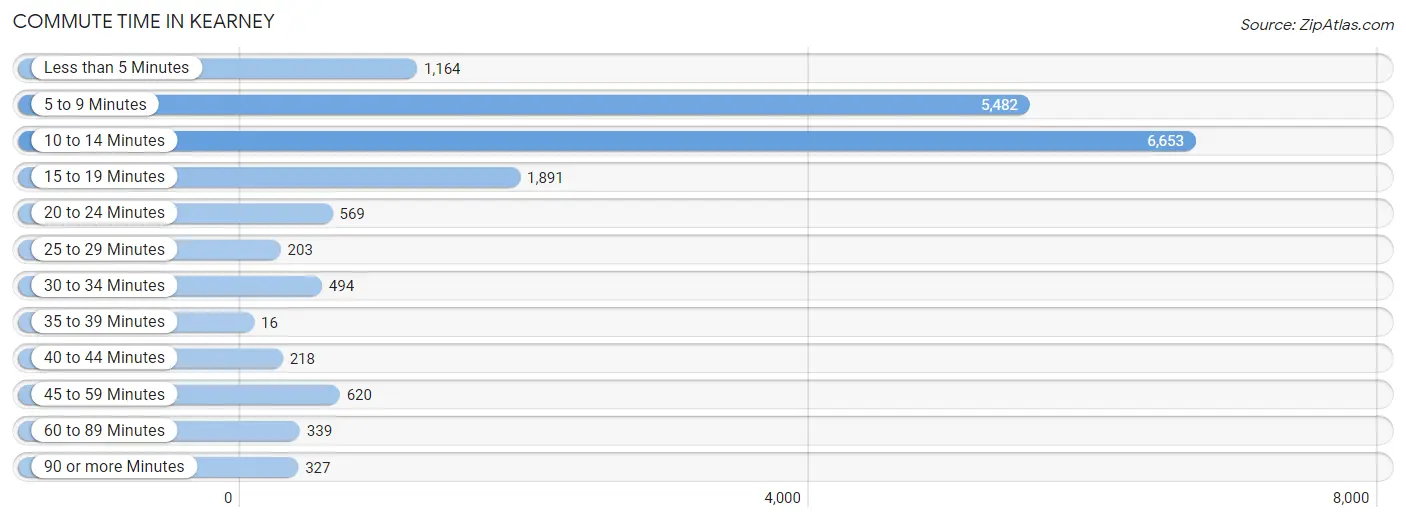
| Commute Time | # Commuters | % Commuters |
| Less than 5 Minutes | 1,164 | 6.5% |
| 5 to 9 Minutes | 5,482 | 30.5% |
| 10 to 14 Minutes | 6,653 | 37.0% |
| 15 to 19 Minutes | 1,891 | 10.5% |
| 20 to 24 Minutes | 569 | 3.2% |
| 25 to 29 Minutes | 203 | 1.1% |
| 30 to 34 Minutes | 494 | 2.8% |
| 35 to 39 Minutes | 16 | 0.1% |
| 40 to 44 Minutes | 218 | 1.2% |
| 45 to 59 Minutes | 620 | 3.5% |
| 60 to 89 Minutes | 339 | 1.9% |
| 90 or more Minutes | 327 | 1.8% |
Commute Time by Sex in Kearney
The most common commute times in Kearney are 10 to 14 minutes (3,421 commuters, 35.4%) for males and 10 to 14 minutes (3,232 commuters, 38.9%) for females.
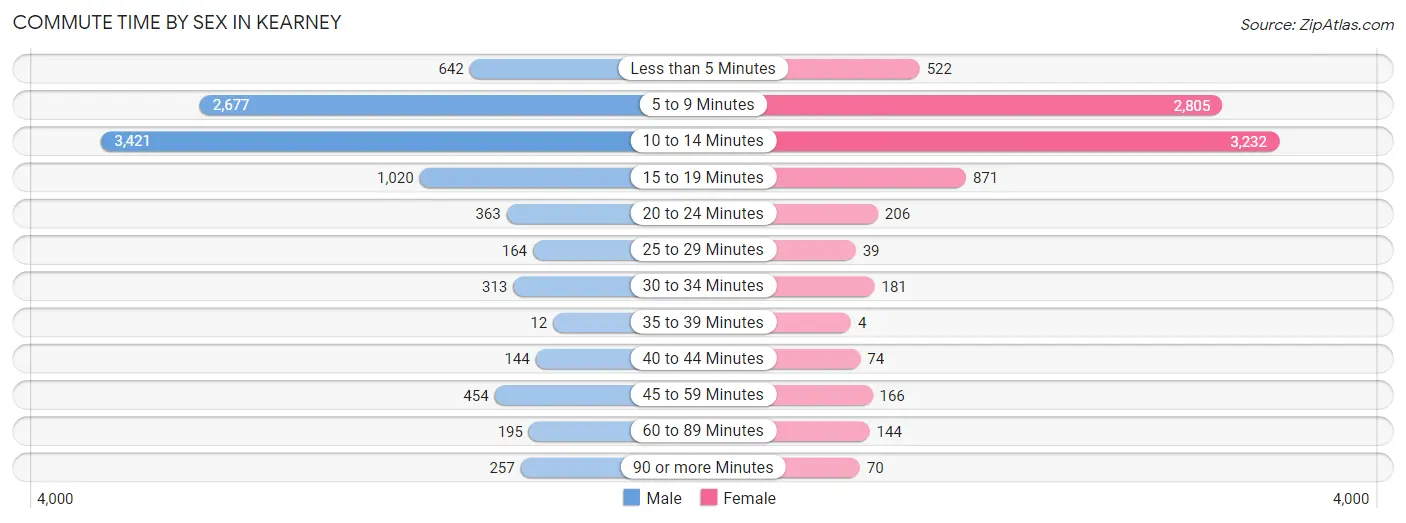
| Commute Time | Male | Female |
| Less than 5 Minutes | 642 (6.6%) | 522 (6.3%) |
| 5 to 9 Minutes | 2,677 (27.7%) | 2,805 (33.7%) |
| 10 to 14 Minutes | 3,421 (35.4%) | 3,232 (38.9%) |
| 15 to 19 Minutes | 1,020 (10.6%) | 871 (10.5%) |
| 20 to 24 Minutes | 363 (3.8%) | 206 (2.5%) |
| 25 to 29 Minutes | 164 (1.7%) | 39 (0.5%) |
| 30 to 34 Minutes | 313 (3.2%) | 181 (2.2%) |
| 35 to 39 Minutes | 12 (0.1%) | 4 (0.1%) |
| 40 to 44 Minutes | 144 (1.5%) | 74 (0.9%) |
| 45 to 59 Minutes | 454 (4.7%) | 166 (2.0%) |
| 60 to 89 Minutes | 195 (2.0%) | 144 (1.7%) |
| 90 or more Minutes | 257 (2.7%) | 70 (0.8%) |
Time of Departure to Work by Sex in Kearney
The most frequent times of departure to work in Kearney are 7:30 AM to 7:59 AM (1,872, 19.4%) for males and 7:30 AM to 7:59 AM (1,688, 20.3%) for females.
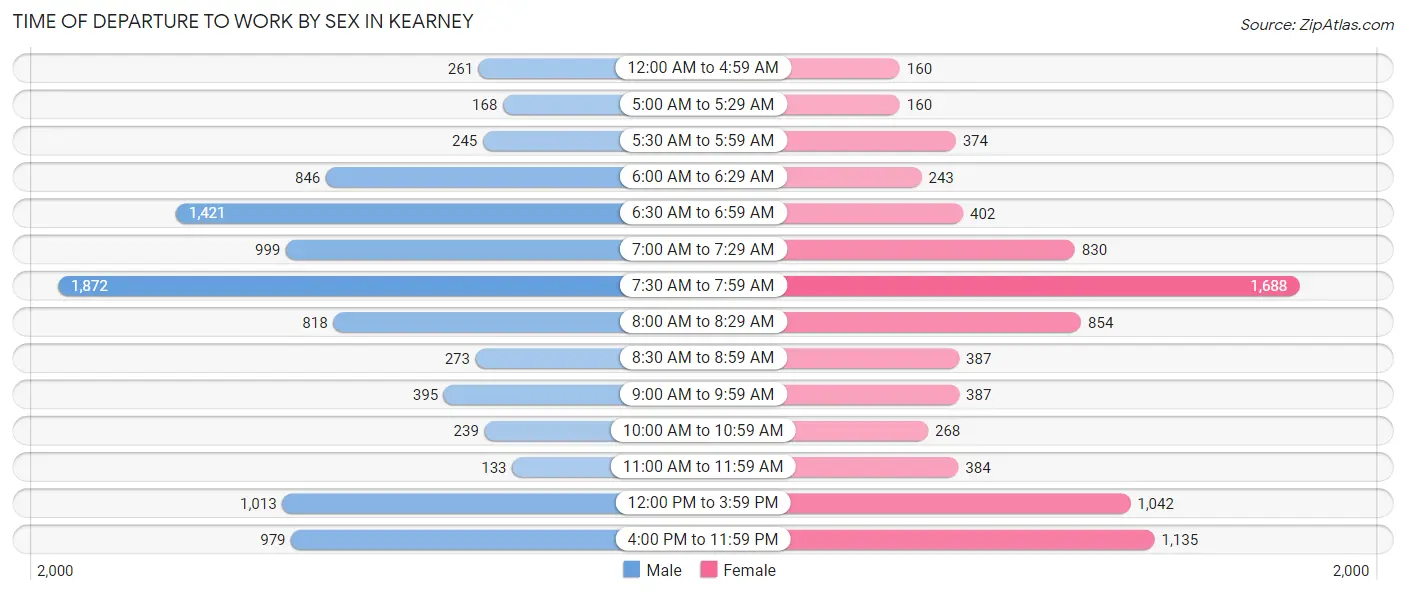
| Time of Departure | Male | Female |
| 12:00 AM to 4:59 AM | 261 (2.7%) | 160 (1.9%) |
| 5:00 AM to 5:29 AM | 168 (1.7%) | 160 (1.9%) |
| 5:30 AM to 5:59 AM | 245 (2.5%) | 374 (4.5%) |
| 6:00 AM to 6:29 AM | 846 (8.8%) | 243 (2.9%) |
| 6:30 AM to 6:59 AM | 1,421 (14.7%) | 402 (4.8%) |
| 7:00 AM to 7:29 AM | 999 (10.3%) | 830 (10.0%) |
| 7:30 AM to 7:59 AM | 1,872 (19.4%) | 1,688 (20.3%) |
| 8:00 AM to 8:29 AM | 818 (8.5%) | 854 (10.3%) |
| 8:30 AM to 8:59 AM | 273 (2.8%) | 387 (4.6%) |
| 9:00 AM to 9:59 AM | 395 (4.1%) | 387 (4.6%) |
| 10:00 AM to 10:59 AM | 239 (2.5%) | 268 (3.2%) |
| 11:00 AM to 11:59 AM | 133 (1.4%) | 384 (4.6%) |
| 12:00 PM to 3:59 PM | 1,013 (10.5%) | 1,042 (12.5%) |
| 4:00 PM to 11:59 PM | 979 (10.1%) | 1,135 (13.7%) |
| Total | 9,662 (100.0%) | 8,314 (100.0%) |
Housing Occupancy in Kearney
Occupancy by Ownership in Kearney
Of the total 13,579 dwellings in Kearney, owner-occupied units account for 8,222 (60.6%), while renter-occupied units make up 5,357 (39.5%).
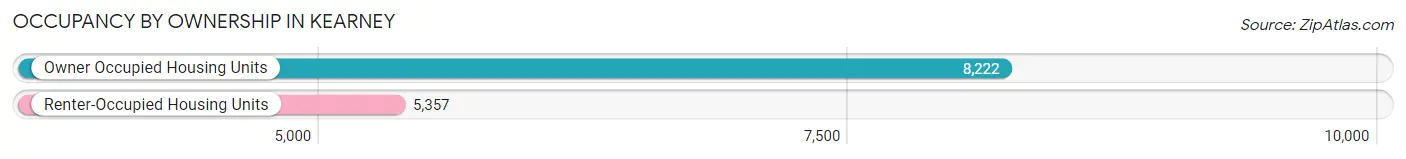
| Occupancy | # Housing Units | % Housing Units |
| Owner Occupied Housing Units | 8,222 | 60.6% |
| Renter-Occupied Housing Units | 5,357 | 39.5% |
| Total Occupied Housing Units | 13,579 | 100.0% |
Occupancy by Household Size in Kearney
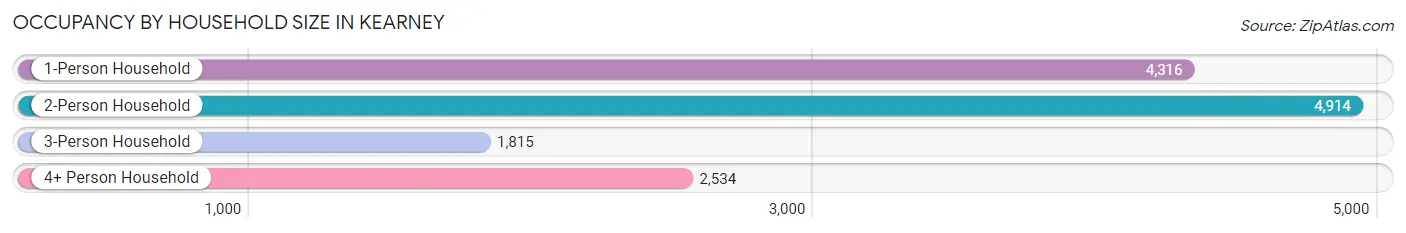
| Household Size | # Housing Units | % Housing Units |
| 1-Person Household | 4,316 | 31.8% |
| 2-Person Household | 4,914 | 36.2% |
| 3-Person Household | 1,815 | 13.4% |
| 4+ Person Household | 2,534 | 18.7% |
| Total Housing Units | 13,579 | 100.0% |
Occupancy by Ownership by Household Size in Kearney
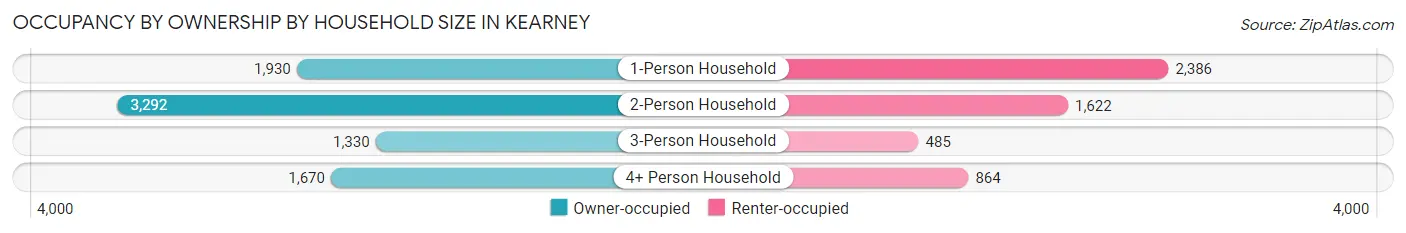
| Household Size | Owner-occupied | Renter-occupied |
| 1-Person Household | 1,930 (44.7%) | 2,386 (55.3%) |
| 2-Person Household | 3,292 (67.0%) | 1,622 (33.0%) |
| 3-Person Household | 1,330 (73.3%) | 485 (26.7%) |
| 4+ Person Household | 1,670 (65.9%) | 864 (34.1%) |
| Total Housing Units | 8,222 (60.6%) | 5,357 (39.5%) |
Occupancy by Educational Attainment in Kearney
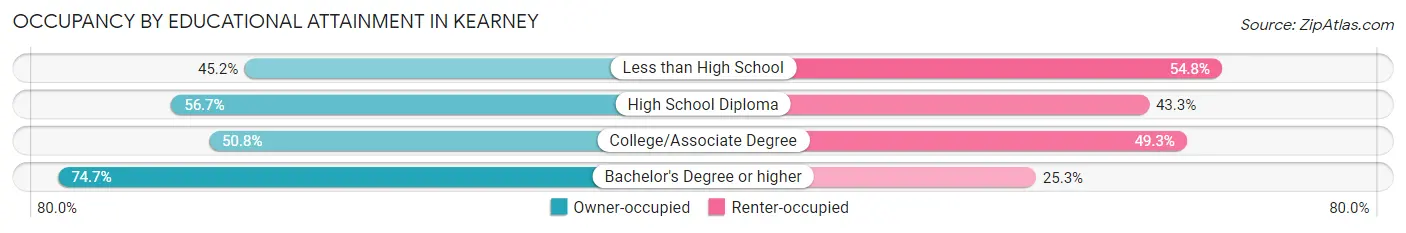
| Household Size | Owner-occupied | Renter-occupied |
| Less than High School | 399 (45.2%) | 484 (54.8%) |
| High School Diploma | 1,568 (56.7%) | 1,196 (43.3%) |
| College/Associate Degree | 2,463 (50.7%) | 2,390 (49.2%) |
| Bachelor's Degree or higher | 3,792 (74.7%) | 1,287 (25.3%) |
Occupancy by Age of Householder in Kearney
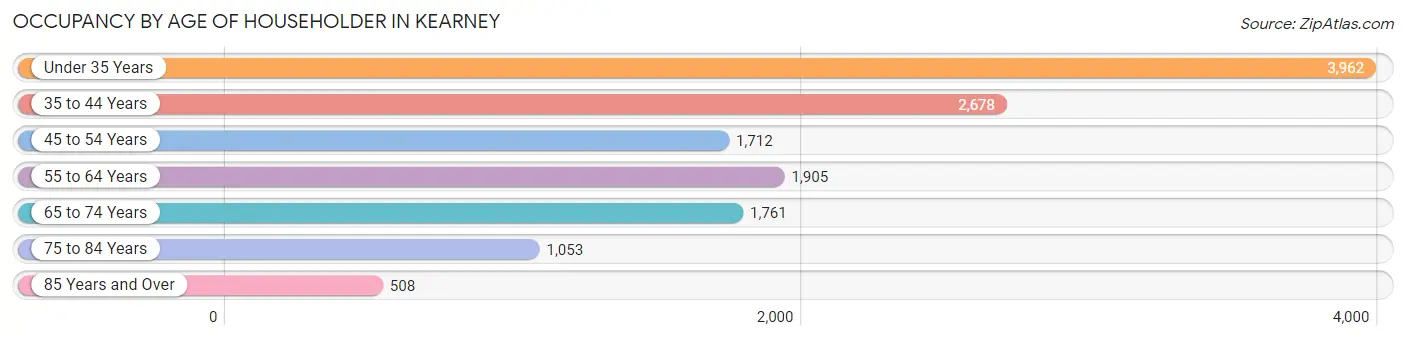
| Age Bracket | # Households | % Households |
| Under 35 Years | 3,962 | 29.2% |
| 35 to 44 Years | 2,678 | 19.7% |
| 45 to 54 Years | 1,712 | 12.6% |
| 55 to 64 Years | 1,905 | 14.0% |
| 65 to 74 Years | 1,761 | 13.0% |
| 75 to 84 Years | 1,053 | 7.7% |
| 85 Years and Over | 508 | 3.7% |
| Total | 13,579 | 100.0% |
Housing Finances in Kearney
Median Income by Occupancy in Kearney
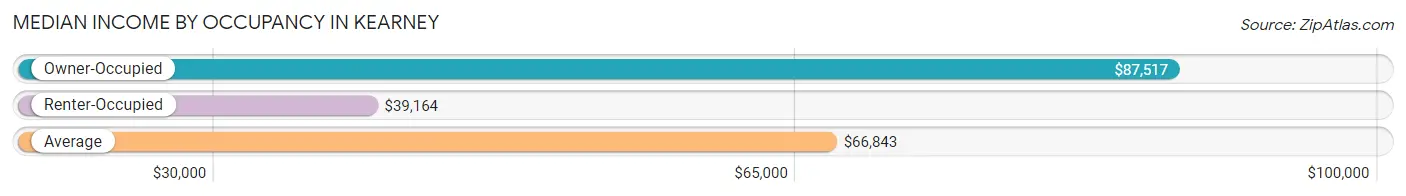
| Occupancy Type | # Households | Median Income |
| Owner-Occupied | 8,222 (60.6%) | $87,517 |
| Renter-Occupied | 5,357 (39.5%) | $39,164 |
| Average | 13,579 (100.0%) | $66,843 |
Occupancy by Householder Income Bracket in Kearney
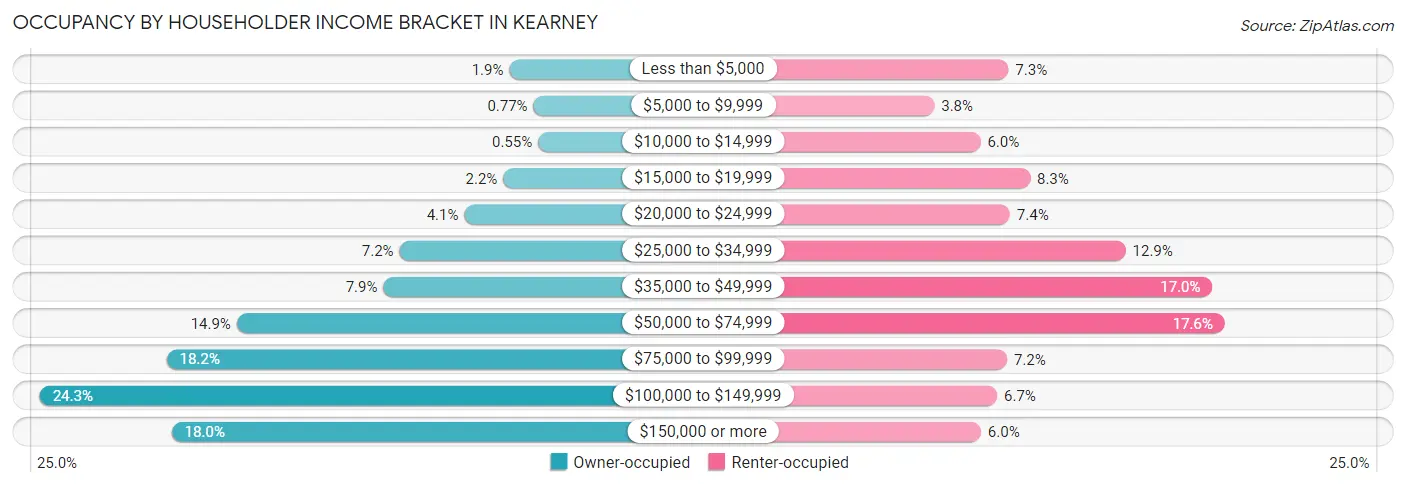
| Income Bracket | Owner-occupied | Renter-occupied |
| Less than $5,000 | 158 (1.9%) | 390 (7.3%) |
| $5,000 to $9,999 | 63 (0.8%) | 201 (3.7%) |
| $10,000 to $14,999 | 45 (0.5%) | 319 (5.9%) |
| $15,000 to $19,999 | 182 (2.2%) | 445 (8.3%) |
| $20,000 to $24,999 | 334 (4.1%) | 394 (7.3%) |
| $25,000 to $34,999 | 588 (7.1%) | 689 (12.9%) |
| $35,000 to $49,999 | 651 (7.9%) | 910 (17.0%) |
| $50,000 to $74,999 | 1,225 (14.9%) | 942 (17.6%) |
| $75,000 to $99,999 | 1,500 (18.2%) | 386 (7.2%) |
| $100,000 to $149,999 | 1,996 (24.3%) | 361 (6.7%) |
| $150,000 or more | 1,480 (18.0%) | 320 (6.0%) |
| Total | 8,222 (100.0%) | 5,357 (100.0%) |
Monthly Housing Cost Tiers in Kearney
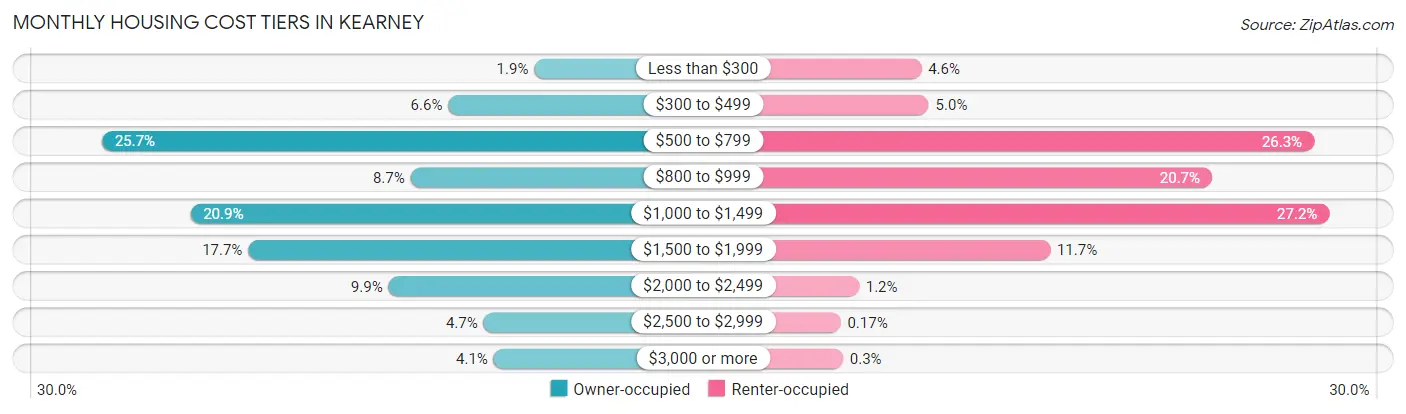
| Monthly Cost | Owner-occupied | Renter-occupied |
| Less than $300 | 152 (1.8%) | 248 (4.6%) |
| $300 to $499 | 543 (6.6%) | 270 (5.0%) |
| $500 to $799 | 2,116 (25.7%) | 1,410 (26.3%) |
| $800 to $999 | 714 (8.7%) | 1,108 (20.7%) |
| $1,000 to $1,499 | 1,714 (20.8%) | 1,455 (27.2%) |
| $1,500 to $1,999 | 1,451 (17.6%) | 629 (11.7%) |
| $2,000 to $2,499 | 814 (9.9%) | 63 (1.2%) |
| $2,500 to $2,999 | 382 (4.6%) | 9 (0.2%) |
| $3,000 or more | 336 (4.1%) | 16 (0.3%) |
| Total | 8,222 (100.0%) | 5,357 (100.0%) |
Physical Housing Characteristics in Kearney
Housing Structures in Kearney
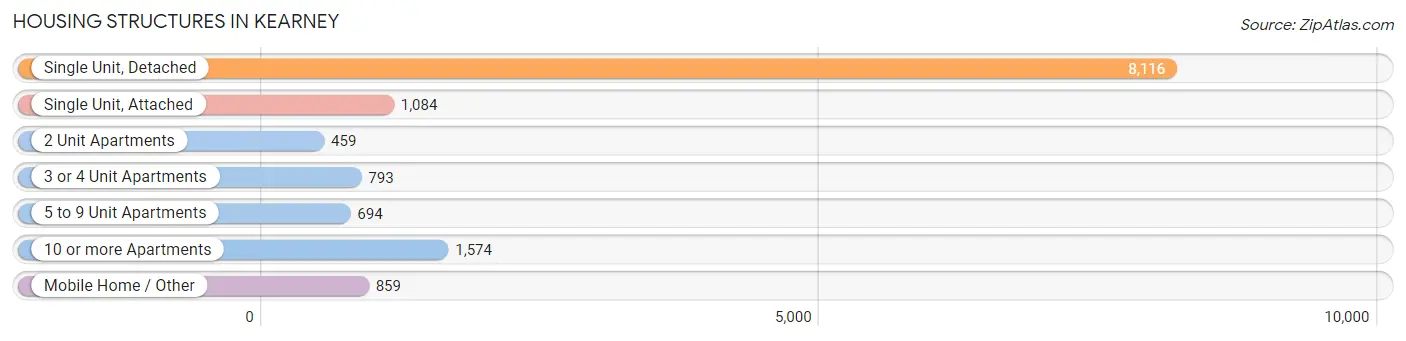
| Structure Type | # Housing Units | % Housing Units |
| Single Unit, Detached | 8,116 | 59.8% |
| Single Unit, Attached | 1,084 | 8.0% |
| 2 Unit Apartments | 459 | 3.4% |
| 3 or 4 Unit Apartments | 793 | 5.8% |
| 5 to 9 Unit Apartments | 694 | 5.1% |
| 10 or more Apartments | 1,574 | 11.6% |
| Mobile Home / Other | 859 | 6.3% |
| Total | 13,579 | 100.0% |
Housing Structures by Occupancy in Kearney
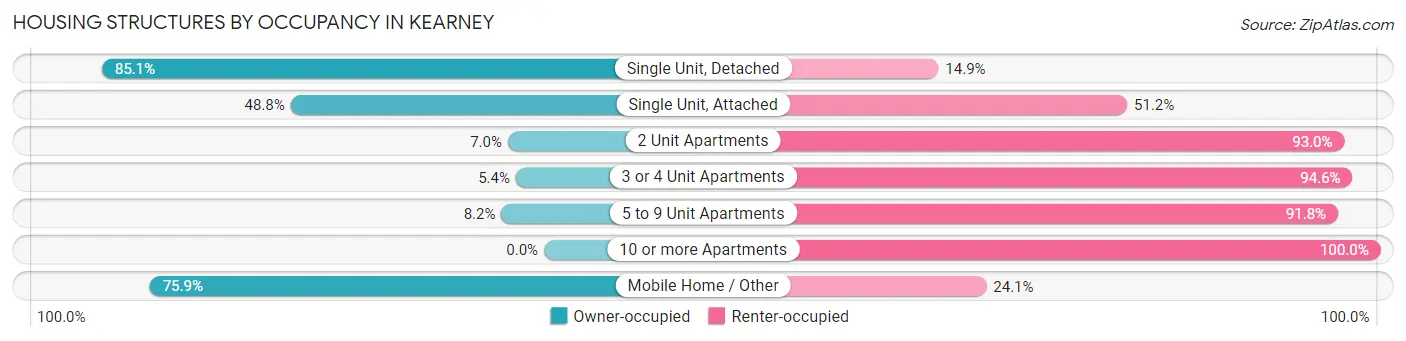
| Structure Type | Owner-occupied | Renter-occupied |
| Single Unit, Detached | 6,909 (85.1%) | 1,207 (14.9%) |
| Single Unit, Attached | 529 (48.8%) | 555 (51.2%) |
| 2 Unit Apartments | 32 (7.0%) | 427 (93.0%) |
| 3 or 4 Unit Apartments | 43 (5.4%) | 750 (94.6%) |
| 5 to 9 Unit Apartments | 57 (8.2%) | 637 (91.8%) |
| 10 or more Apartments | 0 (0.0%) | 1,574 (100.0%) |
| Mobile Home / Other | 652 (75.9%) | 207 (24.1%) |
| Total | 8,222 (60.6%) | 5,357 (39.5%) |
Housing Structures by Number of Rooms in Kearney
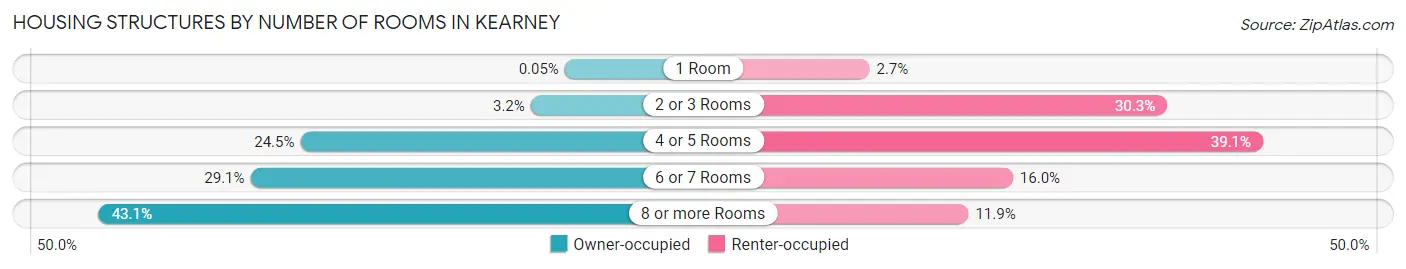
| Number of Rooms | Owner-occupied | Renter-occupied |
| 1 Room | 4 (0.1%) | 147 (2.7%) |
| 2 or 3 Rooms | 263 (3.2%) | 1,621 (30.3%) |
| 4 or 5 Rooms | 2,014 (24.5%) | 2,095 (39.1%) |
| 6 or 7 Rooms | 2,394 (29.1%) | 857 (16.0%) |
| 8 or more Rooms | 3,547 (43.1%) | 637 (11.9%) |
| Total | 8,222 (100.0%) | 5,357 (100.0%) |
Housing Structure by Heating Type in Kearney
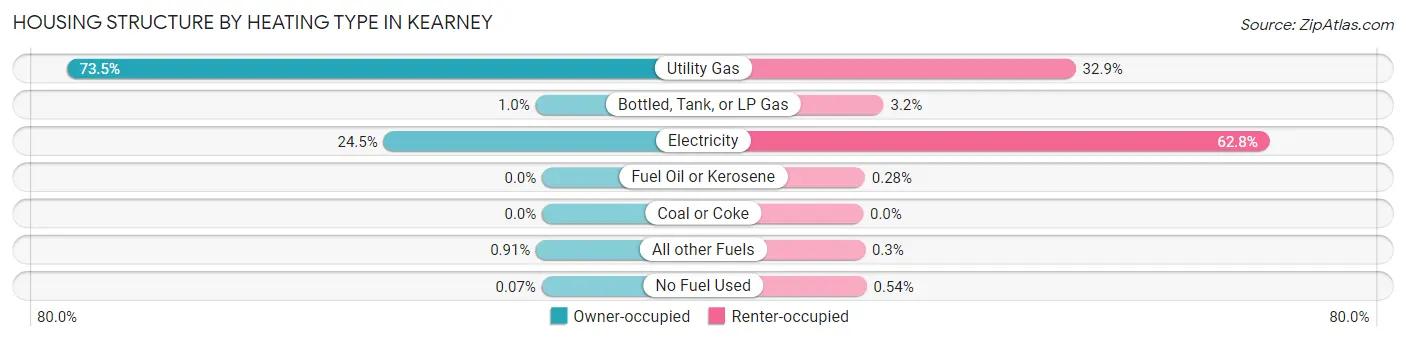
| Heating Type | Owner-occupied | Renter-occupied |
| Utility Gas | 6,044 (73.5%) | 1,761 (32.9%) |
| Bottled, Tank, or LP Gas | 82 (1.0%) | 170 (3.2%) |
| Electricity | 2,015 (24.5%) | 3,366 (62.8%) |
| Fuel Oil or Kerosene | 0 (0.0%) | 15 (0.3%) |
| Coal or Coke | 0 (0.0%) | 0 (0.0%) |
| All other Fuels | 75 (0.9%) | 16 (0.3%) |
| No Fuel Used | 6 (0.1%) | 29 (0.5%) |
| Total | 8,222 (100.0%) | 5,357 (100.0%) |
Household Vehicle Usage in Kearney
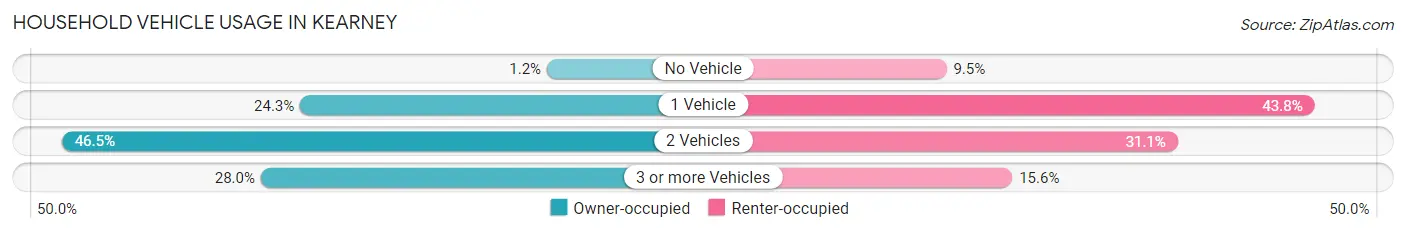
| Vehicles per Household | Owner-occupied | Renter-occupied |
| No Vehicle | 102 (1.2%) | 508 (9.5%) |
| 1 Vehicle | 1,996 (24.3%) | 2,348 (43.8%) |
| 2 Vehicles | 3,826 (46.5%) | 1,664 (31.1%) |
| 3 or more Vehicles | 2,298 (28.0%) | 837 (15.6%) |
| Total | 8,222 (100.0%) | 5,357 (100.0%) |
Real Estate & Mortgages in Kearney
Real Estate and Mortgage Overview in Kearney
| Characteristic | Without Mortgage | With Mortgage |
| Housing Units | 3,495 | 4,727 |
| Median Property Value | $199,700 | $231,800 |
| Median Household Income | $68,906 | $1,057 |
| Monthly Housing Costs | $674 | $324 |
| Real Estate Taxes | $3,448 | $161 |
Property Value by Mortgage Status in Kearney
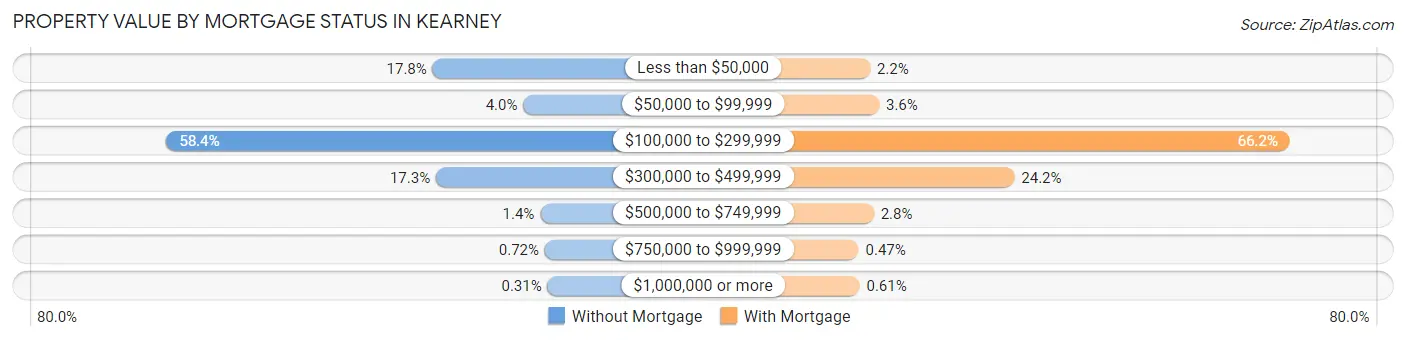
| Property Value | Without Mortgage | With Mortgage |
| Less than $50,000 | 623 (17.8%) | 104 (2.2%) |
| $50,000 to $99,999 | 140 (4.0%) | 169 (3.6%) |
| $100,000 to $299,999 | 2,041 (58.4%) | 3,128 (66.2%) |
| $300,000 to $499,999 | 605 (17.3%) | 1,144 (24.2%) |
| $500,000 to $749,999 | 50 (1.4%) | 131 (2.8%) |
| $750,000 to $999,999 | 25 (0.7%) | 22 (0.5%) |
| $1,000,000 or more | 11 (0.3%) | 29 (0.6%) |
| Total | 3,495 (100.0%) | 4,727 (100.0%) |
Household Income by Mortgage Status in Kearney
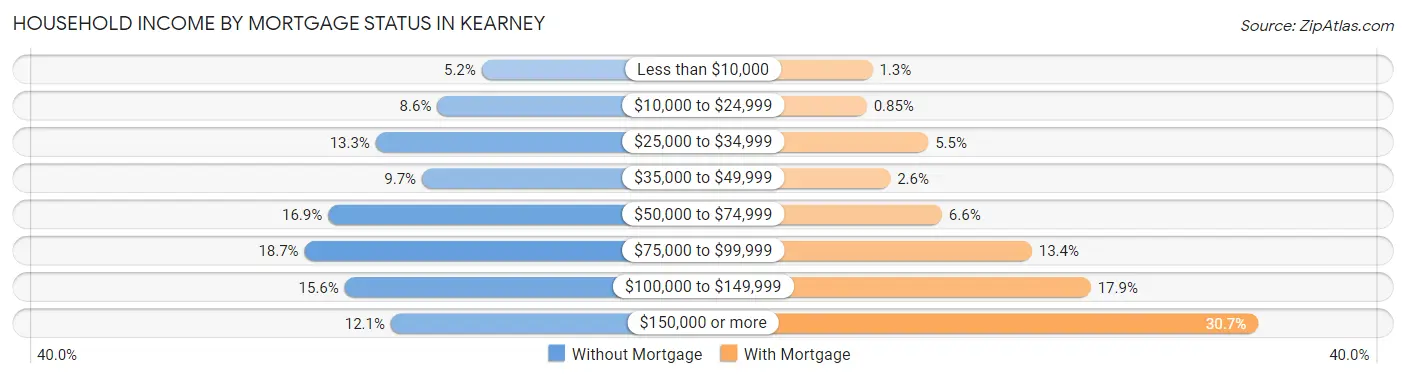
| Household Income | Without Mortgage | With Mortgage |
| Less than $10,000 | 181 (5.2%) | 61 (1.3%) |
| $10,000 to $24,999 | 299 (8.6%) | 40 (0.9%) |
| $25,000 to $34,999 | 463 (13.3%) | 262 (5.5%) |
| $35,000 to $49,999 | 340 (9.7%) | 125 (2.6%) |
| $50,000 to $74,999 | 590 (16.9%) | 311 (6.6%) |
| $75,000 to $99,999 | 653 (18.7%) | 635 (13.4%) |
| $100,000 to $149,999 | 546 (15.6%) | 847 (17.9%) |
| $150,000 or more | 423 (12.1%) | 1,450 (30.7%) |
| Total | 3,495 (100.0%) | 4,727 (100.0%) |
Property Value to Household Income Ratio in Kearney
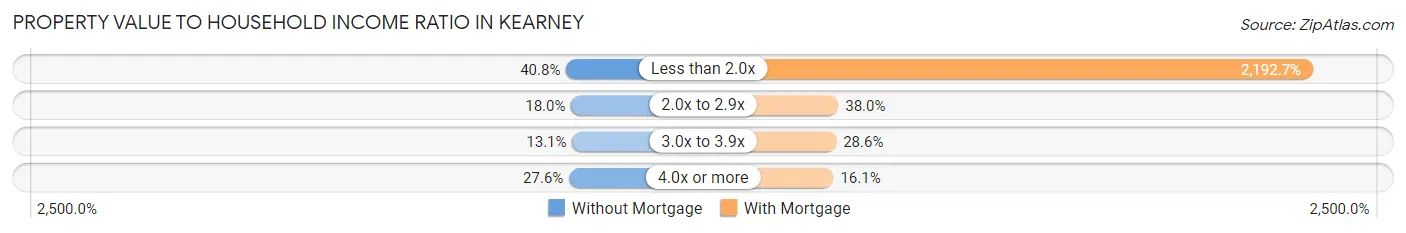
| Value-to-Income Ratio | Without Mortgage | With Mortgage |
| Less than 2.0x | 1,425 (40.8%) | 103,651 (2,192.7%) |
| 2.0x to 2.9x | 628 (18.0%) | 1,798 (38.0%) |
| 3.0x to 3.9x | 457 (13.1%) | 1,354 (28.6%) |
| 4.0x or more | 965 (27.6%) | 761 (16.1%) |
| Total | 3,495 (100.0%) | 4,727 (100.0%) |
Real Estate Taxes by Mortgage Status in Kearney
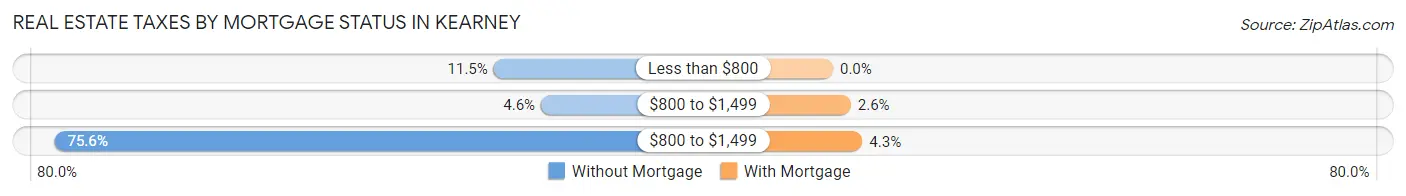
| Property Taxes | Without Mortgage | With Mortgage |
| Less than $800 | 401 (11.5%) | 0 (0.0%) |
| $800 to $1,499 | 159 (4.5%) | 123 (2.6%) |
| $800 to $1,499 | 2,643 (75.6%) | 203 (4.3%) |
| Total | 3,495 (100.0%) | 4,727 (100.0%) |
Health & Disability in Kearney
Health Insurance Coverage by Age in Kearney
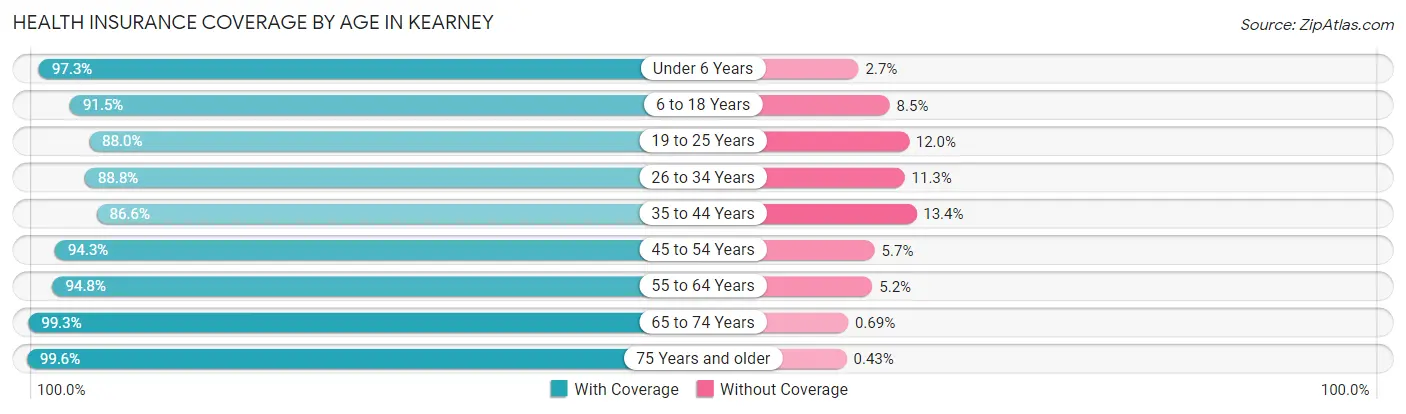
| Age Bracket | With Coverage | Without Coverage |
| Under 6 Years | 2,373 (97.3%) | 65 (2.7%) |
| 6 to 18 Years | 5,031 (91.5%) | 465 (8.5%) |
| 19 to 25 Years | 5,190 (88.0%) | 710 (12.0%) |
| 26 to 34 Years | 3,604 (88.7%) | 457 (11.3%) |
| 35 to 44 Years | 3,697 (86.6%) | 573 (13.4%) |
| 45 to 54 Years | 2,786 (94.3%) | 167 (5.7%) |
| 55 to 64 Years | 3,064 (94.8%) | 169 (5.2%) |
| 65 to 74 Years | 2,891 (99.3%) | 20 (0.7%) |
| 75 Years and older | 2,087 (99.6%) | 9 (0.4%) |
| Total | 30,723 (92.1%) | 2,635 (7.9%) |
Health Insurance Coverage by Citizenship Status in Kearney
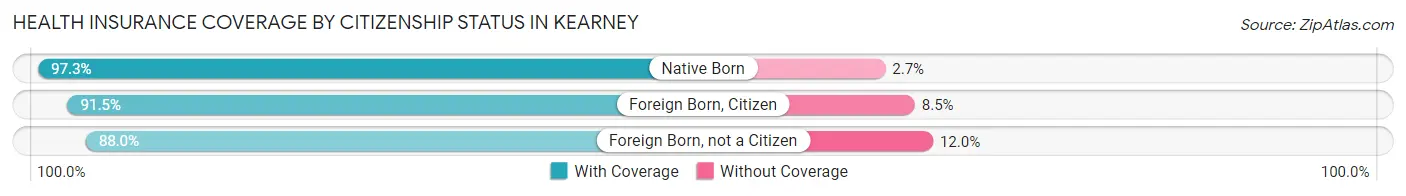
| Citizenship Status | With Coverage | Without Coverage |
| Native Born | 2,373 (97.3%) | 65 (2.7%) |
| Foreign Born, Citizen | 5,031 (91.5%) | 465 (8.5%) |
| Foreign Born, not a Citizen | 5,190 (88.0%) | 710 (12.0%) |
Health Insurance Coverage by Household Income in Kearney
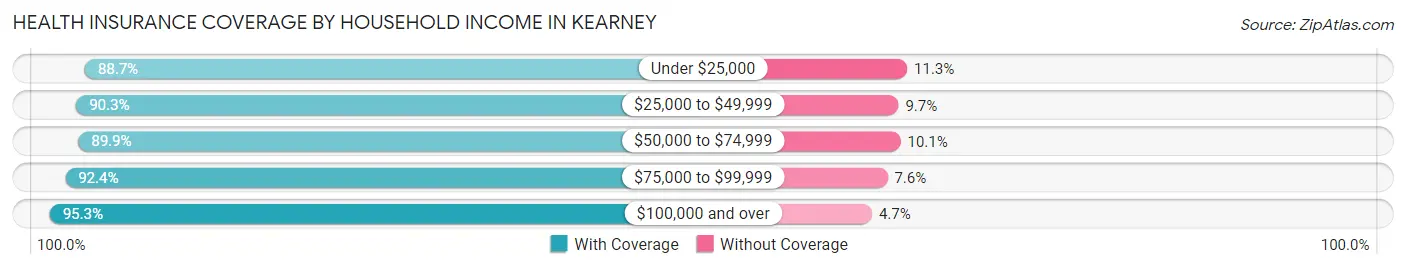
| Household Income | With Coverage | Without Coverage |
| Under $25,000 | 3,264 (88.7%) | 416 (11.3%) |
| $25,000 to $49,999 | 5,129 (90.3%) | 550 (9.7%) |
| $50,000 to $74,999 | 4,780 (89.9%) | 535 (10.1%) |
| $75,000 to $99,999 | 4,718 (92.4%) | 389 (7.6%) |
| $100,000 and over | 11,536 (95.3%) | 572 (4.7%) |
Public vs Private Health Insurance Coverage by Age in Kearney
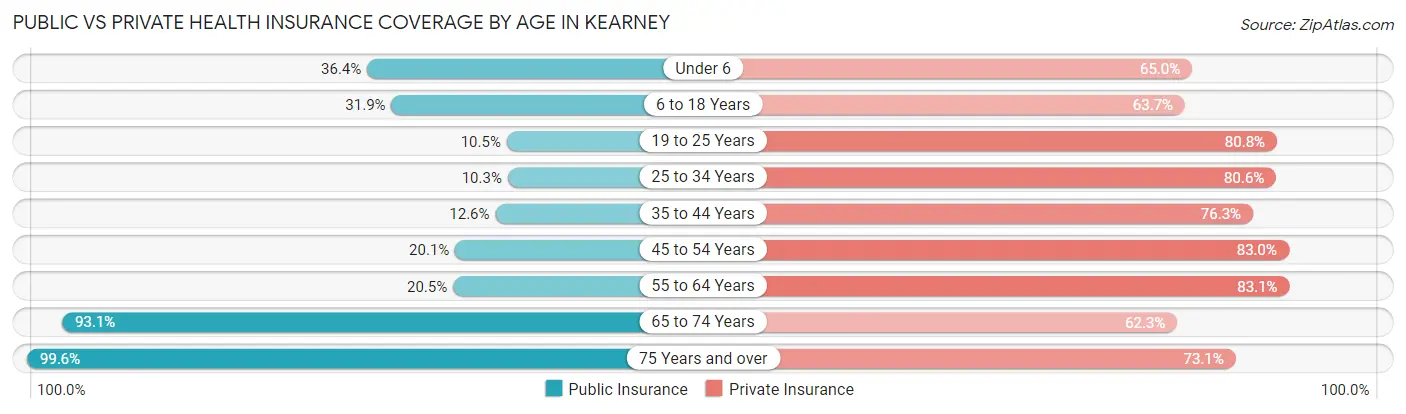
| Age Bracket | Public Insurance | Private Insurance |
| Under 6 | 888 (36.4%) | 1,585 (65.0%) |
| 6 to 18 Years | 1,754 (31.9%) | 3,500 (63.7%) |
| 19 to 25 Years | 620 (10.5%) | 4,765 (80.8%) |
| 25 to 34 Years | 419 (10.3%) | 3,274 (80.6%) |
| 35 to 44 Years | 539 (12.6%) | 3,258 (76.3%) |
| 45 to 54 Years | 593 (20.1%) | 2,450 (83.0%) |
| 55 to 64 Years | 662 (20.5%) | 2,686 (83.1%) |
| 65 to 74 Years | 2,709 (93.1%) | 1,812 (62.3%) |
| 75 Years and over | 2,087 (99.6%) | 1,532 (73.1%) |
| Total | 10,271 (30.8%) | 24,862 (74.5%) |
Disability Status by Sex by Age in Kearney
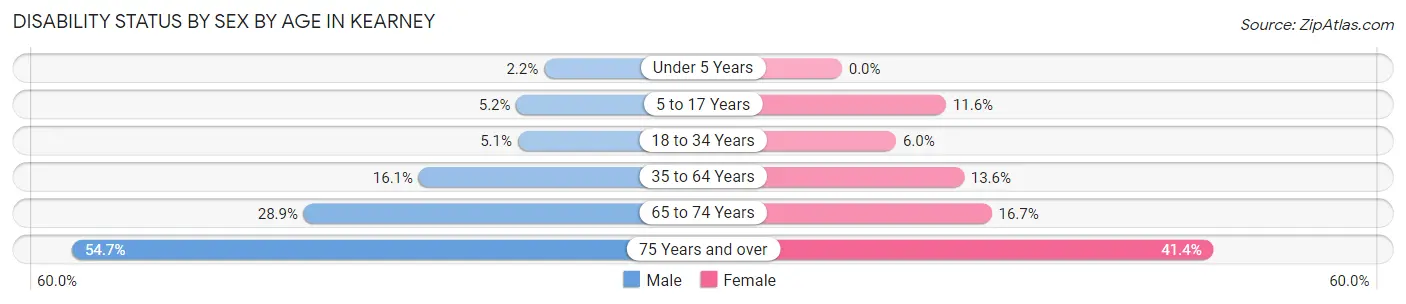
| Age Bracket | Male | Female |
| Under 5 Years | 24 (2.1%) | 0 (0.0%) |
| 5 to 17 Years | 135 (5.2%) | 270 (11.6%) |
| 18 to 34 Years | 282 (5.1%) | 320 (6.0%) |
| 35 to 64 Years | 848 (16.1%) | 705 (13.6%) |
| 65 to 74 Years | 410 (28.9%) | 249 (16.7%) |
| 75 Years and over | 400 (54.7%) | 565 (41.4%) |
Disability Class by Sex by Age in Kearney
Disability Class: Hearing Difficulty
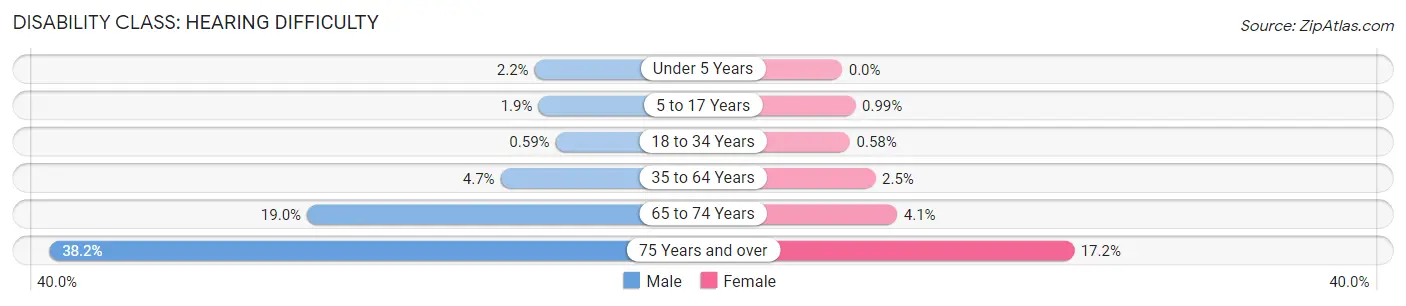
| Age Bracket | Male | Female |
| Under 5 Years | 24 (2.1%) | 0 (0.0%) |
| 5 to 17 Years | 48 (1.9%) | 23 (1.0%) |
| 18 to 34 Years | 33 (0.6%) | 31 (0.6%) |
| 35 to 64 Years | 246 (4.7%) | 128 (2.5%) |
| 65 to 74 Years | 270 (19.0%) | 61 (4.1%) |
| 75 Years and over | 279 (38.2%) | 235 (17.2%) |
Disability Class: Vision Difficulty
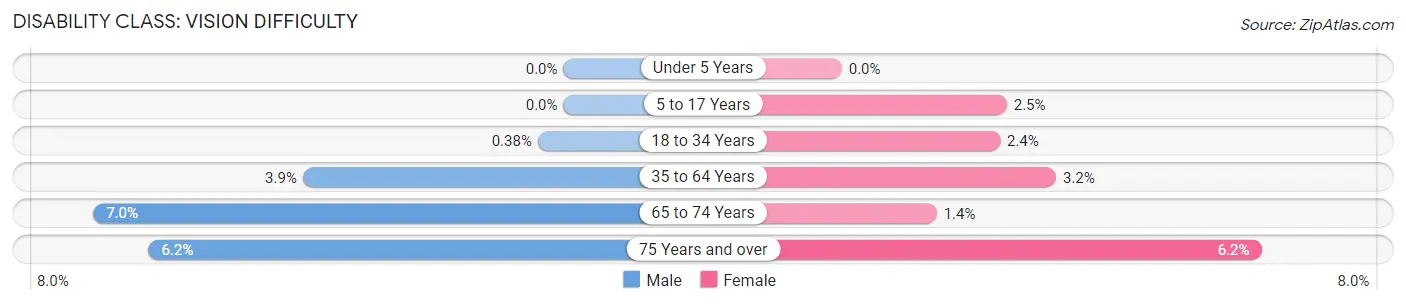
| Age Bracket | Male | Female |
| Under 5 Years | 0 (0.0%) | 0 (0.0%) |
| 5 to 17 Years | 0 (0.0%) | 57 (2.5%) |
| 18 to 34 Years | 21 (0.4%) | 125 (2.4%) |
| 35 to 64 Years | 204 (3.9%) | 165 (3.2%) |
| 65 to 74 Years | 99 (7.0%) | 21 (1.4%) |
| 75 Years and over | 45 (6.2%) | 85 (6.2%) |
Disability Class: Cognitive Difficulty
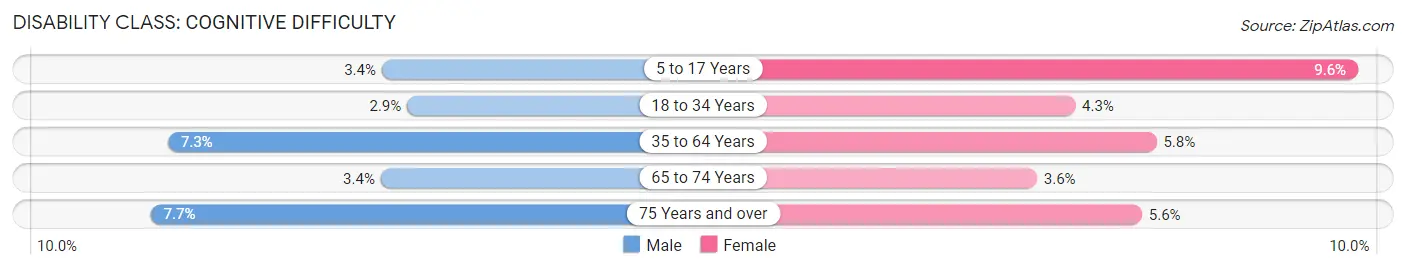
| Age Bracket | Male | Female |
| 5 to 17 Years | 87 (3.4%) | 223 (9.6%) |
| 18 to 34 Years | 161 (2.9%) | 230 (4.3%) |
| 35 to 64 Years | 387 (7.3%) | 303 (5.8%) |
| 65 to 74 Years | 48 (3.4%) | 54 (3.6%) |
| 75 Years and over | 56 (7.7%) | 76 (5.6%) |
Disability Class: Ambulatory Difficulty
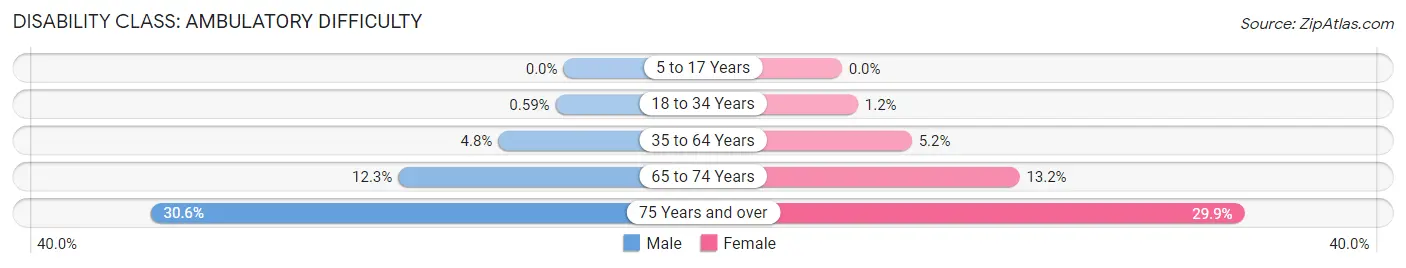
| Age Bracket | Male | Female |
| 5 to 17 Years | 0 (0.0%) | 0 (0.0%) |
| 18 to 34 Years | 33 (0.6%) | 63 (1.2%) |
| 35 to 64 Years | 255 (4.8%) | 269 (5.2%) |
| 65 to 74 Years | 174 (12.3%) | 197 (13.2%) |
| 75 Years and over | 224 (30.6%) | 408 (29.9%) |
Disability Class: Self-Care Difficulty
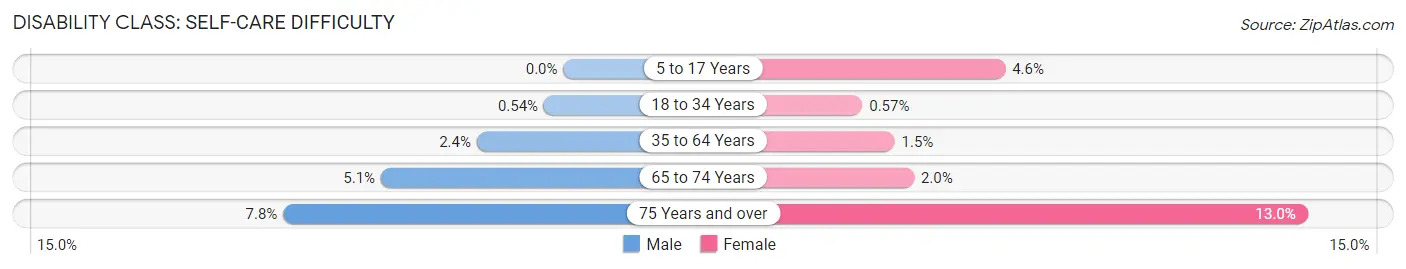
| Age Bracket | Male | Female |
| 5 to 17 Years | 0 (0.0%) | 106 (4.5%) |
| 18 to 34 Years | 30 (0.5%) | 30 (0.6%) |
| 35 to 64 Years | 127 (2.4%) | 76 (1.5%) |
| 65 to 74 Years | 72 (5.1%) | 30 (2.0%) |
| 75 Years and over | 57 (7.8%) | 177 (13.0%) |
Technology Access in Kearney
Computing Device Access in Kearney
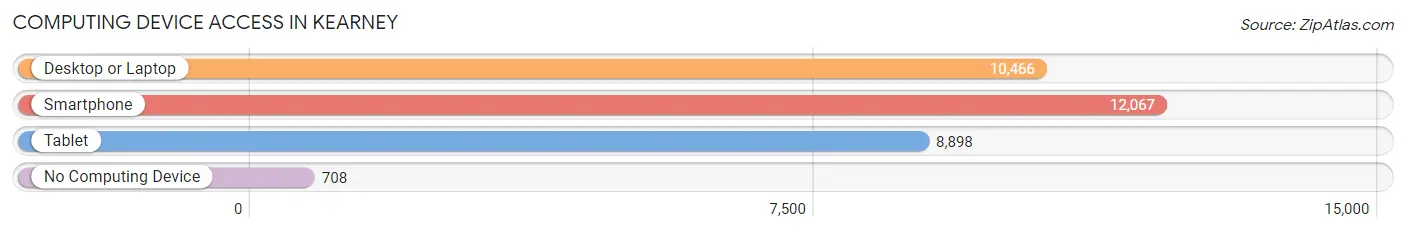
| Device Type | # Households | % Households |
| Desktop or Laptop | 10,466 | 77.1% |
| Smartphone | 12,067 | 88.9% |
| Tablet | 8,898 | 65.5% |
| No Computing Device | 708 | 5.2% |
| Total | 13,579 | 100.0% |
Internet Access in Kearney
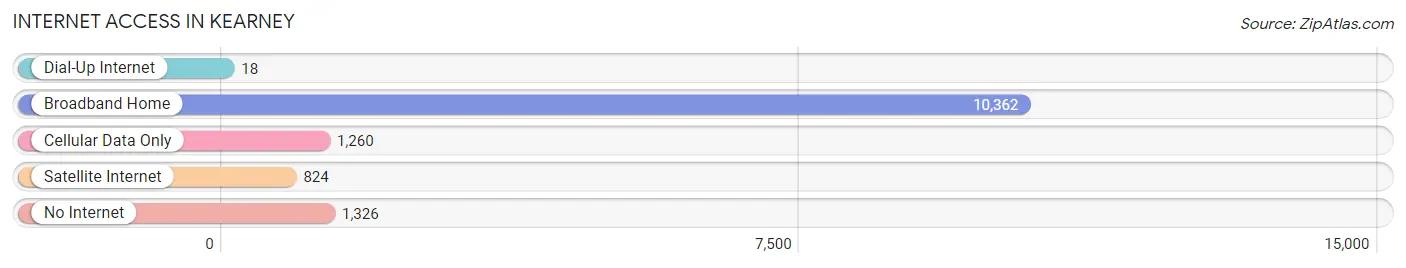
| Internet Type | # Households | % Households |
| Dial-Up Internet | 18 | 0.1% |
| Broadband Home | 10,362 | 76.3% |
| Cellular Data Only | 1,260 | 9.3% |
| Satellite Internet | 824 | 6.1% |
| No Internet | 1,326 | 9.8% |
| Total | 13,579 | 100.0% |
Kearney Summary
Kearney, Nebraska is a city located in Buffalo County in the south-central part of the state. It is the county seat and the largest city in the county. The city is located on the Platte River and is part of the Kearney Micropolitan Statistical Area. As of the 2010 census, the city had a population of 30,787.
History
Kearney was founded in 1871 by a group of settlers led by James and William Kearney. The city was named after the brothers, who were both Civil War veterans. The city was originally a stop on the Union Pacific Railroad and was a major shipping point for cattle and grain.
In the late 19th century, Kearney became a major center for the cattle industry. The city was home to several large stockyards and meatpacking plants. The city also became a major center for the sugar beet industry.
Geography
Kearney is located at 40°42'N 99°4'W (40.7, -99.067). The city is situated on the Platte River, which flows through the city from north to south. The city is located in the Central Lowland region of the Great Plains.
The city has a total area of 16.2 square miles (41.8 km2), of which 16.1 square miles (41.6 km2) is land and 0.1 square miles (0.2 km2) is water.
Economy
Kearney is a major center for agriculture and manufacturing. The city is home to several large food processing plants, including Cargill, ConAgra, and Tyson Foods. The city is also home to several large manufacturing companies, including John Deere, Caterpillar, and 3M.
Kearney is also home to the University of Nebraska at Kearney, which is a major employer in the city. The university has an enrollment of over 8,000 students and employs over 1,000 faculty and staff.
Demographics
As of the 2010 census, there were 30,787 people, 11,845 households, and 6,945 families residing in the city. The population density was 1,906.3 people per square mile (735.3/km2). There were 12,845 housing units at an average density of 794.3 per square mile (306.7/km2). The racial makeup of the city was 90.2% White, 1.3% African American, 0.7% Native American, 1.7% Asian, 0.1% Pacific Islander, 4.2% from other races, and 2.0% from two or more races. Hispanic or Latino of any race were 8.7% of the population.
There were 11,845 households, out of which 28.2% had children under the age of 18 living with them, 44.2% were married couples living together, 10.7% had a female householder with no husband present, and 40.7% were non-families. 33.2% of all households were made up of individuals, and 11.7% had someone living alone who was 65 years of age or older. The average household size was 2.35 and the average family size was 3.02.
In the city, the population was spread out, with 22.7% under the age of 18, 19.2% from 18 to 24, 24.7% from 25 to 44, 20.3% from 45 to 64, and 13.1% who were 65 years of age or older. The median age was 32 years. For every 100 females, there were 92.2 males. For every 100 females age 18 and over, there were 88.7 males.
The median income for a household in the city was $37,845, and the median income for a family was $48,945. Males had a median income of $31,945 versus $23,845 for females. The per capita income for the city was $19,845. About 8.2% of families and 13.2% of the population were below the poverty line, including 15.2% of those under age 18 and 8.2% of those age 65 or over.
Common Questions
What is Per Capita Income in Kearney?
Per Capita income in Kearney is $35,507.
What is the Median Family Income in Kearney?
Median Family Income in Kearney is $93,765.
What is the Median Household income in Kearney?
Median Household Income in Kearney is $66,843.
What is Income or Wage Gap in Kearney?
Income or Wage Gap in Kearney is 34.3%.
Women in Kearney earn 65.7 cents for every dollar earned by a man.
What is Family Income Deficit in Kearney?
Family Income Deficit in Kearney is $8,815.
Families that are below poverty line in Kearney earn $8,815 less on average than the poverty threshold level.
What is Inequality or Gini Index in Kearney?
Inequality or Gini Index in Kearney is 0.45.
What is the Total Population of Kearney?
Total Population of Kearney is 33,809.
What is the Total Male Population of Kearney?
Total Male Population of Kearney is 16,921.
What is the Total Female Population of Kearney?
Total Female Population of Kearney is 16,888.
What is the Ratio of Males per 100 Females in Kearney?
There are 100.20 Males per 100 Females in Kearney.
What is the Ratio of Females per 100 Males in Kearney?
There are 99.80 Females per 100 Males in Kearney.
What is the Median Population Age in Kearney?
Median Population Age in Kearney is 31.9 Years.
What is the Average Family Size in Kearney
Average Family Size in Kearney is 2.9 People.
What is the Average Household Size in Kearney
Average Household Size in Kearney is 2.4 People.
How Large is the Labor Force in Kearney?
There are 19,616 People in the Labor Forcein in Kearney.
What is the Percentage of People in the Labor Force in Kearney?
71.2% of People are in the Labor Force in Kearney.
What is the Unemployment Rate in Kearney?
Unemployment Rate in Kearney is 2.9%.