Ceresco, NE Map & Demographics
Ceresco Map
Ceresco Overview
$33,053
PER CAPITA INCOME
$100,694
AVG FAMILY INCOME
$96,125
AVG HOUSEHOLD INCOME
17.8%
WAGE / INCOME GAP [ % ]
82.2¢/ $1
WAGE / INCOME GAP [ $ ]
0.27
INEQUALITY / GINI INDEX
1,414
TOTAL POPULATION
718
MALE POPULATION
696
FEMALE POPULATION
103.16
MALES / 100 FEMALES
96.94
FEMALES / 100 MALES
36.6
MEDIAN AGE
3.2
AVG FAMILY SIZE
3.0
AVG HOUSEHOLD SIZE
750
LABOR FORCE [ PEOPLE ]
68.0%
PERCENT IN LABOR FORCE
2.7%
UNEMPLOYMENT RATE
Ceresco Zip Codes
Ceresco Area Codes
Income in Ceresco
Income Overview in Ceresco
Per Capita Income in Ceresco is $33,053, while median incomes of families and households are $100,694 and $96,125 respectively.
| Characteristic | Number | Measure |
| Per Capita Income | 1,414 | $33,053 |
| Median Family Income | 386 | $100,694 |
| Mean Family Income | 386 | $103,416 |
| Median Household Income | 473 | $96,125 |
| Mean Household Income | 473 | $97,963 |
| Income Deficit | 386 | $0 |
| Wage / Income Gap (%) | 1,414 | 17.81% |
| Wage / Income Gap ($) | 1,414 | 82.19¢ per $1 |
| Gini / Inequality Index | 1,414 | 0.27 |
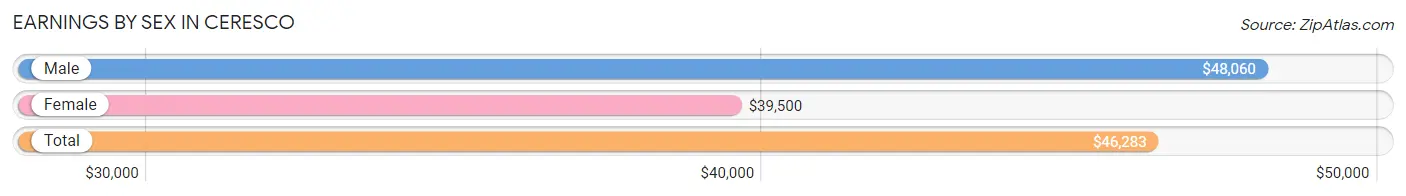
Earnings by Sex in Ceresco
Average Earnings in Ceresco are $46,283, $48,060 for men and $39,500 for women, a difference of 17.8%.
| Sex | Number | Average Earnings |
| Male | 437 (54.4%) | $48,060 |
| Female | 366 (45.6%) | $39,500 |
| Total | 803 (100.0%) | $46,283 |
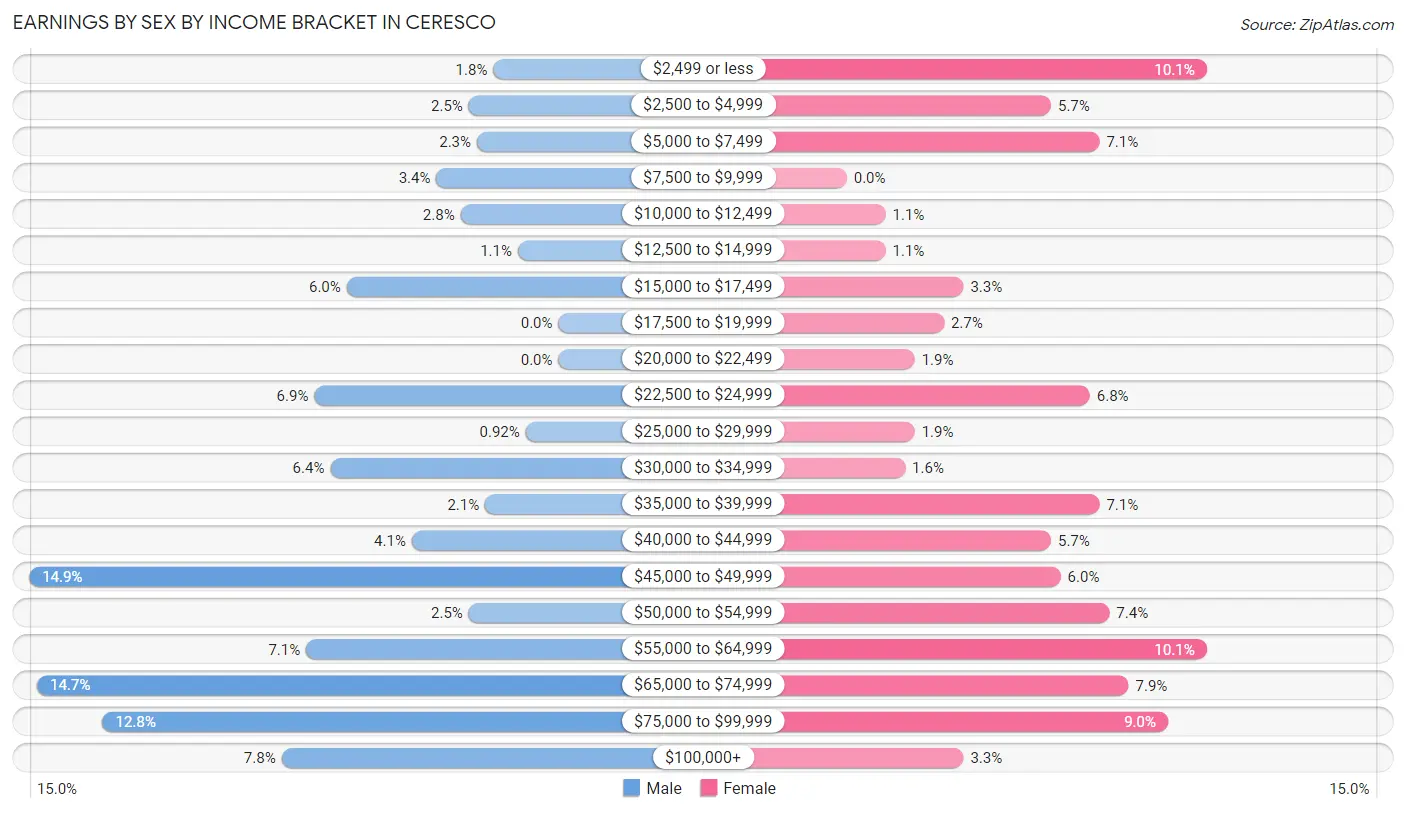
Earnings by Sex by Income Bracket in Ceresco
The most common earnings brackets in Ceresco are $45,000 to $49,999 for men (65 | 14.9%) and $2,499 or less for women (37 | 10.1%).
| Income | Male | Female |
| $2,499 or less | 8 (1.8%) | 37 (10.1%) |
| $2,500 to $4,999 | 11 (2.5%) | 21 (5.7%) |
| $5,000 to $7,499 | 10 (2.3%) | 26 (7.1%) |
| $7,500 to $9,999 | 15 (3.4%) | 0 (0.0%) |
| $10,000 to $12,499 | 12 (2.8%) | 4 (1.1%) |
| $12,500 to $14,999 | 5 (1.1%) | 4 (1.1%) |
| $15,000 to $17,499 | 26 (5.9%) | 12 (3.3%) |
| $17,500 to $19,999 | 0 (0.0%) | 10 (2.7%) |
| $20,000 to $22,499 | 0 (0.0%) | 7 (1.9%) |
| $22,500 to $24,999 | 30 (6.9%) | 25 (6.8%) |
| $25,000 to $29,999 | 4 (0.9%) | 7 (1.9%) |
| $30,000 to $34,999 | 28 (6.4%) | 6 (1.6%) |
| $35,000 to $39,999 | 9 (2.1%) | 26 (7.1%) |
| $40,000 to $44,999 | 18 (4.1%) | 21 (5.7%) |
| $45,000 to $49,999 | 65 (14.9%) | 22 (6.0%) |
| $50,000 to $54,999 | 11 (2.5%) | 27 (7.4%) |
| $55,000 to $64,999 | 31 (7.1%) | 37 (10.1%) |
| $65,000 to $74,999 | 64 (14.6%) | 29 (7.9%) |
| $75,000 to $99,999 | 56 (12.8%) | 33 (9.0%) |
| $100,000+ | 34 (7.8%) | 12 (3.3%) |
| Total | 437 (100.0%) | 366 (100.0%) |
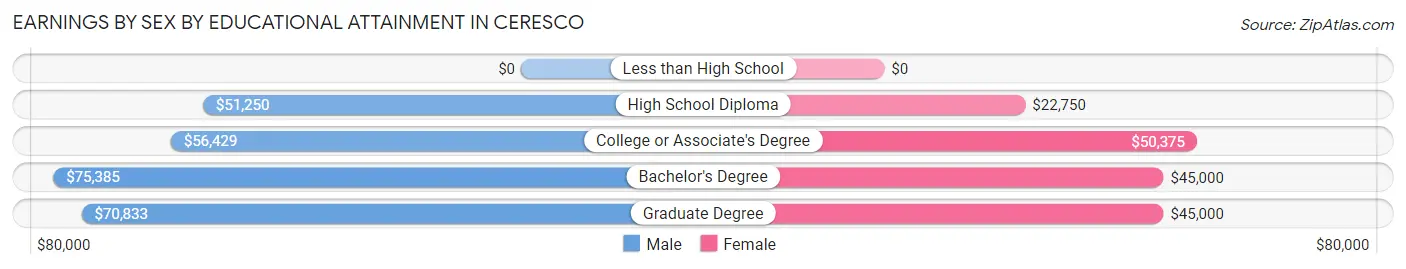
Earnings by Sex by Educational Attainment in Ceresco
Average earnings in Ceresco are $58,646 for men and $44,722 for women, a difference of 23.7%. Men with an educational attainment of bachelor's degree enjoy the highest average annual earnings of $75,385, while those with high school diploma education earn the least with $51,250. Women with an educational attainment of college or associate's degree earn the most with the average annual earnings of $50,375, while those with high school diploma education have the smallest earnings of $22,750.
| Educational Attainment | Male Income | Female Income |
| Less than High School | - | - |
| High School Diploma | $51,250 | $22,750 |
| College or Associate's Degree | $56,429 | $50,375 |
| Bachelor's Degree | $75,385 | $45,000 |
| Graduate Degree | $70,833 | $45,000 |
| Total | $58,646 | $44,722 |
Family Income in Ceresco
Family Income Brackets in Ceresco
According to the Ceresco family income data, there are 154 families falling into the $100,000 to $149,999 income range, which is the most common income bracket and makes up 39.9% of all families.
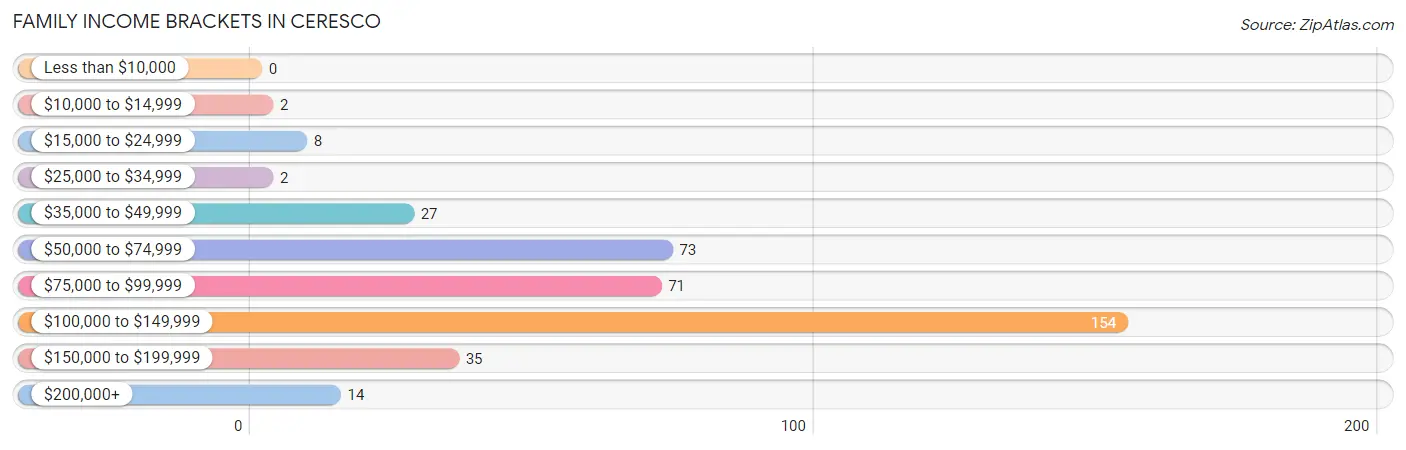
| Income Bracket | # Families | % Families |
| Less than $10,000 | 0 | 0.0% |
| $10,000 to $14,999 | 2 | 0.5% |
| $15,000 to $24,999 | 8 | 2.1% |
| $25,000 to $34,999 | 2 | 0.5% |
| $35,000 to $49,999 | 27 | 7.0% |
| $50,000 to $74,999 | 73 | 18.9% |
| $75,000 to $99,999 | 71 | 18.4% |
| $100,000 to $149,999 | 154 | 39.9% |
| $150,000 to $199,999 | 35 | 9.1% |
| $200,000+ | 14 | 3.6% |
Family Income by Famaliy Size in Ceresco
6-person families (57 | 14.8%) account for the highest median family income in Ceresco with $111,202 per family, while 2-person families (181 | 46.9%) have the highest median income of $41,875 per family member.
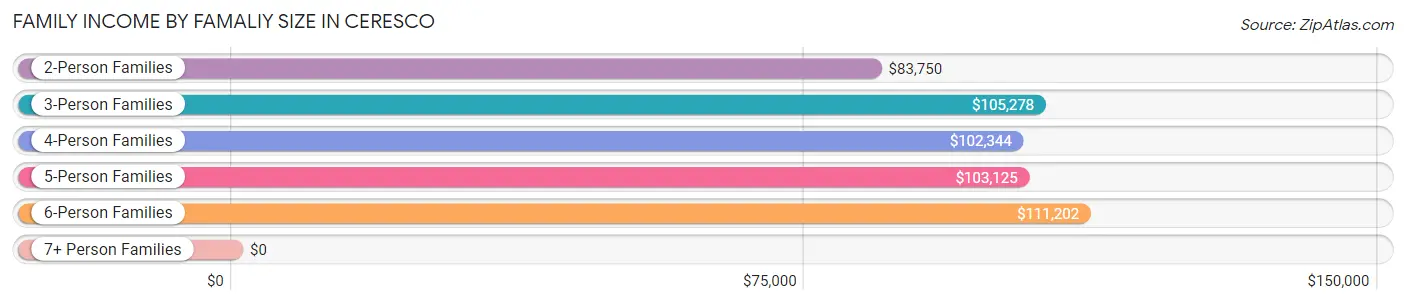
| Income Bracket | # Families | Median Income |
| 2-Person Families | 181 (46.9%) | $83,750 |
| 3-Person Families | 60 (15.5%) | $105,278 |
| 4-Person Families | 59 (15.3%) | $102,344 |
| 5-Person Families | 17 (4.4%) | $103,125 |
| 6-Person Families | 57 (14.8%) | $111,202 |
| 7+ Person Families | 12 (3.1%) | $0 |
| Total | 386 (100.0%) | $100,694 |
Family Income by Number of Earners in Ceresco
The median family income in Ceresco is $100,694, with families comprising 3+ earners (58) having the highest median family income of $111,538, while families with no earners (41) have the lowest median family income of $54,375, accounting for 15.0% and 10.6% of families, respectively.
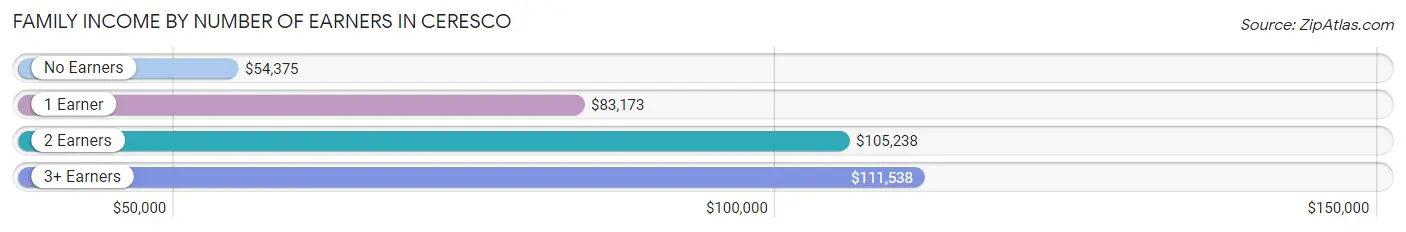
| Number of Earners | # Families | Median Income |
| No Earners | 41 (10.6%) | $54,375 |
| 1 Earner | 69 (17.9%) | $83,173 |
| 2 Earners | 218 (56.5%) | $105,238 |
| 3+ Earners | 58 (15.0%) | $111,538 |
| Total | 386 (100.0%) | $100,694 |
Household Income in Ceresco
Household Income Brackets in Ceresco
With 168 households falling in the category, the $100,000 to $149,999 income range is the most frequent in Ceresco, accounting for 35.5% of all households.
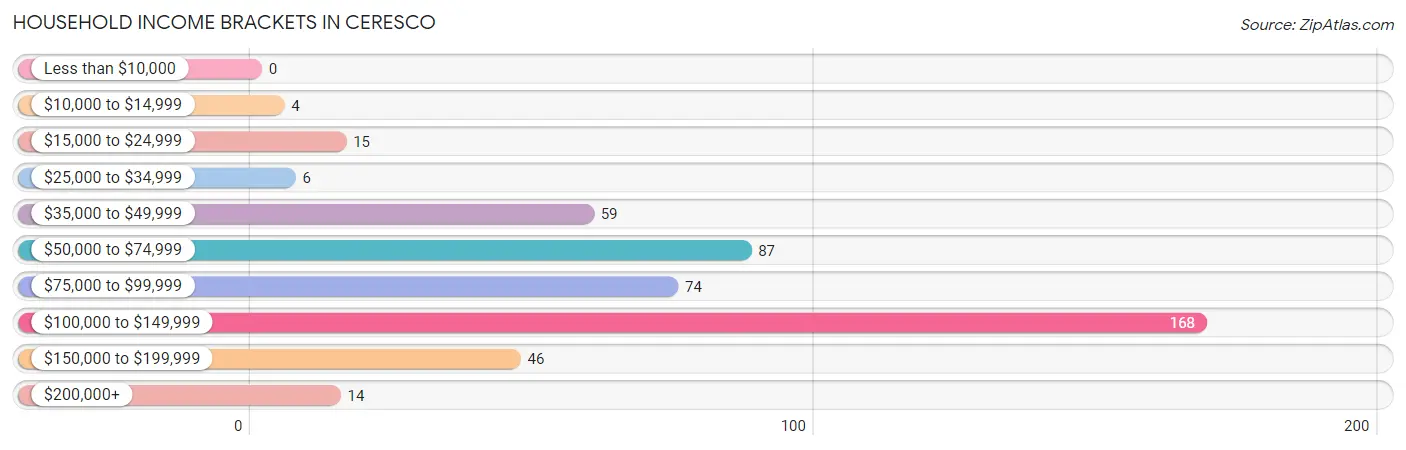
| Income Bracket | # Households | % Households |
| Less than $10,000 | 0 | 0.0% |
| $10,000 to $14,999 | 4 | 0.8% |
| $15,000 to $24,999 | 15 | 3.2% |
| $25,000 to $34,999 | 6 | 1.3% |
| $35,000 to $49,999 | 59 | 12.5% |
| $50,000 to $74,999 | 87 | 18.4% |
| $75,000 to $99,999 | 74 | 15.6% |
| $100,000 to $149,999 | 168 | 35.5% |
| $150,000 to $199,999 | 46 | 9.7% |
| $200,000+ | 14 | 3.0% |
Household Income by Householder Age in Ceresco
The median household income in Ceresco is $96,125, with the highest median household income of $106,548 found in the 25 to 44 years age bracket for the primary householder. A total of 210 households (44.4%) fall into this category. Meanwhile, the 65+ years age bracket for the primary householder has the lowest median household income of $65,833, with 118 households (24.9%) in this group.
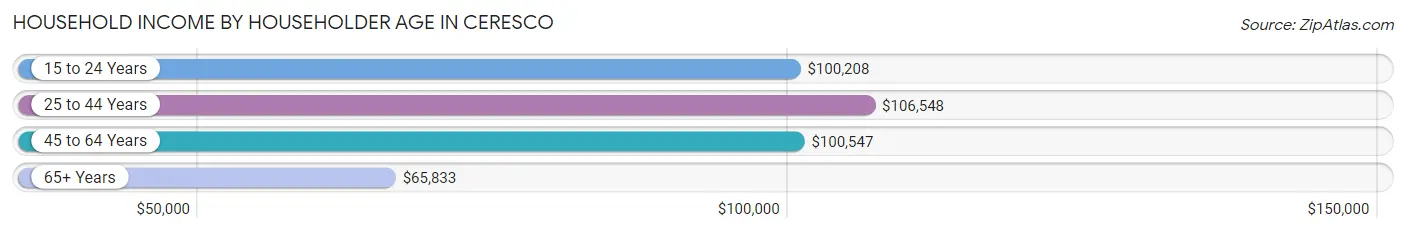
| Income Bracket | # Households | Median Income |
| 15 to 24 Years | 22 (4.6%) | $100,208 |
| 25 to 44 Years | 210 (44.4%) | $106,548 |
| 45 to 64 Years | 123 (26.0%) | $100,547 |
| 65+ Years | 118 (24.9%) | $65,833 |
| Total | 473 (100.0%) | $96,125 |
Poverty in Ceresco
Income Below Poverty by Sex and Age in Ceresco
With 2.4% poverty level for males and 4.1% for females among the residents of Ceresco, 55 to 64 year old males and 18 to 24 year old females are the most vulnerable to poverty, with 8 males (16.0%) and 20 females (23.0%) in their respective age groups living below the poverty level.
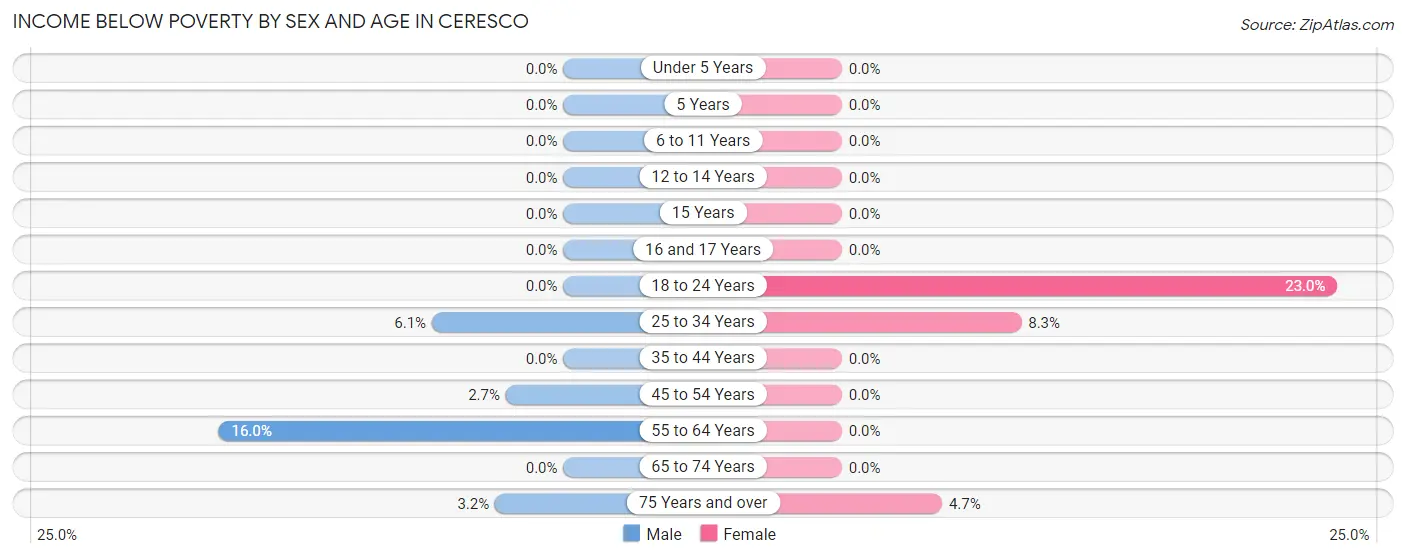
| Age Bracket | Male | Female |
| Under 5 Years | 0 (0.0%) | 0 (0.0%) |
| 5 Years | 0 (0.0%) | 0 (0.0%) |
| 6 to 11 Years | 0 (0.0%) | 0 (0.0%) |
| 12 to 14 Years | 0 (0.0%) | 0 (0.0%) |
| 15 Years | 0 (0.0%) | 0 (0.0%) |
| 16 and 17 Years | 0 (0.0%) | 0 (0.0%) |
| 18 to 24 Years | 0 (0.0%) | 20 (23.0%) |
| 25 to 34 Years | 5 (6.1%) | 6 (8.3%) |
| 35 to 44 Years | 0 (0.0%) | 0 (0.0%) |
| 45 to 54 Years | 2 (2.7%) | 0 (0.0%) |
| 55 to 64 Years | 8 (16.0%) | 0 (0.0%) |
| 65 to 74 Years | 0 (0.0%) | 0 (0.0%) |
| 75 Years and over | 2 (3.2%) | 2 (4.6%) |
| Total | 17 (2.4%) | 28 (4.1%) |
Income Above Poverty by Sex and Age in Ceresco
According to the poverty statistics in Ceresco, males aged under 5 years and females aged under 5 years are the age groups that are most secure financially, with 100.0% of males and 100.0% of females in these age groups living above the poverty line.
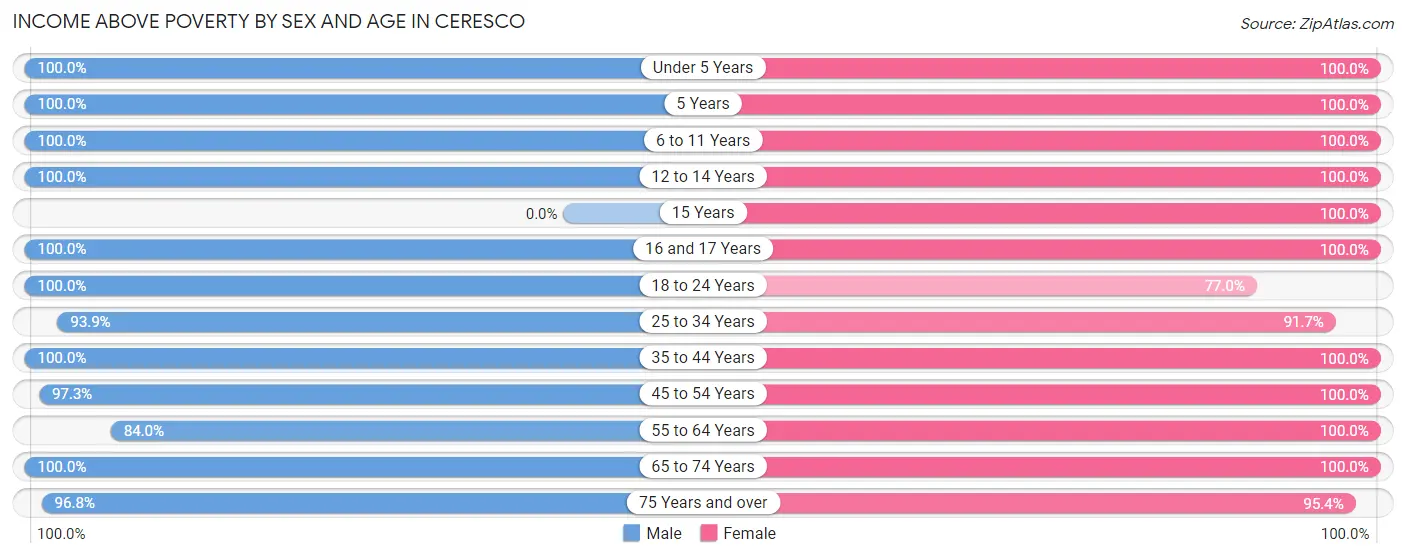
| Age Bracket | Male | Female |
| Under 5 Years | 59 (100.0%) | 46 (100.0%) |
| 5 Years | 18 (100.0%) | 1 (100.0%) |
| 6 to 11 Years | 44 (100.0%) | 74 (100.0%) |
| 12 to 14 Years | 30 (100.0%) | 31 (100.0%) |
| 15 Years | 0 (0.0%) | 2 (100.0%) |
| 16 and 17 Years | 23 (100.0%) | 26 (100.0%) |
| 18 to 24 Years | 72 (100.0%) | 67 (77.0%) |
| 25 to 34 Years | 77 (93.9%) | 66 (91.7%) |
| 35 to 44 Years | 117 (100.0%) | 92 (100.0%) |
| 45 to 54 Years | 73 (97.3%) | 62 (100.0%) |
| 55 to 64 Years | 42 (84.0%) | 88 (100.0%) |
| 65 to 74 Years | 85 (100.0%) | 66 (100.0%) |
| 75 Years and over | 61 (96.8%) | 41 (95.4%) |
| Total | 701 (97.6%) | 662 (95.9%) |
Income Below Poverty Among Married-Couple Families in Ceresco
The poverty statistics for married-couple families in Ceresco show that 0.6% or 2 of the total 340 families live below the poverty line. Families with no children have the highest poverty rate of 1.1%, comprising of 2 families. On the other hand, families with 1 or 2 children have the lowest poverty rate of 0.0%, which includes 0 families.
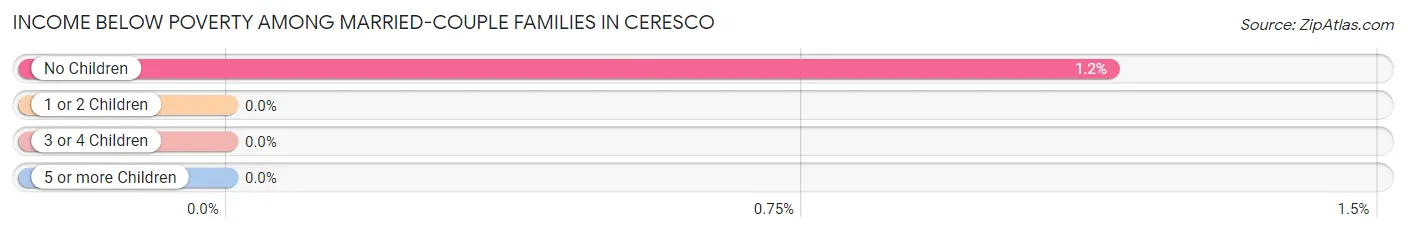
| Children | Above Poverty | Below Poverty |
| No Children | 172 (98.9%) | 2 (1.1%) |
| 1 or 2 Children | 91 (100.0%) | 0 (0.0%) |
| 3 or 4 Children | 75 (100.0%) | 0 (0.0%) |
| 5 or more Children | 0 (0.0%) | 0 (0.0%) |
| Total | 338 (99.4%) | 2 (0.6%) |
Income Below Poverty Among Single-Parent Households in Ceresco
| Children | Single Father | Single Mother |
| No Children | 0 (0.0%) | 0 (0.0%) |
| 1 or 2 Children | 0 (0.0%) | 0 (0.0%) |
| 3 or 4 Children | 0 (0.0%) | 0 (0.0%) |
| 5 or more Children | 0 (0.0%) | 0 (0.0%) |
| Total | 0 (0.0%) | 0 (0.0%) |
Income Below Poverty Among Married-Couple vs Single-Parent Households in Ceresco
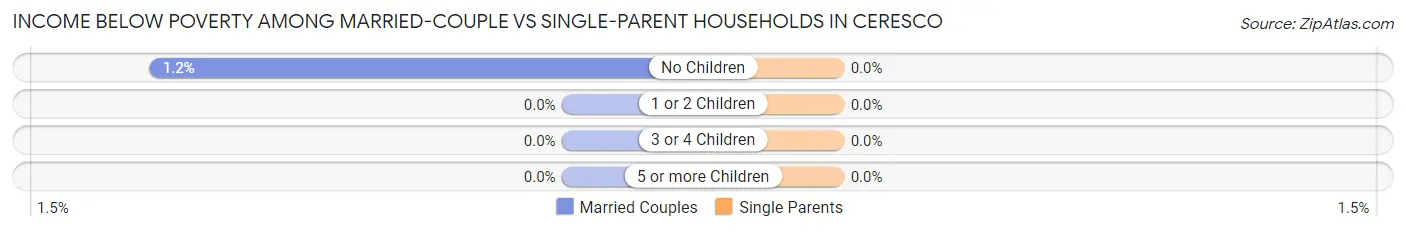
| Children | Married-Couple Families | Single-Parent Households |
| No Children | 2 (1.1%) | 0 (0.0%) |
| 1 or 2 Children | 0 (0.0%) | 0 (0.0%) |
| 3 or 4 Children | 0 (0.0%) | 0 (0.0%) |
| 5 or more Children | 0 (0.0%) | 0 (0.0%) |
| Total | 2 (0.6%) | 0 (0.0%) |
Race in Ceresco
The most populous races in Ceresco are White / Caucasian (1,296 | 91.6%), Hispanic or Latino (97 | 6.9%), and Some other Race (57 | 4.0%).
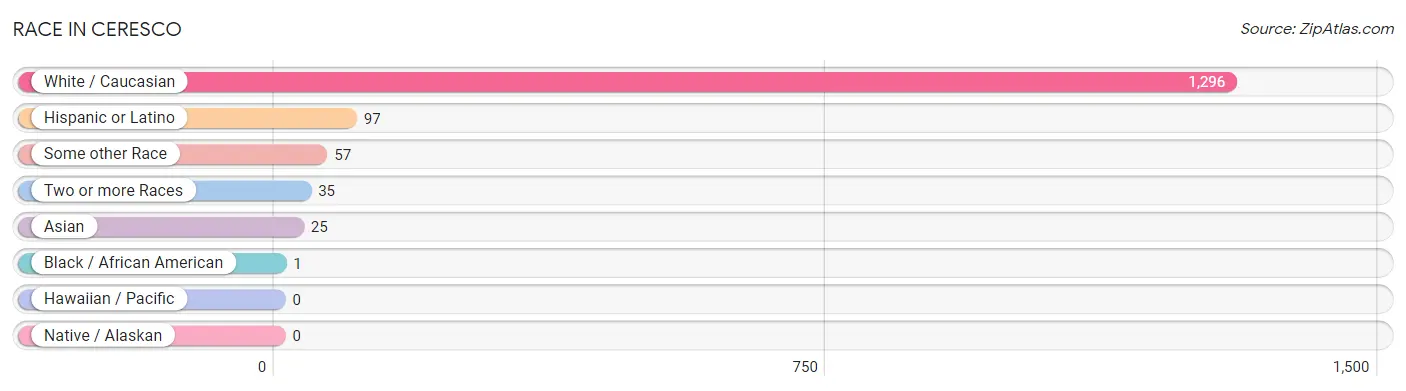
| Race | # Population | % Population |
| Asian | 25 | 1.8% |
| Black / African American | 1 | 0.1% |
| Hawaiian / Pacific | 0 | 0.0% |
| Hispanic or Latino | 97 | 6.9% |
| Native / Alaskan | 0 | 0.0% |
| White / Caucasian | 1,296 | 91.6% |
| Two or more Races | 35 | 2.5% |
| Some other Race | 57 | 4.0% |
| Total | 1,414 | 100.0% |
Ancestry in Ceresco
The most populous ancestries reported in Ceresco are German (540 | 38.2%), Czech (216 | 15.3%), English (147 | 10.4%), Irish (112 | 7.9%), and Mexican (92 | 6.5%), together accounting for 78.3% of all Ceresco residents.
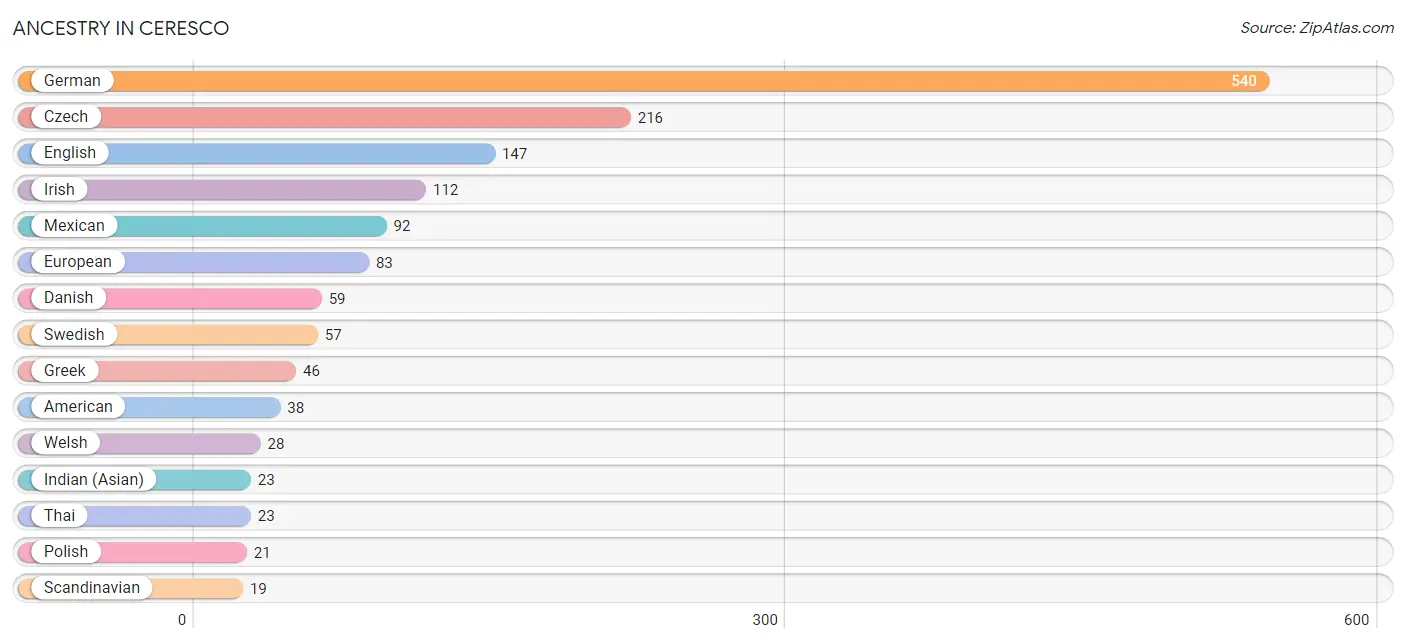
| Ancestry | # Population | % Population |
| American | 38 | 2.7% |
| Central American | 5 | 0.4% |
| Czech | 216 | 15.3% |
| Czechoslovakian | 4 | 0.3% |
| Danish | 59 | 4.2% |
| Dutch | 2 | 0.1% |
| English | 147 | 10.4% |
| European | 83 | 5.9% |
| Finnish | 1 | 0.1% |
| French | 15 | 1.1% |
| German | 540 | 38.2% |
| Greek | 46 | 3.3% |
| Honduran | 5 | 0.4% |
| Hungarian | 3 | 0.2% |
| Indian (Asian) | 23 | 1.6% |
| Irish | 112 | 7.9% |
| Italian | 18 | 1.3% |
| Latvian | 3 | 0.2% |
| Mexican | 92 | 6.5% |
| Norwegian | 13 | 0.9% |
| Polish | 21 | 1.5% |
| Russian | 2 | 0.1% |
| Scandinavian | 19 | 1.3% |
| Scottish | 12 | 0.9% |
| Sri Lankan | 7 | 0.5% |
| Swedish | 57 | 4.0% |
| Thai | 23 | 1.6% |
| Ukrainian | 19 | 1.3% |
| Welsh | 28 | 2.0% | View All 29 Rows |
Immigrants in Ceresco
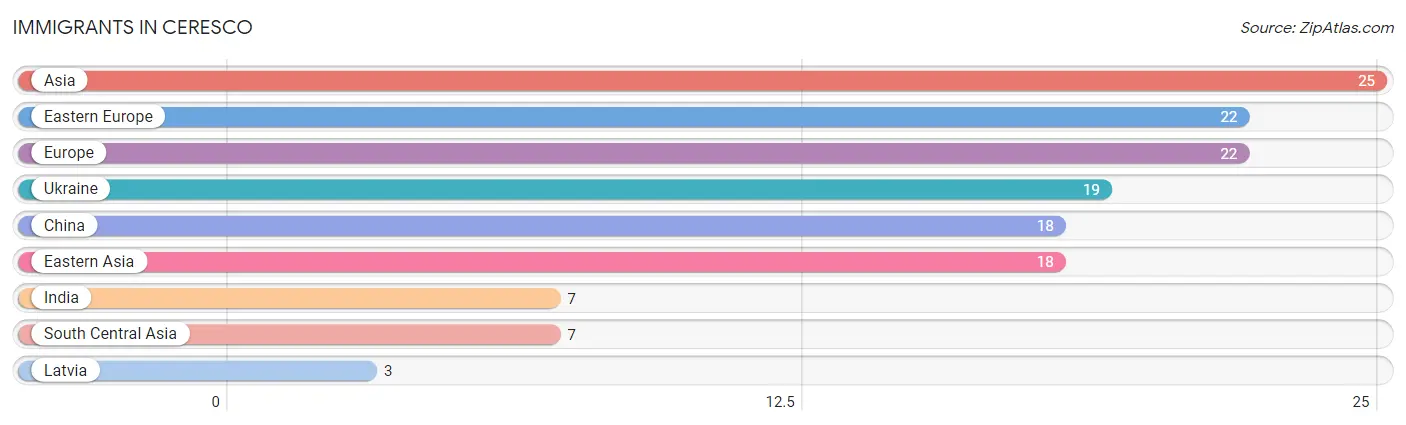
The most numerous immigrant groups reported in Ceresco came from Asia (25 | 1.8%), Eastern Europe (22 | 1.6%), Europe (22 | 1.6%), Ukraine (19 | 1.3%), and China (18 | 1.3%), together accounting for 7.5% of all Ceresco residents.
| Immigration Origin | # Population | % Population |
| Asia | 25 | 1.8% |
| China | 18 | 1.3% |
| Eastern Asia | 18 | 1.3% |
| Eastern Europe | 22 | 1.6% |
| Europe | 22 | 1.6% |
| India | 7 | 0.5% |
| Latvia | 3 | 0.2% |
| South Central Asia | 7 | 0.5% |
| Ukraine | 19 | 1.3% | View All 9 Rows |
Sex and Age in Ceresco
Sex and Age in Ceresco
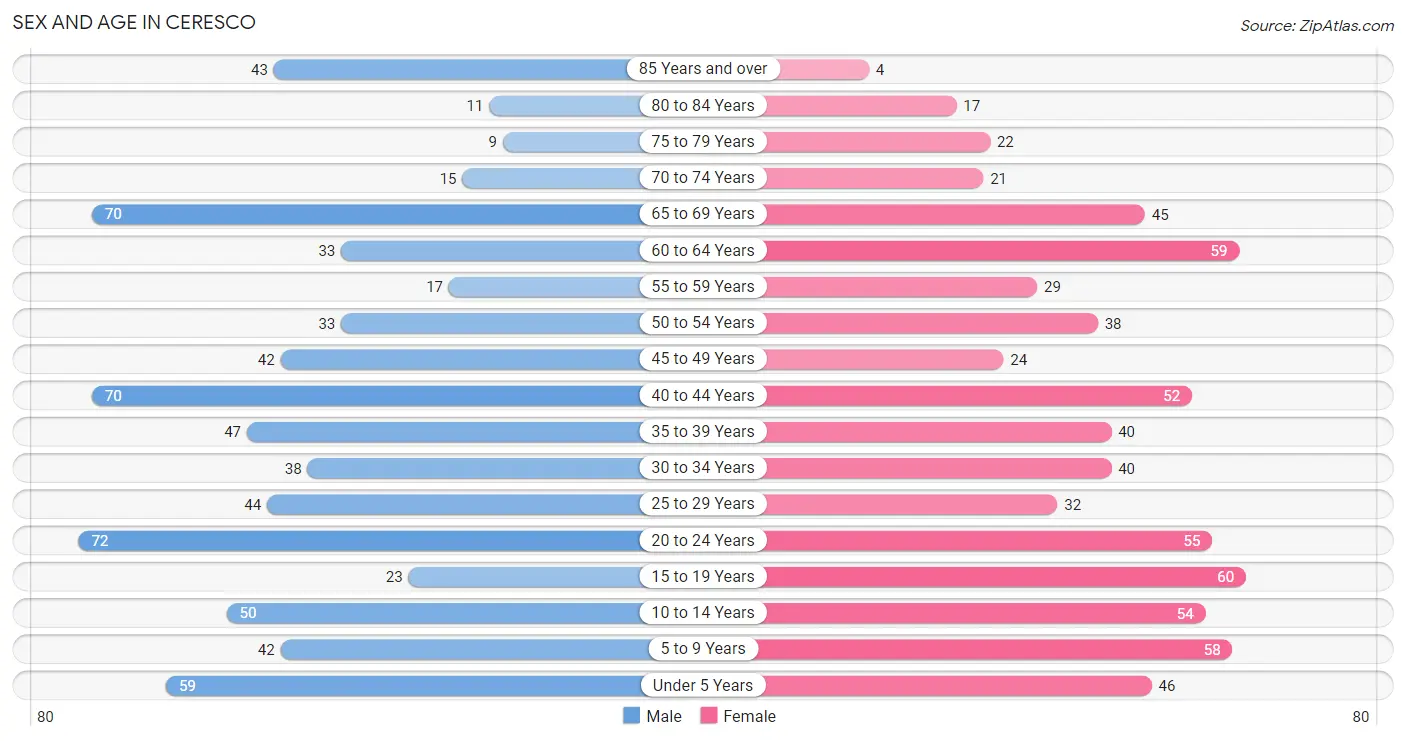
The most populous age groups in Ceresco are 20 to 24 Years (72 | 10.0%) for men and 15 to 19 Years (60 | 8.6%) for women.
| Age Bracket | Male | Female |
| Under 5 Years | 59 (8.2%) | 46 (6.6%) |
| 5 to 9 Years | 42 (5.9%) | 58 (8.3%) |
| 10 to 14 Years | 50 (7.0%) | 54 (7.8%) |
| 15 to 19 Years | 23 (3.2%) | 60 (8.6%) |
| 20 to 24 Years | 72 (10.0%) | 55 (7.9%) |
| 25 to 29 Years | 44 (6.1%) | 32 (4.6%) |
| 30 to 34 Years | 38 (5.3%) | 40 (5.8%) |
| 35 to 39 Years | 47 (6.6%) | 40 (5.8%) |
| 40 to 44 Years | 70 (9.8%) | 52 (7.5%) |
| 45 to 49 Years | 42 (5.9%) | 24 (3.5%) |
| 50 to 54 Years | 33 (4.6%) | 38 (5.5%) |
| 55 to 59 Years | 17 (2.4%) | 29 (4.2%) |
| 60 to 64 Years | 33 (4.6%) | 59 (8.5%) |
| 65 to 69 Years | 70 (9.8%) | 45 (6.5%) |
| 70 to 74 Years | 15 (2.1%) | 21 (3.0%) |
| 75 to 79 Years | 9 (1.3%) | 22 (3.2%) |
| 80 to 84 Years | 11 (1.5%) | 17 (2.4%) |
| 85 Years and over | 43 (6.0%) | 4 (0.6%) |
| Total | 718 (100.0%) | 696 (100.0%) |
Families and Households in Ceresco
Median Family Size in Ceresco
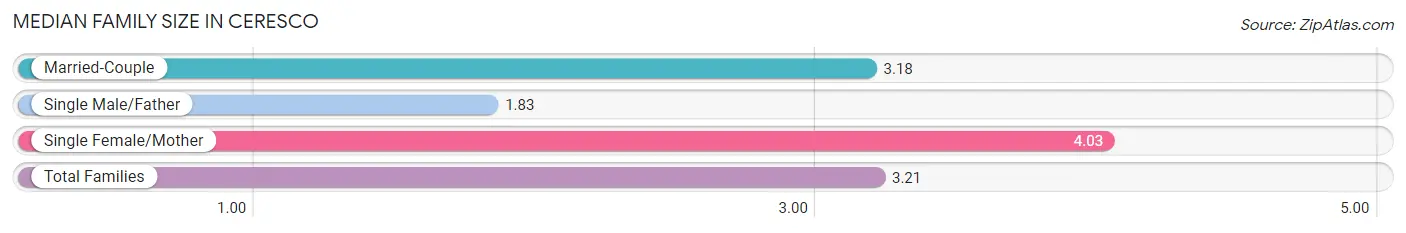
The median family size in Ceresco is 3.21 persons per family, with single female/mother families (34 | 8.8%) accounting for the largest median family size of 4.03 persons per family. On the other hand, single male/father families (12 | 3.1%) represent the smallest median family size with 1.83 persons per family.
| Family Type | # Families | Family Size |
| Married-Couple | 340 (88.1%) | 3.18 |
| Single Male/Father | 12 (3.1%) | 1.83 |
| Single Female/Mother | 34 (8.8%) | 4.03 |
| Total Families | 386 (100.0%) | 3.21 |
Median Household Size in Ceresco
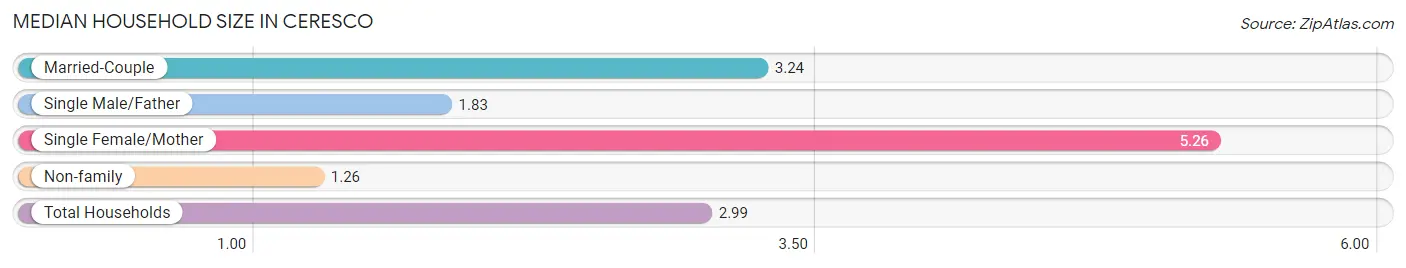
The median household size in Ceresco is 2.99 persons per household, with single female/mother households (34 | 7.2%) accounting for the largest median household size of 5.26 persons per household. non-family households (87 | 18.4%) represent the smallest median household size with 1.26 persons per household.
| Household Type | # Households | Household Size |
| Married-Couple | 340 (71.9%) | 3.24 |
| Single Male/Father | 12 (2.5%) | 1.83 |
| Single Female/Mother | 34 (7.2%) | 5.26 |
| Non-family | 87 (18.4%) | 1.26 |
| Total Households | 473 (100.0%) | 2.99 |
Household Size by Marriage Status in Ceresco
Out of a total of 473 households in Ceresco, 386 (81.6%) are family households, while 87 (18.4%) are nonfamily households. The most numerous type of family households are 2-person households, comprising 181, and the most common type of nonfamily households are 1-person households, comprising 69.
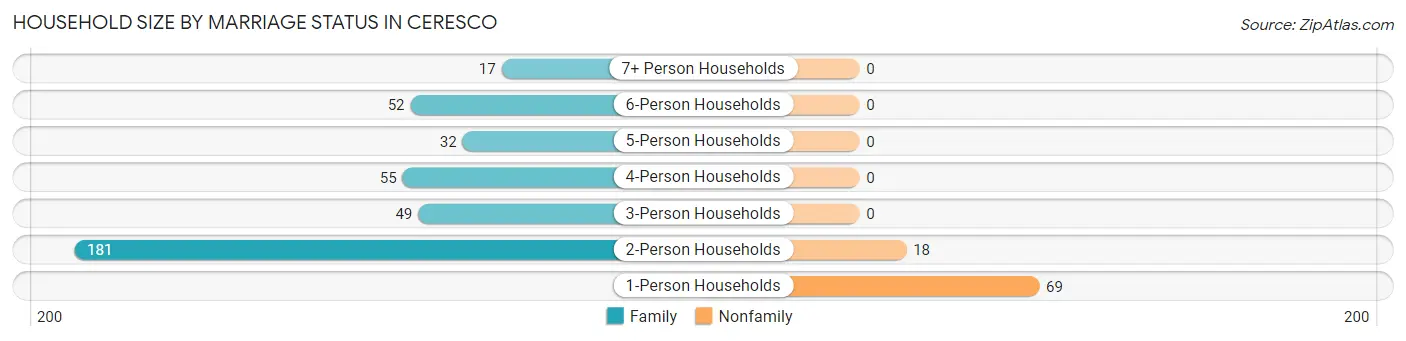
| Household Size | Family Households | Nonfamily Households |
| 1-Person Households | - | 69 (14.6%) |
| 2-Person Households | 181 (38.3%) | 18 (3.8%) |
| 3-Person Households | 49 (10.4%) | 0 (0.0%) |
| 4-Person Households | 55 (11.6%) | 0 (0.0%) |
| 5-Person Households | 32 (6.8%) | 0 (0.0%) |
| 6-Person Households | 52 (11.0%) | 0 (0.0%) |
| 7+ Person Households | 17 (3.6%) | 0 (0.0%) |
| Total | 386 (81.6%) | 87 (18.4%) |
Female Fertility in Ceresco
Fertility by Age in Ceresco
Average fertility rate in Ceresco is 131.0 births per 1,000 women. Women in the age bracket of 20 to 34 years have the highest fertility rate with 260.0 births per 1,000 women. Women in the age bracket of 20 to 34 years acount for 80.5% of all women with births.
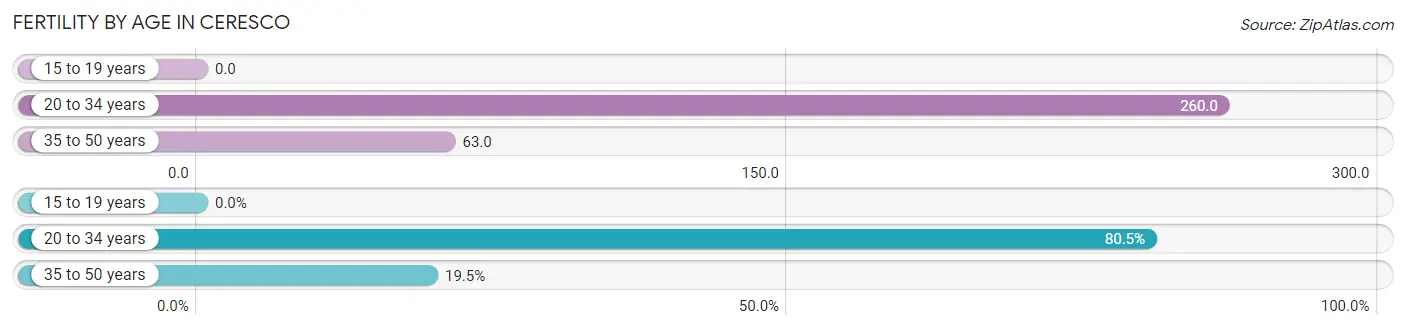
| Age Bracket | Women with Births | Births / 1,000 Women |
| 15 to 19 years | 0 (0.0%) | 0.0 |
| 20 to 34 years | 33 (80.5%) | 260.0 |
| 35 to 50 years | 8 (19.5%) | 63.0 |
| Total | 41 (100.0%) | 131.0 |
Fertility by Age by Marriage Status in Ceresco
48.8% of women with births (41) in Ceresco are married. The highest percentage of unmarried women with births falls into 35 to 50 years age bracket with 62.5% of them unmarried at the time of birth, while the lowest percentage of unmarried women with births belong to 20 to 34 years age bracket with 48.5% of them unmarried.
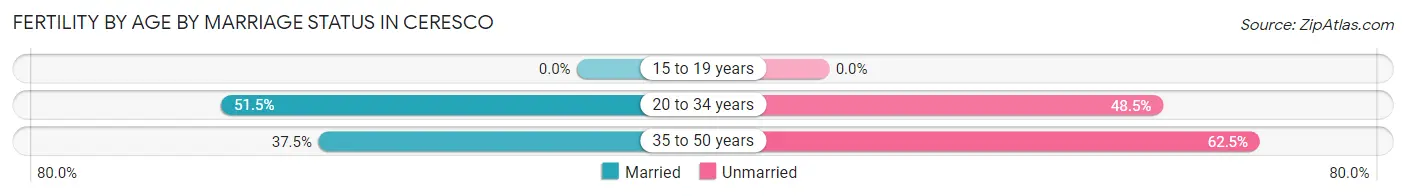
| Age Bracket | Married | Unmarried |
| 15 to 19 years | 0 (0.0%) | 0 (0.0%) |
| 20 to 34 years | 17 (51.5%) | 16 (48.5%) |
| 35 to 50 years | 3 (37.5%) | 5 (62.5%) |
| Total | 20 (48.8%) | 21 (51.2%) |
Fertility by Education in Ceresco
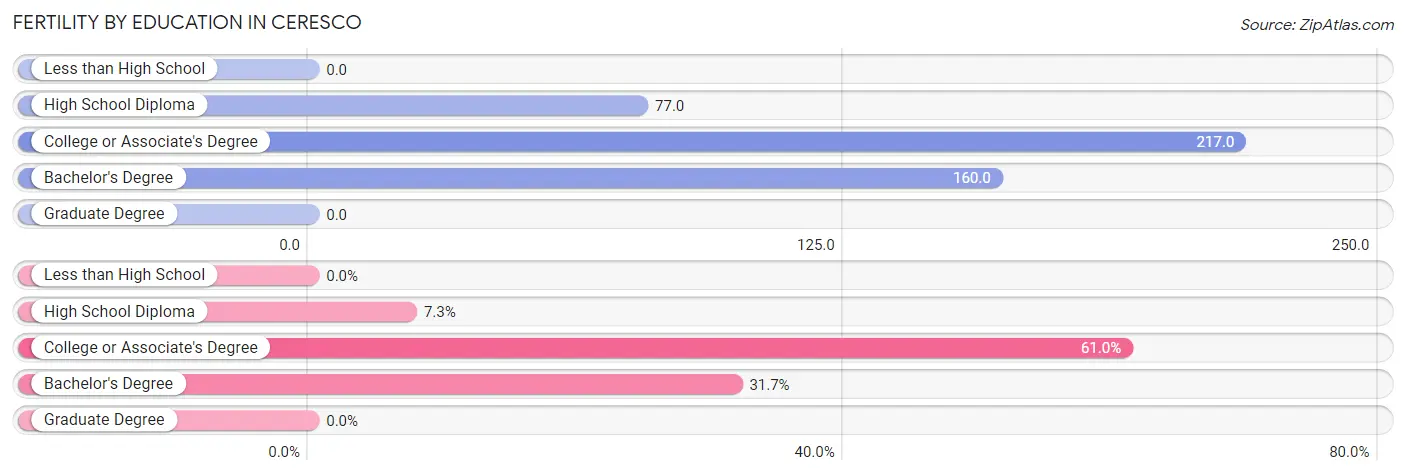
| Educational Attainment | Women with Births | Births / 1,000 Women |
| Less than High School | 0 (0.0%) | 0.0 |
| High School Diploma | 3 (7.3%) | 77.0 |
| College or Associate's Degree | 25 (61.0%) | 217.0 |
| Bachelor's Degree | 13 (31.7%) | 160.0 |
| Graduate Degree | 0 (0.0%) | 0.0 |
| Total | 41 (100.0%) | 131.0 |
Fertility by Education by Marriage Status in Ceresco
51.2% of women with births in Ceresco are unmarried. Women with the educational attainment of high school diploma are most likely to be married with 100.0% of them married at childbirth, while women with the educational attainment of college or associate's degree are least likely to be married with 64.0% of them unmarried at childbirth.
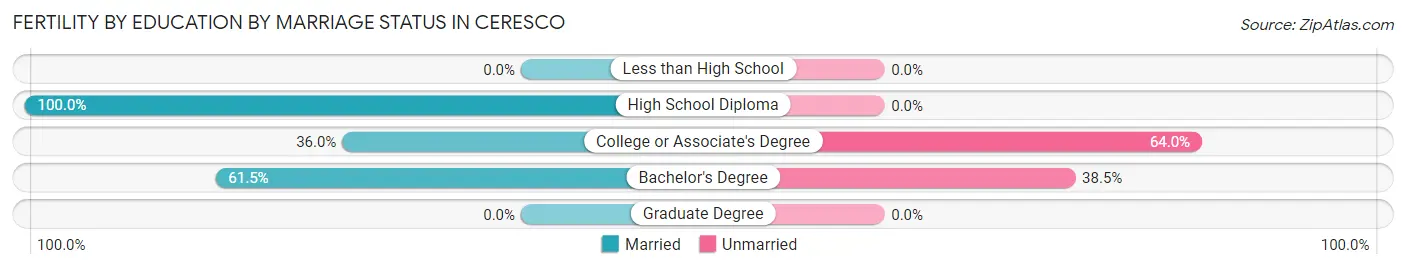
| Educational Attainment | Married | Unmarried |
| Less than High School | 0 (0.0%) | 0 (0.0%) |
| High School Diploma | 3 (100.0%) | 0 (0.0%) |
| College or Associate's Degree | 9 (36.0%) | 16 (64.0%) |
| Bachelor's Degree | 8 (61.5%) | 5 (38.5%) |
| Graduate Degree | 0 (0.0%) | 0 (0.0%) |
| Total | 20 (48.8%) | 21 (51.2%) |
Employment Characteristics in Ceresco
Employment by Class of Employer in Ceresco
Among the 720 employed individuals in Ceresco, private company employees (475 | 66.0%), local government employees (73 | 10.1%), and not-for-profit organizations (63 | 8.7%) make up the most common classes of employment.
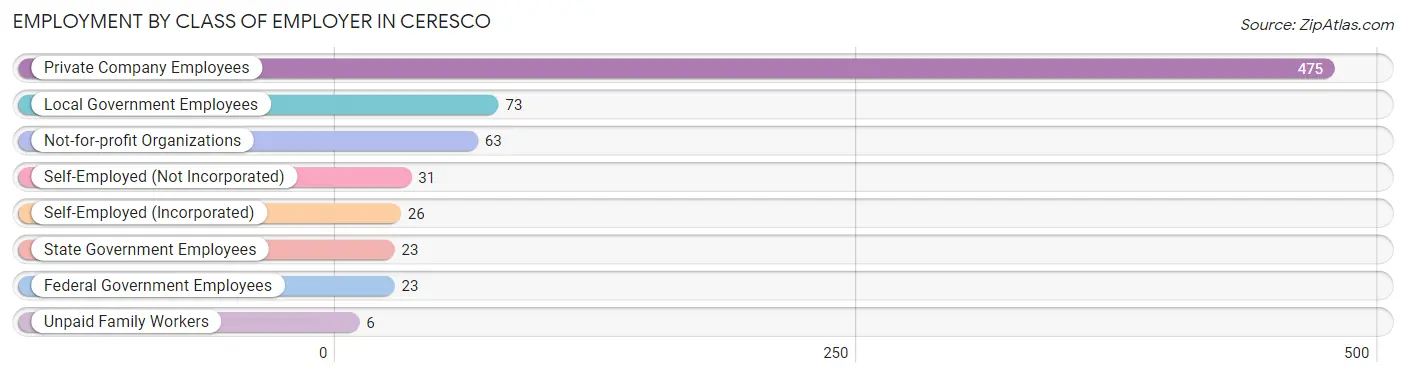
| Employer Class | # Employees | % Employees |
| Private Company Employees | 475 | 66.0% |
| Self-Employed (Incorporated) | 26 | 3.6% |
| Self-Employed (Not Incorporated) | 31 | 4.3% |
| Not-for-profit Organizations | 63 | 8.7% |
| Local Government Employees | 73 | 10.1% |
| State Government Employees | 23 | 3.2% |
| Federal Government Employees | 23 | 3.2% |
| Unpaid Family Workers | 6 | 0.8% |
| Total | 720 | 100.0% |
Employment Status by Age in Ceresco
According to the labor force statistics for Ceresco, out of the total population over 16 years of age (1,103), 68.0% or 750 individuals are in the labor force, with 2.7% or 20 of them unemployed. The age group with the highest labor force participation rate is 20 to 24 years, with 100.0% or 127 individuals in the labor force. Within the labor force, the 16 to 19 years age range has the highest percentage of unemployed individuals, with 63.6% or 14 of them being unemployed.
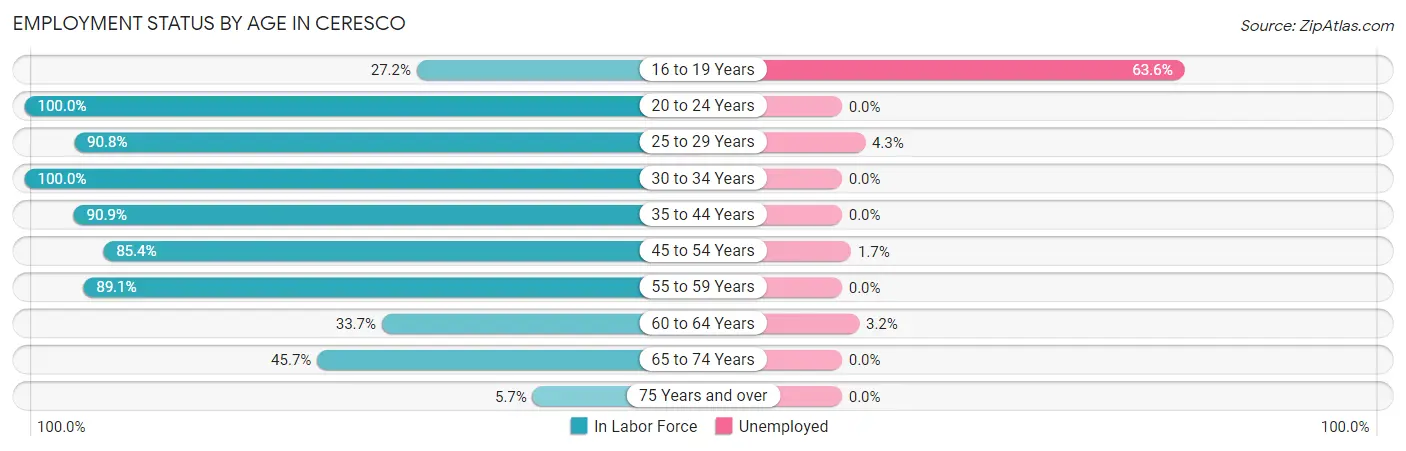
| Age Bracket | In Labor Force | Unemployed |
| 16 to 19 Years | 22 (27.2%) | 14 (63.6%) |
| 20 to 24 Years | 127 (100.0%) | 0 (0.0%) |
| 25 to 29 Years | 69 (90.8%) | 3 (4.3%) |
| 30 to 34 Years | 78 (100.0%) | 0 (0.0%) |
| 35 to 44 Years | 190 (90.9%) | 0 (0.0%) |
| 45 to 54 Years | 117 (85.4%) | 2 (1.7%) |
| 55 to 59 Years | 41 (89.1%) | 0 (0.0%) |
| 60 to 64 Years | 31 (33.7%) | 1 (3.2%) |
| 65 to 74 Years | 69 (45.7%) | 0 (0.0%) |
| 75 Years and over | 6 (5.7%) | 0 (0.0%) |
| Total | 750 (68.0%) | 20 (2.7%) |
Employment Status by Educational Attainment in Ceresco
According to labor force statistics for Ceresco, 82.4% of individuals (526) out of the total population between 25 and 64 years of age (638) are in the labor force, with 1.1% or 6 of them being unemployed. The group with the highest labor force participation rate are those with the educational attainment of less than high school, with 100.0% or 6 individuals in the labor force. Within the labor force, individuals with bachelor's degree or higher education have the highest percentage of unemployment, with 2.9% or 5 of them being unemployed.
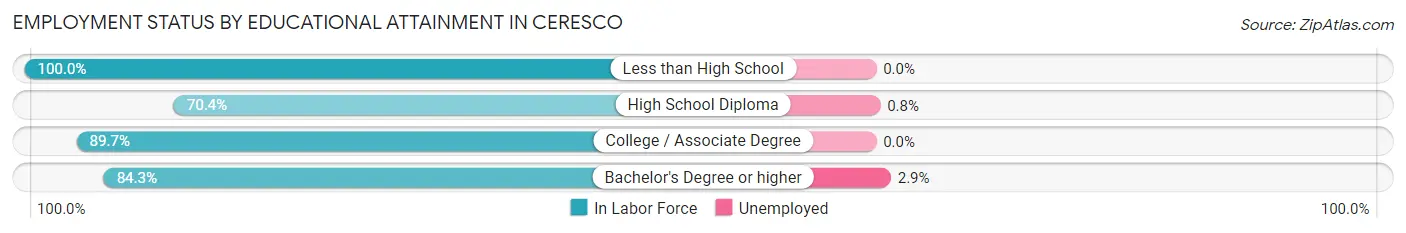
| Educational Attainment | In Labor Force | Unemployed |
| Less than High School | 6 (100.0%) | 0 (0.0%) |
| High School Diploma | 131 (70.4%) | 1 (0.8%) |
| College / Associate Degree | 217 (89.7%) | 0 (0.0%) |
| Bachelor's Degree or higher | 172 (84.3%) | 6 (2.9%) |
| Total | 526 (82.4%) | 7 (1.1%) |
Employment Occupations by Sex in Ceresco
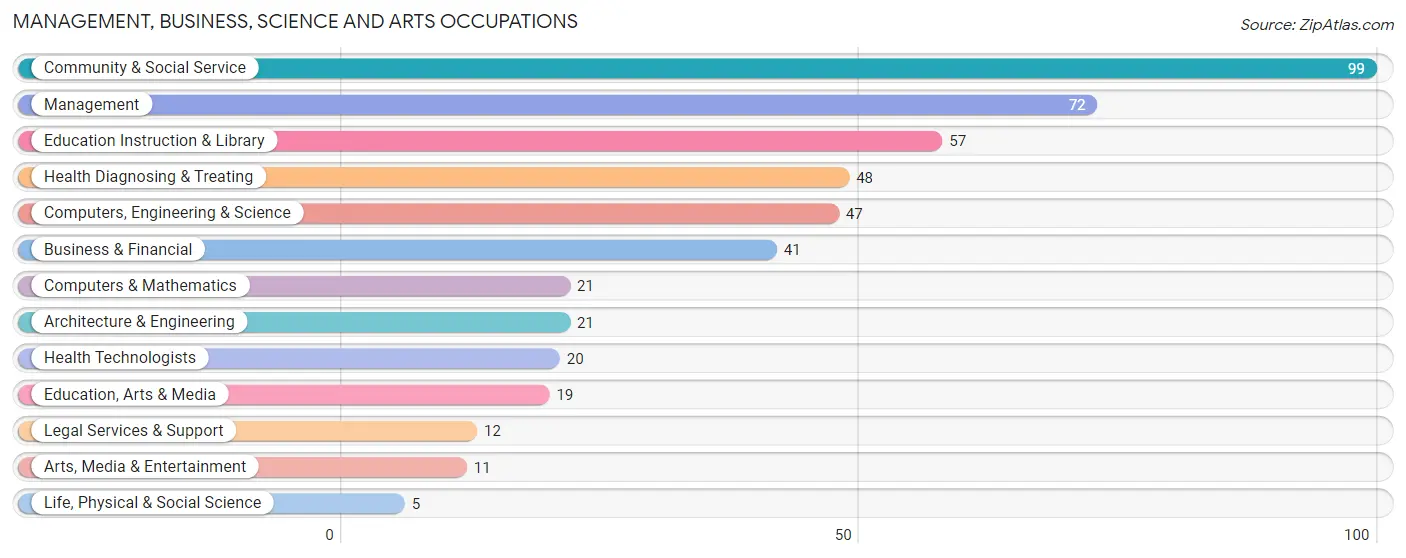
Management, Business, Science and Arts Occupations
The most common Management, Business, Science and Arts occupations in Ceresco are Community & Social Service (99 | 13.6%), Management (72 | 9.9%), Education Instruction & Library (57 | 7.8%), Health Diagnosing & Treating (48 | 6.6%), and Computers, Engineering & Science (47 | 6.4%).
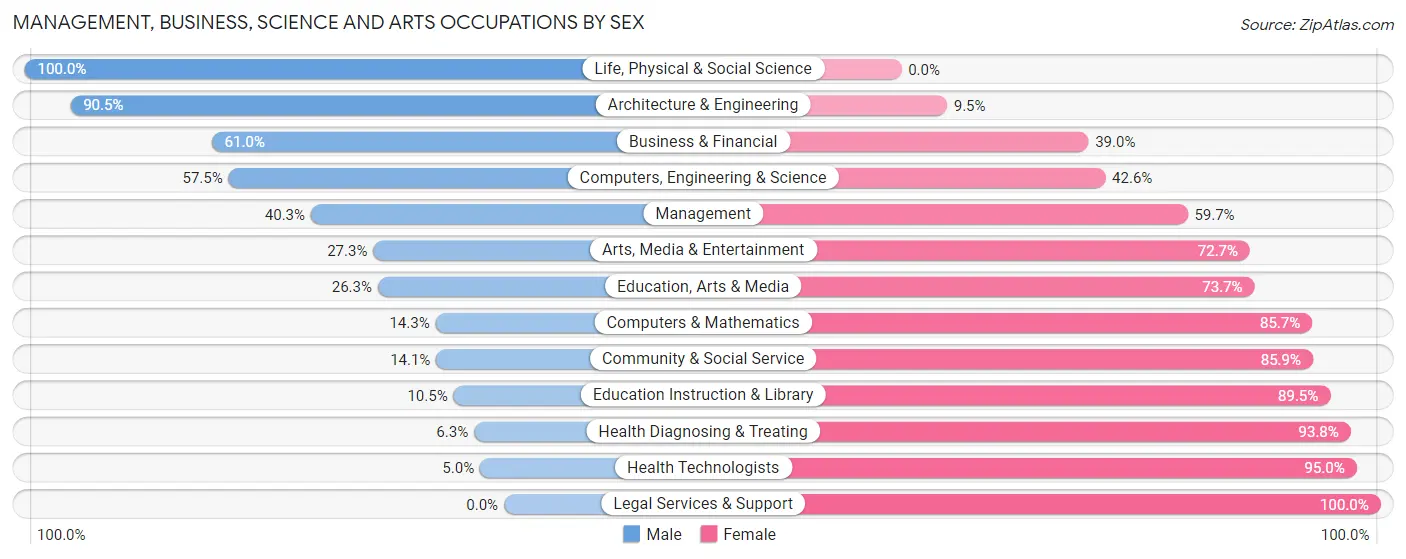
Management, Business, Science and Arts Occupations by Sex
Within the Management, Business, Science and Arts occupations in Ceresco, the most male-oriented occupations are Life, Physical & Social Science (100.0%), Architecture & Engineering (90.5%), and Business & Financial (61.0%), while the most female-oriented occupations are Legal Services & Support (100.0%), Health Technologists (95.0%), and Health Diagnosing & Treating (93.8%).
| Occupation | Male | Female |
| Management | 29 (40.3%) | 43 (59.7%) |
| Business & Financial | 25 (61.0%) | 16 (39.0%) |
| Computers, Engineering & Science | 27 (57.5%) | 20 (42.5%) |
| Computers & Mathematics | 3 (14.3%) | 18 (85.7%) |
| Architecture & Engineering | 19 (90.5%) | 2 (9.5%) |
| Life, Physical & Social Science | 5 (100.0%) | 0 (0.0%) |
| Community & Social Service | 14 (14.1%) | 85 (85.9%) |
| Education, Arts & Media | 5 (26.3%) | 14 (73.7%) |
| Legal Services & Support | 0 (0.0%) | 12 (100.0%) |
| Education Instruction & Library | 6 (10.5%) | 51 (89.5%) |
| Arts, Media & Entertainment | 3 (27.3%) | 8 (72.7%) |
| Health Diagnosing & Treating | 3 (6.2%) | 45 (93.8%) |
| Health Technologists | 1 (5.0%) | 19 (95.0%) |
| Total (Category) | 98 (31.9%) | 209 (68.1%) |
| Total (Overall) | 408 (55.9%) | 322 (44.1%) |
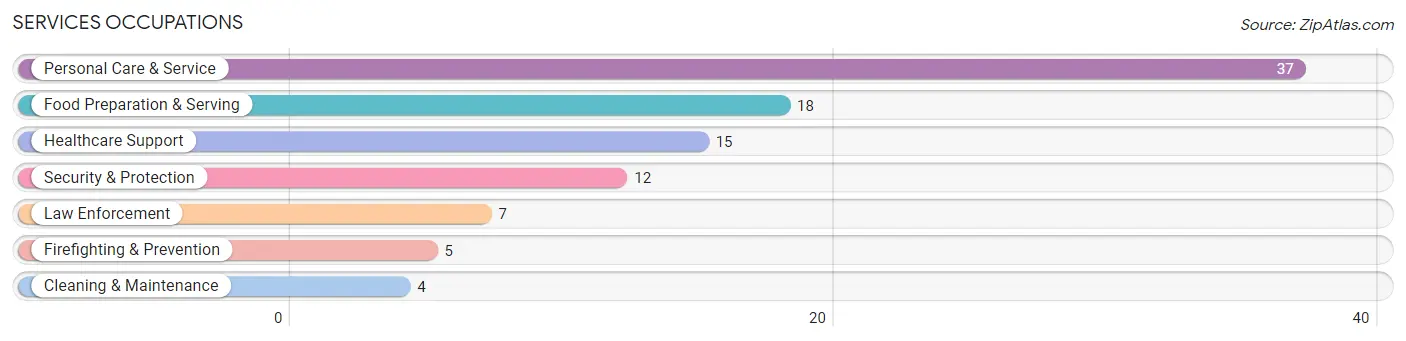
Services Occupations
The most common Services occupations in Ceresco are Personal Care & Service (37 | 5.1%), Food Preparation & Serving (18 | 2.5%), Healthcare Support (15 | 2.1%), Security & Protection (12 | 1.6%), and Law Enforcement (7 | 1.0%).
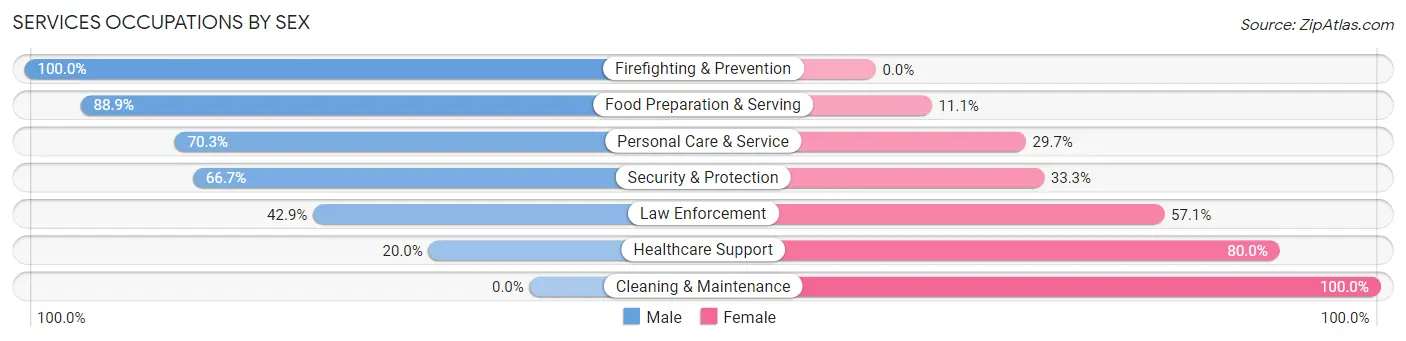
Services Occupations by Sex
Within the Services occupations in Ceresco, the most male-oriented occupations are Firefighting & Prevention (100.0%), Food Preparation & Serving (88.9%), and Personal Care & Service (70.3%), while the most female-oriented occupations are Cleaning & Maintenance (100.0%), Healthcare Support (80.0%), and Law Enforcement (57.1%).
| Occupation | Male | Female |
| Healthcare Support | 3 (20.0%) | 12 (80.0%) |
| Security & Protection | 8 (66.7%) | 4 (33.3%) |
| Firefighting & Prevention | 5 (100.0%) | 0 (0.0%) |
| Law Enforcement | 3 (42.9%) | 4 (57.1%) |
| Food Preparation & Serving | 16 (88.9%) | 2 (11.1%) |
| Cleaning & Maintenance | 0 (0.0%) | 4 (100.0%) |
| Personal Care & Service | 26 (70.3%) | 11 (29.7%) |
| Total (Category) | 53 (61.6%) | 33 (38.4%) |
| Total (Overall) | 408 (55.9%) | 322 (44.1%) |
Sales and Office Occupations
The most common Sales and Office occupations in Ceresco are Office & Administration (64 | 8.8%), and Sales & Related (49 | 6.7%).
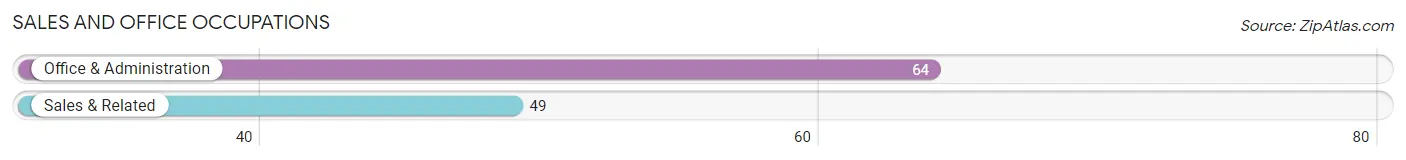
Sales and Office Occupations by Sex
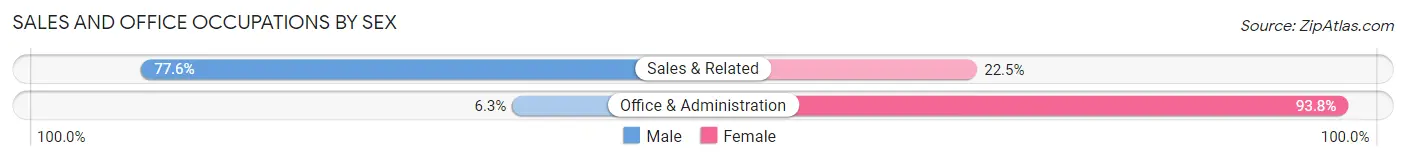
| Occupation | Male | Female |
| Sales & Related | 38 (77.5%) | 11 (22.5%) |
| Office & Administration | 4 (6.2%) | 60 (93.8%) |
| Total (Category) | 42 (37.2%) | 71 (62.8%) |
| Total (Overall) | 408 (55.9%) | 322 (44.1%) |
Natural Resources, Construction and Maintenance Occupations
The most common Natural Resources, Construction and Maintenance occupations in Ceresco are Installation, Maintenance & Repair (43 | 5.9%), and Construction & Extraction (42 | 5.8%).
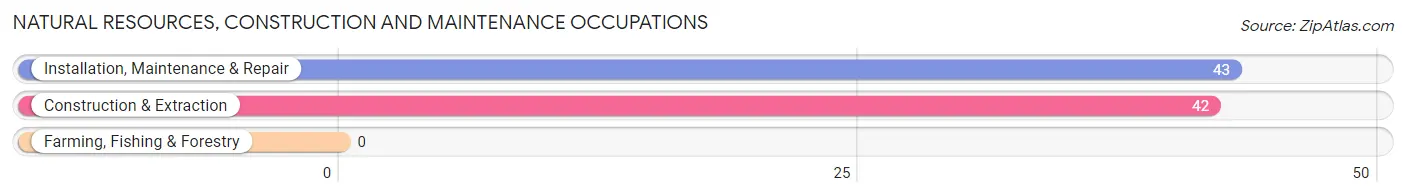
Natural Resources, Construction and Maintenance Occupations by Sex
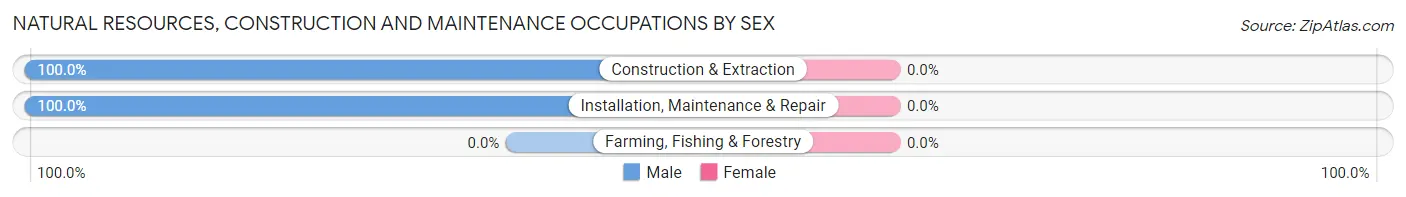
| Occupation | Male | Female |
| Farming, Fishing & Forestry | 0 (0.0%) | 0 (0.0%) |
| Construction & Extraction | 42 (100.0%) | 0 (0.0%) |
| Installation, Maintenance & Repair | 43 (100.0%) | 0 (0.0%) |
| Total (Category) | 85 (100.0%) | 0 (0.0%) |
| Total (Overall) | 408 (55.9%) | 322 (44.1%) |
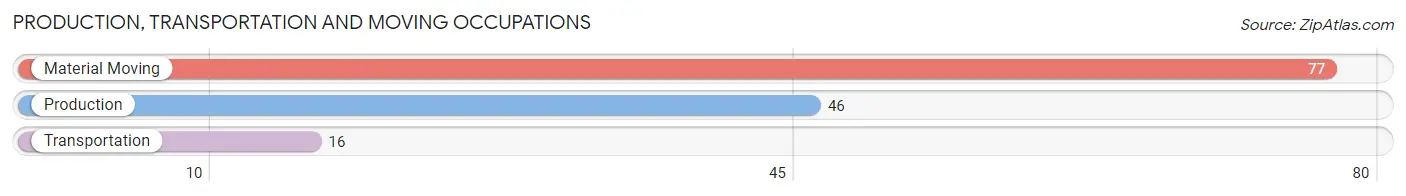
Production, Transportation and Moving Occupations
The most common Production, Transportation and Moving occupations in Ceresco are Material Moving (77 | 10.5%), Production (46 | 6.3%), and Transportation (16 | 2.2%).
Production, Transportation and Moving Occupations by Sex
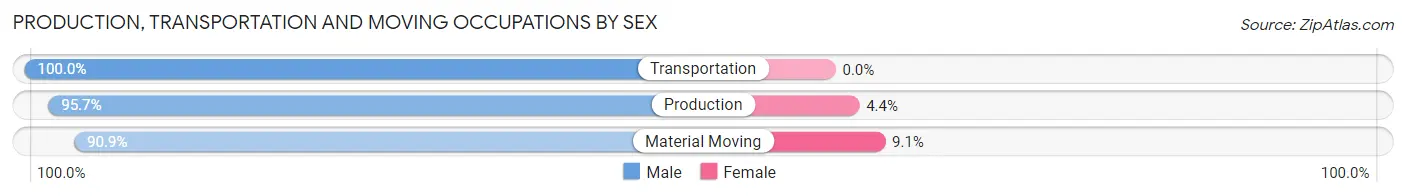
| Occupation | Male | Female |
| Production | 44 (95.7%) | 2 (4.3%) |
| Transportation | 16 (100.0%) | 0 (0.0%) |
| Material Moving | 70 (90.9%) | 7 (9.1%) |
| Total (Category) | 130 (93.5%) | 9 (6.5%) |
| Total (Overall) | 408 (55.9%) | 322 (44.1%) |
Employment Industries by Sex in Ceresco
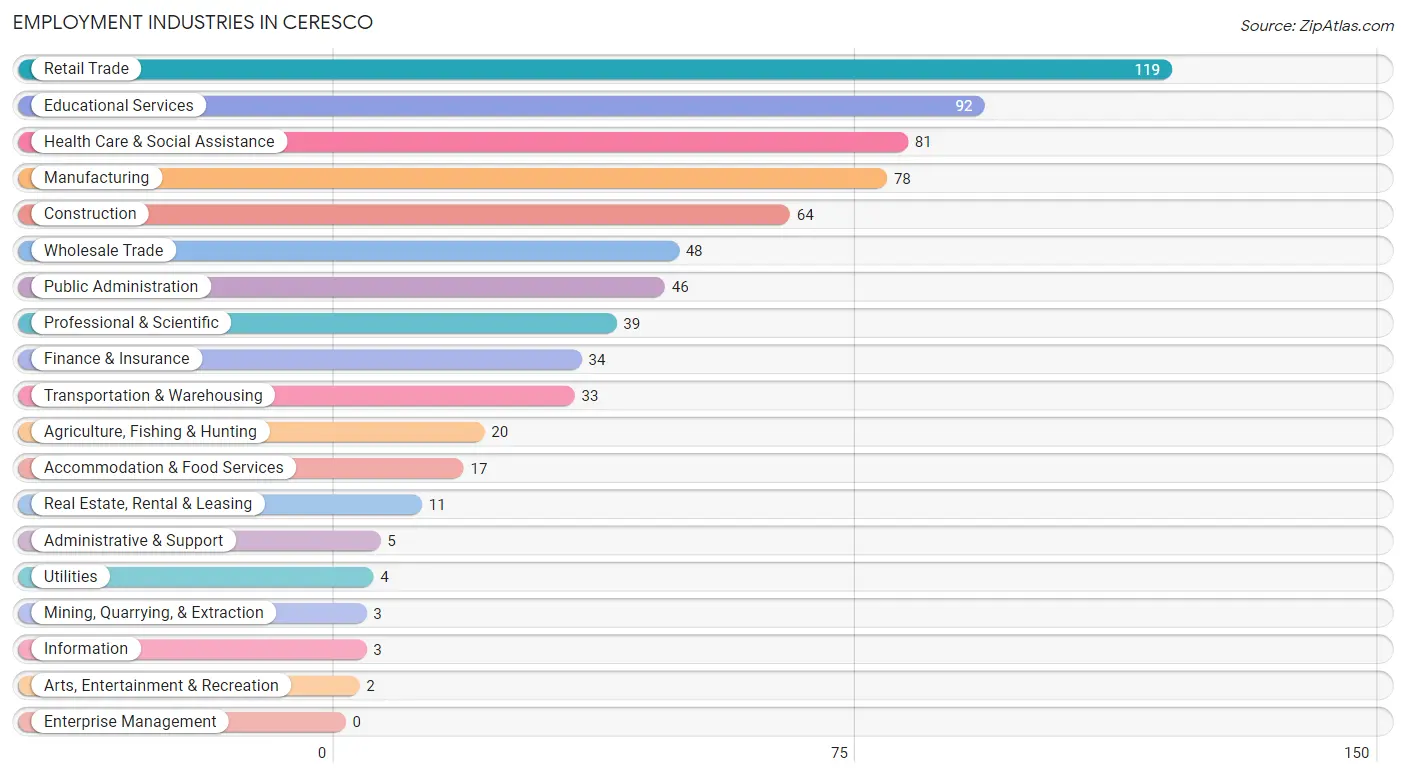
Employment Industries in Ceresco
The major employment industries in Ceresco include Retail Trade (119 | 16.3%), Educational Services (92 | 12.6%), Health Care & Social Assistance (81 | 11.1%), Manufacturing (78 | 10.7%), and Construction (64 | 8.8%).
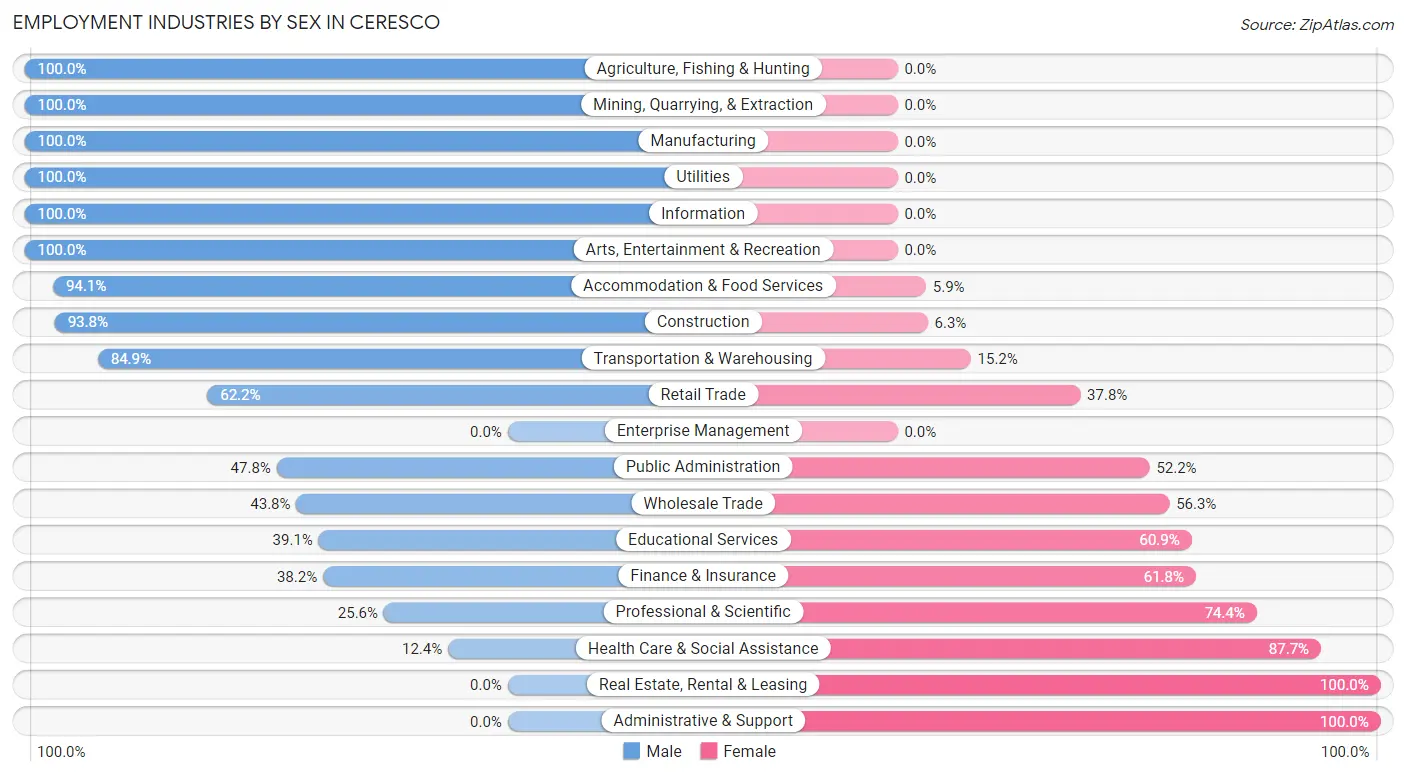
Employment Industries by Sex in Ceresco
The Ceresco industries that see more men than women are Agriculture, Fishing & Hunting (100.0%), Mining, Quarrying, & Extraction (100.0%), and Manufacturing (100.0%), whereas the industries that tend to have a higher number of women are Real Estate, Rental & Leasing (100.0%), Administrative & Support (100.0%), and Health Care & Social Assistance (87.6%).
| Industry | Male | Female |
| Agriculture, Fishing & Hunting | 20 (100.0%) | 0 (0.0%) |
| Mining, Quarrying, & Extraction | 3 (100.0%) | 0 (0.0%) |
| Construction | 60 (93.8%) | 4 (6.2%) |
| Manufacturing | 78 (100.0%) | 0 (0.0%) |
| Wholesale Trade | 21 (43.8%) | 27 (56.2%) |
| Retail Trade | 74 (62.2%) | 45 (37.8%) |
| Transportation & Warehousing | 28 (84.9%) | 5 (15.1%) |
| Utilities | 4 (100.0%) | 0 (0.0%) |
| Information | 3 (100.0%) | 0 (0.0%) |
| Finance & Insurance | 13 (38.2%) | 21 (61.8%) |
| Real Estate, Rental & Leasing | 0 (0.0%) | 11 (100.0%) |
| Professional & Scientific | 10 (25.6%) | 29 (74.4%) |
| Enterprise Management | 0 (0.0%) | 0 (0.0%) |
| Administrative & Support | 0 (0.0%) | 5 (100.0%) |
| Educational Services | 36 (39.1%) | 56 (60.9%) |
| Health Care & Social Assistance | 10 (12.3%) | 71 (87.6%) |
| Arts, Entertainment & Recreation | 2 (100.0%) | 0 (0.0%) |
| Accommodation & Food Services | 16 (94.1%) | 1 (5.9%) |
| Public Administration | 22 (47.8%) | 24 (52.2%) |
| Total | 408 (55.9%) | 322 (44.1%) |
Education in Ceresco
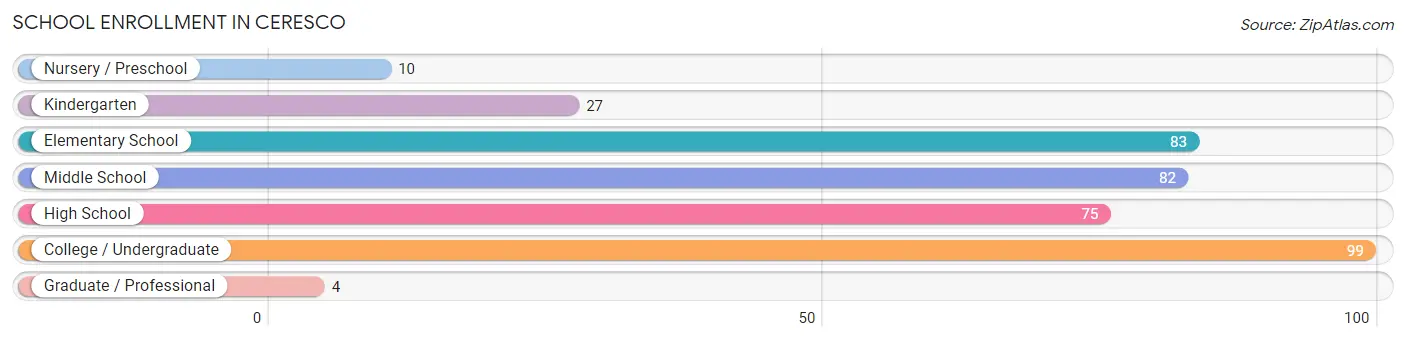
School Enrollment in Ceresco
The most common levels of schooling among the 380 students in Ceresco are college / undergraduate (99 | 26.1%), elementary school (83 | 21.8%), and middle school (82 | 21.6%).
| School Level | # Students | % Students |
| Nursery / Preschool | 10 | 2.6% |
| Kindergarten | 27 | 7.1% |
| Elementary School | 83 | 21.8% |
| Middle School | 82 | 21.6% |
| High School | 75 | 19.7% |
| College / Undergraduate | 99 | 26.1% |
| Graduate / Professional | 4 | 1.1% |
| Total | 380 | 100.0% |
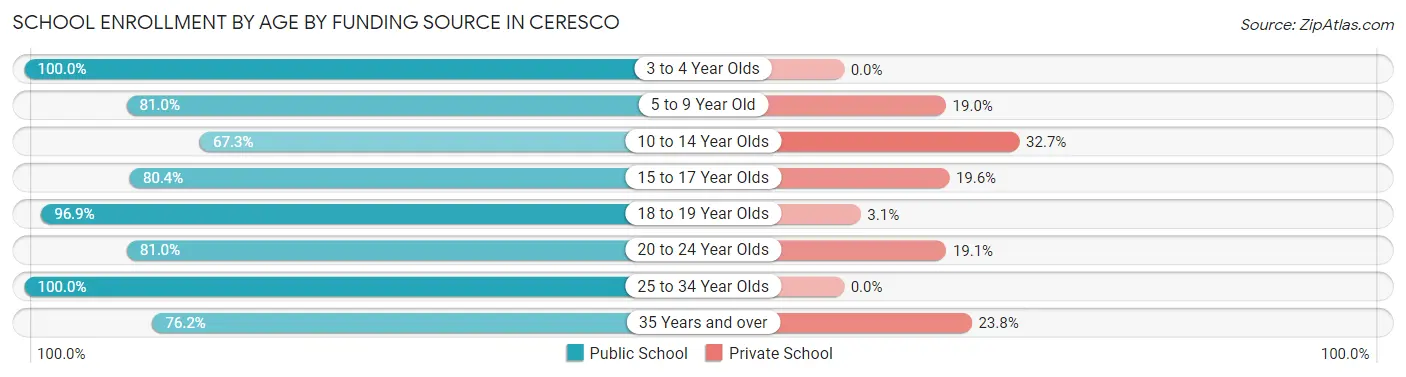
School Enrollment by Age by Funding Source in Ceresco
Out of a total of 380 students who are enrolled in schools in Ceresco, 81 (21.3%) attend a private institution, while the remaining 299 (78.7%) are enrolled in public schools. The age group of 10 to 14 year olds has the highest likelihood of being enrolled in private schools, with 34 (32.7% in the age bracket) enrolled. Conversely, the age group of 3 to 4 year olds has the lowest likelihood of being enrolled in a private school, with 5 (100.0% in the age bracket) attending a public institution.
| Age Bracket | Public School | Private School |
| 3 to 4 Year Olds | 5 (100.0%) | 0 (0.0%) |
| 5 to 9 Year Old | 81 (81.0%) | 19 (19.0%) |
| 10 to 14 Year Olds | 70 (67.3%) | 34 (32.7%) |
| 15 to 17 Year Olds | 41 (80.4%) | 10 (19.6%) |
| 18 to 19 Year Olds | 31 (96.9%) | 1 (3.1%) |
| 20 to 24 Year Olds | 51 (80.9%) | 12 (19.1%) |
| 25 to 34 Year Olds | 4 (100.0%) | 0 (0.0%) |
| 35 Years and over | 16 (76.2%) | 5 (23.8%) |
| Total | 299 (78.7%) | 81 (21.3%) |
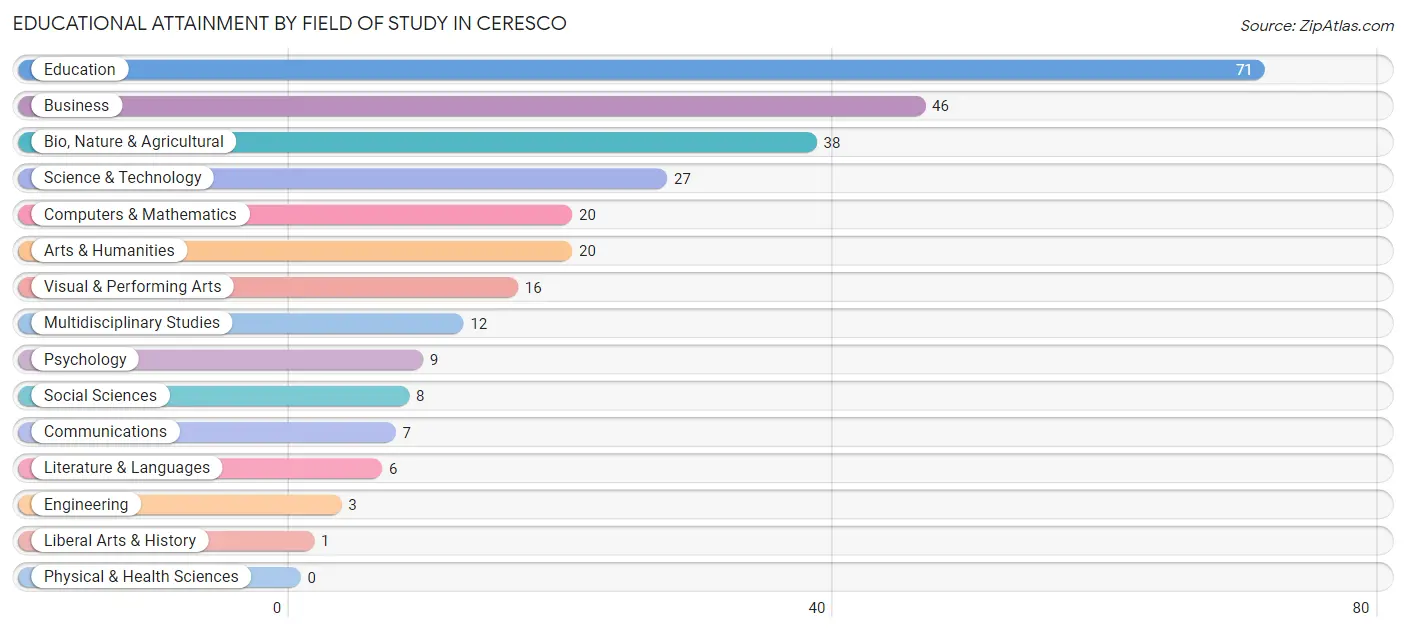
Educational Attainment by Field of Study in Ceresco
Education (71 | 25.0%), business (46 | 16.2%), bio, nature & agricultural (38 | 13.4%), science & technology (27 | 9.5%), and computers & mathematics (20 | 7.0%) are the most common fields of study among 284 individuals in Ceresco who have obtained a bachelor's degree or higher.
| Field of Study | # Graduates | % Graduates |
| Computers & Mathematics | 20 | 7.0% |
| Bio, Nature & Agricultural | 38 | 13.4% |
| Physical & Health Sciences | 0 | 0.0% |
| Psychology | 9 | 3.2% |
| Social Sciences | 8 | 2.8% |
| Engineering | 3 | 1.1% |
| Multidisciplinary Studies | 12 | 4.2% |
| Science & Technology | 27 | 9.5% |
| Business | 46 | 16.2% |
| Education | 71 | 25.0% |
| Literature & Languages | 6 | 2.1% |
| Liberal Arts & History | 1 | 0.4% |
| Visual & Performing Arts | 16 | 5.6% |
| Communications | 7 | 2.5% |
| Arts & Humanities | 20 | 7.0% |
| Total | 284 | 100.0% |
Transportation & Commute in Ceresco
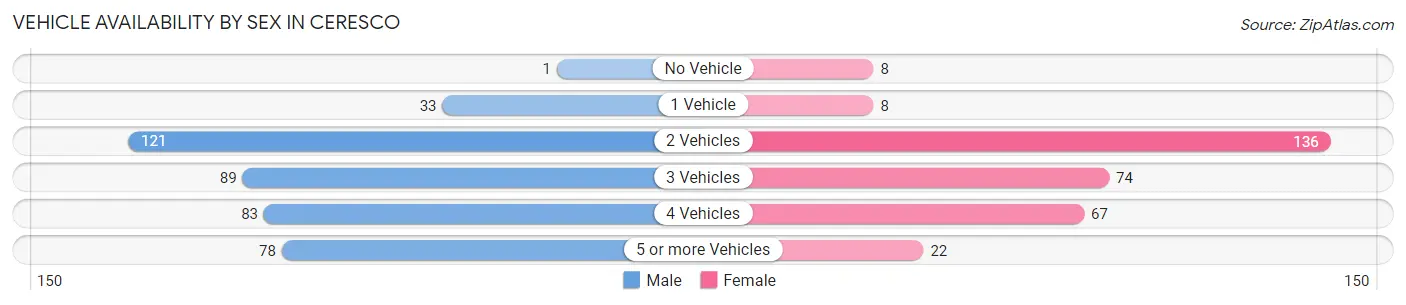
Vehicle Availability by Sex in Ceresco
The most prevalent vehicle ownership categories in Ceresco are males with 2 vehicles (121, accounting for 29.9%) and females with 2 vehicles (136, making up 38.4%).
| Vehicles Available | Male | Female |
| No Vehicle | 1 (0.3%) | 8 (2.5%) |
| 1 Vehicle | 33 (8.2%) | 8 (2.5%) |
| 2 Vehicles | 121 (29.9%) | 136 (43.2%) |
| 3 Vehicles | 89 (22.0%) | 74 (23.5%) |
| 4 Vehicles | 83 (20.5%) | 67 (21.3%) |
| 5 or more Vehicles | 78 (19.3%) | 22 (7.0%) |
| Total | 405 (100.0%) | 315 (100.0%) |
Commute Time in Ceresco
The most frequently occuring commute durations in Ceresco are 25 to 29 minutes (143 commuters, 21.8%), 30 to 34 minutes (116 commuters, 17.7%), and 35 to 39 minutes (77 commuters, 11.7%).
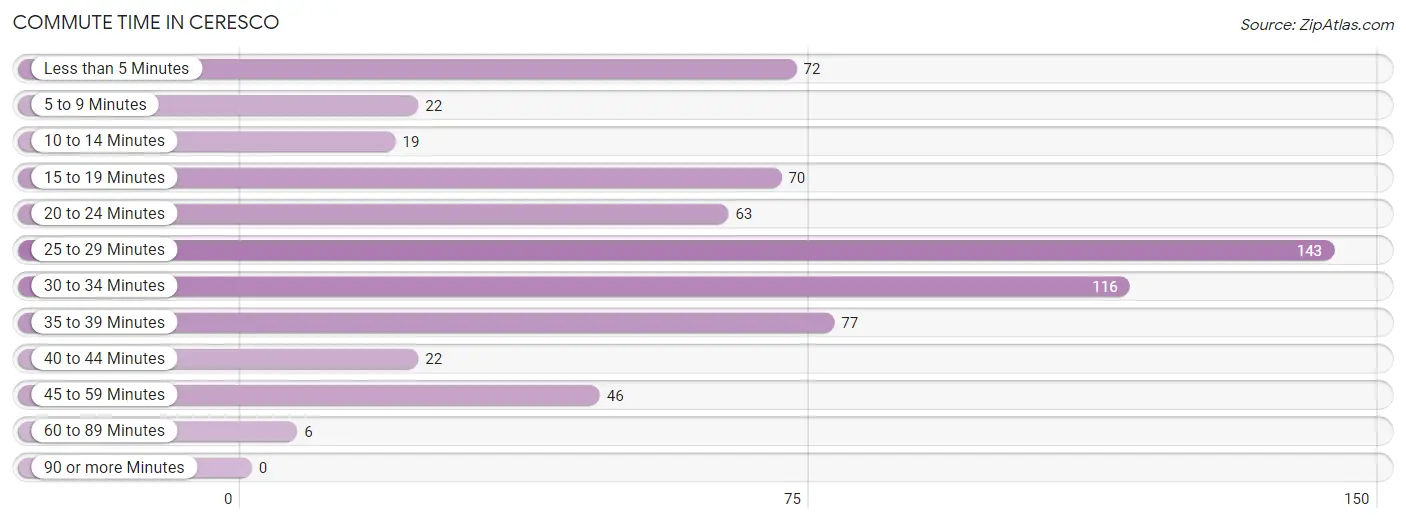
| Commute Time | # Commuters | % Commuters |
| Less than 5 Minutes | 72 | 11.0% |
| 5 to 9 Minutes | 22 | 3.4% |
| 10 to 14 Minutes | 19 | 2.9% |
| 15 to 19 Minutes | 70 | 10.7% |
| 20 to 24 Minutes | 63 | 9.6% |
| 25 to 29 Minutes | 143 | 21.8% |
| 30 to 34 Minutes | 116 | 17.7% |
| 35 to 39 Minutes | 77 | 11.7% |
| 40 to 44 Minutes | 22 | 3.4% |
| 45 to 59 Minutes | 46 | 7.0% |
| 60 to 89 Minutes | 6 | 0.9% |
| 90 or more Minutes | 0 | 0.0% |
Commute Time by Sex in Ceresco
The most common commute times in Ceresco are 25 to 29 minutes (95 commuters, 25.5%) for males and 25 to 29 minutes (48 commuters, 17.0%) for females.
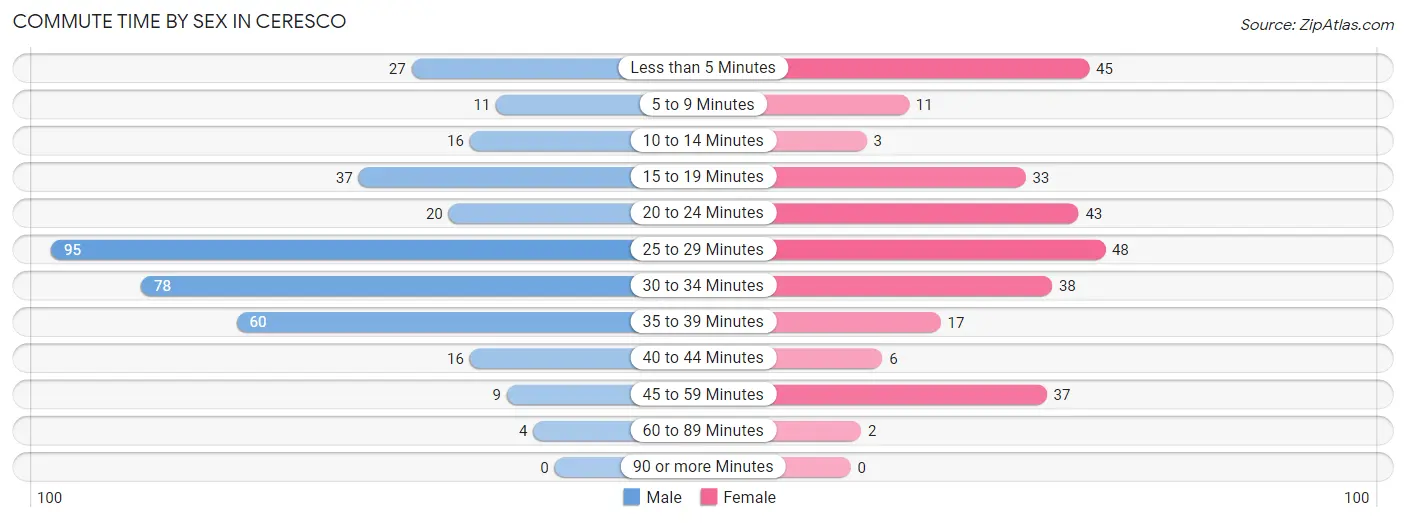
| Commute Time | Male | Female |
| Less than 5 Minutes | 27 (7.2%) | 45 (15.9%) |
| 5 to 9 Minutes | 11 (2.9%) | 11 (3.9%) |
| 10 to 14 Minutes | 16 (4.3%) | 3 (1.1%) |
| 15 to 19 Minutes | 37 (9.9%) | 33 (11.7%) |
| 20 to 24 Minutes | 20 (5.4%) | 43 (15.2%) |
| 25 to 29 Minutes | 95 (25.5%) | 48 (17.0%) |
| 30 to 34 Minutes | 78 (20.9%) | 38 (13.4%) |
| 35 to 39 Minutes | 60 (16.1%) | 17 (6.0%) |
| 40 to 44 Minutes | 16 (4.3%) | 6 (2.1%) |
| 45 to 59 Minutes | 9 (2.4%) | 37 (13.1%) |
| 60 to 89 Minutes | 4 (1.1%) | 2 (0.7%) |
| 90 or more Minutes | 0 (0.0%) | 0 (0.0%) |
Time of Departure to Work by Sex in Ceresco
The most frequent times of departure to work in Ceresco are 7:30 AM to 7:59 AM (63, 16.9%) for males and 7:00 AM to 7:29 AM (89, 31.5%) for females.
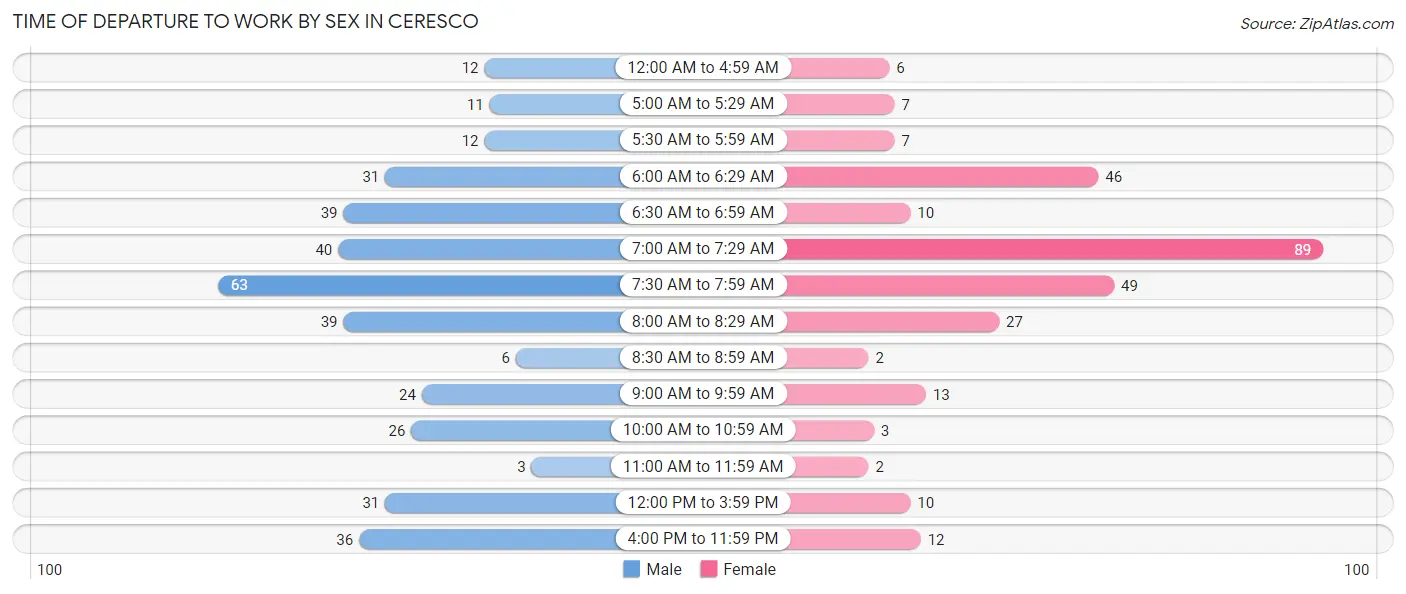
| Time of Departure | Male | Female |
| 12:00 AM to 4:59 AM | 12 (3.2%) | 6 (2.1%) |
| 5:00 AM to 5:29 AM | 11 (2.9%) | 7 (2.5%) |
| 5:30 AM to 5:59 AM | 12 (3.2%) | 7 (2.5%) |
| 6:00 AM to 6:29 AM | 31 (8.3%) | 46 (16.3%) |
| 6:30 AM to 6:59 AM | 39 (10.5%) | 10 (3.5%) |
| 7:00 AM to 7:29 AM | 40 (10.7%) | 89 (31.5%) |
| 7:30 AM to 7:59 AM | 63 (16.9%) | 49 (17.3%) |
| 8:00 AM to 8:29 AM | 39 (10.5%) | 27 (9.5%) |
| 8:30 AM to 8:59 AM | 6 (1.6%) | 2 (0.7%) |
| 9:00 AM to 9:59 AM | 24 (6.4%) | 13 (4.6%) |
| 10:00 AM to 10:59 AM | 26 (7.0%) | 3 (1.1%) |
| 11:00 AM to 11:59 AM | 3 (0.8%) | 2 (0.7%) |
| 12:00 PM to 3:59 PM | 31 (8.3%) | 10 (3.5%) |
| 4:00 PM to 11:59 PM | 36 (9.7%) | 12 (4.2%) |
| Total | 373 (100.0%) | 283 (100.0%) |
Housing Occupancy in Ceresco
Occupancy by Ownership in Ceresco
Of the total 473 dwellings in Ceresco, owner-occupied units account for 395 (83.5%), while renter-occupied units make up 78 (16.5%).
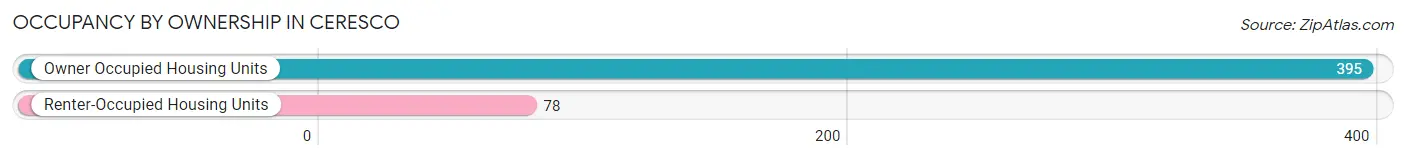
| Occupancy | # Housing Units | % Housing Units |
| Owner Occupied Housing Units | 395 | 83.5% |
| Renter-Occupied Housing Units | 78 | 16.5% |
| Total Occupied Housing Units | 473 | 100.0% |
Occupancy by Household Size in Ceresco
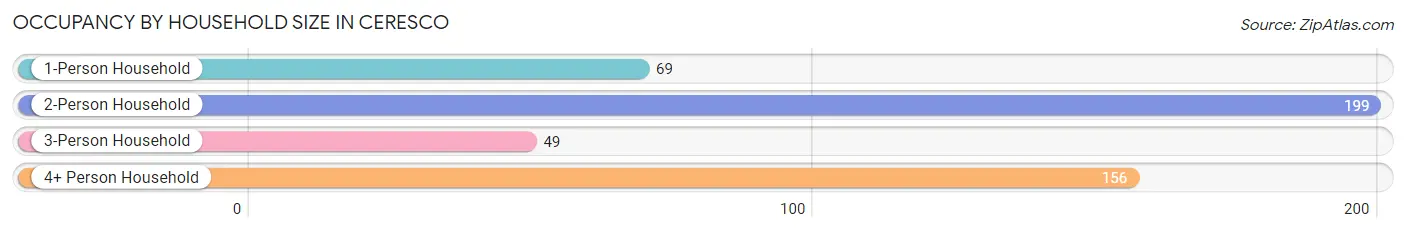
| Household Size | # Housing Units | % Housing Units |
| 1-Person Household | 69 | 14.6% |
| 2-Person Household | 199 | 42.1% |
| 3-Person Household | 49 | 10.4% |
| 4+ Person Household | 156 | 33.0% |
| Total Housing Units | 473 | 100.0% |
Occupancy by Ownership by Household Size in Ceresco
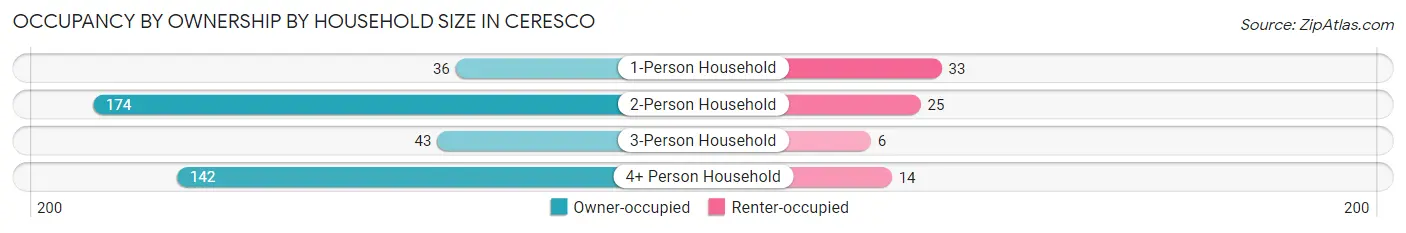
| Household Size | Owner-occupied | Renter-occupied |
| 1-Person Household | 36 (52.2%) | 33 (47.8%) |
| 2-Person Household | 174 (87.4%) | 25 (12.6%) |
| 3-Person Household | 43 (87.8%) | 6 (12.2%) |
| 4+ Person Household | 142 (91.0%) | 14 (9.0%) |
| Total Housing Units | 395 (83.5%) | 78 (16.5%) |
Occupancy by Educational Attainment in Ceresco
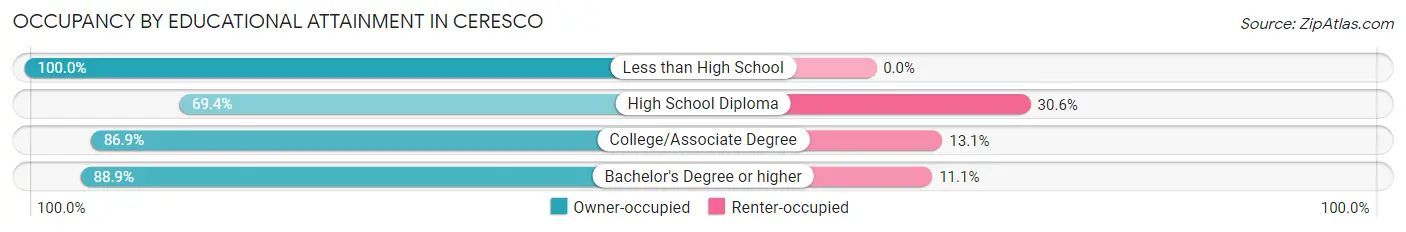
| Household Size | Owner-occupied | Renter-occupied |
| Less than High School | 6 (100.0%) | 0 (0.0%) |
| High School Diploma | 77 (69.4%) | 34 (30.6%) |
| College/Associate Degree | 192 (86.9%) | 29 (13.1%) |
| Bachelor's Degree or higher | 120 (88.9%) | 15 (11.1%) |
Occupancy by Age of Householder in Ceresco
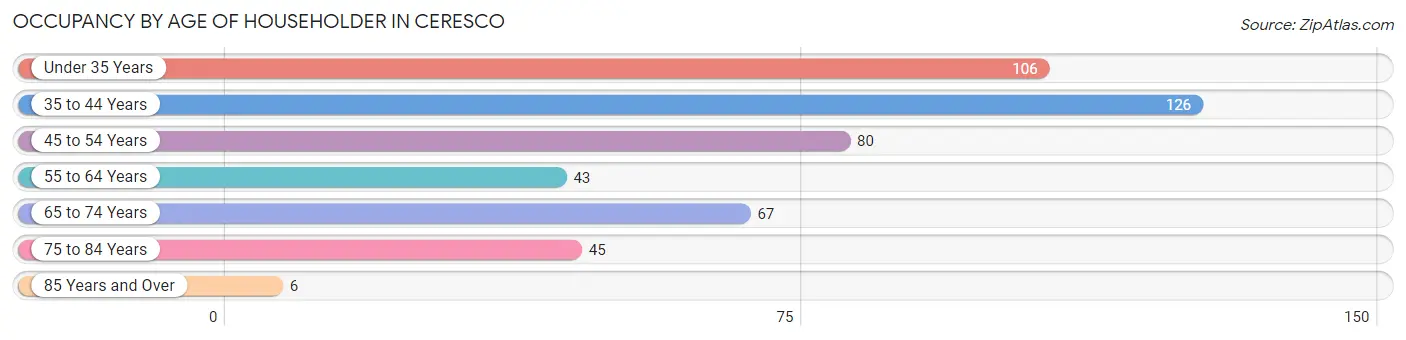
| Age Bracket | # Households | % Households |
| Under 35 Years | 106 | 22.4% |
| 35 to 44 Years | 126 | 26.6% |
| 45 to 54 Years | 80 | 16.9% |
| 55 to 64 Years | 43 | 9.1% |
| 65 to 74 Years | 67 | 14.2% |
| 75 to 84 Years | 45 | 9.5% |
| 85 Years and Over | 6 | 1.3% |
| Total | 473 | 100.0% |
Housing Finances in Ceresco
Median Income by Occupancy in Ceresco
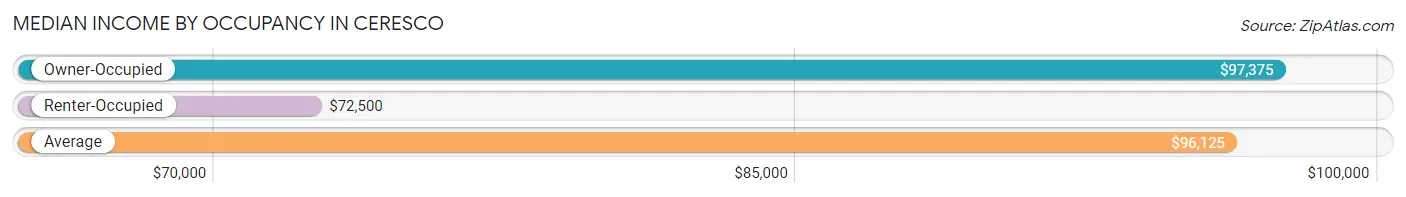
| Occupancy Type | # Households | Median Income |
| Owner-Occupied | 395 (83.5%) | $97,375 |
| Renter-Occupied | 78 (16.5%) | $72,500 |
| Average | 473 (100.0%) | $96,125 |
Occupancy by Householder Income Bracket in Ceresco
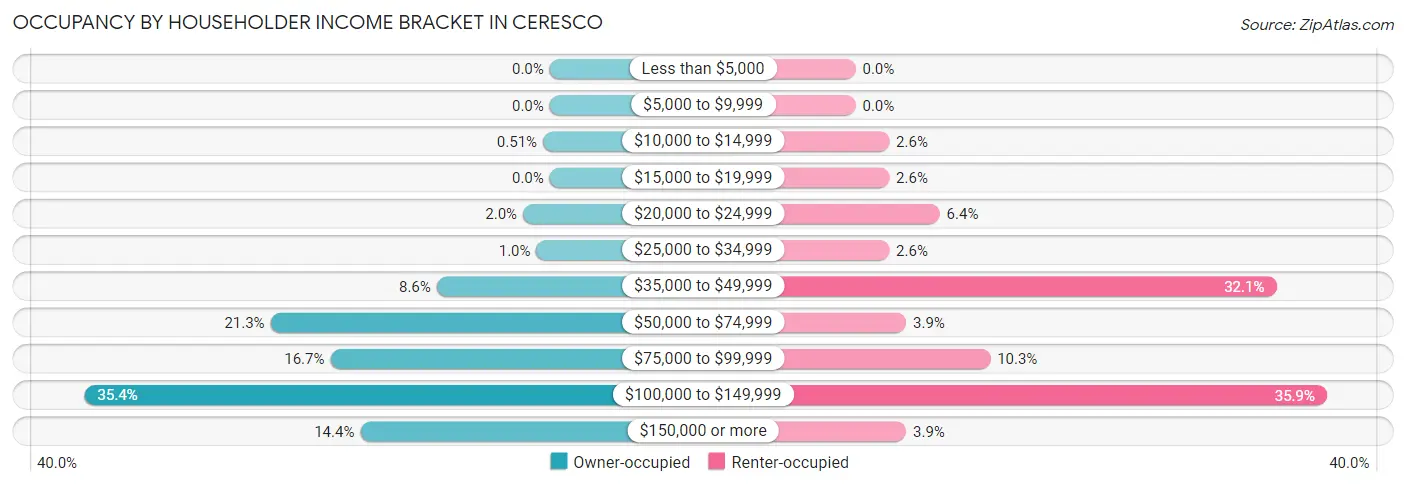
| Income Bracket | Owner-occupied | Renter-occupied |
| Less than $5,000 | 0 (0.0%) | 0 (0.0%) |
| $5,000 to $9,999 | 0 (0.0%) | 0 (0.0%) |
| $10,000 to $14,999 | 2 (0.5%) | 2 (2.6%) |
| $15,000 to $19,999 | 0 (0.0%) | 2 (2.6%) |
| $20,000 to $24,999 | 8 (2.0%) | 5 (6.4%) |
| $25,000 to $34,999 | 4 (1.0%) | 2 (2.6%) |
| $35,000 to $49,999 | 34 (8.6%) | 25 (32.1%) |
| $50,000 to $74,999 | 84 (21.3%) | 3 (3.8%) |
| $75,000 to $99,999 | 66 (16.7%) | 8 (10.3%) |
| $100,000 to $149,999 | 140 (35.4%) | 28 (35.9%) |
| $150,000 or more | 57 (14.4%) | 3 (3.8%) |
| Total | 395 (100.0%) | 78 (100.0%) |
Monthly Housing Cost Tiers in Ceresco
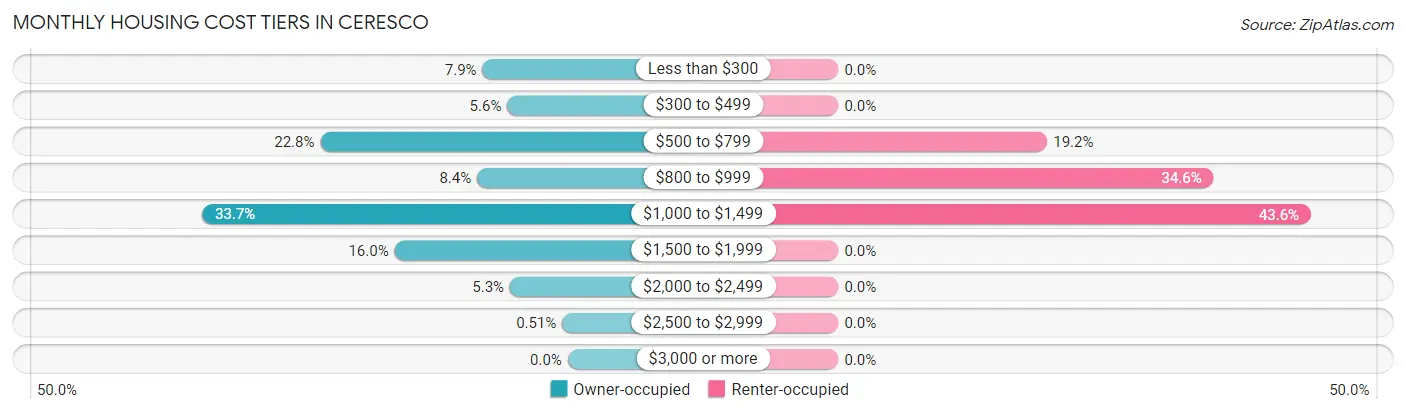
| Monthly Cost | Owner-occupied | Renter-occupied |
| Less than $300 | 31 (7.9%) | 0 (0.0%) |
| $300 to $499 | 22 (5.6%) | 0 (0.0%) |
| $500 to $799 | 90 (22.8%) | 15 (19.2%) |
| $800 to $999 | 33 (8.4%) | 27 (34.6%) |
| $1,000 to $1,499 | 133 (33.7%) | 34 (43.6%) |
| $1,500 to $1,999 | 63 (16.0%) | 0 (0.0%) |
| $2,000 to $2,499 | 21 (5.3%) | 0 (0.0%) |
| $2,500 to $2,999 | 2 (0.5%) | 0 (0.0%) |
| $3,000 or more | 0 (0.0%) | 0 (0.0%) |
| Total | 395 (100.0%) | 78 (100.0%) |
Physical Housing Characteristics in Ceresco
Housing Structures in Ceresco
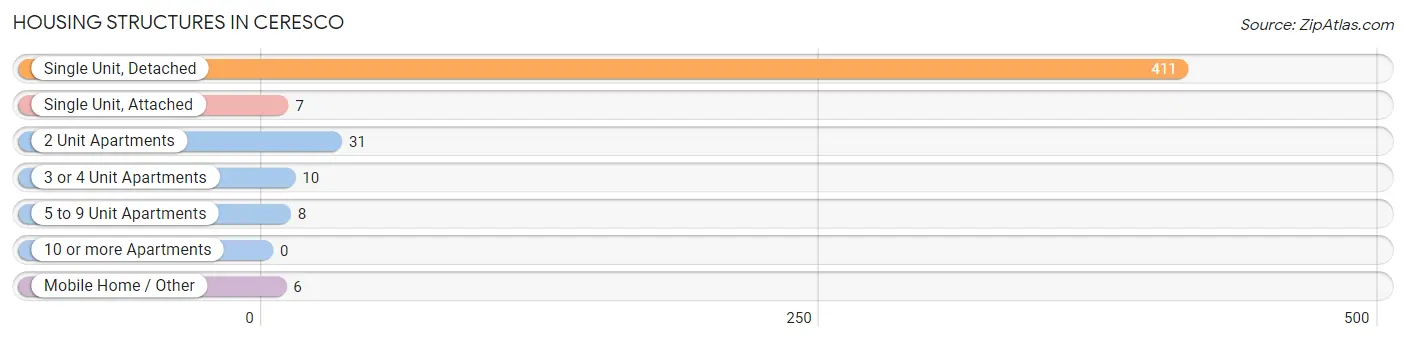
| Structure Type | # Housing Units | % Housing Units |
| Single Unit, Detached | 411 | 86.9% |
| Single Unit, Attached | 7 | 1.5% |
| 2 Unit Apartments | 31 | 6.6% |
| 3 or 4 Unit Apartments | 10 | 2.1% |
| 5 to 9 Unit Apartments | 8 | 1.7% |
| 10 or more Apartments | 0 | 0.0% |
| Mobile Home / Other | 6 | 1.3% |
| Total | 473 | 100.0% |
Housing Structures by Occupancy in Ceresco
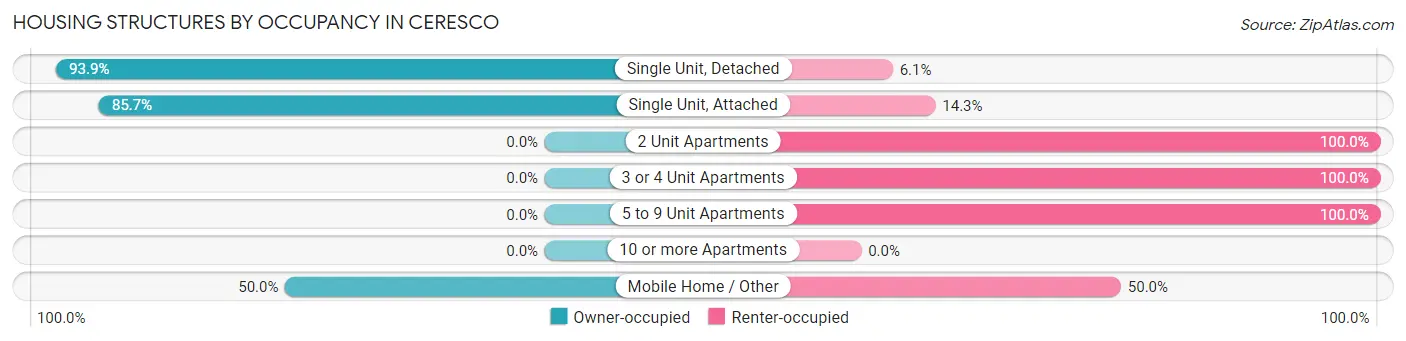
| Structure Type | Owner-occupied | Renter-occupied |
| Single Unit, Detached | 386 (93.9%) | 25 (6.1%) |
| Single Unit, Attached | 6 (85.7%) | 1 (14.3%) |
| 2 Unit Apartments | 0 (0.0%) | 31 (100.0%) |
| 3 or 4 Unit Apartments | 0 (0.0%) | 10 (100.0%) |
| 5 to 9 Unit Apartments | 0 (0.0%) | 8 (100.0%) |
| 10 or more Apartments | 0 (0.0%) | 0 (0.0%) |
| Mobile Home / Other | 3 (50.0%) | 3 (50.0%) |
| Total | 395 (83.5%) | 78 (16.5%) |
Housing Structures by Number of Rooms in Ceresco
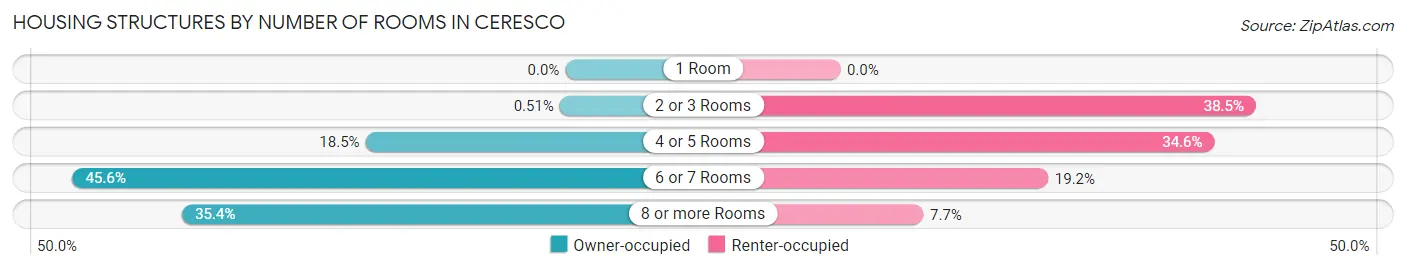
| Number of Rooms | Owner-occupied | Renter-occupied |
| 1 Room | 0 (0.0%) | 0 (0.0%) |
| 2 or 3 Rooms | 2 (0.5%) | 30 (38.5%) |
| 4 or 5 Rooms | 73 (18.5%) | 27 (34.6%) |
| 6 or 7 Rooms | 180 (45.6%) | 15 (19.2%) |
| 8 or more Rooms | 140 (35.4%) | 6 (7.7%) |
| Total | 395 (100.0%) | 78 (100.0%) |
Housing Structure by Heating Type in Ceresco
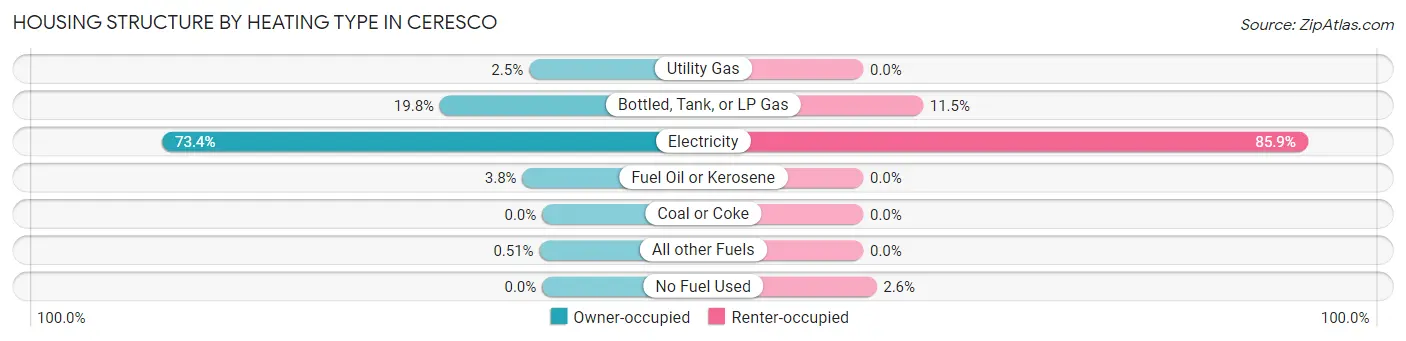
| Heating Type | Owner-occupied | Renter-occupied |
| Utility Gas | 10 (2.5%) | 0 (0.0%) |
| Bottled, Tank, or LP Gas | 78 (19.8%) | 9 (11.5%) |
| Electricity | 290 (73.4%) | 67 (85.9%) |
| Fuel Oil or Kerosene | 15 (3.8%) | 0 (0.0%) |
| Coal or Coke | 0 (0.0%) | 0 (0.0%) |
| All other Fuels | 2 (0.5%) | 0 (0.0%) |
| No Fuel Used | 0 (0.0%) | 2 (2.6%) |
| Total | 395 (100.0%) | 78 (100.0%) |
Household Vehicle Usage in Ceresco
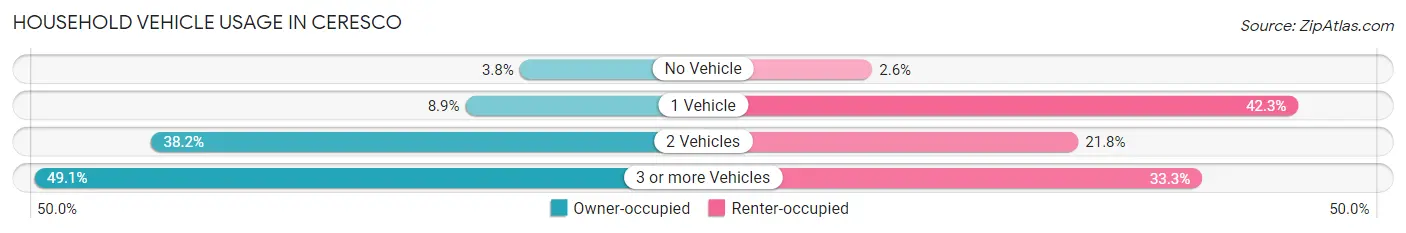
| Vehicles per Household | Owner-occupied | Renter-occupied |
| No Vehicle | 15 (3.8%) | 2 (2.6%) |
| 1 Vehicle | 35 (8.9%) | 33 (42.3%) |
| 2 Vehicles | 151 (38.2%) | 17 (21.8%) |
| 3 or more Vehicles | 194 (49.1%) | 26 (33.3%) |
| Total | 395 (100.0%) | 78 (100.0%) |
Real Estate & Mortgages in Ceresco
Real Estate and Mortgage Overview in Ceresco
| Characteristic | Without Mortgage | With Mortgage |
| Housing Units | 165 | 230 |
| Median Property Value | $158,400 | $168,500 |
| Median Household Income | $87,054 | $39 |
| Monthly Housing Costs | $610 | $0 |
| Real Estate Taxes | $2,609 | $0 |
Property Value by Mortgage Status in Ceresco
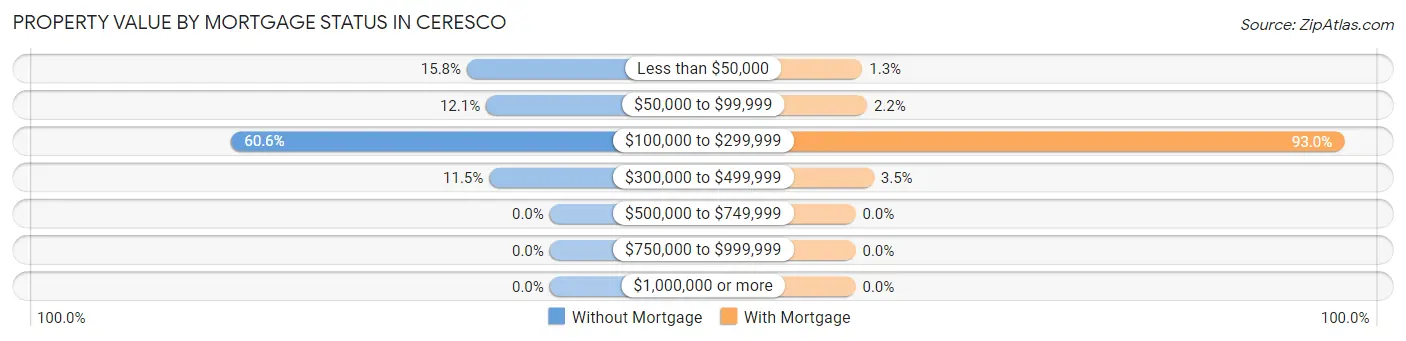
| Property Value | Without Mortgage | With Mortgage |
| Less than $50,000 | 26 (15.8%) | 3 (1.3%) |
| $50,000 to $99,999 | 20 (12.1%) | 5 (2.2%) |
| $100,000 to $299,999 | 100 (60.6%) | 214 (93.0%) |
| $300,000 to $499,999 | 19 (11.5%) | 8 (3.5%) |
| $500,000 to $749,999 | 0 (0.0%) | 0 (0.0%) |
| $750,000 to $999,999 | 0 (0.0%) | 0 (0.0%) |
| $1,000,000 or more | 0 (0.0%) | 0 (0.0%) |
| Total | 165 (100.0%) | 230 (100.0%) |
Household Income by Mortgage Status in Ceresco
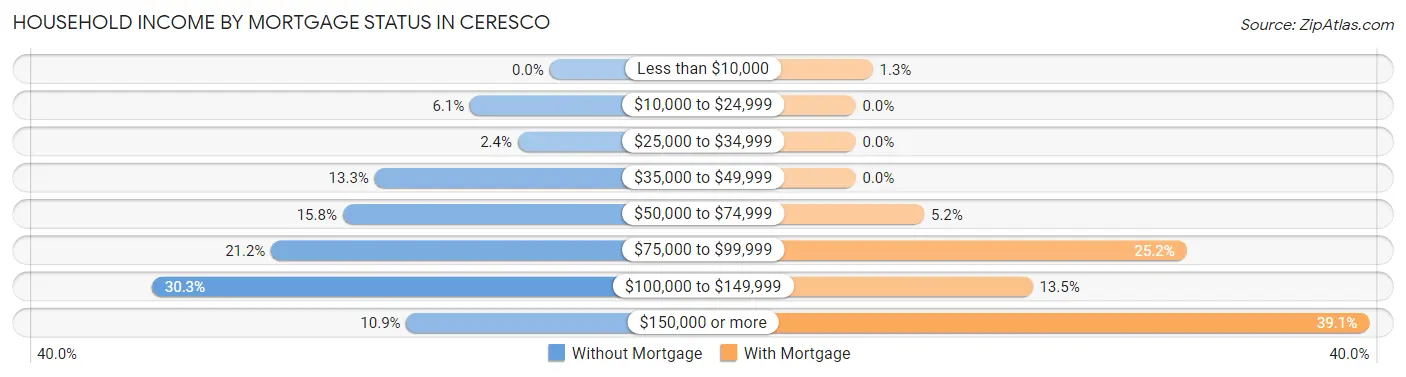
| Household Income | Without Mortgage | With Mortgage |
| Less than $10,000 | 0 (0.0%) | 3 (1.3%) |
| $10,000 to $24,999 | 10 (6.1%) | 0 (0.0%) |
| $25,000 to $34,999 | 4 (2.4%) | 0 (0.0%) |
| $35,000 to $49,999 | 22 (13.3%) | 0 (0.0%) |
| $50,000 to $74,999 | 26 (15.8%) | 12 (5.2%) |
| $75,000 to $99,999 | 35 (21.2%) | 58 (25.2%) |
| $100,000 to $149,999 | 50 (30.3%) | 31 (13.5%) |
| $150,000 or more | 18 (10.9%) | 90 (39.1%) |
| Total | 165 (100.0%) | 230 (100.0%) |
Property Value to Household Income Ratio in Ceresco
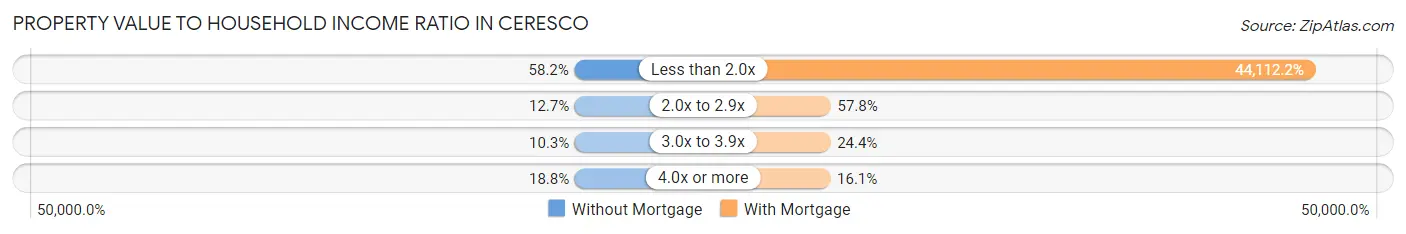
| Value-to-Income Ratio | Without Mortgage | With Mortgage |
| Less than 2.0x | 96 (58.2%) | 101,458 (44,112.2%) |
| 2.0x to 2.9x | 21 (12.7%) | 133 (57.8%) |
| 3.0x to 3.9x | 17 (10.3%) | 56 (24.3%) |
| 4.0x or more | 31 (18.8%) | 37 (16.1%) |
| Total | 165 (100.0%) | 230 (100.0%) |
Real Estate Taxes by Mortgage Status in Ceresco
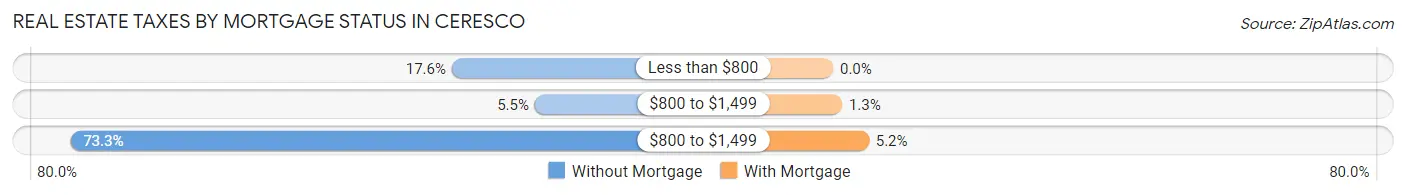
| Property Taxes | Without Mortgage | With Mortgage |
| Less than $800 | 29 (17.6%) | 0 (0.0%) |
| $800 to $1,499 | 9 (5.4%) | 3 (1.3%) |
| $800 to $1,499 | 121 (73.3%) | 12 (5.2%) |
| Total | 165 (100.0%) | 230 (100.0%) |
Health & Disability in Ceresco
Health Insurance Coverage by Age in Ceresco
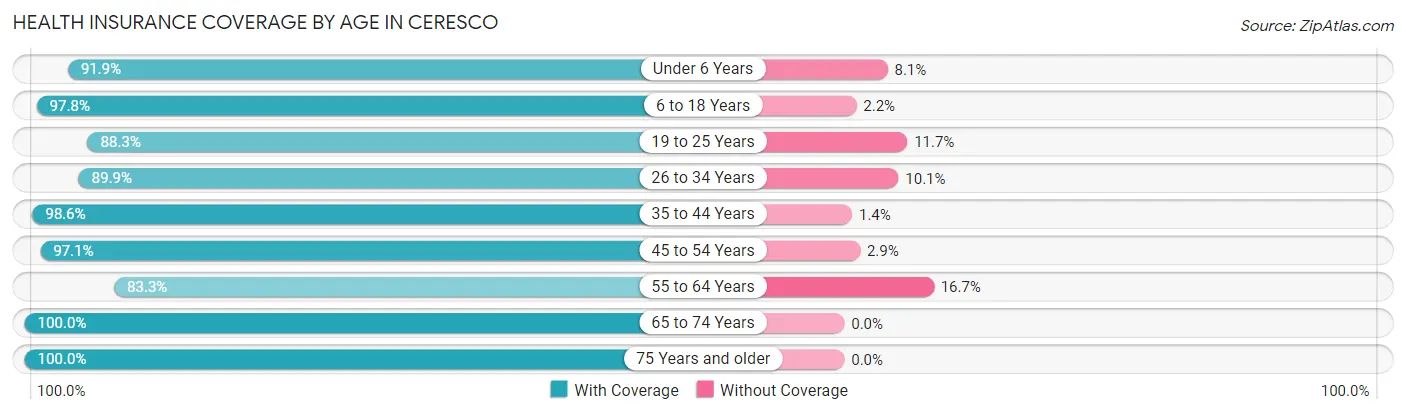
| Age Bracket | With Coverage | Without Coverage |
| Under 6 Years | 114 (91.9%) | 10 (8.1%) |
| 6 to 18 Years | 262 (97.8%) | 6 (2.2%) |
| 19 to 25 Years | 143 (88.3%) | 19 (11.7%) |
| 26 to 34 Years | 107 (89.9%) | 12 (10.1%) |
| 35 to 44 Years | 206 (98.6%) | 3 (1.4%) |
| 45 to 54 Years | 133 (97.1%) | 4 (2.9%) |
| 55 to 64 Years | 115 (83.3%) | 23 (16.7%) |
| 65 to 74 Years | 151 (100.0%) | 0 (0.0%) |
| 75 Years and older | 106 (100.0%) | 0 (0.0%) |
| Total | 1,337 (94.6%) | 77 (5.4%) |
Health Insurance Coverage by Citizenship Status in Ceresco
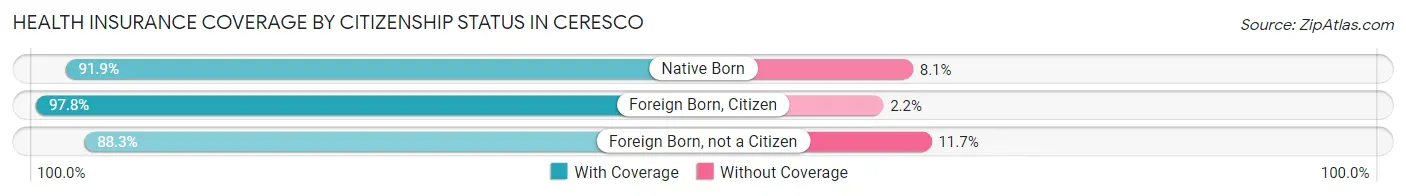
| Citizenship Status | With Coverage | Without Coverage |
| Native Born | 114 (91.9%) | 10 (8.1%) |
| Foreign Born, Citizen | 262 (97.8%) | 6 (2.2%) |
| Foreign Born, not a Citizen | 143 (88.3%) | 19 (11.7%) |
Health Insurance Coverage by Household Income in Ceresco
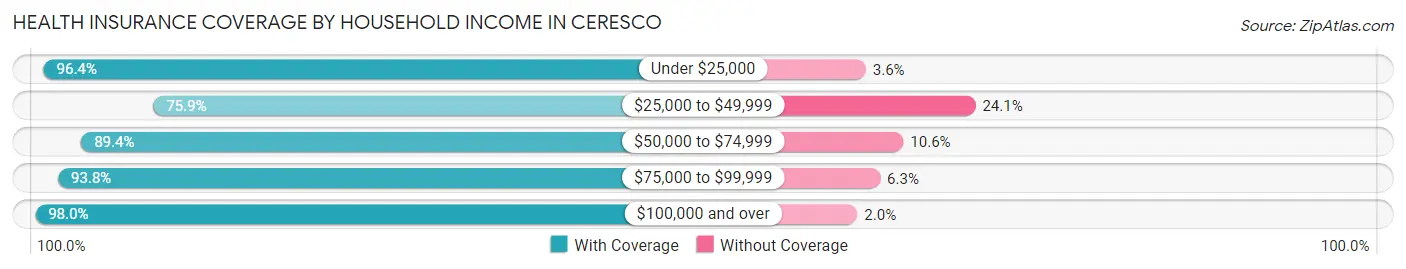
| Household Income | With Coverage | Without Coverage |
| Under $25,000 | 27 (96.4%) | 1 (3.6%) |
| $25,000 to $49,999 | 85 (75.9%) | 27 (24.1%) |
| $50,000 to $74,999 | 160 (89.4%) | 19 (10.6%) |
| $75,000 to $99,999 | 180 (93.8%) | 12 (6.2%) |
| $100,000 and over | 885 (98.0%) | 18 (2.0%) |
Public vs Private Health Insurance Coverage by Age in Ceresco
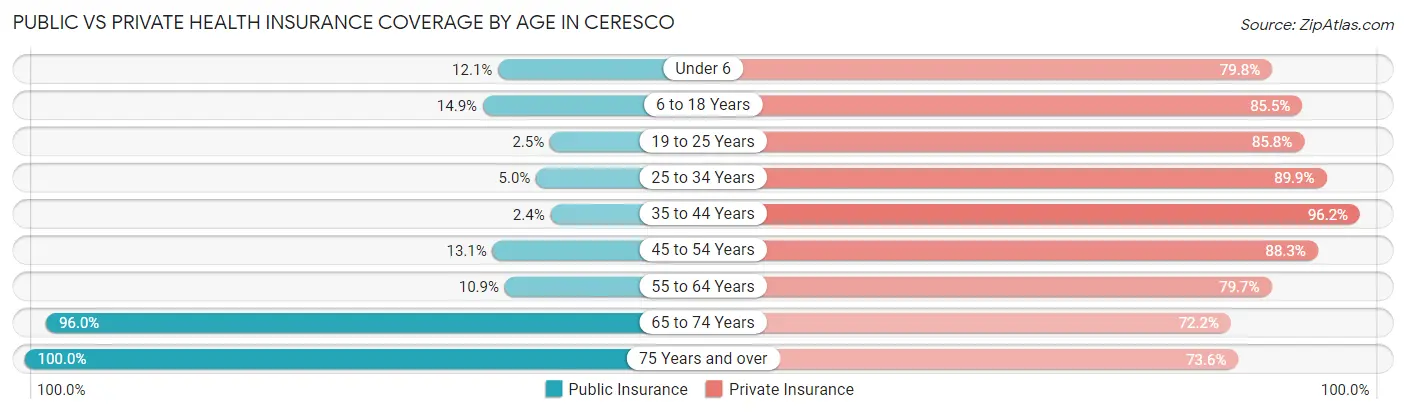
| Age Bracket | Public Insurance | Private Insurance |
| Under 6 | 15 (12.1%) | 99 (79.8%) |
| 6 to 18 Years | 40 (14.9%) | 229 (85.5%) |
| 19 to 25 Years | 4 (2.5%) | 139 (85.8%) |
| 25 to 34 Years | 6 (5.0%) | 107 (89.9%) |
| 35 to 44 Years | 5 (2.4%) | 201 (96.2%) |
| 45 to 54 Years | 18 (13.1%) | 121 (88.3%) |
| 55 to 64 Years | 15 (10.9%) | 110 (79.7%) |
| 65 to 74 Years | 145 (96.0%) | 109 (72.2%) |
| 75 Years and over | 106 (100.0%) | 78 (73.6%) |
| Total | 354 (25.0%) | 1,193 (84.4%) |
Disability Status by Sex by Age in Ceresco
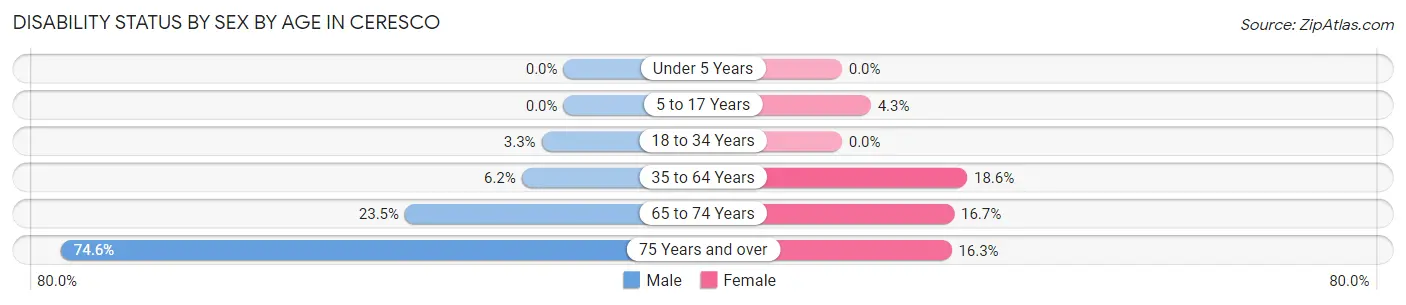
| Age Bracket | Male | Female |
| Under 5 Years | 0 (0.0%) | 0 (0.0%) |
| 5 to 17 Years | 0 (0.0%) | 6 (4.3%) |
| 18 to 34 Years | 5 (3.3%) | 0 (0.0%) |
| 35 to 64 Years | 15 (6.2%) | 45 (18.6%) |
| 65 to 74 Years | 20 (23.5%) | 11 (16.7%) |
| 75 Years and over | 47 (74.6%) | 7 (16.3%) |
Disability Class by Sex by Age in Ceresco
Disability Class: Hearing Difficulty
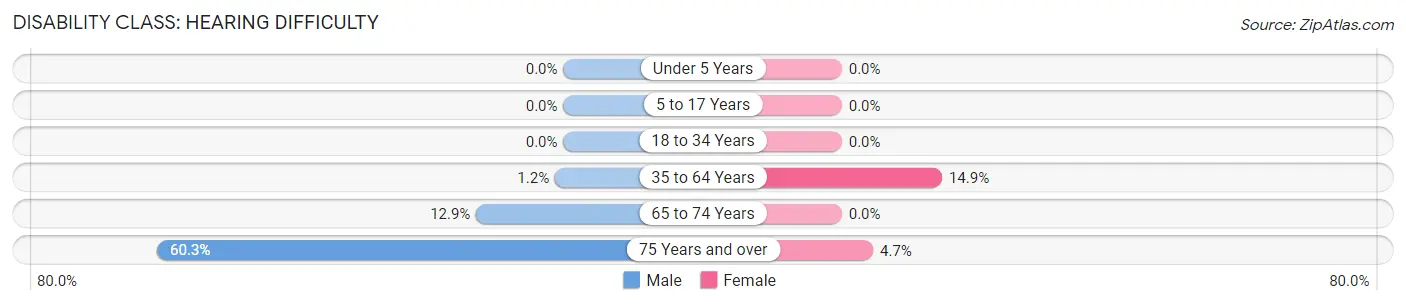
| Age Bracket | Male | Female |
| Under 5 Years | 0 (0.0%) | 0 (0.0%) |
| 5 to 17 Years | 0 (0.0%) | 0 (0.0%) |
| 18 to 34 Years | 0 (0.0%) | 0 (0.0%) |
| 35 to 64 Years | 3 (1.2%) | 36 (14.9%) |
| 65 to 74 Years | 11 (12.9%) | 0 (0.0%) |
| 75 Years and over | 38 (60.3%) | 2 (4.6%) |
Disability Class: Vision Difficulty
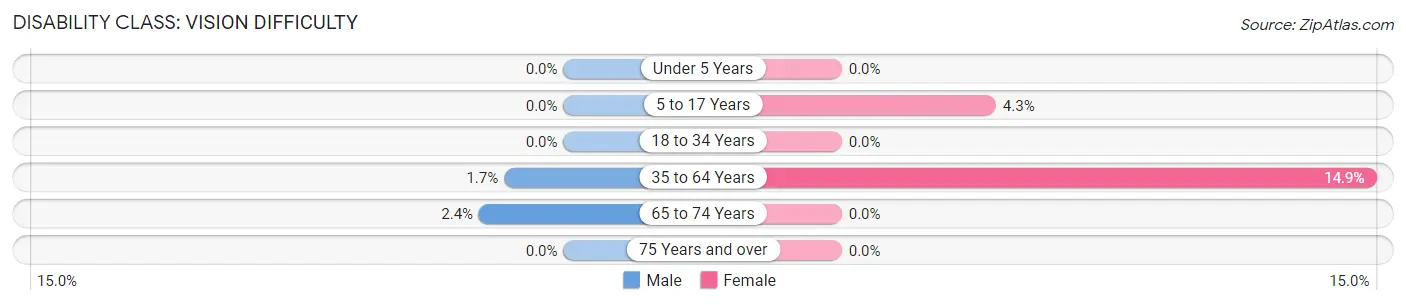
| Age Bracket | Male | Female |
| Under 5 Years | 0 (0.0%) | 0 (0.0%) |
| 5 to 17 Years | 0 (0.0%) | 6 (4.3%) |
| 18 to 34 Years | 0 (0.0%) | 0 (0.0%) |
| 35 to 64 Years | 4 (1.7%) | 36 (14.9%) |
| 65 to 74 Years | 2 (2.4%) | 0 (0.0%) |
| 75 Years and over | 0 (0.0%) | 0 (0.0%) |
Disability Class: Cognitive Difficulty
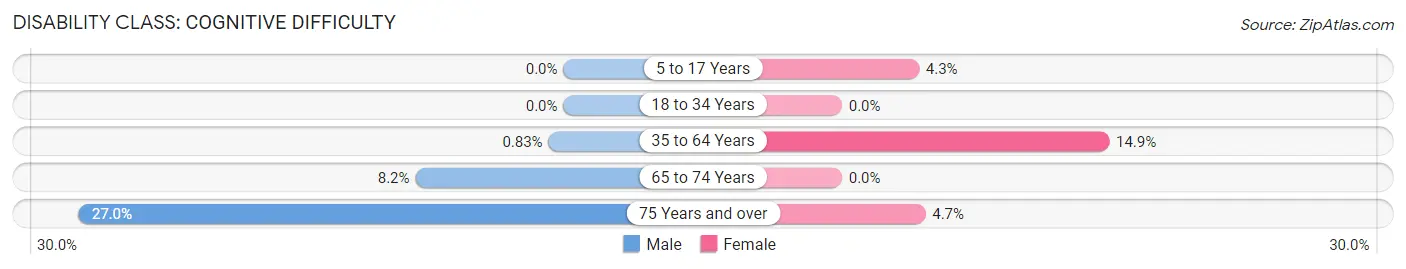
| Age Bracket | Male | Female |
| 5 to 17 Years | 0 (0.0%) | 6 (4.3%) |
| 18 to 34 Years | 0 (0.0%) | 0 (0.0%) |
| 35 to 64 Years | 2 (0.8%) | 36 (14.9%) |
| 65 to 74 Years | 7 (8.2%) | 0 (0.0%) |
| 75 Years and over | 17 (27.0%) | 2 (4.6%) |
Disability Class: Ambulatory Difficulty
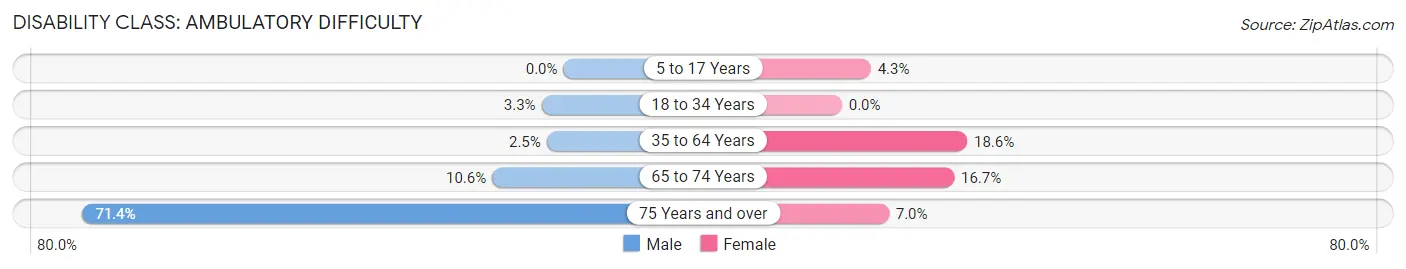
| Age Bracket | Male | Female |
| 5 to 17 Years | 0 (0.0%) | 6 (4.3%) |
| 18 to 34 Years | 5 (3.3%) | 0 (0.0%) |
| 35 to 64 Years | 6 (2.5%) | 45 (18.6%) |
| 65 to 74 Years | 9 (10.6%) | 11 (16.7%) |
| 75 Years and over | 45 (71.4%) | 3 (7.0%) |
Disability Class: Self-Care Difficulty
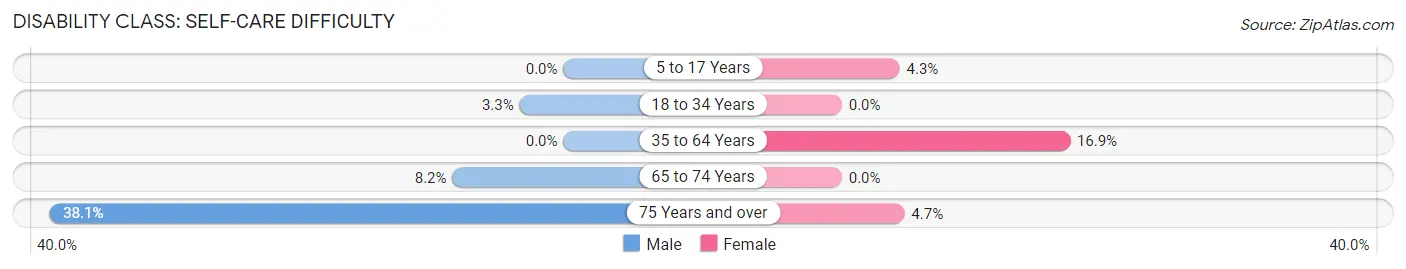
| Age Bracket | Male | Female |
| 5 to 17 Years | 0 (0.0%) | 6 (4.3%) |
| 18 to 34 Years | 5 (3.3%) | 0 (0.0%) |
| 35 to 64 Years | 0 (0.0%) | 41 (16.9%) |
| 65 to 74 Years | 7 (8.2%) | 0 (0.0%) |
| 75 Years and over | 24 (38.1%) | 2 (4.6%) |
Technology Access in Ceresco
Computing Device Access in Ceresco
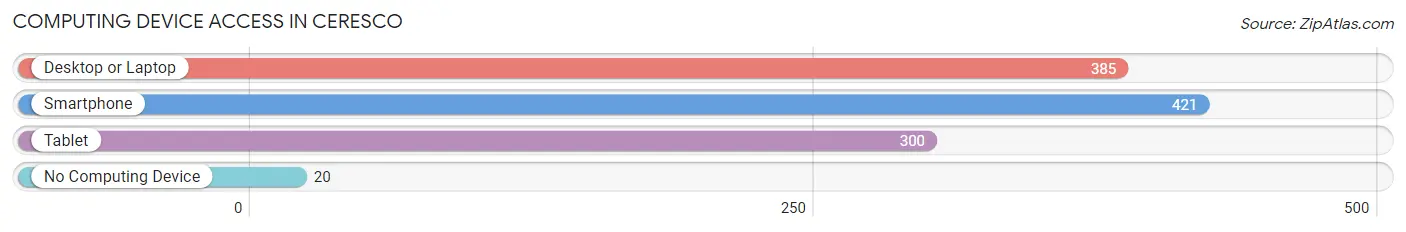
| Device Type | # Households | % Households |
| Desktop or Laptop | 385 | 81.4% |
| Smartphone | 421 | 89.0% |
| Tablet | 300 | 63.4% |
| No Computing Device | 20 | 4.2% |
| Total | 473 | 100.0% |
Internet Access in Ceresco
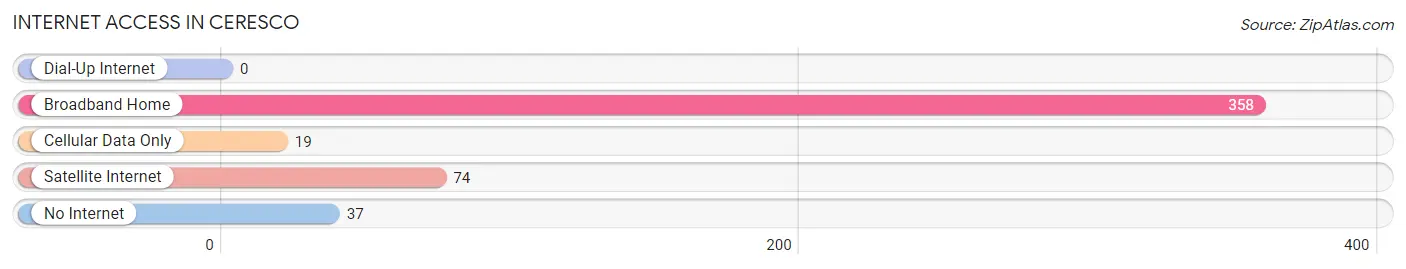
| Internet Type | # Households | % Households |
| Dial-Up Internet | 0 | 0.0% |
| Broadband Home | 358 | 75.7% |
| Cellular Data Only | 19 | 4.0% |
| Satellite Internet | 74 | 15.6% |
| No Internet | 37 | 7.8% |
| Total | 473 | 100.0% |
Ceresco Summary
Ceresco, Nebraska is a small village located in Saunders County, Nebraska. It is situated on the banks of the Platte River, approximately 20 miles west of Omaha. The village was founded in 1871 and has a population of approximately 500 people.
Ceresco is a rural community with a strong agricultural heritage. The village is surrounded by rolling hills and farmland, and is home to a variety of crops, including corn, soybeans, and wheat. The village is also home to a number of small businesses, including a grocery store, a hardware store, and a few restaurants.
Geographically, Ceresco is located in the eastern part of Saunders County, Nebraska. It is situated on the banks of the Platte River, approximately 20 miles west of Omaha. The village is surrounded by rolling hills and farmland, and is home to a variety of crops, including corn, soybeans, and wheat.
The economy of Ceresco is largely based on agriculture. The village is home to a number of small businesses, including a grocery store, a hardware store, and a few restaurants. The village also has a few manufacturing businesses, including a furniture factory and a woodworking shop.
The demographics of Ceresco are largely homogeneous. The village is predominantly white, with a small population of African Americans and Hispanics. The median household income in Ceresco is approximately $45,000, and the median age is around 40 years old.
Ceresco is a small village with a rich history and a strong agricultural heritage. The village is surrounded by rolling hills and farmland, and is home to a variety of crops, including corn, soybeans, and wheat. The village is also home to a number of small businesses, including a grocery store, a hardware store, and a few restaurants. The economy of Ceresco is largely based on agriculture, and the village has a predominantly white population with a small population of African Americans and Hispanics. The median household income in Ceresco is approximately $45,000, and the median age is around 40 years old.
Common Questions
What is Per Capita Income in Ceresco?
Per Capita income in Ceresco is $33,053.
What is the Median Family Income in Ceresco?
Median Family Income in Ceresco is $100,694.
What is the Median Household income in Ceresco?
Median Household Income in Ceresco is $96,125.
What is Income or Wage Gap in Ceresco?
Income or Wage Gap in Ceresco is 17.8%.
Women in Ceresco earn 82.2 cents for every dollar earned by a man.
What is Inequality or Gini Index in Ceresco?
Inequality or Gini Index in Ceresco is 0.27.
What is the Total Population of Ceresco?
Total Population of Ceresco is 1,414.
What is the Total Male Population of Ceresco?
Total Male Population of Ceresco is 718.
What is the Total Female Population of Ceresco?
Total Female Population of Ceresco is 696.
What is the Ratio of Males per 100 Females in Ceresco?
There are 103.16 Males per 100 Females in Ceresco.
What is the Ratio of Females per 100 Males in Ceresco?
There are 96.94 Females per 100 Males in Ceresco.
What is the Median Population Age in Ceresco?
Median Population Age in Ceresco is 36.6 Years.
What is the Average Family Size in Ceresco
Average Family Size in Ceresco is 3.2 People.
What is the Average Household Size in Ceresco
Average Household Size in Ceresco is 3.0 People.
How Large is the Labor Force in Ceresco?
There are 750 People in the Labor Forcein in Ceresco.
What is the Percentage of People in the Labor Force in Ceresco?
68.0% of People are in the Labor Force in Ceresco.
What is the Unemployment Rate in Ceresco?
Unemployment Rate in Ceresco is 2.7%.