Prague, NE Map & Demographics
Prague Map
Prague Overview
$29,247
PER CAPITA INCOME
$92,813
AVG FAMILY INCOME
$60,781
AVG HOUSEHOLD INCOME
45.0%
WAGE / INCOME GAP [ % ]
55.0¢/ $1
WAGE / INCOME GAP [ $ ]
0.36
INEQUALITY / GINI INDEX
342
TOTAL POPULATION
185
MALE POPULATION
157
FEMALE POPULATION
117.83
MALES / 100 FEMALES
84.86
FEMALES / 100 MALES
39.8
MEDIAN AGE
3.1
AVG FAMILY SIZE
2.5
AVG HOUSEHOLD SIZE
216
LABOR FORCE [ PEOPLE ]
72.5%
PERCENT IN LABOR FORCE
6.0%
UNEMPLOYMENT RATE
Prague Zip Codes
Prague Area Codes
Income in Prague
Income Overview in Prague
Per Capita Income in Prague is $29,247, while median incomes of families and households are $92,813 and $60,781 respectively.
| Characteristic | Number | Measure |
| Per Capita Income | 342 | $29,247 |
| Median Family Income | 83 | $92,813 |
| Mean Family Income | 83 | $90,081 |
| Median Household Income | 135 | $60,781 |
| Mean Household Income | 135 | $72,227 |
| Income Deficit | 83 | $0 |
| Wage / Income Gap (%) | 342 | 44.99% |
| Wage / Income Gap ($) | 342 | 55.01¢ per $1 |
| Gini / Inequality Index | 342 | 0.36 |
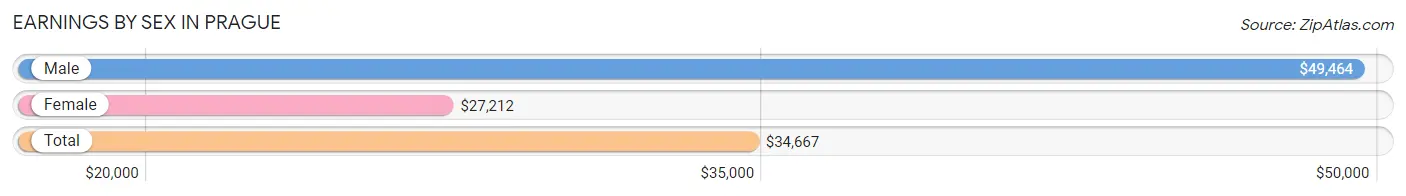
Earnings by Sex in Prague
Average Earnings in Prague are $34,667, $49,464 for men and $27,212 for women, a difference of 45.0%.
| Sex | Number | Average Earnings |
| Male | 113 (51.8%) | $49,464 |
| Female | 105 (48.2%) | $27,212 |
| Total | 218 (100.0%) | $34,667 |
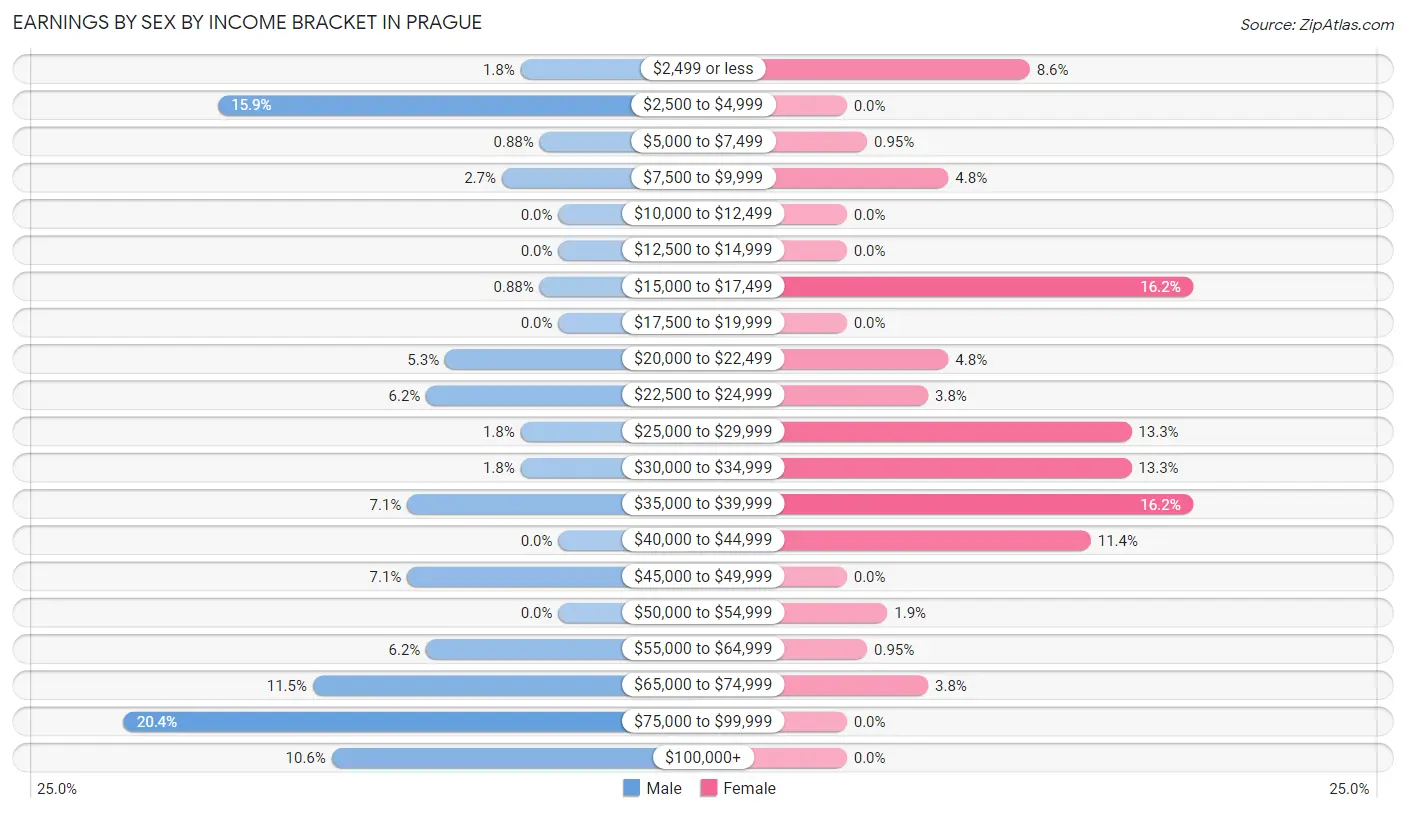
Earnings by Sex by Income Bracket in Prague
The most common earnings brackets in Prague are $75,000 to $99,999 for men (23 | 20.3%) and $15,000 to $17,499 for women (17 | 16.2%).
| Income | Male | Female |
| $2,499 or less | 2 (1.8%) | 9 (8.6%) |
| $2,500 to $4,999 | 18 (15.9%) | 0 (0.0%) |
| $5,000 to $7,499 | 1 (0.9%) | 1 (0.9%) |
| $7,500 to $9,999 | 3 (2.6%) | 5 (4.8%) |
| $10,000 to $12,499 | 0 (0.0%) | 0 (0.0%) |
| $12,500 to $14,999 | 0 (0.0%) | 0 (0.0%) |
| $15,000 to $17,499 | 1 (0.9%) | 17 (16.2%) |
| $17,500 to $19,999 | 0 (0.0%) | 0 (0.0%) |
| $20,000 to $22,499 | 6 (5.3%) | 5 (4.8%) |
| $22,500 to $24,999 | 7 (6.2%) | 4 (3.8%) |
| $25,000 to $29,999 | 2 (1.8%) | 14 (13.3%) |
| $30,000 to $34,999 | 2 (1.8%) | 14 (13.3%) |
| $35,000 to $39,999 | 8 (7.1%) | 17 (16.2%) |
| $40,000 to $44,999 | 0 (0.0%) | 12 (11.4%) |
| $45,000 to $49,999 | 8 (7.1%) | 0 (0.0%) |
| $50,000 to $54,999 | 0 (0.0%) | 2 (1.9%) |
| $55,000 to $64,999 | 7 (6.2%) | 1 (0.9%) |
| $65,000 to $74,999 | 13 (11.5%) | 4 (3.8%) |
| $75,000 to $99,999 | 23 (20.3%) | 0 (0.0%) |
| $100,000+ | 12 (10.6%) | 0 (0.0%) |
| Total | 113 (100.0%) | 105 (100.0%) |
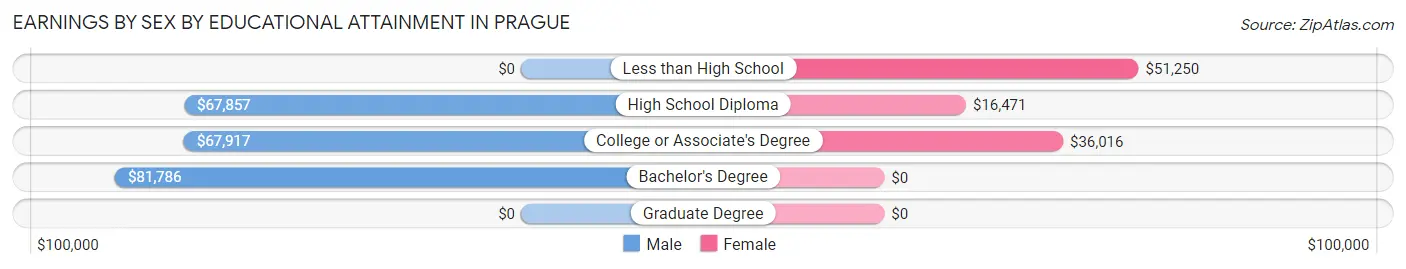
Earnings by Sex by Educational Attainment in Prague
Average earnings in Prague are $68,375 for men and $23,750 for women, a difference of 65.3%. Men with an educational attainment of bachelor's degree enjoy the highest average annual earnings of $81,786, while those with high school diploma education earn the least with $67,857. Women with an educational attainment of less than high school earn the most with the average annual earnings of $51,250, while those with high school diploma education have the smallest earnings of $16,471.
| Educational Attainment | Male Income | Female Income |
| Less than High School | - | - |
| High School Diploma | $67,857 | $16,471 |
| College or Associate's Degree | $67,917 | $36,016 |
| Bachelor's Degree | $81,786 | $0 |
| Graduate Degree | - | - |
| Total | $68,375 | $23,750 |
Family Income in Prague
Family Income Brackets in Prague
According to the Prague family income data, there are 29 families falling into the $100,000 to $149,999 income range, which is the most common income bracket and makes up 34.9% of all families.
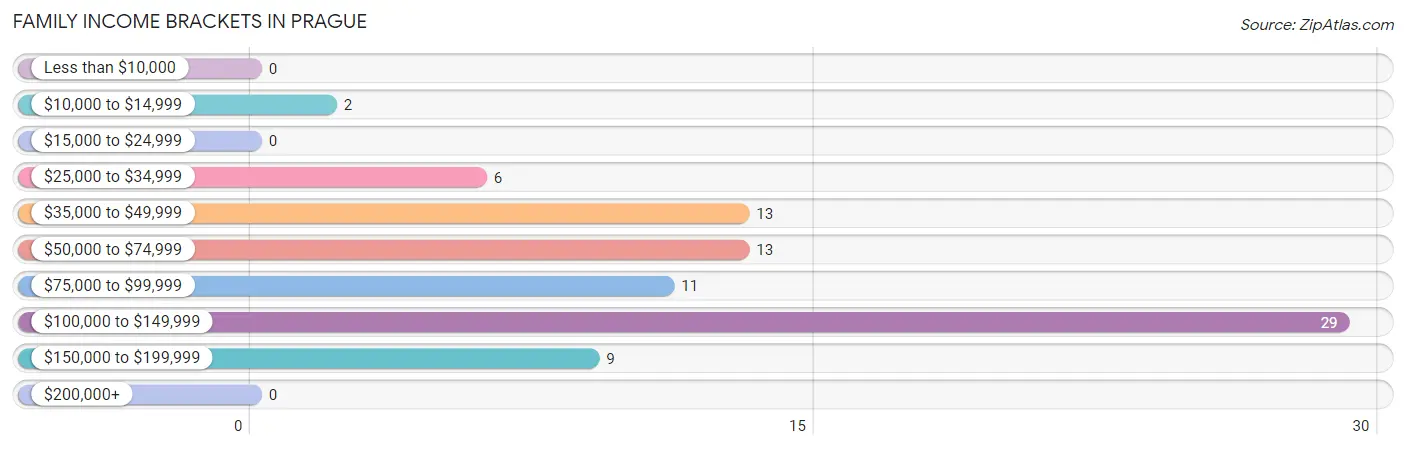
| Income Bracket | # Families | % Families |
| Less than $10,000 | 0 | 0.0% |
| $10,000 to $14,999 | 2 | 2.4% |
| $15,000 to $24,999 | 0 | 0.0% |
| $25,000 to $34,999 | 6 | 7.2% |
| $35,000 to $49,999 | 13 | 15.7% |
| $50,000 to $74,999 | 13 | 15.7% |
| $75,000 to $99,999 | 11 | 13.3% |
| $100,000 to $149,999 | 29 | 34.9% |
| $150,000 to $199,999 | 9 | 10.8% |
| $200,000+ | 0 | 0.0% |
Family Income by Famaliy Size in Prague
4-person families (23 | 27.7%) account for the highest median family income in Prague with $116,094 per family, while 3-person families (24 | 28.9%) have the highest median income of $33,397 per family member.
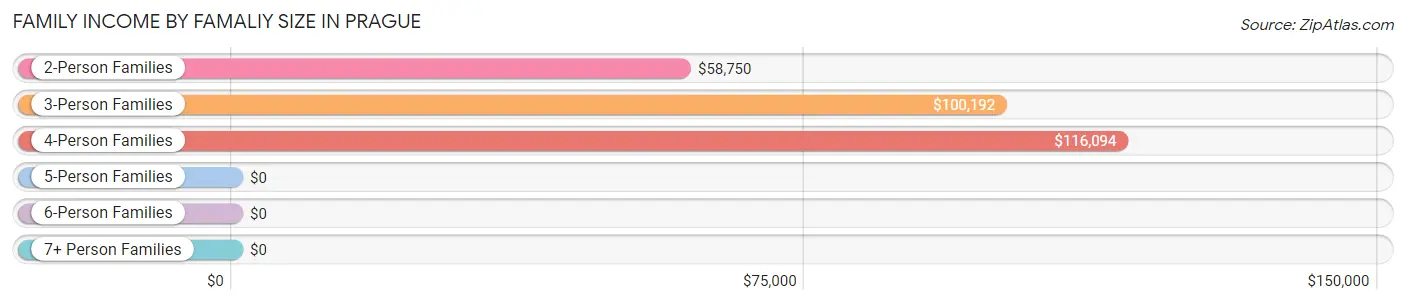
| Income Bracket | # Families | Median Income |
| 2-Person Families | 32 (38.6%) | $58,750 |
| 3-Person Families | 24 (28.9%) | $100,192 |
| 4-Person Families | 23 (27.7%) | $116,094 |
| 5-Person Families | 2 (2.4%) | $0 |
| 6-Person Families | 0 (0.0%) | $0 |
| 7+ Person Families | 2 (2.4%) | $0 |
| Total | 83 (100.0%) | $92,813 |
Family Income by Number of Earners in Prague
The median family income in Prague is $92,813, with families comprising 2 earners (28) having the highest median family income of $115,313, while families with no earners (10) have the lowest median family income of $38,750, accounting for 33.7% and 12.0% of families, respectively.
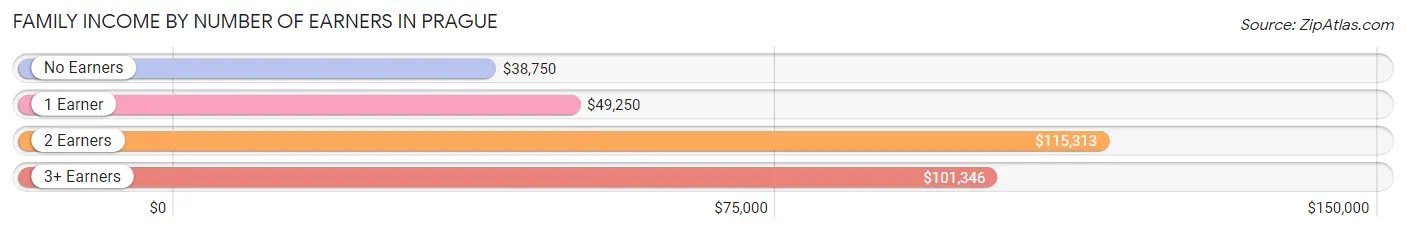
| Number of Earners | # Families | Median Income |
| No Earners | 10 (12.0%) | $38,750 |
| 1 Earner | 19 (22.9%) | $49,250 |
| 2 Earners | 28 (33.7%) | $115,313 |
| 3+ Earners | 26 (31.3%) | $101,346 |
| Total | 83 (100.0%) | $92,813 |
Household Income in Prague
Household Income Brackets in Prague
With 33 households falling in the category, the $100,000 to $149,999 income range is the most frequent in Prague, accounting for 24.4% of all households.
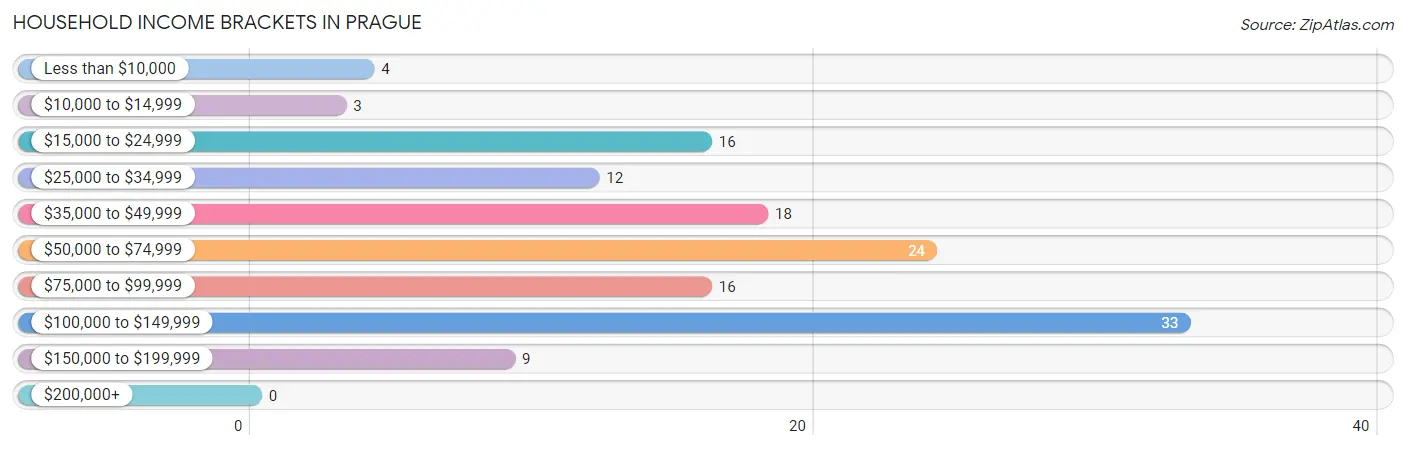
| Income Bracket | # Households | % Households |
| Less than $10,000 | 4 | 3.0% |
| $10,000 to $14,999 | 3 | 2.2% |
| $15,000 to $24,999 | 16 | 11.9% |
| $25,000 to $34,999 | 12 | 8.9% |
| $35,000 to $49,999 | 18 | 13.3% |
| $50,000 to $74,999 | 24 | 17.8% |
| $75,000 to $99,999 | 16 | 11.9% |
| $100,000 to $149,999 | 33 | 24.4% |
| $150,000 to $199,999 | 9 | 6.7% |
| $200,000+ | 0 | 0.0% |
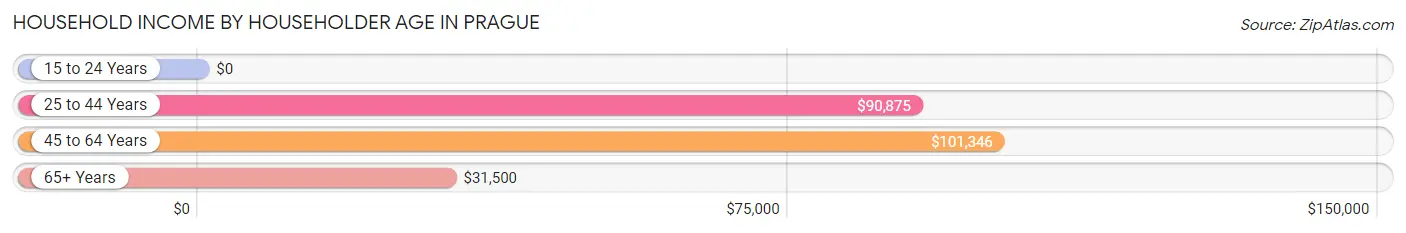
Household Income by Householder Age in Prague
The median household income in Prague is $60,781, with the highest median household income of $101,346 found in the 45 to 64 years age bracket for the primary householder. A total of 42 households (31.1%) fall into this category.
| Income Bracket | # Households | Median Income |
| 15 to 24 Years | 0 (0.0%) | $0 |
| 25 to 44 Years | 47 (34.8%) | $90,875 |
| 45 to 64 Years | 42 (31.1%) | $101,346 |
| 65+ Years | 46 (34.1%) | $31,500 |
| Total | 135 (100.0%) | $60,781 |
Poverty in Prague
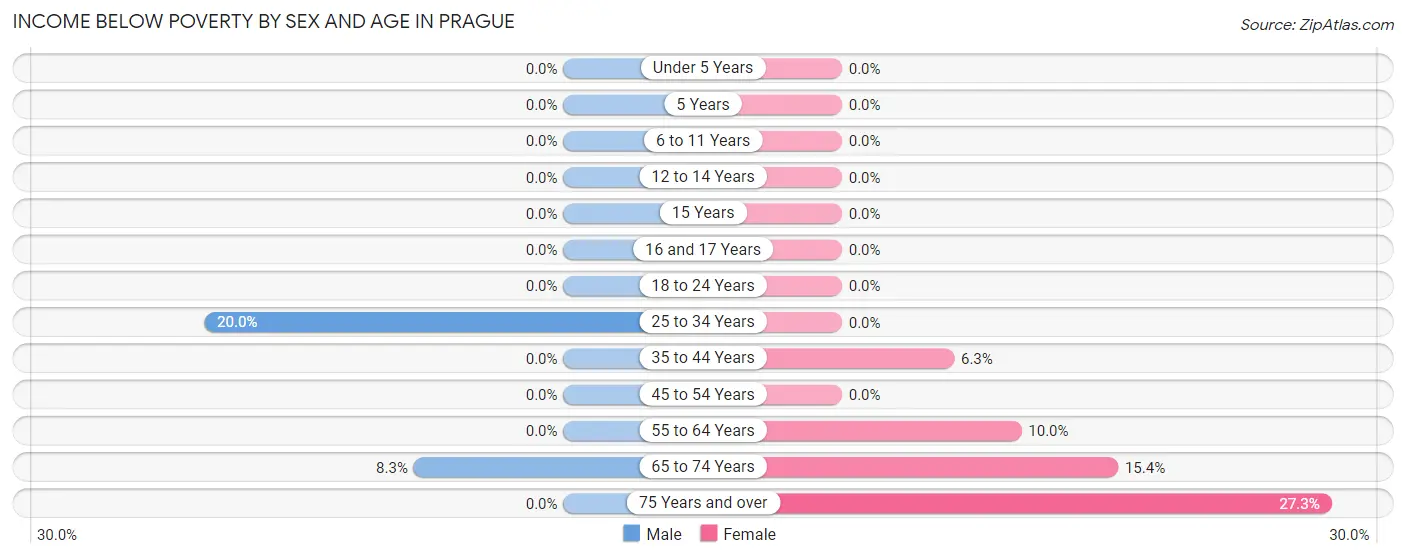
Income Below Poverty by Sex and Age in Prague
With 4.4% poverty level for males and 5.1% for females among the residents of Prague, 25 to 34 year old males and 75 year old and over females are the most vulnerable to poverty, with 6 males (20.0%) and 3 females (27.3%) in their respective age groups living below the poverty level.
| Age Bracket | Male | Female |
| Under 5 Years | 0 (0.0%) | 0 (0.0%) |
| 5 Years | 0 (0.0%) | 0 (0.0%) |
| 6 to 11 Years | 0 (0.0%) | 0 (0.0%) |
| 12 to 14 Years | 0 (0.0%) | 0 (0.0%) |
| 15 Years | 0 (0.0%) | 0 (0.0%) |
| 16 and 17 Years | 0 (0.0%) | 0 (0.0%) |
| 18 to 24 Years | 0 (0.0%) | 0 (0.0%) |
| 25 to 34 Years | 6 (20.0%) | 0 (0.0%) |
| 35 to 44 Years | 0 (0.0%) | 1 (6.2%) |
| 45 to 54 Years | 0 (0.0%) | 0 (0.0%) |
| 55 to 64 Years | 0 (0.0%) | 2 (10.0%) |
| 65 to 74 Years | 2 (8.3%) | 2 (15.4%) |
| 75 Years and over | 0 (0.0%) | 3 (27.3%) |
| Total | 8 (4.4%) | 8 (5.1%) |
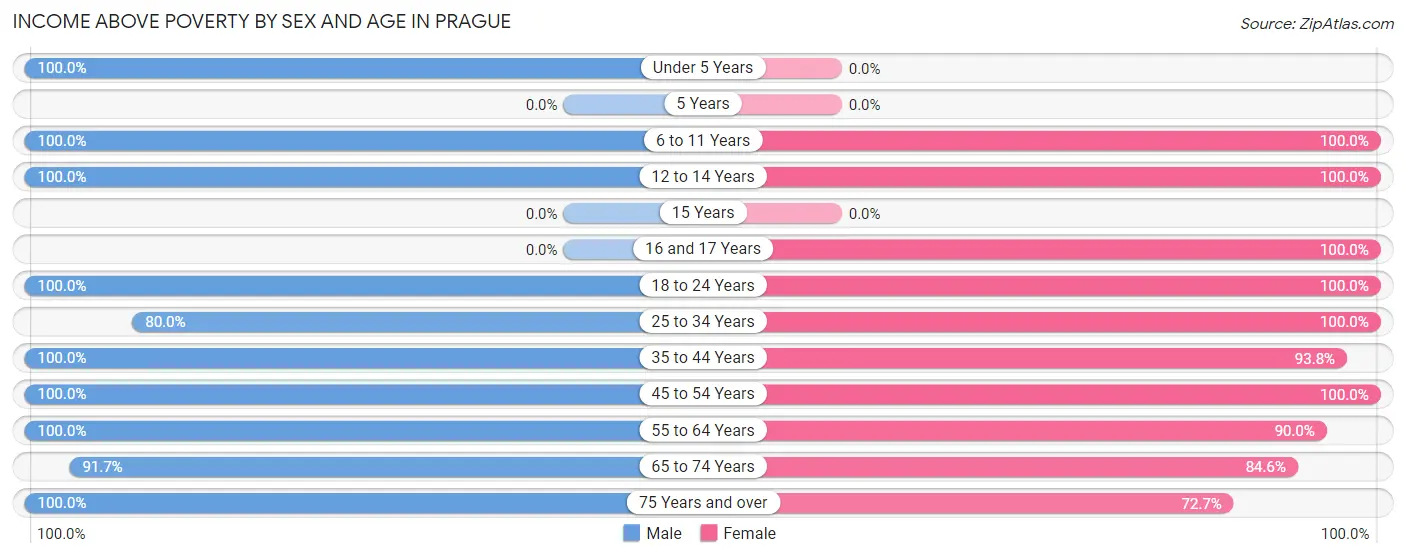
Income Above Poverty by Sex and Age in Prague
According to the poverty statistics in Prague, males aged under 5 years and females aged 6 to 11 years are the age groups that are most secure financially, with 100.0% of males and 100.0% of females in these age groups living above the poverty line.
| Age Bracket | Male | Female |
| Under 5 Years | 13 (100.0%) | 0 (0.0%) |
| 5 Years | 0 (0.0%) | 0 (0.0%) |
| 6 to 11 Years | 8 (100.0%) | 13 (100.0%) |
| 12 to 14 Years | 3 (100.0%) | 2 (100.0%) |
| 15 Years | 0 (0.0%) | 0 (0.0%) |
| 16 and 17 Years | 0 (0.0%) | 2 (100.0%) |
| 18 to 24 Years | 30 (100.0%) | 43 (100.0%) |
| 25 to 34 Years | 24 (80.0%) | 10 (100.0%) |
| 35 to 44 Years | 18 (100.0%) | 15 (93.8%) |
| 45 to 54 Years | 15 (100.0%) | 26 (100.0%) |
| 55 to 64 Years | 25 (100.0%) | 18 (90.0%) |
| 65 to 74 Years | 22 (91.7%) | 11 (84.6%) |
| 75 Years and over | 15 (100.0%) | 8 (72.7%) |
| Total | 173 (95.6%) | 148 (94.9%) |
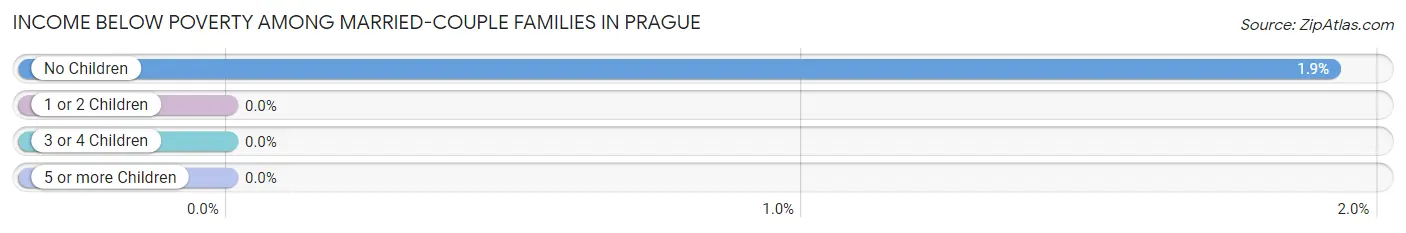
Income Below Poverty Among Married-Couple Families in Prague
The poverty statistics for married-couple families in Prague show that 1.4% or 1 of the total 71 families live below the poverty line. Families with no children have the highest poverty rate of 1.9%, comprising of 1 families. On the other hand, families with 1 or 2 children have the lowest poverty rate of 0.0%, which includes 0 families.
| Children | Above Poverty | Below Poverty |
| No Children | 51 (98.1%) | 1 (1.9%) |
| 1 or 2 Children | 15 (100.0%) | 0 (0.0%) |
| 3 or 4 Children | 2 (100.0%) | 0 (0.0%) |
| 5 or more Children | 2 (100.0%) | 0 (0.0%) |
| Total | 70 (98.6%) | 1 (1.4%) |
Income Below Poverty Among Single-Parent Households in Prague
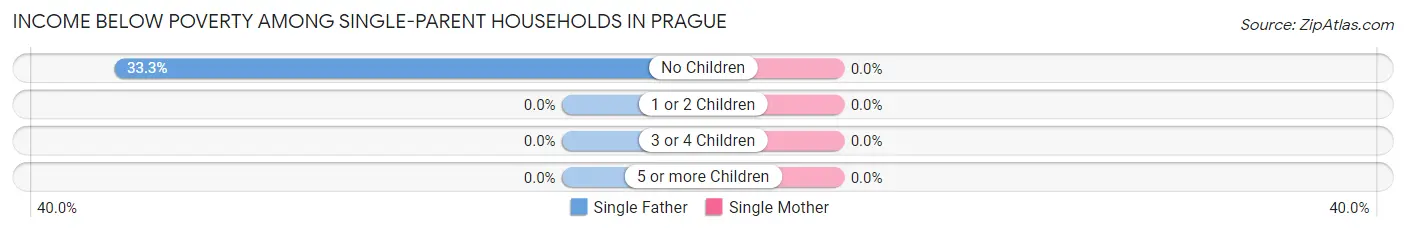
| Children | Single Father | Single Mother |
| No Children | 2 (33.3%) | 0 (0.0%) |
| 1 or 2 Children | 0 (0.0%) | 0 (0.0%) |
| 3 or 4 Children | 0 (0.0%) | 0 (0.0%) |
| 5 or more Children | 0 (0.0%) | 0 (0.0%) |
| Total | 2 (22.2%) | 0 (0.0%) |
Income Below Poverty Among Married-Couple vs Single-Parent Households in Prague
The poverty data for Prague shows that 1 of the married-couple family households (1.4%) and 2 of the single-parent households (16.7%) are living below the poverty level. Within the married-couple family households, those with no children have the highest poverty rate, with 1 households (1.9%) falling below the poverty line. Among the single-parent households, those with no children have the highest poverty rate, with 2 household (25.0%) living below poverty.
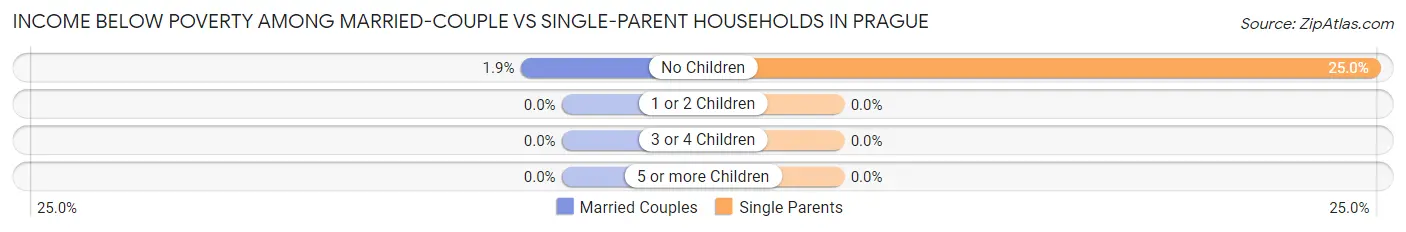
| Children | Married-Couple Families | Single-Parent Households |
| No Children | 1 (1.9%) | 2 (25.0%) |
| 1 or 2 Children | 0 (0.0%) | 0 (0.0%) |
| 3 or 4 Children | 0 (0.0%) | 0 (0.0%) |
| 5 or more Children | 0 (0.0%) | 0 (0.0%) |
| Total | 1 (1.4%) | 2 (16.7%) |
Race in Prague
The most populous races in Prague are White / Caucasian (337 | 98.5%), Two or more Races (4 | 1.2%), and Native / Alaskan (1 | 0.3%).
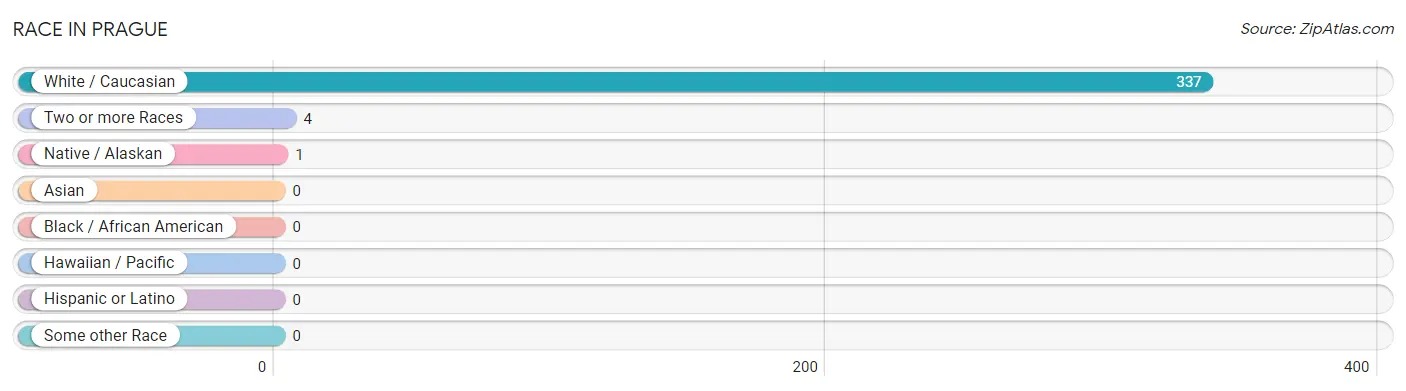
| Race | # Population | % Population |
| Asian | 0 | 0.0% |
| Black / African American | 0 | 0.0% |
| Hawaiian / Pacific | 0 | 0.0% |
| Hispanic or Latino | 0 | 0.0% |
| Native / Alaskan | 1 | 0.3% |
| White / Caucasian | 337 | 98.5% |
| Two or more Races | 4 | 1.2% |
| Some other Race | 0 | 0.0% |
| Total | 342 | 100.0% |
Ancestry in Prague
The most populous ancestries reported in Prague are Czech (150 | 43.9%), German (124 | 36.3%), Irish (52 | 15.2%), French (12 | 3.5%), and American (10 | 2.9%), together accounting for 101.7% of all Prague residents.
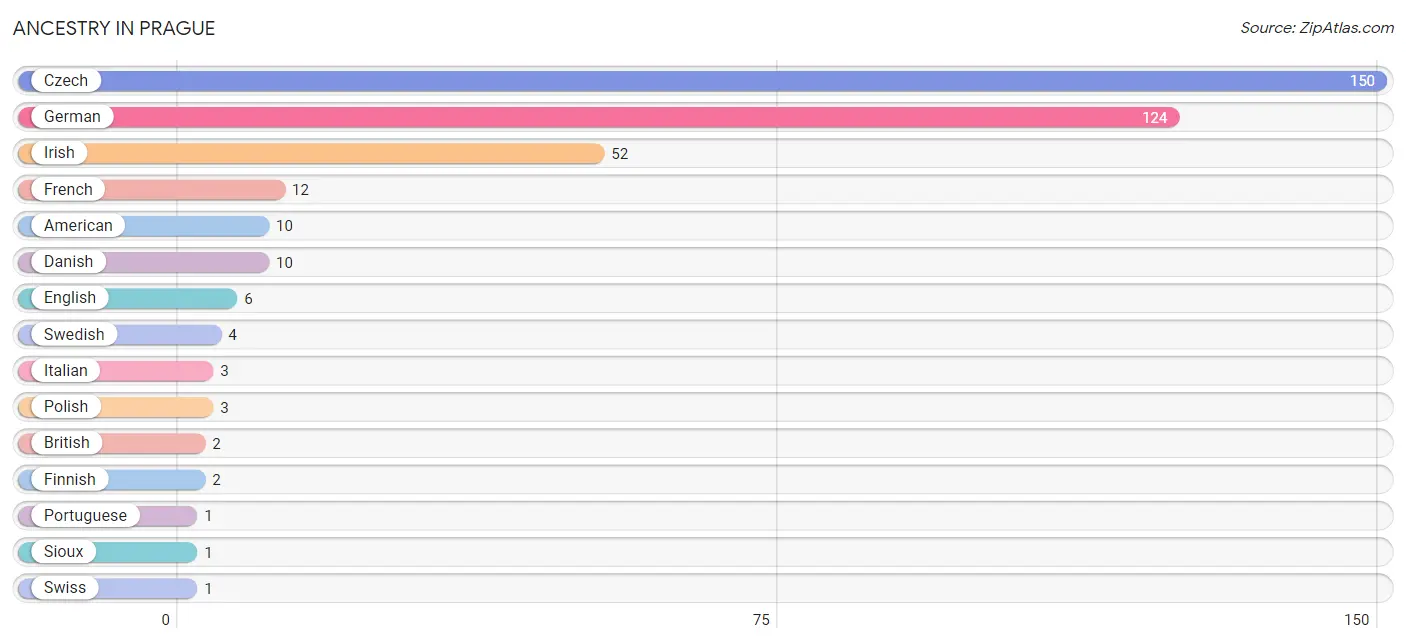
| Ancestry | # Population | % Population |
| American | 10 | 2.9% |
| British | 2 | 0.6% |
| Czech | 150 | 43.9% |
| Danish | 10 | 2.9% |
| English | 6 | 1.8% |
| Finnish | 2 | 0.6% |
| French | 12 | 3.5% |
| German | 124 | 36.3% |
| Irish | 52 | 15.2% |
| Italian | 3 | 0.9% |
| Polish | 3 | 0.9% |
| Portuguese | 1 | 0.3% |
| Sioux | 1 | 0.3% |
| Swedish | 4 | 1.2% |
| Swiss | 1 | 0.3% | View All 15 Rows |
Immigrants in Prague

| Immigration Origin | # Population | % Population | View All 0 Rows |
Sex and Age in Prague
Sex and Age in Prague
The most populous age groups in Prague are 20 to 24 Years (24 | 13.0%) for men and 20 to 24 Years (33 | 21.0%) for women.
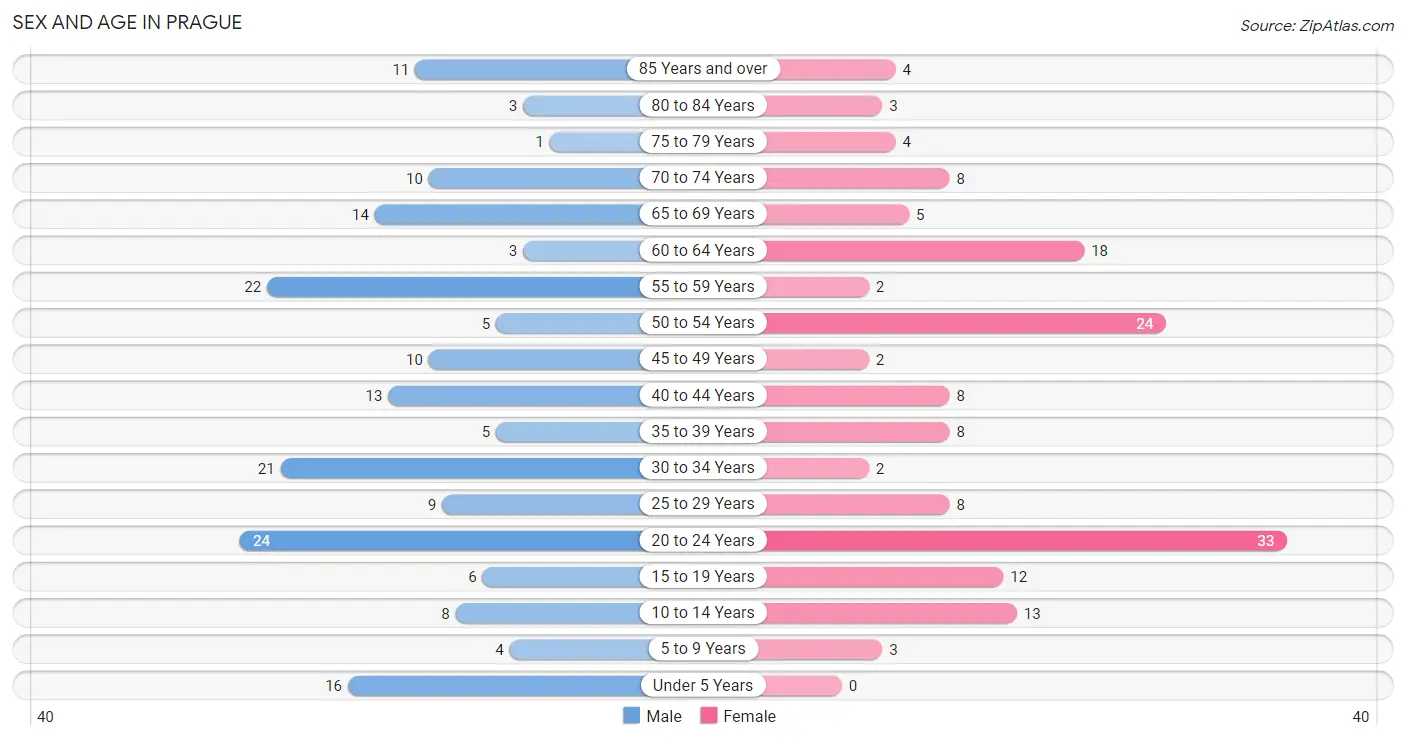
| Age Bracket | Male | Female |
| Under 5 Years | 16 (8.6%) | 0 (0.0%) |
| 5 to 9 Years | 4 (2.2%) | 3 (1.9%) |
| 10 to 14 Years | 8 (4.3%) | 13 (8.3%) |
| 15 to 19 Years | 6 (3.2%) | 12 (7.6%) |
| 20 to 24 Years | 24 (13.0%) | 33 (21.0%) |
| 25 to 29 Years | 9 (4.9%) | 8 (5.1%) |
| 30 to 34 Years | 21 (11.4%) | 2 (1.3%) |
| 35 to 39 Years | 5 (2.7%) | 8 (5.1%) |
| 40 to 44 Years | 13 (7.0%) | 8 (5.1%) |
| 45 to 49 Years | 10 (5.4%) | 2 (1.3%) |
| 50 to 54 Years | 5 (2.7%) | 24 (15.3%) |
| 55 to 59 Years | 22 (11.9%) | 2 (1.3%) |
| 60 to 64 Years | 3 (1.6%) | 18 (11.5%) |
| 65 to 69 Years | 14 (7.6%) | 5 (3.2%) |
| 70 to 74 Years | 10 (5.4%) | 8 (5.1%) |
| 75 to 79 Years | 1 (0.5%) | 4 (2.5%) |
| 80 to 84 Years | 3 (1.6%) | 3 (1.9%) |
| 85 Years and over | 11 (5.9%) | 4 (2.5%) |
| Total | 185 (100.0%) | 157 (100.0%) |
Families and Households in Prague
Median Family Size in Prague
The median family size in Prague is 3.07 persons per family, with married-couple families (71 | 85.5%) accounting for the largest median family size of 3.25 persons per family. On the other hand, single male/father families (9 | 10.8%) represent the smallest median family size with 1.89 persons per family.
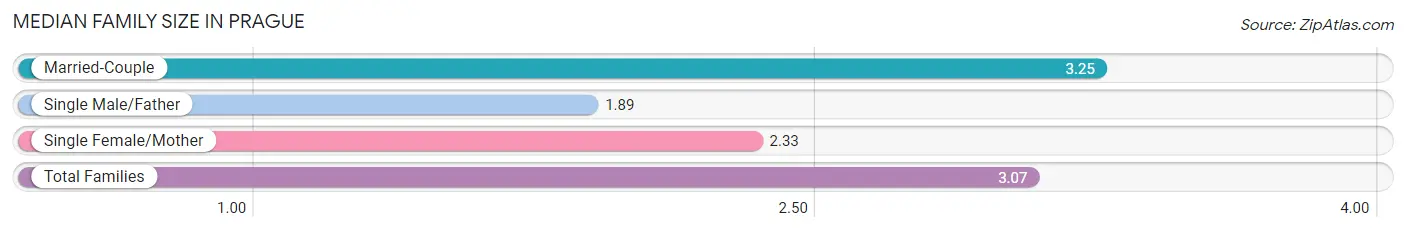
| Family Type | # Families | Family Size |
| Married-Couple | 71 (85.5%) | 3.25 |
| Single Male/Father | 9 (10.8%) | 1.89 |
| Single Female/Mother | 3 (3.6%) | 2.33 |
| Total Families | 83 (100.0%) | 3.07 |
Median Household Size in Prague
The median household size in Prague is 2.53 persons per household, with married-couple households (71 | 52.6%) accounting for the largest median household size of 3.3 persons per household. non-family households (52 | 38.5%) represent the smallest median household size with 1.50 persons per household.
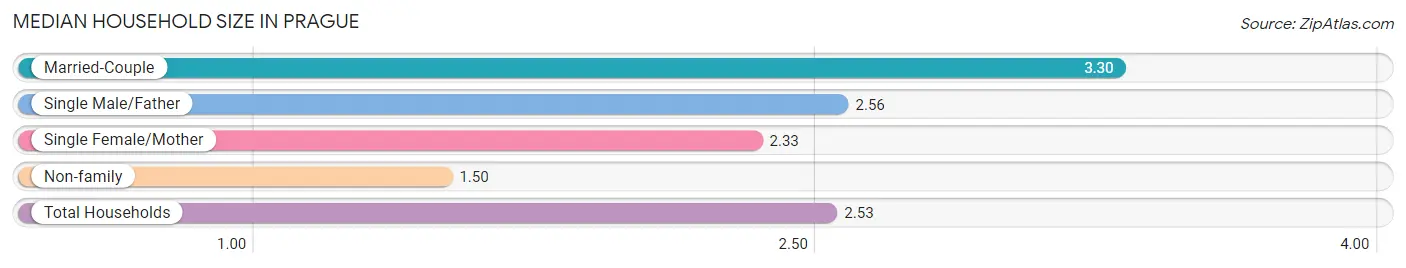
| Household Type | # Households | Household Size |
| Married-Couple | 71 (52.6%) | 3.30 |
| Single Male/Father | 9 (6.7%) | 2.56 |
| Single Female/Mother | 3 (2.2%) | 2.33 |
| Non-family | 52 (38.5%) | 1.50 |
| Total Households | 135 (100.0%) | 2.53 |
Household Size by Marriage Status in Prague
Out of a total of 135 households in Prague, 83 (61.5%) are family households, while 52 (38.5%) are nonfamily households. The most numerous type of family households are 2-person households, comprising 28, and the most common type of nonfamily households are 1-person households, comprising 33.
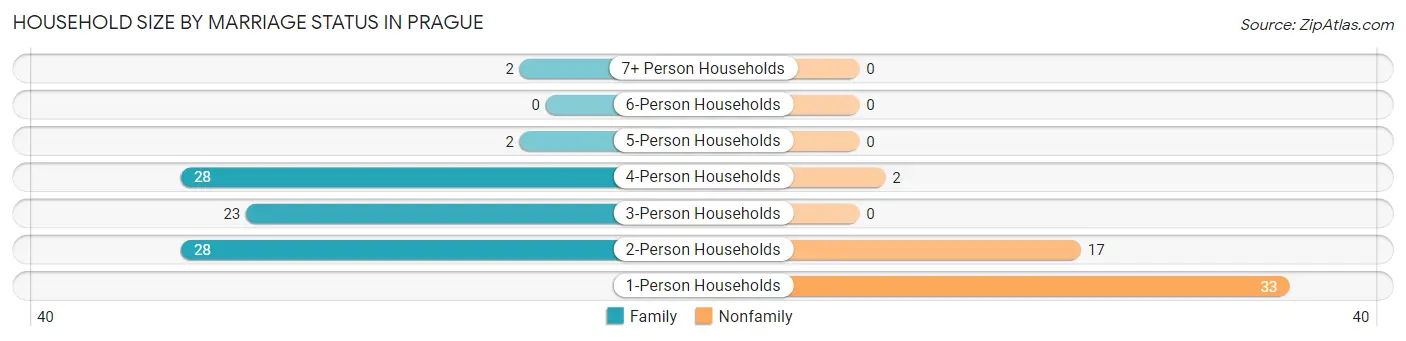
| Household Size | Family Households | Nonfamily Households |
| 1-Person Households | - | 33 (24.4%) |
| 2-Person Households | 28 (20.7%) | 17 (12.6%) |
| 3-Person Households | 23 (17.0%) | 0 (0.0%) |
| 4-Person Households | 28 (20.7%) | 2 (1.5%) |
| 5-Person Households | 2 (1.5%) | 0 (0.0%) |
| 6-Person Households | 0 (0.0%) | 0 (0.0%) |
| 7+ Person Households | 2 (1.5%) | 0 (0.0%) |
| Total | 83 (61.5%) | 52 (38.5%) |
Female Fertility in Prague
Fertility by Age in Prague
| Age Bracket | Women with Births | Births / 1,000 Women |
| 15 to 19 years | 0 (0.0%) | 0.0 |
| 20 to 34 years | 0 (0.0%) | 0.0 |
| 35 to 50 years | 0 (0.0%) | 0.0 |
| Total | 0 (0.0%) | 0.0 |
Fertility by Age by Marriage Status in Prague
| Age Bracket | Married | Unmarried |
| 15 to 19 years | 0 (0.0%) | 0 (0.0%) |
| 20 to 34 years | 0 (0.0%) | 0 (0.0%) |
| 35 to 50 years | 0 (0.0%) | 0 (0.0%) |
| Total | 0 (0.0%) | 0 (0.0%) |
Fertility by Education in Prague
| Educational Attainment | Women with Births | Births / 1,000 Women |
| Less than High School | 0 (0.0%) | 0.0 |
| High School Diploma | 0 (0.0%) | 0.0 |
| College or Associate's Degree | 0 (0.0%) | 0.0 |
| Bachelor's Degree | 0 (0.0%) | 0.0 |
| Graduate Degree | 0 (0.0%) | 0.0 |
| Total | 0 (0.0%) | 0.0 |
Fertility by Education by Marriage Status in Prague
| Educational Attainment | Married | Unmarried |
| Less than High School | 0 (0.0%) | 0 (0.0%) |
| High School Diploma | 0 (0.0%) | 0 (0.0%) |
| College or Associate's Degree | 0 (0.0%) | 0 (0.0%) |
| Bachelor's Degree | 0 (0.0%) | 0 (0.0%) |
| Graduate Degree | 0 (0.0%) | 0 (0.0%) |
| Total | 0 (0.0%) | 0 (0.0%) |
Employment Characteristics in Prague
Employment by Class of Employer in Prague
Among the 201 employed individuals in Prague, private company employees (145 | 72.1%), self-employed (not incorporated) (17 | 8.5%), and federal government employees (12 | 6.0%) make up the most common classes of employment.
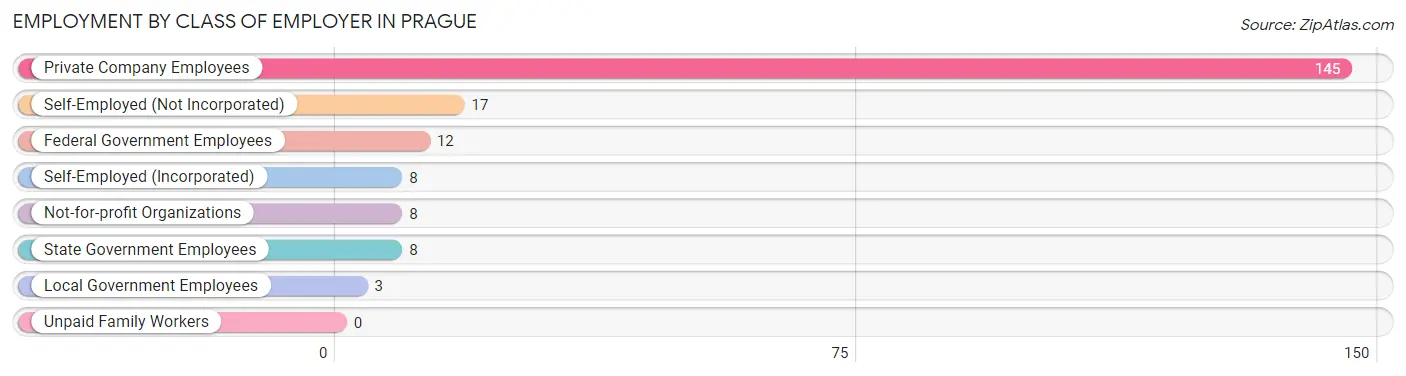
| Employer Class | # Employees | % Employees |
| Private Company Employees | 145 | 72.1% |
| Self-Employed (Incorporated) | 8 | 4.0% |
| Self-Employed (Not Incorporated) | 17 | 8.5% |
| Not-for-profit Organizations | 8 | 4.0% |
| Local Government Employees | 3 | 1.5% |
| State Government Employees | 8 | 4.0% |
| Federal Government Employees | 12 | 6.0% |
| Unpaid Family Workers | 0 | 0.0% |
| Total | 201 | 100.0% |
Employment Status by Age in Prague
According to the labor force statistics for Prague, out of the total population over 16 years of age (298), 72.5% or 216 individuals are in the labor force, with 6.0% or 13 of them unemployed. The age group with the highest labor force participation rate is 20 to 24 years, with 100.0% or 57 individuals in the labor force. Within the labor force, the 16 to 19 years age range has the highest percentage of unemployed individuals, with 33.3% or 4 of them being unemployed.
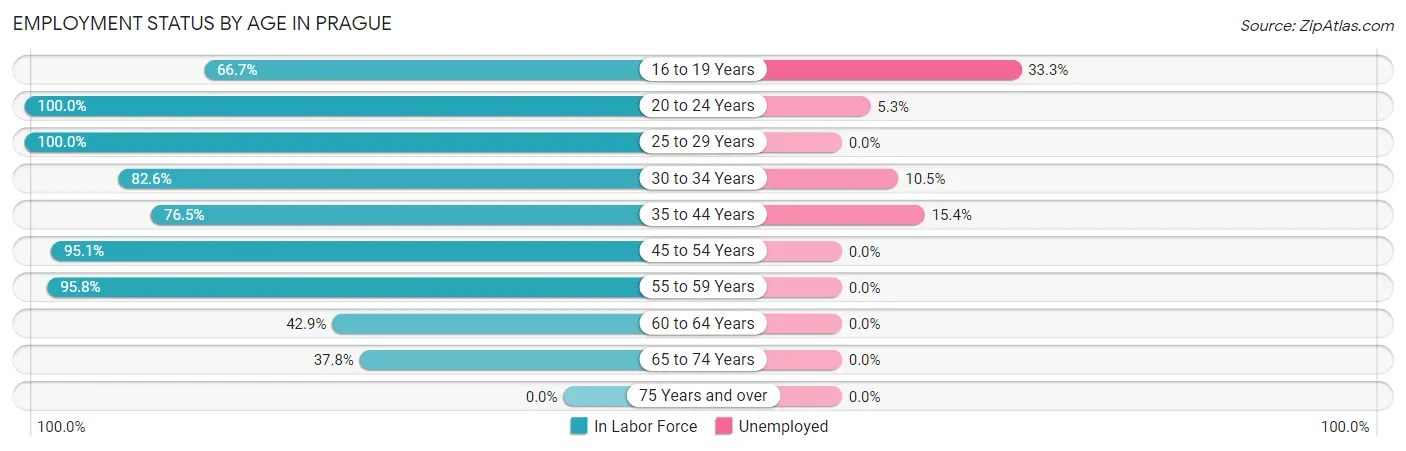
| Age Bracket | In Labor Force | Unemployed |
| 16 to 19 Years | 12 (66.7%) | 4 (33.3%) |
| 20 to 24 Years | 57 (100.0%) | 3 (5.3%) |
| 25 to 29 Years | 17 (100.0%) | 0 (0.0%) |
| 30 to 34 Years | 19 (82.6%) | 2 (10.5%) |
| 35 to 44 Years | 26 (76.5%) | 4 (15.4%) |
| 45 to 54 Years | 39 (95.1%) | 0 (0.0%) |
| 55 to 59 Years | 23 (95.8%) | 0 (0.0%) |
| 60 to 64 Years | 9 (42.9%) | 0 (0.0%) |
| 65 to 74 Years | 14 (37.8%) | 0 (0.0%) |
| 75 Years and over | 0 (0.0%) | 0 (0.0%) |
| Total | 216 (72.5%) | 13 (6.0%) |
Employment Status by Educational Attainment in Prague
According to labor force statistics for Prague, 83.1% of individuals (133) out of the total population between 25 and 64 years of age (160) are in the labor force, with 4.5% or 6 of them being unemployed. The group with the highest labor force participation rate are those with the educational attainment of college / associate degree, with 91.8% or 56 individuals in the labor force. Within the labor force, individuals with high school diploma education have the highest percentage of unemployment, with 6.8% or 4 of them being unemployed.
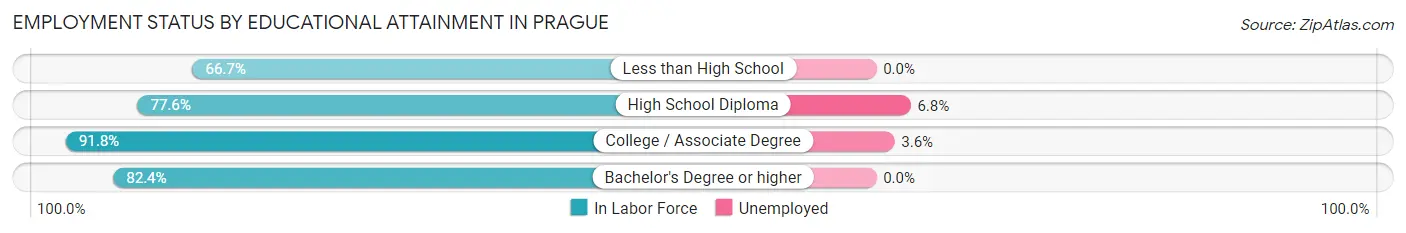
| Educational Attainment | In Labor Force | Unemployed |
| Less than High School | 4 (66.7%) | 0 (0.0%) |
| High School Diploma | 59 (77.6%) | 5 (6.8%) |
| College / Associate Degree | 56 (91.8%) | 2 (3.6%) |
| Bachelor's Degree or higher | 14 (82.4%) | 0 (0.0%) |
| Total | 133 (83.1%) | 7 (4.5%) |
Employment Occupations by Sex in Prague
Management, Business, Science and Arts Occupations
The most common Management, Business, Science and Arts occupations in Prague are Community & Social Service (21 | 10.3%), Management (12 | 5.9%), Arts, Media & Entertainment (12 | 5.9%), Education Instruction & Library (5 | 2.5%), and Education, Arts & Media (4 | 2.0%).
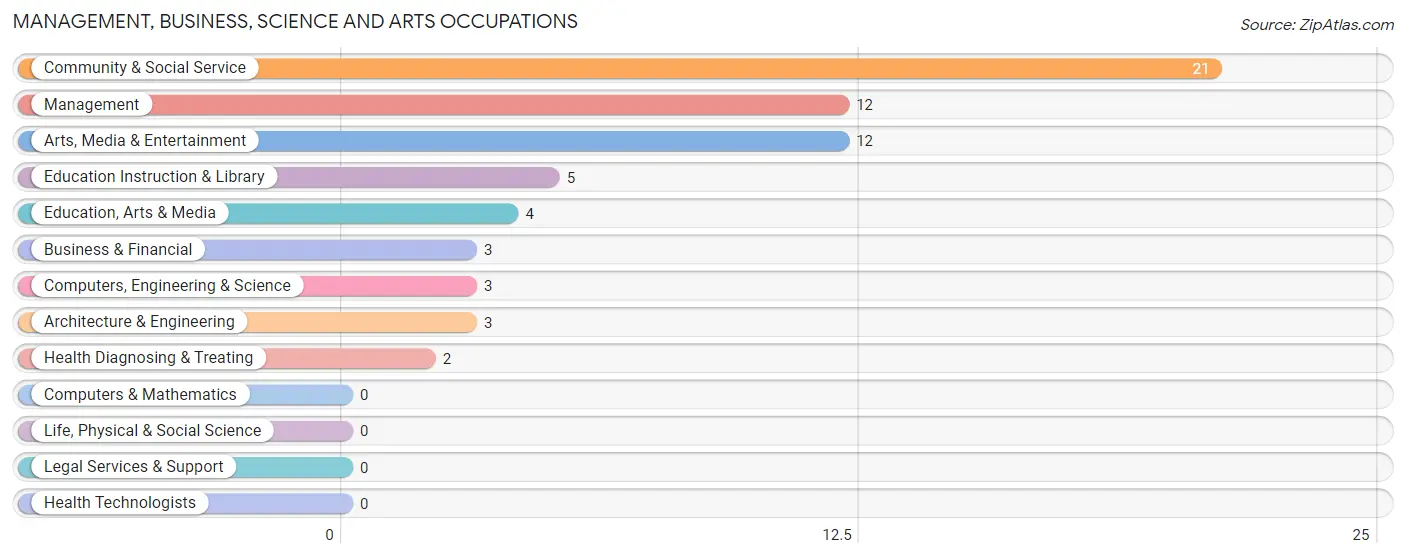
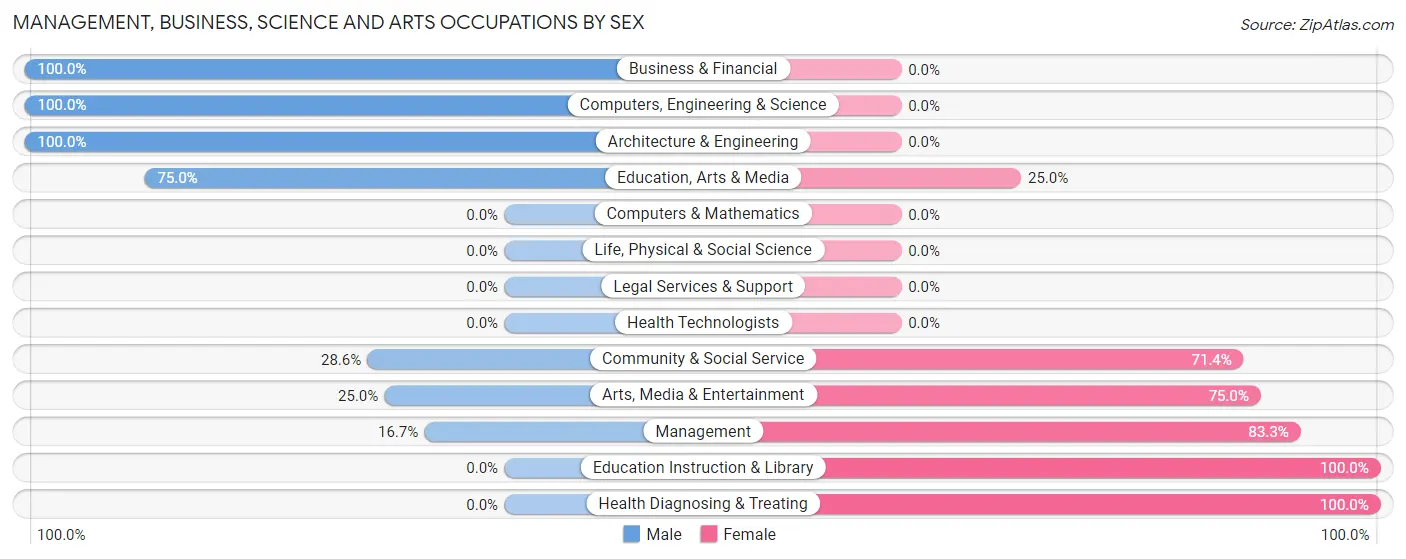
Management, Business, Science and Arts Occupations by Sex
Within the Management, Business, Science and Arts occupations in Prague, the most male-oriented occupations are Business & Financial (100.0%), Computers, Engineering & Science (100.0%), and Architecture & Engineering (100.0%), while the most female-oriented occupations are Education Instruction & Library (100.0%), Health Diagnosing & Treating (100.0%), and Management (83.3%).
| Occupation | Male | Female |
| Management | 2 (16.7%) | 10 (83.3%) |
| Business & Financial | 3 (100.0%) | 0 (0.0%) |
| Computers, Engineering & Science | 3 (100.0%) | 0 (0.0%) |
| Computers & Mathematics | 0 (0.0%) | 0 (0.0%) |
| Architecture & Engineering | 3 (100.0%) | 0 (0.0%) |
| Life, Physical & Social Science | 0 (0.0%) | 0 (0.0%) |
| Community & Social Service | 6 (28.6%) | 15 (71.4%) |
| Education, Arts & Media | 3 (75.0%) | 1 (25.0%) |
| Legal Services & Support | 0 (0.0%) | 0 (0.0%) |
| Education Instruction & Library | 0 (0.0%) | 5 (100.0%) |
| Arts, Media & Entertainment | 3 (25.0%) | 9 (75.0%) |
| Health Diagnosing & Treating | 0 (0.0%) | 2 (100.0%) |
| Health Technologists | 0 (0.0%) | 0 (0.0%) |
| Total (Category) | 14 (34.2%) | 27 (65.8%) |
| Total (Overall) | 110 (54.2%) | 93 (45.8%) |
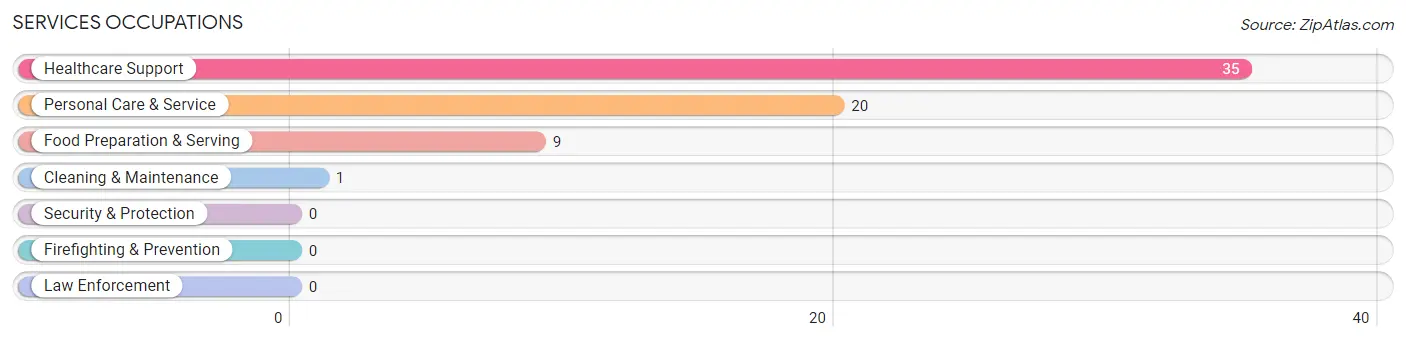
Services Occupations
The most common Services occupations in Prague are Healthcare Support (35 | 17.2%), Personal Care & Service (20 | 9.9%), Food Preparation & Serving (9 | 4.4%), and Cleaning & Maintenance (1 | 0.5%).
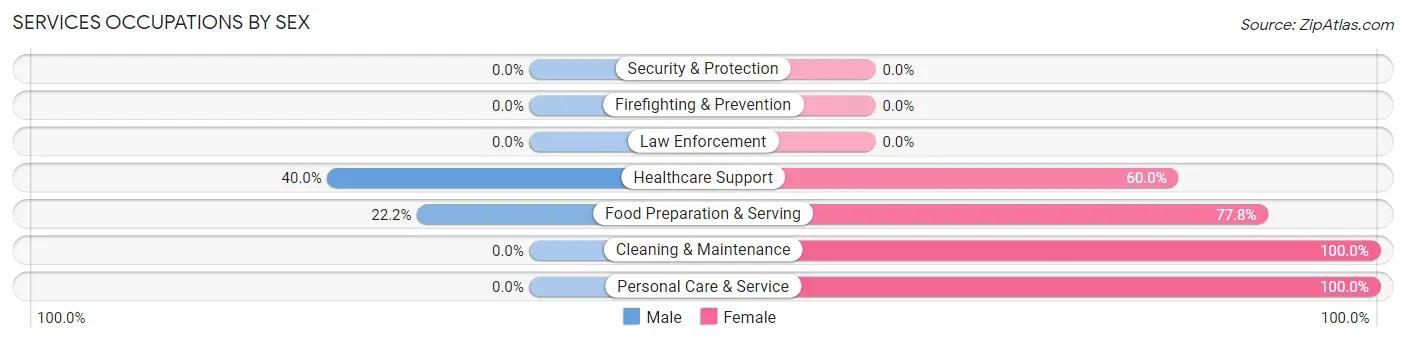
Services Occupations by Sex
Within the Services occupations in Prague, the most male-oriented occupations are Healthcare Support (40.0%), and Food Preparation & Serving (22.2%), while the most female-oriented occupations are Cleaning & Maintenance (100.0%), Personal Care & Service (100.0%), and Food Preparation & Serving (77.8%).
| Occupation | Male | Female |
| Healthcare Support | 14 (40.0%) | 21 (60.0%) |
| Security & Protection | 0 (0.0%) | 0 (0.0%) |
| Firefighting & Prevention | 0 (0.0%) | 0 (0.0%) |
| Law Enforcement | 0 (0.0%) | 0 (0.0%) |
| Food Preparation & Serving | 2 (22.2%) | 7 (77.8%) |
| Cleaning & Maintenance | 0 (0.0%) | 1 (100.0%) |
| Personal Care & Service | 0 (0.0%) | 20 (100.0%) |
| Total (Category) | 16 (24.6%) | 49 (75.4%) |
| Total (Overall) | 110 (54.2%) | 93 (45.8%) |
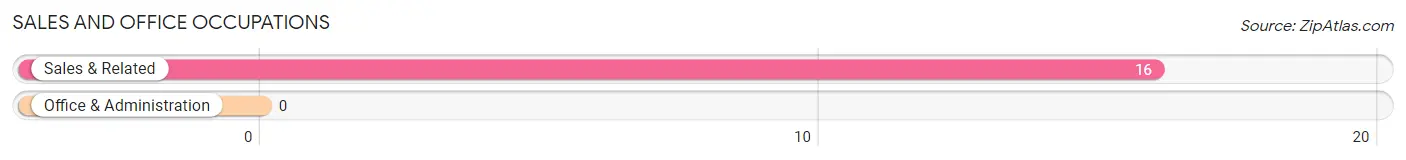
Sales and Office Occupations
The most common Sales and Office occupations in Prague are , and Sales & Related (16 | 7.9%).
Sales and Office Occupations by Sex

| Occupation | Male | Female |
| Sales & Related | 8 (50.0%) | 8 (50.0%) |
| Office & Administration | 0 (0.0%) | 0 (0.0%) |
| Total (Category) | 8 (50.0%) | 8 (50.0%) |
| Total (Overall) | 110 (54.2%) | 93 (45.8%) |
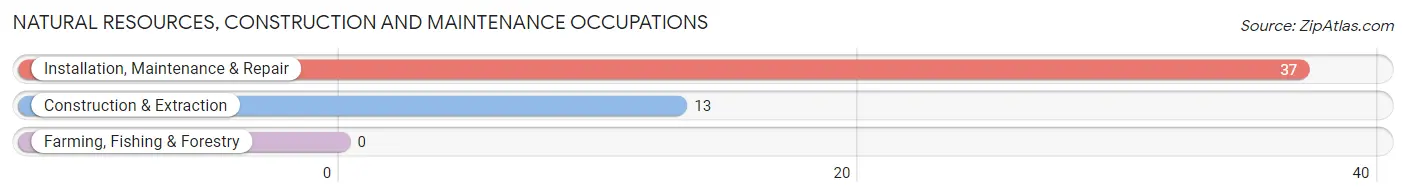
Natural Resources, Construction and Maintenance Occupations
The most common Natural Resources, Construction and Maintenance occupations in Prague are Installation, Maintenance & Repair (37 | 18.2%), and Construction & Extraction (13 | 6.4%).
Natural Resources, Construction and Maintenance Occupations by Sex
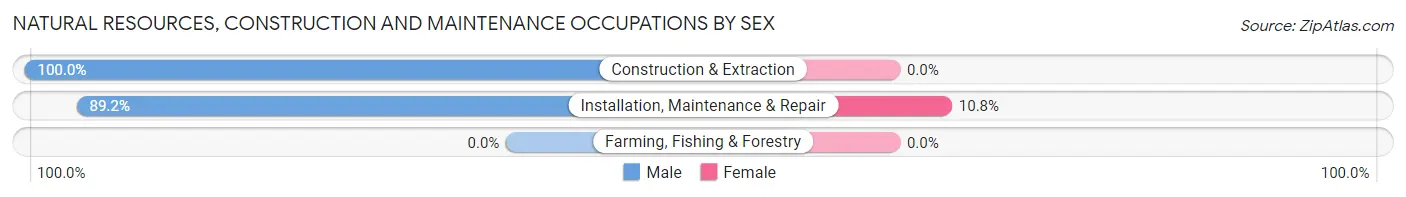
| Occupation | Male | Female |
| Farming, Fishing & Forestry | 0 (0.0%) | 0 (0.0%) |
| Construction & Extraction | 13 (100.0%) | 0 (0.0%) |
| Installation, Maintenance & Repair | 33 (89.2%) | 4 (10.8%) |
| Total (Category) | 46 (92.0%) | 4 (8.0%) |
| Total (Overall) | 110 (54.2%) | 93 (45.8%) |
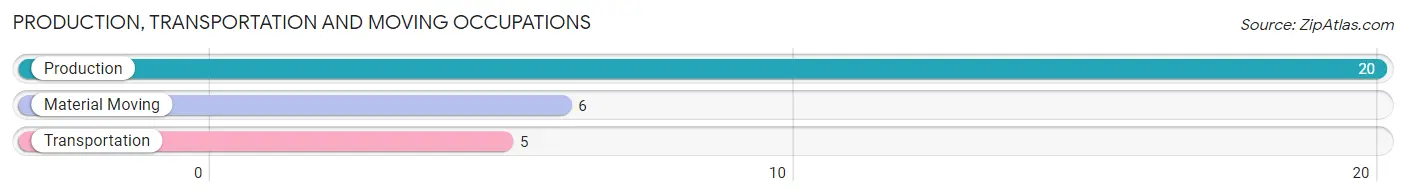
Production, Transportation and Moving Occupations
The most common Production, Transportation and Moving occupations in Prague are Production (20 | 9.9%), Material Moving (6 | 3.0%), and Transportation (5 | 2.5%).
Production, Transportation and Moving Occupations by Sex
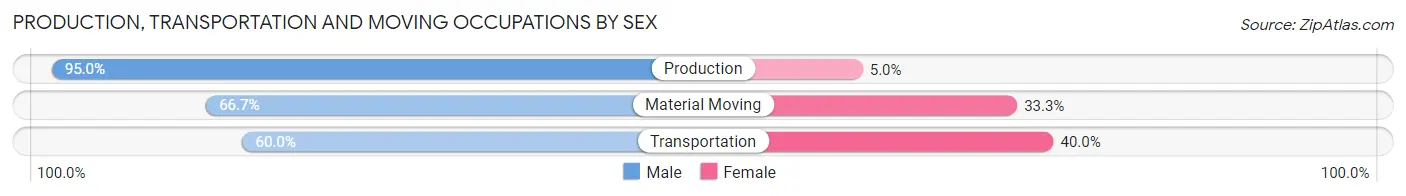
| Occupation | Male | Female |
| Production | 19 (95.0%) | 1 (5.0%) |
| Transportation | 3 (60.0%) | 2 (40.0%) |
| Material Moving | 4 (66.7%) | 2 (33.3%) |
| Total (Category) | 26 (83.9%) | 5 (16.1%) |
| Total (Overall) | 110 (54.2%) | 93 (45.8%) |
Employment Industries by Sex in Prague
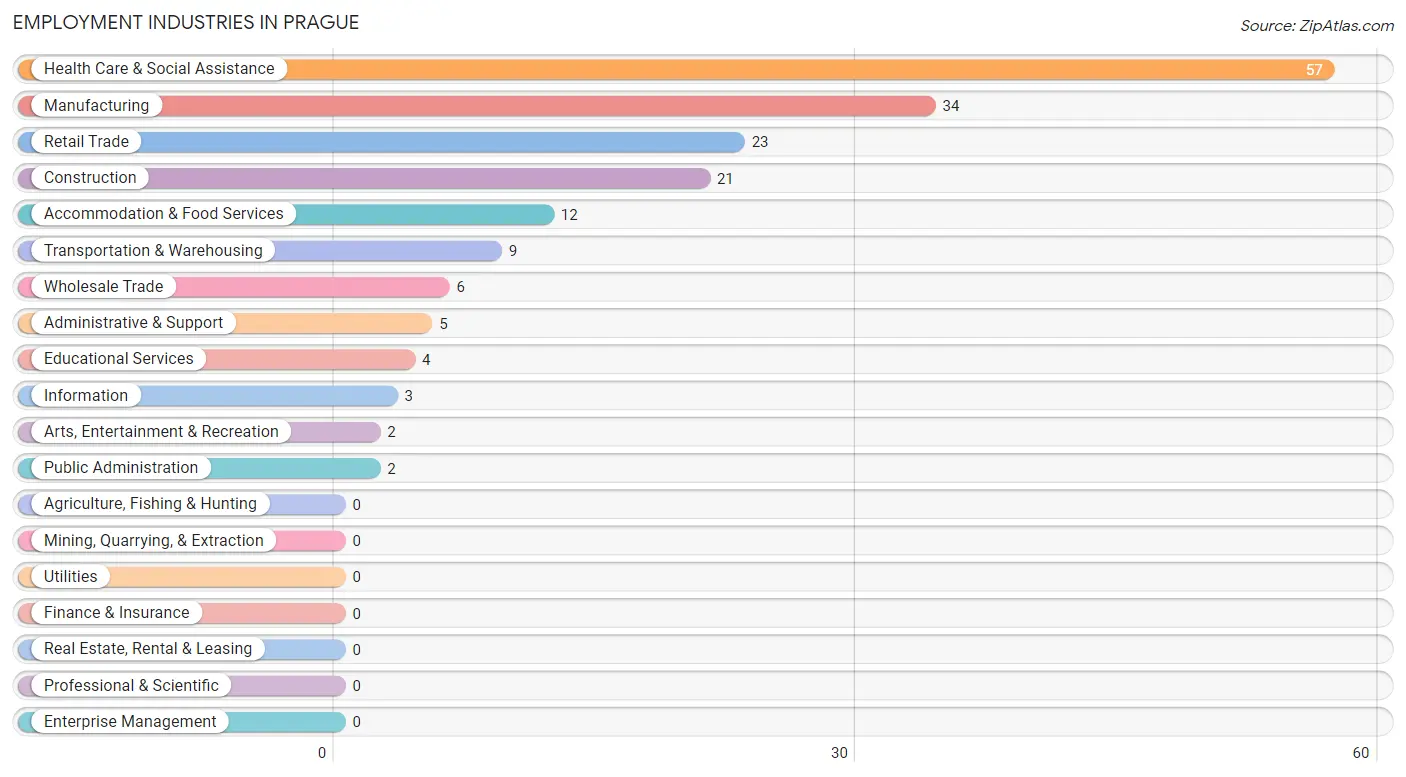
Employment Industries in Prague
The major employment industries in Prague include Health Care & Social Assistance (57 | 28.1%), Manufacturing (34 | 16.8%), Retail Trade (23 | 11.3%), Construction (21 | 10.3%), and Accommodation & Food Services (12 | 5.9%).
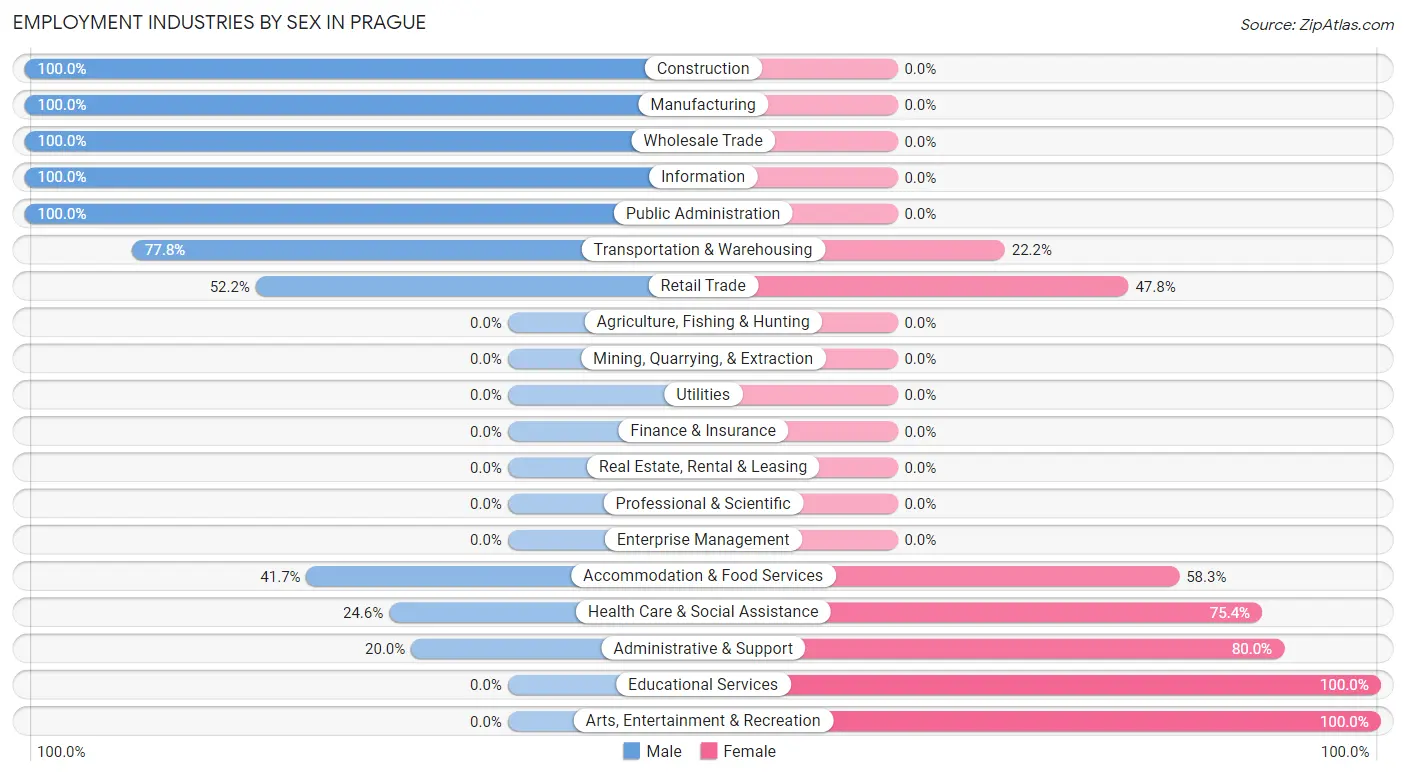
Employment Industries by Sex in Prague
The Prague industries that see more men than women are Construction (100.0%), Manufacturing (100.0%), and Wholesale Trade (100.0%), whereas the industries that tend to have a higher number of women are Educational Services (100.0%), Arts, Entertainment & Recreation (100.0%), and Administrative & Support (80.0%).
| Industry | Male | Female |
| Agriculture, Fishing & Hunting | 0 (0.0%) | 0 (0.0%) |
| Mining, Quarrying, & Extraction | 0 (0.0%) | 0 (0.0%) |
| Construction | 21 (100.0%) | 0 (0.0%) |
| Manufacturing | 34 (100.0%) | 0 (0.0%) |
| Wholesale Trade | 6 (100.0%) | 0 (0.0%) |
| Retail Trade | 12 (52.2%) | 11 (47.8%) |
| Transportation & Warehousing | 7 (77.8%) | 2 (22.2%) |
| Utilities | 0 (0.0%) | 0 (0.0%) |
| Information | 3 (100.0%) | 0 (0.0%) |
| Finance & Insurance | 0 (0.0%) | 0 (0.0%) |
| Real Estate, Rental & Leasing | 0 (0.0%) | 0 (0.0%) |
| Professional & Scientific | 0 (0.0%) | 0 (0.0%) |
| Enterprise Management | 0 (0.0%) | 0 (0.0%) |
| Administrative & Support | 1 (20.0%) | 4 (80.0%) |
| Educational Services | 0 (0.0%) | 4 (100.0%) |
| Health Care & Social Assistance | 14 (24.6%) | 43 (75.4%) |
| Arts, Entertainment & Recreation | 0 (0.0%) | 2 (100.0%) |
| Accommodation & Food Services | 5 (41.7%) | 7 (58.3%) |
| Public Administration | 2 (100.0%) | 0 (0.0%) |
| Total | 110 (54.2%) | 93 (45.8%) |
Education in Prague
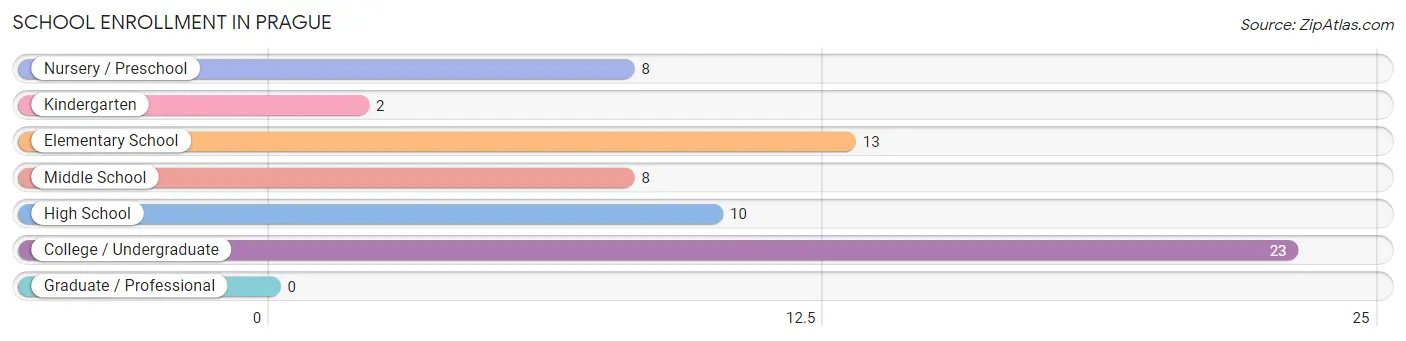
School Enrollment in Prague
The most common levels of schooling among the 64 students in Prague are college / undergraduate (23 | 35.9%), elementary school (13 | 20.3%), and high school (10 | 15.6%).
| School Level | # Students | % Students |
| Nursery / Preschool | 8 | 12.5% |
| Kindergarten | 2 | 3.1% |
| Elementary School | 13 | 20.3% |
| Middle School | 8 | 12.5% |
| High School | 10 | 15.6% |
| College / Undergraduate | 23 | 35.9% |
| Graduate / Professional | 0 | 0.0% |
| Total | 64 | 100.0% |
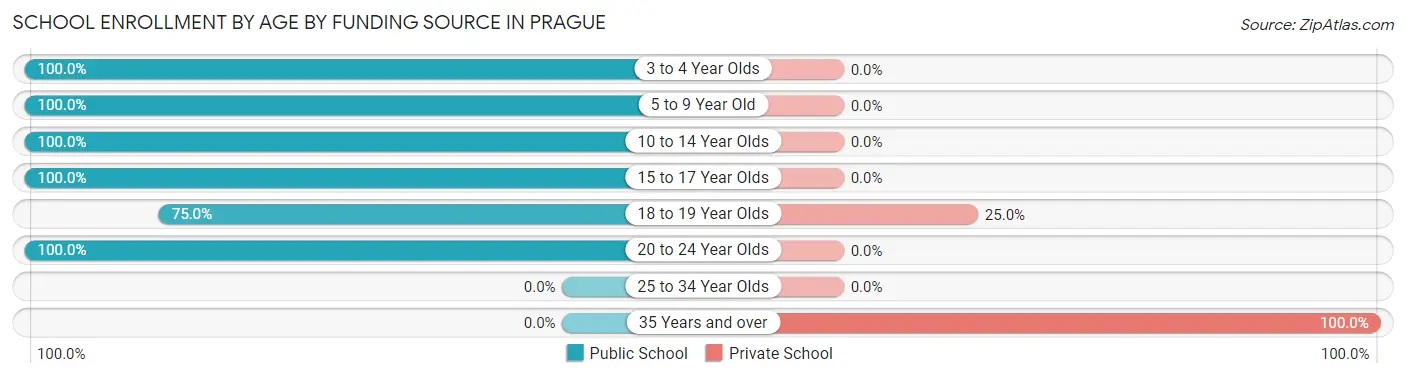
School Enrollment by Age by Funding Source in Prague
Out of a total of 64 students who are enrolled in schools in Prague, 6 (9.4%) attend a private institution, while the remaining 58 (90.6%) are enrolled in public schools. The age group of 35 years and over has the highest likelihood of being enrolled in private schools, with 2 (100.0% in the age bracket) enrolled. Conversely, the age group of 3 to 4 year olds has the lowest likelihood of being enrolled in a private school, with 8 (100.0% in the age bracket) attending a public institution.
| Age Bracket | Public School | Private School |
| 3 to 4 Year Olds | 8 (100.0%) | 0 (0.0%) |
| 5 to 9 Year Old | 6 (100.0%) | 0 (0.0%) |
| 10 to 14 Year Olds | 19 (100.0%) | 0 (0.0%) |
| 15 to 17 Year Olds | 2 (100.0%) | 0 (0.0%) |
| 18 to 19 Year Olds | 12 (75.0%) | 4 (25.0%) |
| 20 to 24 Year Olds | 11 (100.0%) | 0 (0.0%) |
| 25 to 34 Year Olds | 0 (0.0%) | 0 (0.0%) |
| 35 Years and over | 0 (0.0%) | 2 (100.0%) |
| Total | 58 (90.6%) | 6 (9.4%) |
Educational Attainment by Field of Study in Prague
Business (8 | 34.8%), psychology (5 | 21.7%), science & technology (4 | 17.4%), social sciences (2 | 8.7%), and physical & health sciences (1 | 4.3%) are the most common fields of study among 23 individuals in Prague who have obtained a bachelor's degree or higher.
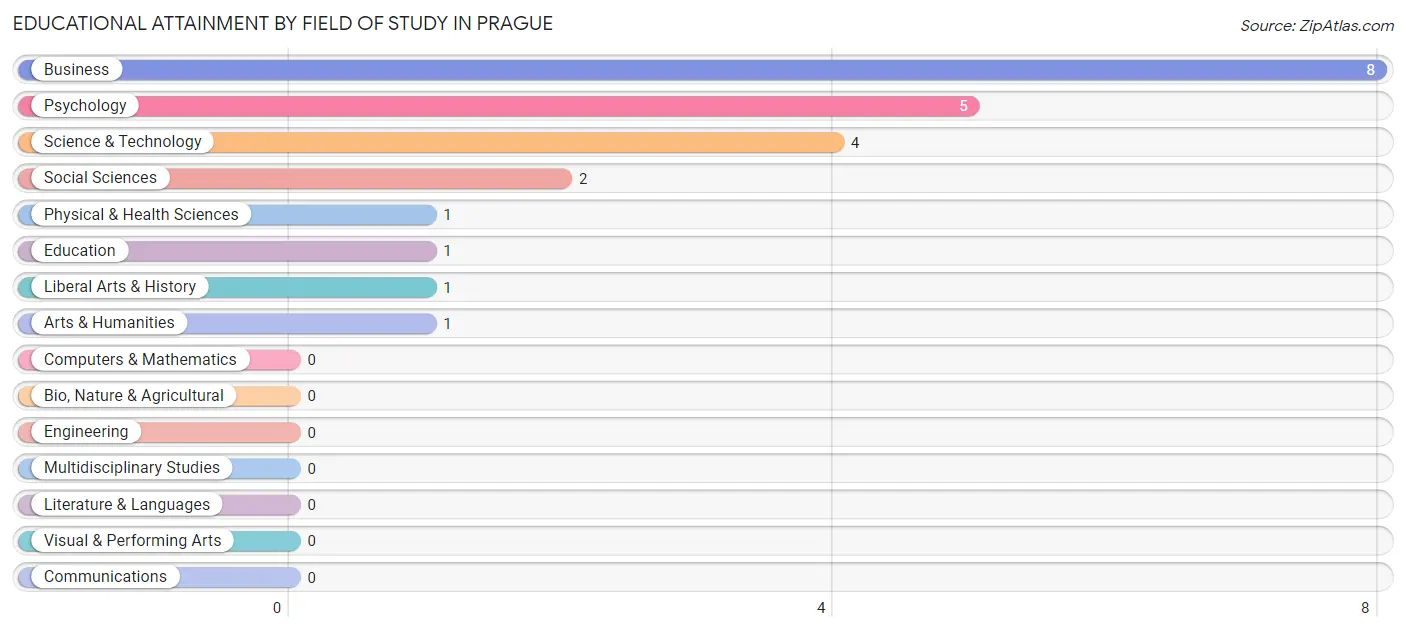
| Field of Study | # Graduates | % Graduates |
| Computers & Mathematics | 0 | 0.0% |
| Bio, Nature & Agricultural | 0 | 0.0% |
| Physical & Health Sciences | 1 | 4.3% |
| Psychology | 5 | 21.7% |
| Social Sciences | 2 | 8.7% |
| Engineering | 0 | 0.0% |
| Multidisciplinary Studies | 0 | 0.0% |
| Science & Technology | 4 | 17.4% |
| Business | 8 | 34.8% |
| Education | 1 | 4.3% |
| Literature & Languages | 0 | 0.0% |
| Liberal Arts & History | 1 | 4.3% |
| Visual & Performing Arts | 0 | 0.0% |
| Communications | 0 | 0.0% |
| Arts & Humanities | 1 | 4.3% |
| Total | 23 | 100.0% |
Transportation & Commute in Prague
Vehicle Availability by Sex in Prague
The most prevalent vehicle ownership categories in Prague are males with 4 vehicles (41, accounting for 37.3%) and females with 4 vehicles (27, making up 45.1%).
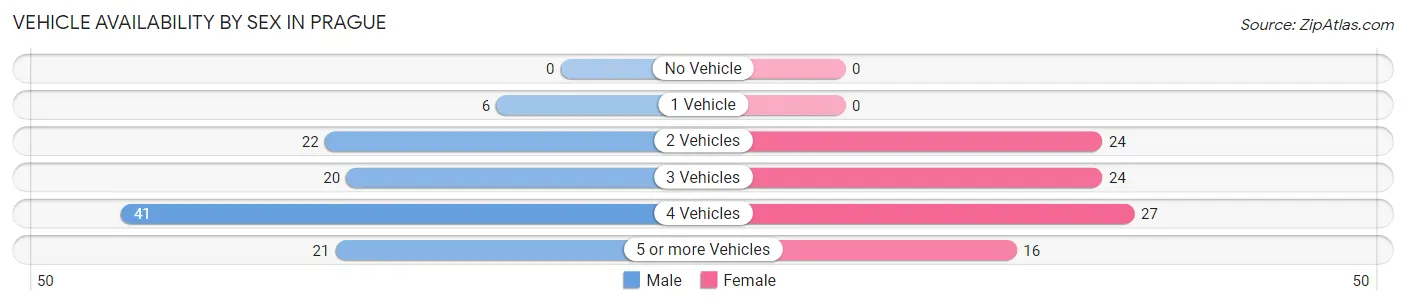
| Vehicles Available | Male | Female |
| No Vehicle | 0 (0.0%) | 0 (0.0%) |
| 1 Vehicle | 6 (5.4%) | 0 (0.0%) |
| 2 Vehicles | 22 (20.0%) | 24 (26.4%) |
| 3 Vehicles | 20 (18.2%) | 24 (26.4%) |
| 4 Vehicles | 41 (37.3%) | 27 (29.7%) |
| 5 or more Vehicles | 21 (19.1%) | 16 (17.6%) |
| Total | 110 (100.0%) | 91 (100.0%) |
Commute Time in Prague
The most frequently occuring commute durations in Prague are 30 to 34 minutes (42 commuters, 21.5%), 20 to 24 minutes (32 commuters, 16.4%), and 45 to 59 minutes (27 commuters, 13.9%).
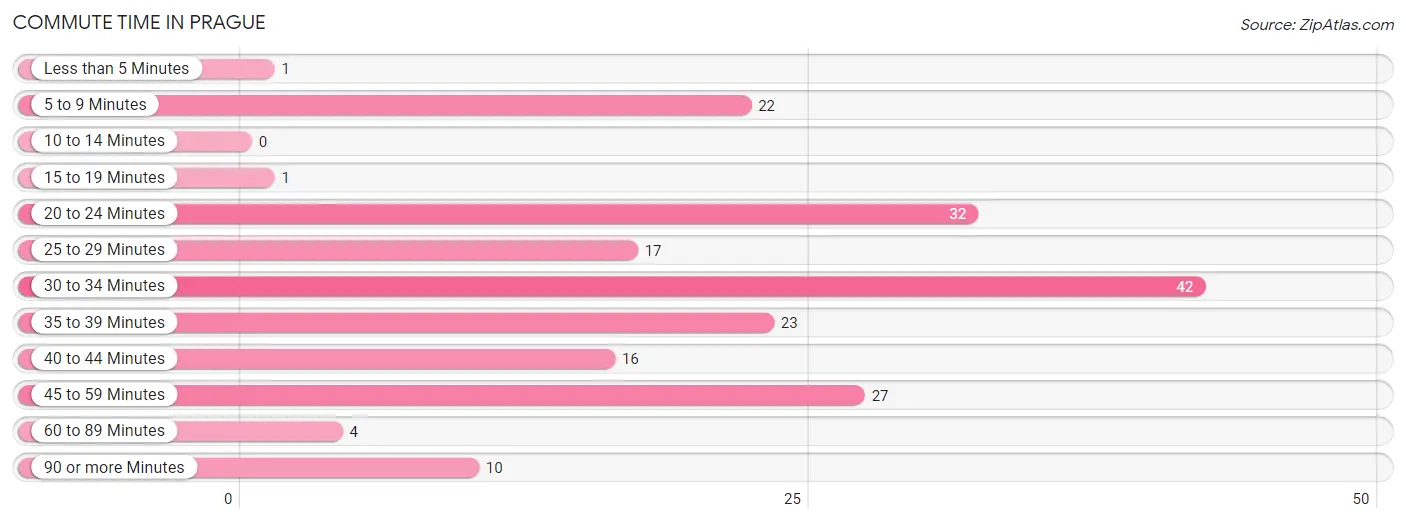
| Commute Time | # Commuters | % Commuters |
| Less than 5 Minutes | 1 | 0.5% |
| 5 to 9 Minutes | 22 | 11.3% |
| 10 to 14 Minutes | 0 | 0.0% |
| 15 to 19 Minutes | 1 | 0.5% |
| 20 to 24 Minutes | 32 | 16.4% |
| 25 to 29 Minutes | 17 | 8.7% |
| 30 to 34 Minutes | 42 | 21.5% |
| 35 to 39 Minutes | 23 | 11.8% |
| 40 to 44 Minutes | 16 | 8.2% |
| 45 to 59 Minutes | 27 | 13.9% |
| 60 to 89 Minutes | 4 | 2.1% |
| 90 or more Minutes | 10 | 5.1% |
Commute Time by Sex in Prague
The most common commute times in Prague are 35 to 39 minutes (22 commuters, 20.9%) for males and 30 to 34 minutes (23 commuters, 25.6%) for females.
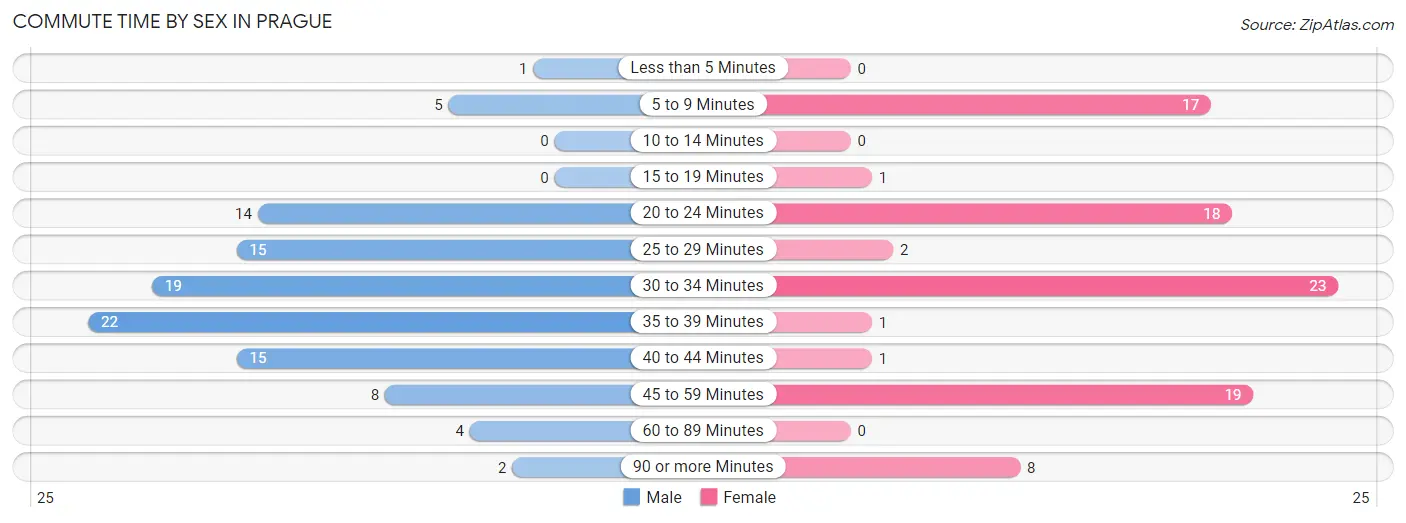
| Commute Time | Male | Female |
| Less than 5 Minutes | 1 (0.9%) | 0 (0.0%) |
| 5 to 9 Minutes | 5 (4.8%) | 17 (18.9%) |
| 10 to 14 Minutes | 0 (0.0%) | 0 (0.0%) |
| 15 to 19 Minutes | 0 (0.0%) | 1 (1.1%) |
| 20 to 24 Minutes | 14 (13.3%) | 18 (20.0%) |
| 25 to 29 Minutes | 15 (14.3%) | 2 (2.2%) |
| 30 to 34 Minutes | 19 (18.1%) | 23 (25.6%) |
| 35 to 39 Minutes | 22 (20.9%) | 1 (1.1%) |
| 40 to 44 Minutes | 15 (14.3%) | 1 (1.1%) |
| 45 to 59 Minutes | 8 (7.6%) | 19 (21.1%) |
| 60 to 89 Minutes | 4 (3.8%) | 0 (0.0%) |
| 90 or more Minutes | 2 (1.9%) | 8 (8.9%) |
Time of Departure to Work by Sex in Prague
The most frequent times of departure to work in Prague are 5:30 AM to 5:59 AM (23, 21.9%) for males and 9:00 AM to 9:59 AM (20, 22.2%) for females.
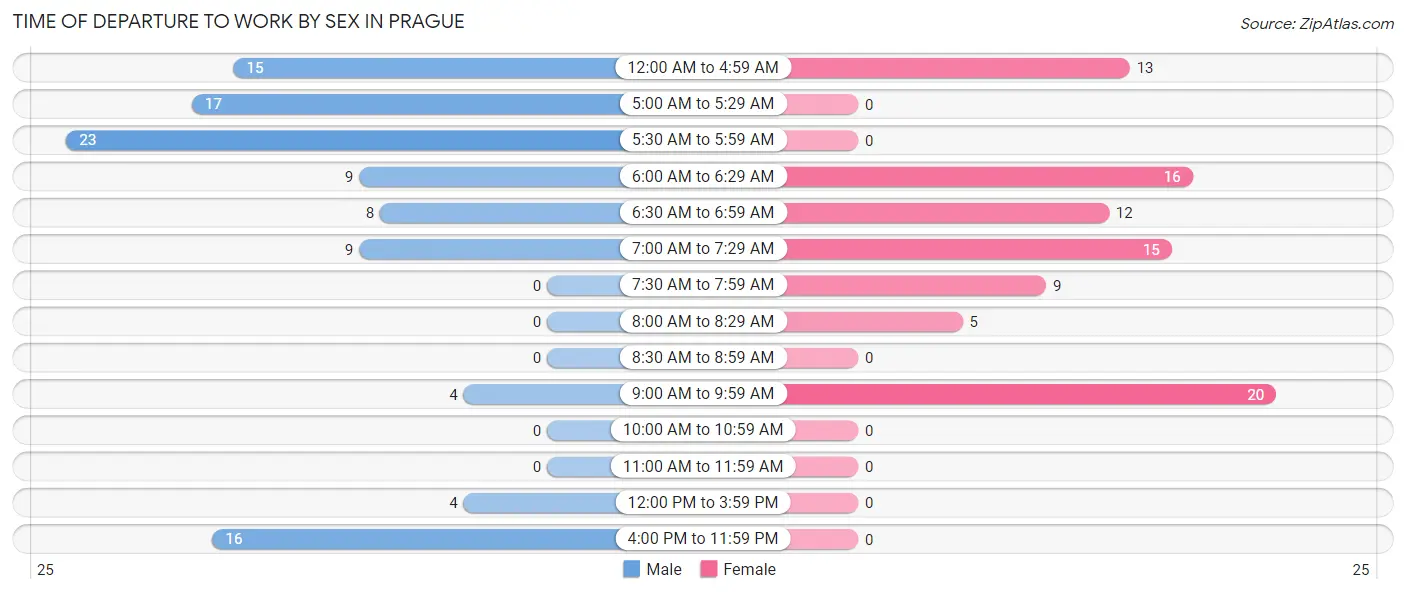
| Time of Departure | Male | Female |
| 12:00 AM to 4:59 AM | 15 (14.3%) | 13 (14.4%) |
| 5:00 AM to 5:29 AM | 17 (16.2%) | 0 (0.0%) |
| 5:30 AM to 5:59 AM | 23 (21.9%) | 0 (0.0%) |
| 6:00 AM to 6:29 AM | 9 (8.6%) | 16 (17.8%) |
| 6:30 AM to 6:59 AM | 8 (7.6%) | 12 (13.3%) |
| 7:00 AM to 7:29 AM | 9 (8.6%) | 15 (16.7%) |
| 7:30 AM to 7:59 AM | 0 (0.0%) | 9 (10.0%) |
| 8:00 AM to 8:29 AM | 0 (0.0%) | 5 (5.6%) |
| 8:30 AM to 8:59 AM | 0 (0.0%) | 0 (0.0%) |
| 9:00 AM to 9:59 AM | 4 (3.8%) | 20 (22.2%) |
| 10:00 AM to 10:59 AM | 0 (0.0%) | 0 (0.0%) |
| 11:00 AM to 11:59 AM | 0 (0.0%) | 0 (0.0%) |
| 12:00 PM to 3:59 PM | 4 (3.8%) | 0 (0.0%) |
| 4:00 PM to 11:59 PM | 16 (15.2%) | 0 (0.0%) |
| Total | 105 (100.0%) | 90 (100.0%) |
Housing Occupancy in Prague
Occupancy by Ownership in Prague
Of the total 135 dwellings in Prague, owner-occupied units account for 122 (90.4%), while renter-occupied units make up 13 (9.6%).
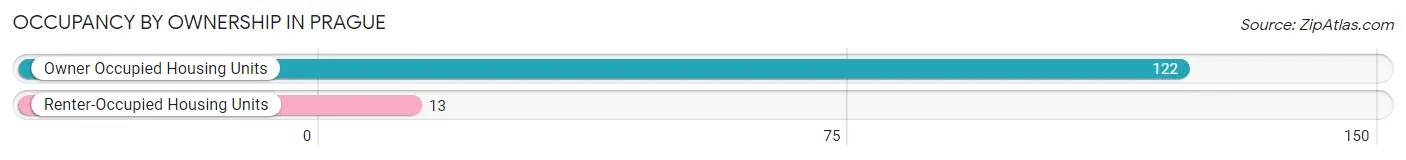
| Occupancy | # Housing Units | % Housing Units |
| Owner Occupied Housing Units | 122 | 90.4% |
| Renter-Occupied Housing Units | 13 | 9.6% |
| Total Occupied Housing Units | 135 | 100.0% |
Occupancy by Household Size in Prague
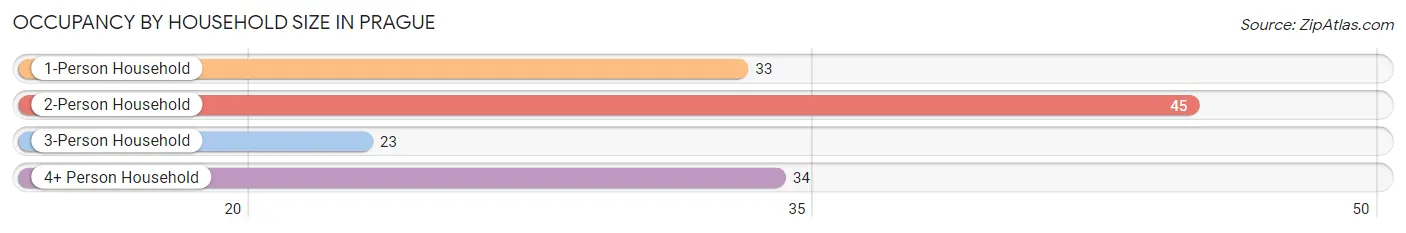
| Household Size | # Housing Units | % Housing Units |
| 1-Person Household | 33 | 24.4% |
| 2-Person Household | 45 | 33.3% |
| 3-Person Household | 23 | 17.0% |
| 4+ Person Household | 34 | 25.2% |
| Total Housing Units | 135 | 100.0% |
Occupancy by Ownership by Household Size in Prague
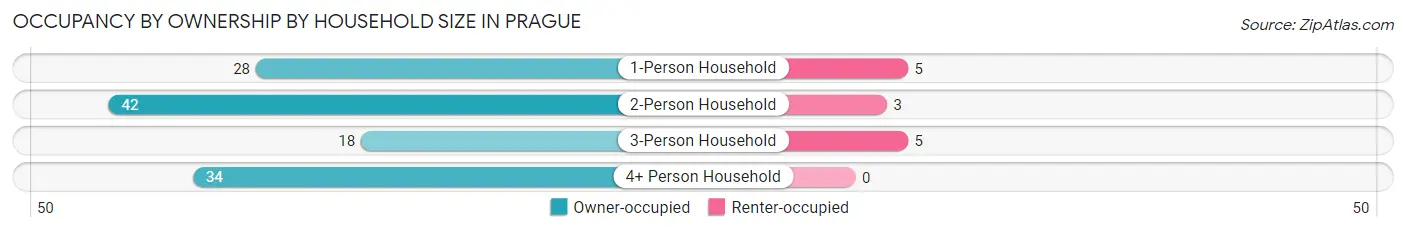
| Household Size | Owner-occupied | Renter-occupied |
| 1-Person Household | 28 (84.9%) | 5 (15.1%) |
| 2-Person Household | 42 (93.3%) | 3 (6.7%) |
| 3-Person Household | 18 (78.3%) | 5 (21.7%) |
| 4+ Person Household | 34 (100.0%) | 0 (0.0%) |
| Total Housing Units | 122 (90.4%) | 13 (9.6%) |
Occupancy by Educational Attainment in Prague
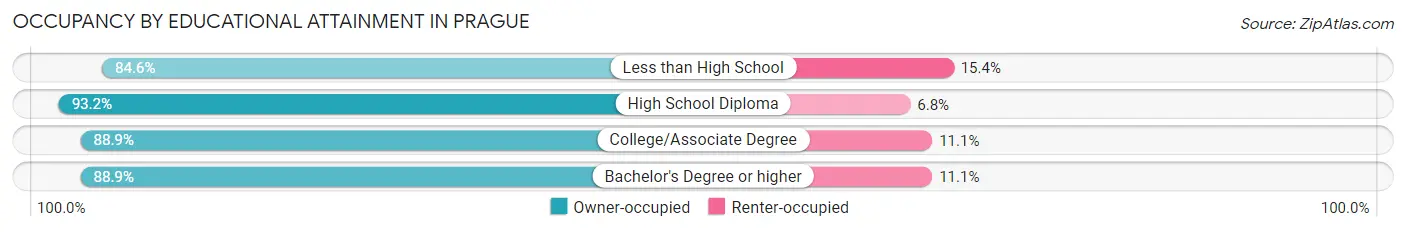
| Household Size | Owner-occupied | Renter-occupied |
| Less than High School | 11 (84.6%) | 2 (15.4%) |
| High School Diploma | 55 (93.2%) | 4 (6.8%) |
| College/Associate Degree | 48 (88.9%) | 6 (11.1%) |
| Bachelor's Degree or higher | 8 (88.9%) | 1 (11.1%) |
Occupancy by Age of Householder in Prague
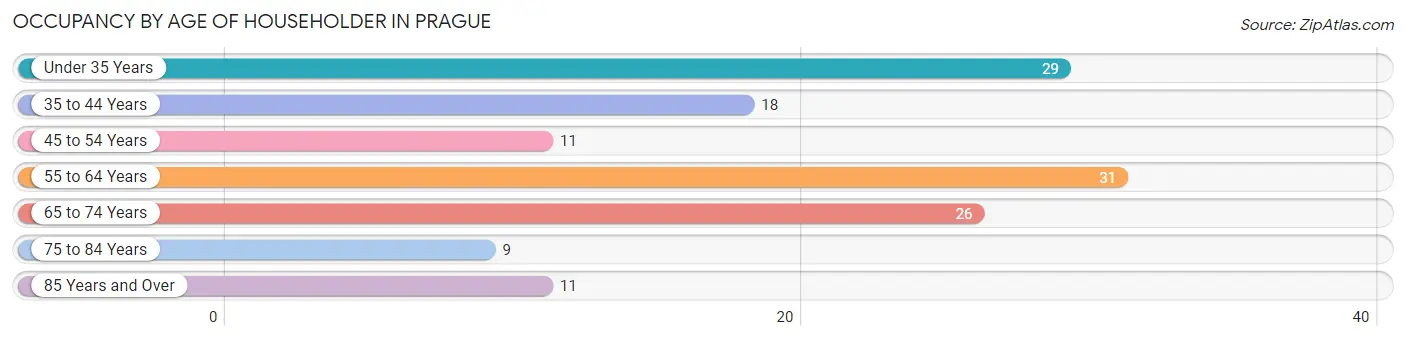
| Age Bracket | # Households | % Households |
| Under 35 Years | 29 | 21.5% |
| 35 to 44 Years | 18 | 13.3% |
| 45 to 54 Years | 11 | 8.2% |
| 55 to 64 Years | 31 | 23.0% |
| 65 to 74 Years | 26 | 19.3% |
| 75 to 84 Years | 9 | 6.7% |
| 85 Years and Over | 11 | 8.2% |
| Total | 135 | 100.0% |
Housing Finances in Prague
Median Income by Occupancy in Prague
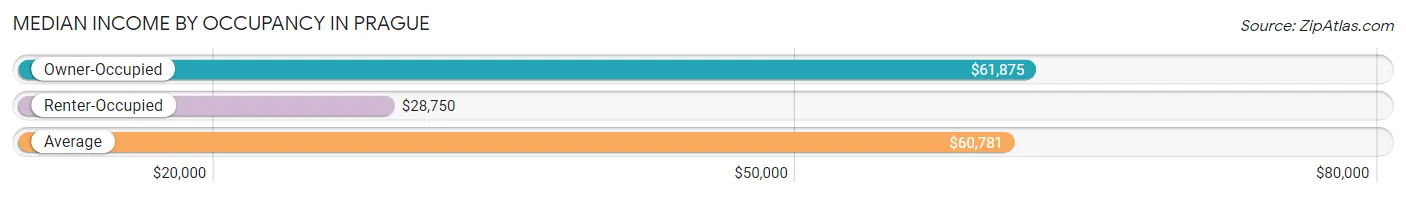
| Occupancy Type | # Households | Median Income |
| Owner-Occupied | 122 (90.4%) | $61,875 |
| Renter-Occupied | 13 (9.6%) | $28,750 |
| Average | 135 (100.0%) | $60,781 |
Occupancy by Householder Income Bracket in Prague
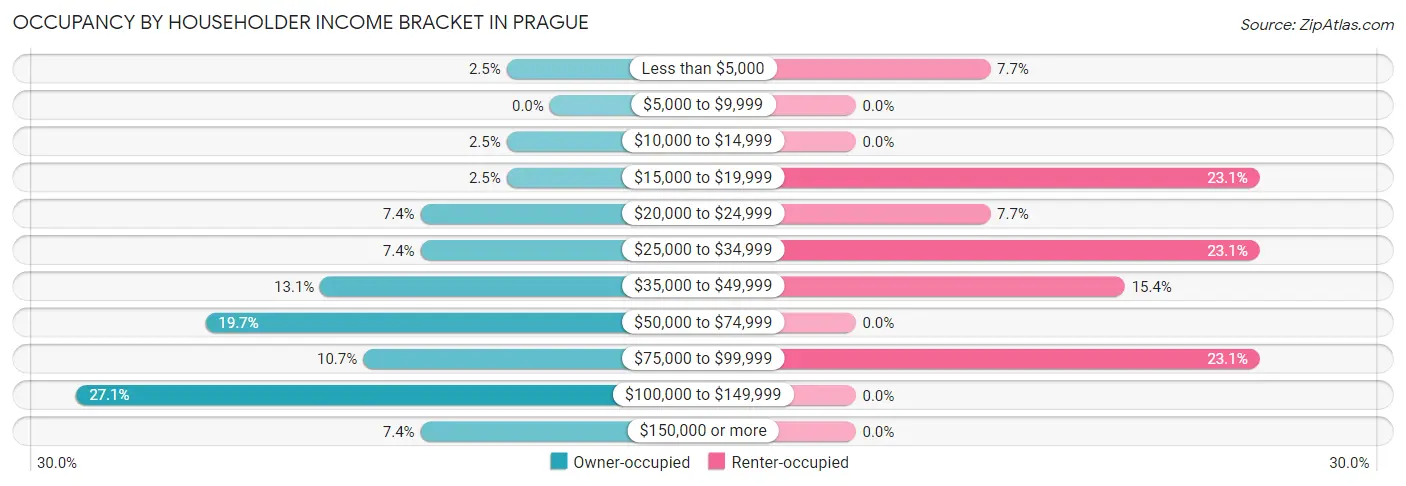
| Income Bracket | Owner-occupied | Renter-occupied |
| Less than $5,000 | 3 (2.5%) | 1 (7.7%) |
| $5,000 to $9,999 | 0 (0.0%) | 0 (0.0%) |
| $10,000 to $14,999 | 3 (2.5%) | 0 (0.0%) |
| $15,000 to $19,999 | 3 (2.5%) | 3 (23.1%) |
| $20,000 to $24,999 | 9 (7.4%) | 1 (7.7%) |
| $25,000 to $34,999 | 9 (7.4%) | 3 (23.1%) |
| $35,000 to $49,999 | 16 (13.1%) | 2 (15.4%) |
| $50,000 to $74,999 | 24 (19.7%) | 0 (0.0%) |
| $75,000 to $99,999 | 13 (10.7%) | 3 (23.1%) |
| $100,000 to $149,999 | 33 (27.1%) | 0 (0.0%) |
| $150,000 or more | 9 (7.4%) | 0 (0.0%) |
| Total | 122 (100.0%) | 13 (100.0%) |
Monthly Housing Cost Tiers in Prague
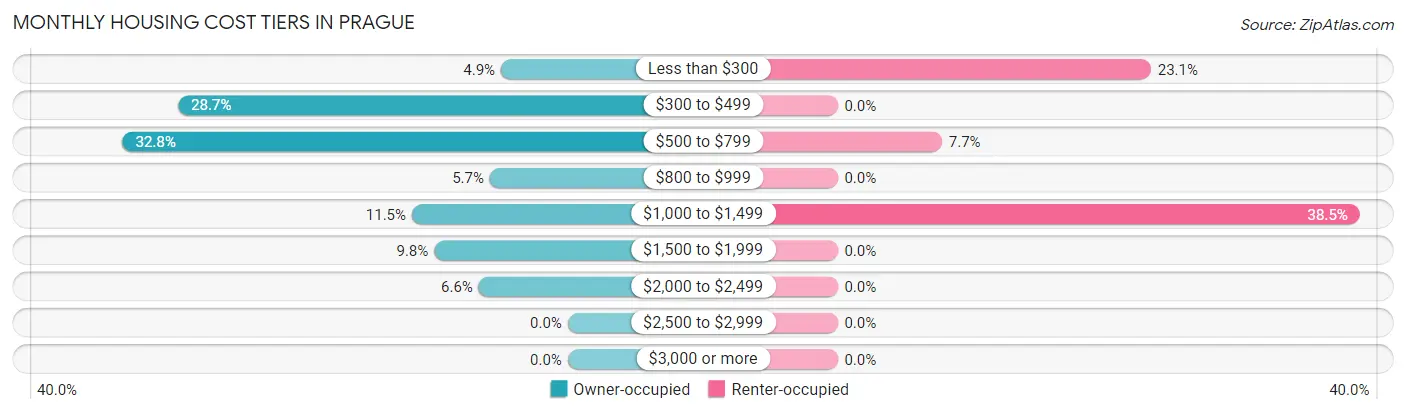
| Monthly Cost | Owner-occupied | Renter-occupied |
| Less than $300 | 6 (4.9%) | 3 (23.1%) |
| $300 to $499 | 35 (28.7%) | 0 (0.0%) |
| $500 to $799 | 40 (32.8%) | 1 (7.7%) |
| $800 to $999 | 7 (5.7%) | 0 (0.0%) |
| $1,000 to $1,499 | 14 (11.5%) | 5 (38.5%) |
| $1,500 to $1,999 | 12 (9.8%) | 0 (0.0%) |
| $2,000 to $2,499 | 8 (6.6%) | 0 (0.0%) |
| $2,500 to $2,999 | 0 (0.0%) | 0 (0.0%) |
| $3,000 or more | 0 (0.0%) | 0 (0.0%) |
| Total | 122 (100.0%) | 13 (100.0%) |
Physical Housing Characteristics in Prague
Housing Structures in Prague
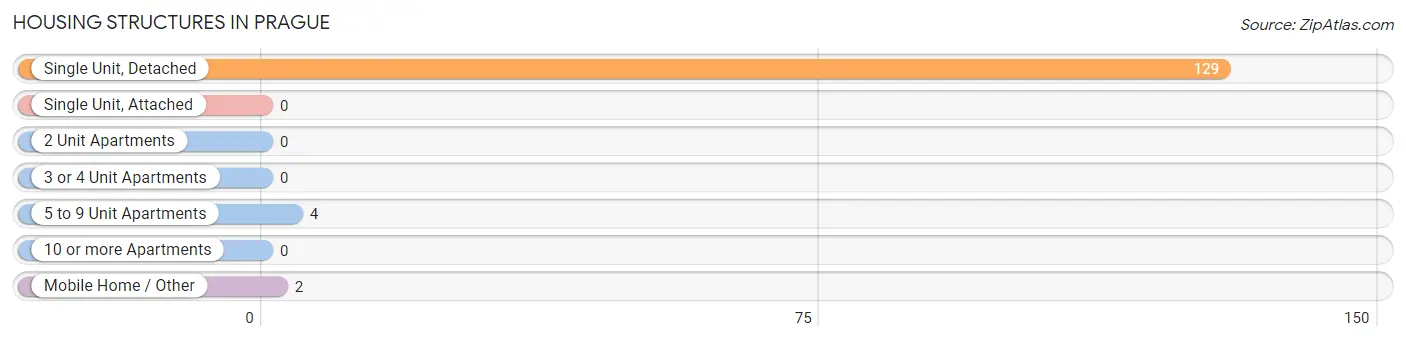
| Structure Type | # Housing Units | % Housing Units |
| Single Unit, Detached | 129 | 95.6% |
| Single Unit, Attached | 0 | 0.0% |
| 2 Unit Apartments | 0 | 0.0% |
| 3 or 4 Unit Apartments | 0 | 0.0% |
| 5 to 9 Unit Apartments | 4 | 3.0% |
| 10 or more Apartments | 0 | 0.0% |
| Mobile Home / Other | 2 | 1.5% |
| Total | 135 | 100.0% |
Housing Structures by Occupancy in Prague
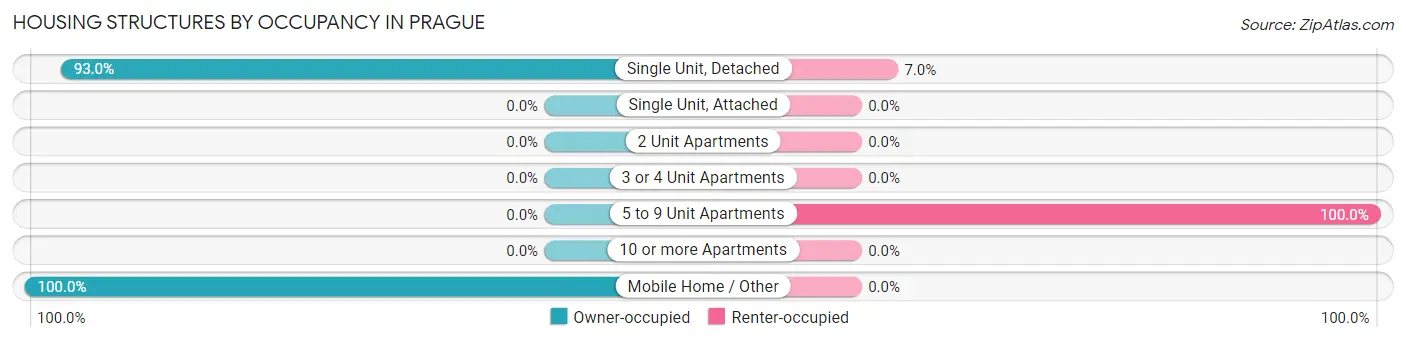
| Structure Type | Owner-occupied | Renter-occupied |
| Single Unit, Detached | 120 (93.0%) | 9 (7.0%) |
| Single Unit, Attached | 0 (0.0%) | 0 (0.0%) |
| 2 Unit Apartments | 0 (0.0%) | 0 (0.0%) |
| 3 or 4 Unit Apartments | 0 (0.0%) | 0 (0.0%) |
| 5 to 9 Unit Apartments | 0 (0.0%) | 4 (100.0%) |
| 10 or more Apartments | 0 (0.0%) | 0 (0.0%) |
| Mobile Home / Other | 2 (100.0%) | 0 (0.0%) |
| Total | 122 (90.4%) | 13 (9.6%) |
Housing Structures by Number of Rooms in Prague
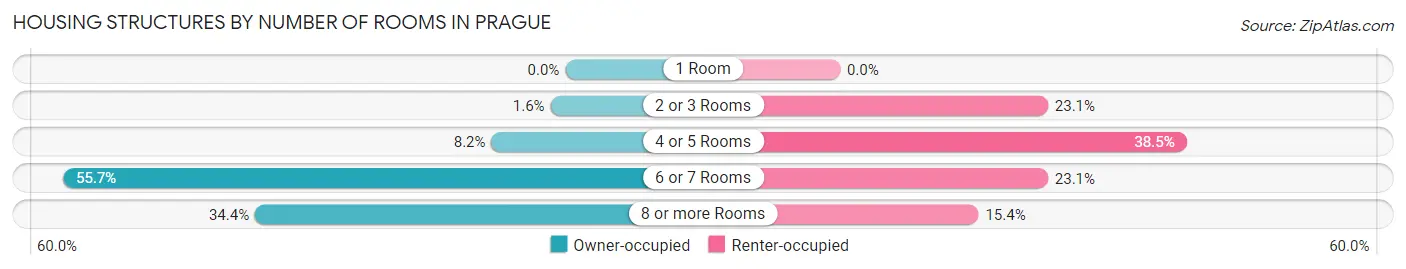
| Number of Rooms | Owner-occupied | Renter-occupied |
| 1 Room | 0 (0.0%) | 0 (0.0%) |
| 2 or 3 Rooms | 2 (1.6%) | 3 (23.1%) |
| 4 or 5 Rooms | 10 (8.2%) | 5 (38.5%) |
| 6 or 7 Rooms | 68 (55.7%) | 3 (23.1%) |
| 8 or more Rooms | 42 (34.4%) | 2 (15.4%) |
| Total | 122 (100.0%) | 13 (100.0%) |
Housing Structure by Heating Type in Prague
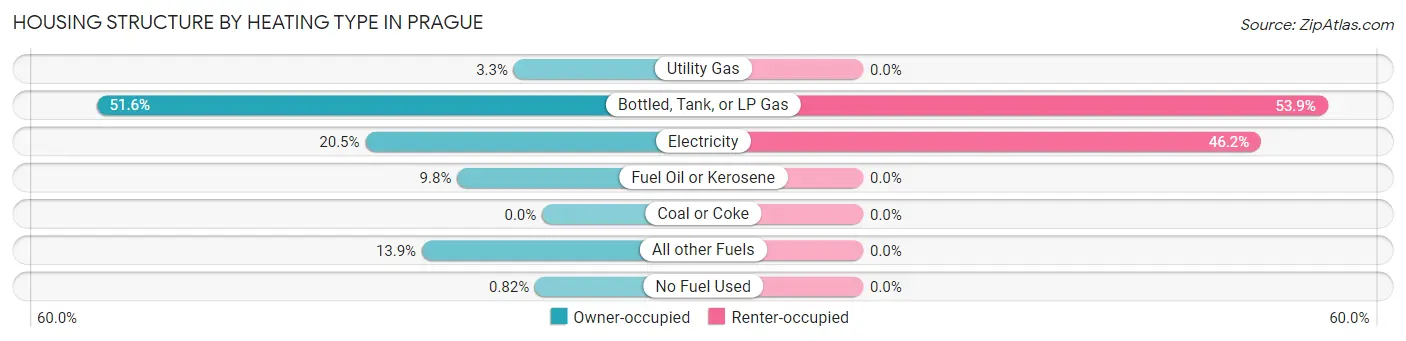
| Heating Type | Owner-occupied | Renter-occupied |
| Utility Gas | 4 (3.3%) | 0 (0.0%) |
| Bottled, Tank, or LP Gas | 63 (51.6%) | 7 (53.8%) |
| Electricity | 25 (20.5%) | 6 (46.2%) |
| Fuel Oil or Kerosene | 12 (9.8%) | 0 (0.0%) |
| Coal or Coke | 0 (0.0%) | 0 (0.0%) |
| All other Fuels | 17 (13.9%) | 0 (0.0%) |
| No Fuel Used | 1 (0.8%) | 0 (0.0%) |
| Total | 122 (100.0%) | 13 (100.0%) |
Household Vehicle Usage in Prague
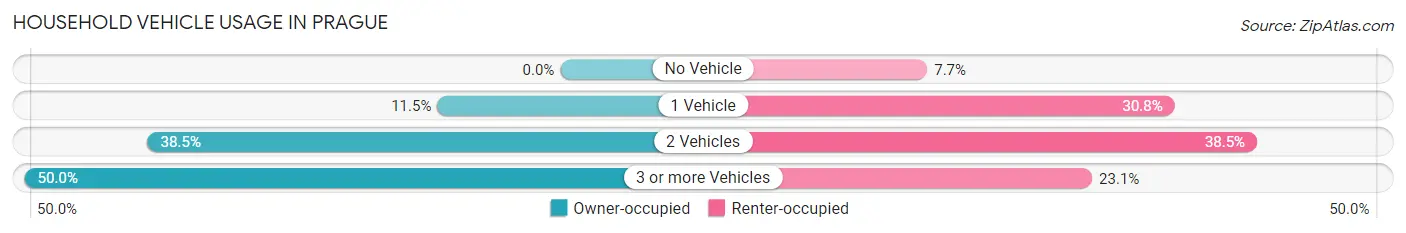
| Vehicles per Household | Owner-occupied | Renter-occupied |
| No Vehicle | 0 (0.0%) | 1 (7.7%) |
| 1 Vehicle | 14 (11.5%) | 4 (30.8%) |
| 2 Vehicles | 47 (38.5%) | 5 (38.5%) |
| 3 or more Vehicles | 61 (50.0%) | 3 (23.1%) |
| Total | 122 (100.0%) | 13 (100.0%) |
Real Estate & Mortgages in Prague
Real Estate and Mortgage Overview in Prague
| Characteristic | Without Mortgage | With Mortgage |
| Housing Units | 68 | 54 |
| Median Property Value | $87,000 | $0 |
| Median Household Income | $50,000 | $9 |
| Monthly Housing Costs | $473 | $0 |
| Real Estate Taxes | $1,338 | $0 |
Property Value by Mortgage Status in Prague
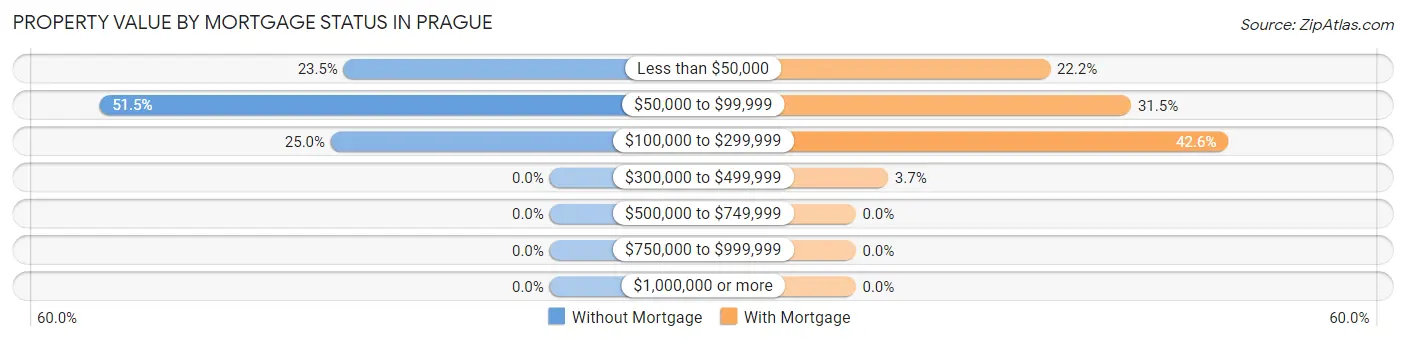
| Property Value | Without Mortgage | With Mortgage |
| Less than $50,000 | 16 (23.5%) | 12 (22.2%) |
| $50,000 to $99,999 | 35 (51.5%) | 17 (31.5%) |
| $100,000 to $299,999 | 17 (25.0%) | 23 (42.6%) |
| $300,000 to $499,999 | 0 (0.0%) | 2 (3.7%) |
| $500,000 to $749,999 | 0 (0.0%) | 0 (0.0%) |
| $750,000 to $999,999 | 0 (0.0%) | 0 (0.0%) |
| $1,000,000 or more | 0 (0.0%) | 0 (0.0%) |
| Total | 68 (100.0%) | 54 (100.0%) |
Household Income by Mortgage Status in Prague
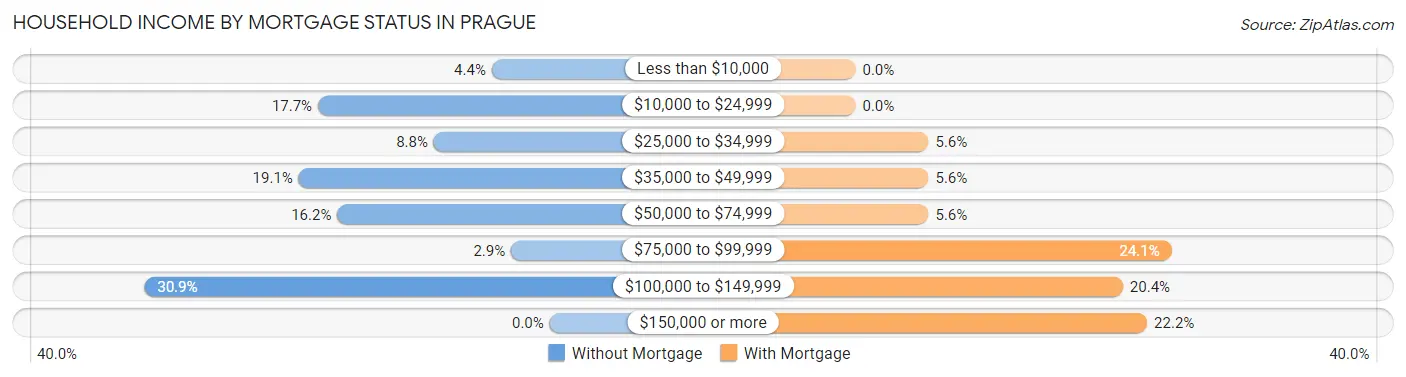
| Household Income | Without Mortgage | With Mortgage |
| Less than $10,000 | 3 (4.4%) | 0 (0.0%) |
| $10,000 to $24,999 | 12 (17.6%) | 0 (0.0%) |
| $25,000 to $34,999 | 6 (8.8%) | 3 (5.6%) |
| $35,000 to $49,999 | 13 (19.1%) | 3 (5.6%) |
| $50,000 to $74,999 | 11 (16.2%) | 3 (5.6%) |
| $75,000 to $99,999 | 2 (2.9%) | 13 (24.1%) |
| $100,000 to $149,999 | 21 (30.9%) | 11 (20.4%) |
| $150,000 or more | 0 (0.0%) | 12 (22.2%) |
| Total | 68 (100.0%) | 54 (100.0%) |
Property Value to Household Income Ratio in Prague
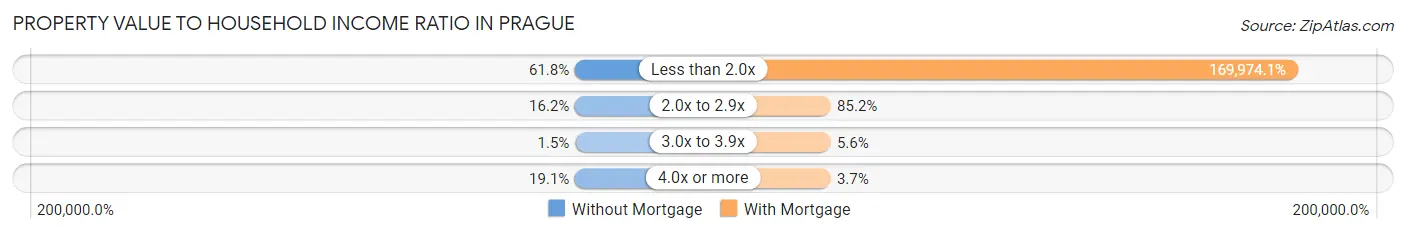
| Value-to-Income Ratio | Without Mortgage | With Mortgage |
| Less than 2.0x | 42 (61.8%) | 91,786 (169,974.1%) |
| 2.0x to 2.9x | 11 (16.2%) | 46 (85.2%) |
| 3.0x to 3.9x | 1 (1.5%) | 3 (5.6%) |
| 4.0x or more | 13 (19.1%) | 2 (3.7%) |
| Total | 68 (100.0%) | 54 (100.0%) |
Real Estate Taxes by Mortgage Status in Prague
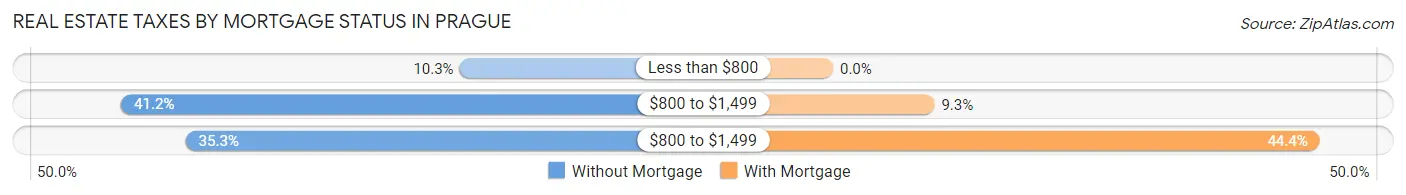
| Property Taxes | Without Mortgage | With Mortgage |
| Less than $800 | 7 (10.3%) | 0 (0.0%) |
| $800 to $1,499 | 28 (41.2%) | 5 (9.3%) |
| $800 to $1,499 | 24 (35.3%) | 24 (44.4%) |
| Total | 68 (100.0%) | 54 (100.0%) |
Health & Disability in Prague
Health Insurance Coverage by Age in Prague
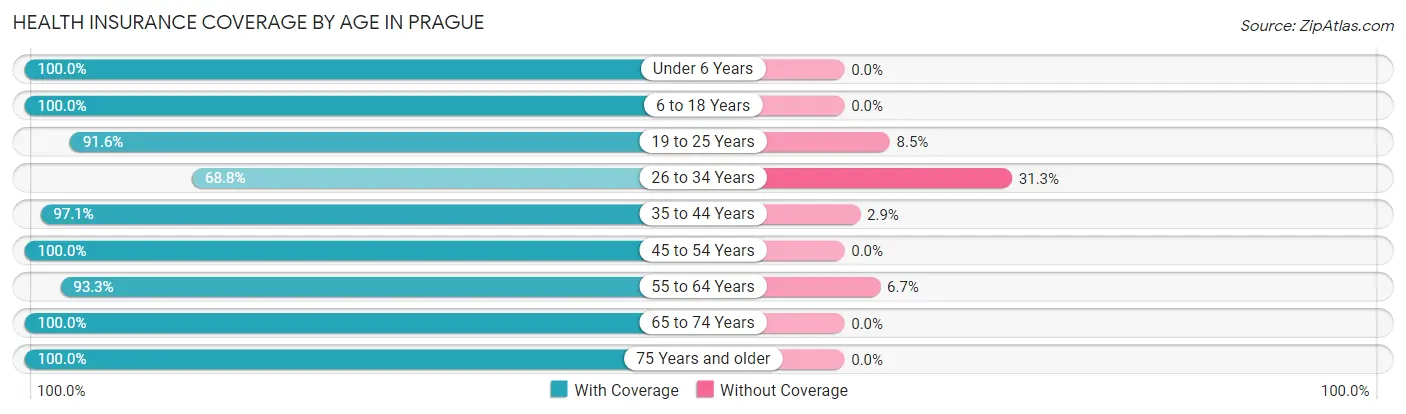
| Age Bracket | With Coverage | Without Coverage |
| Under 6 Years | 16 (100.0%) | 0 (0.0%) |
| 6 to 18 Years | 40 (100.0%) | 0 (0.0%) |
| 19 to 25 Years | 65 (91.5%) | 6 (8.5%) |
| 26 to 34 Years | 22 (68.8%) | 10 (31.2%) |
| 35 to 44 Years | 33 (97.1%) | 1 (2.9%) |
| 45 to 54 Years | 41 (100.0%) | 0 (0.0%) |
| 55 to 64 Years | 42 (93.3%) | 3 (6.7%) |
| 65 to 74 Years | 37 (100.0%) | 0 (0.0%) |
| 75 Years and older | 26 (100.0%) | 0 (0.0%) |
| Total | 322 (94.2%) | 20 (5.9%) |
Health Insurance Coverage by Citizenship Status in Prague
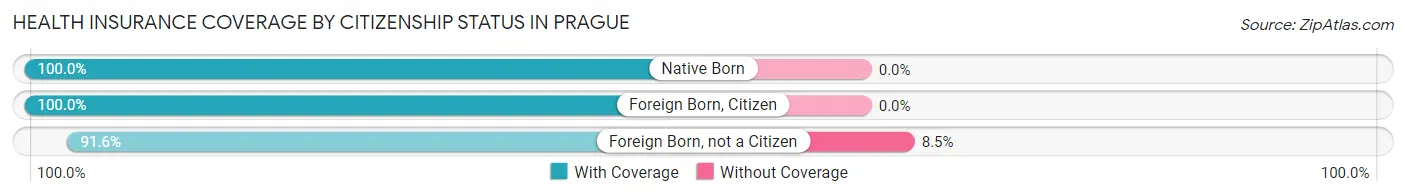
| Citizenship Status | With Coverage | Without Coverage |
| Native Born | 16 (100.0%) | 0 (0.0%) |
| Foreign Born, Citizen | 40 (100.0%) | 0 (0.0%) |
| Foreign Born, not a Citizen | 65 (91.5%) | 6 (8.5%) |
Health Insurance Coverage by Household Income in Prague
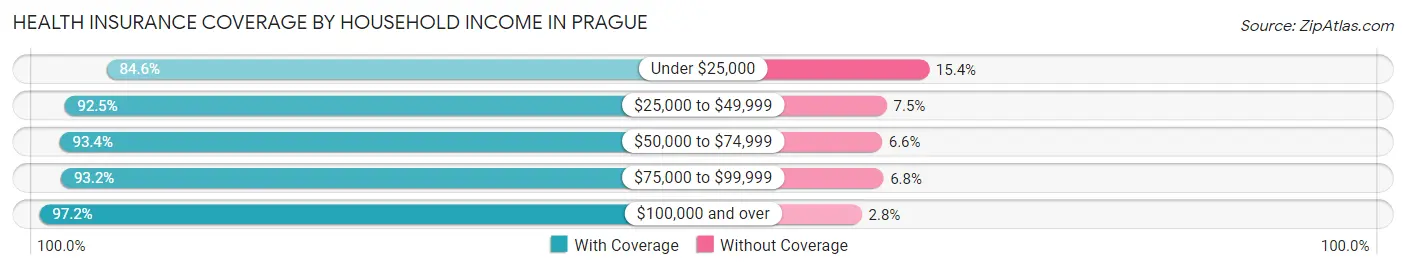
| Household Income | With Coverage | Without Coverage |
| Under $25,000 | 22 (84.6%) | 4 (15.4%) |
| $25,000 to $49,999 | 62 (92.5%) | 5 (7.5%) |
| $50,000 to $74,999 | 57 (93.4%) | 4 (6.6%) |
| $75,000 to $99,999 | 41 (93.2%) | 3 (6.8%) |
| $100,000 and over | 140 (97.2%) | 4 (2.8%) |
Public vs Private Health Insurance Coverage by Age in Prague
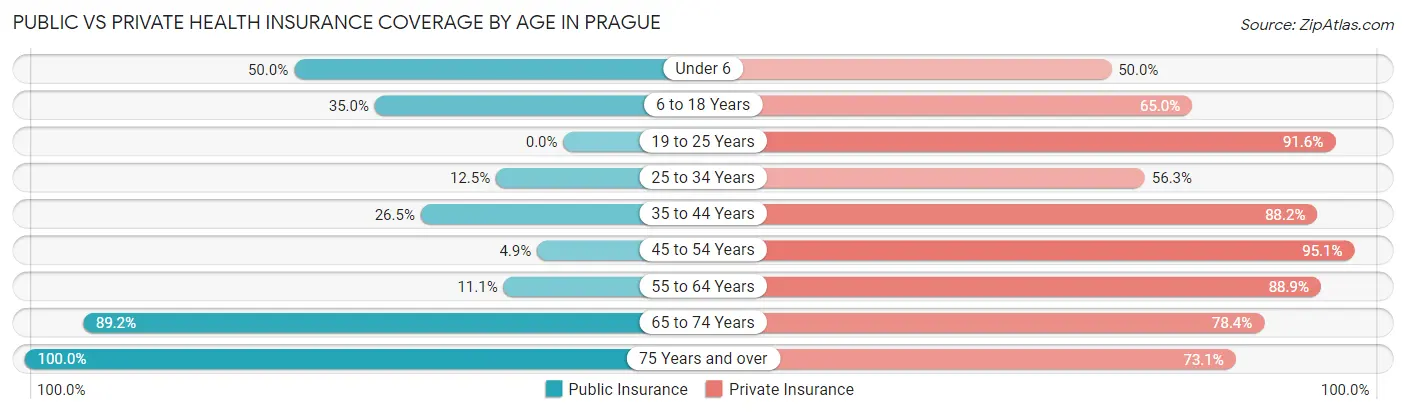
| Age Bracket | Public Insurance | Private Insurance |
| Under 6 | 8 (50.0%) | 8 (50.0%) |
| 6 to 18 Years | 14 (35.0%) | 26 (65.0%) |
| 19 to 25 Years | 0 (0.0%) | 65 (91.5%) |
| 25 to 34 Years | 4 (12.5%) | 18 (56.2%) |
| 35 to 44 Years | 9 (26.5%) | 30 (88.2%) |
| 45 to 54 Years | 2 (4.9%) | 39 (95.1%) |
| 55 to 64 Years | 5 (11.1%) | 40 (88.9%) |
| 65 to 74 Years | 33 (89.2%) | 29 (78.4%) |
| 75 Years and over | 26 (100.0%) | 19 (73.1%) |
| Total | 101 (29.5%) | 274 (80.1%) |
Disability Status by Sex by Age in Prague
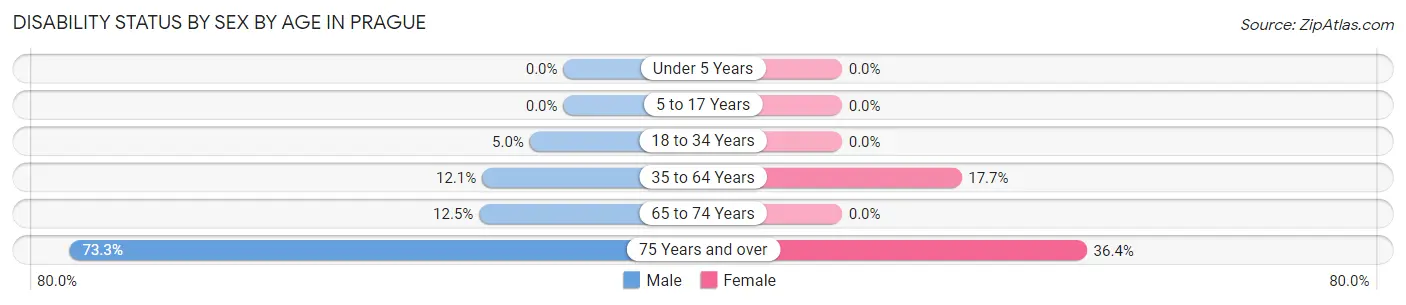
| Age Bracket | Male | Female |
| Under 5 Years | 0 (0.0%) | 0 (0.0%) |
| 5 to 17 Years | 0 (0.0%) | 0 (0.0%) |
| 18 to 34 Years | 3 (5.0%) | 0 (0.0%) |
| 35 to 64 Years | 7 (12.1%) | 11 (17.7%) |
| 65 to 74 Years | 3 (12.5%) | 0 (0.0%) |
| 75 Years and over | 11 (73.3%) | 4 (36.4%) |
Disability Class by Sex by Age in Prague
Disability Class: Hearing Difficulty
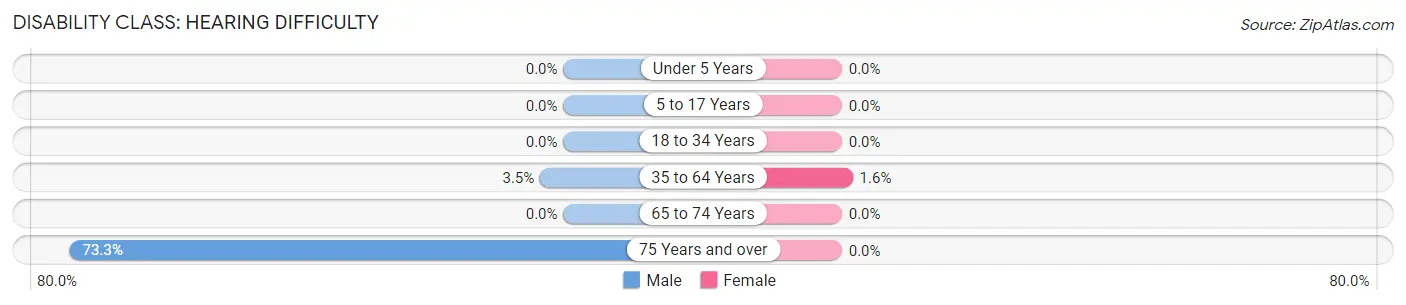
| Age Bracket | Male | Female |
| Under 5 Years | 0 (0.0%) | 0 (0.0%) |
| 5 to 17 Years | 0 (0.0%) | 0 (0.0%) |
| 18 to 34 Years | 0 (0.0%) | 0 (0.0%) |
| 35 to 64 Years | 2 (3.5%) | 1 (1.6%) |
| 65 to 74 Years | 0 (0.0%) | 0 (0.0%) |
| 75 Years and over | 11 (73.3%) | 0 (0.0%) |
Disability Class: Vision Difficulty
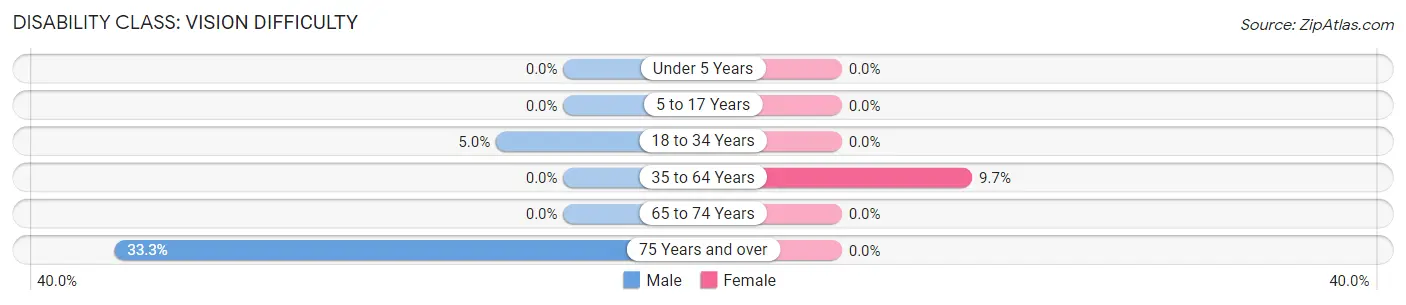
| Age Bracket | Male | Female |
| Under 5 Years | 0 (0.0%) | 0 (0.0%) |
| 5 to 17 Years | 0 (0.0%) | 0 (0.0%) |
| 18 to 34 Years | 3 (5.0%) | 0 (0.0%) |
| 35 to 64 Years | 0 (0.0%) | 6 (9.7%) |
| 65 to 74 Years | 0 (0.0%) | 0 (0.0%) |
| 75 Years and over | 5 (33.3%) | 0 (0.0%) |
Disability Class: Cognitive Difficulty
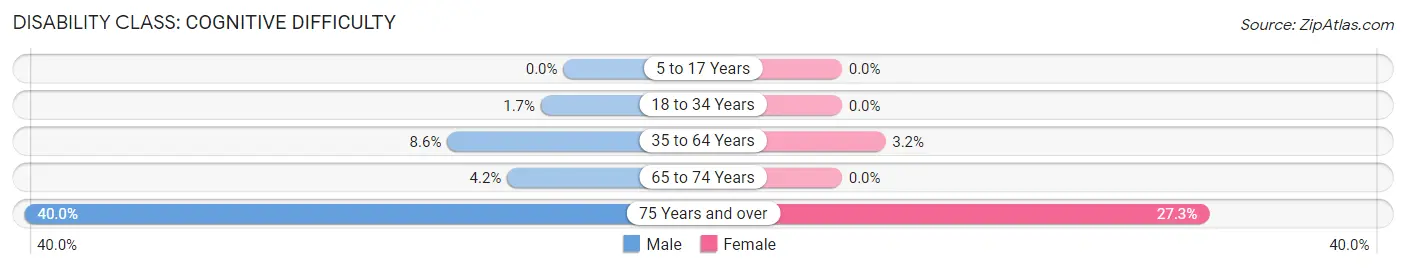
| Age Bracket | Male | Female |
| 5 to 17 Years | 0 (0.0%) | 0 (0.0%) |
| 18 to 34 Years | 1 (1.7%) | 0 (0.0%) |
| 35 to 64 Years | 5 (8.6%) | 2 (3.2%) |
| 65 to 74 Years | 1 (4.2%) | 0 (0.0%) |
| 75 Years and over | 6 (40.0%) | 3 (27.3%) |
Disability Class: Ambulatory Difficulty
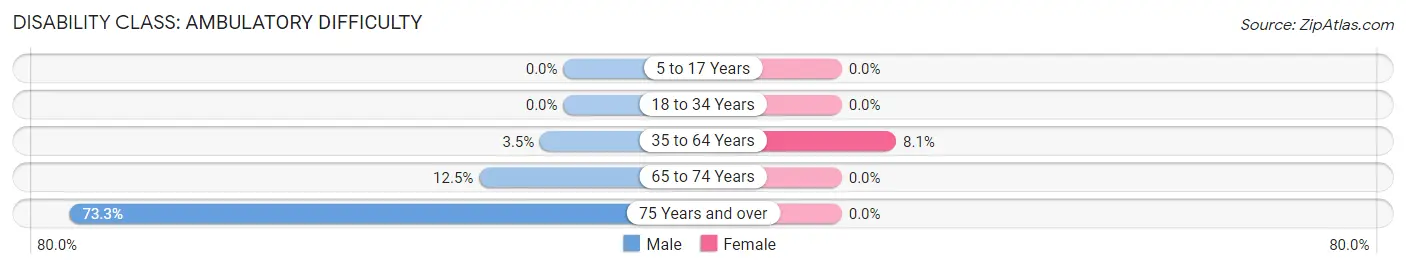
| Age Bracket | Male | Female |
| 5 to 17 Years | 0 (0.0%) | 0 (0.0%) |
| 18 to 34 Years | 0 (0.0%) | 0 (0.0%) |
| 35 to 64 Years | 2 (3.5%) | 5 (8.1%) |
| 65 to 74 Years | 3 (12.5%) | 0 (0.0%) |
| 75 Years and over | 11 (73.3%) | 0 (0.0%) |
Disability Class: Self-Care Difficulty
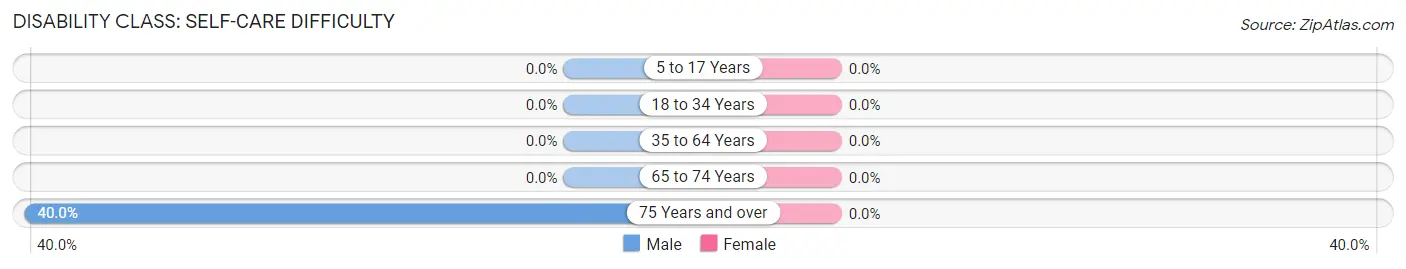
| Age Bracket | Male | Female |
| 5 to 17 Years | 0 (0.0%) | 0 (0.0%) |
| 18 to 34 Years | 0 (0.0%) | 0 (0.0%) |
| 35 to 64 Years | 0 (0.0%) | 0 (0.0%) |
| 65 to 74 Years | 0 (0.0%) | 0 (0.0%) |
| 75 Years and over | 6 (40.0%) | 0 (0.0%) |
Technology Access in Prague
Computing Device Access in Prague
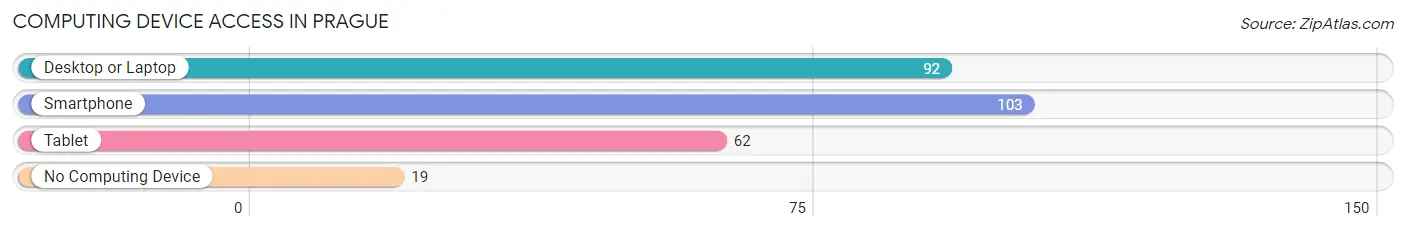
| Device Type | # Households | % Households |
| Desktop or Laptop | 92 | 68.1% |
| Smartphone | 103 | 76.3% |
| Tablet | 62 | 45.9% |
| No Computing Device | 19 | 14.1% |
| Total | 135 | 100.0% |
Internet Access in Prague
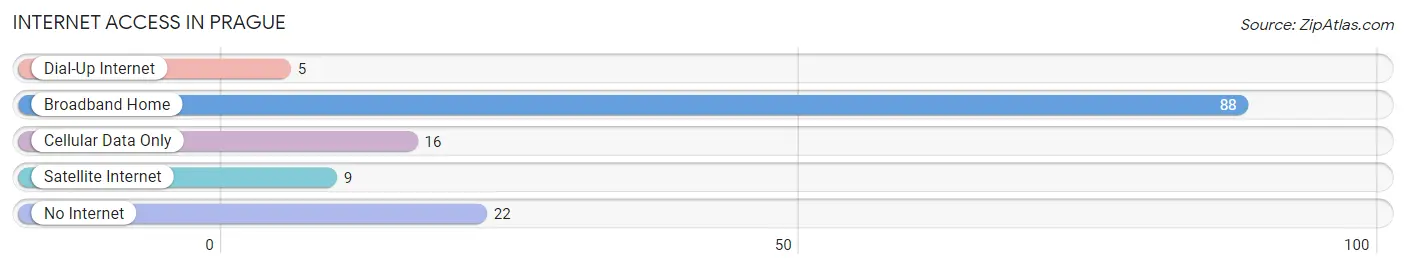
| Internet Type | # Households | % Households |
| Dial-Up Internet | 5 | 3.7% |
| Broadband Home | 88 | 65.2% |
| Cellular Data Only | 16 | 11.8% |
| Satellite Internet | 9 | 6.7% |
| No Internet | 22 | 16.3% |
| Total | 135 | 100.0% |
Prague Summary
Prague is a city located in the eastern part of the Czech Republic, in the Central Bohemian Region. It is the capital and largest city of the Czech Republic, and the 14th largest city in the European Union. Prague is home to a population of 1.3 million people, making it the sixth most populous city in the EU.
Geography
Prague is located in the heart of Central Europe, on the banks of the Vltava River. It is situated in the north-western part of the Czech Republic, and is bordered by Germany to the west, Austria to the south, Slovakia to the east, and Poland to the north. The city is divided into 10 districts, each with its own unique character and attractions. The city centre is located in the Old Town, which is home to many of the city’s most famous landmarks, such as the Charles Bridge, the Prague Castle, and the Old Town Square.
History
Prague has a long and rich history, dating back to the 9th century. It was founded by the Přemyslid dynasty, and was the capital of the Kingdom of Bohemia from the 10th century until 1918. During the Middle Ages, Prague was an important centre of trade and culture, and was home to many of Europe’s most influential figures, such as Charles IV, Rudolf II, and Jan Hus.
In the 16th century, Prague was the centre of the Protestant Reformation, and was the site of the Defenestration of Prague in 1618, which sparked the Thirty Years’ War. In the 18th century, Prague was the capital of the Austrian Empire, and was the site of the first modern university in Central Europe, Charles University.
In 1918, Prague became the capital of the newly formed Czechoslovakia, and in 1993, it became the capital of the Czech Republic. Today, Prague is a vibrant and cosmopolitan city, and is a popular tourist destination.
Economy
Prague is the economic and cultural centre of the Czech Republic, and is home to many of the country’s largest companies and institutions. The city’s economy is largely based on services, and is one of the most competitive in the EU. The city is home to many international companies, such as Microsoft, IBM, and Oracle, and is a major centre for banking and finance.
The city is also a major centre for tourism, and is home to many of the country’s most popular attractions, such as the Prague Castle, the Charles Bridge, and the Old Town Square. The city is also home to many cultural institutions, such as the National Theatre, the National Museum, and the Prague State Opera.
Demographics
Prague is home to a population of 1.3 million people, making it the sixth most populous city in the EU. The city is ethnically diverse, with the largest ethnic group being Czechs, followed by Slovaks, Poles, Germans, and Ukrainians. The city is also home to a large number of foreign nationals, with the largest groups being from the United Kingdom, the United States, and Germany.
The city is predominantly Roman Catholic, with around 70% of the population identifying as such. The city is also home to a large number of other religious groups, including Protestants, Jews, and Muslims.
Prague is a vibrant and cosmopolitan city, and is home to a diverse population. It is a major centre for culture, business, and tourism, and is one of the most popular destinations in Europe.
Common Questions
What is Per Capita Income in Prague?
Per Capita income in Prague is $29,247.
What is the Median Family Income in Prague?
Median Family Income in Prague is $92,813.
What is the Median Household income in Prague?
Median Household Income in Prague is $60,781.
What is Income or Wage Gap in Prague?
Income or Wage Gap in Prague is 45.0%.
Women in Prague earn 55.0 cents for every dollar earned by a man.
What is Inequality or Gini Index in Prague?
Inequality or Gini Index in Prague is 0.36.
What is the Total Population of Prague?
Total Population of Prague is 342.
What is the Total Male Population of Prague?
Total Male Population of Prague is 185.
What is the Total Female Population of Prague?
Total Female Population of Prague is 157.
What is the Ratio of Males per 100 Females in Prague?
There are 117.83 Males per 100 Females in Prague.
What is the Ratio of Females per 100 Males in Prague?
There are 84.86 Females per 100 Males in Prague.
What is the Median Population Age in Prague?
Median Population Age in Prague is 39.8 Years.
What is the Average Family Size in Prague
Average Family Size in Prague is 3.1 People.
What is the Average Household Size in Prague
Average Household Size in Prague is 2.5 People.
How Large is the Labor Force in Prague?
There are 216 People in the Labor Forcein in Prague.
What is the Percentage of People in the Labor Force in Prague?
72.5% of People are in the Labor Force in Prague.
What is the Unemployment Rate in Prague?
Unemployment Rate in Prague is 6.0%.