Blue Hill, NE Map & Demographics
Blue Hill Map
Blue Hill Overview
$31,739
PER CAPITA INCOME
$87,679
AVG FAMILY INCOME
$61,250
AVG HOUSEHOLD INCOME
23.1%
WAGE / INCOME GAP [ % ]
76.9¢/ $1
WAGE / INCOME GAP [ $ ]
0.37
INEQUALITY / GINI INDEX
883
TOTAL POPULATION
480
MALE POPULATION
403
FEMALE POPULATION
119.11
MALES / 100 FEMALES
83.96
FEMALES / 100 MALES
39.8
MEDIAN AGE
3.0
AVG FAMILY SIZE
2.2
AVG HOUSEHOLD SIZE
477
LABOR FORCE [ PEOPLE ]
69.5%
PERCENT IN LABOR FORCE
2.5%
UNEMPLOYMENT RATE
Blue Hill Zip Codes
Blue Hill Area Codes
Income in Blue Hill
Income Overview in Blue Hill
Per Capita Income in Blue Hill is $31,739, while median incomes of families and households are $87,679 and $61,250 respectively.
| Characteristic | Number | Measure |
| Per Capita Income | 883 | $31,739 |
| Median Family Income | 219 | $87,679 |
| Mean Family Income | 219 | $89,029 |
| Median Household Income | 394 | $61,250 |
| Mean Household Income | 394 | $69,689 |
| Income Deficit | 219 | $0 |
| Wage / Income Gap (%) | 883 | 23.06% |
| Wage / Income Gap ($) | 883 | 76.94¢ per $1 |
| Gini / Inequality Index | 883 | 0.37 |
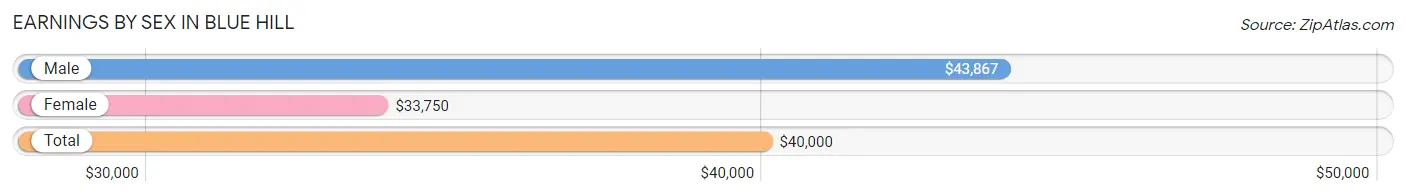
Earnings by Sex in Blue Hill
Average Earnings in Blue Hill are $40,000, $43,867 for men and $33,750 for women, a difference of 23.1%.
| Sex | Number | Average Earnings |
| Male | 291 (59.2%) | $43,867 |
| Female | 201 (40.8%) | $33,750 |
| Total | 492 (100.0%) | $40,000 |
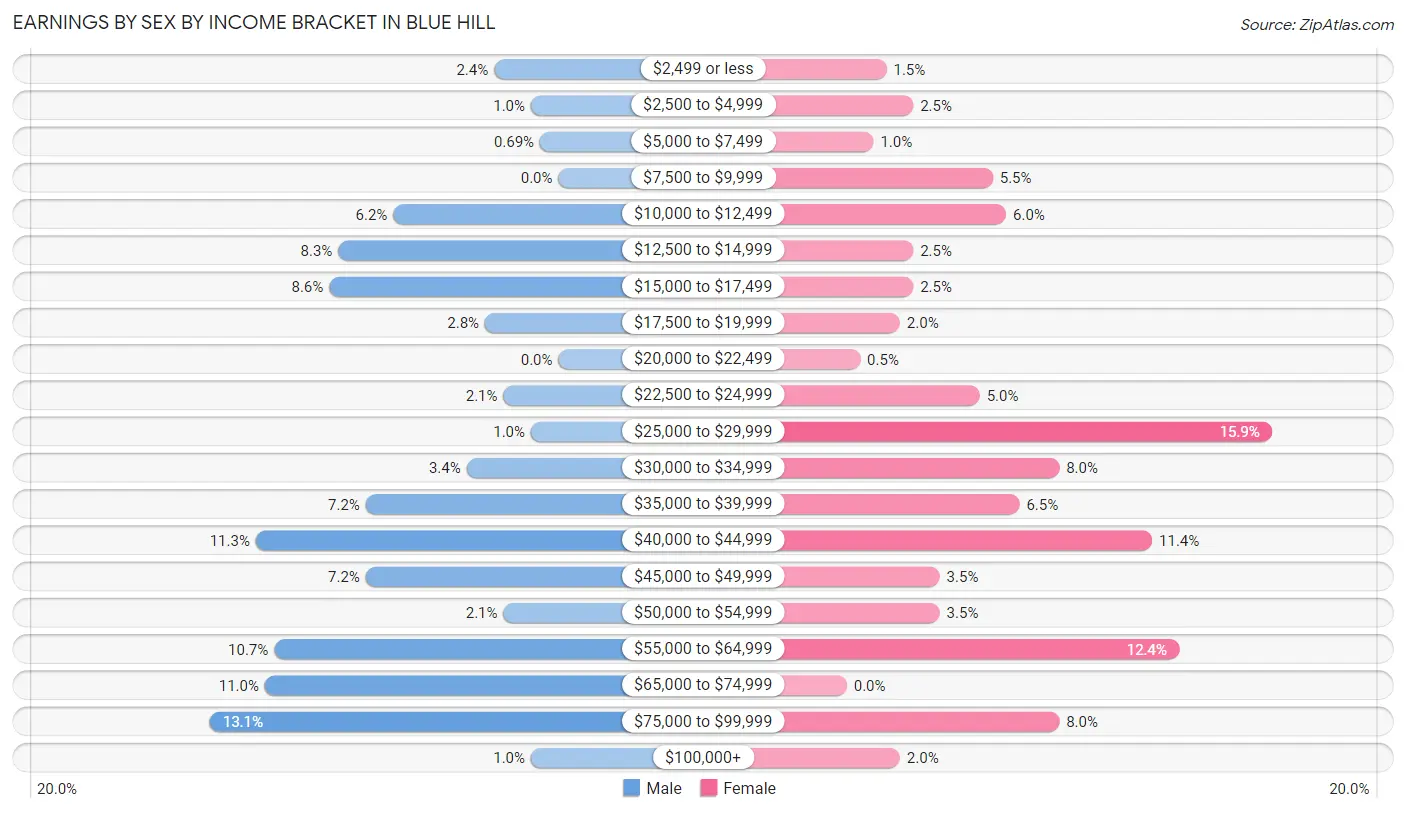
Earnings by Sex by Income Bracket in Blue Hill
The most common earnings brackets in Blue Hill are $75,000 to $99,999 for men (38 | 13.1%) and $25,000 to $29,999 for women (32 | 15.9%).
| Income | Male | Female |
| $2,499 or less | 7 (2.4%) | 3 (1.5%) |
| $2,500 to $4,999 | 3 (1.0%) | 5 (2.5%) |
| $5,000 to $7,499 | 2 (0.7%) | 2 (1.0%) |
| $7,500 to $9,999 | 0 (0.0%) | 11 (5.5%) |
| $10,000 to $12,499 | 18 (6.2%) | 12 (6.0%) |
| $12,500 to $14,999 | 24 (8.3%) | 5 (2.5%) |
| $15,000 to $17,499 | 25 (8.6%) | 5 (2.5%) |
| $17,500 to $19,999 | 8 (2.8%) | 4 (2.0%) |
| $20,000 to $22,499 | 0 (0.0%) | 1 (0.5%) |
| $22,500 to $24,999 | 6 (2.1%) | 10 (5.0%) |
| $25,000 to $29,999 | 3 (1.0%) | 32 (15.9%) |
| $30,000 to $34,999 | 10 (3.4%) | 16 (8.0%) |
| $35,000 to $39,999 | 21 (7.2%) | 13 (6.5%) |
| $40,000 to $44,999 | 33 (11.3%) | 23 (11.4%) |
| $45,000 to $49,999 | 21 (7.2%) | 7 (3.5%) |
| $50,000 to $54,999 | 6 (2.1%) | 7 (3.5%) |
| $55,000 to $64,999 | 31 (10.6%) | 25 (12.4%) |
| $65,000 to $74,999 | 32 (11.0%) | 0 (0.0%) |
| $75,000 to $99,999 | 38 (13.1%) | 16 (8.0%) |
| $100,000+ | 3 (1.0%) | 4 (2.0%) |
| Total | 291 (100.0%) | 201 (100.0%) |
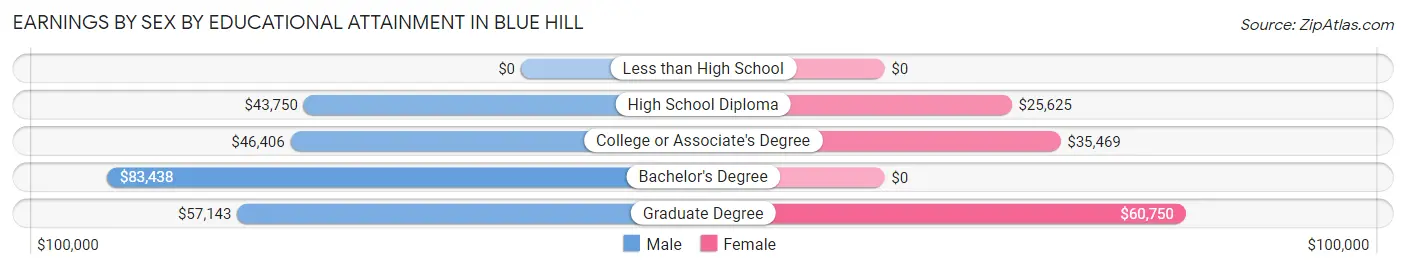
Earnings by Sex by Educational Attainment in Blue Hill
Average earnings in Blue Hill are $44,883 for men and $33,750 for women, a difference of 24.8%. Men with an educational attainment of bachelor's degree enjoy the highest average annual earnings of $83,438, while those with high school diploma education earn the least with $43,750. Women with an educational attainment of graduate degree earn the most with the average annual earnings of $60,750, while those with high school diploma education have the smallest earnings of $25,625.
| Educational Attainment | Male Income | Female Income |
| Less than High School | - | - |
| High School Diploma | $43,750 | $25,625 |
| College or Associate's Degree | $46,406 | $35,469 |
| Bachelor's Degree | $83,438 | $0 |
| Graduate Degree | $57,143 | $60,750 |
| Total | $44,883 | $33,750 |
Family Income in Blue Hill
Family Income Brackets in Blue Hill
According to the Blue Hill family income data, there are 66 families falling into the $100,000 to $149,999 income range, which is the most common income bracket and makes up 30.1% of all families.
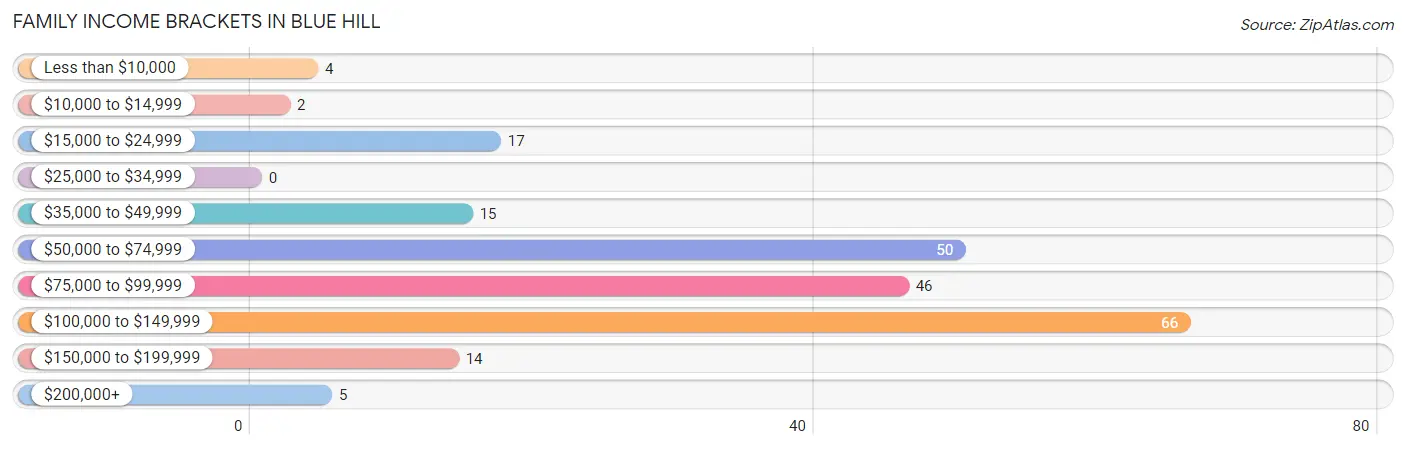
| Income Bracket | # Families | % Families |
| Less than $10,000 | 4 | 1.8% |
| $10,000 to $14,999 | 2 | 0.9% |
| $15,000 to $24,999 | 17 | 7.8% |
| $25,000 to $34,999 | 0 | 0.0% |
| $35,000 to $49,999 | 15 | 6.8% |
| $50,000 to $74,999 | 50 | 22.8% |
| $75,000 to $99,999 | 46 | 21.0% |
| $100,000 to $149,999 | 66 | 30.1% |
| $150,000 to $199,999 | 14 | 6.4% |
| $200,000+ | 5 | 2.3% |
Family Income by Famaliy Size in Blue Hill
5-person families (14 | 6.4%) account for the highest median family income in Blue Hill with $130,417 per family, while 2-person families (107 | 48.9%) have the highest median income of $39,453 per family member.
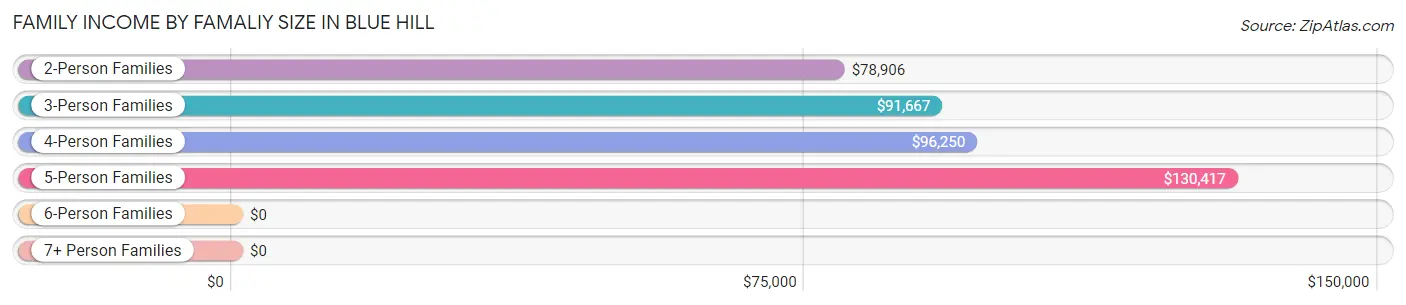
| Income Bracket | # Families | Median Income |
| 2-Person Families | 107 (48.9%) | $78,906 |
| 3-Person Families | 36 (16.4%) | $91,667 |
| 4-Person Families | 56 (25.6%) | $96,250 |
| 5-Person Families | 14 (6.4%) | $130,417 |
| 6-Person Families | 1 (0.5%) | $0 |
| 7+ Person Families | 5 (2.3%) | $0 |
| Total | 219 (100.0%) | $87,679 |
Family Income by Number of Earners in Blue Hill
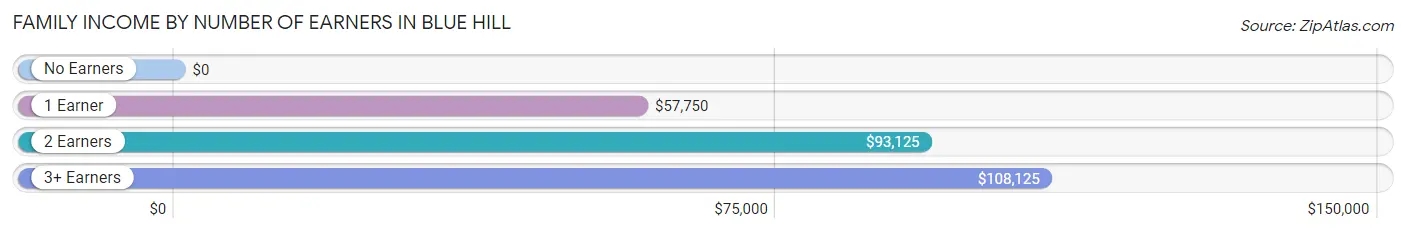
| Number of Earners | # Families | Median Income |
| No Earners | 18 (8.2%) | $0 |
| 1 Earner | 58 (26.5%) | $57,750 |
| 2 Earners | 128 (58.5%) | $93,125 |
| 3+ Earners | 15 (6.9%) | $108,125 |
| Total | 219 (100.0%) | $87,679 |
Household Income in Blue Hill
Household Income Brackets in Blue Hill
With 94 households falling in the category, the $35,000 to $49,999 income range is the most frequent in Blue Hill, accounting for 23.9% of all households. In contrast, only 5 households (1.3%) fall into the $25,000 to $34,999 income bracket, making it the least populous group.
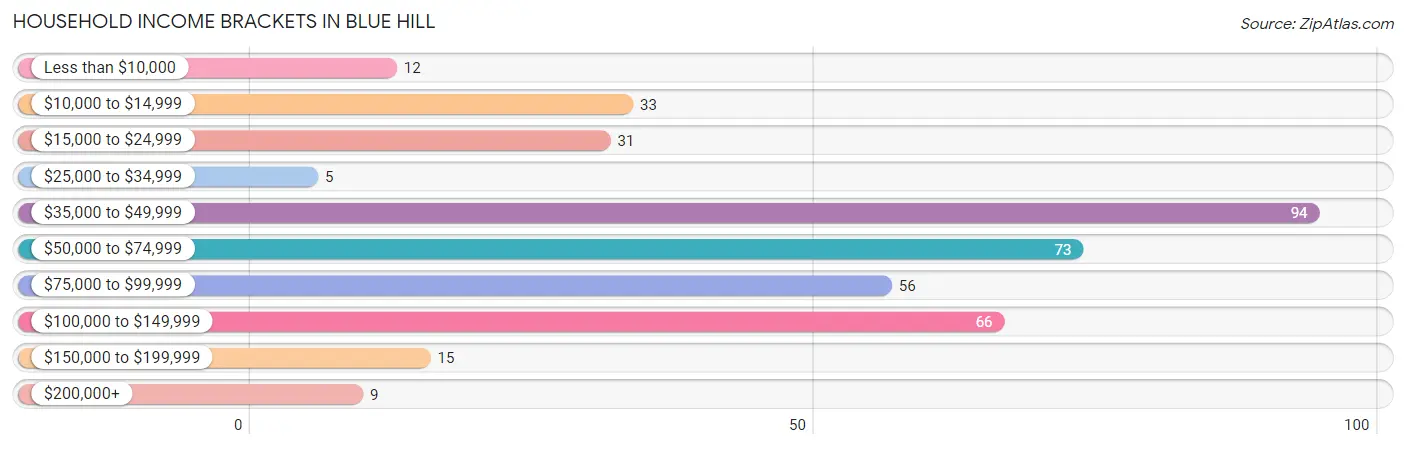
| Income Bracket | # Households | % Households |
| Less than $10,000 | 12 | 3.0% |
| $10,000 to $14,999 | 33 | 8.4% |
| $15,000 to $24,999 | 31 | 7.9% |
| $25,000 to $34,999 | 5 | 1.3% |
| $35,000 to $49,999 | 94 | 23.9% |
| $50,000 to $74,999 | 73 | 18.5% |
| $75,000 to $99,999 | 56 | 14.2% |
| $100,000 to $149,999 | 66 | 16.8% |
| $150,000 to $199,999 | 15 | 3.8% |
| $200,000+ | 9 | 2.3% |
Household Income by Householder Age in Blue Hill
The median household income in Blue Hill is $61,250, with the highest median household income of $82,708 found in the 25 to 44 years age bracket for the primary householder. A total of 123 households (31.2%) fall into this category. Meanwhile, the 15 to 24 years age bracket for the primary householder has the lowest median household income of $0, with 47 households (11.9%) in this group.
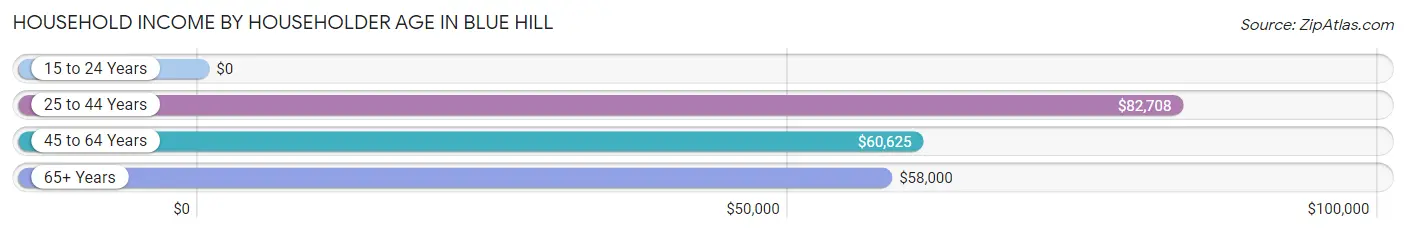
| Income Bracket | # Households | Median Income |
| 15 to 24 Years | 47 (11.9%) | $0 |
| 25 to 44 Years | 123 (31.2%) | $82,708 |
| 45 to 64 Years | 120 (30.5%) | $60,625 |
| 65+ Years | 104 (26.4%) | $58,000 |
| Total | 394 (100.0%) | $61,250 |
Poverty in Blue Hill
Income Below Poverty by Sex and Age in Blue Hill
With 9.2% poverty level for males and 9.1% for females among the residents of Blue Hill, 18 to 24 year old males and 16 and 17 year old females are the most vulnerable to poverty, with 22 males (44.0%) and 5 females (38.5%) in their respective age groups living below the poverty level.
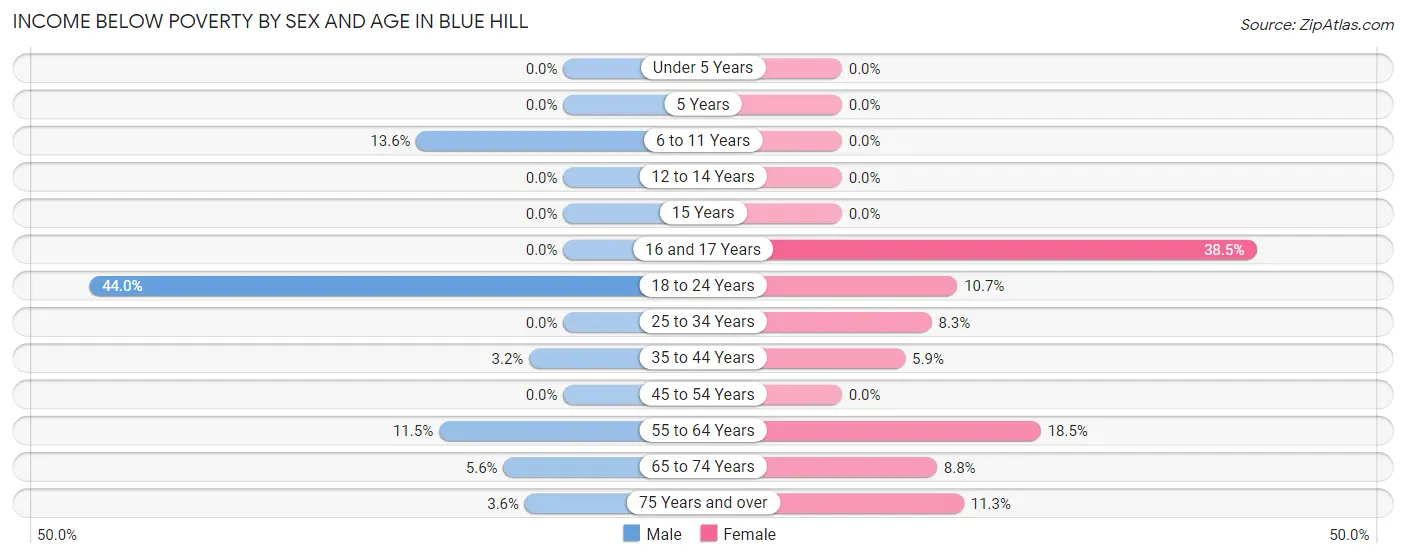
| Age Bracket | Male | Female |
| Under 5 Years | 0 (0.0%) | 0 (0.0%) |
| 5 Years | 0 (0.0%) | 0 (0.0%) |
| 6 to 11 Years | 9 (13.6%) | 0 (0.0%) |
| 12 to 14 Years | 0 (0.0%) | 0 (0.0%) |
| 15 Years | 0 (0.0%) | 0 (0.0%) |
| 16 and 17 Years | 0 (0.0%) | 5 (38.5%) |
| 18 to 24 Years | 22 (44.0%) | 3 (10.7%) |
| 25 to 34 Years | 0 (0.0%) | 4 (8.3%) |
| 35 to 44 Years | 2 (3.2%) | 2 (5.9%) |
| 45 to 54 Years | 0 (0.0%) | 0 (0.0%) |
| 55 to 64 Years | 6 (11.5%) | 12 (18.5%) |
| 65 to 74 Years | 2 (5.6%) | 3 (8.8%) |
| 75 Years and over | 1 (3.6%) | 6 (11.3%) |
| Total | 42 (9.2%) | 35 (9.1%) |
Income Above Poverty by Sex and Age in Blue Hill
According to the poverty statistics in Blue Hill, males aged under 5 years and females aged under 5 years are the age groups that are most secure financially, with 100.0% of males and 100.0% of females in these age groups living above the poverty line.
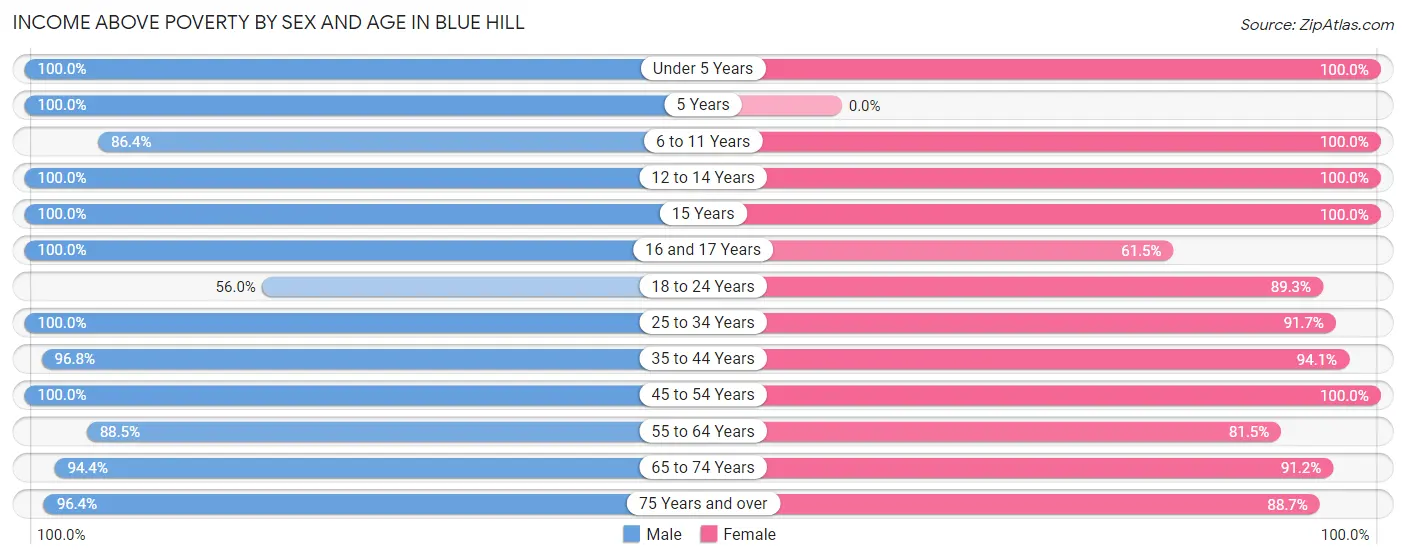
| Age Bracket | Male | Female |
| Under 5 Years | 20 (100.0%) | 28 (100.0%) |
| 5 Years | 3 (100.0%) | 0 (0.0%) |
| 6 to 11 Years | 57 (86.4%) | 28 (100.0%) |
| 12 to 14 Years | 15 (100.0%) | 17 (100.0%) |
| 15 Years | 5 (100.0%) | 3 (100.0%) |
| 16 and 17 Years | 6 (100.0%) | 8 (61.5%) |
| 18 to 24 Years | 28 (56.0%) | 25 (89.3%) |
| 25 to 34 Years | 57 (100.0%) | 44 (91.7%) |
| 35 to 44 Years | 61 (96.8%) | 32 (94.1%) |
| 45 to 54 Years | 54 (100.0%) | 32 (100.0%) |
| 55 to 64 Years | 46 (88.5%) | 53 (81.5%) |
| 65 to 74 Years | 34 (94.4%) | 31 (91.2%) |
| 75 Years and over | 27 (96.4%) | 47 (88.7%) |
| Total | 413 (90.8%) | 348 (90.9%) |
Income Below Poverty Among Married-Couple Families in Blue Hill
The poverty statistics for married-couple families in Blue Hill show that 3.2% or 6 of the total 189 families live below the poverty line. Families with no children have the highest poverty rate of 4.1%, comprising of 4 families. On the other hand, families with 3 or 4 children have the lowest poverty rate of 0.0%, which includes 0 families.
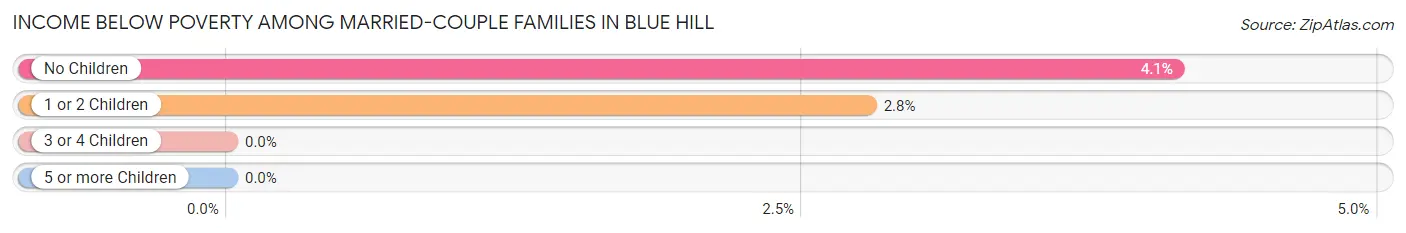
| Children | Above Poverty | Below Poverty |
| No Children | 93 (95.9%) | 4 (4.1%) |
| 1 or 2 Children | 70 (97.2%) | 2 (2.8%) |
| 3 or 4 Children | 20 (100.0%) | 0 (0.0%) |
| 5 or more Children | 0 (0.0%) | 0 (0.0%) |
| Total | 183 (96.8%) | 6 (3.2%) |
Income Below Poverty Among Single-Parent Households in Blue Hill
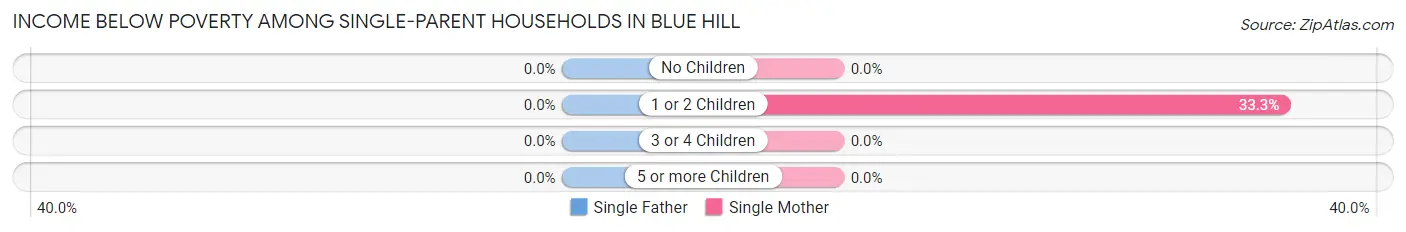
| Children | Single Father | Single Mother |
| No Children | 0 (0.0%) | 0 (0.0%) |
| 1 or 2 Children | 0 (0.0%) | 3 (33.3%) |
| 3 or 4 Children | 0 (0.0%) | 0 (0.0%) |
| 5 or more Children | 0 (0.0%) | 0 (0.0%) |
| Total | 0 (0.0%) | 3 (30.0%) |
Income Below Poverty Among Married-Couple vs Single-Parent Households in Blue Hill
The poverty data for Blue Hill shows that 6 of the married-couple family households (3.2%) and 3 of the single-parent households (10.0%) are living below the poverty level. Within the married-couple family households, those with no children have the highest poverty rate, with 4 households (4.1%) falling below the poverty line. Among the single-parent households, those with 1 or 2 children have the highest poverty rate, with 3 household (20.0%) living below poverty.
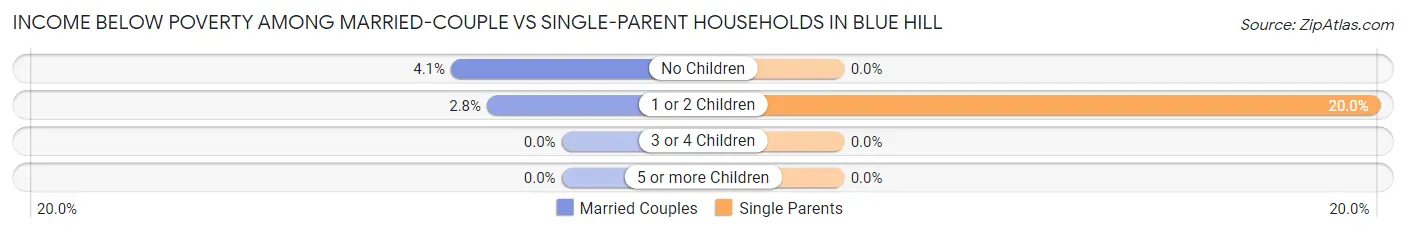
| Children | Married-Couple Families | Single-Parent Households |
| No Children | 4 (4.1%) | 0 (0.0%) |
| 1 or 2 Children | 2 (2.8%) | 3 (20.0%) |
| 3 or 4 Children | 0 (0.0%) | 0 (0.0%) |
| 5 or more Children | 0 (0.0%) | 0 (0.0%) |
| Total | 6 (3.2%) | 3 (10.0%) |
Race in Blue Hill
The most populous races in Blue Hill are White / Caucasian (834 | 94.5%), Two or more Races (34 | 3.8%), and Hispanic or Latino (16 | 1.8%).
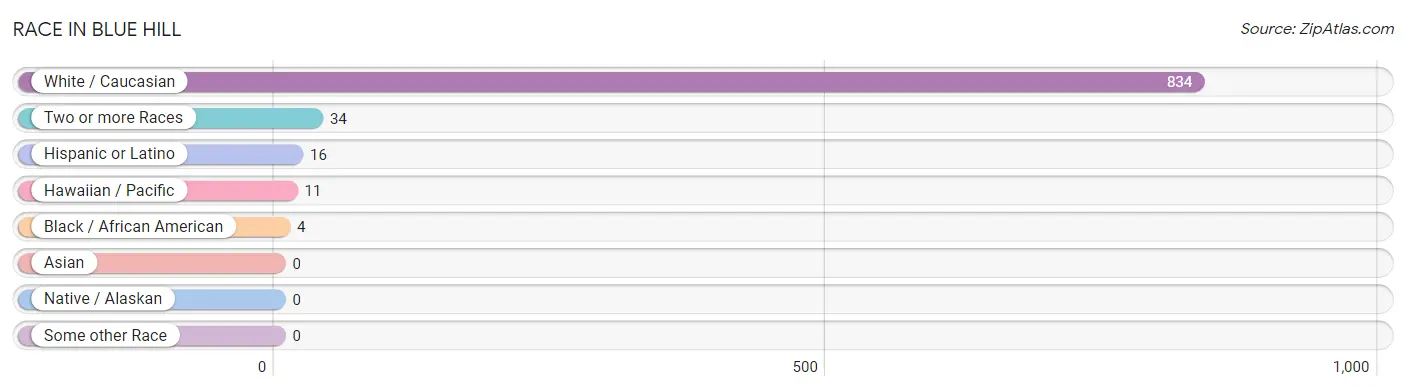
| Race | # Population | % Population |
| Asian | 0 | 0.0% |
| Black / African American | 4 | 0.4% |
| Hawaiian / Pacific | 11 | 1.3% |
| Hispanic or Latino | 16 | 1.8% |
| Native / Alaskan | 0 | 0.0% |
| White / Caucasian | 834 | 94.5% |
| Two or more Races | 34 | 3.8% |
| Some other Race | 0 | 0.0% |
| Total | 883 | 100.0% |
Ancestry in Blue Hill
The most populous ancestries reported in Blue Hill are German (416 | 47.1%), Irish (87 | 9.9%), English (63 | 7.1%), American (51 | 5.8%), and Czech (39 | 4.4%), together accounting for 74.3% of all Blue Hill residents.
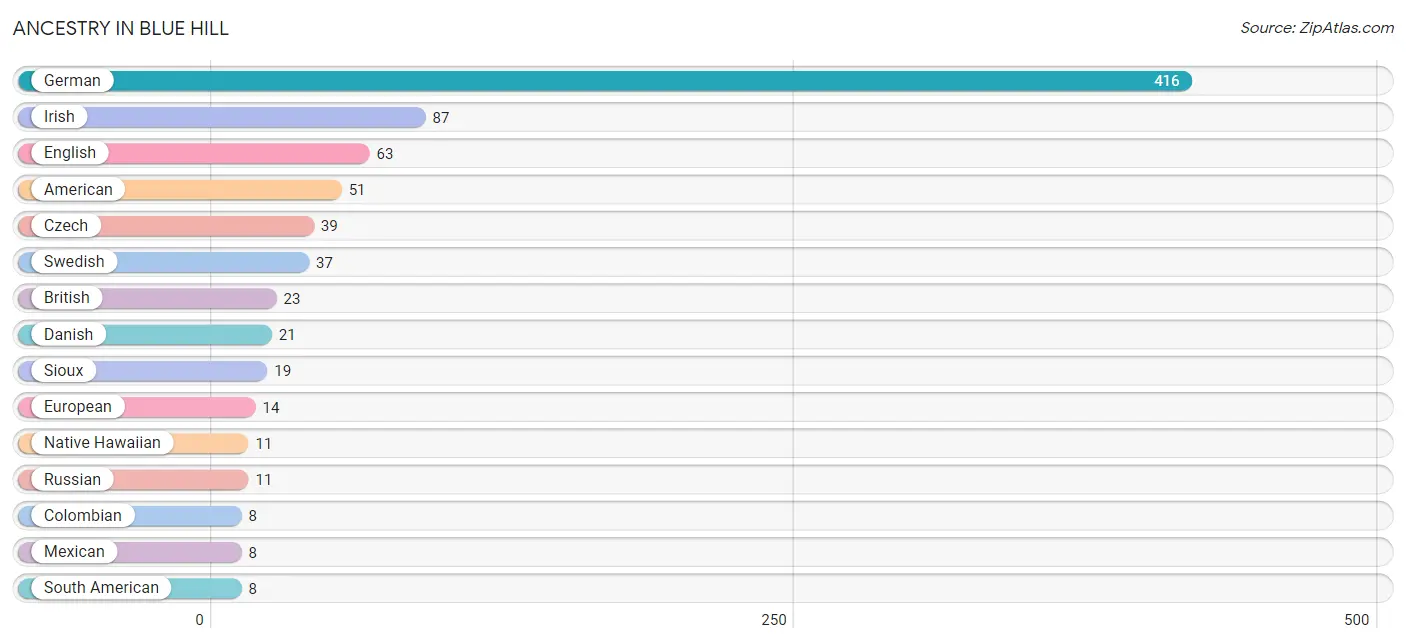
| Ancestry | # Population | % Population |
| American | 51 | 5.8% |
| British | 23 | 2.6% |
| Colombian | 8 | 0.9% |
| Czech | 39 | 4.4% |
| Czechoslovakian | 4 | 0.4% |
| Danish | 21 | 2.4% |
| English | 63 | 7.1% |
| European | 14 | 1.6% |
| French | 2 | 0.2% |
| French Canadian | 2 | 0.2% |
| German | 416 | 47.1% |
| Greek | 1 | 0.1% |
| Irish | 87 | 9.9% |
| Mexican | 8 | 0.9% |
| Native Hawaiian | 11 | 1.3% |
| Norwegian | 4 | 0.4% |
| Russian | 11 | 1.3% |
| Scandinavian | 7 | 0.8% |
| Scotch-Irish | 6 | 0.7% |
| Scottish | 6 | 0.7% |
| Sioux | 19 | 2.1% |
| South African | 7 | 0.8% |
| South American | 8 | 0.9% |
| Subsaharan African | 7 | 0.8% |
| Swedish | 37 | 4.2% |
| Welsh | 5 | 0.6% | View All 26 Rows |
Immigrants in Blue Hill
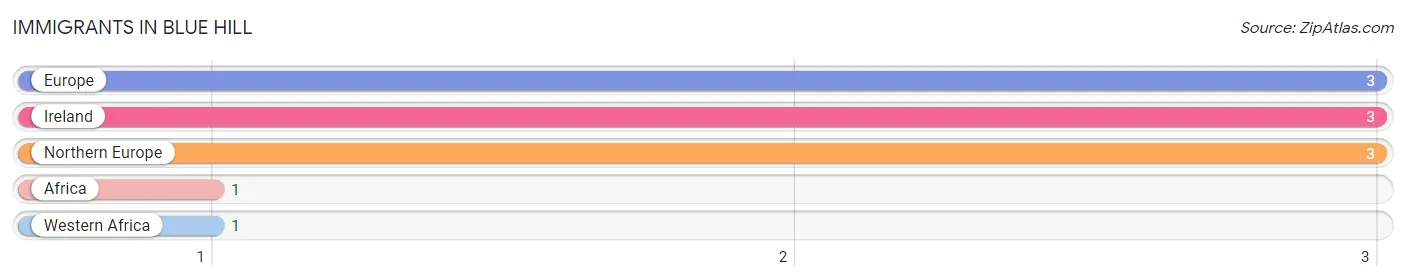
The most numerous immigrant groups reported in Blue Hill came from Europe (3 | 0.3%), Ireland (3 | 0.3%), Northern Europe (3 | 0.3%), Africa (1 | 0.1%), and Western Africa (1 | 0.1%), together accounting for 1.2% of all Blue Hill residents.
| Immigration Origin | # Population | % Population |
| Africa | 1 | 0.1% |
| Europe | 3 | 0.3% |
| Ireland | 3 | 0.3% |
| Northern Europe | 3 | 0.3% |
| Western Africa | 1 | 0.1% | View All 5 Rows |
Sex and Age in Blue Hill
Sex and Age in Blue Hill
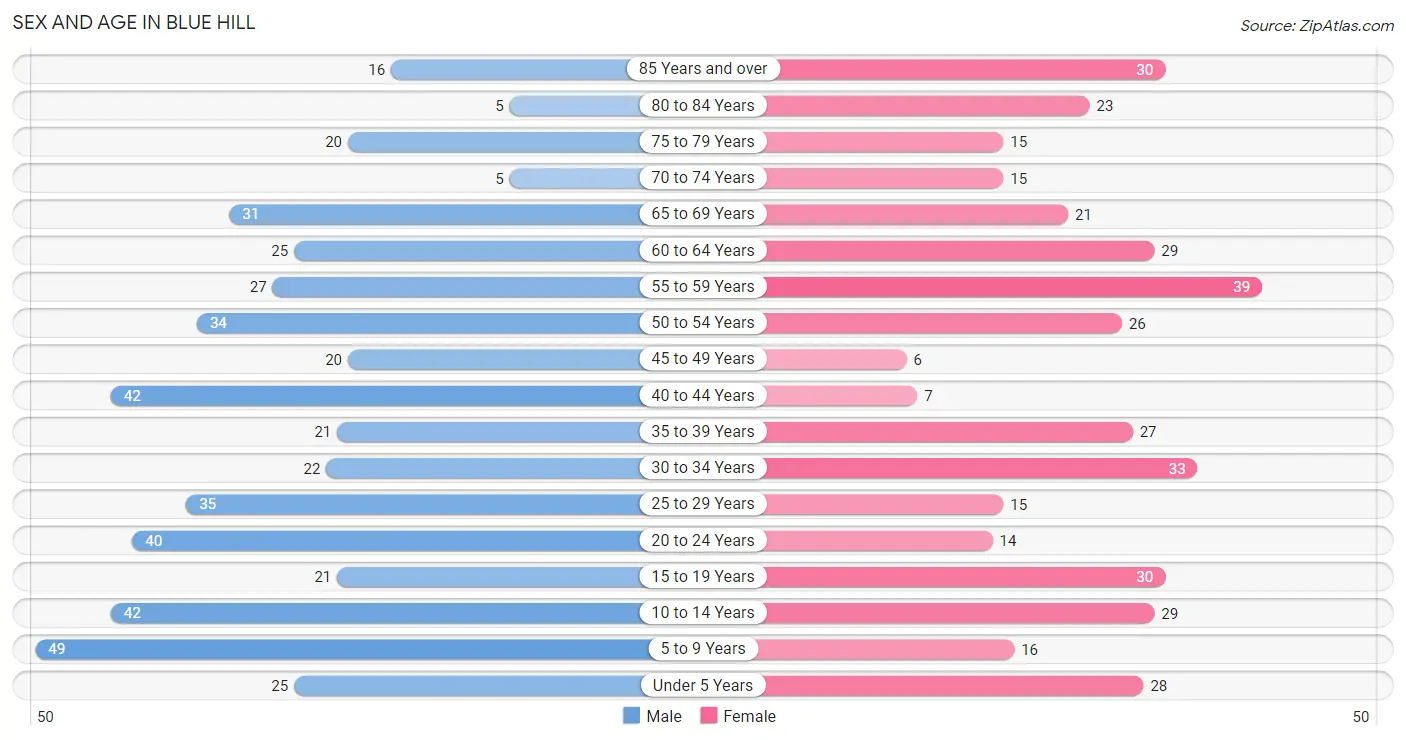
The most populous age groups in Blue Hill are 5 to 9 Years (49 | 10.2%) for men and 55 to 59 Years (39 | 9.7%) for women.
| Age Bracket | Male | Female |
| Under 5 Years | 25 (5.2%) | 28 (7.0%) |
| 5 to 9 Years | 49 (10.2%) | 16 (4.0%) |
| 10 to 14 Years | 42 (8.7%) | 29 (7.2%) |
| 15 to 19 Years | 21 (4.4%) | 30 (7.4%) |
| 20 to 24 Years | 40 (8.3%) | 14 (3.5%) |
| 25 to 29 Years | 35 (7.3%) | 15 (3.7%) |
| 30 to 34 Years | 22 (4.6%) | 33 (8.2%) |
| 35 to 39 Years | 21 (4.4%) | 27 (6.7%) |
| 40 to 44 Years | 42 (8.7%) | 7 (1.7%) |
| 45 to 49 Years | 20 (4.2%) | 6 (1.5%) |
| 50 to 54 Years | 34 (7.1%) | 26 (6.5%) |
| 55 to 59 Years | 27 (5.6%) | 39 (9.7%) |
| 60 to 64 Years | 25 (5.2%) | 29 (7.2%) |
| 65 to 69 Years | 31 (6.5%) | 21 (5.2%) |
| 70 to 74 Years | 5 (1.0%) | 15 (3.7%) |
| 75 to 79 Years | 20 (4.2%) | 15 (3.7%) |
| 80 to 84 Years | 5 (1.0%) | 23 (5.7%) |
| 85 Years and over | 16 (3.3%) | 30 (7.4%) |
| Total | 480 (100.0%) | 403 (100.0%) |
Families and Households in Blue Hill
Median Family Size in Blue Hill
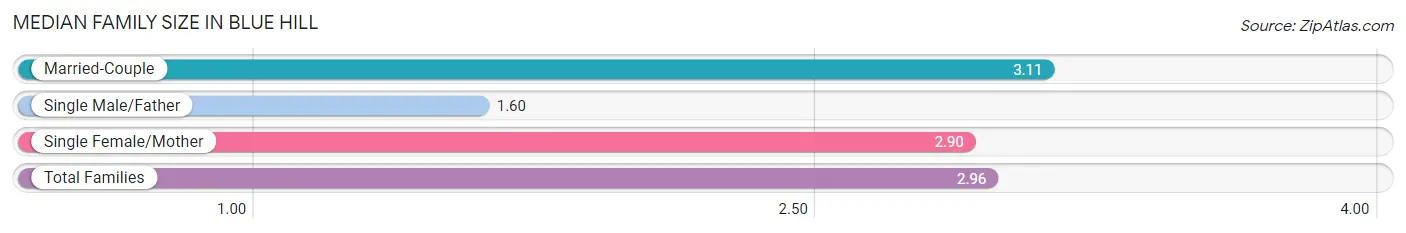
The median family size in Blue Hill is 2.96 persons per family, with married-couple families (189 | 86.3%) accounting for the largest median family size of 3.11 persons per family. On the other hand, single male/father families (20 | 9.1%) represent the smallest median family size with 1.60 persons per family.
| Family Type | # Families | Family Size |
| Married-Couple | 189 (86.3%) | 3.11 |
| Single Male/Father | 20 (9.1%) | 1.60 |
| Single Female/Mother | 10 (4.6%) | 2.90 |
| Total Families | 219 (100.0%) | 2.96 |
Median Household Size in Blue Hill
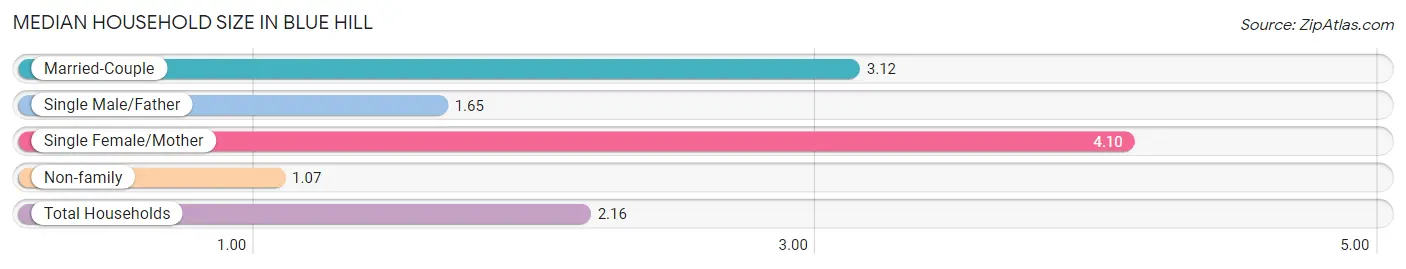
The median household size in Blue Hill is 2.16 persons per household, with single female/mother households (10 | 2.5%) accounting for the largest median household size of 4.1 persons per household. non-family households (175 | 44.4%) represent the smallest median household size with 1.07 persons per household.
| Household Type | # Households | Household Size |
| Married-Couple | 189 (48.0%) | 3.12 |
| Single Male/Father | 20 (5.1%) | 1.65 |
| Single Female/Mother | 10 (2.5%) | 4.10 |
| Non-family | 175 (44.4%) | 1.07 |
| Total Households | 394 (100.0%) | 2.16 |
Household Size by Marriage Status in Blue Hill
Out of a total of 394 households in Blue Hill, 219 (55.6%) are family households, while 175 (44.4%) are nonfamily households. The most numerous type of family households are 2-person households, comprising 105, and the most common type of nonfamily households are 1-person households, comprising 154.
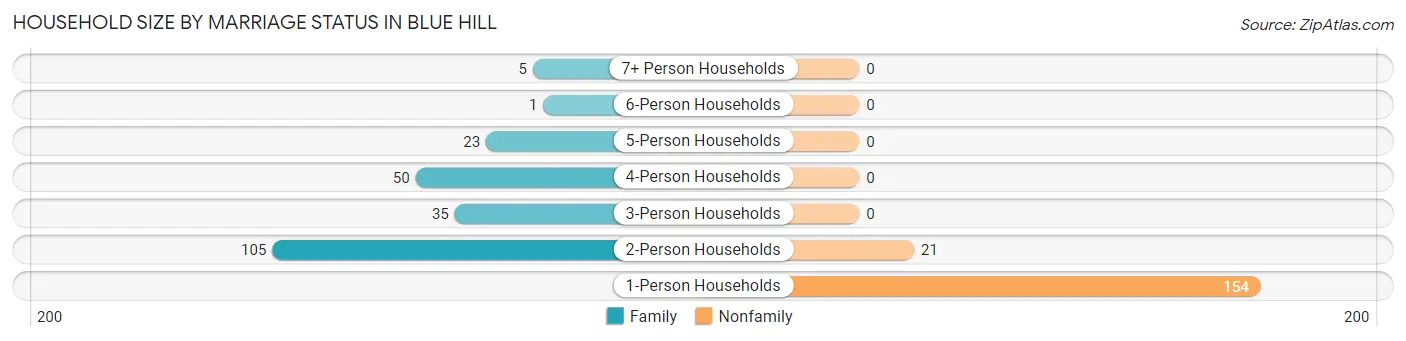
| Household Size | Family Households | Nonfamily Households |
| 1-Person Households | - | 154 (39.1%) |
| 2-Person Households | 105 (26.7%) | 21 (5.3%) |
| 3-Person Households | 35 (8.9%) | 0 (0.0%) |
| 4-Person Households | 50 (12.7%) | 0 (0.0%) |
| 5-Person Households | 23 (5.8%) | 0 (0.0%) |
| 6-Person Households | 1 (0.3%) | 0 (0.0%) |
| 7+ Person Households | 5 (1.3%) | 0 (0.0%) |
| Total | 219 (55.6%) | 175 (44.4%) |
Female Fertility in Blue Hill
Fertility by Age in Blue Hill
Average fertility rate in Blue Hill is 91.0 births per 1,000 women. Women in the age bracket of 20 to 34 years have the highest fertility rate with 194.0 births per 1,000 women. Women in the age bracket of 20 to 34 years acount for 100.0% of all women with births.
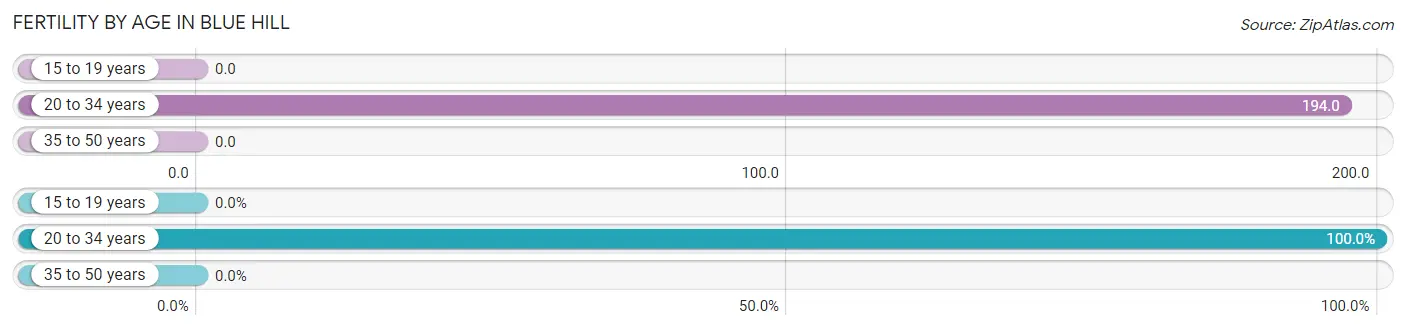
| Age Bracket | Women with Births | Births / 1,000 Women |
| 15 to 19 years | 0 (0.0%) | 0.0 |
| 20 to 34 years | 12 (100.0%) | 194.0 |
| 35 to 50 years | 0 (0.0%) | 0.0 |
| Total | 12 (100.0%) | 91.0 |
Fertility by Age by Marriage Status in Blue Hill
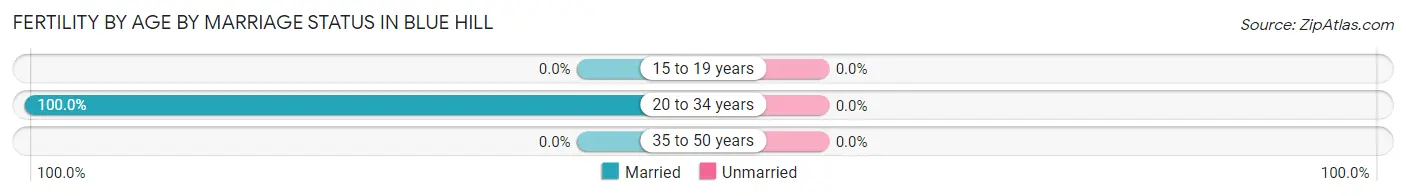
| Age Bracket | Married | Unmarried |
| 15 to 19 years | 0 (0.0%) | 0 (0.0%) |
| 20 to 34 years | 12 (100.0%) | 0 (0.0%) |
| 35 to 50 years | 0 (0.0%) | 0 (0.0%) |
| Total | 12 (100.0%) | 0 (0.0%) |
Fertility by Education in Blue Hill
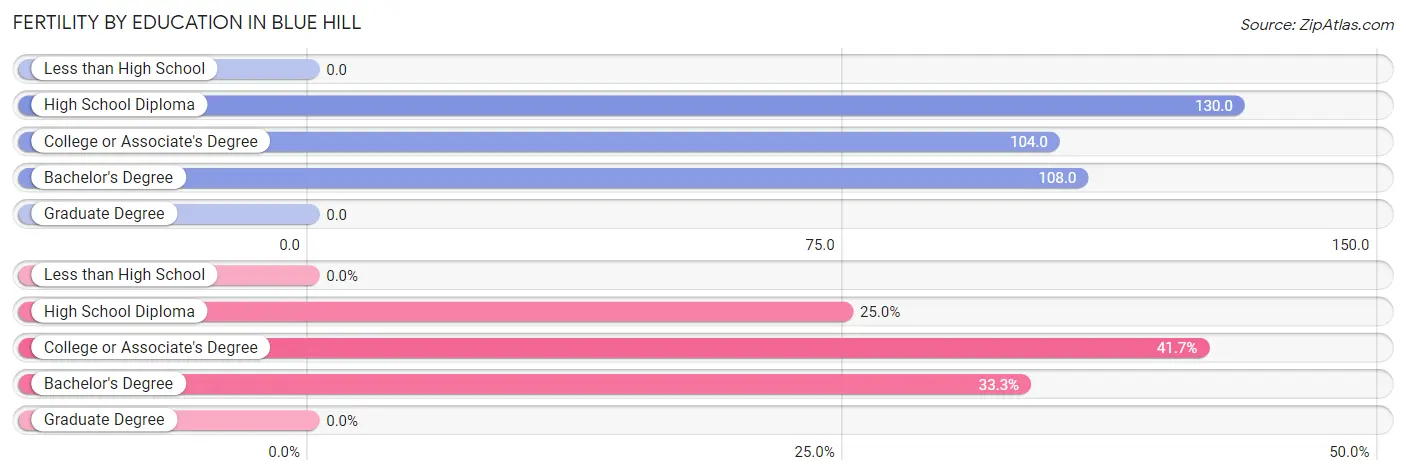
| Educational Attainment | Women with Births | Births / 1,000 Women |
| Less than High School | 0 (0.0%) | 0.0 |
| High School Diploma | 3 (25.0%) | 130.0 |
| College or Associate's Degree | 5 (41.7%) | 104.0 |
| Bachelor's Degree | 4 (33.3%) | 108.0 |
| Graduate Degree | 0 (0.0%) | 0.0 |
| Total | 12 (100.0%) | 91.0 |
Fertility by Education by Marriage Status in Blue Hill
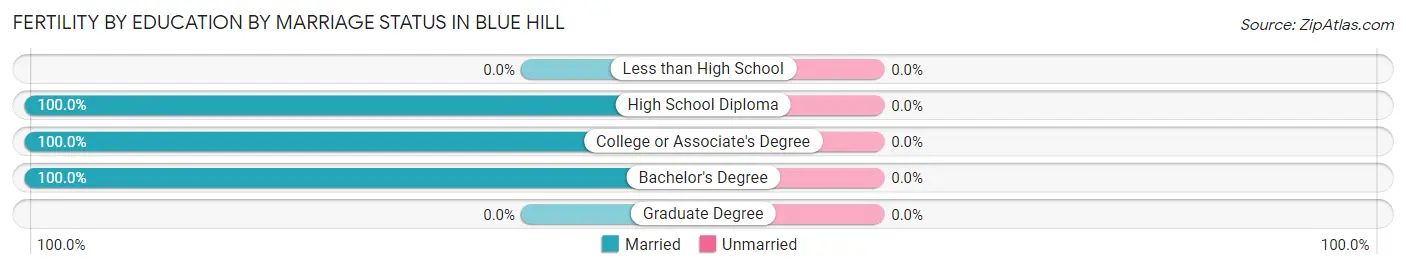
| Educational Attainment | Married | Unmarried |
| Less than High School | 0 (0.0%) | 0 (0.0%) |
| High School Diploma | 3 (100.0%) | 0 (0.0%) |
| College or Associate's Degree | 5 (100.0%) | 0 (0.0%) |
| Bachelor's Degree | 4 (100.0%) | 0 (0.0%) |
| Graduate Degree | 0 (0.0%) | 0 (0.0%) |
| Total | 12 (100.0%) | 0 (0.0%) |
Employment Characteristics in Blue Hill
Employment by Class of Employer in Blue Hill
Among the 449 employed individuals in Blue Hill, private company employees (269 | 59.9%), not-for-profit organizations (56 | 12.5%), and local government employees (53 | 11.8%) make up the most common classes of employment.
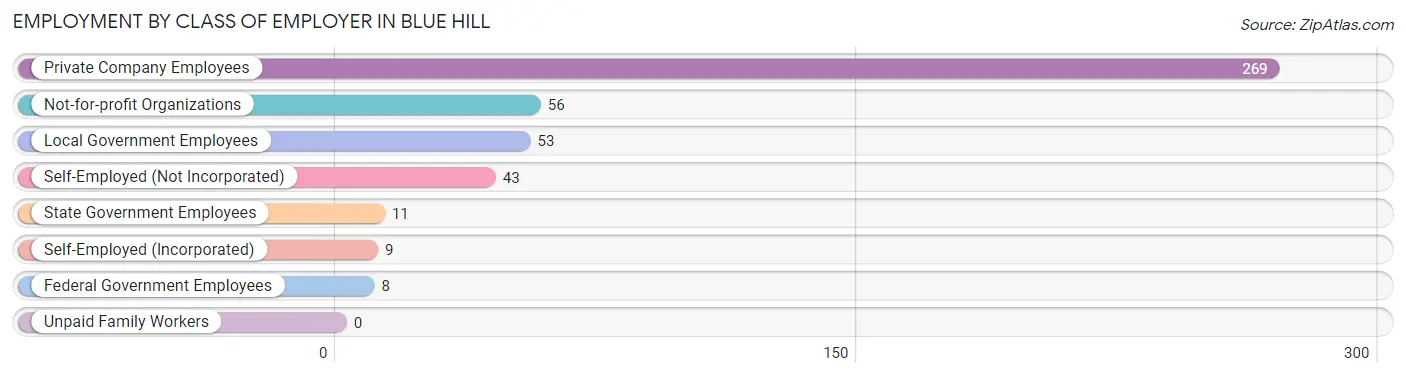
| Employer Class | # Employees | % Employees |
| Private Company Employees | 269 | 59.9% |
| Self-Employed (Incorporated) | 9 | 2.0% |
| Self-Employed (Not Incorporated) | 43 | 9.6% |
| Not-for-profit Organizations | 56 | 12.5% |
| Local Government Employees | 53 | 11.8% |
| State Government Employees | 11 | 2.5% |
| Federal Government Employees | 8 | 1.8% |
| Unpaid Family Workers | 0 | 0.0% |
| Total | 449 | 100.0% |
Employment Status by Age in Blue Hill
According to the labor force statistics for Blue Hill, out of the total population over 16 years of age (686), 69.5% or 477 individuals are in the labor force, with 2.5% or 12 of them unemployed. The age group with the highest labor force participation rate is 20 to 24 years, with 100.0% or 54 individuals in the labor force. Within the labor force, the 16 to 19 years age range has the highest percentage of unemployed individuals, with 33.3% or 5 of them being unemployed.
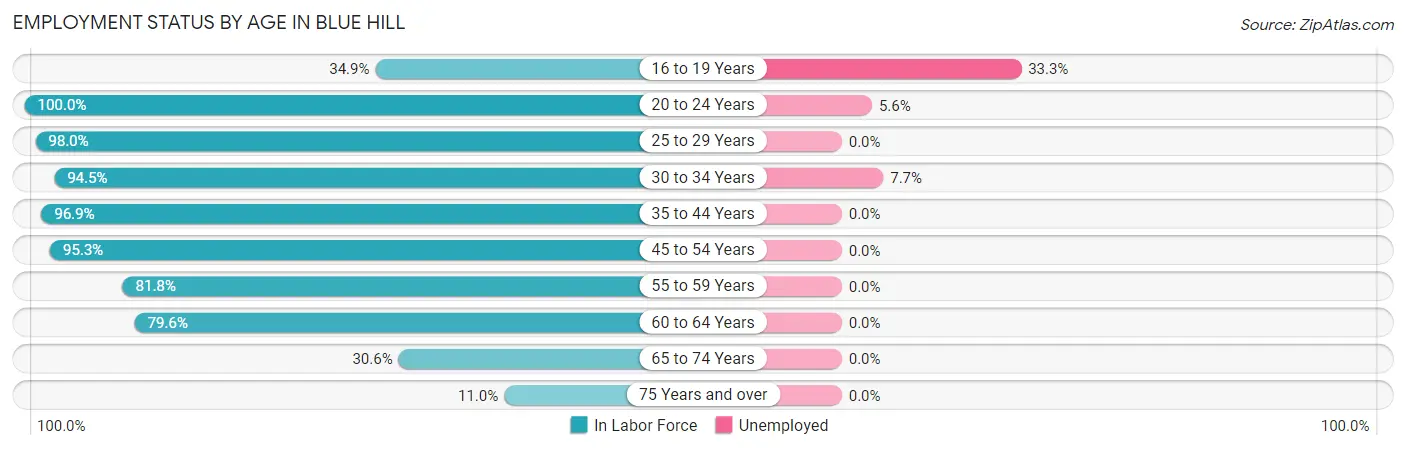
| Age Bracket | In Labor Force | Unemployed |
| 16 to 19 Years | 15 (34.9%) | 5 (33.3%) |
| 20 to 24 Years | 54 (100.0%) | 3 (5.6%) |
| 25 to 29 Years | 49 (98.0%) | 0 (0.0%) |
| 30 to 34 Years | 52 (94.5%) | 4 (7.7%) |
| 35 to 44 Years | 94 (96.9%) | 0 (0.0%) |
| 45 to 54 Years | 82 (95.3%) | 0 (0.0%) |
| 55 to 59 Years | 54 (81.8%) | 0 (0.0%) |
| 60 to 64 Years | 43 (79.6%) | 0 (0.0%) |
| 65 to 74 Years | 22 (30.6%) | 0 (0.0%) |
| 75 Years and over | 12 (11.0%) | 0 (0.0%) |
| Total | 477 (69.5%) | 12 (2.5%) |
Employment Status by Educational Attainment in Blue Hill
According to labor force statistics for Blue Hill, 91.7% of individuals (374) out of the total population between 25 and 64 years of age (408) are in the labor force, with 1.1% or 4 of them being unemployed. The group with the highest labor force participation rate are those with the educational attainment of college / associate degree, with 95.5% or 193 individuals in the labor force. Within the labor force, individuals with high school diploma education have the highest percentage of unemployment, with 2.8% or 3 of them being unemployed.
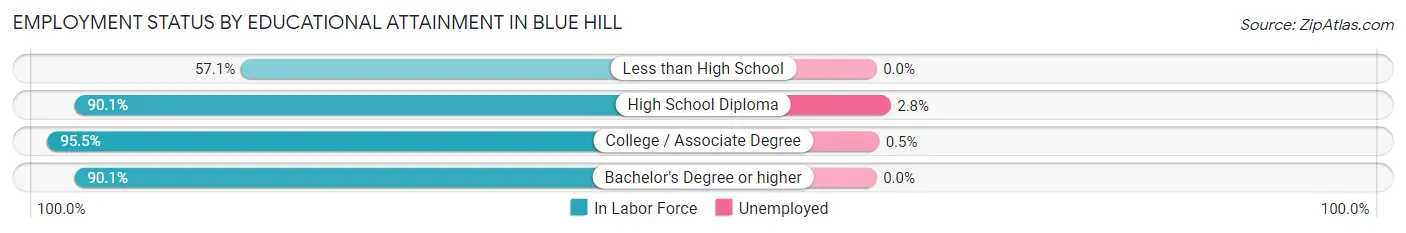
| Educational Attainment | In Labor Force | Unemployed |
| Less than High School | 8 (57.1%) | 0 (0.0%) |
| High School Diploma | 109 (90.1%) | 3 (2.8%) |
| College / Associate Degree | 193 (95.5%) | 1 (0.5%) |
| Bachelor's Degree or higher | 64 (90.1%) | 0 (0.0%) |
| Total | 374 (91.7%) | 4 (1.1%) |
Employment Occupations by Sex in Blue Hill
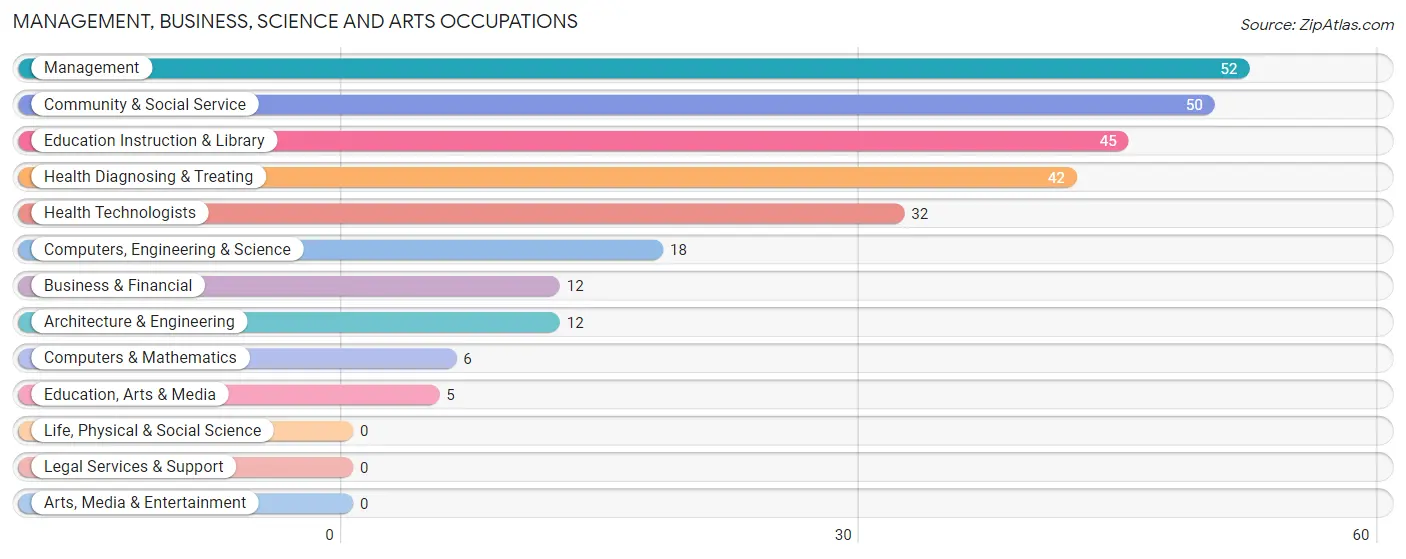
Management, Business, Science and Arts Occupations
The most common Management, Business, Science and Arts occupations in Blue Hill are Management (52 | 11.2%), Community & Social Service (50 | 10.7%), Education Instruction & Library (45 | 9.7%), Health Diagnosing & Treating (42 | 9.0%), and Health Technologists (32 | 6.9%).
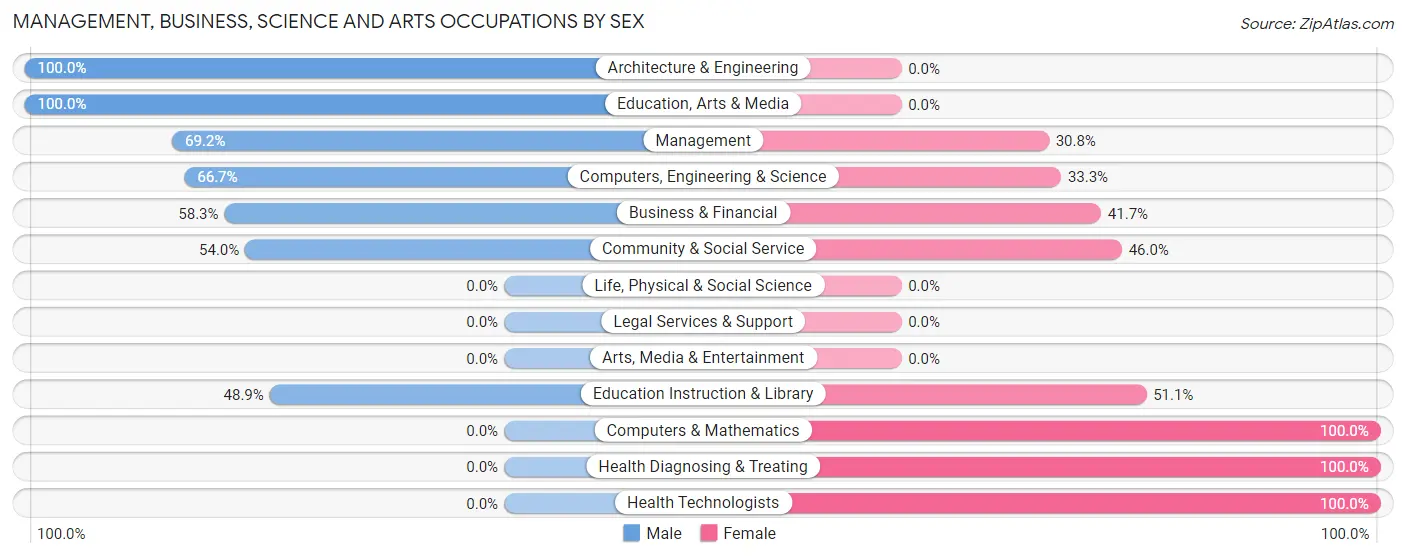
Management, Business, Science and Arts Occupations by Sex
Within the Management, Business, Science and Arts occupations in Blue Hill, the most male-oriented occupations are Architecture & Engineering (100.0%), Education, Arts & Media (100.0%), and Management (69.2%), while the most female-oriented occupations are Computers & Mathematics (100.0%), Health Diagnosing & Treating (100.0%), and Health Technologists (100.0%).
| Occupation | Male | Female |
| Management | 36 (69.2%) | 16 (30.8%) |
| Business & Financial | 7 (58.3%) | 5 (41.7%) |
| Computers, Engineering & Science | 12 (66.7%) | 6 (33.3%) |
| Computers & Mathematics | 0 (0.0%) | 6 (100.0%) |
| Architecture & Engineering | 12 (100.0%) | 0 (0.0%) |
| Life, Physical & Social Science | 0 (0.0%) | 0 (0.0%) |
| Community & Social Service | 27 (54.0%) | 23 (46.0%) |
| Education, Arts & Media | 5 (100.0%) | 0 (0.0%) |
| Legal Services & Support | 0 (0.0%) | 0 (0.0%) |
| Education Instruction & Library | 22 (48.9%) | 23 (51.1%) |
| Arts, Media & Entertainment | 0 (0.0%) | 0 (0.0%) |
| Health Diagnosing & Treating | 0 (0.0%) | 42 (100.0%) |
| Health Technologists | 0 (0.0%) | 32 (100.0%) |
| Total (Category) | 82 (47.1%) | 92 (52.9%) |
| Total (Overall) | 282 (60.7%) | 183 (39.4%) |
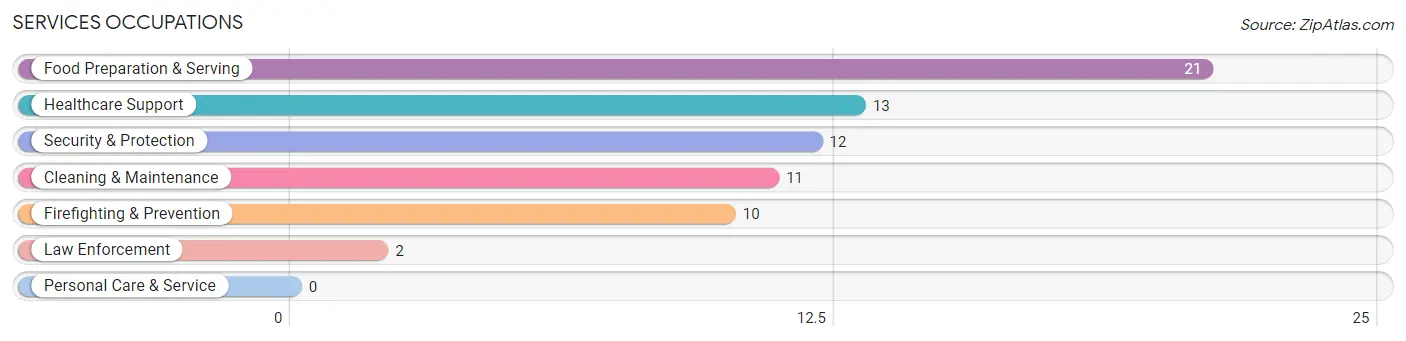
Services Occupations
The most common Services occupations in Blue Hill are Food Preparation & Serving (21 | 4.5%), Healthcare Support (13 | 2.8%), Security & Protection (12 | 2.6%), Cleaning & Maintenance (11 | 2.4%), and Firefighting & Prevention (10 | 2.1%).
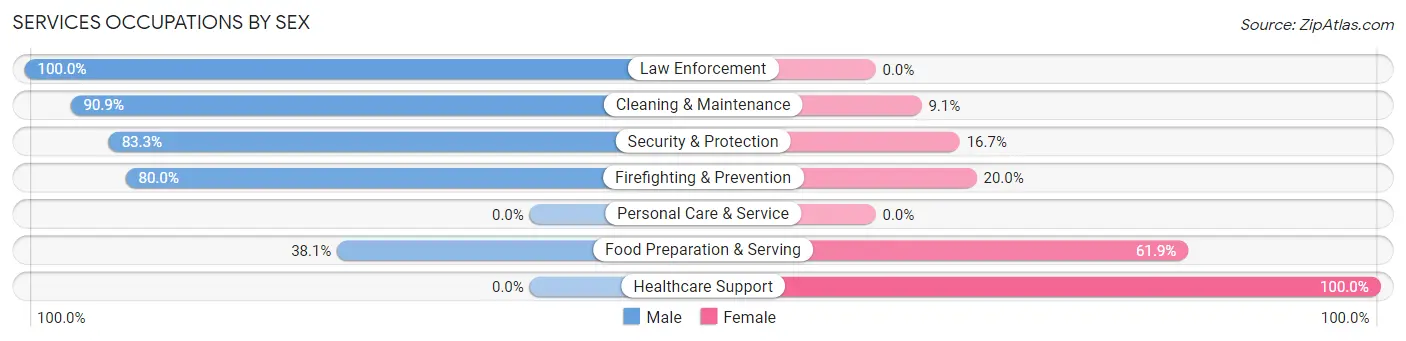
Services Occupations by Sex
Within the Services occupations in Blue Hill, the most male-oriented occupations are Law Enforcement (100.0%), Cleaning & Maintenance (90.9%), and Security & Protection (83.3%), while the most female-oriented occupations are Healthcare Support (100.0%), Food Preparation & Serving (61.9%), and Firefighting & Prevention (20.0%).
| Occupation | Male | Female |
| Healthcare Support | 0 (0.0%) | 13 (100.0%) |
| Security & Protection | 10 (83.3%) | 2 (16.7%) |
| Firefighting & Prevention | 8 (80.0%) | 2 (20.0%) |
| Law Enforcement | 2 (100.0%) | 0 (0.0%) |
| Food Preparation & Serving | 8 (38.1%) | 13 (61.9%) |
| Cleaning & Maintenance | 10 (90.9%) | 1 (9.1%) |
| Personal Care & Service | 0 (0.0%) | 0 (0.0%) |
| Total (Category) | 28 (49.1%) | 29 (50.9%) |
| Total (Overall) | 282 (60.7%) | 183 (39.4%) |
Sales and Office Occupations
The most common Sales and Office occupations in Blue Hill are Office & Administration (52 | 11.2%), and Sales & Related (24 | 5.2%).
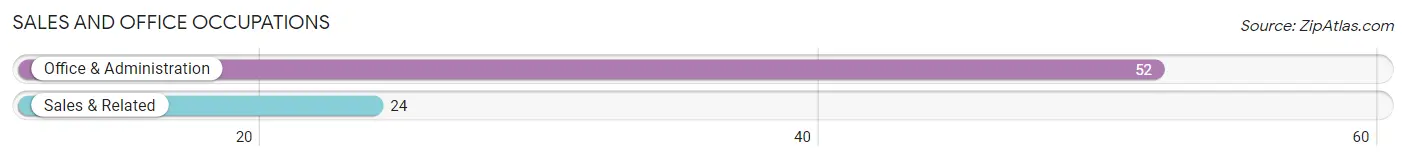
Sales and Office Occupations by Sex

| Occupation | Male | Female |
| Sales & Related | 21 (87.5%) | 3 (12.5%) |
| Office & Administration | 10 (19.2%) | 42 (80.8%) |
| Total (Category) | 31 (40.8%) | 45 (59.2%) |
| Total (Overall) | 282 (60.7%) | 183 (39.4%) |
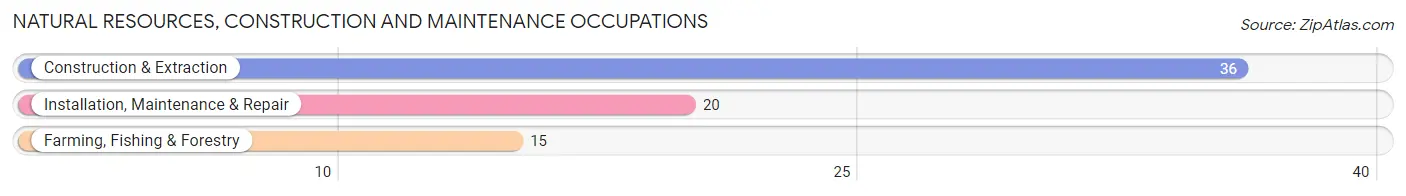
Natural Resources, Construction and Maintenance Occupations
The most common Natural Resources, Construction and Maintenance occupations in Blue Hill are Construction & Extraction (36 | 7.7%), Installation, Maintenance & Repair (20 | 4.3%), and Farming, Fishing & Forestry (15 | 3.2%).
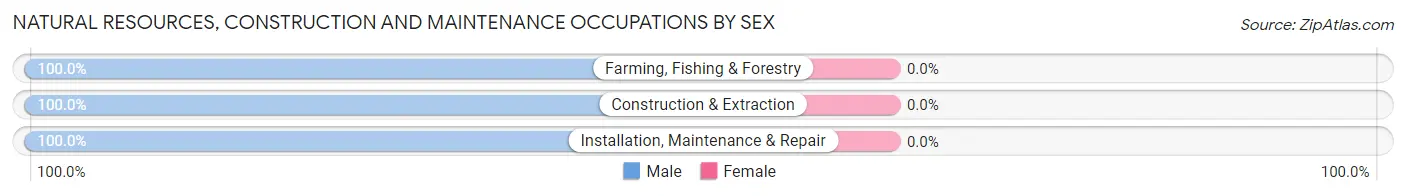
Natural Resources, Construction and Maintenance Occupations by Sex
| Occupation | Male | Female |
| Farming, Fishing & Forestry | 15 (100.0%) | 0 (0.0%) |
| Construction & Extraction | 36 (100.0%) | 0 (0.0%) |
| Installation, Maintenance & Repair | 20 (100.0%) | 0 (0.0%) |
| Total (Category) | 71 (100.0%) | 0 (0.0%) |
| Total (Overall) | 282 (60.7%) | 183 (39.4%) |
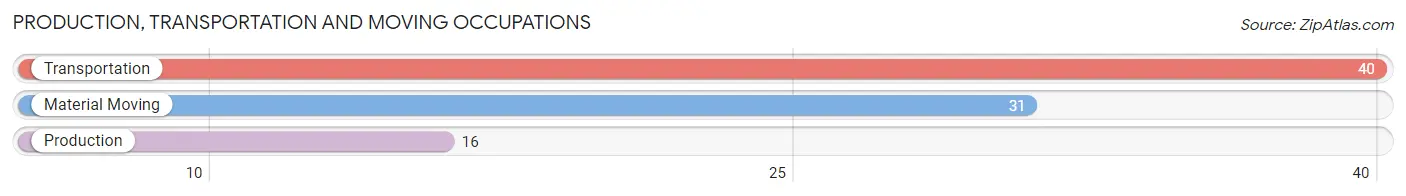
Production, Transportation and Moving Occupations
The most common Production, Transportation and Moving occupations in Blue Hill are Transportation (40 | 8.6%), Material Moving (31 | 6.7%), and Production (16 | 3.4%).
Production, Transportation and Moving Occupations by Sex
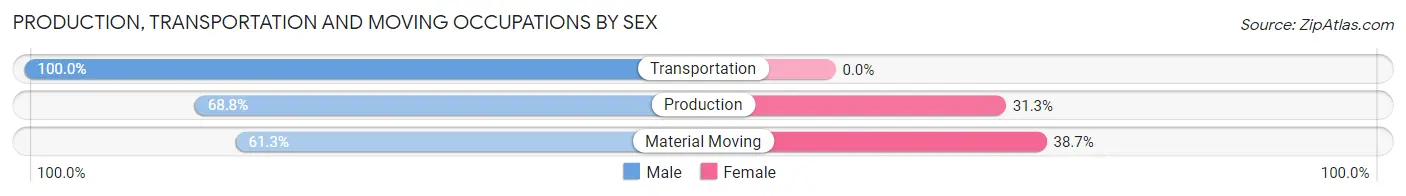
| Occupation | Male | Female |
| Production | 11 (68.8%) | 5 (31.2%) |
| Transportation | 40 (100.0%) | 0 (0.0%) |
| Material Moving | 19 (61.3%) | 12 (38.7%) |
| Total (Category) | 70 (80.5%) | 17 (19.5%) |
| Total (Overall) | 282 (60.7%) | 183 (39.4%) |
Employment Industries by Sex in Blue Hill
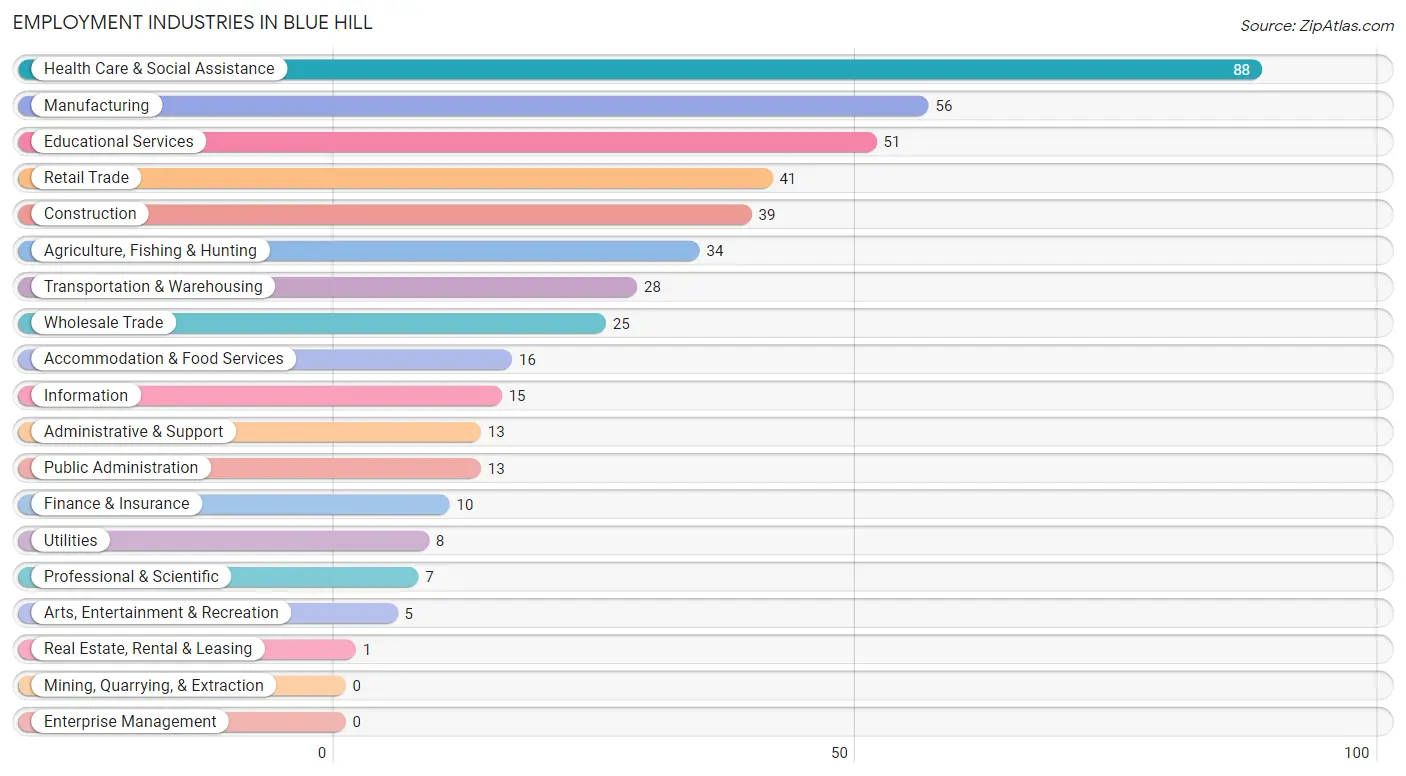
Employment Industries in Blue Hill
The major employment industries in Blue Hill include Health Care & Social Assistance (88 | 18.9%), Manufacturing (56 | 12.0%), Educational Services (51 | 11.0%), Retail Trade (41 | 8.8%), and Construction (39 | 8.4%).
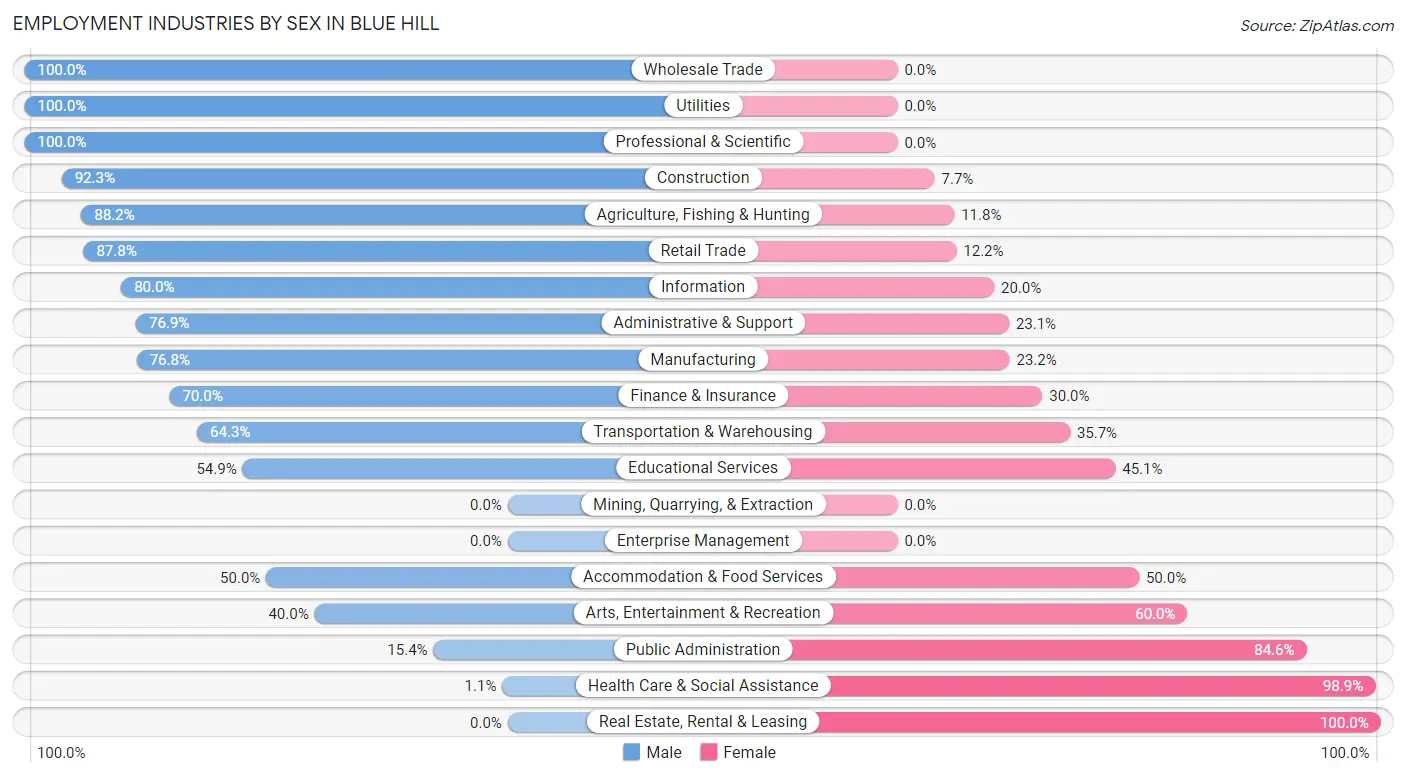
Employment Industries by Sex in Blue Hill
The Blue Hill industries that see more men than women are Wholesale Trade (100.0%), Utilities (100.0%), and Professional & Scientific (100.0%), whereas the industries that tend to have a higher number of women are Real Estate, Rental & Leasing (100.0%), Health Care & Social Assistance (98.9%), and Public Administration (84.6%).
| Industry | Male | Female |
| Agriculture, Fishing & Hunting | 30 (88.2%) | 4 (11.8%) |
| Mining, Quarrying, & Extraction | 0 (0.0%) | 0 (0.0%) |
| Construction | 36 (92.3%) | 3 (7.7%) |
| Manufacturing | 43 (76.8%) | 13 (23.2%) |
| Wholesale Trade | 25 (100.0%) | 0 (0.0%) |
| Retail Trade | 36 (87.8%) | 5 (12.2%) |
| Transportation & Warehousing | 18 (64.3%) | 10 (35.7%) |
| Utilities | 8 (100.0%) | 0 (0.0%) |
| Information | 12 (80.0%) | 3 (20.0%) |
| Finance & Insurance | 7 (70.0%) | 3 (30.0%) |
| Real Estate, Rental & Leasing | 0 (0.0%) | 1 (100.0%) |
| Professional & Scientific | 7 (100.0%) | 0 (0.0%) |
| Enterprise Management | 0 (0.0%) | 0 (0.0%) |
| Administrative & Support | 10 (76.9%) | 3 (23.1%) |
| Educational Services | 28 (54.9%) | 23 (45.1%) |
| Health Care & Social Assistance | 1 (1.1%) | 87 (98.9%) |
| Arts, Entertainment & Recreation | 2 (40.0%) | 3 (60.0%) |
| Accommodation & Food Services | 8 (50.0%) | 8 (50.0%) |
| Public Administration | 2 (15.4%) | 11 (84.6%) |
| Total | 282 (60.7%) | 183 (39.4%) |
Education in Blue Hill
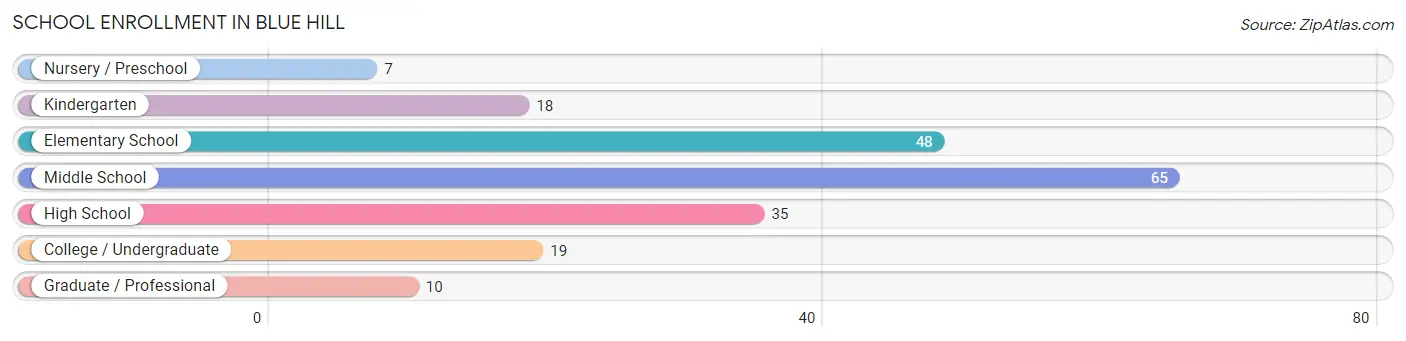
School Enrollment in Blue Hill
The most common levels of schooling among the 202 students in Blue Hill are middle school (65 | 32.2%), elementary school (48 | 23.8%), and high school (35 | 17.3%).
| School Level | # Students | % Students |
| Nursery / Preschool | 7 | 3.5% |
| Kindergarten | 18 | 8.9% |
| Elementary School | 48 | 23.8% |
| Middle School | 65 | 32.2% |
| High School | 35 | 17.3% |
| College / Undergraduate | 19 | 9.4% |
| Graduate / Professional | 10 | 5.0% |
| Total | 202 | 100.0% |
School Enrollment by Age by Funding Source in Blue Hill
Out of a total of 202 students who are enrolled in schools in Blue Hill, 19 (9.4%) attend a private institution, while the remaining 183 (90.6%) are enrolled in public schools. The age group of 18 to 19 year olds has the highest likelihood of being enrolled in private schools, with 5 (100.0% in the age bracket) enrolled. Conversely, the age group of 5 to 9 year old has the lowest likelihood of being enrolled in a private school, with 65 (100.0% in the age bracket) attending a public institution.
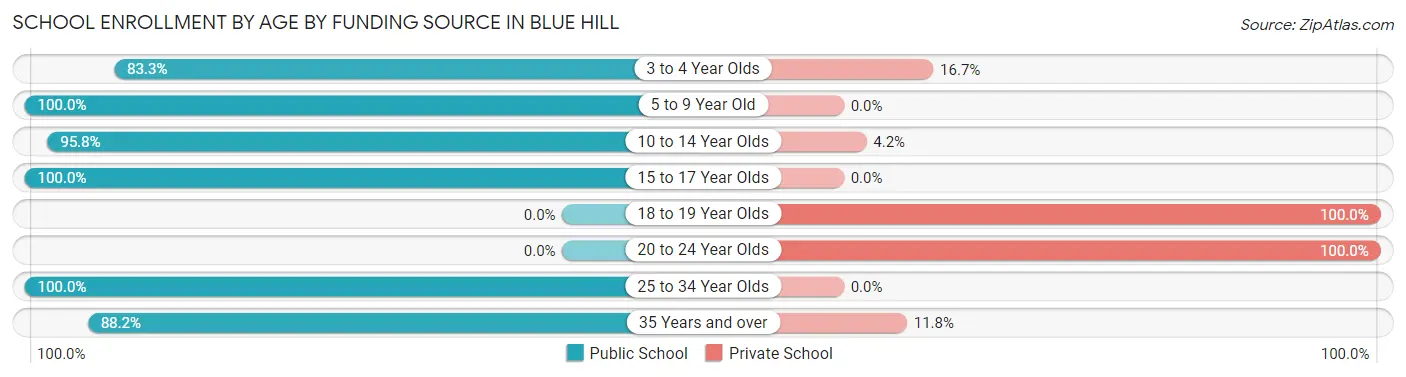
| Age Bracket | Public School | Private School |
| 3 to 4 Year Olds | 5 (83.3%) | 1 (16.7%) |
| 5 to 9 Year Old | 65 (100.0%) | 0 (0.0%) |
| 10 to 14 Year Olds | 68 (95.8%) | 3 (4.2%) |
| 15 to 17 Year Olds | 27 (100.0%) | 0 (0.0%) |
| 18 to 19 Year Olds | 0 (0.0%) | 5 (100.0%) |
| 20 to 24 Year Olds | 0 (0.0%) | 8 (100.0%) |
| 25 to 34 Year Olds | 3 (100.0%) | 0 (0.0%) |
| 35 Years and over | 15 (88.2%) | 2 (11.8%) |
| Total | 183 (90.6%) | 19 (9.4%) |
Educational Attainment by Field of Study in Blue Hill
Business (41 | 30.8%), education (41 | 30.8%), science & technology (24 | 18.0%), bio, nature & agricultural (11 | 8.3%), and arts & humanities (8 | 6.0%) are the most common fields of study among 133 individuals in Blue Hill who have obtained a bachelor's degree or higher.
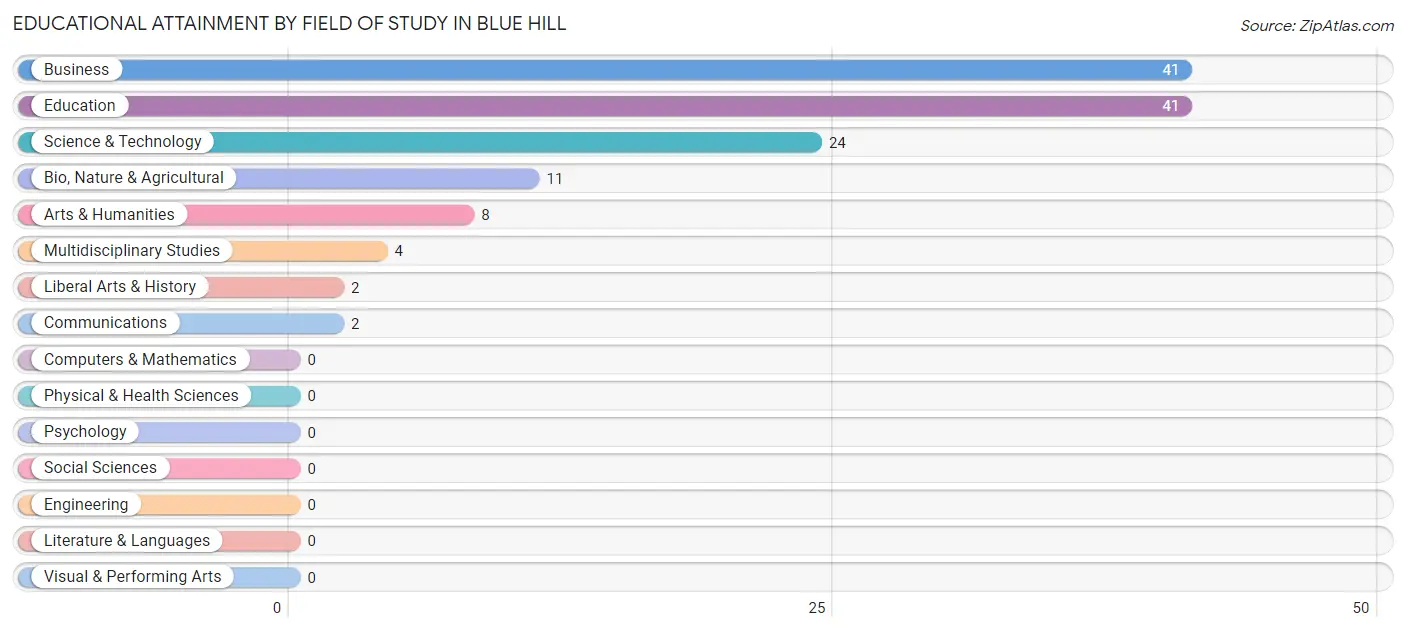
| Field of Study | # Graduates | % Graduates |
| Computers & Mathematics | 0 | 0.0% |
| Bio, Nature & Agricultural | 11 | 8.3% |
| Physical & Health Sciences | 0 | 0.0% |
| Psychology | 0 | 0.0% |
| Social Sciences | 0 | 0.0% |
| Engineering | 0 | 0.0% |
| Multidisciplinary Studies | 4 | 3.0% |
| Science & Technology | 24 | 18.0% |
| Business | 41 | 30.8% |
| Education | 41 | 30.8% |
| Literature & Languages | 0 | 0.0% |
| Liberal Arts & History | 2 | 1.5% |
| Visual & Performing Arts | 0 | 0.0% |
| Communications | 2 | 1.5% |
| Arts & Humanities | 8 | 6.0% |
| Total | 133 | 100.0% |
Transportation & Commute in Blue Hill
Vehicle Availability by Sex in Blue Hill
The most prevalent vehicle ownership categories in Blue Hill are males with 2 vehicles (84, accounting for 31.2%) and females with 2 vehicles (36, making up 46.7%).
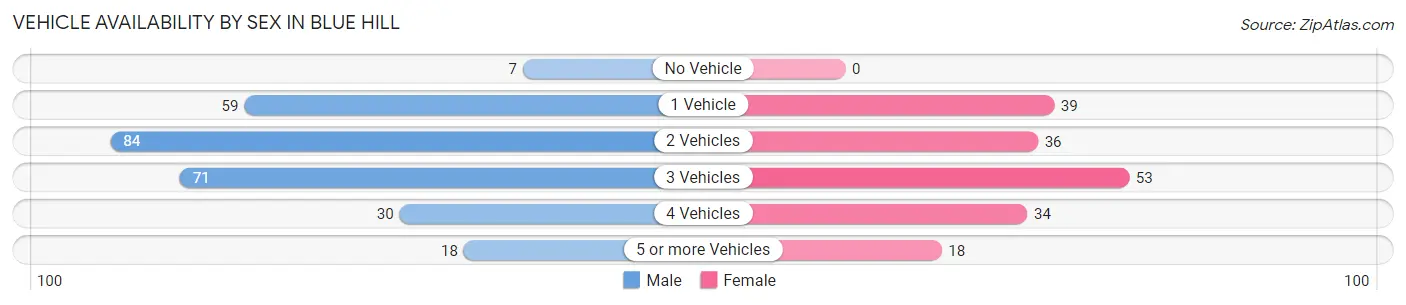
| Vehicles Available | Male | Female |
| No Vehicle | 7 (2.6%) | 0 (0.0%) |
| 1 Vehicle | 59 (21.9%) | 39 (21.7%) |
| 2 Vehicles | 84 (31.2%) | 36 (20.0%) |
| 3 Vehicles | 71 (26.4%) | 53 (29.4%) |
| 4 Vehicles | 30 (11.2%) | 34 (18.9%) |
| 5 or more Vehicles | 18 (6.7%) | 18 (10.0%) |
| Total | 269 (100.0%) | 180 (100.0%) |
Commute Time in Blue Hill
The most frequently occuring commute durations in Blue Hill are 30 to 34 minutes (97 commuters, 21.7%), 5 to 9 minutes (83 commuters, 18.6%), and 20 to 24 minutes (80 commuters, 17.9%).
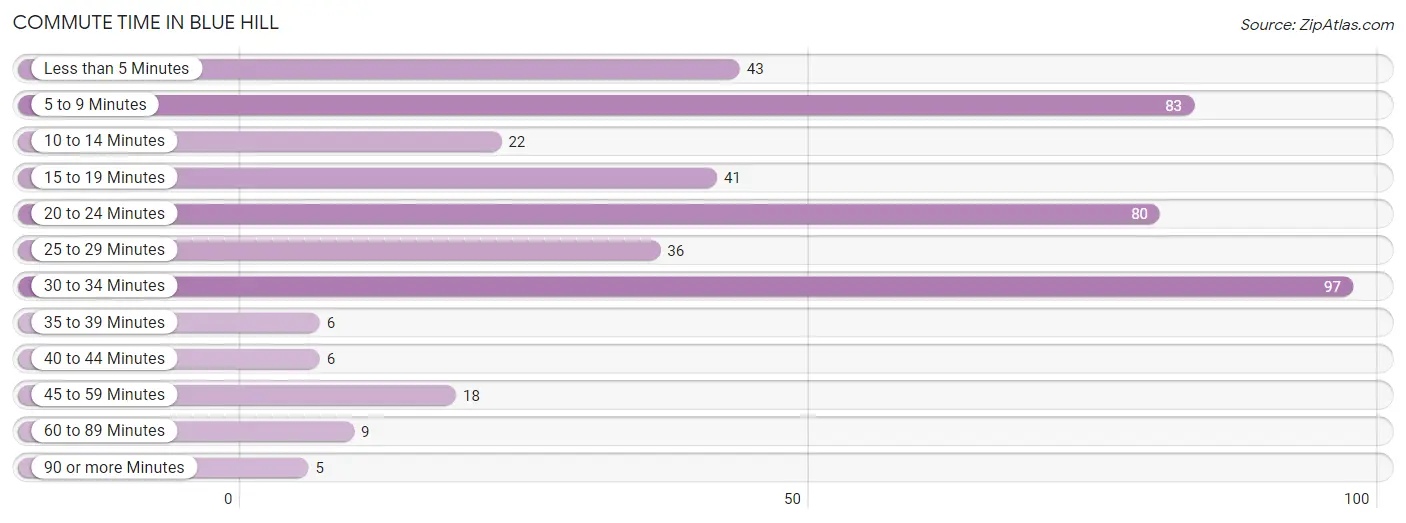
| Commute Time | # Commuters | % Commuters |
| Less than 5 Minutes | 43 | 9.6% |
| 5 to 9 Minutes | 83 | 18.6% |
| 10 to 14 Minutes | 22 | 4.9% |
| 15 to 19 Minutes | 41 | 9.2% |
| 20 to 24 Minutes | 80 | 17.9% |
| 25 to 29 Minutes | 36 | 8.1% |
| 30 to 34 Minutes | 97 | 21.7% |
| 35 to 39 Minutes | 6 | 1.3% |
| 40 to 44 Minutes | 6 | 1.3% |
| 45 to 59 Minutes | 18 | 4.0% |
| 60 to 89 Minutes | 9 | 2.0% |
| 90 or more Minutes | 5 | 1.1% |
Commute Time by Sex in Blue Hill
The most common commute times in Blue Hill are 20 to 24 minutes (59 commuters, 22.2%) for males and 30 to 34 minutes (53 commuters, 29.4%) for females.
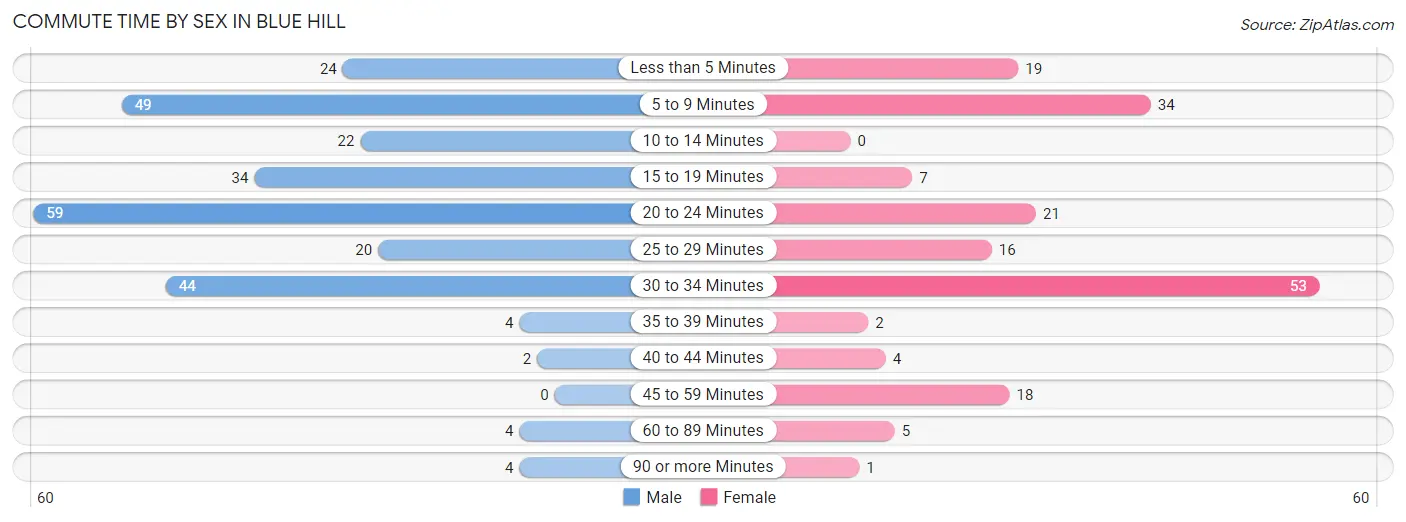
| Commute Time | Male | Female |
| Less than 5 Minutes | 24 (9.0%) | 19 (10.6%) |
| 5 to 9 Minutes | 49 (18.4%) | 34 (18.9%) |
| 10 to 14 Minutes | 22 (8.3%) | 0 (0.0%) |
| 15 to 19 Minutes | 34 (12.8%) | 7 (3.9%) |
| 20 to 24 Minutes | 59 (22.2%) | 21 (11.7%) |
| 25 to 29 Minutes | 20 (7.5%) | 16 (8.9%) |
| 30 to 34 Minutes | 44 (16.5%) | 53 (29.4%) |
| 35 to 39 Minutes | 4 (1.5%) | 2 (1.1%) |
| 40 to 44 Minutes | 2 (0.7%) | 4 (2.2%) |
| 45 to 59 Minutes | 0 (0.0%) | 18 (10.0%) |
| 60 to 89 Minutes | 4 (1.5%) | 5 (2.8%) |
| 90 or more Minutes | 4 (1.5%) | 1 (0.6%) |
Time of Departure to Work by Sex in Blue Hill
The most frequent times of departure to work in Blue Hill are 7:30 AM to 7:59 AM (74, 27.8%) for males and 7:00 AM to 7:29 AM (63, 35.0%) for females.

| Time of Departure | Male | Female |
| 12:00 AM to 4:59 AM | 0 (0.0%) | 9 (5.0%) |
| 5:00 AM to 5:29 AM | 14 (5.3%) | 12 (6.7%) |
| 5:30 AM to 5:59 AM | 12 (4.5%) | 13 (7.2%) |
| 6:00 AM to 6:29 AM | 39 (14.7%) | 22 (12.2%) |
| 6:30 AM to 6:59 AM | 53 (19.9%) | 12 (6.7%) |
| 7:00 AM to 7:29 AM | 34 (12.8%) | 63 (35.0%) |
| 7:30 AM to 7:59 AM | 74 (27.8%) | 16 (8.9%) |
| 8:00 AM to 8:29 AM | 12 (4.5%) | 19 (10.6%) |
| 8:30 AM to 8:59 AM | 0 (0.0%) | 3 (1.7%) |
| 9:00 AM to 9:59 AM | 8 (3.0%) | 0 (0.0%) |
| 10:00 AM to 10:59 AM | 0 (0.0%) | 0 (0.0%) |
| 11:00 AM to 11:59 AM | 0 (0.0%) | 0 (0.0%) |
| 12:00 PM to 3:59 PM | 15 (5.6%) | 4 (2.2%) |
| 4:00 PM to 11:59 PM | 5 (1.9%) | 7 (3.9%) |
| Total | 266 (100.0%) | 180 (100.0%) |
Housing Occupancy in Blue Hill
Occupancy by Ownership in Blue Hill
Of the total 394 dwellings in Blue Hill, owner-occupied units account for 271 (68.8%), while renter-occupied units make up 123 (31.2%).
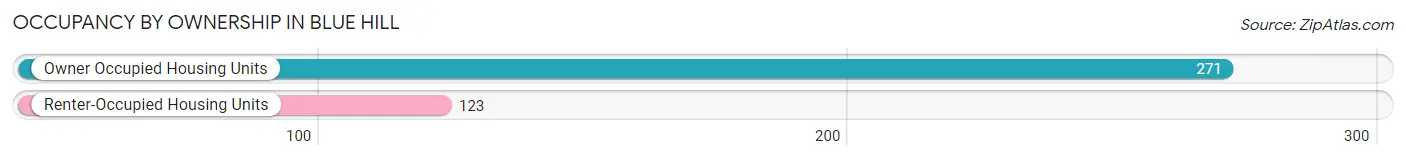
| Occupancy | # Housing Units | % Housing Units |
| Owner Occupied Housing Units | 271 | 68.8% |
| Renter-Occupied Housing Units | 123 | 31.2% |
| Total Occupied Housing Units | 394 | 100.0% |
Occupancy by Household Size in Blue Hill
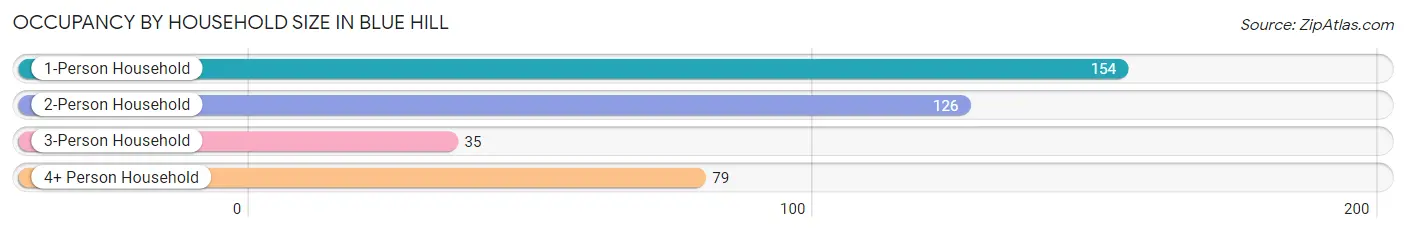
| Household Size | # Housing Units | % Housing Units |
| 1-Person Household | 154 | 39.1% |
| 2-Person Household | 126 | 32.0% |
| 3-Person Household | 35 | 8.9% |
| 4+ Person Household | 79 | 20.1% |
| Total Housing Units | 394 | 100.0% |
Occupancy by Ownership by Household Size in Blue Hill
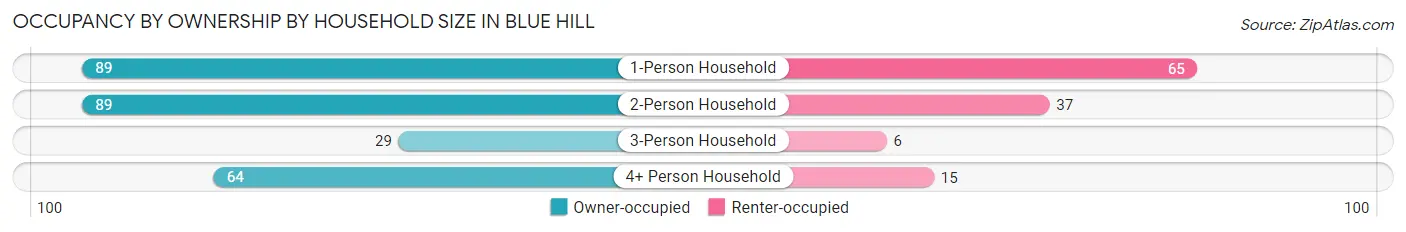
| Household Size | Owner-occupied | Renter-occupied |
| 1-Person Household | 89 (57.8%) | 65 (42.2%) |
| 2-Person Household | 89 (70.6%) | 37 (29.4%) |
| 3-Person Household | 29 (82.9%) | 6 (17.1%) |
| 4+ Person Household | 64 (81.0%) | 15 (19.0%) |
| Total Housing Units | 271 (68.8%) | 123 (31.2%) |
Occupancy by Educational Attainment in Blue Hill
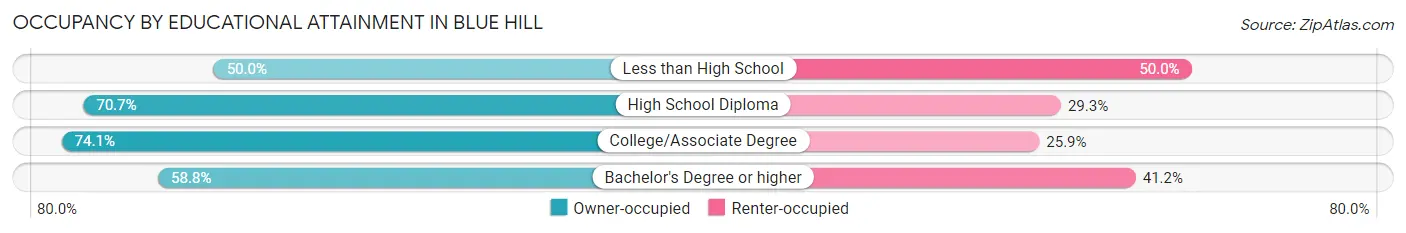
| Household Size | Owner-occupied | Renter-occupied |
| Less than High School | 3 (50.0%) | 3 (50.0%) |
| High School Diploma | 82 (70.7%) | 34 (29.3%) |
| College/Associate Degree | 126 (74.1%) | 44 (25.9%) |
| Bachelor's Degree or higher | 60 (58.8%) | 42 (41.2%) |
Occupancy by Age of Householder in Blue Hill
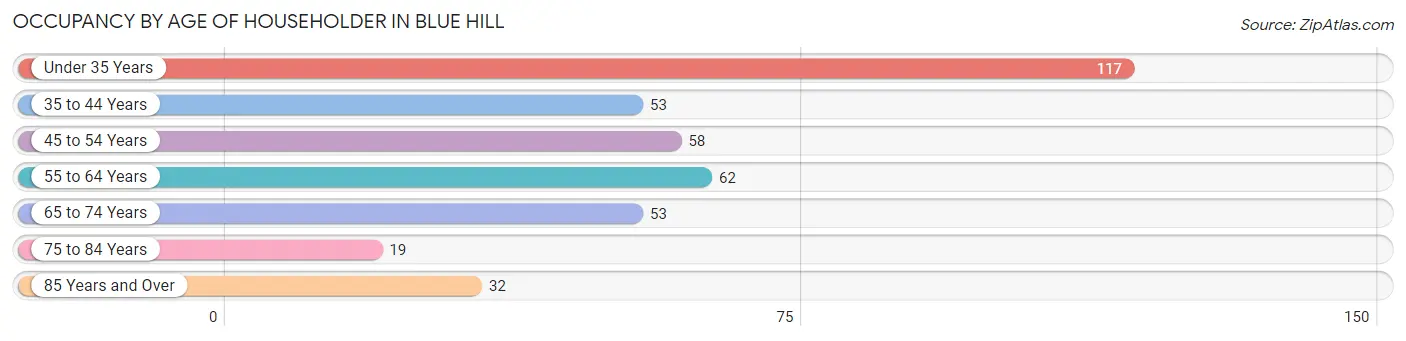
| Age Bracket | # Households | % Households |
| Under 35 Years | 117 | 29.7% |
| 35 to 44 Years | 53 | 13.5% |
| 45 to 54 Years | 58 | 14.7% |
| 55 to 64 Years | 62 | 15.7% |
| 65 to 74 Years | 53 | 13.5% |
| 75 to 84 Years | 19 | 4.8% |
| 85 Years and Over | 32 | 8.1% |
| Total | 394 | 100.0% |
Housing Finances in Blue Hill
Median Income by Occupancy in Blue Hill
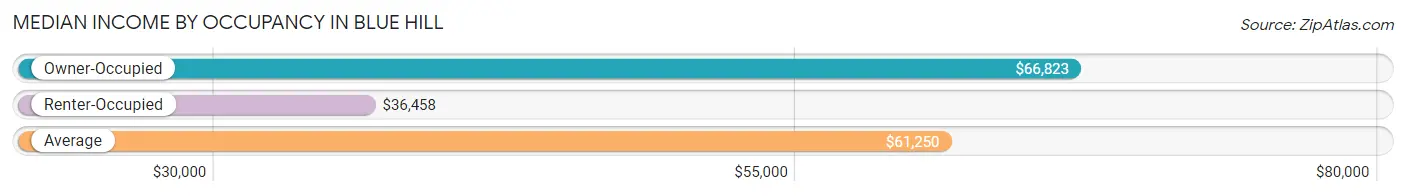
| Occupancy Type | # Households | Median Income |
| Owner-Occupied | 271 (68.8%) | $66,823 |
| Renter-Occupied | 123 (31.2%) | $36,458 |
| Average | 394 (100.0%) | $61,250 |
Occupancy by Householder Income Bracket in Blue Hill
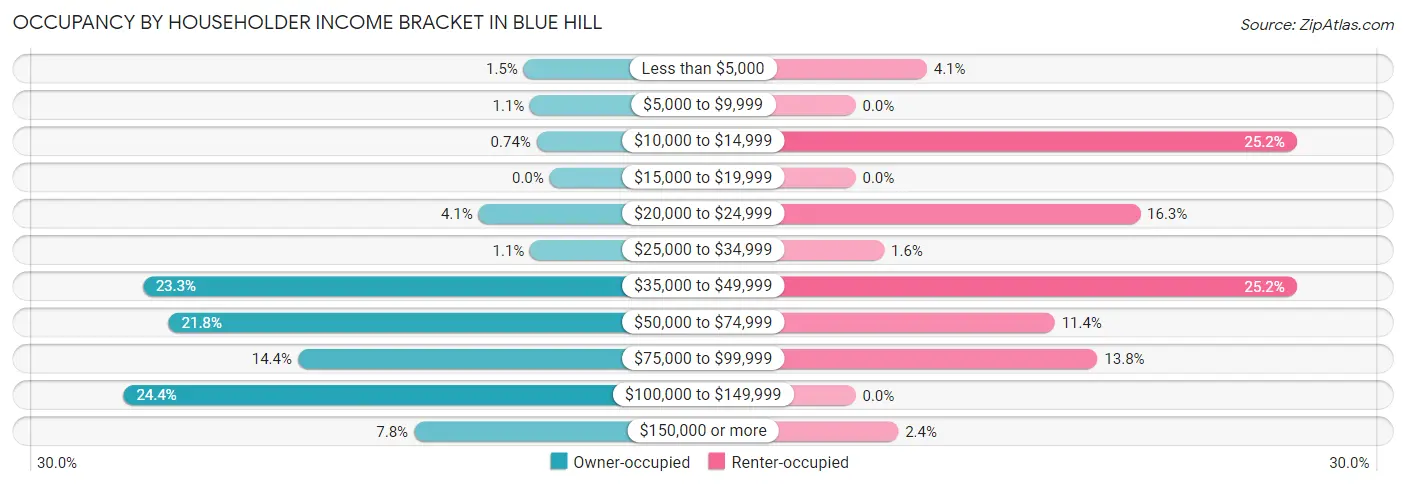
| Income Bracket | Owner-occupied | Renter-occupied |
| Less than $5,000 | 4 (1.5%) | 5 (4.1%) |
| $5,000 to $9,999 | 3 (1.1%) | 0 (0.0%) |
| $10,000 to $14,999 | 2 (0.7%) | 31 (25.2%) |
| $15,000 to $19,999 | 0 (0.0%) | 0 (0.0%) |
| $20,000 to $24,999 | 11 (4.1%) | 20 (16.3%) |
| $25,000 to $34,999 | 3 (1.1%) | 2 (1.6%) |
| $35,000 to $49,999 | 63 (23.3%) | 31 (25.2%) |
| $50,000 to $74,999 | 59 (21.8%) | 14 (11.4%) |
| $75,000 to $99,999 | 39 (14.4%) | 17 (13.8%) |
| $100,000 to $149,999 | 66 (24.3%) | 0 (0.0%) |
| $150,000 or more | 21 (7.7%) | 3 (2.4%) |
| Total | 271 (100.0%) | 123 (100.0%) |
Monthly Housing Cost Tiers in Blue Hill
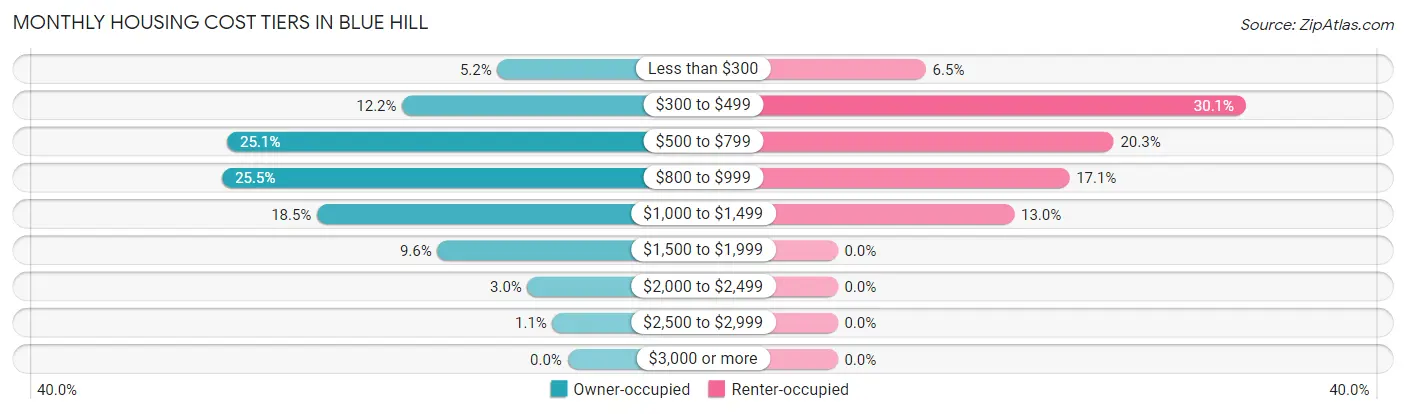
| Monthly Cost | Owner-occupied | Renter-occupied |
| Less than $300 | 14 (5.2%) | 8 (6.5%) |
| $300 to $499 | 33 (12.2%) | 37 (30.1%) |
| $500 to $799 | 68 (25.1%) | 25 (20.3%) |
| $800 to $999 | 69 (25.5%) | 21 (17.1%) |
| $1,000 to $1,499 | 50 (18.4%) | 16 (13.0%) |
| $1,500 to $1,999 | 26 (9.6%) | 0 (0.0%) |
| $2,000 to $2,499 | 8 (2.9%) | 0 (0.0%) |
| $2,500 to $2,999 | 3 (1.1%) | 0 (0.0%) |
| $3,000 or more | 0 (0.0%) | 0 (0.0%) |
| Total | 271 (100.0%) | 123 (100.0%) |
Physical Housing Characteristics in Blue Hill
Housing Structures in Blue Hill
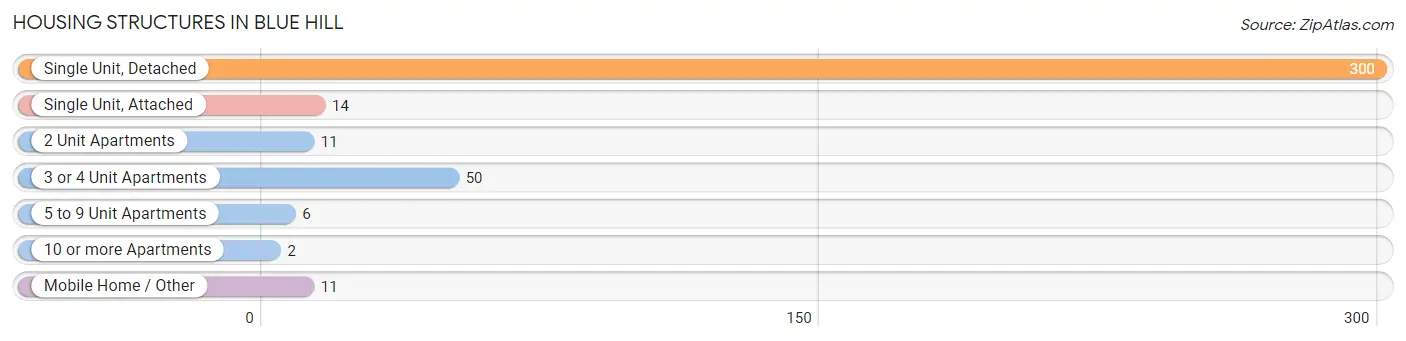
| Structure Type | # Housing Units | % Housing Units |
| Single Unit, Detached | 300 | 76.1% |
| Single Unit, Attached | 14 | 3.5% |
| 2 Unit Apartments | 11 | 2.8% |
| 3 or 4 Unit Apartments | 50 | 12.7% |
| 5 to 9 Unit Apartments | 6 | 1.5% |
| 10 or more Apartments | 2 | 0.5% |
| Mobile Home / Other | 11 | 2.8% |
| Total | 394 | 100.0% |
Housing Structures by Occupancy in Blue Hill
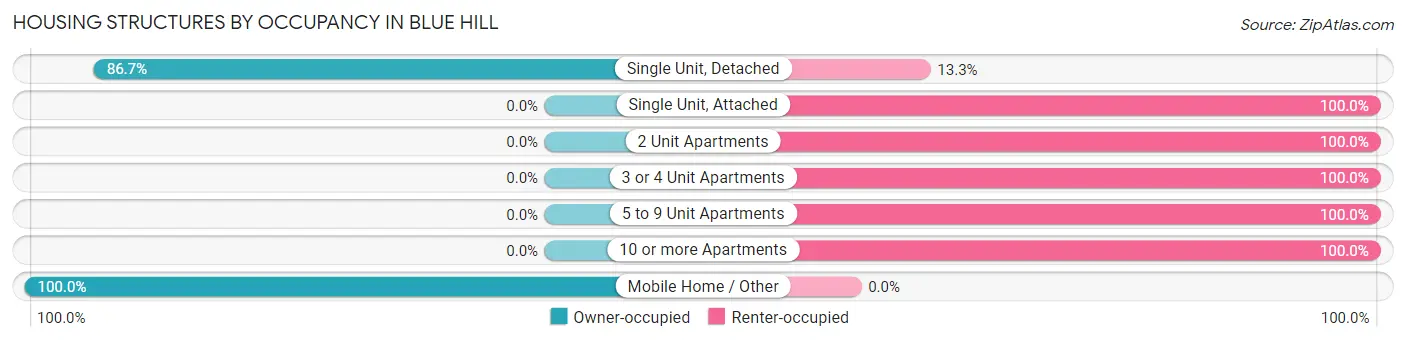
| Structure Type | Owner-occupied | Renter-occupied |
| Single Unit, Detached | 260 (86.7%) | 40 (13.3%) |
| Single Unit, Attached | 0 (0.0%) | 14 (100.0%) |
| 2 Unit Apartments | 0 (0.0%) | 11 (100.0%) |
| 3 or 4 Unit Apartments | 0 (0.0%) | 50 (100.0%) |
| 5 to 9 Unit Apartments | 0 (0.0%) | 6 (100.0%) |
| 10 or more Apartments | 0 (0.0%) | 2 (100.0%) |
| Mobile Home / Other | 11 (100.0%) | 0 (0.0%) |
| Total | 271 (68.8%) | 123 (31.2%) |
Housing Structures by Number of Rooms in Blue Hill
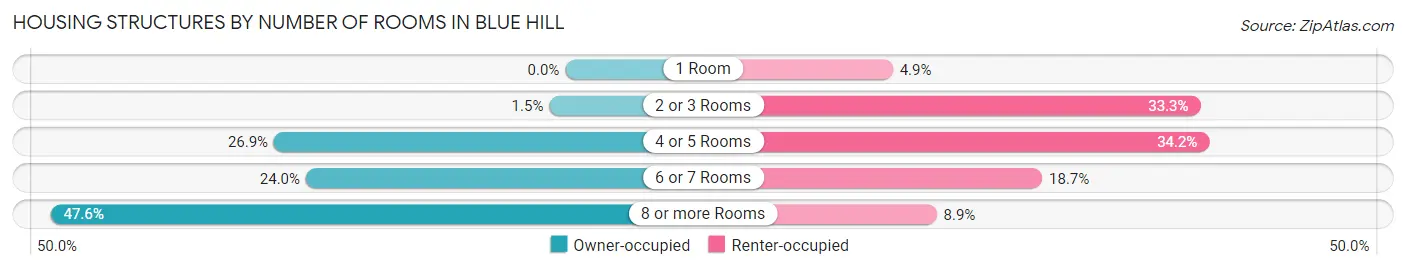
| Number of Rooms | Owner-occupied | Renter-occupied |
| 1 Room | 0 (0.0%) | 6 (4.9%) |
| 2 or 3 Rooms | 4 (1.5%) | 41 (33.3%) |
| 4 or 5 Rooms | 73 (26.9%) | 42 (34.2%) |
| 6 or 7 Rooms | 65 (24.0%) | 23 (18.7%) |
| 8 or more Rooms | 129 (47.6%) | 11 (8.9%) |
| Total | 271 (100.0%) | 123 (100.0%) |
Housing Structure by Heating Type in Blue Hill
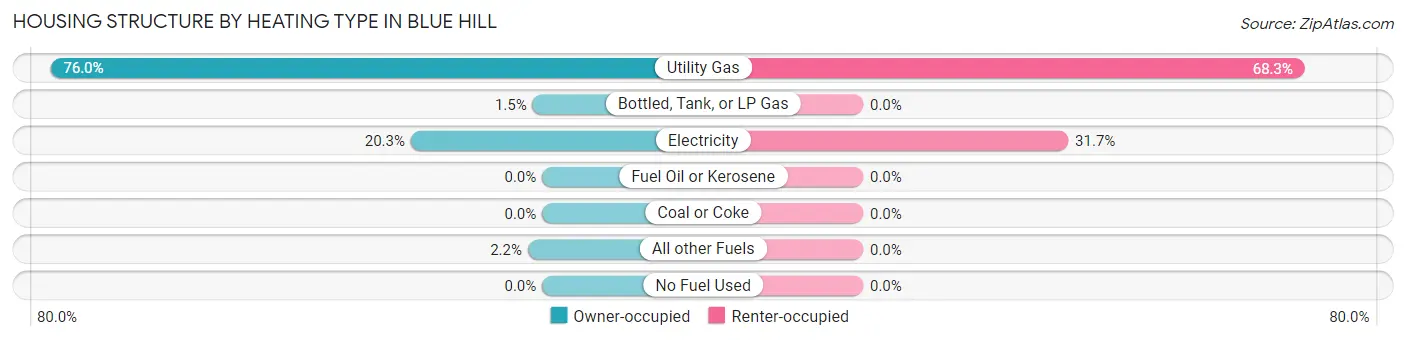
| Heating Type | Owner-occupied | Renter-occupied |
| Utility Gas | 206 (76.0%) | 84 (68.3%) |
| Bottled, Tank, or LP Gas | 4 (1.5%) | 0 (0.0%) |
| Electricity | 55 (20.3%) | 39 (31.7%) |
| Fuel Oil or Kerosene | 0 (0.0%) | 0 (0.0%) |
| Coal or Coke | 0 (0.0%) | 0 (0.0%) |
| All other Fuels | 6 (2.2%) | 0 (0.0%) |
| No Fuel Used | 0 (0.0%) | 0 (0.0%) |
| Total | 271 (100.0%) | 123 (100.0%) |
Household Vehicle Usage in Blue Hill
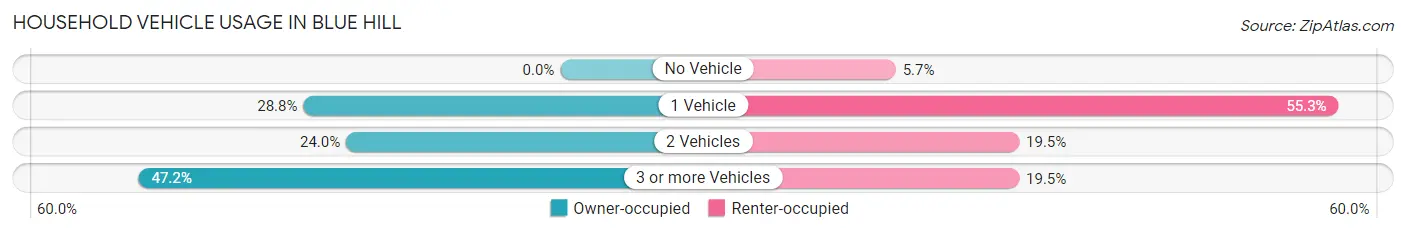
| Vehicles per Household | Owner-occupied | Renter-occupied |
| No Vehicle | 0 (0.0%) | 7 (5.7%) |
| 1 Vehicle | 78 (28.8%) | 68 (55.3%) |
| 2 Vehicles | 65 (24.0%) | 24 (19.5%) |
| 3 or more Vehicles | 128 (47.2%) | 24 (19.5%) |
| Total | 271 (100.0%) | 123 (100.0%) |
Real Estate & Mortgages in Blue Hill
Real Estate and Mortgage Overview in Blue Hill
| Characteristic | Without Mortgage | With Mortgage |
| Housing Units | 127 | 144 |
| Median Property Value | $138,800 | $138,000 |
| Median Household Income | $59,375 | $10 |
| Monthly Housing Costs | $594 | $0 |
| Real Estate Taxes | $2,150 | $1 |
Property Value by Mortgage Status in Blue Hill
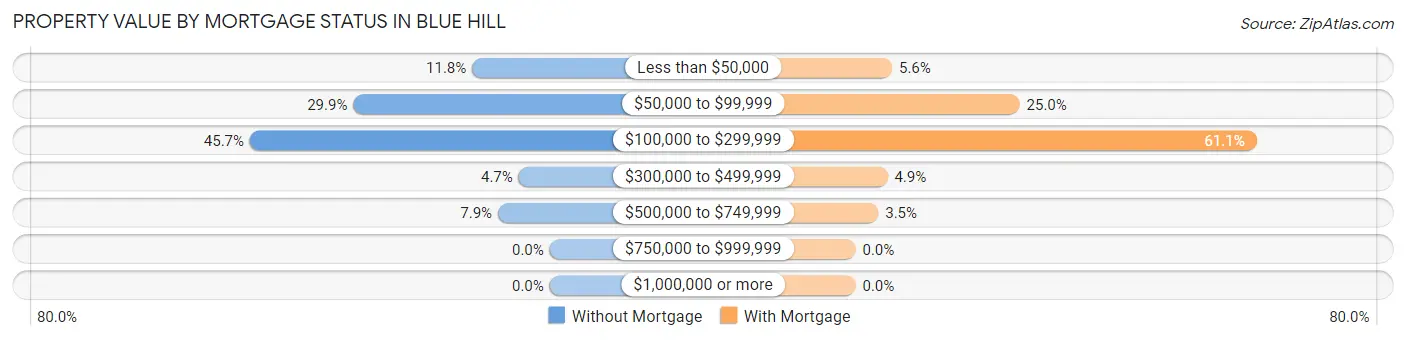
| Property Value | Without Mortgage | With Mortgage |
| Less than $50,000 | 15 (11.8%) | 8 (5.6%) |
| $50,000 to $99,999 | 38 (29.9%) | 36 (25.0%) |
| $100,000 to $299,999 | 58 (45.7%) | 88 (61.1%) |
| $300,000 to $499,999 | 6 (4.7%) | 7 (4.9%) |
| $500,000 to $749,999 | 10 (7.9%) | 5 (3.5%) |
| $750,000 to $999,999 | 0 (0.0%) | 0 (0.0%) |
| $1,000,000 or more | 0 (0.0%) | 0 (0.0%) |
| Total | 127 (100.0%) | 144 (100.0%) |
Household Income by Mortgage Status in Blue Hill
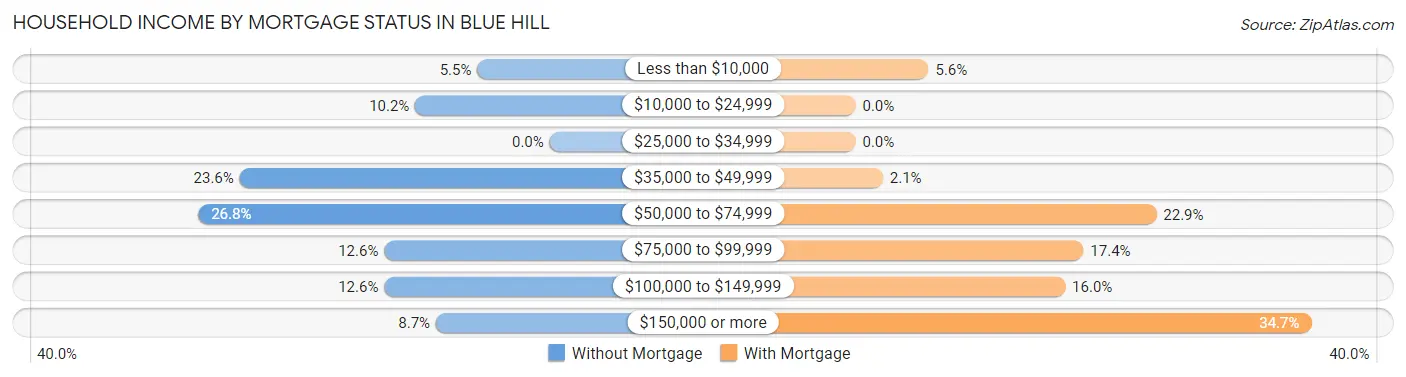
| Household Income | Without Mortgage | With Mortgage |
| Less than $10,000 | 7 (5.5%) | 8 (5.6%) |
| $10,000 to $24,999 | 13 (10.2%) | 0 (0.0%) |
| $25,000 to $34,999 | 0 (0.0%) | 0 (0.0%) |
| $35,000 to $49,999 | 30 (23.6%) | 3 (2.1%) |
| $50,000 to $74,999 | 34 (26.8%) | 33 (22.9%) |
| $75,000 to $99,999 | 16 (12.6%) | 25 (17.4%) |
| $100,000 to $149,999 | 16 (12.6%) | 23 (16.0%) |
| $150,000 or more | 11 (8.7%) | 50 (34.7%) |
| Total | 127 (100.0%) | 144 (100.0%) |
Property Value to Household Income Ratio in Blue Hill
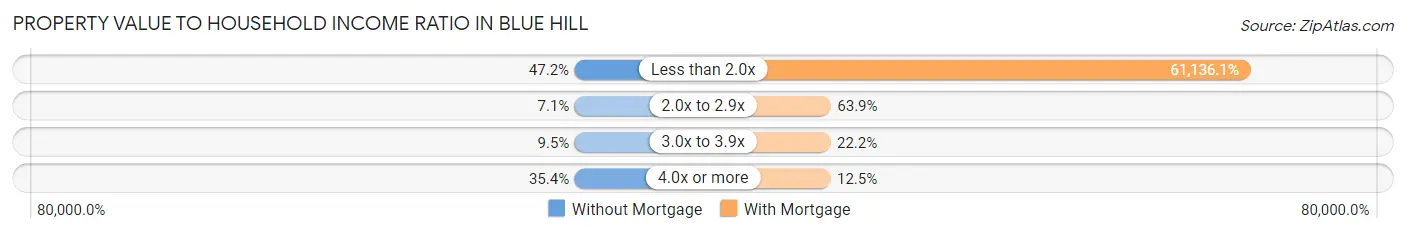
| Value-to-Income Ratio | Without Mortgage | With Mortgage |
| Less than 2.0x | 60 (47.2%) | 88,036 (61,136.1%) |
| 2.0x to 2.9x | 9 (7.1%) | 92 (63.9%) |
| 3.0x to 3.9x | 12 (9.5%) | 32 (22.2%) |
| 4.0x or more | 45 (35.4%) | 18 (12.5%) |
| Total | 127 (100.0%) | 144 (100.0%) |
Real Estate Taxes by Mortgage Status in Blue Hill
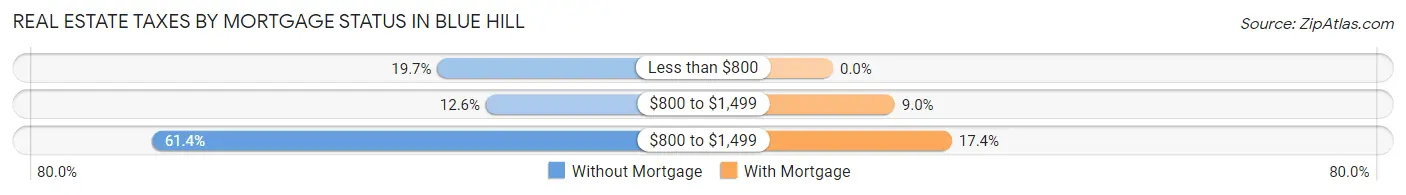
| Property Taxes | Without Mortgage | With Mortgage |
| Less than $800 | 25 (19.7%) | 0 (0.0%) |
| $800 to $1,499 | 16 (12.6%) | 13 (9.0%) |
| $800 to $1,499 | 78 (61.4%) | 25 (17.4%) |
| Total | 127 (100.0%) | 144 (100.0%) |
Health & Disability in Blue Hill
Health Insurance Coverage by Age in Blue Hill
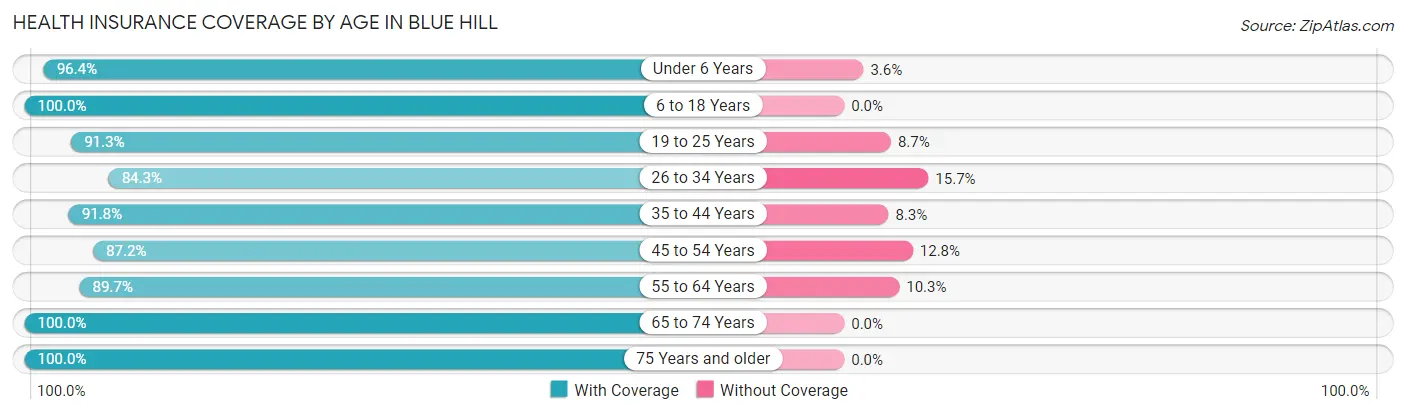
| Age Bracket | With Coverage | Without Coverage |
| Under 6 Years | 54 (96.4%) | 2 (3.6%) |
| 6 to 18 Years | 172 (100.0%) | 0 (0.0%) |
| 19 to 25 Years | 63 (91.3%) | 6 (8.7%) |
| 26 to 34 Years | 86 (84.3%) | 16 (15.7%) |
| 35 to 44 Years | 89 (91.7%) | 8 (8.3%) |
| 45 to 54 Years | 75 (87.2%) | 11 (12.8%) |
| 55 to 64 Years | 105 (89.7%) | 12 (10.3%) |
| 65 to 74 Years | 70 (100.0%) | 0 (0.0%) |
| 75 Years and older | 81 (100.0%) | 0 (0.0%) |
| Total | 795 (93.5%) | 55 (6.5%) |
Health Insurance Coverage by Citizenship Status in Blue Hill
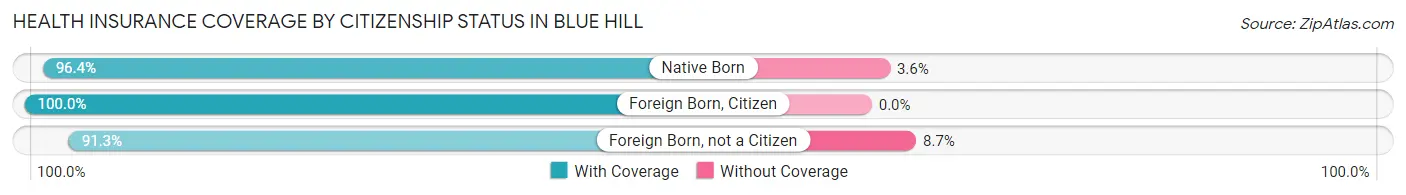
| Citizenship Status | With Coverage | Without Coverage |
| Native Born | 54 (96.4%) | 2 (3.6%) |
| Foreign Born, Citizen | 172 (100.0%) | 0 (0.0%) |
| Foreign Born, not a Citizen | 63 (91.3%) | 6 (8.7%) |
Health Insurance Coverage by Household Income in Blue Hill
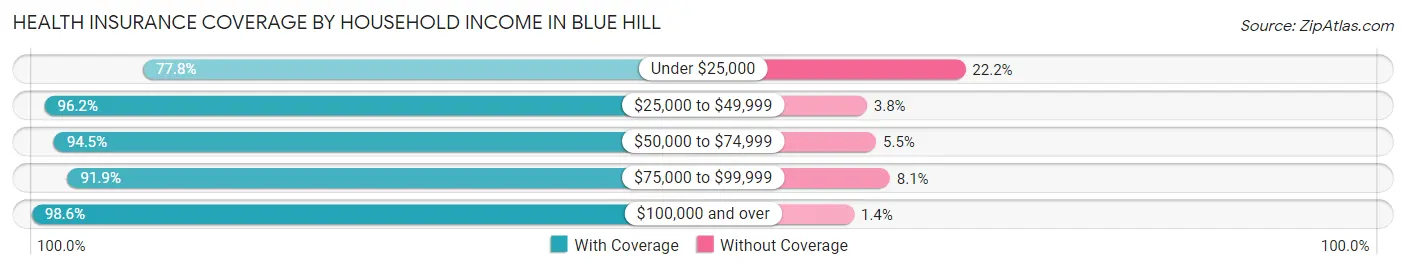
| Household Income | With Coverage | Without Coverage |
| Under $25,000 | 91 (77.8%) | 26 (22.2%) |
| $25,000 to $49,999 | 128 (96.2%) | 5 (3.8%) |
| $50,000 to $74,999 | 172 (94.5%) | 10 (5.5%) |
| $75,000 to $99,999 | 114 (91.9%) | 10 (8.1%) |
| $100,000 and over | 290 (98.6%) | 4 (1.4%) |
Public vs Private Health Insurance Coverage by Age in Blue Hill
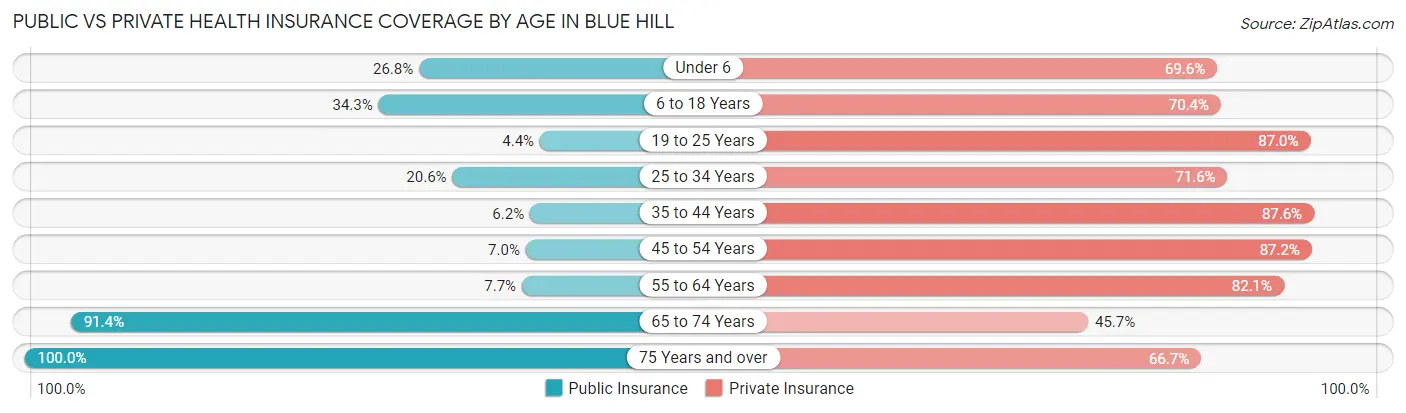
| Age Bracket | Public Insurance | Private Insurance |
| Under 6 | 15 (26.8%) | 39 (69.6%) |
| 6 to 18 Years | 59 (34.3%) | 121 (70.4%) |
| 19 to 25 Years | 3 (4.3%) | 60 (87.0%) |
| 25 to 34 Years | 21 (20.6%) | 73 (71.6%) |
| 35 to 44 Years | 6 (6.2%) | 85 (87.6%) |
| 45 to 54 Years | 6 (7.0%) | 75 (87.2%) |
| 55 to 64 Years | 9 (7.7%) | 96 (82.1%) |
| 65 to 74 Years | 64 (91.4%) | 32 (45.7%) |
| 75 Years and over | 81 (100.0%) | 54 (66.7%) |
| Total | 264 (31.1%) | 635 (74.7%) |
Disability Status by Sex by Age in Blue Hill
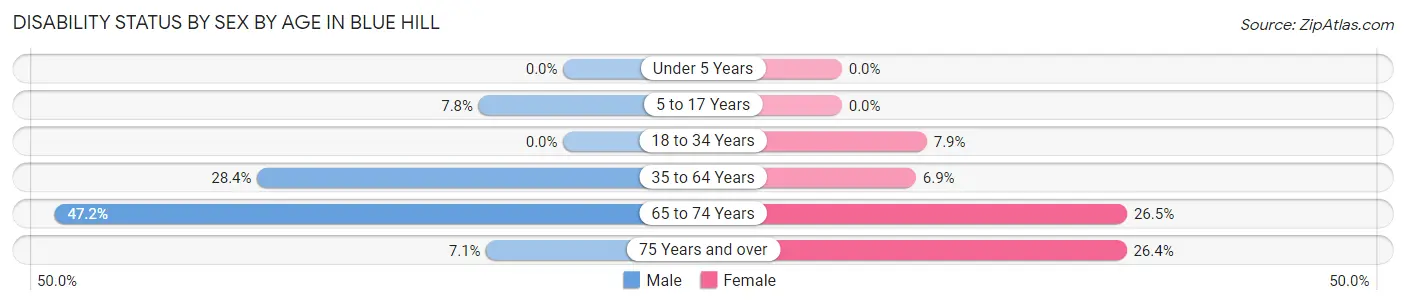
| Age Bracket | Male | Female |
| Under 5 Years | 0 (0.0%) | 0 (0.0%) |
| 5 to 17 Years | 8 (7.8%) | 0 (0.0%) |
| 18 to 34 Years | 0 (0.0%) | 6 (7.9%) |
| 35 to 64 Years | 48 (28.4%) | 9 (6.9%) |
| 65 to 74 Years | 17 (47.2%) | 9 (26.5%) |
| 75 Years and over | 2 (7.1%) | 14 (26.4%) |
Disability Class by Sex by Age in Blue Hill
Disability Class: Hearing Difficulty
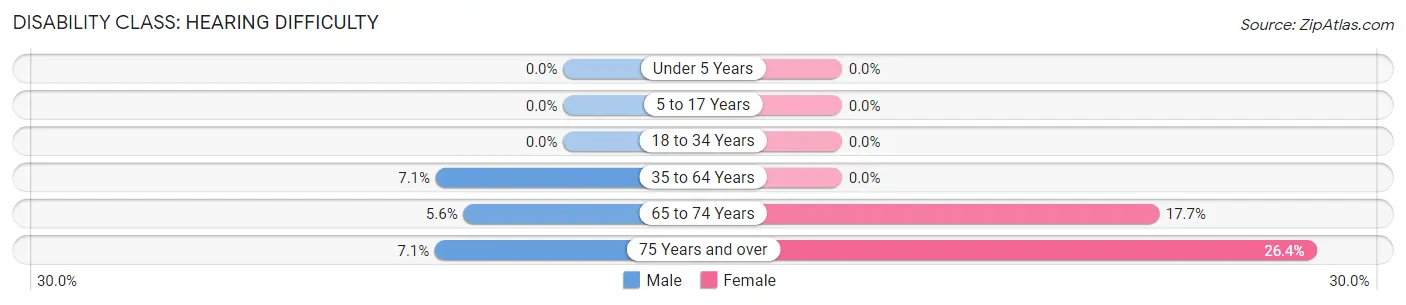
| Age Bracket | Male | Female |
| Under 5 Years | 0 (0.0%) | 0 (0.0%) |
| 5 to 17 Years | 0 (0.0%) | 0 (0.0%) |
| 18 to 34 Years | 0 (0.0%) | 0 (0.0%) |
| 35 to 64 Years | 12 (7.1%) | 0 (0.0%) |
| 65 to 74 Years | 2 (5.6%) | 6 (17.6%) |
| 75 Years and over | 2 (7.1%) | 14 (26.4%) |
Disability Class: Vision Difficulty
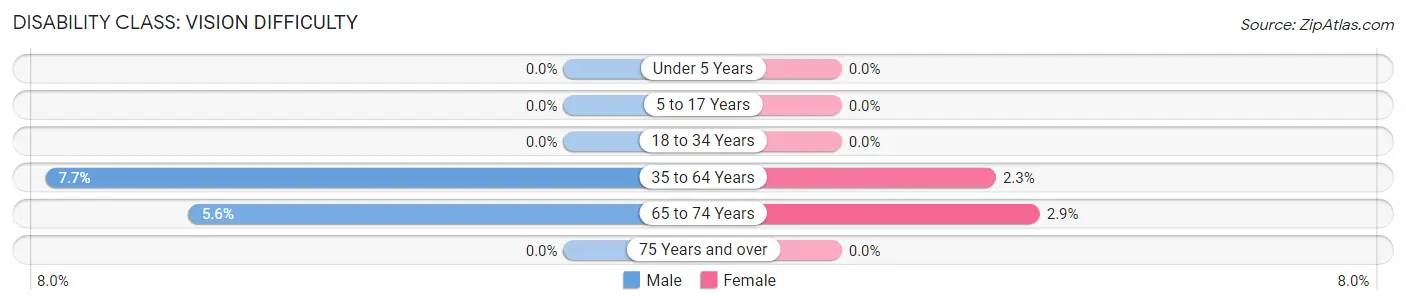
| Age Bracket | Male | Female |
| Under 5 Years | 0 (0.0%) | 0 (0.0%) |
| 5 to 17 Years | 0 (0.0%) | 0 (0.0%) |
| 18 to 34 Years | 0 (0.0%) | 0 (0.0%) |
| 35 to 64 Years | 13 (7.7%) | 3 (2.3%) |
| 65 to 74 Years | 2 (5.6%) | 1 (2.9%) |
| 75 Years and over | 0 (0.0%) | 0 (0.0%) |
Disability Class: Cognitive Difficulty
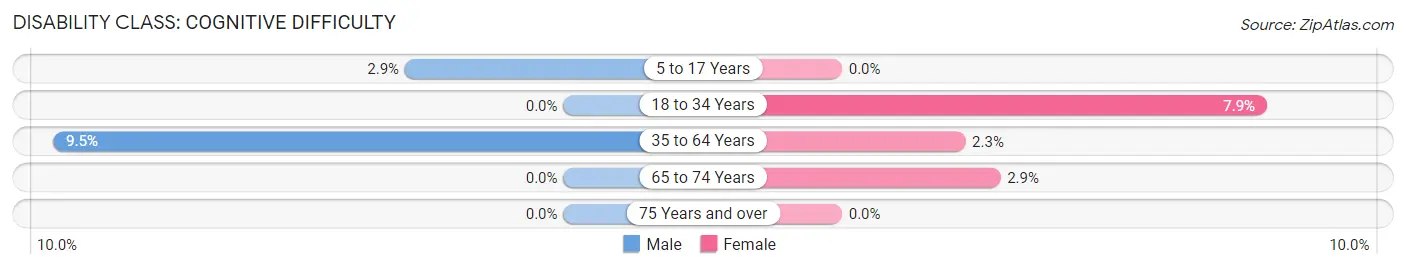
| Age Bracket | Male | Female |
| 5 to 17 Years | 3 (2.9%) | 0 (0.0%) |
| 18 to 34 Years | 0 (0.0%) | 6 (7.9%) |
| 35 to 64 Years | 16 (9.5%) | 3 (2.3%) |
| 65 to 74 Years | 0 (0.0%) | 1 (2.9%) |
| 75 Years and over | 0 (0.0%) | 0 (0.0%) |
Disability Class: Ambulatory Difficulty
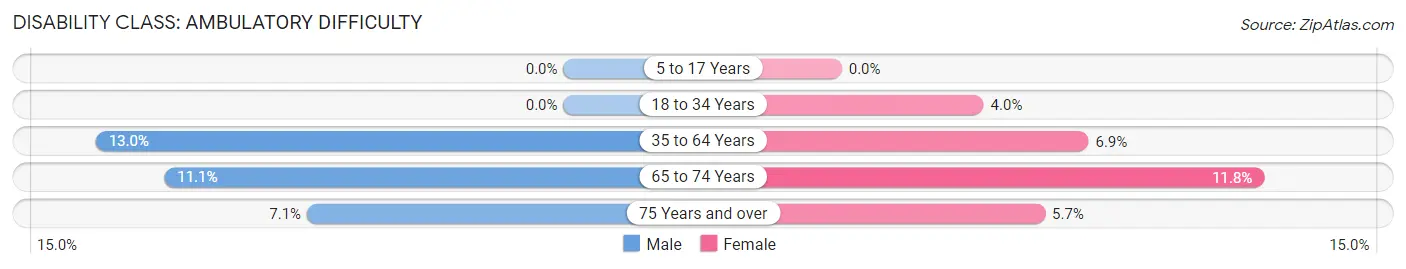
| Age Bracket | Male | Female |
| 5 to 17 Years | 0 (0.0%) | 0 (0.0%) |
| 18 to 34 Years | 0 (0.0%) | 3 (4.0%) |
| 35 to 64 Years | 22 (13.0%) | 9 (6.9%) |
| 65 to 74 Years | 4 (11.1%) | 4 (11.8%) |
| 75 Years and over | 2 (7.1%) | 3 (5.7%) |
Disability Class: Self-Care Difficulty
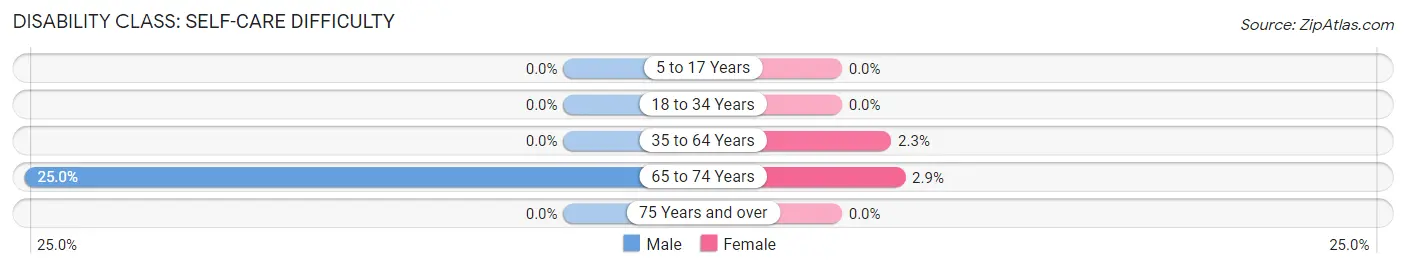
| Age Bracket | Male | Female |
| 5 to 17 Years | 0 (0.0%) | 0 (0.0%) |
| 18 to 34 Years | 0 (0.0%) | 0 (0.0%) |
| 35 to 64 Years | 0 (0.0%) | 3 (2.3%) |
| 65 to 74 Years | 9 (25.0%) | 1 (2.9%) |
| 75 Years and over | 0 (0.0%) | 0 (0.0%) |
Technology Access in Blue Hill
Computing Device Access in Blue Hill
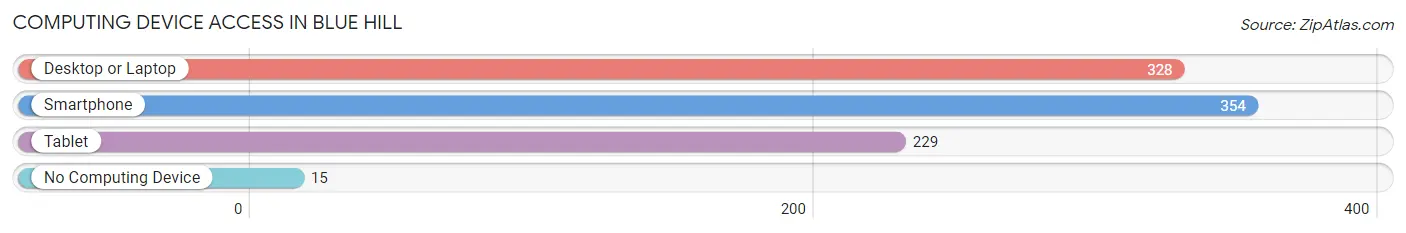
| Device Type | # Households | % Households |
| Desktop or Laptop | 328 | 83.3% |
| Smartphone | 354 | 89.8% |
| Tablet | 229 | 58.1% |
| No Computing Device | 15 | 3.8% |
| Total | 394 | 100.0% |
Internet Access in Blue Hill
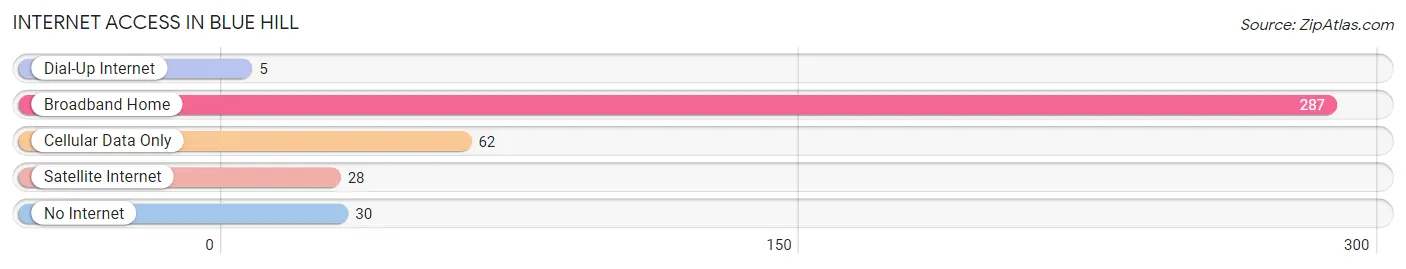
| Internet Type | # Households | % Households |
| Dial-Up Internet | 5 | 1.3% |
| Broadband Home | 287 | 72.8% |
| Cellular Data Only | 62 | 15.7% |
| Satellite Internet | 28 | 7.1% |
| No Internet | 30 | 7.6% |
| Total | 394 | 100.0% |
Blue Hill Summary
Introduction
Blue Hill is a small town located in Webster County, Nebraska. It is situated in the south-central part of the state, approximately 40 miles from the state capital of Lincoln. The town has a population of 1,717 people, according to the 2010 census. Blue Hill is a rural community with a strong agricultural base, and is home to a variety of businesses, including a grain elevator, a feed mill, a lumber yard, and a variety of retail stores.
History
Blue Hill was founded in 1871 by a group of settlers from Ohio. The town was named after the nearby Blue Hill Creek, which was named for its blue-green color. The town was originally a farming community, and the first settlers grew wheat, corn, and other crops. The town was incorporated in 1887, and the first mayor was elected in 1888.
In the early 1900s, the town began to grow and prosper. The railroad arrived in 1906, and the town became a shipping point for grain, livestock, and other goods. The town also became a center for the lumber industry, and several sawmills were built in the area.
In the 1950s, the town began to decline as the railroad industry declined and the lumber industry moved away. The town was hit hard by the Great Depression, and many of the businesses closed. However, the town was able to survive and eventually began to grow again.
Geography
Blue Hill is located in south-central Nebraska, approximately 40 miles from the state capital of Lincoln. The town is situated in the Blue Hill Creek Valley, which is surrounded by rolling hills and farmland. The town is located at an elevation of 1,845 feet above sea level.
The climate in Blue Hill is generally mild, with hot summers and cold winters. The average annual temperature is around 50 degrees Fahrenheit. The average annual precipitation is around 25 inches.
Economy
Blue Hill is a rural community with a strong agricultural base. The town is home to a variety of businesses, including a grain elevator, a feed mill, a lumber yard, and a variety of retail stores. The town is also home to a number of small manufacturing companies, including a furniture factory and a plastics factory.
The town is also home to a number of tourist attractions, including the Blue Hill Creek State Park, which offers camping, fishing, and other outdoor activities. The town is also home to a number of historic sites, including the Blue Hill Museum and the Blue Hill Opera House.
Demographics
According to the 2010 census, the population of Blue Hill is 1,717 people. The median age is 41.7 years, and the median household income is $45,938. The town is predominantly white (94.3%), with small percentages of African American (2.2%), Hispanic (1.7%), and Asian (1.2%) residents.
Conclusion
Blue Hill is a small town located in Webster County, Nebraska. It is a rural community with a strong agricultural base, and is home to a variety of businesses, including a grain elevator, a feed mill, a lumber yard, and a variety of retail stores. The town is also home to a number of tourist attractions, including the Blue Hill Creek State Park. The population of Blue Hill is 1,717 people, according to the 2010 census, and the median household income is $45,938.
Common Questions
What is Per Capita Income in Blue Hill?
Per Capita income in Blue Hill is $31,739.
What is the Median Family Income in Blue Hill?
Median Family Income in Blue Hill is $87,679.
What is the Median Household income in Blue Hill?
Median Household Income in Blue Hill is $61,250.
What is Income or Wage Gap in Blue Hill?
Income or Wage Gap in Blue Hill is 23.1%.
Women in Blue Hill earn 76.9 cents for every dollar earned by a man.
What is Inequality or Gini Index in Blue Hill?
Inequality or Gini Index in Blue Hill is 0.37.
What is the Total Population of Blue Hill?
Total Population of Blue Hill is 883.
What is the Total Male Population of Blue Hill?
Total Male Population of Blue Hill is 480.
What is the Total Female Population of Blue Hill?
Total Female Population of Blue Hill is 403.
What is the Ratio of Males per 100 Females in Blue Hill?
There are 119.11 Males per 100 Females in Blue Hill.
What is the Ratio of Females per 100 Males in Blue Hill?
There are 83.96 Females per 100 Males in Blue Hill.
What is the Median Population Age in Blue Hill?
Median Population Age in Blue Hill is 39.8 Years.
What is the Average Family Size in Blue Hill
Average Family Size in Blue Hill is 3.0 People.
What is the Average Household Size in Blue Hill
Average Household Size in Blue Hill is 2.2 People.
How Large is the Labor Force in Blue Hill?
There are 477 People in the Labor Forcein in Blue Hill.
What is the Percentage of People in the Labor Force in Blue Hill?
69.5% of People are in the Labor Force in Blue Hill.
What is the Unemployment Rate in Blue Hill?
Unemployment Rate in Blue Hill is 2.5%.