Gering, NE Map & Demographics
Gering Map
Gering Overview
$33,853
PER CAPITA INCOME
$82,946
AVG FAMILY INCOME
$65,743
AVG HOUSEHOLD INCOME
20.9%
WAGE / INCOME GAP [ % ]
79.1¢/ $1
WAGE / INCOME GAP [ $ ]
$9,235
FAMILY INCOME DEFICIT
0.45
INEQUALITY / GINI INDEX
8,582
TOTAL POPULATION
4,252
MALE POPULATION
4,330
FEMALE POPULATION
98.20
MALES / 100 FEMALES
101.83
FEMALES / 100 MALES
36.1
MEDIAN AGE
3.0
AVG FAMILY SIZE
2.4
AVG HOUSEHOLD SIZE
4,229
LABOR FORCE [ PEOPLE ]
64.5%
PERCENT IN LABOR FORCE
2.3%
UNEMPLOYMENT RATE
Gering Zip Codes
Gering Area Codes
Income in Gering
Income Overview in Gering
Per Capita Income in Gering is $33,853, while median incomes of families and households are $82,946 and $65,743 respectively.
| Characteristic | Number | Measure |
| Per Capita Income | 8,582 | $33,853 |
| Median Family Income | 2,290 | $82,946 |
| Mean Family Income | 2,290 | $102,371 |
| Median Household Income | 3,384 | $65,743 |
| Mean Household Income | 3,384 | $81,862 |
| Income Deficit | 2,290 | $9,235 |
| Wage / Income Gap (%) | 8,582 | 20.87% |
| Wage / Income Gap ($) | 8,582 | 79.13¢ per $1 |
| Gini / Inequality Index | 8,582 | 0.45 |
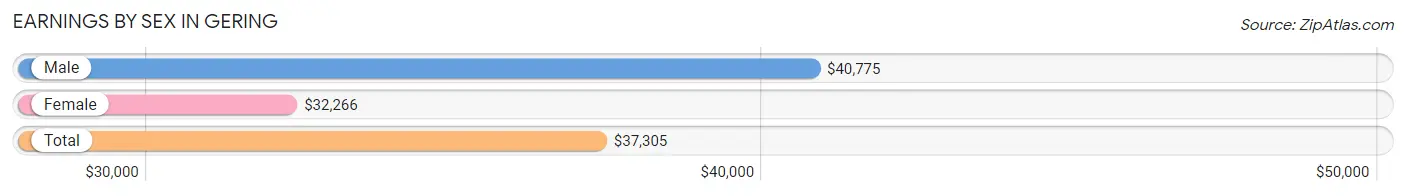
Earnings by Sex in Gering
Average Earnings in Gering are $37,305, $40,775 for men and $32,266 for women, a difference of 20.9%.
| Sex | Number | Average Earnings |
| Male | 2,437 (52.4%) | $40,775 |
| Female | 2,211 (47.6%) | $32,266 |
| Total | 4,648 (100.0%) | $37,305 |
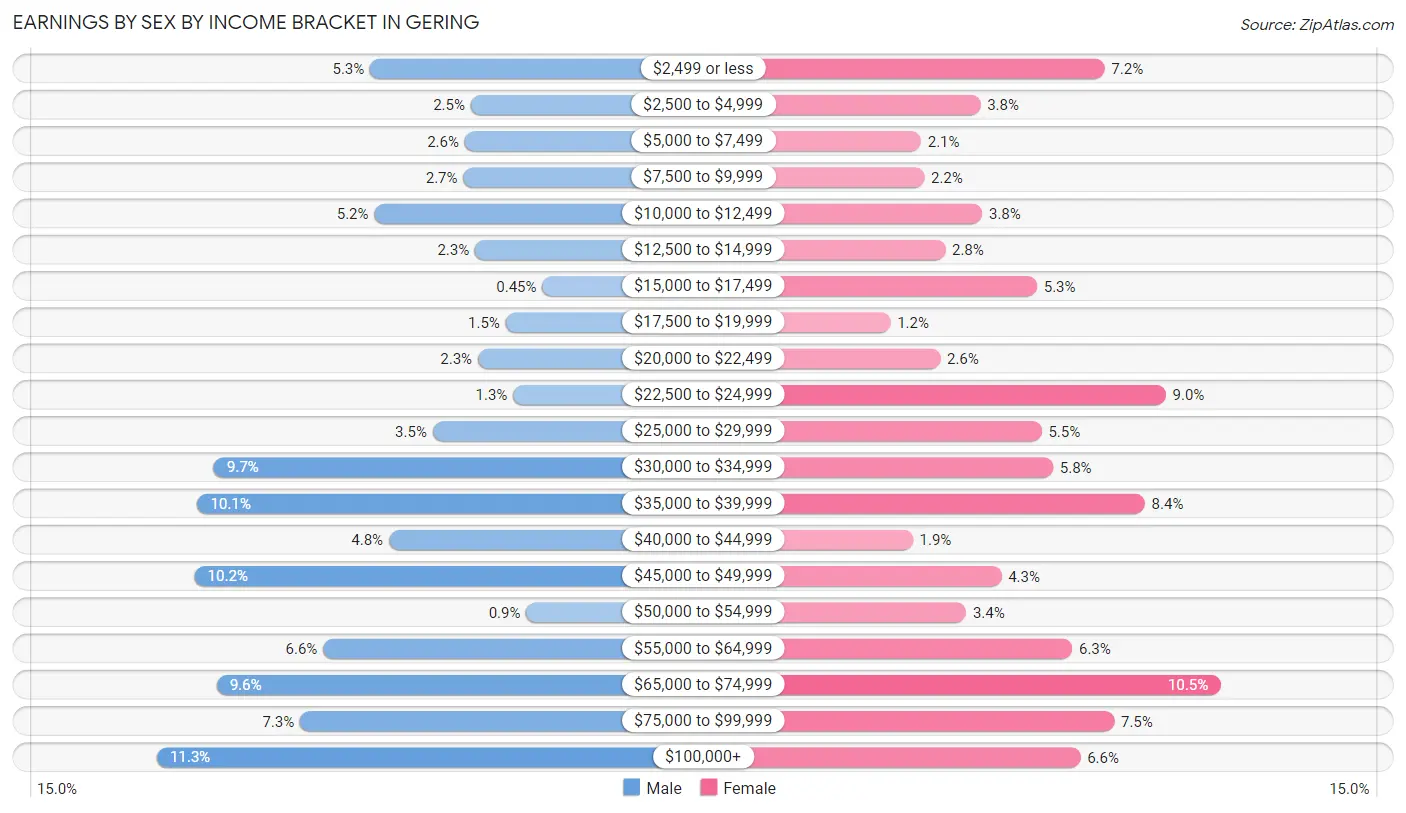
Earnings by Sex by Income Bracket in Gering
The most common earnings brackets in Gering are $100,000+ for men (275 | 11.3%) and $65,000 to $74,999 for women (232 | 10.5%).
| Income | Male | Female |
| $2,499 or less | 129 (5.3%) | 160 (7.2%) |
| $2,500 to $4,999 | 60 (2.5%) | 83 (3.7%) |
| $5,000 to $7,499 | 64 (2.6%) | 46 (2.1%) |
| $7,500 to $9,999 | 65 (2.7%) | 48 (2.2%) |
| $10,000 to $12,499 | 126 (5.2%) | 84 (3.8%) |
| $12,500 to $14,999 | 57 (2.3%) | 61 (2.8%) |
| $15,000 to $17,499 | 11 (0.4%) | 118 (5.3%) |
| $17,500 to $19,999 | 36 (1.5%) | 27 (1.2%) |
| $20,000 to $22,499 | 55 (2.3%) | 58 (2.6%) |
| $22,500 to $24,999 | 31 (1.3%) | 198 (9.0%) |
| $25,000 to $29,999 | 86 (3.5%) | 121 (5.5%) |
| $30,000 to $34,999 | 236 (9.7%) | 128 (5.8%) |
| $35,000 to $39,999 | 247 (10.1%) | 185 (8.4%) |
| $40,000 to $44,999 | 116 (4.8%) | 41 (1.8%) |
| $45,000 to $49,999 | 249 (10.2%) | 96 (4.3%) |
| $50,000 to $54,999 | 22 (0.9%) | 74 (3.4%) |
| $55,000 to $64,999 | 161 (6.6%) | 140 (6.3%) |
| $65,000 to $74,999 | 234 (9.6%) | 232 (10.5%) |
| $75,000 to $99,999 | 177 (7.3%) | 166 (7.5%) |
| $100,000+ | 275 (11.3%) | 145 (6.6%) |
| Total | 2,437 (100.0%) | 2,211 (100.0%) |
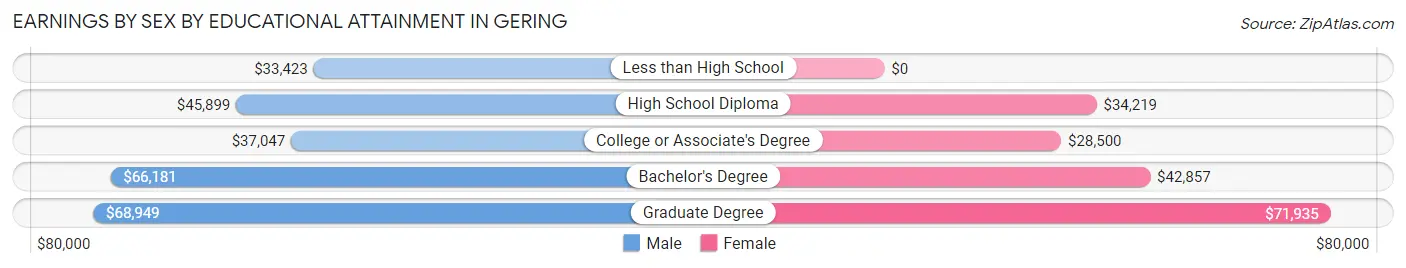
Earnings by Sex by Educational Attainment in Gering
Average earnings in Gering are $45,552 for men and $38,119 for women, a difference of 16.3%. Men with an educational attainment of graduate degree enjoy the highest average annual earnings of $68,949, while those with less than high school education earn the least with $33,423. Women with an educational attainment of graduate degree earn the most with the average annual earnings of $71,935, while those with college or associate's degree education have the smallest earnings of $28,500.
| Educational Attainment | Male Income | Female Income |
| Less than High School | $33,423 | $0 |
| High School Diploma | $45,899 | $34,219 |
| College or Associate's Degree | $37,047 | $28,500 |
| Bachelor's Degree | $66,181 | $42,857 |
| Graduate Degree | $68,949 | $71,935 |
| Total | $45,552 | $38,119 |
Family Income in Gering
Family Income Brackets in Gering
According to the Gering family income data, there are 552 families falling into the $100,000 to $149,999 income range, which is the most common income bracket and makes up 24.1% of all families. Conversely, the $15,000 to $24,999 income bracket is the least frequent group with only 18 families (0.8%) belonging to this category.
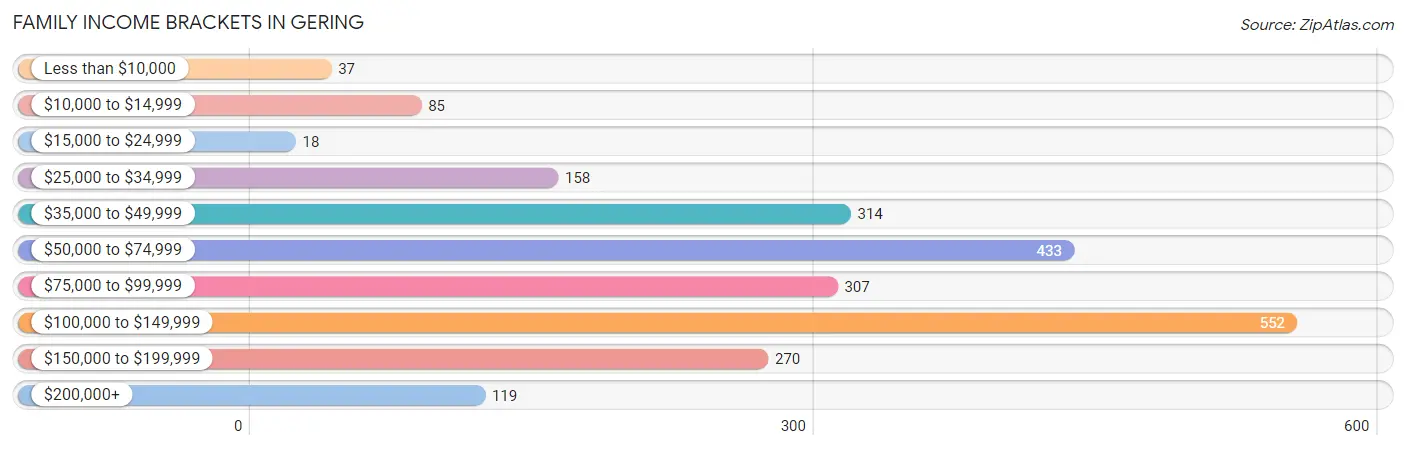
| Income Bracket | # Families | % Families |
| Less than $10,000 | 37 | 1.6% |
| $10,000 to $14,999 | 85 | 3.7% |
| $15,000 to $24,999 | 18 | 0.8% |
| $25,000 to $34,999 | 158 | 6.9% |
| $35,000 to $49,999 | 314 | 13.7% |
| $50,000 to $74,999 | 433 | 18.9% |
| $75,000 to $99,999 | 307 | 13.4% |
| $100,000 to $149,999 | 552 | 24.1% |
| $150,000 to $199,999 | 270 | 11.8% |
| $200,000+ | 119 | 5.2% |
Family Income by Famaliy Size in Gering
5-person families (144 | 6.3%) account for the highest median family income in Gering with $121,250 per family, while 2-person families (892 | 39.0%) have the highest median income of $37,022 per family member.
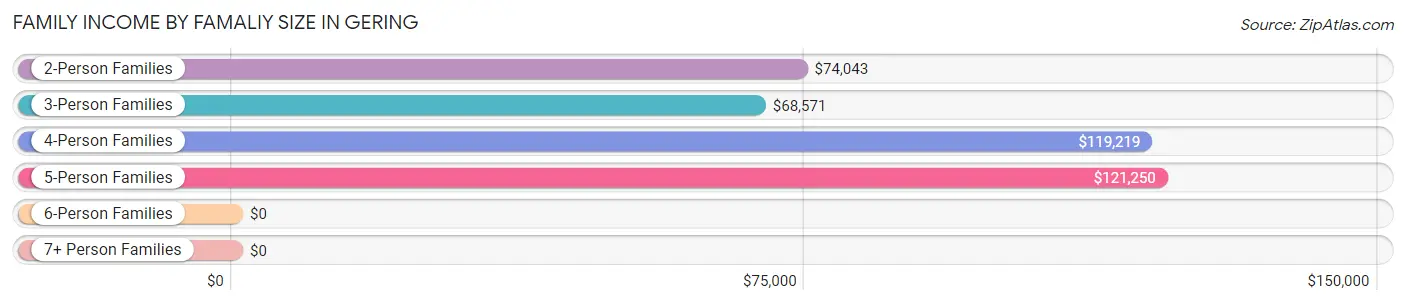
| Income Bracket | # Families | Median Income |
| 2-Person Families | 892 (39.0%) | $74,043 |
| 3-Person Families | 734 (32.1%) | $68,571 |
| 4-Person Families | 396 (17.3%) | $119,219 |
| 5-Person Families | 144 (6.3%) | $121,250 |
| 6-Person Families | 124 (5.4%) | $0 |
| 7+ Person Families | 0 (0.0%) | $0 |
| Total | 2,290 (100.0%) | $82,946 |
Family Income by Number of Earners in Gering
The median family income in Gering is $82,946, with families comprising 2 earners (1,026) having the highest median family income of $111,875, while families with no earners (119) have the lowest median family income of $45,724, accounting for 44.8% and 5.2% of families, respectively.
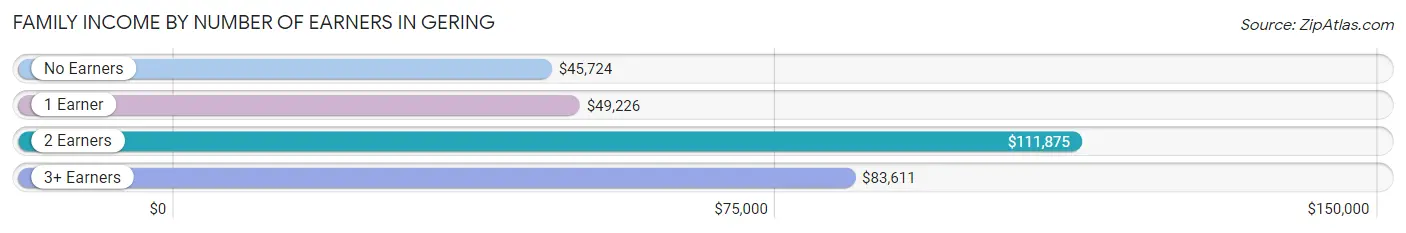
| Number of Earners | # Families | Median Income |
| No Earners | 119 (5.2%) | $45,724 |
| 1 Earner | 869 (38.0%) | $49,226 |
| 2 Earners | 1,026 (44.8%) | $111,875 |
| 3+ Earners | 276 (12.0%) | $83,611 |
| Total | 2,290 (100.0%) | $82,946 |
Household Income in Gering
Household Income Brackets in Gering
With 653 households falling in the category, the $50,000 to $74,999 income range is the most frequent in Gering, accounting for 19.3% of all households. In contrast, only 125 households (3.7%) fall into the $15,000 to $24,999 income bracket, making it the least populous group.
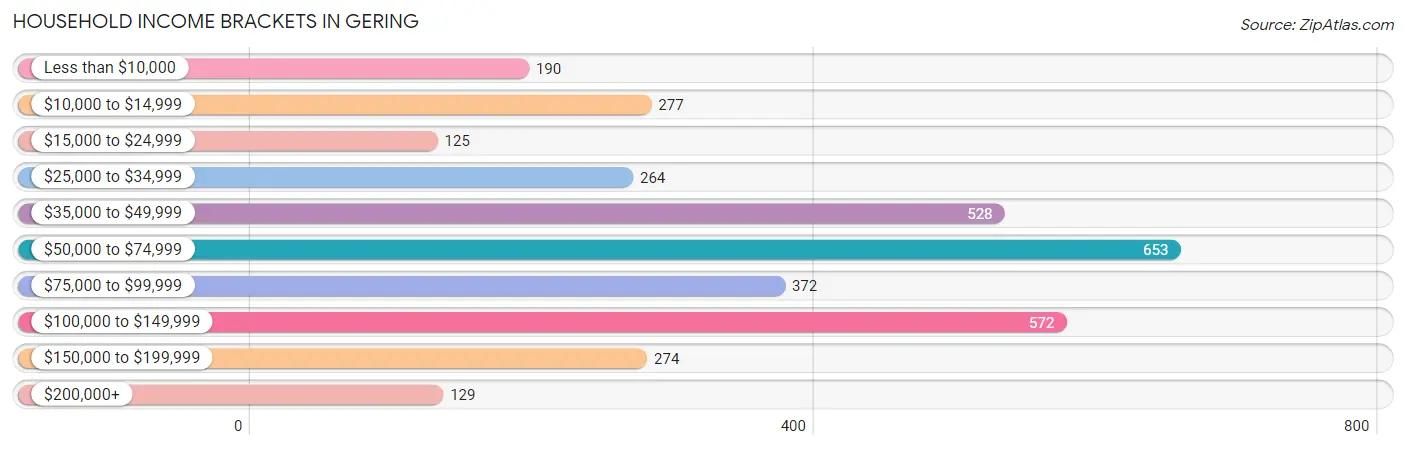
| Income Bracket | # Households | % Households |
| Less than $10,000 | 190 | 5.6% |
| $10,000 to $14,999 | 277 | 8.2% |
| $15,000 to $24,999 | 125 | 3.7% |
| $25,000 to $34,999 | 264 | 7.8% |
| $35,000 to $49,999 | 528 | 15.6% |
| $50,000 to $74,999 | 653 | 19.3% |
| $75,000 to $99,999 | 372 | 11.0% |
| $100,000 to $149,999 | 572 | 16.9% |
| $150,000 to $199,999 | 274 | 8.1% |
| $200,000+ | 129 | 3.8% |
Household Income by Householder Age in Gering
The median household income in Gering is $65,743, with the highest median household income of $83,356 found in the 25 to 44 years age bracket for the primary householder. A total of 1,223 households (36.1%) fall into this category. Meanwhile, the 65+ years age bracket for the primary householder has the lowest median household income of $41,806, with 974 households (28.8%) in this group.
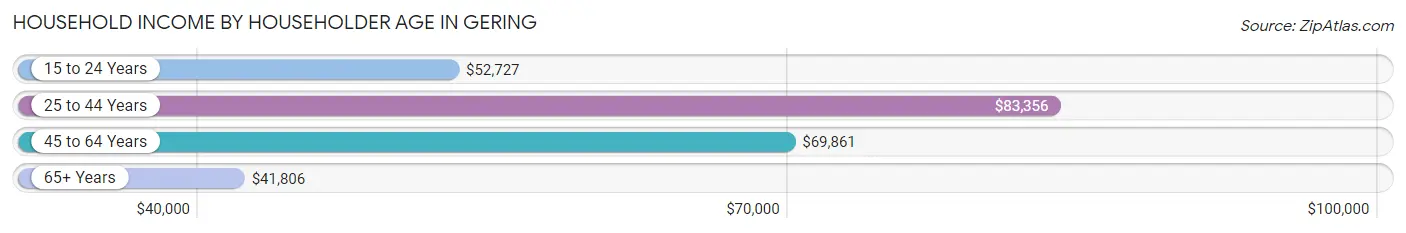
| Income Bracket | # Households | Median Income |
| 15 to 24 Years | 122 (3.6%) | $52,727 |
| 25 to 44 Years | 1,223 (36.1%) | $83,356 |
| 45 to 64 Years | 1,065 (31.5%) | $69,861 |
| 65+ Years | 974 (28.8%) | $41,806 |
| Total | 3,384 (100.0%) | $65,743 |
Poverty in Gering
Income Below Poverty by Sex and Age in Gering
With 9.5% poverty level for males and 12.2% for females among the residents of Gering, 16 and 17 year old males and 25 to 34 year old females are the most vulnerable to poverty, with 18 males (25.7%) and 103 females (20.9%) in their respective age groups living below the poverty level.
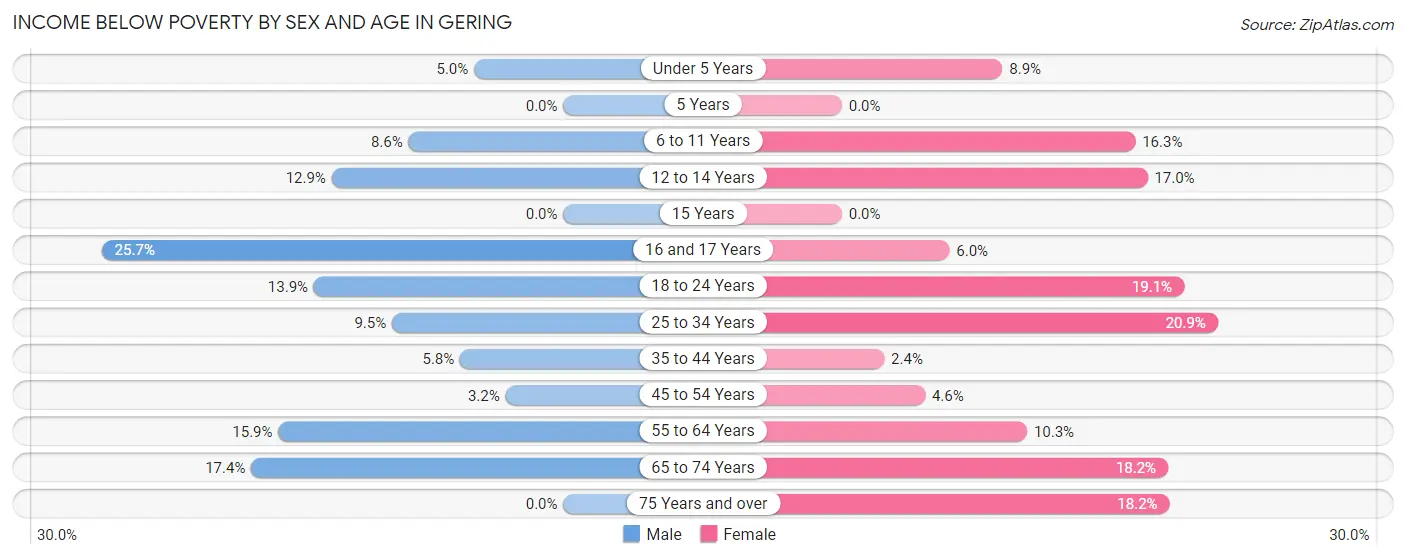
| Age Bracket | Male | Female |
| Under 5 Years | 18 (5.0%) | 22 (8.9%) |
| 5 Years | 0 (0.0%) | 0 (0.0%) |
| 6 to 11 Years | 38 (8.6%) | 50 (16.3%) |
| 12 to 14 Years | 24 (12.9%) | 56 (17.0%) |
| 15 Years | 0 (0.0%) | 0 (0.0%) |
| 16 and 17 Years | 18 (25.7%) | 17 (6.0%) |
| 18 to 24 Years | 40 (13.9%) | 40 (19.1%) |
| 25 to 34 Years | 60 (9.5%) | 103 (20.9%) |
| 35 to 44 Years | 30 (5.8%) | 14 (2.4%) |
| 45 to 54 Years | 11 (3.2%) | 24 (4.6%) |
| 55 to 64 Years | 80 (15.9%) | 33 (10.3%) |
| 65 to 74 Years | 61 (17.4%) | 95 (18.2%) |
| 75 Years and over | 0 (0.0%) | 56 (18.2%) |
| Total | 380 (9.5%) | 510 (12.2%) |
Income Above Poverty by Sex and Age in Gering
According to the poverty statistics in Gering, males aged 5 years and females aged 5 years are the age groups that are most secure financially, with 100.0% of males and 100.0% of females in these age groups living above the poverty line.
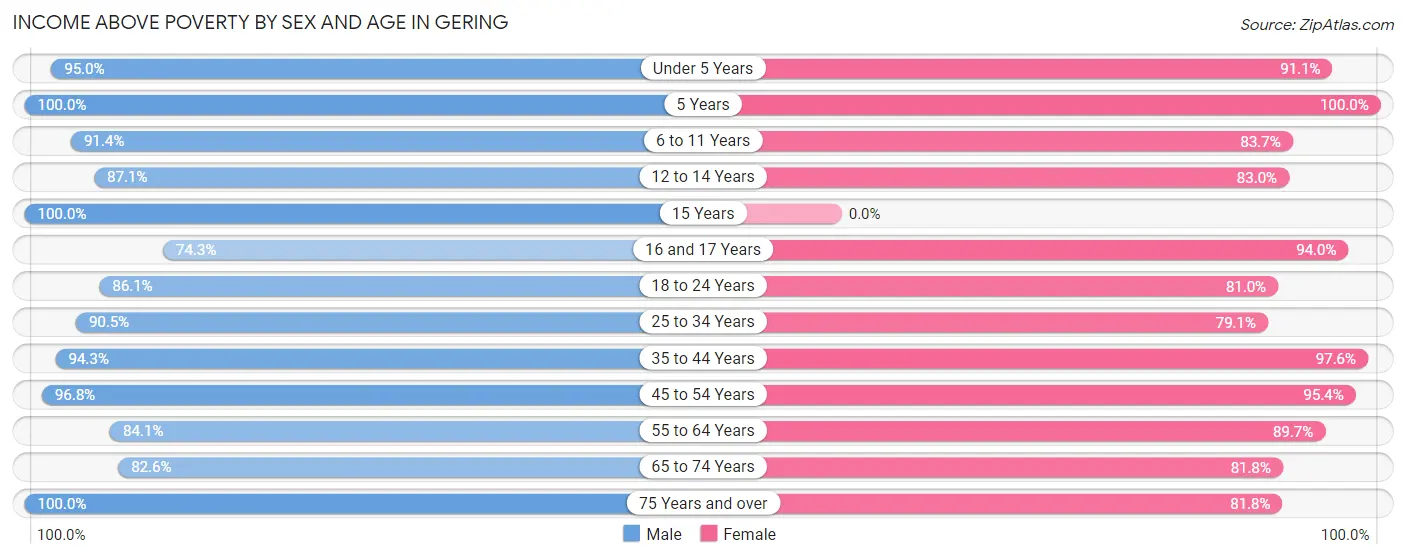
| Age Bracket | Male | Female |
| Under 5 Years | 344 (95.0%) | 224 (91.1%) |
| 5 Years | 12 (100.0%) | 42 (100.0%) |
| 6 to 11 Years | 403 (91.4%) | 256 (83.7%) |
| 12 to 14 Years | 162 (87.1%) | 273 (83.0%) |
| 15 Years | 59 (100.0%) | 0 (0.0%) |
| 16 and 17 Years | 52 (74.3%) | 267 (94.0%) |
| 18 to 24 Years | 248 (86.1%) | 170 (80.9%) |
| 25 to 34 Years | 569 (90.5%) | 389 (79.1%) |
| 35 to 44 Years | 492 (94.3%) | 578 (97.6%) |
| 45 to 54 Years | 331 (96.8%) | 494 (95.4%) |
| 55 to 64 Years | 424 (84.1%) | 287 (89.7%) |
| 65 to 74 Years | 290 (82.6%) | 428 (81.8%) |
| 75 Years and over | 248 (100.0%) | 251 (81.8%) |
| Total | 3,634 (90.5%) | 3,659 (87.8%) |
Income Below Poverty Among Married-Couple Families in Gering
The poverty statistics for married-couple families in Gering show that 3.1% or 47 of the total 1,516 families live below the poverty line. Families with no children have the highest poverty rate of 3.9%, comprising of 29 families. On the other hand, families with 3 or 4 children have the lowest poverty rate of 0.0%, which includes 0 families.
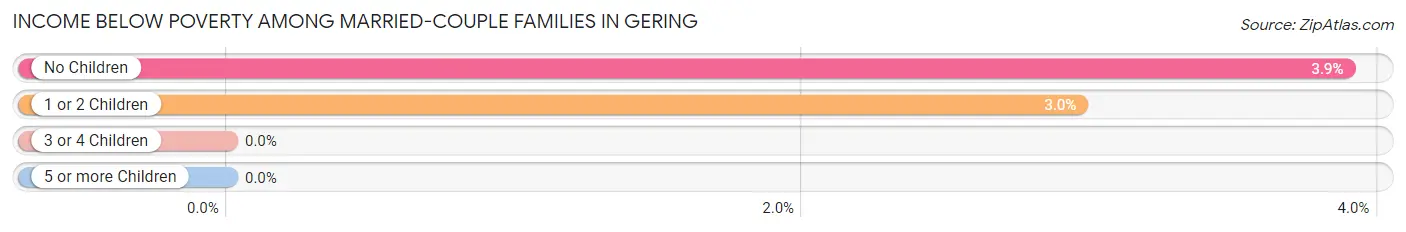
| Children | Above Poverty | Below Poverty |
| No Children | 717 (96.1%) | 29 (3.9%) |
| 1 or 2 Children | 590 (97.0%) | 18 (3.0%) |
| 3 or 4 Children | 162 (100.0%) | 0 (0.0%) |
| 5 or more Children | 0 (0.0%) | 0 (0.0%) |
| Total | 1,469 (96.9%) | 47 (3.1%) |
Income Below Poverty Among Single-Parent Households in Gering
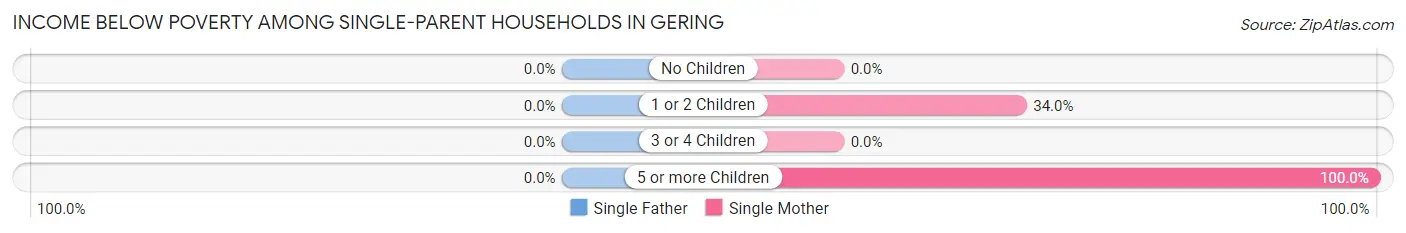
| Children | Single Father | Single Mother |
| No Children | 0 (0.0%) | 0 (0.0%) |
| 1 or 2 Children | 0 (0.0%) | 82 (34.0%) |
| 3 or 4 Children | 0 (0.0%) | 0 (0.0%) |
| 5 or more Children | 0 (0.0%) | 26 (100.0%) |
| Total | 0 (0.0%) | 108 (25.8%) |
Income Below Poverty Among Married-Couple vs Single-Parent Households in Gering
The poverty data for Gering shows that 47 of the married-couple family households (3.1%) and 108 of the single-parent households (14.0%) are living below the poverty level. Within the married-couple family households, those with no children have the highest poverty rate, with 29 households (3.9%) falling below the poverty line. Among the single-parent households, those with 5 or more children have the highest poverty rate, with 26 household (100.0%) living below poverty.
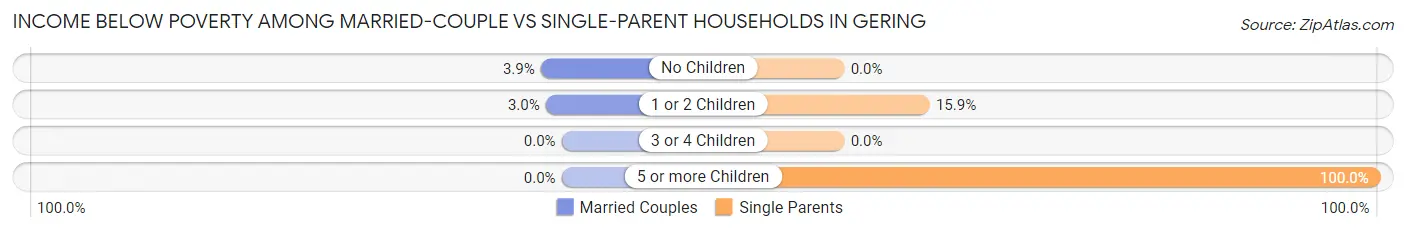
| Children | Married-Couple Families | Single-Parent Households |
| No Children | 29 (3.9%) | 0 (0.0%) |
| 1 or 2 Children | 18 (3.0%) | 82 (15.9%) |
| 3 or 4 Children | 0 (0.0%) | 0 (0.0%) |
| 5 or more Children | 0 (0.0%) | 26 (100.0%) |
| Total | 47 (3.1%) | 108 (14.0%) |
Race in Gering
The most populous races in Gering are White / Caucasian (7,243 | 84.4%), Hispanic or Latino (2,316 | 27.0%), and Two or more Races (869 | 10.1%).
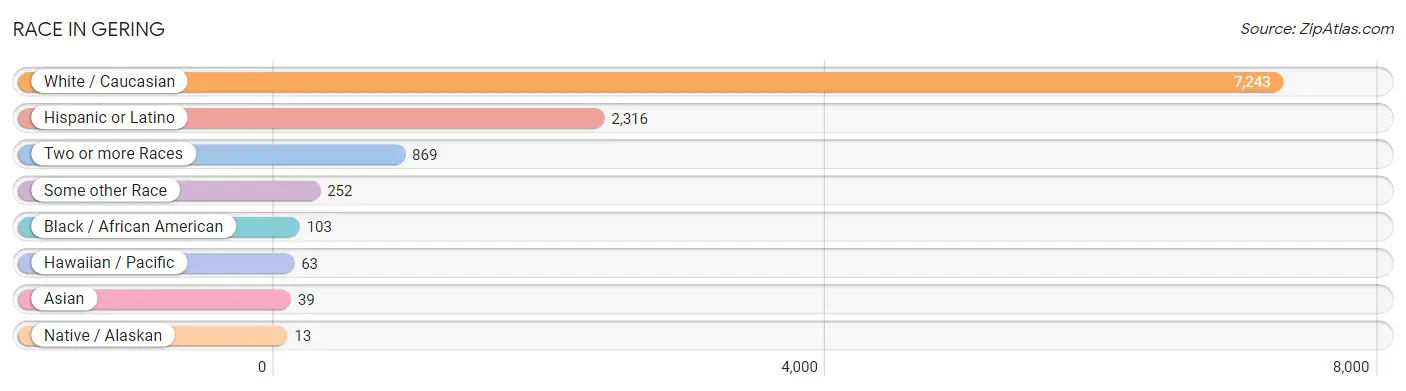
| Race | # Population | % Population |
| Asian | 39 | 0.4% |
| Black / African American | 103 | 1.2% |
| Hawaiian / Pacific | 63 | 0.7% |
| Hispanic or Latino | 2,316 | 27.0% |
| Native / Alaskan | 13 | 0.2% |
| White / Caucasian | 7,243 | 84.4% |
| Two or more Races | 869 | 10.1% |
| Some other Race | 252 | 2.9% |
| Total | 8,582 | 100.0% |
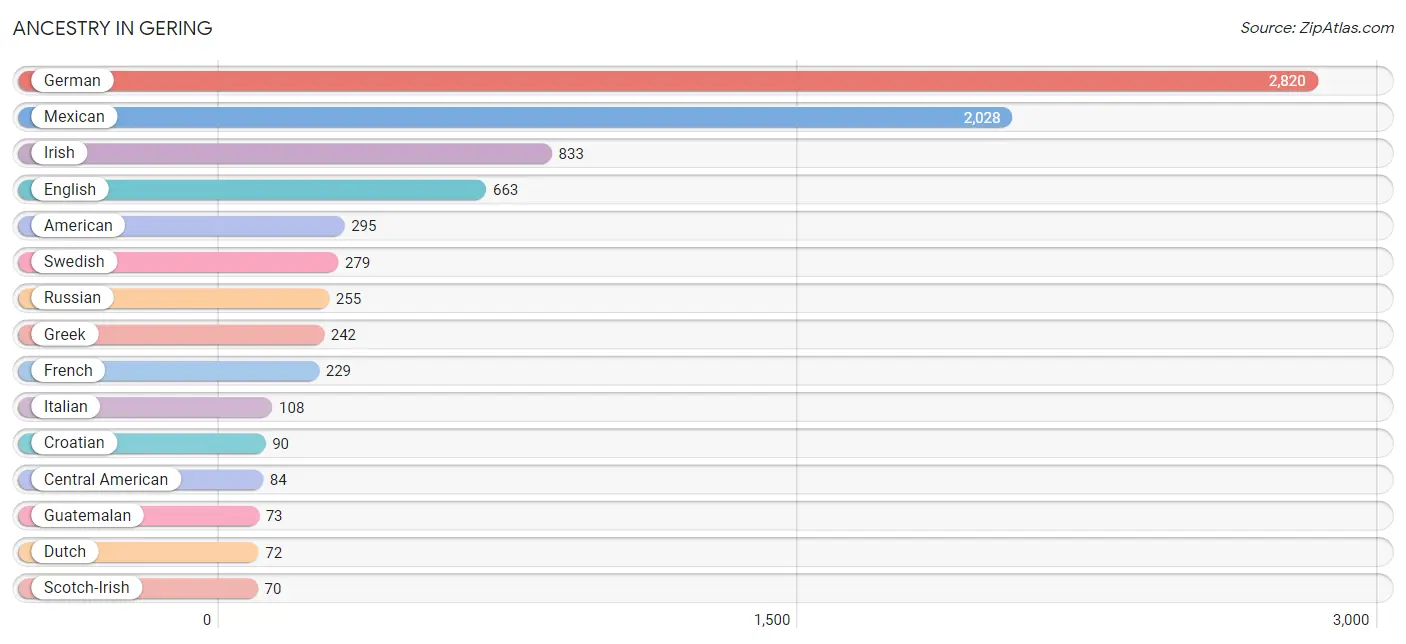
Ancestry in Gering
The most populous ancestries reported in Gering are German (2,820 | 32.9%), Mexican (2,028 | 23.6%), Irish (833 | 9.7%), English (663 | 7.7%), and American (295 | 3.4%), together accounting for 77.4% of all Gering residents.
| Ancestry | # Population | % Population |
| American | 295 | 3.4% |
| Bhutanese | 5 | 0.1% |
| Canadian | 13 | 0.2% |
| Central American | 84 | 1.0% |
| Croatian | 90 | 1.1% |
| Crow | 30 | 0.4% |
| Czech | 65 | 0.8% |
| Czechoslovakian | 42 | 0.5% |
| Danish | 15 | 0.2% |
| Dutch | 72 | 0.8% |
| English | 663 | 7.7% |
| European | 46 | 0.5% |
| French | 229 | 2.7% |
| German | 2,820 | 32.9% |
| German Russian | 15 | 0.2% |
| Greek | 242 | 2.8% |
| Guamanian / Chamorro | 63 | 0.7% |
| Guatemalan | 73 | 0.9% |
| Hungarian | 6 | 0.1% |
| Indian (Asian) | 39 | 0.4% |
| Irish | 833 | 9.7% |
| Italian | 108 | 1.3% |
| Korean | 9 | 0.1% |
| Mexican | 2,028 | 23.6% |
| Mexican American Indian | 10 | 0.1% |
| Norwegian | 38 | 0.4% |
| Paiute | 5 | 0.1% |
| Panamanian | 5 | 0.1% |
| Pennsylvania German | 52 | 0.6% |
| Polish | 65 | 0.8% |
| Puerto Rican | 57 | 0.7% |
| Russian | 255 | 3.0% |
| Salvadoran | 6 | 0.1% |
| Samoan | 13 | 0.2% |
| Scotch-Irish | 70 | 0.8% |
| Scottish | 49 | 0.6% |
| Shoshone | 6 | 0.1% |
| Sioux | 66 | 0.8% |
| South American | 19 | 0.2% |
| Spaniard | 30 | 0.4% |
| Sri Lankan | 12 | 0.1% |
| Swedish | 279 | 3.3% |
| Venezuelan | 19 | 0.2% |
| Welsh | 10 | 0.1% | View All 44 Rows |
Immigrants in Gering
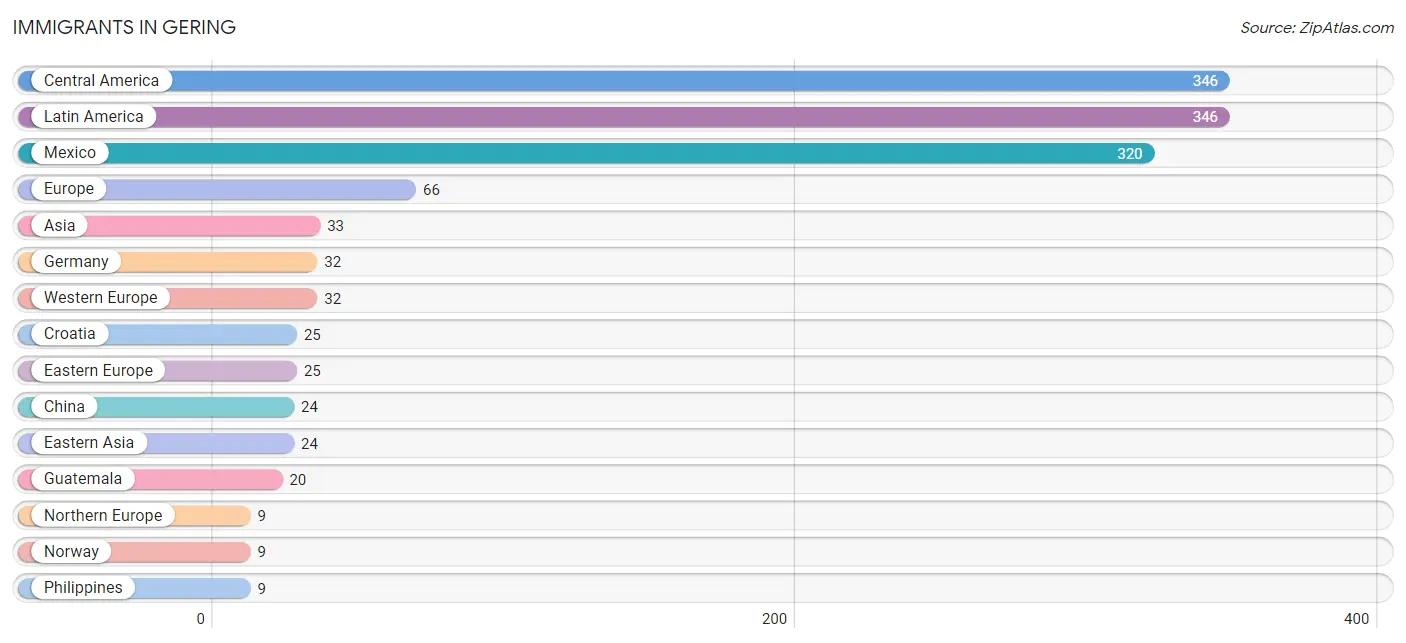
The most numerous immigrant groups reported in Gering came from Central America (346 | 4.0%), Latin America (346 | 4.0%), Mexico (320 | 3.7%), Europe (66 | 0.8%), and Asia (33 | 0.4%), together accounting for 12.9% of all Gering residents.
| Immigration Origin | # Population | % Population |
| Asia | 33 | 0.4% |
| Central America | 346 | 4.0% |
| China | 24 | 0.3% |
| Croatia | 25 | 0.3% |
| Eastern Asia | 24 | 0.3% |
| Eastern Europe | 25 | 0.3% |
| El Salvador | 6 | 0.1% |
| Europe | 66 | 0.8% |
| Germany | 32 | 0.4% |
| Guatemala | 20 | 0.2% |
| Latin America | 346 | 4.0% |
| Mexico | 320 | 3.7% |
| Northern Europe | 9 | 0.1% |
| Norway | 9 | 0.1% |
| Philippines | 9 | 0.1% |
| South Eastern Asia | 9 | 0.1% |
| Western Europe | 32 | 0.4% | View All 17 Rows |
Sex and Age in Gering
Sex and Age in Gering
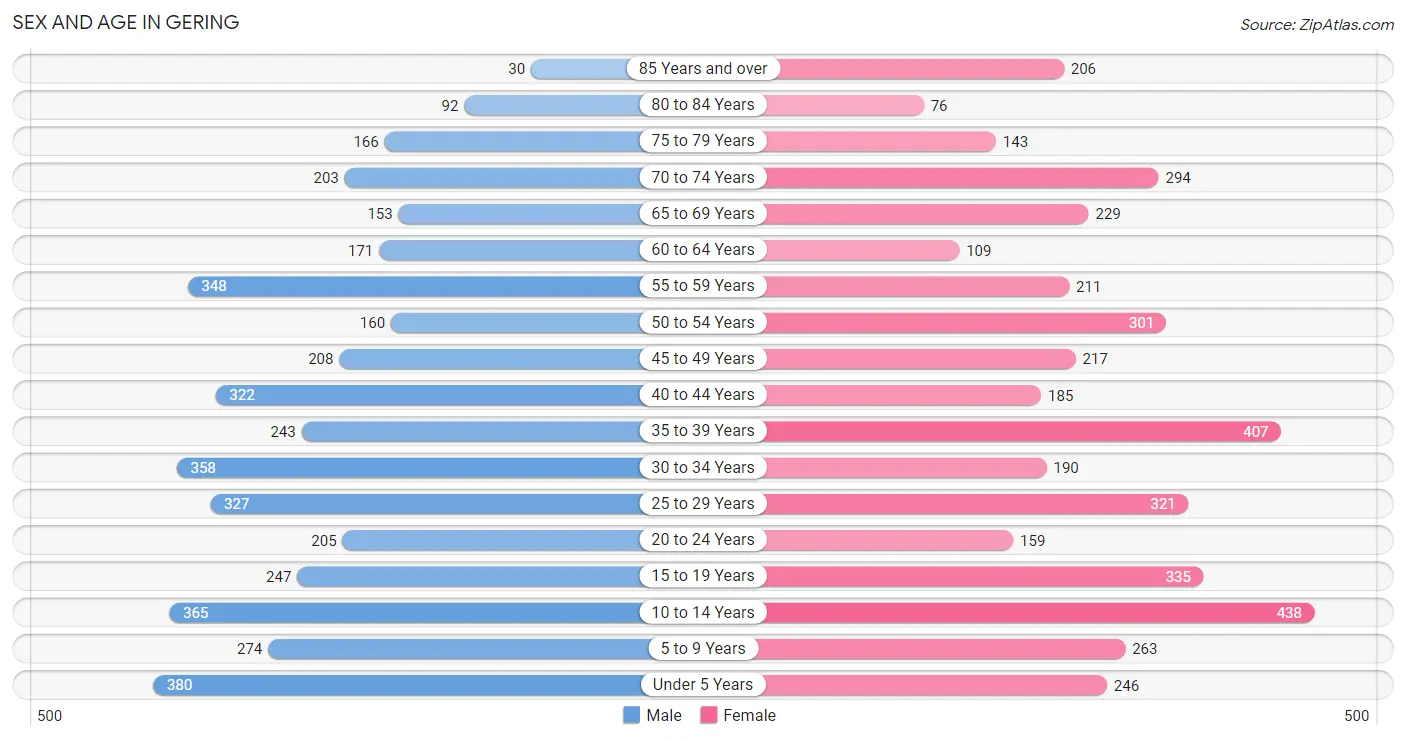
The most populous age groups in Gering are Under 5 Years (380 | 8.9%) for men and 10 to 14 Years (438 | 10.1%) for women.
| Age Bracket | Male | Female |
| Under 5 Years | 380 (8.9%) | 246 (5.7%) |
| 5 to 9 Years | 274 (6.4%) | 263 (6.1%) |
| 10 to 14 Years | 365 (8.6%) | 438 (10.1%) |
| 15 to 19 Years | 247 (5.8%) | 335 (7.7%) |
| 20 to 24 Years | 205 (4.8%) | 159 (3.7%) |
| 25 to 29 Years | 327 (7.7%) | 321 (7.4%) |
| 30 to 34 Years | 358 (8.4%) | 190 (4.4%) |
| 35 to 39 Years | 243 (5.7%) | 407 (9.4%) |
| 40 to 44 Years | 322 (7.6%) | 185 (4.3%) |
| 45 to 49 Years | 208 (4.9%) | 217 (5.0%) |
| 50 to 54 Years | 160 (3.8%) | 301 (7.0%) |
| 55 to 59 Years | 348 (8.2%) | 211 (4.9%) |
| 60 to 64 Years | 171 (4.0%) | 109 (2.5%) |
| 65 to 69 Years | 153 (3.6%) | 229 (5.3%) |
| 70 to 74 Years | 203 (4.8%) | 294 (6.8%) |
| 75 to 79 Years | 166 (3.9%) | 143 (3.3%) |
| 80 to 84 Years | 92 (2.2%) | 76 (1.8%) |
| 85 Years and over | 30 (0.7%) | 206 (4.8%) |
| Total | 4,252 (100.0%) | 4,330 (100.0%) |
Families and Households in Gering
Median Family Size in Gering
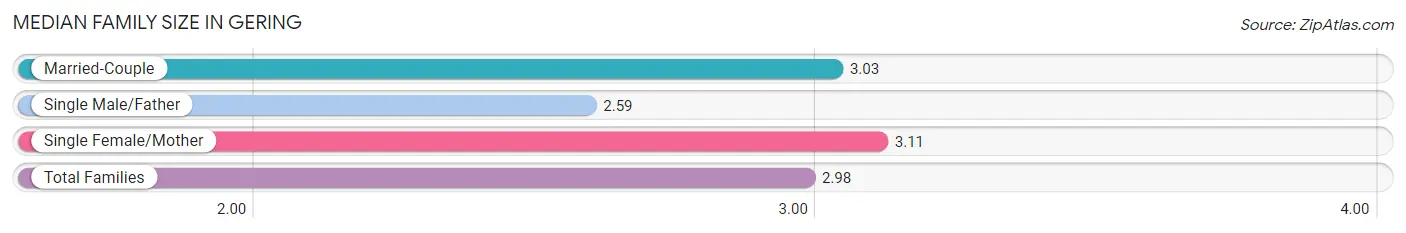
The median family size in Gering is 2.98 persons per family, with single female/mother families (419 | 18.3%) accounting for the largest median family size of 3.11 persons per family. On the other hand, single male/father families (355 | 15.5%) represent the smallest median family size with 2.59 persons per family.
| Family Type | # Families | Family Size |
| Married-Couple | 1,516 (66.2%) | 3.03 |
| Single Male/Father | 355 (15.5%) | 2.59 |
| Single Female/Mother | 419 (18.3%) | 3.11 |
| Total Families | 2,290 (100.0%) | 2.98 |
Median Household Size in Gering
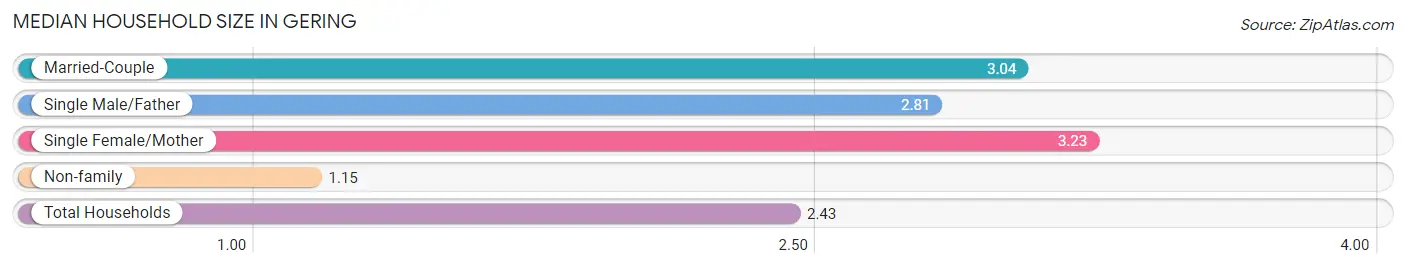
The median household size in Gering is 2.43 persons per household, with single female/mother households (419 | 12.4%) accounting for the largest median household size of 3.23 persons per household. non-family households (1,094 | 32.3%) represent the smallest median household size with 1.15 persons per household.
| Household Type | # Households | Household Size |
| Married-Couple | 1,516 (44.8%) | 3.04 |
| Single Male/Father | 355 (10.5%) | 2.81 |
| Single Female/Mother | 419 (12.4%) | 3.23 |
| Non-family | 1,094 (32.3%) | 1.15 |
| Total Households | 3,384 (100.0%) | 2.43 |
Household Size by Marriage Status in Gering
Out of a total of 3,384 households in Gering, 2,290 (67.7%) are family households, while 1,094 (32.3%) are nonfamily households. The most numerous type of family households are 2-person households, comprising 835, and the most common type of nonfamily households are 1-person households, comprising 920.
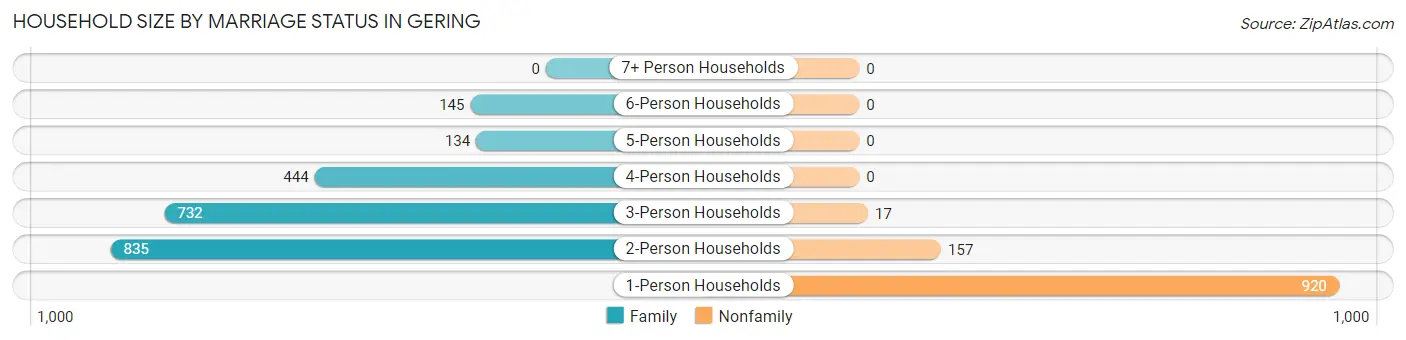
| Household Size | Family Households | Nonfamily Households |
| 1-Person Households | - | 920 (27.2%) |
| 2-Person Households | 835 (24.7%) | 157 (4.6%) |
| 3-Person Households | 732 (21.6%) | 17 (0.5%) |
| 4-Person Households | 444 (13.1%) | 0 (0.0%) |
| 5-Person Households | 134 (4.0%) | 0 (0.0%) |
| 6-Person Households | 145 (4.3%) | 0 (0.0%) |
| 7+ Person Households | 0 (0.0%) | 0 (0.0%) |
| Total | 2,290 (67.7%) | 1,094 (32.3%) |
Female Fertility in Gering
Fertility by Age in Gering
Average fertility rate in Gering is 86.0 births per 1,000 women. Women in the age bracket of 20 to 34 years have the highest fertility rate with 172.0 births per 1,000 women. Women in the age bracket of 20 to 34 years acount for 71.9% of all women with births.
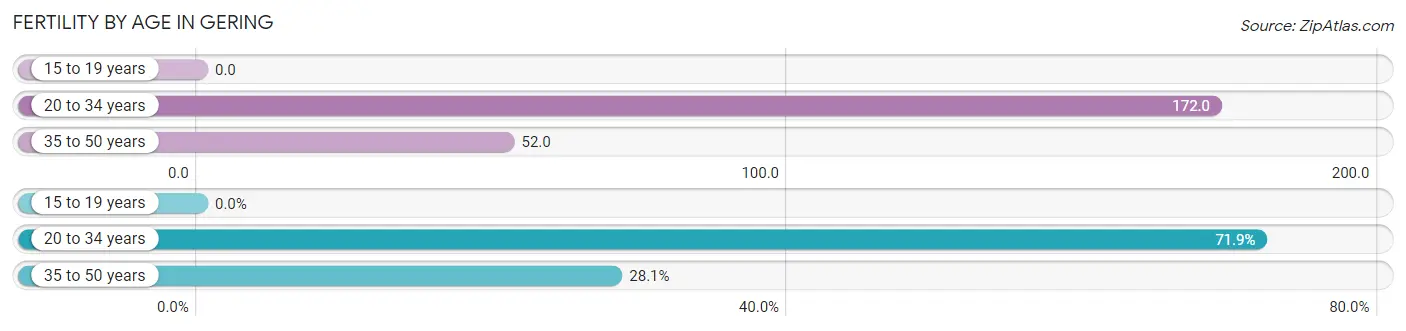
| Age Bracket | Women with Births | Births / 1,000 Women |
| 15 to 19 years | 0 (0.0%) | 0.0 |
| 20 to 34 years | 115 (71.9%) | 172.0 |
| 35 to 50 years | 45 (28.1%) | 52.0 |
| Total | 160 (100.0%) | 86.0 |
Fertility by Age by Marriage Status in Gering
91.2% of women with births (160) in Gering are married. The highest percentage of unmarried women with births falls into 20 to 34 years age bracket with 12.2% of them unmarried at the time of birth, while the lowest percentage of unmarried women with births belong to 35 to 50 years age bracket with 0.0% of them unmarried.
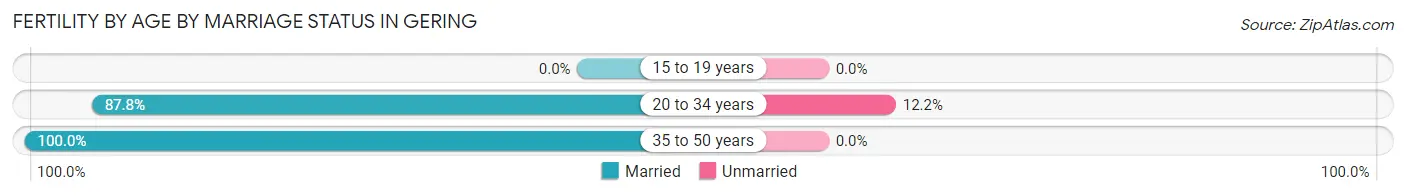
| Age Bracket | Married | Unmarried |
| 15 to 19 years | 0 (0.0%) | 0 (0.0%) |
| 20 to 34 years | 101 (87.8%) | 14 (12.2%) |
| 35 to 50 years | 45 (100.0%) | 0 (0.0%) |
| Total | 146 (91.2%) | 14 (8.7%) |
Fertility by Education in Gering
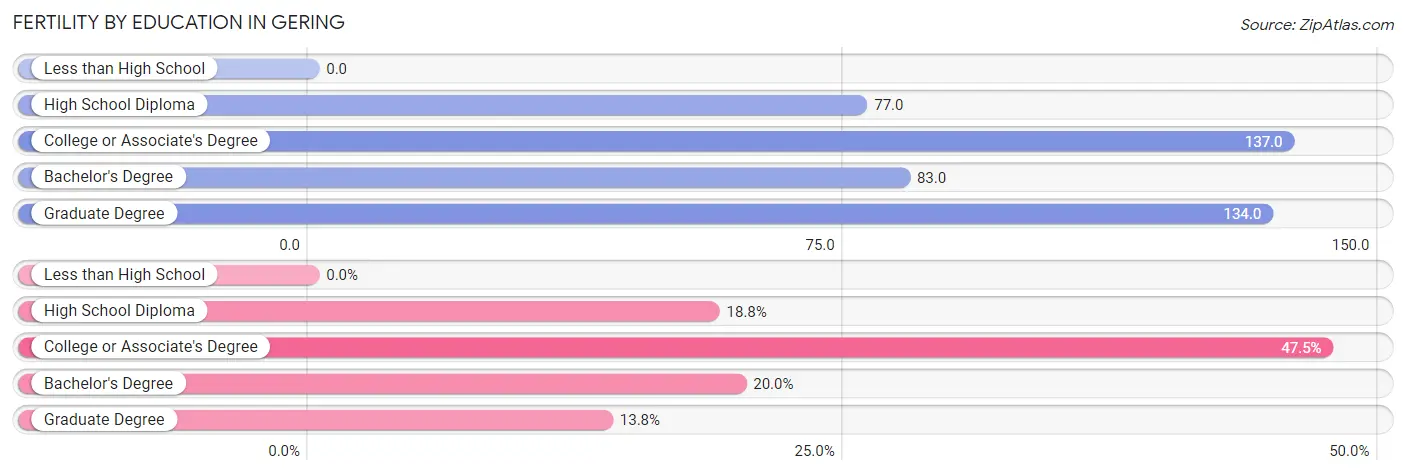
| Educational Attainment | Women with Births | Births / 1,000 Women |
| Less than High School | 0 (0.0%) | 0.0 |
| High School Diploma | 30 (18.8%) | 77.0 |
| College or Associate's Degree | 76 (47.5%) | 137.0 |
| Bachelor's Degree | 32 (20.0%) | 83.0 |
| Graduate Degree | 22 (13.8%) | 134.0 |
| Total | 160 (100.0%) | 86.0 |
Fertility by Education by Marriage Status in Gering
8.7% of women with births in Gering are unmarried. Women with the educational attainment of bachelor's degree are most likely to be married with 100.0% of them married at childbirth, while women with the educational attainment of high school diploma are least likely to be married with 20.0% of them unmarried at childbirth.
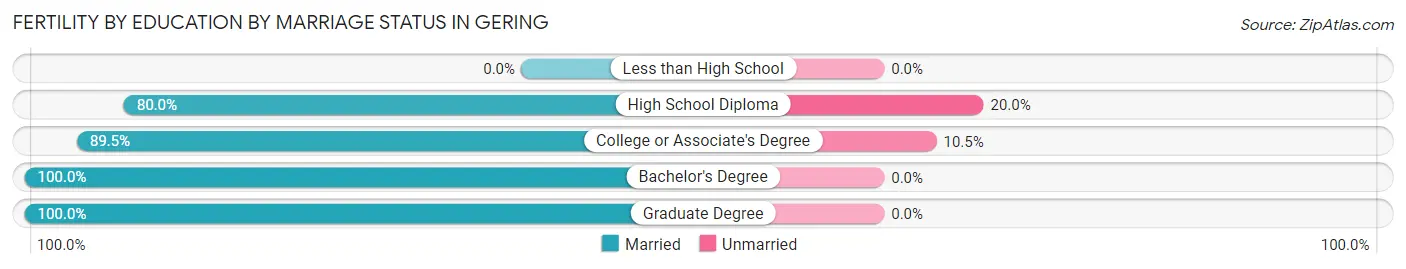
| Educational Attainment | Married | Unmarried |
| Less than High School | 0 (0.0%) | 0 (0.0%) |
| High School Diploma | 24 (80.0%) | 6 (20.0%) |
| College or Associate's Degree | 68 (89.5%) | 8 (10.5%) |
| Bachelor's Degree | 32 (100.0%) | 0 (0.0%) |
| Graduate Degree | 22 (100.0%) | 0 (0.0%) |
| Total | 146 (91.2%) | 14 (8.7%) |
Employment Characteristics in Gering
Employment by Class of Employer in Gering
Among the 3,946 employed individuals in Gering, private company employees (2,294 | 58.1%), local government employees (420 | 10.6%), and self-employed (not incorporated) (341 | 8.6%) make up the most common classes of employment.
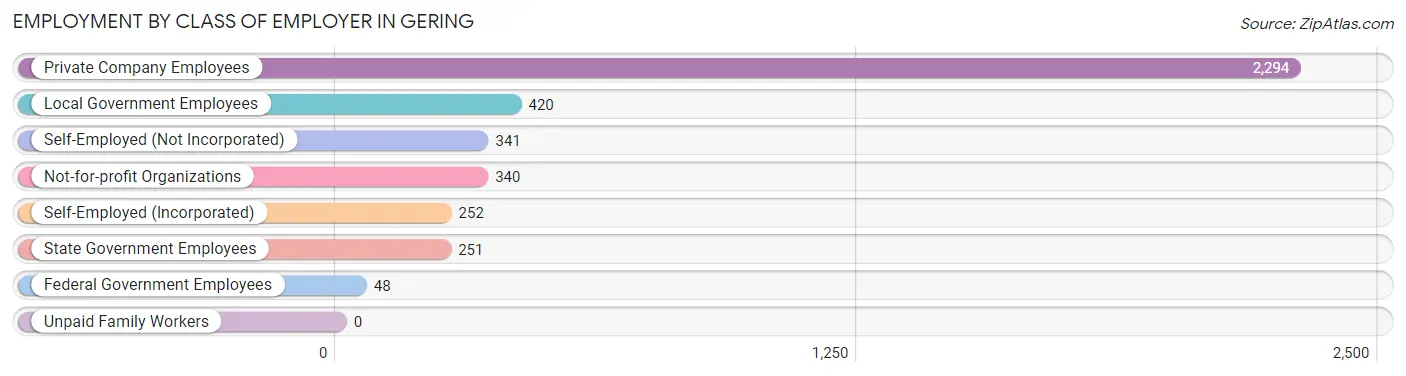
| Employer Class | # Employees | % Employees |
| Private Company Employees | 2,294 | 58.1% |
| Self-Employed (Incorporated) | 252 | 6.4% |
| Self-Employed (Not Incorporated) | 341 | 8.6% |
| Not-for-profit Organizations | 340 | 8.6% |
| Local Government Employees | 420 | 10.6% |
| State Government Employees | 251 | 6.4% |
| Federal Government Employees | 48 | 1.2% |
| Unpaid Family Workers | 0 | 0.0% |
| Total | 3,946 | 100.0% |
Employment Status by Age in Gering
According to the labor force statistics for Gering, out of the total population over 16 years of age (6,557), 64.5% or 4,229 individuals are in the labor force, with 2.3% or 97 of them unemployed. The age group with the highest labor force participation rate is 45 to 54 years, with 92.2% or 817 individuals in the labor force. Within the labor force, the 55 to 59 years age range has the highest percentage of unemployed individuals, with 7.8% or 35 of them being unemployed.
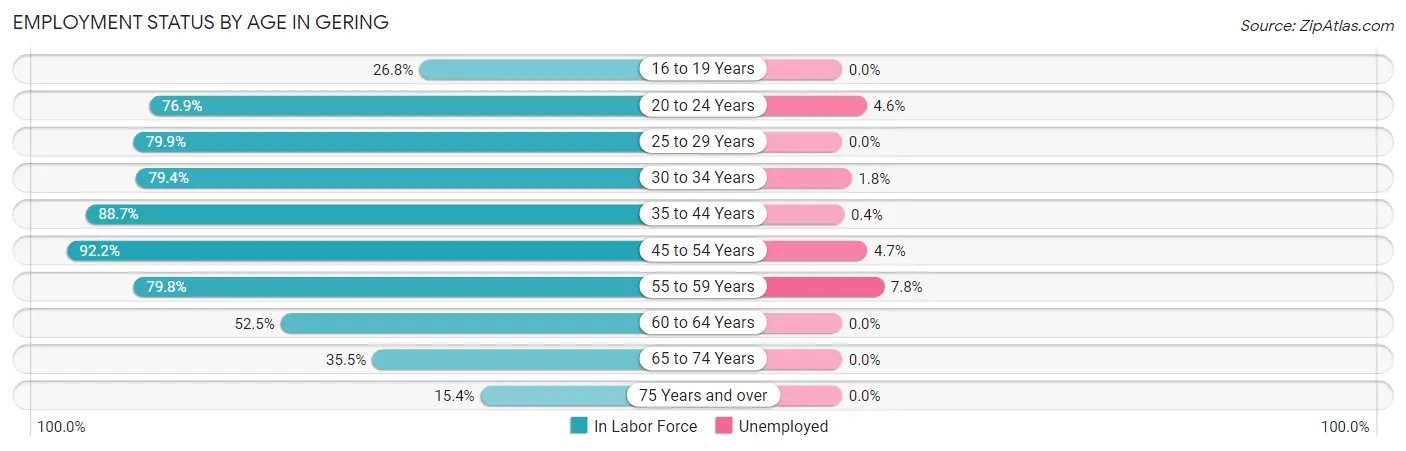
| Age Bracket | In Labor Force | Unemployed |
| 16 to 19 Years | 140 (26.8%) | 0 (0.0%) |
| 20 to 24 Years | 280 (76.9%) | 13 (4.6%) |
| 25 to 29 Years | 518 (79.9%) | 0 (0.0%) |
| 30 to 34 Years | 435 (79.4%) | 8 (1.8%) |
| 35 to 44 Years | 1,026 (88.7%) | 4 (0.4%) |
| 45 to 54 Years | 817 (92.2%) | 38 (4.7%) |
| 55 to 59 Years | 446 (79.8%) | 35 (7.8%) |
| 60 to 64 Years | 147 (52.5%) | 0 (0.0%) |
| 65 to 74 Years | 312 (35.5%) | 0 (0.0%) |
| 75 Years and over | 110 (15.4%) | 0 (0.0%) |
| Total | 4,229 (64.5%) | 97 (2.3%) |
Employment Status by Educational Attainment in Gering
According to labor force statistics for Gering, 83.1% of individuals (3,389) out of the total population between 25 and 64 years of age (4,078) are in the labor force, with 2.5% or 85 of them being unemployed. The group with the highest labor force participation rate are those with the educational attainment of bachelor's degree or higher, with 95.0% or 1,104 individuals in the labor force. Within the labor force, individuals with high school diploma education have the highest percentage of unemployment, with 4.8% or 42 of them being unemployed.
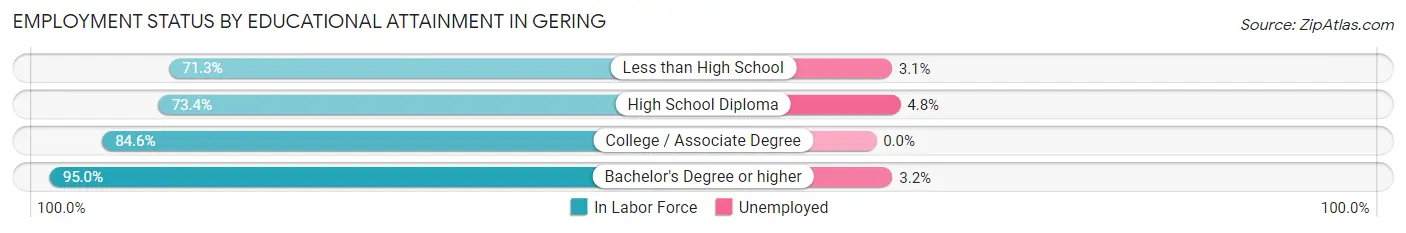
| Educational Attainment | In Labor Force | Unemployed |
| Less than High School | 259 (71.3%) | 11 (3.1%) |
| High School Diploma | 871 (73.4%) | 57 (4.8%) |
| College / Associate Degree | 1,156 (84.6%) | 0 (0.0%) |
| Bachelor's Degree or higher | 1,104 (95.0%) | 37 (3.2%) |
| Total | 3,389 (83.1%) | 102 (2.5%) |
Employment Occupations by Sex in Gering
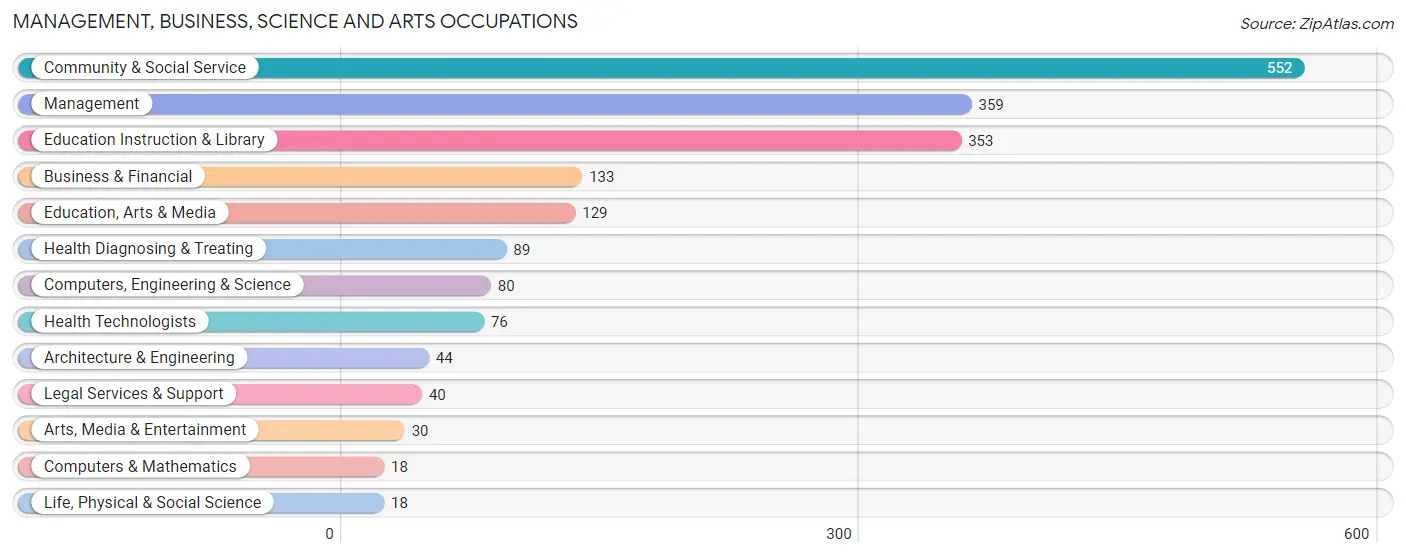
Management, Business, Science and Arts Occupations
The most common Management, Business, Science and Arts occupations in Gering are Community & Social Service (552 | 13.4%), Management (359 | 8.7%), Education Instruction & Library (353 | 8.5%), Business & Financial (133 | 3.2%), and Education, Arts & Media (129 | 3.1%).
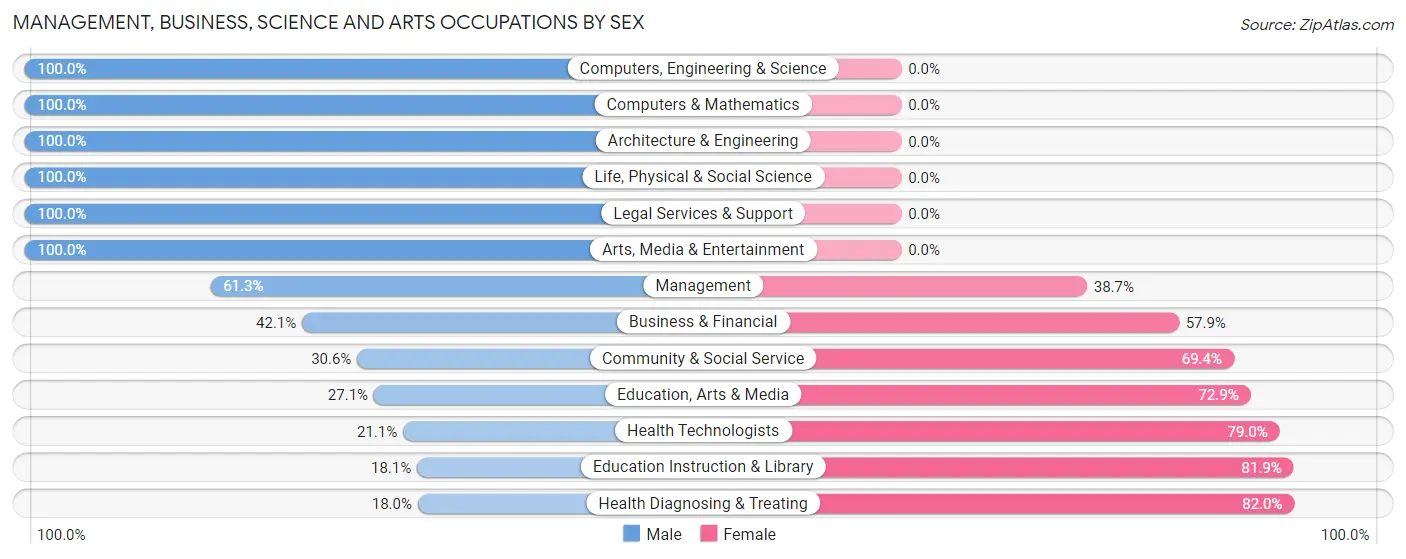
Management, Business, Science and Arts Occupations by Sex
Within the Management, Business, Science and Arts occupations in Gering, the most male-oriented occupations are Computers, Engineering & Science (100.0%), Computers & Mathematics (100.0%), and Architecture & Engineering (100.0%), while the most female-oriented occupations are Health Diagnosing & Treating (82.0%), Education Instruction & Library (81.9%), and Health Technologists (78.9%).
| Occupation | Male | Female |
| Management | 220 (61.3%) | 139 (38.7%) |
| Business & Financial | 56 (42.1%) | 77 (57.9%) |
| Computers, Engineering & Science | 80 (100.0%) | 0 (0.0%) |
| Computers & Mathematics | 18 (100.0%) | 0 (0.0%) |
| Architecture & Engineering | 44 (100.0%) | 0 (0.0%) |
| Life, Physical & Social Science | 18 (100.0%) | 0 (0.0%) |
| Community & Social Service | 169 (30.6%) | 383 (69.4%) |
| Education, Arts & Media | 35 (27.1%) | 94 (72.9%) |
| Legal Services & Support | 40 (100.0%) | 0 (0.0%) |
| Education Instruction & Library | 64 (18.1%) | 289 (81.9%) |
| Arts, Media & Entertainment | 30 (100.0%) | 0 (0.0%) |
| Health Diagnosing & Treating | 16 (18.0%) | 73 (82.0%) |
| Health Technologists | 16 (21.0%) | 60 (78.9%) |
| Total (Category) | 541 (44.6%) | 672 (55.4%) |
| Total (Overall) | 2,084 (50.4%) | 2,049 (49.6%) |
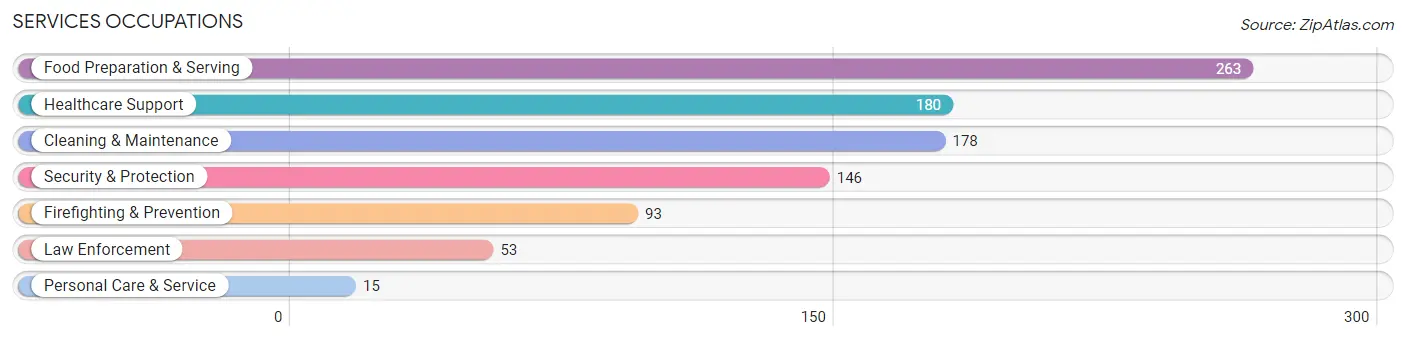
Services Occupations
The most common Services occupations in Gering are Food Preparation & Serving (263 | 6.4%), Healthcare Support (180 | 4.4%), Cleaning & Maintenance (178 | 4.3%), Security & Protection (146 | 3.5%), and Firefighting & Prevention (93 | 2.2%).
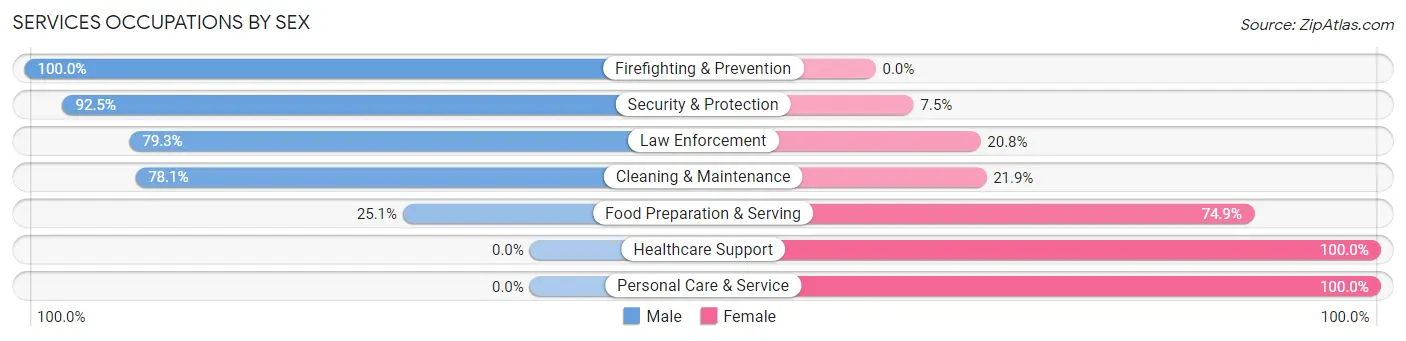
Services Occupations by Sex
Within the Services occupations in Gering, the most male-oriented occupations are Firefighting & Prevention (100.0%), Security & Protection (92.5%), and Law Enforcement (79.2%), while the most female-oriented occupations are Healthcare Support (100.0%), Personal Care & Service (100.0%), and Food Preparation & Serving (74.9%).
| Occupation | Male | Female |
| Healthcare Support | 0 (0.0%) | 180 (100.0%) |
| Security & Protection | 135 (92.5%) | 11 (7.5%) |
| Firefighting & Prevention | 93 (100.0%) | 0 (0.0%) |
| Law Enforcement | 42 (79.2%) | 11 (20.7%) |
| Food Preparation & Serving | 66 (25.1%) | 197 (74.9%) |
| Cleaning & Maintenance | 139 (78.1%) | 39 (21.9%) |
| Personal Care & Service | 0 (0.0%) | 15 (100.0%) |
| Total (Category) | 340 (43.5%) | 442 (56.5%) |
| Total (Overall) | 2,084 (50.4%) | 2,049 (49.6%) |
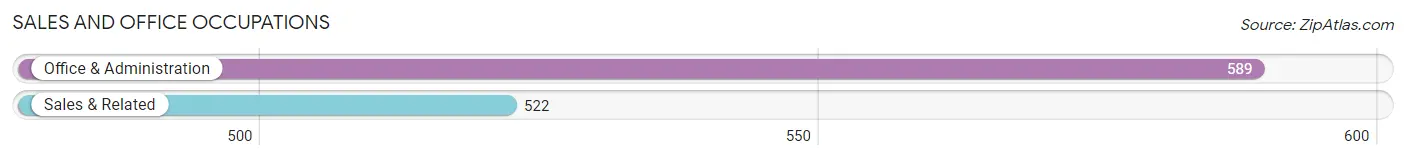
Sales and Office Occupations
The most common Sales and Office occupations in Gering are Office & Administration (589 | 14.2%), and Sales & Related (522 | 12.6%).
Sales and Office Occupations by Sex
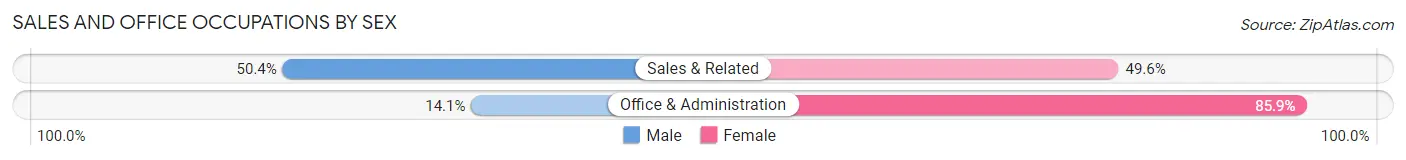
| Occupation | Male | Female |
| Sales & Related | 263 (50.4%) | 259 (49.6%) |
| Office & Administration | 83 (14.1%) | 506 (85.9%) |
| Total (Category) | 346 (31.1%) | 765 (68.9%) |
| Total (Overall) | 2,084 (50.4%) | 2,049 (49.6%) |
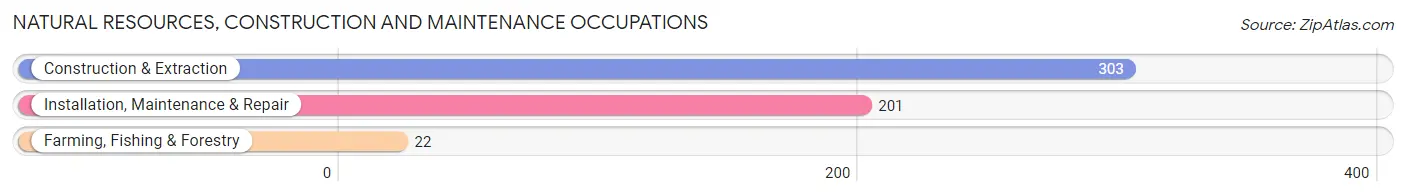
Natural Resources, Construction and Maintenance Occupations
The most common Natural Resources, Construction and Maintenance occupations in Gering are Construction & Extraction (303 | 7.3%), Installation, Maintenance & Repair (201 | 4.9%), and Farming, Fishing & Forestry (22 | 0.5%).
Natural Resources, Construction and Maintenance Occupations by Sex
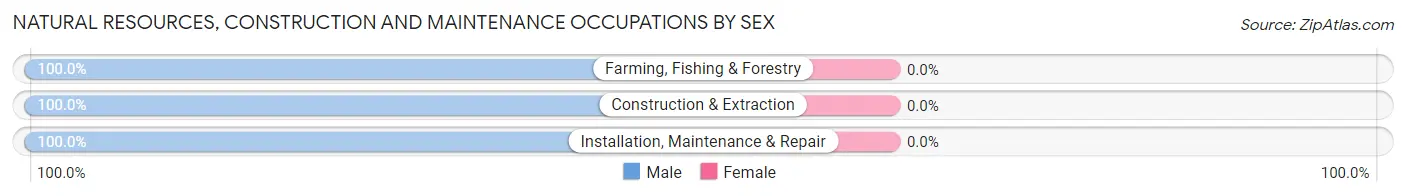
| Occupation | Male | Female |
| Farming, Fishing & Forestry | 22 (100.0%) | 0 (0.0%) |
| Construction & Extraction | 303 (100.0%) | 0 (0.0%) |
| Installation, Maintenance & Repair | 201 (100.0%) | 0 (0.0%) |
| Total (Category) | 526 (100.0%) | 0 (0.0%) |
| Total (Overall) | 2,084 (50.4%) | 2,049 (49.6%) |
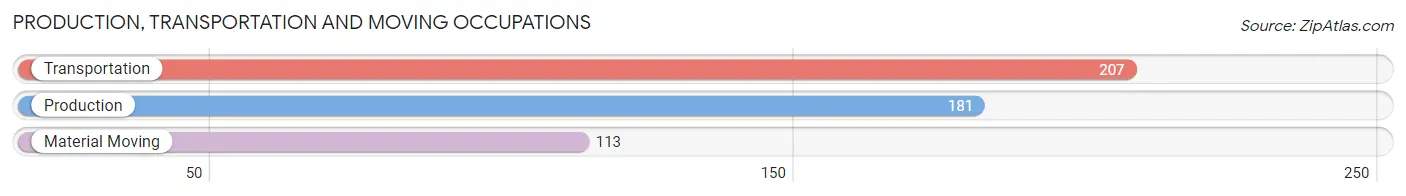
Production, Transportation and Moving Occupations
The most common Production, Transportation and Moving occupations in Gering are Transportation (207 | 5.0%), Production (181 | 4.4%), and Material Moving (113 | 2.7%).
Production, Transportation and Moving Occupations by Sex
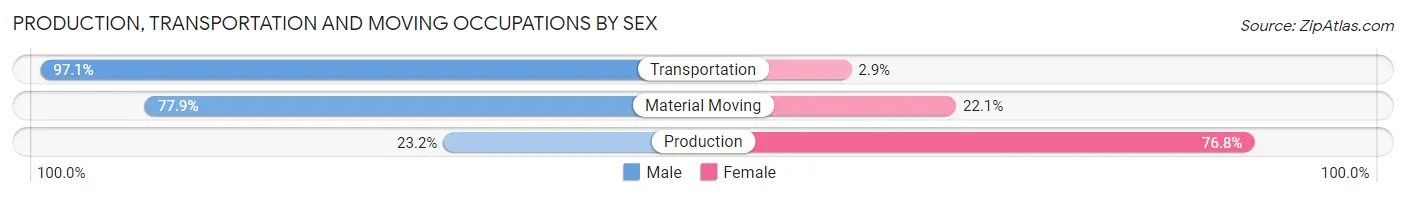
| Occupation | Male | Female |
| Production | 42 (23.2%) | 139 (76.8%) |
| Transportation | 201 (97.1%) | 6 (2.9%) |
| Material Moving | 88 (77.9%) | 25 (22.1%) |
| Total (Category) | 331 (66.1%) | 170 (33.9%) |
| Total (Overall) | 2,084 (50.4%) | 2,049 (49.6%) |
Employment Industries by Sex in Gering
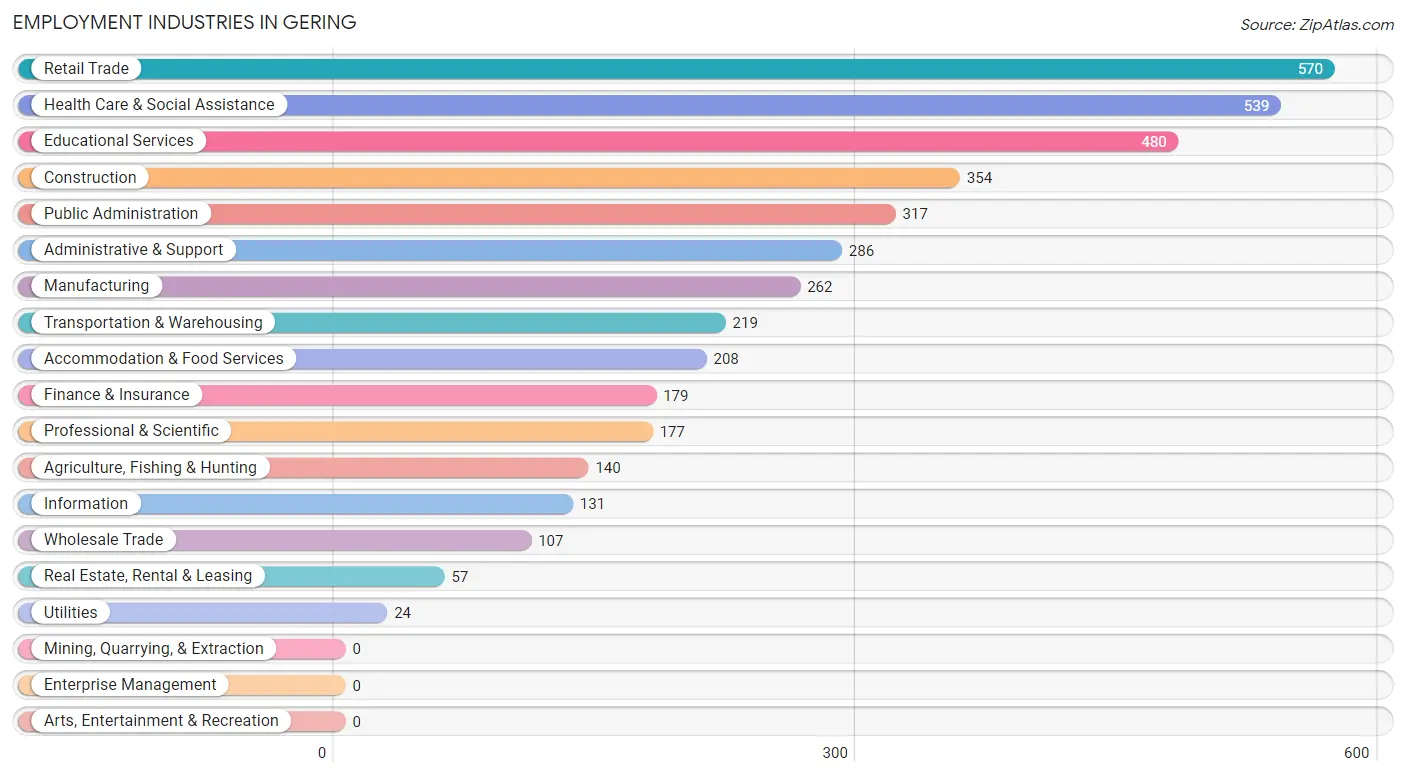
Employment Industries in Gering
The major employment industries in Gering include Retail Trade (570 | 13.8%), Health Care & Social Assistance (539 | 13.0%), Educational Services (480 | 11.6%), Construction (354 | 8.6%), and Public Administration (317 | 7.7%).
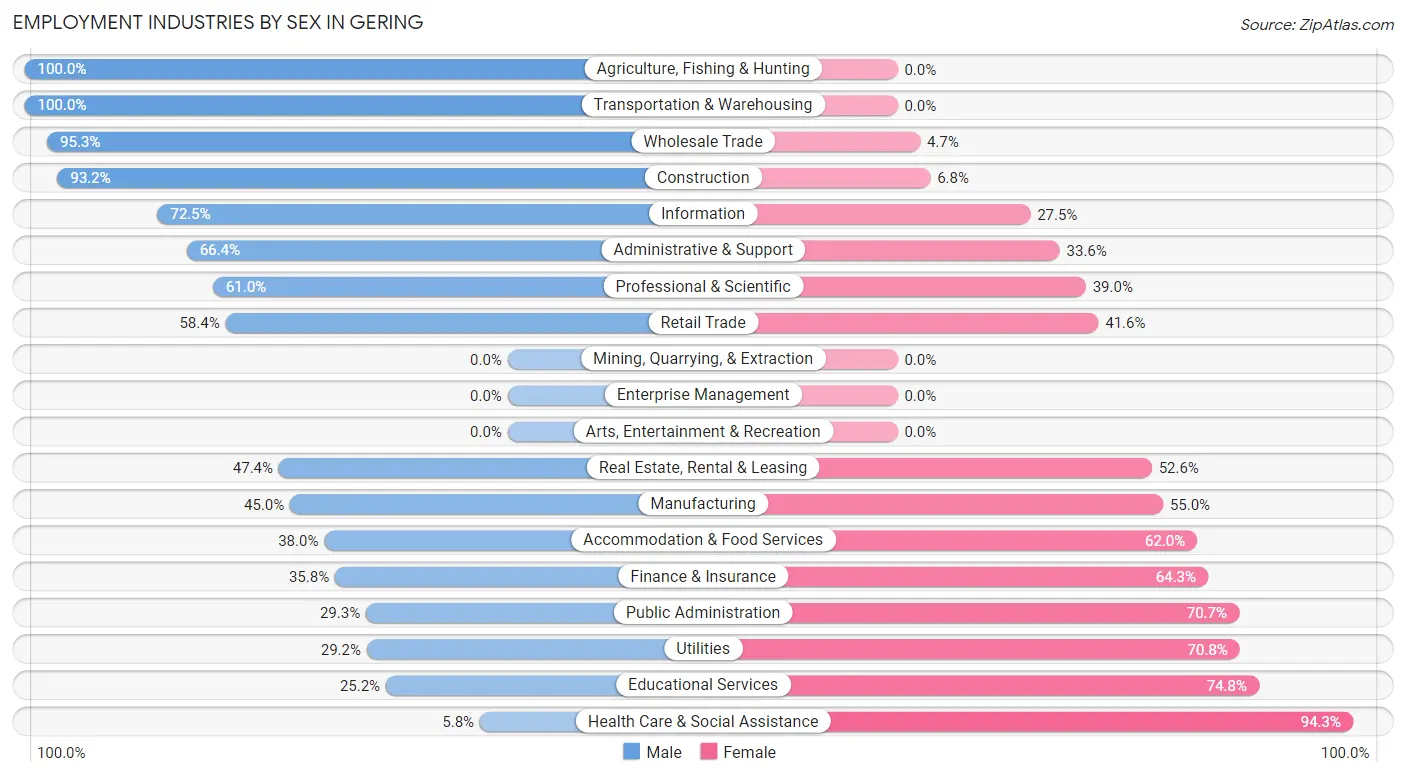
Employment Industries by Sex in Gering
The Gering industries that see more men than women are Agriculture, Fishing & Hunting (100.0%), Transportation & Warehousing (100.0%), and Wholesale Trade (95.3%), whereas the industries that tend to have a higher number of women are Health Care & Social Assistance (94.3%), Educational Services (74.8%), and Utilities (70.8%).
| Industry | Male | Female |
| Agriculture, Fishing & Hunting | 140 (100.0%) | 0 (0.0%) |
| Mining, Quarrying, & Extraction | 0 (0.0%) | 0 (0.0%) |
| Construction | 330 (93.2%) | 24 (6.8%) |
| Manufacturing | 118 (45.0%) | 144 (55.0%) |
| Wholesale Trade | 102 (95.3%) | 5 (4.7%) |
| Retail Trade | 333 (58.4%) | 237 (41.6%) |
| Transportation & Warehousing | 219 (100.0%) | 0 (0.0%) |
| Utilities | 7 (29.2%) | 17 (70.8%) |
| Information | 95 (72.5%) | 36 (27.5%) |
| Finance & Insurance | 64 (35.7%) | 115 (64.2%) |
| Real Estate, Rental & Leasing | 27 (47.4%) | 30 (52.6%) |
| Professional & Scientific | 108 (61.0%) | 69 (39.0%) |
| Enterprise Management | 0 (0.0%) | 0 (0.0%) |
| Administrative & Support | 190 (66.4%) | 96 (33.6%) |
| Educational Services | 121 (25.2%) | 359 (74.8%) |
| Health Care & Social Assistance | 31 (5.8%) | 508 (94.3%) |
| Arts, Entertainment & Recreation | 0 (0.0%) | 0 (0.0%) |
| Accommodation & Food Services | 79 (38.0%) | 129 (62.0%) |
| Public Administration | 93 (29.3%) | 224 (70.7%) |
| Total | 2,084 (50.4%) | 2,049 (49.6%) |
Education in Gering
School Enrollment in Gering
The most common levels of schooling among the 2,300 students in Gering are middle school (666 | 29.0%), elementary school (609 | 26.5%), and high school (438 | 19.0%).
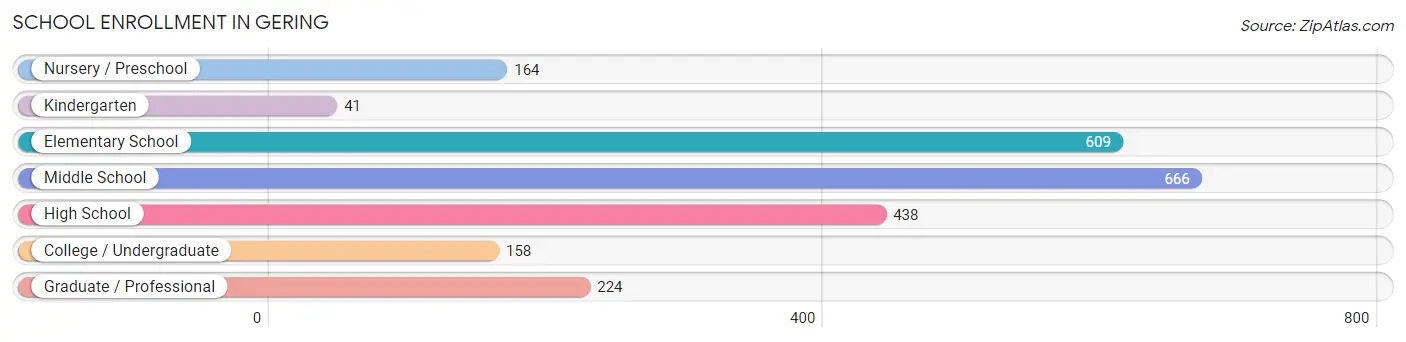
| School Level | # Students | % Students |
| Nursery / Preschool | 164 | 7.1% |
| Kindergarten | 41 | 1.8% |
| Elementary School | 609 | 26.5% |
| Middle School | 666 | 29.0% |
| High School | 438 | 19.0% |
| College / Undergraduate | 158 | 6.9% |
| Graduate / Professional | 224 | 9.7% |
| Total | 2,300 | 100.0% |
School Enrollment by Age by Funding Source in Gering
Out of a total of 2,300 students who are enrolled in schools in Gering, 414 (18.0%) attend a private institution, while the remaining 1,886 (82.0%) are enrolled in public schools. The age group of 3 to 4 year olds has the highest likelihood of being enrolled in private schools, with 96 (79.3% in the age bracket) enrolled. Conversely, the age group of 25 to 34 year olds has the lowest likelihood of being enrolled in a private school, with 72 (100.0% in the age bracket) attending a public institution.
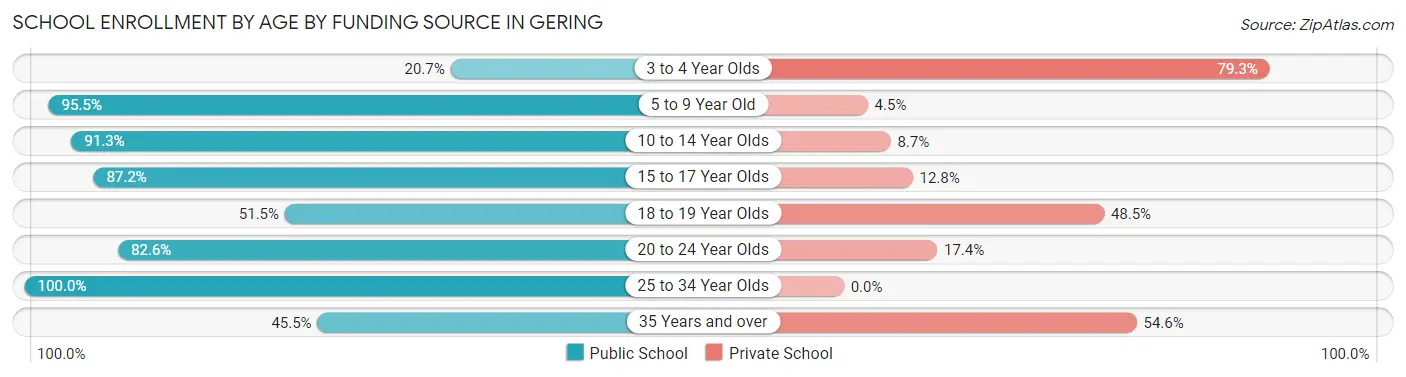
| Age Bracket | Public School | Private School |
| 3 to 4 Year Olds | 25 (20.7%) | 96 (79.3%) |
| 5 to 9 Year Old | 513 (95.5%) | 24 (4.5%) |
| 10 to 14 Year Olds | 733 (91.3%) | 70 (8.7%) |
| 15 to 17 Year Olds | 360 (87.2%) | 53 (12.8%) |
| 18 to 19 Year Olds | 51 (51.5%) | 48 (48.5%) |
| 20 to 24 Year Olds | 38 (82.6%) | 8 (17.4%) |
| 25 to 34 Year Olds | 72 (100.0%) | 0 (0.0%) |
| 35 Years and over | 95 (45.5%) | 114 (54.5%) |
| Total | 1,886 (82.0%) | 414 (18.0%) |
Educational Attainment by Field of Study in Gering
Education (351 | 21.6%), business (321 | 19.7%), bio, nature & agricultural (174 | 10.7%), arts & humanities (156 | 9.6%), and social sciences (100 | 6.1%) are the most common fields of study among 1,626 individuals in Gering who have obtained a bachelor's degree or higher.
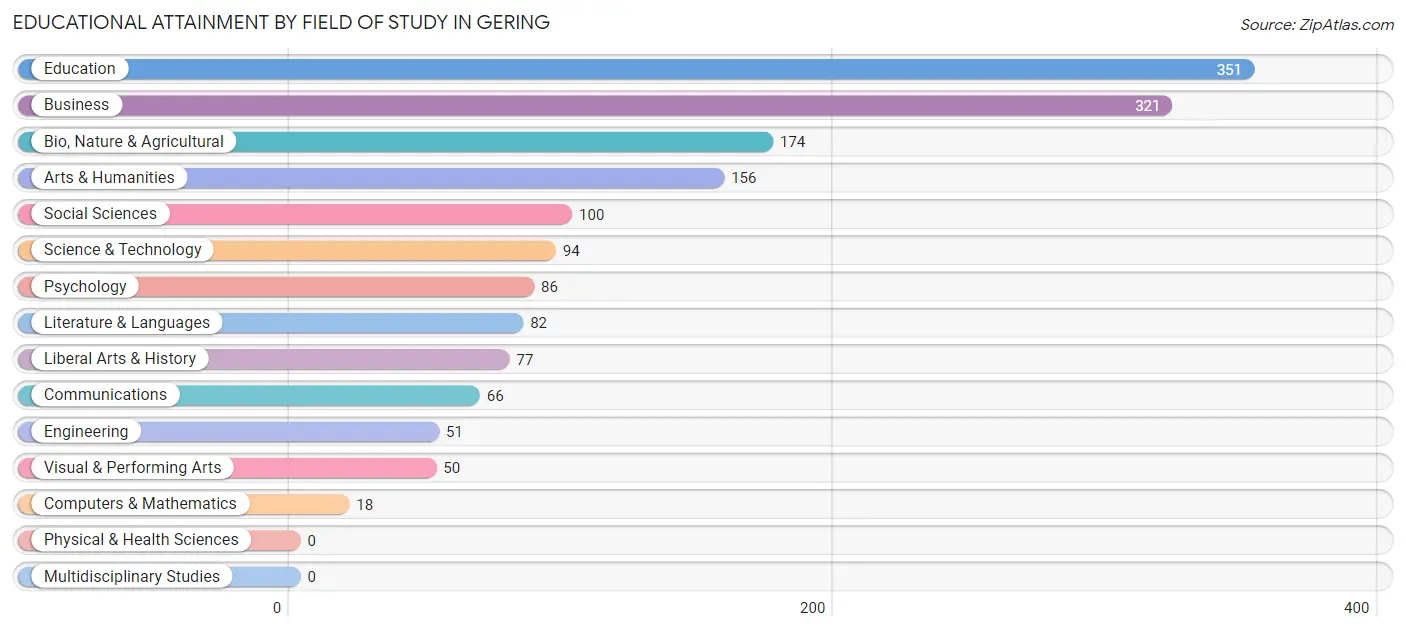
| Field of Study | # Graduates | % Graduates |
| Computers & Mathematics | 18 | 1.1% |
| Bio, Nature & Agricultural | 174 | 10.7% |
| Physical & Health Sciences | 0 | 0.0% |
| Psychology | 86 | 5.3% |
| Social Sciences | 100 | 6.1% |
| Engineering | 51 | 3.1% |
| Multidisciplinary Studies | 0 | 0.0% |
| Science & Technology | 94 | 5.8% |
| Business | 321 | 19.7% |
| Education | 351 | 21.6% |
| Literature & Languages | 82 | 5.0% |
| Liberal Arts & History | 77 | 4.7% |
| Visual & Performing Arts | 50 | 3.1% |
| Communications | 66 | 4.1% |
| Arts & Humanities | 156 | 9.6% |
| Total | 1,626 | 100.0% |
Transportation & Commute in Gering
Vehicle Availability by Sex in Gering
The most prevalent vehicle ownership categories in Gering are males with 2 vehicles (790, accounting for 39.8%) and females with 2 vehicles (805, making up 40.5%).
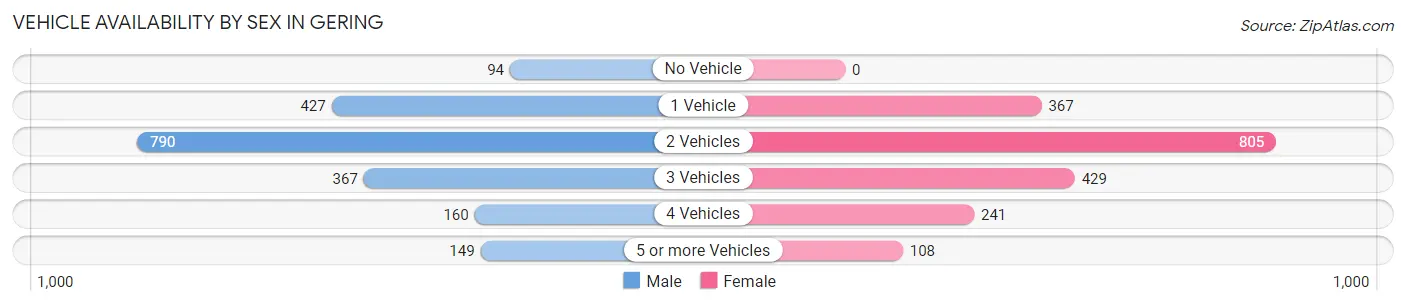
| Vehicles Available | Male | Female |
| No Vehicle | 94 (4.7%) | 0 (0.0%) |
| 1 Vehicle | 427 (21.5%) | 367 (18.8%) |
| 2 Vehicles | 790 (39.8%) | 805 (41.3%) |
| 3 Vehicles | 367 (18.5%) | 429 (22.0%) |
| 4 Vehicles | 160 (8.1%) | 241 (12.4%) |
| 5 or more Vehicles | 149 (7.5%) | 108 (5.5%) |
| Total | 1,987 (100.0%) | 1,950 (100.0%) |
Commute Time in Gering
The most frequently occuring commute durations in Gering are 10 to 14 minutes (1,324 commuters, 35.2%), 5 to 9 minutes (904 commuters, 24.0%), and 15 to 19 minutes (652 commuters, 17.3%).
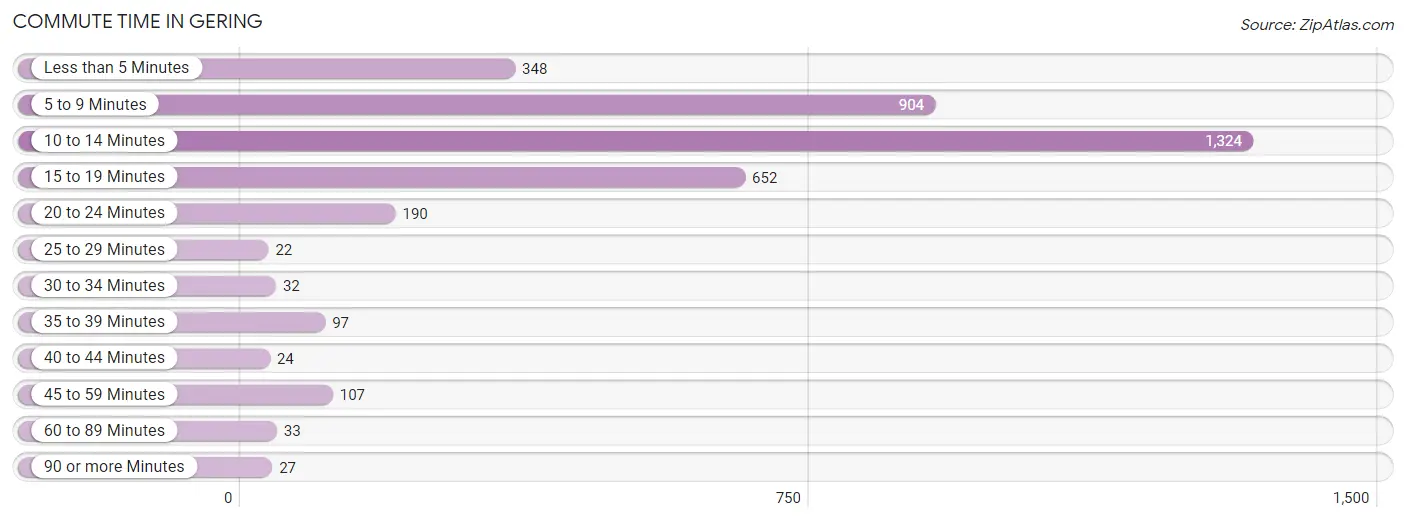
| Commute Time | # Commuters | % Commuters |
| Less than 5 Minutes | 348 | 9.3% |
| 5 to 9 Minutes | 904 | 24.0% |
| 10 to 14 Minutes | 1,324 | 35.2% |
| 15 to 19 Minutes | 652 | 17.3% |
| 20 to 24 Minutes | 190 | 5.1% |
| 25 to 29 Minutes | 22 | 0.6% |
| 30 to 34 Minutes | 32 | 0.9% |
| 35 to 39 Minutes | 97 | 2.6% |
| 40 to 44 Minutes | 24 | 0.6% |
| 45 to 59 Minutes | 107 | 2.9% |
| 60 to 89 Minutes | 33 | 0.9% |
| 90 or more Minutes | 27 | 0.7% |
Commute Time by Sex in Gering
The most common commute times in Gering are 10 to 14 minutes (726 commuters, 37.7%) for males and 10 to 14 minutes (598 commuters, 32.6%) for females.
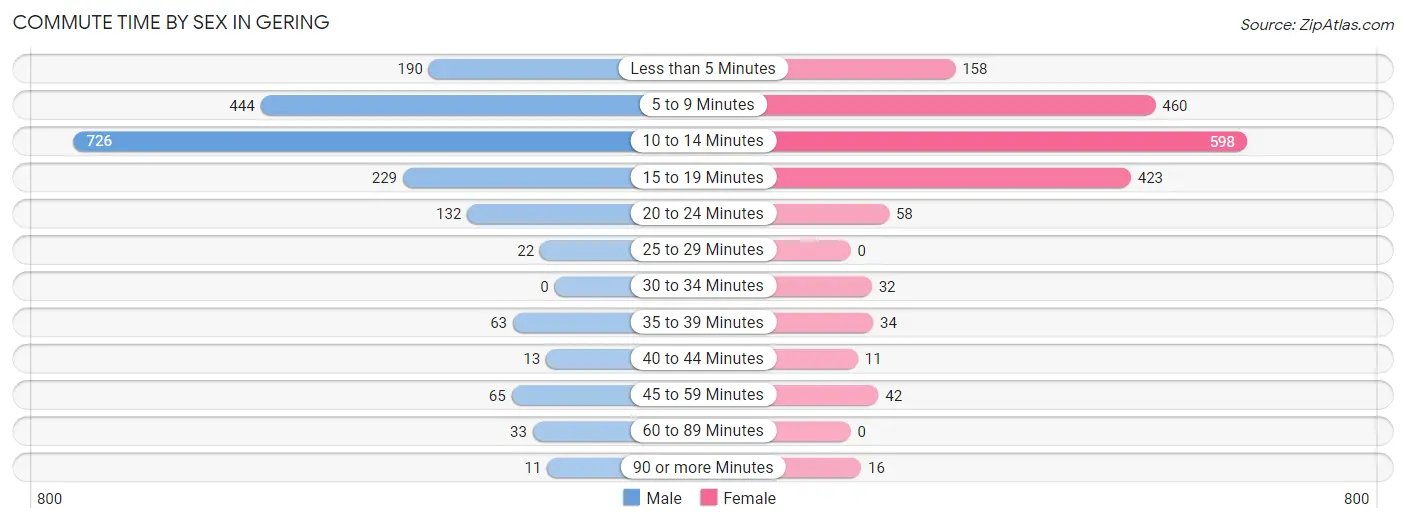
| Commute Time | Male | Female |
| Less than 5 Minutes | 190 (9.9%) | 158 (8.6%) |
| 5 to 9 Minutes | 444 (23.0%) | 460 (25.1%) |
| 10 to 14 Minutes | 726 (37.7%) | 598 (32.6%) |
| 15 to 19 Minutes | 229 (11.9%) | 423 (23.1%) |
| 20 to 24 Minutes | 132 (6.9%) | 58 (3.2%) |
| 25 to 29 Minutes | 22 (1.1%) | 0 (0.0%) |
| 30 to 34 Minutes | 0 (0.0%) | 32 (1.8%) |
| 35 to 39 Minutes | 63 (3.3%) | 34 (1.9%) |
| 40 to 44 Minutes | 13 (0.7%) | 11 (0.6%) |
| 45 to 59 Minutes | 65 (3.4%) | 42 (2.3%) |
| 60 to 89 Minutes | 33 (1.7%) | 0 (0.0%) |
| 90 or more Minutes | 11 (0.6%) | 16 (0.9%) |
Time of Departure to Work by Sex in Gering
The most frequent times of departure to work in Gering are 7:00 AM to 7:29 AM (380, 19.7%) for males and 7:00 AM to 7:29 AM (325, 17.7%) for females.
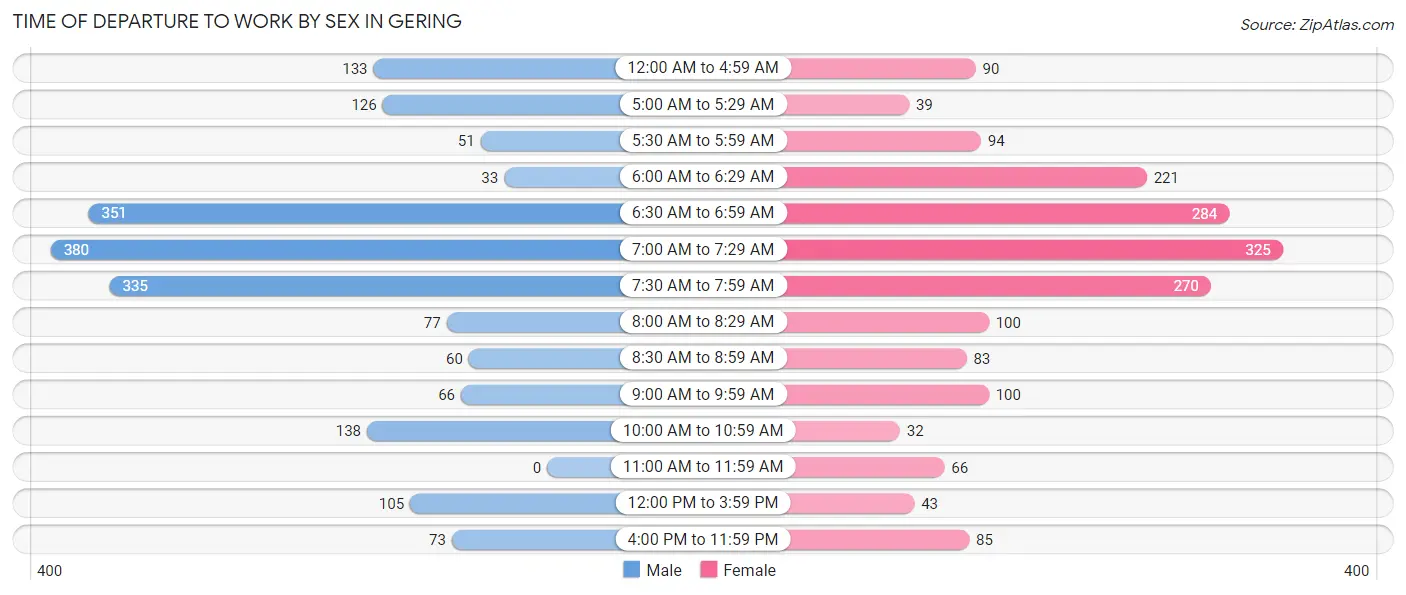
| Time of Departure | Male | Female |
| 12:00 AM to 4:59 AM | 133 (6.9%) | 90 (4.9%) |
| 5:00 AM to 5:29 AM | 126 (6.5%) | 39 (2.1%) |
| 5:30 AM to 5:59 AM | 51 (2.6%) | 94 (5.1%) |
| 6:00 AM to 6:29 AM | 33 (1.7%) | 221 (12.1%) |
| 6:30 AM to 6:59 AM | 351 (18.2%) | 284 (15.5%) |
| 7:00 AM to 7:29 AM | 380 (19.7%) | 325 (17.7%) |
| 7:30 AM to 7:59 AM | 335 (17.4%) | 270 (14.7%) |
| 8:00 AM to 8:29 AM | 77 (4.0%) | 100 (5.5%) |
| 8:30 AM to 8:59 AM | 60 (3.1%) | 83 (4.5%) |
| 9:00 AM to 9:59 AM | 66 (3.4%) | 100 (5.5%) |
| 10:00 AM to 10:59 AM | 138 (7.2%) | 32 (1.8%) |
| 11:00 AM to 11:59 AM | 0 (0.0%) | 66 (3.6%) |
| 12:00 PM to 3:59 PM | 105 (5.4%) | 43 (2.4%) |
| 4:00 PM to 11:59 PM | 73 (3.8%) | 85 (4.6%) |
| Total | 1,928 (100.0%) | 1,832 (100.0%) |
Housing Occupancy in Gering
Occupancy by Ownership in Gering
Of the total 3,384 dwellings in Gering, owner-occupied units account for 2,519 (74.4%), while renter-occupied units make up 865 (25.6%).
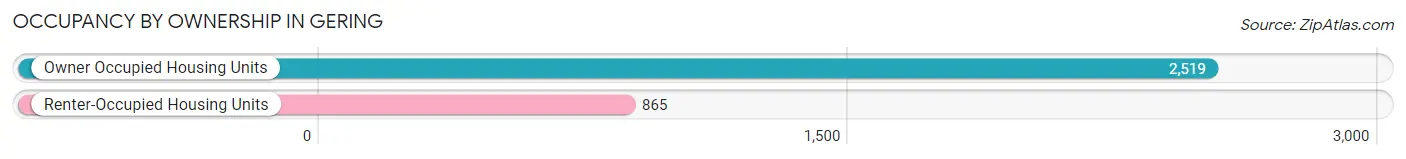
| Occupancy | # Housing Units | % Housing Units |
| Owner Occupied Housing Units | 2,519 | 74.4% |
| Renter-Occupied Housing Units | 865 | 25.6% |
| Total Occupied Housing Units | 3,384 | 100.0% |
Occupancy by Household Size in Gering
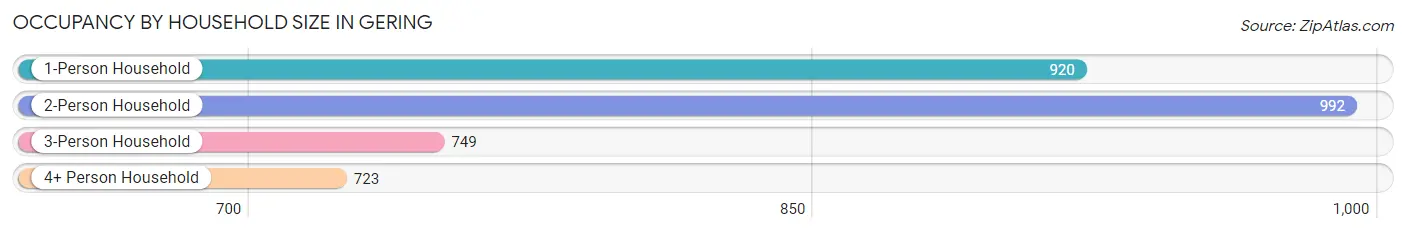
| Household Size | # Housing Units | % Housing Units |
| 1-Person Household | 920 | 27.2% |
| 2-Person Household | 992 | 29.3% |
| 3-Person Household | 749 | 22.1% |
| 4+ Person Household | 723 | 21.4% |
| Total Housing Units | 3,384 | 100.0% |
Occupancy by Ownership by Household Size in Gering
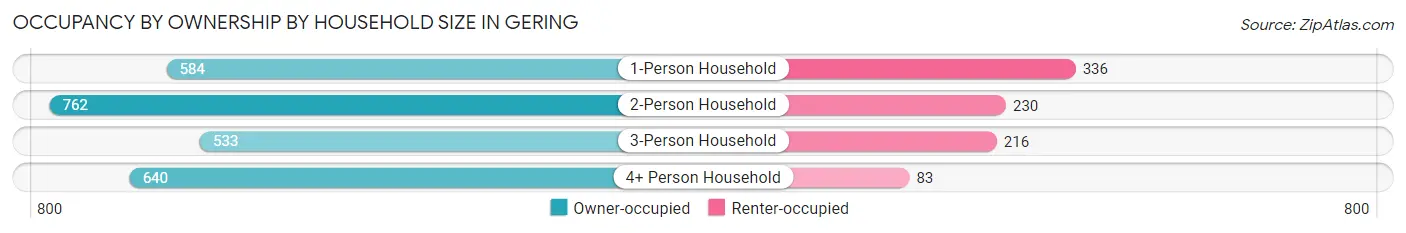
| Household Size | Owner-occupied | Renter-occupied |
| 1-Person Household | 584 (63.5%) | 336 (36.5%) |
| 2-Person Household | 762 (76.8%) | 230 (23.2%) |
| 3-Person Household | 533 (71.2%) | 216 (28.8%) |
| 4+ Person Household | 640 (88.5%) | 83 (11.5%) |
| Total Housing Units | 2,519 (74.4%) | 865 (25.6%) |
Occupancy by Educational Attainment in Gering
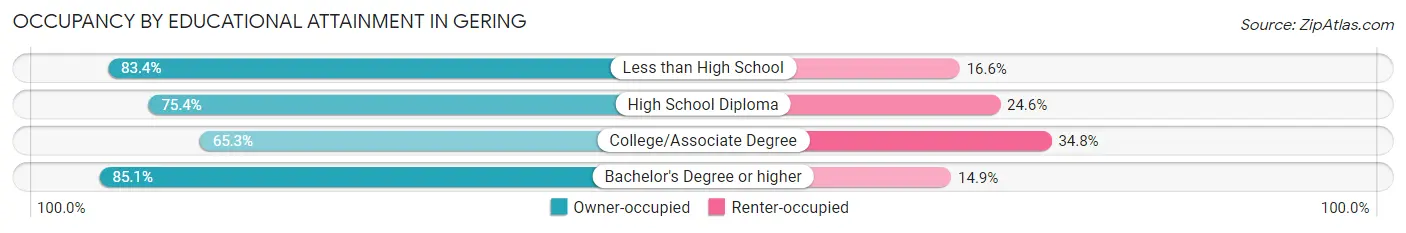
| Household Size | Owner-occupied | Renter-occupied |
| Less than High School | 136 (83.4%) | 27 (16.6%) |
| High School Diploma | 685 (75.4%) | 223 (24.6%) |
| College/Associate Degree | 890 (65.2%) | 474 (34.7%) |
| Bachelor's Degree or higher | 808 (85.1%) | 141 (14.9%) |
Occupancy by Age of Householder in Gering
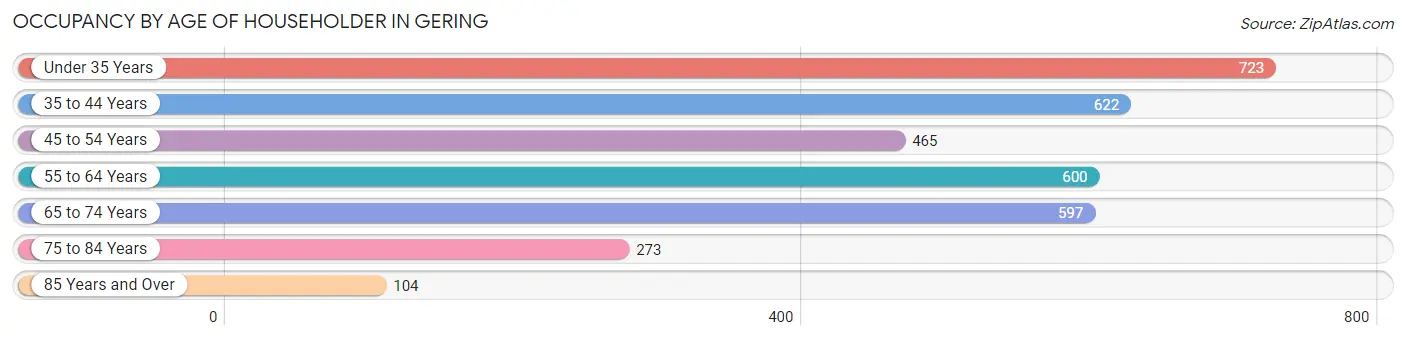
| Age Bracket | # Households | % Households |
| Under 35 Years | 723 | 21.4% |
| 35 to 44 Years | 622 | 18.4% |
| 45 to 54 Years | 465 | 13.7% |
| 55 to 64 Years | 600 | 17.7% |
| 65 to 74 Years | 597 | 17.6% |
| 75 to 84 Years | 273 | 8.1% |
| 85 Years and Over | 104 | 3.1% |
| Total | 3,384 | 100.0% |
Housing Finances in Gering
Median Income by Occupancy in Gering
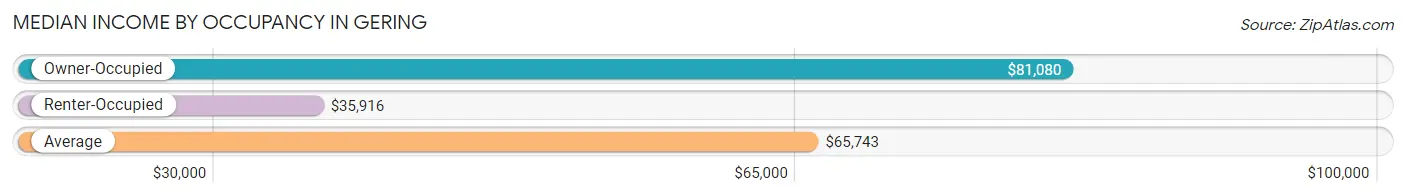
| Occupancy Type | # Households | Median Income |
| Owner-Occupied | 2,519 (74.4%) | $81,080 |
| Renter-Occupied | 865 (25.6%) | $35,916 |
| Average | 3,384 (100.0%) | $65,743 |
Occupancy by Householder Income Bracket in Gering
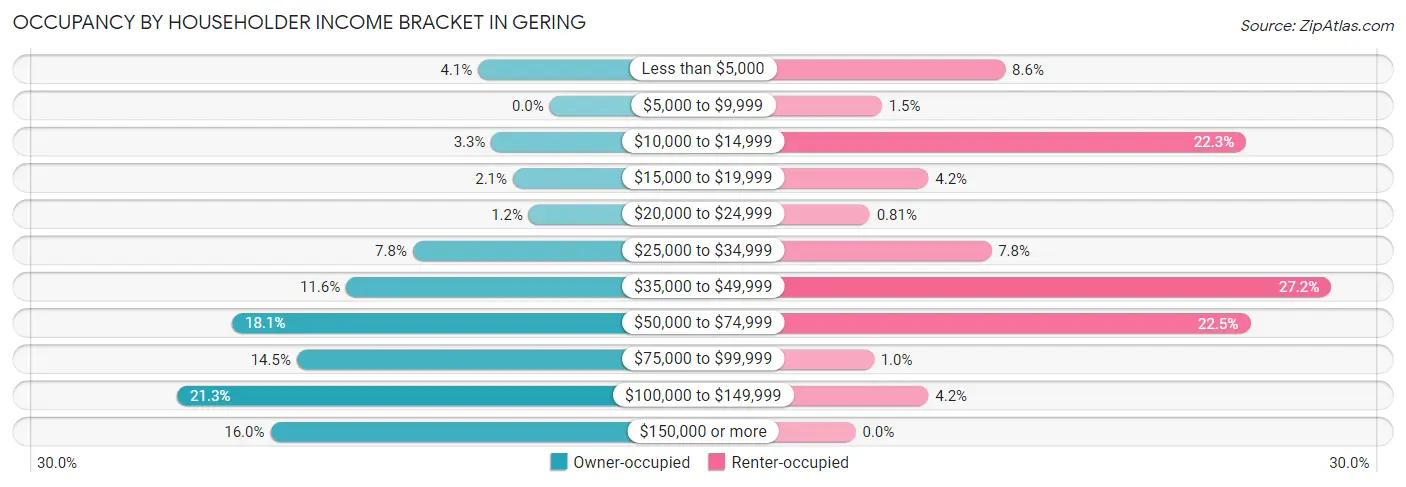
| Income Bracket | Owner-occupied | Renter-occupied |
| Less than $5,000 | 103 (4.1%) | 74 (8.6%) |
| $5,000 to $9,999 | 0 (0.0%) | 13 (1.5%) |
| $10,000 to $14,999 | 84 (3.3%) | 193 (22.3%) |
| $15,000 to $19,999 | 53 (2.1%) | 36 (4.2%) |
| $20,000 to $24,999 | 30 (1.2%) | 7 (0.8%) |
| $25,000 to $34,999 | 197 (7.8%) | 67 (7.7%) |
| $35,000 to $49,999 | 293 (11.6%) | 235 (27.2%) |
| $50,000 to $74,999 | 457 (18.1%) | 195 (22.5%) |
| $75,000 to $99,999 | 364 (14.4%) | 9 (1.0%) |
| $100,000 to $149,999 | 536 (21.3%) | 36 (4.2%) |
| $150,000 or more | 402 (16.0%) | 0 (0.0%) |
| Total | 2,519 (100.0%) | 865 (100.0%) |
Monthly Housing Cost Tiers in Gering
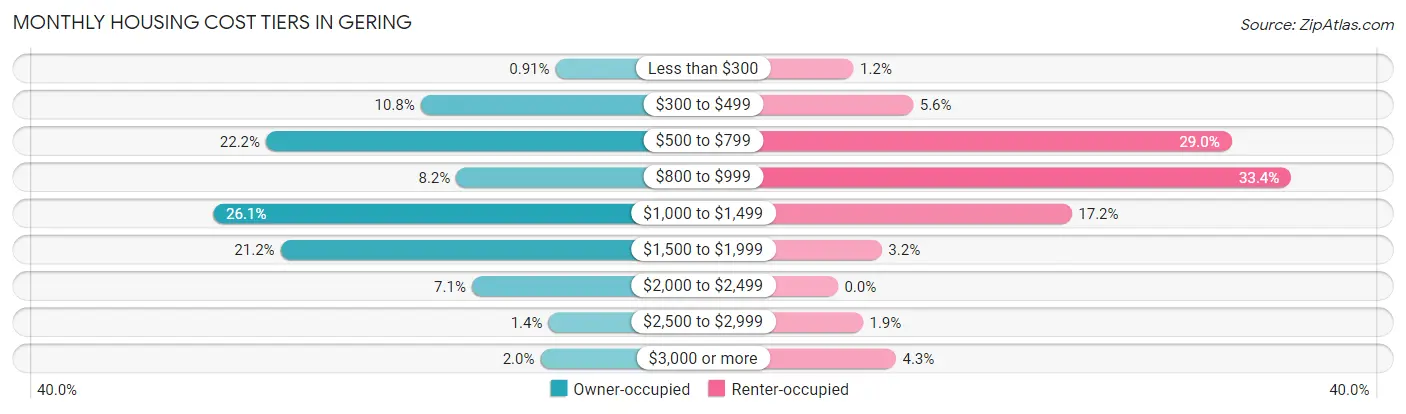
| Monthly Cost | Owner-occupied | Renter-occupied |
| Less than $300 | 23 (0.9%) | 10 (1.2%) |
| $300 to $499 | 273 (10.8%) | 48 (5.6%) |
| $500 to $799 | 560 (22.2%) | 251 (29.0%) |
| $800 to $999 | 207 (8.2%) | 289 (33.4%) |
| $1,000 to $1,499 | 658 (26.1%) | 149 (17.2%) |
| $1,500 to $1,999 | 533 (21.2%) | 28 (3.2%) |
| $2,000 to $2,499 | 178 (7.1%) | 0 (0.0%) |
| $2,500 to $2,999 | 36 (1.4%) | 16 (1.8%) |
| $3,000 or more | 51 (2.0%) | 37 (4.3%) |
| Total | 2,519 (100.0%) | 865 (100.0%) |
Physical Housing Characteristics in Gering
Housing Structures in Gering
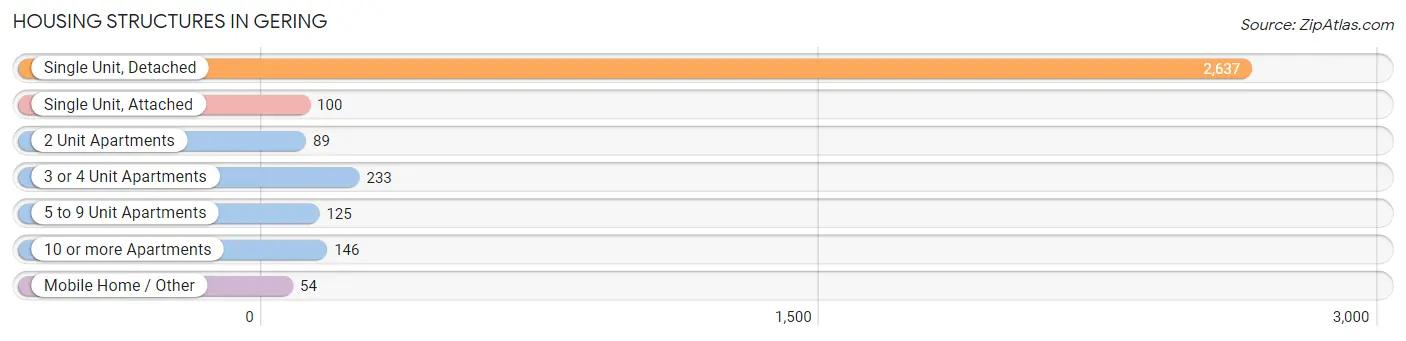
| Structure Type | # Housing Units | % Housing Units |
| Single Unit, Detached | 2,637 | 77.9% |
| Single Unit, Attached | 100 | 3.0% |
| 2 Unit Apartments | 89 | 2.6% |
| 3 or 4 Unit Apartments | 233 | 6.9% |
| 5 to 9 Unit Apartments | 125 | 3.7% |
| 10 or more Apartments | 146 | 4.3% |
| Mobile Home / Other | 54 | 1.6% |
| Total | 3,384 | 100.0% |
Housing Structures by Occupancy in Gering
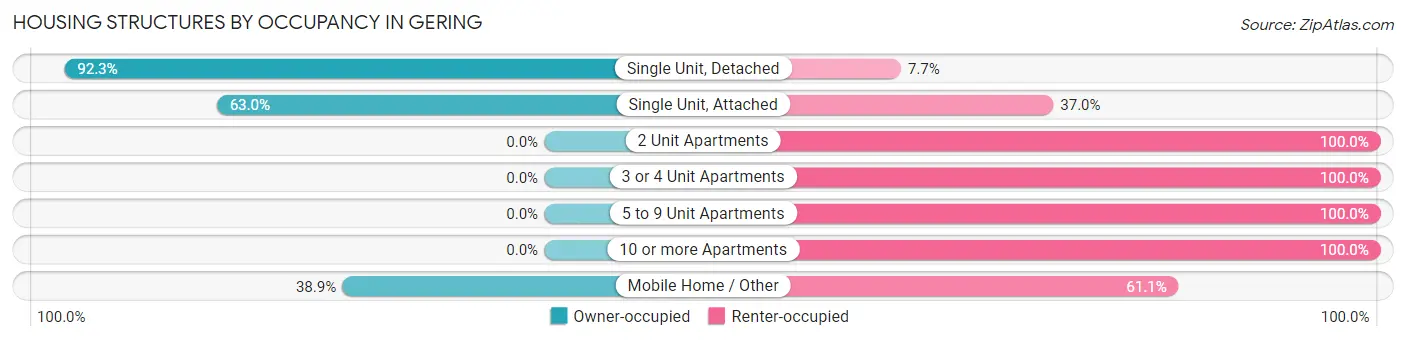
| Structure Type | Owner-occupied | Renter-occupied |
| Single Unit, Detached | 2,435 (92.3%) | 202 (7.7%) |
| Single Unit, Attached | 63 (63.0%) | 37 (37.0%) |
| 2 Unit Apartments | 0 (0.0%) | 89 (100.0%) |
| 3 or 4 Unit Apartments | 0 (0.0%) | 233 (100.0%) |
| 5 to 9 Unit Apartments | 0 (0.0%) | 125 (100.0%) |
| 10 or more Apartments | 0 (0.0%) | 146 (100.0%) |
| Mobile Home / Other | 21 (38.9%) | 33 (61.1%) |
| Total | 2,519 (74.4%) | 865 (25.6%) |
Housing Structures by Number of Rooms in Gering
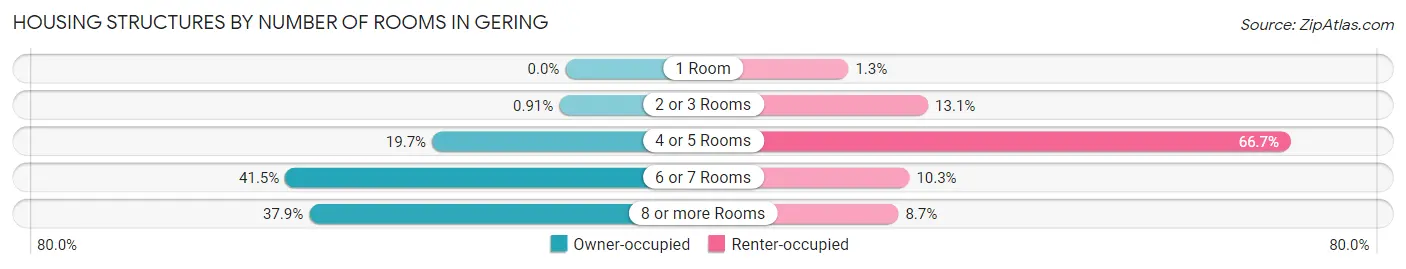
| Number of Rooms | Owner-occupied | Renter-occupied |
| 1 Room | 0 (0.0%) | 11 (1.3%) |
| 2 or 3 Rooms | 23 (0.9%) | 113 (13.1%) |
| 4 or 5 Rooms | 497 (19.7%) | 577 (66.7%) |
| 6 or 7 Rooms | 1,044 (41.4%) | 89 (10.3%) |
| 8 or more Rooms | 955 (37.9%) | 75 (8.7%) |
| Total | 2,519 (100.0%) | 865 (100.0%) |
Housing Structure by Heating Type in Gering
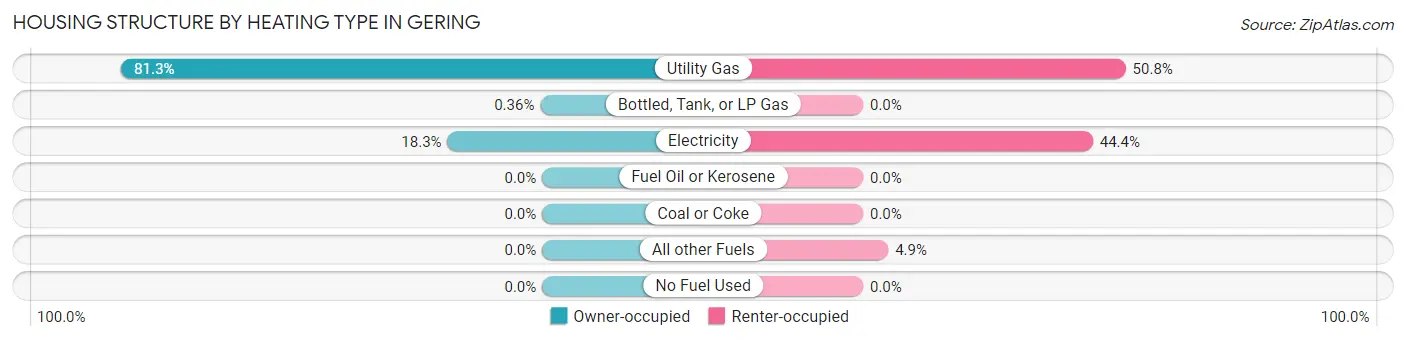
| Heating Type | Owner-occupied | Renter-occupied |
| Utility Gas | 2,049 (81.3%) | 439 (50.7%) |
| Bottled, Tank, or LP Gas | 9 (0.4%) | 0 (0.0%) |
| Electricity | 461 (18.3%) | 384 (44.4%) |
| Fuel Oil or Kerosene | 0 (0.0%) | 0 (0.0%) |
| Coal or Coke | 0 (0.0%) | 0 (0.0%) |
| All other Fuels | 0 (0.0%) | 42 (4.9%) |
| No Fuel Used | 0 (0.0%) | 0 (0.0%) |
| Total | 2,519 (100.0%) | 865 (100.0%) |
Household Vehicle Usage in Gering
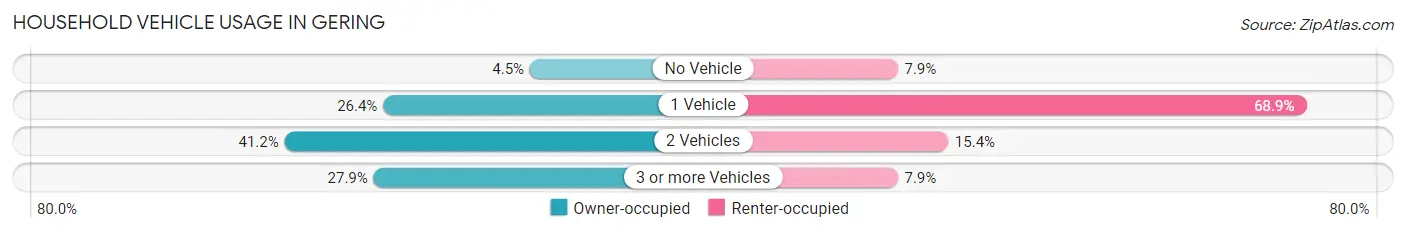
| Vehicles per Household | Owner-occupied | Renter-occupied |
| No Vehicle | 114 (4.5%) | 68 (7.9%) |
| 1 Vehicle | 666 (26.4%) | 596 (68.9%) |
| 2 Vehicles | 1,037 (41.2%) | 133 (15.4%) |
| 3 or more Vehicles | 702 (27.9%) | 68 (7.9%) |
| Total | 2,519 (100.0%) | 865 (100.0%) |
Real Estate & Mortgages in Gering
Real Estate and Mortgage Overview in Gering
| Characteristic | Without Mortgage | With Mortgage |
| Housing Units | 924 | 1,595 |
| Median Property Value | $123,600 | $185,900 |
| Median Household Income | $55,694 | $267 |
| Monthly Housing Costs | $562 | $51 |
| Real Estate Taxes | $2,202 | $47 |
Property Value by Mortgage Status in Gering
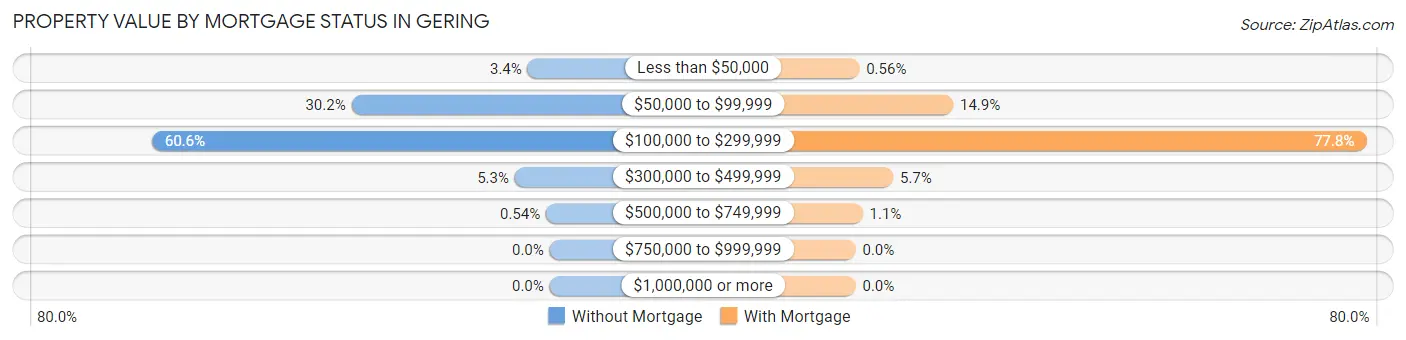
| Property Value | Without Mortgage | With Mortgage |
| Less than $50,000 | 31 (3.4%) | 9 (0.6%) |
| $50,000 to $99,999 | 279 (30.2%) | 237 (14.9%) |
| $100,000 to $299,999 | 560 (60.6%) | 1,241 (77.8%) |
| $300,000 to $499,999 | 49 (5.3%) | 91 (5.7%) |
| $500,000 to $749,999 | 5 (0.5%) | 17 (1.1%) |
| $750,000 to $999,999 | 0 (0.0%) | 0 (0.0%) |
| $1,000,000 or more | 0 (0.0%) | 0 (0.0%) |
| Total | 924 (100.0%) | 1,595 (100.0%) |
Household Income by Mortgage Status in Gering
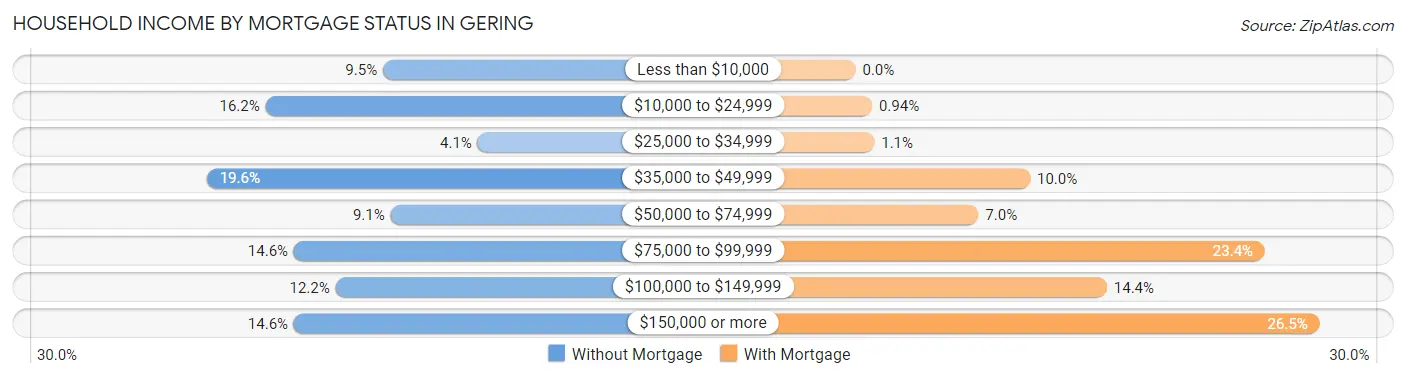
| Household Income | Without Mortgage | With Mortgage |
| Less than $10,000 | 88 (9.5%) | 0 (0.0%) |
| $10,000 to $24,999 | 150 (16.2%) | 15 (0.9%) |
| $25,000 to $34,999 | 38 (4.1%) | 17 (1.1%) |
| $35,000 to $49,999 | 181 (19.6%) | 159 (10.0%) |
| $50,000 to $74,999 | 84 (9.1%) | 112 (7.0%) |
| $75,000 to $99,999 | 135 (14.6%) | 373 (23.4%) |
| $100,000 to $149,999 | 113 (12.2%) | 229 (14.4%) |
| $150,000 or more | 135 (14.6%) | 423 (26.5%) |
| Total | 924 (100.0%) | 1,595 (100.0%) |
Property Value to Household Income Ratio in Gering
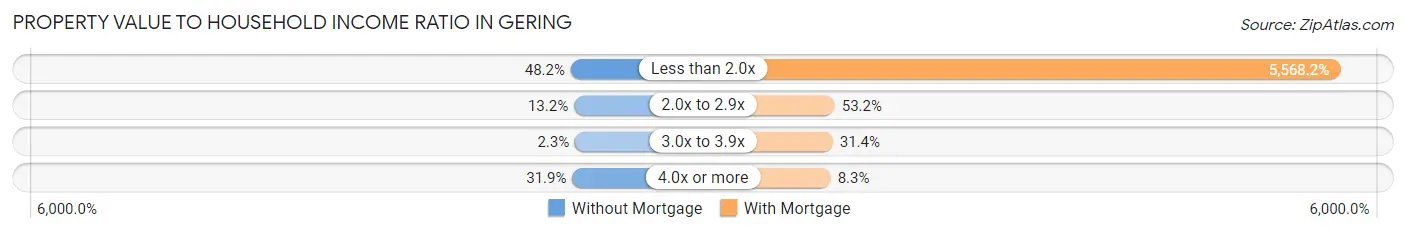
| Value-to-Income Ratio | Without Mortgage | With Mortgage |
| Less than 2.0x | 445 (48.2%) | 88,813 (5,568.2%) |
| 2.0x to 2.9x | 122 (13.2%) | 848 (53.2%) |
| 3.0x to 3.9x | 21 (2.3%) | 500 (31.4%) |
| 4.0x or more | 295 (31.9%) | 133 (8.3%) |
| Total | 924 (100.0%) | 1,595 (100.0%) |
Real Estate Taxes by Mortgage Status in Gering
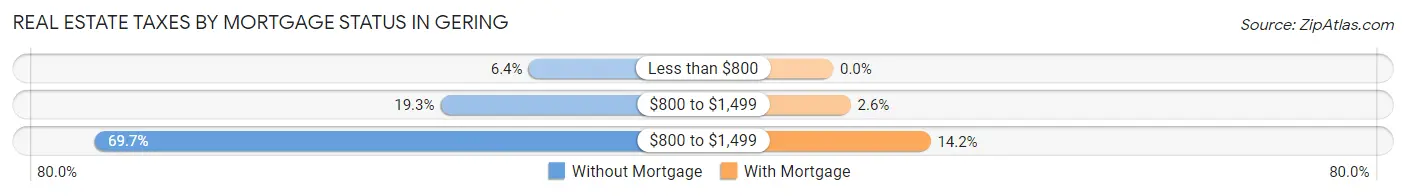
| Property Taxes | Without Mortgage | With Mortgage |
| Less than $800 | 59 (6.4%) | 0 (0.0%) |
| $800 to $1,499 | 178 (19.3%) | 41 (2.6%) |
| $800 to $1,499 | 644 (69.7%) | 227 (14.2%) |
| Total | 924 (100.0%) | 1,595 (100.0%) |
Health & Disability in Gering
Health Insurance Coverage by Age in Gering
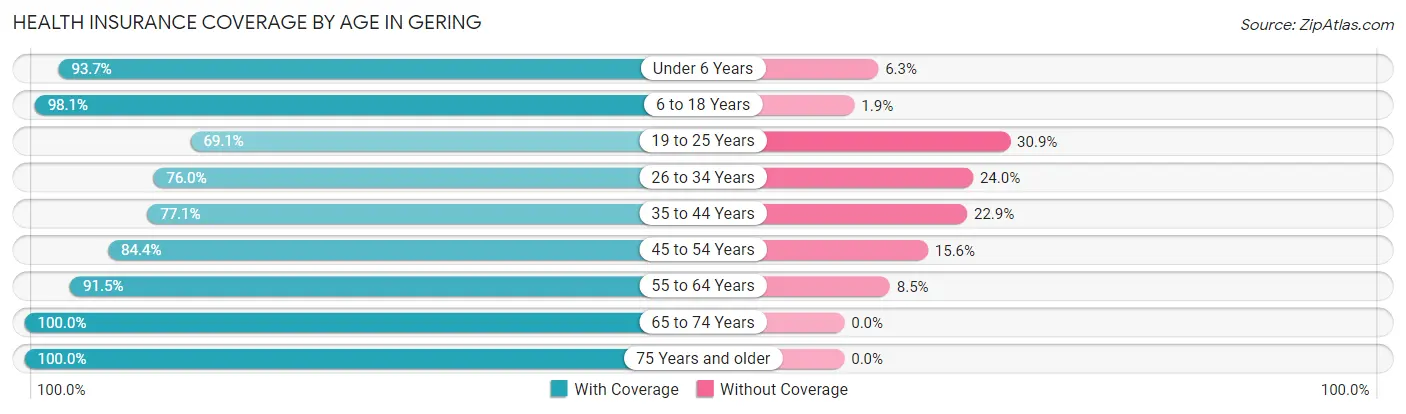
| Age Bracket | With Coverage | Without Coverage |
| Under 6 Years | 637 (93.7%) | 43 (6.3%) |
| 6 to 18 Years | 1,766 (98.1%) | 34 (1.9%) |
| 19 to 25 Years | 326 (69.1%) | 146 (30.9%) |
| 26 to 34 Years | 795 (76.0%) | 251 (24.0%) |
| 35 to 44 Years | 859 (77.1%) | 255 (22.9%) |
| 45 to 54 Years | 726 (84.4%) | 134 (15.6%) |
| 55 to 64 Years | 754 (91.5%) | 70 (8.5%) |
| 65 to 74 Years | 874 (100.0%) | 0 (0.0%) |
| 75 Years and older | 555 (100.0%) | 0 (0.0%) |
| Total | 7,292 (88.7%) | 933 (11.3%) |
Health Insurance Coverage by Citizenship Status in Gering
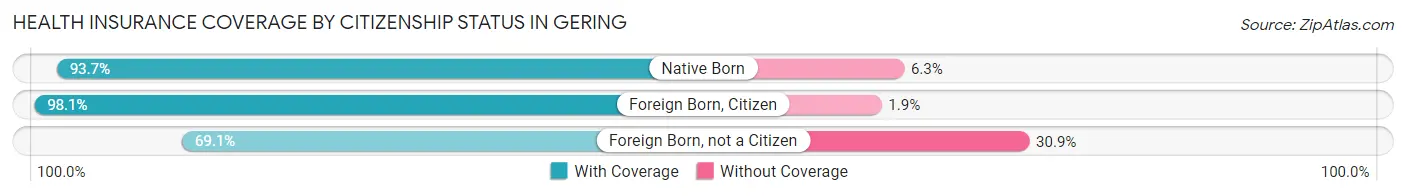
| Citizenship Status | With Coverage | Without Coverage |
| Native Born | 637 (93.7%) | 43 (6.3%) |
| Foreign Born, Citizen | 1,766 (98.1%) | 34 (1.9%) |
| Foreign Born, not a Citizen | 326 (69.1%) | 146 (30.9%) |
Health Insurance Coverage by Household Income in Gering
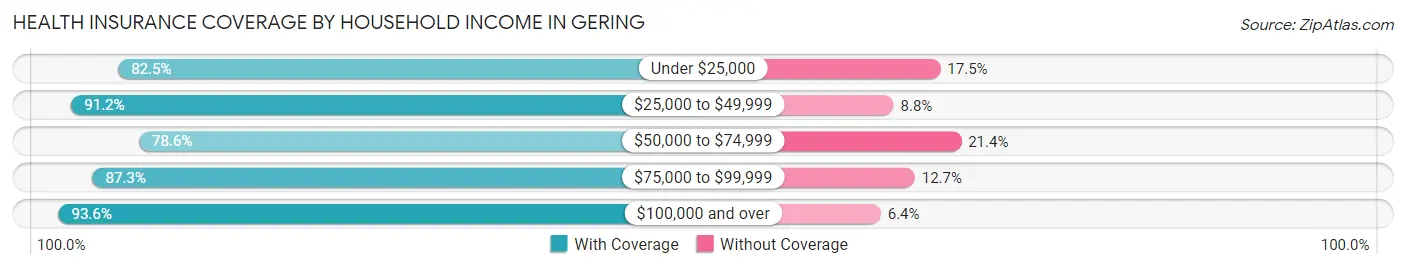
| Household Income | With Coverage | Without Coverage |
| Under $25,000 | 691 (82.5%) | 147 (17.5%) |
| $25,000 to $49,999 | 1,446 (91.2%) | 139 (8.8%) |
| $50,000 to $74,999 | 1,055 (78.6%) | 288 (21.4%) |
| $75,000 to $99,999 | 993 (87.3%) | 145 (12.7%) |
| $100,000 and over | 3,100 (93.6%) | 211 (6.4%) |
Public vs Private Health Insurance Coverage by Age in Gering
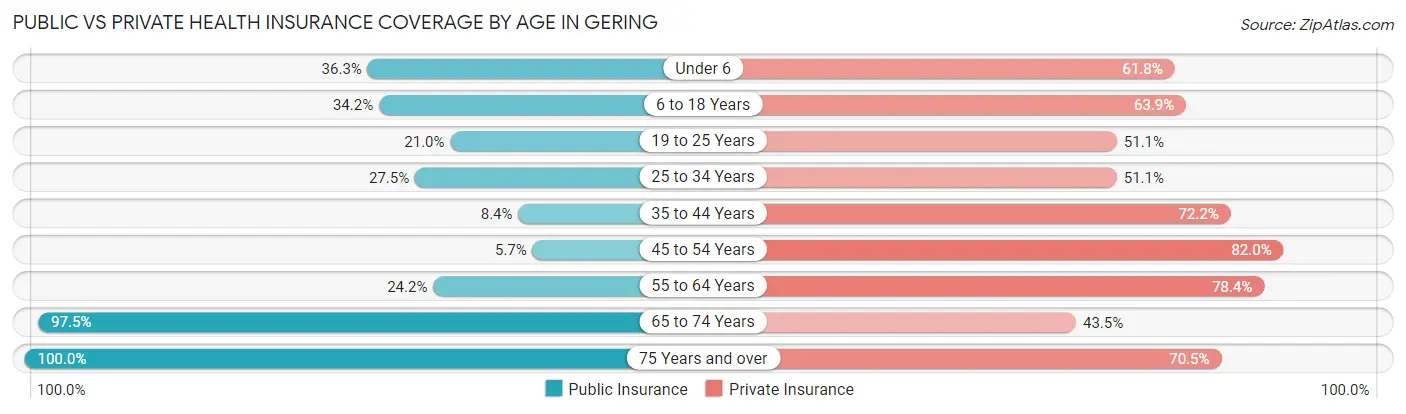
| Age Bracket | Public Insurance | Private Insurance |
| Under 6 | 247 (36.3%) | 420 (61.8%) |
| 6 to 18 Years | 616 (34.2%) | 1,150 (63.9%) |
| 19 to 25 Years | 99 (21.0%) | 241 (51.1%) |
| 25 to 34 Years | 288 (27.5%) | 534 (51.0%) |
| 35 to 44 Years | 93 (8.4%) | 804 (72.2%) |
| 45 to 54 Years | 49 (5.7%) | 705 (82.0%) |
| 55 to 64 Years | 199 (24.1%) | 646 (78.4%) |
| 65 to 74 Years | 852 (97.5%) | 380 (43.5%) |
| 75 Years and over | 555 (100.0%) | 391 (70.5%) |
| Total | 2,998 (36.4%) | 5,271 (64.1%) |
Disability Status by Sex by Age in Gering
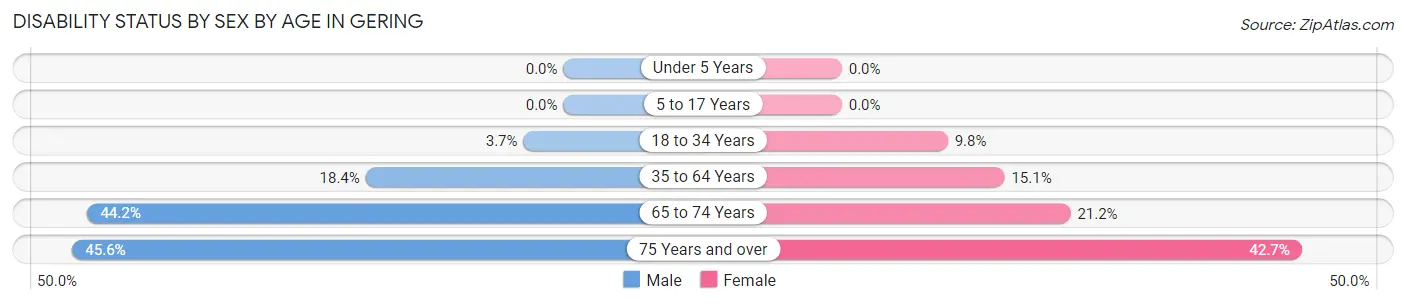
| Age Bracket | Male | Female |
| Under 5 Years | 0 (0.0%) | 0 (0.0%) |
| 5 to 17 Years | 0 (0.0%) | 0 (0.0%) |
| 18 to 34 Years | 34 (3.7%) | 69 (9.8%) |
| 35 to 64 Years | 251 (18.3%) | 216 (15.1%) |
| 65 to 74 Years | 155 (44.2%) | 111 (21.2%) |
| 75 Years and over | 113 (45.6%) | 131 (42.7%) |
Disability Class by Sex by Age in Gering
Disability Class: Hearing Difficulty
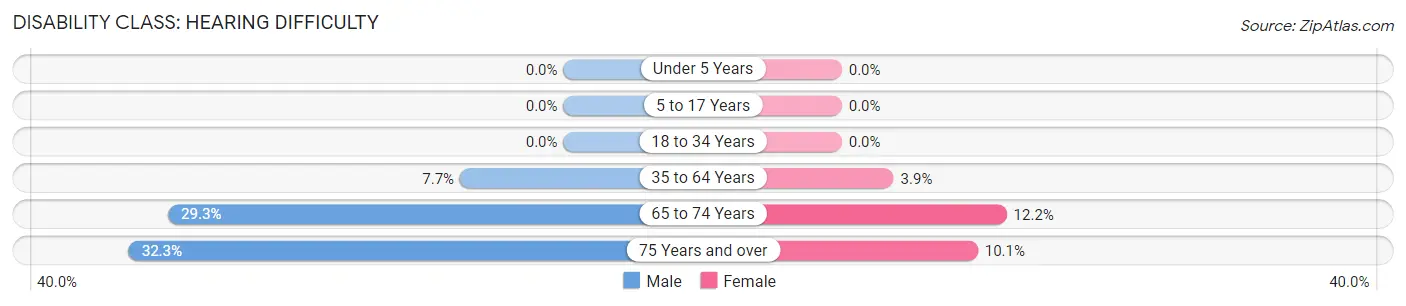
| Age Bracket | Male | Female |
| Under 5 Years | 0 (0.0%) | 0 (0.0%) |
| 5 to 17 Years | 0 (0.0%) | 0 (0.0%) |
| 18 to 34 Years | 0 (0.0%) | 0 (0.0%) |
| 35 to 64 Years | 105 (7.7%) | 55 (3.8%) |
| 65 to 74 Years | 103 (29.3%) | 64 (12.2%) |
| 75 Years and over | 80 (32.3%) | 31 (10.1%) |
Disability Class: Vision Difficulty
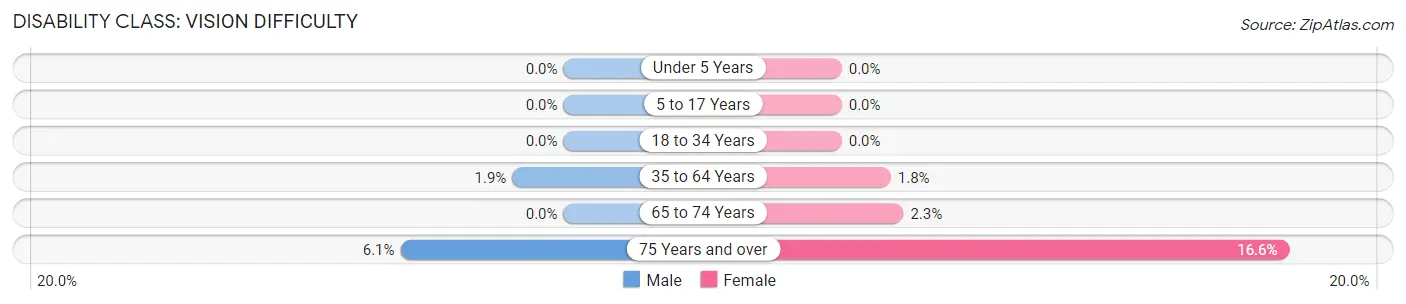
| Age Bracket | Male | Female |
| Under 5 Years | 0 (0.0%) | 0 (0.0%) |
| 5 to 17 Years | 0 (0.0%) | 0 (0.0%) |
| 18 to 34 Years | 0 (0.0%) | 0 (0.0%) |
| 35 to 64 Years | 26 (1.9%) | 26 (1.8%) |
| 65 to 74 Years | 0 (0.0%) | 12 (2.3%) |
| 75 Years and over | 15 (6.0%) | 51 (16.6%) |
Disability Class: Cognitive Difficulty
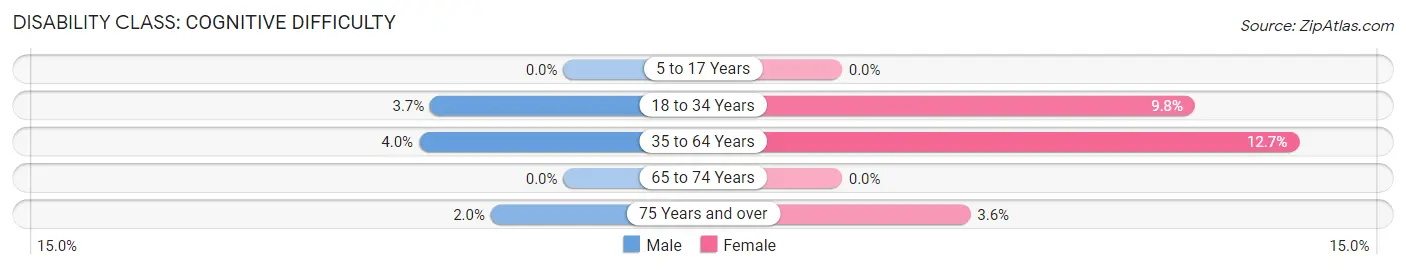
| Age Bracket | Male | Female |
| 5 to 17 Years | 0 (0.0%) | 0 (0.0%) |
| 18 to 34 Years | 34 (3.7%) | 69 (9.8%) |
| 35 to 64 Years | 55 (4.0%) | 182 (12.7%) |
| 65 to 74 Years | 0 (0.0%) | 0 (0.0%) |
| 75 Years and over | 5 (2.0%) | 11 (3.6%) |
Disability Class: Ambulatory Difficulty
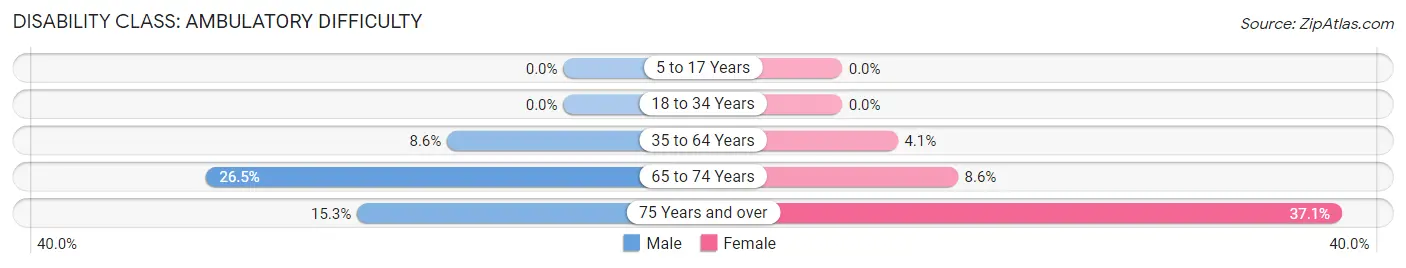
| Age Bracket | Male | Female |
| 5 to 17 Years | 0 (0.0%) | 0 (0.0%) |
| 18 to 34 Years | 0 (0.0%) | 0 (0.0%) |
| 35 to 64 Years | 118 (8.6%) | 59 (4.1%) |
| 65 to 74 Years | 93 (26.5%) | 45 (8.6%) |
| 75 Years and over | 38 (15.3%) | 114 (37.1%) |
Disability Class: Self-Care Difficulty
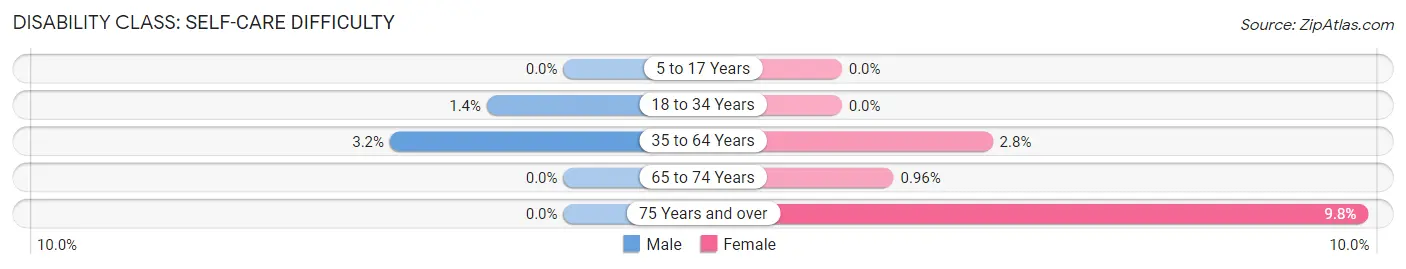
| Age Bracket | Male | Female |
| 5 to 17 Years | 0 (0.0%) | 0 (0.0%) |
| 18 to 34 Years | 13 (1.4%) | 0 (0.0%) |
| 35 to 64 Years | 44 (3.2%) | 40 (2.8%) |
| 65 to 74 Years | 0 (0.0%) | 5 (1.0%) |
| 75 Years and over | 0 (0.0%) | 30 (9.8%) |
Technology Access in Gering
Computing Device Access in Gering
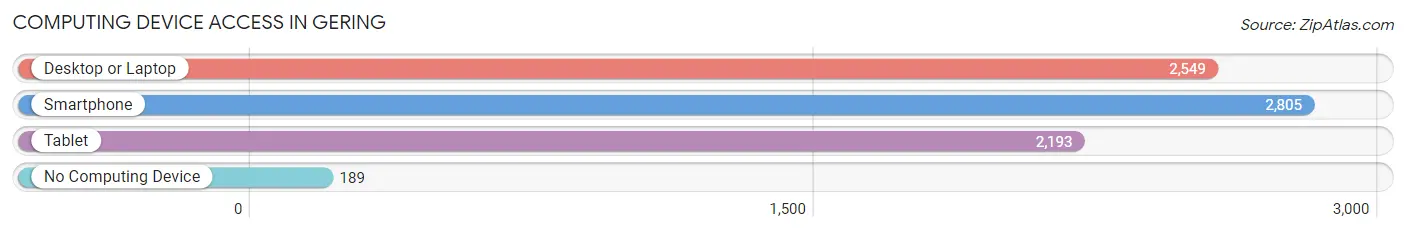
| Device Type | # Households | % Households |
| Desktop or Laptop | 2,549 | 75.3% |
| Smartphone | 2,805 | 82.9% |
| Tablet | 2,193 | 64.8% |
| No Computing Device | 189 | 5.6% |
| Total | 3,384 | 100.0% |
Internet Access in Gering
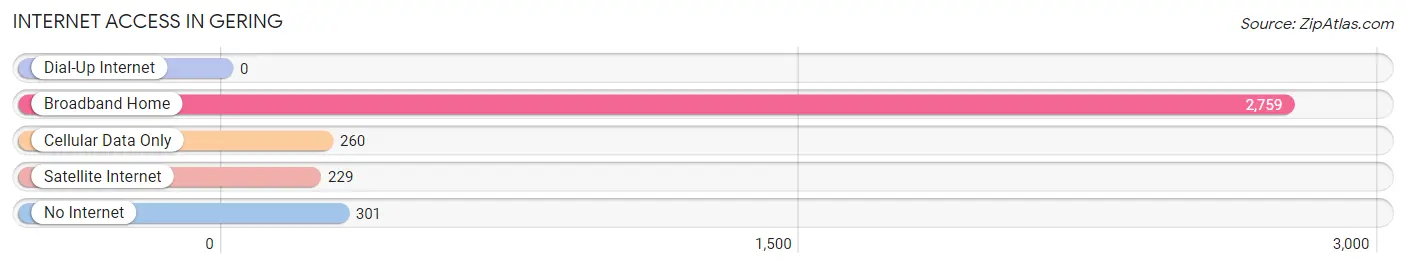
| Internet Type | # Households | % Households |
| Dial-Up Internet | 0 | 0.0% |
| Broadband Home | 2,759 | 81.5% |
| Cellular Data Only | 260 | 7.7% |
| Satellite Internet | 229 | 6.8% |
| No Internet | 301 | 8.9% |
| Total | 3,384 | 100.0% |
Gering Summary
Gering is a city located in the western part of the state of Nebraska in the United States. It is the county seat of Scotts Bluff County and is located along the North Platte River. The city has a population of approximately 8,500 people and is part of the Scottsbluff, Nebraska Metropolitan Statistical Area.
History
Gering was founded in 1887 by the Union Pacific Railroad. The city was named after the German city of Gering, which was the hometown of one of the railroad's engineers. The city quickly grew and by 1890, it had a population of over 1,000 people.
Gering was an important stop on the Oregon Trail, and many of the original settlers in the area were pioneers who had traveled the trail. The city was also an important stop for the Pony Express and the Union Pacific Railroad.
In the early 1900s, Gering became an important agricultural center. The city was home to several large farms and ranches, and it was also the site of the first sugar beet factory in the state of Nebraska.
Geography
Gering is located in the western part of Nebraska, along the North Platte River. The city is situated at an elevation of 3,845 feet above sea level. The city is located in the High Plains region of the Great Plains, and it is surrounded by rolling hills and prairies.
The climate in Gering is semi-arid, with hot summers and cold winters. The average annual temperature is around 50 degrees Fahrenheit, and the average annual precipitation is around 17 inches.
Economy
Gering's economy is largely based on agriculture and manufacturing. The city is home to several large farms and ranches, and it is also the site of the first sugar beet factory in the state of Nebraska.
The city is also home to several manufacturing companies, including a large meat packing plant and a plastics factory. Gering is also home to several retail stores, restaurants, and other businesses.
Demographics
As of the 2010 census, Gering had a population of 8,500 people. The racial makeup of the city was 90.3% White, 0.7% African American, 0.7% Native American, 0.7% Asian, 0.1% Pacific Islander, 5.2% from other races, and 2.2% from two or more races. Hispanic or Latino of any race were 11.2% of the population.
The median household income in Gering was $41,944, and the median family income was $50,944. The per capita income in Gering was $20,845. About 11.2% of families and 14.2% of the population were below the poverty line, including 19.2% of those under age 18 and 8.2% of those age 65 or over.
Common Questions
What is Per Capita Income in Gering?
Per Capita income in Gering is $33,853.
What is the Median Family Income in Gering?
Median Family Income in Gering is $82,946.
What is the Median Household income in Gering?
Median Household Income in Gering is $65,743.
What is Income or Wage Gap in Gering?
Income or Wage Gap in Gering is 20.9%.
Women in Gering earn 79.1 cents for every dollar earned by a man.
What is Family Income Deficit in Gering?
Family Income Deficit in Gering is $9,235.
Families that are below poverty line in Gering earn $9,235 less on average than the poverty threshold level.
What is Inequality or Gini Index in Gering?
Inequality or Gini Index in Gering is 0.45.
What is the Total Population of Gering?
Total Population of Gering is 8,582.
What is the Total Male Population of Gering?
Total Male Population of Gering is 4,252.
What is the Total Female Population of Gering?
Total Female Population of Gering is 4,330.
What is the Ratio of Males per 100 Females in Gering?
There are 98.20 Males per 100 Females in Gering.
What is the Ratio of Females per 100 Males in Gering?
There are 101.83 Females per 100 Males in Gering.
What is the Median Population Age in Gering?
Median Population Age in Gering is 36.1 Years.
What is the Average Family Size in Gering
Average Family Size in Gering is 3.0 People.
What is the Average Household Size in Gering
Average Household Size in Gering is 2.4 People.
How Large is the Labor Force in Gering?
There are 4,229 People in the Labor Forcein in Gering.
What is the Percentage of People in the Labor Force in Gering?
64.5% of People are in the Labor Force in Gering.
What is the Unemployment Rate in Gering?
Unemployment Rate in Gering is 2.3%.