Staplehurst, NE Map & Demographics
Staplehurst Map
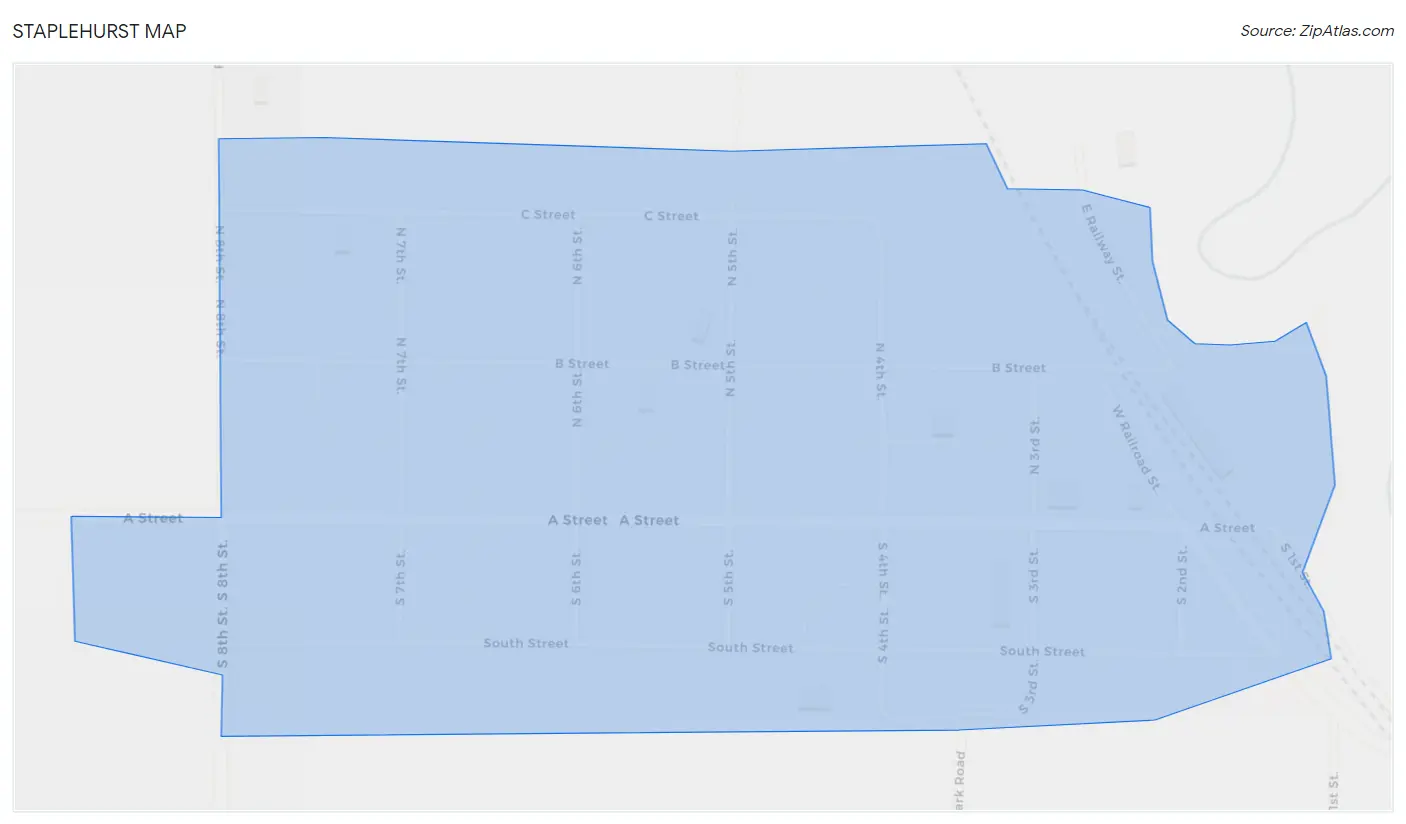
Staplehurst Overview
$37,123
PER CAPITA INCOME
$76,667
AVG FAMILY INCOME
$77,644
AVG HOUSEHOLD INCOME
33.1%
WAGE / INCOME GAP [ % ]
66.9¢/ $1
WAGE / INCOME GAP [ $ ]
0.28
INEQUALITY / GINI INDEX
313
TOTAL POPULATION
175
MALE POPULATION
138
FEMALE POPULATION
126.81
MALES / 100 FEMALES
78.86
FEMALES / 100 MALES
38.9
MEDIAN AGE
2.4
AVG FAMILY SIZE
2.0
AVG HOUSEHOLD SIZE
204
LABOR FORCE [ PEOPLE ]
81.9%
PERCENT IN LABOR FORCE
1.0%
UNEMPLOYMENT RATE
Staplehurst Zip Codes
Staplehurst Area Codes
Income in Staplehurst
Income Overview in Staplehurst
Per Capita Income in Staplehurst is $37,123, while median incomes of families and households are $76,667 and $77,644 respectively.
| Characteristic | Number | Measure |
| Per Capita Income | 313 | $37,123 |
| Median Family Income | 106 | $76,667 |
| Mean Family Income | 106 | $80,863 |
| Median Household Income | 157 | $77,644 |
| Mean Household Income | 157 | $74,335 |
| Income Deficit | 106 | $0 |
| Wage / Income Gap (%) | 313 | 33.10% |
| Wage / Income Gap ($) | 313 | 66.90¢ per $1 |
| Gini / Inequality Index | 313 | 0.28 |
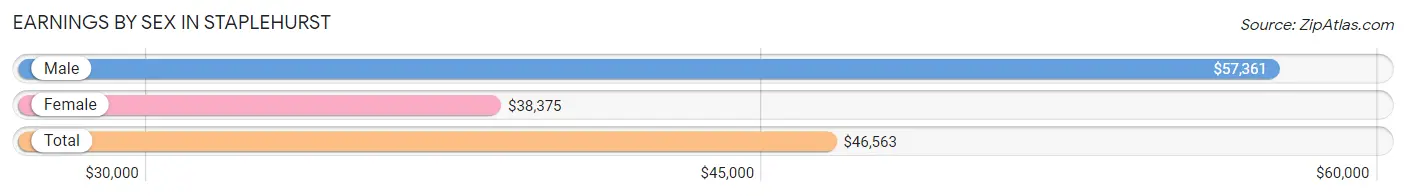
Earnings by Sex in Staplehurst
Average Earnings in Staplehurst are $46,563, $57,361 for men and $38,375 for women, a difference of 33.1%.
| Sex | Number | Average Earnings |
| Male | 123 (58.6%) | $57,361 |
| Female | 87 (41.4%) | $38,375 |
| Total | 210 (100.0%) | $46,563 |
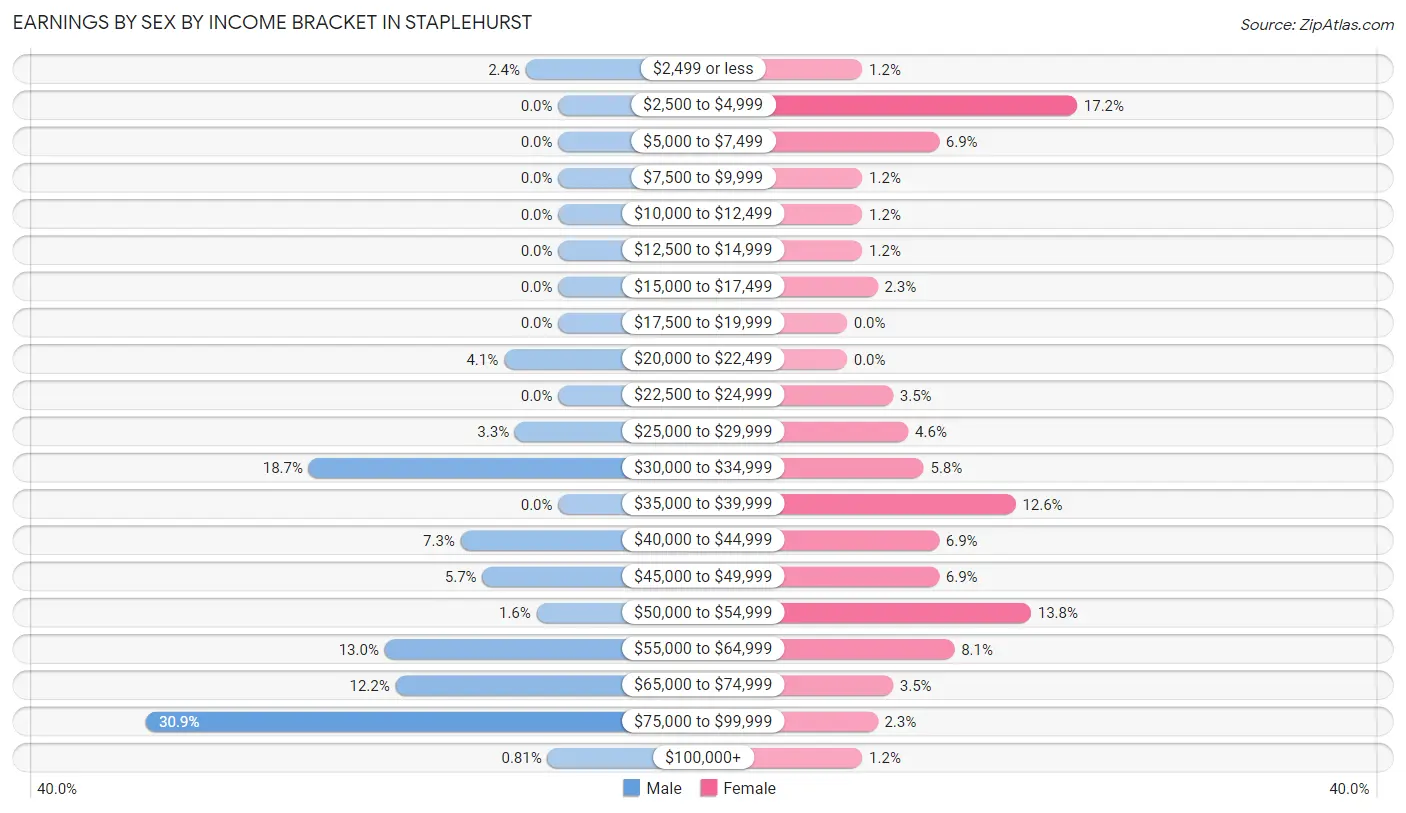
Earnings by Sex by Income Bracket in Staplehurst
The most common earnings brackets in Staplehurst are $75,000 to $99,999 for men (38 | 30.9%) and $2,500 to $4,999 for women (15 | 17.2%).
| Income | Male | Female |
| $2,499 or less | 3 (2.4%) | 1 (1.1%) |
| $2,500 to $4,999 | 0 (0.0%) | 15 (17.2%) |
| $5,000 to $7,499 | 0 (0.0%) | 6 (6.9%) |
| $7,500 to $9,999 | 0 (0.0%) | 1 (1.1%) |
| $10,000 to $12,499 | 0 (0.0%) | 1 (1.1%) |
| $12,500 to $14,999 | 0 (0.0%) | 1 (1.1%) |
| $15,000 to $17,499 | 0 (0.0%) | 2 (2.3%) |
| $17,500 to $19,999 | 0 (0.0%) | 0 (0.0%) |
| $20,000 to $22,499 | 5 (4.1%) | 0 (0.0%) |
| $22,500 to $24,999 | 0 (0.0%) | 3 (3.5%) |
| $25,000 to $29,999 | 4 (3.3%) | 4 (4.6%) |
| $30,000 to $34,999 | 23 (18.7%) | 5 (5.8%) |
| $35,000 to $39,999 | 0 (0.0%) | 11 (12.6%) |
| $40,000 to $44,999 | 9 (7.3%) | 6 (6.9%) |
| $45,000 to $49,999 | 7 (5.7%) | 6 (6.9%) |
| $50,000 to $54,999 | 2 (1.6%) | 12 (13.8%) |
| $55,000 to $64,999 | 16 (13.0%) | 7 (8.1%) |
| $65,000 to $74,999 | 15 (12.2%) | 3 (3.5%) |
| $75,000 to $99,999 | 38 (30.9%) | 2 (2.3%) |
| $100,000+ | 1 (0.8%) | 1 (1.1%) |
| Total | 123 (100.0%) | 87 (100.0%) |
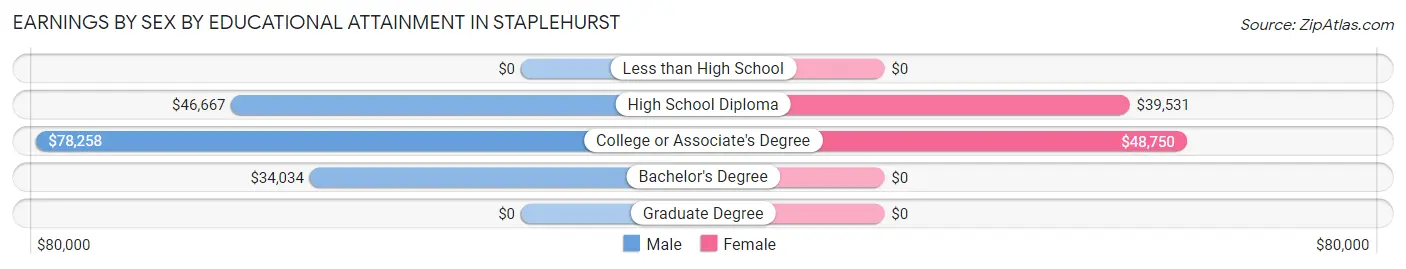
Earnings by Sex by Educational Attainment in Staplehurst
Average earnings in Staplehurst are $60,250 for men and $41,667 for women, a difference of 30.8%. Men with an educational attainment of college or associate's degree enjoy the highest average annual earnings of $78,258, while those with bachelor's degree education earn the least with $34,034. Women with an educational attainment of college or associate's degree earn the most with the average annual earnings of $48,750, while those with high school diploma education have the smallest earnings of $39,531.
| Educational Attainment | Male Income | Female Income |
| Less than High School | - | - |
| High School Diploma | $46,667 | $39,531 |
| College or Associate's Degree | $78,258 | $48,750 |
| Bachelor's Degree | $34,034 | $0 |
| Graduate Degree | - | - |
| Total | $60,250 | $41,667 |
Family Income in Staplehurst
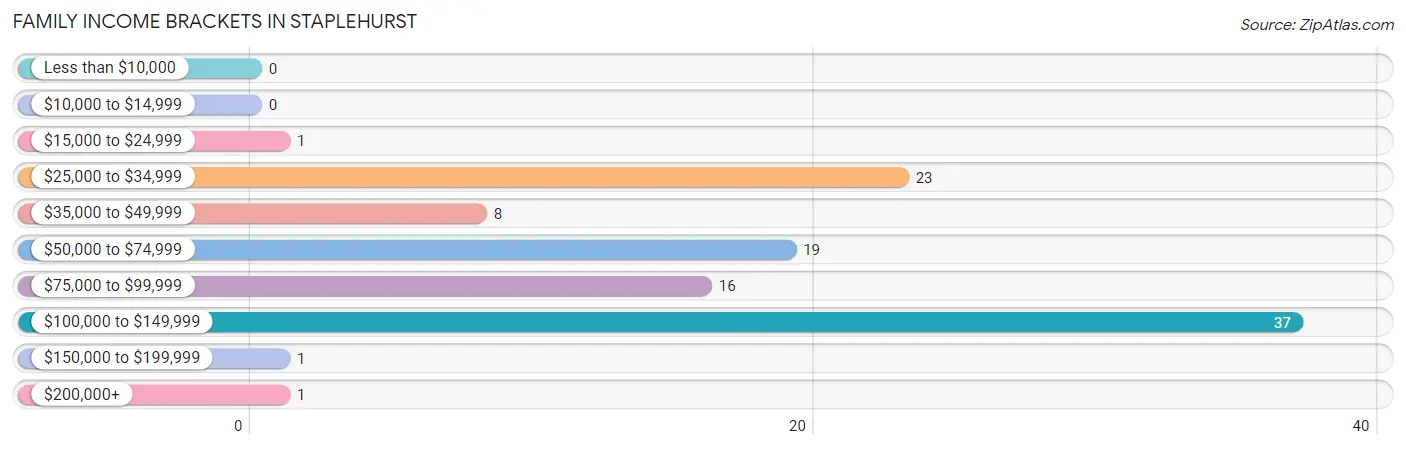
Family Income Brackets in Staplehurst
According to the Staplehurst family income data, there are 37 families falling into the $100,000 to $149,999 income range, which is the most common income bracket and makes up 34.9% of all families.
| Income Bracket | # Families | % Families |
| Less than $10,000 | 0 | 0.0% |
| $10,000 to $14,999 | 0 | 0.0% |
| $15,000 to $24,999 | 1 | 0.9% |
| $25,000 to $34,999 | 23 | 21.7% |
| $35,000 to $49,999 | 8 | 7.5% |
| $50,000 to $74,999 | 19 | 17.9% |
| $75,000 to $99,999 | 16 | 15.1% |
| $100,000 to $149,999 | 37 | 34.9% |
| $150,000 to $199,999 | 1 | 0.9% |
| $200,000+ | 1 | 0.9% |
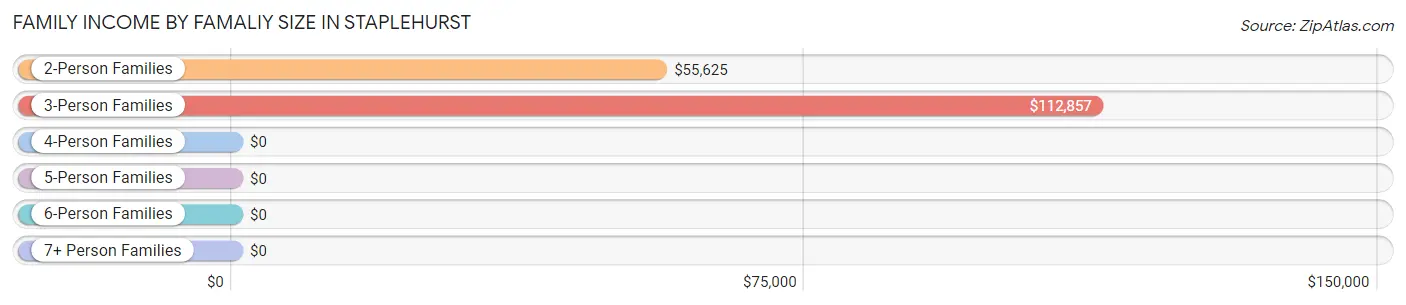
Family Income by Famaliy Size in Staplehurst
3-person families (24 | 22.6%) account for the highest median family income in Staplehurst with $112,857 per family, while 3-person families (24 | 22.6%) have the highest median income of $37,619 per family member.
| Income Bracket | # Families | Median Income |
| 2-Person Families | 64 (60.4%) | $55,625 |
| 3-Person Families | 24 (22.6%) | $112,857 |
| 4-Person Families | 11 (10.4%) | $0 |
| 5-Person Families | 5 (4.7%) | $0 |
| 6-Person Families | 1 (0.9%) | $0 |
| 7+ Person Families | 1 (0.9%) | $0 |
| Total | 106 (100.0%) | $76,667 |
Family Income by Number of Earners in Staplehurst
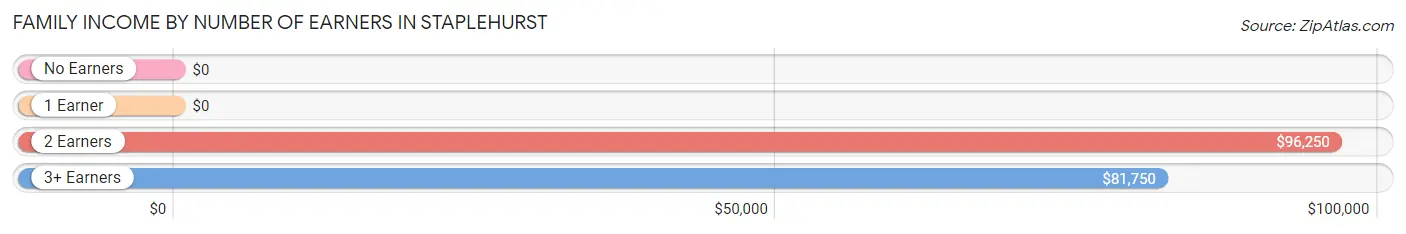
| Number of Earners | # Families | Median Income |
| No Earners | 5 (4.7%) | $0 |
| 1 Earner | 38 (35.8%) | $0 |
| 2 Earners | 54 (50.9%) | $96,250 |
| 3+ Earners | 9 (8.5%) | $81,750 |
| Total | 106 (100.0%) | $76,667 |
Household Income in Staplehurst
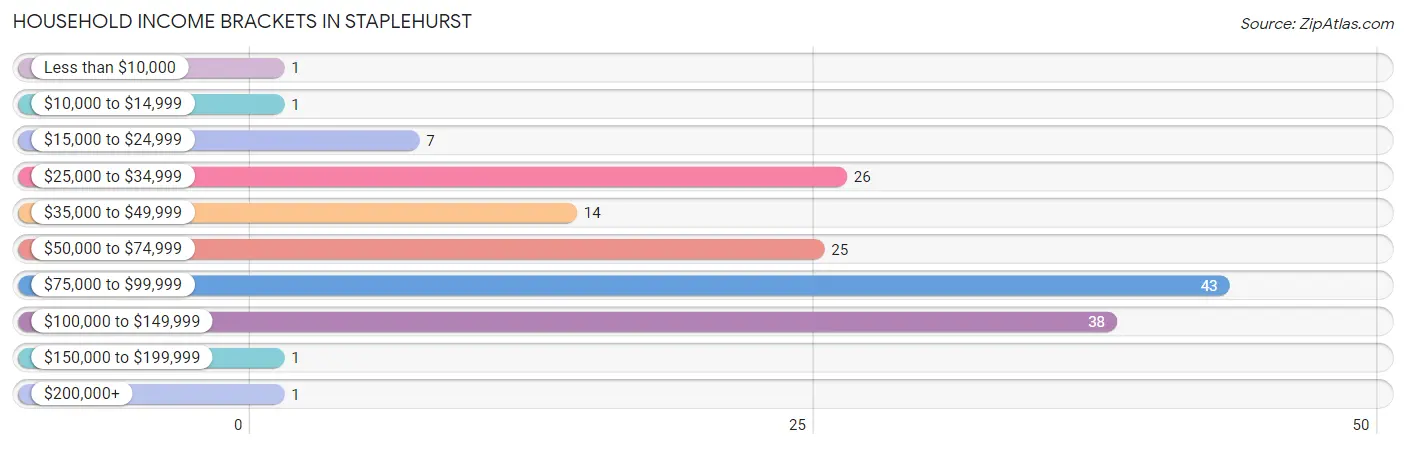
Household Income Brackets in Staplehurst
With 43 households falling in the category, the $75,000 to $99,999 income range is the most frequent in Staplehurst, accounting for 27.4% of all households. In contrast, only 1 households (0.6%) fall into the less than $10,000 income bracket, making it the least populous group.
| Income Bracket | # Households | % Households |
| Less than $10,000 | 1 | 0.6% |
| $10,000 to $14,999 | 1 | 0.6% |
| $15,000 to $24,999 | 7 | 4.5% |
| $25,000 to $34,999 | 26 | 16.6% |
| $35,000 to $49,999 | 14 | 8.9% |
| $50,000 to $74,999 | 25 | 15.9% |
| $75,000 to $99,999 | 43 | 27.4% |
| $100,000 to $149,999 | 38 | 24.2% |
| $150,000 to $199,999 | 1 | 0.6% |
| $200,000+ | 1 | 0.6% |
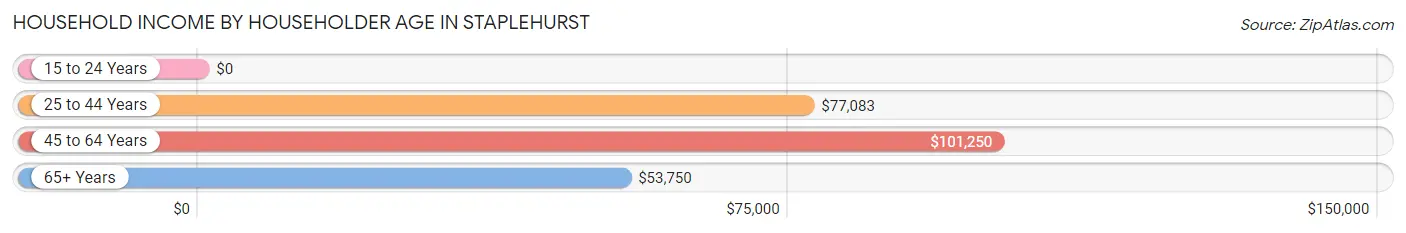
Household Income by Householder Age in Staplehurst
The median household income in Staplehurst is $77,644, with the highest median household income of $101,250 found in the 45 to 64 years age bracket for the primary householder. A total of 38 households (24.2%) fall into this category.
| Income Bracket | # Households | Median Income |
| 15 to 24 Years | 0 (0.0%) | $0 |
| 25 to 44 Years | 95 (60.5%) | $77,083 |
| 45 to 64 Years | 38 (24.2%) | $101,250 |
| 65+ Years | 24 (15.3%) | $53,750 |
| Total | 157 (100.0%) | $77,644 |
Poverty in Staplehurst
Income Below Poverty by Sex and Age in Staplehurst
With 1.7% poverty level for males and 4.6% for females among the residents of Staplehurst, 6 to 11 year old males and 75 year old and over females are the most vulnerable to poverty, with 3 males (14.3%) and 1 females (33.3%) in their respective age groups living below the poverty level.
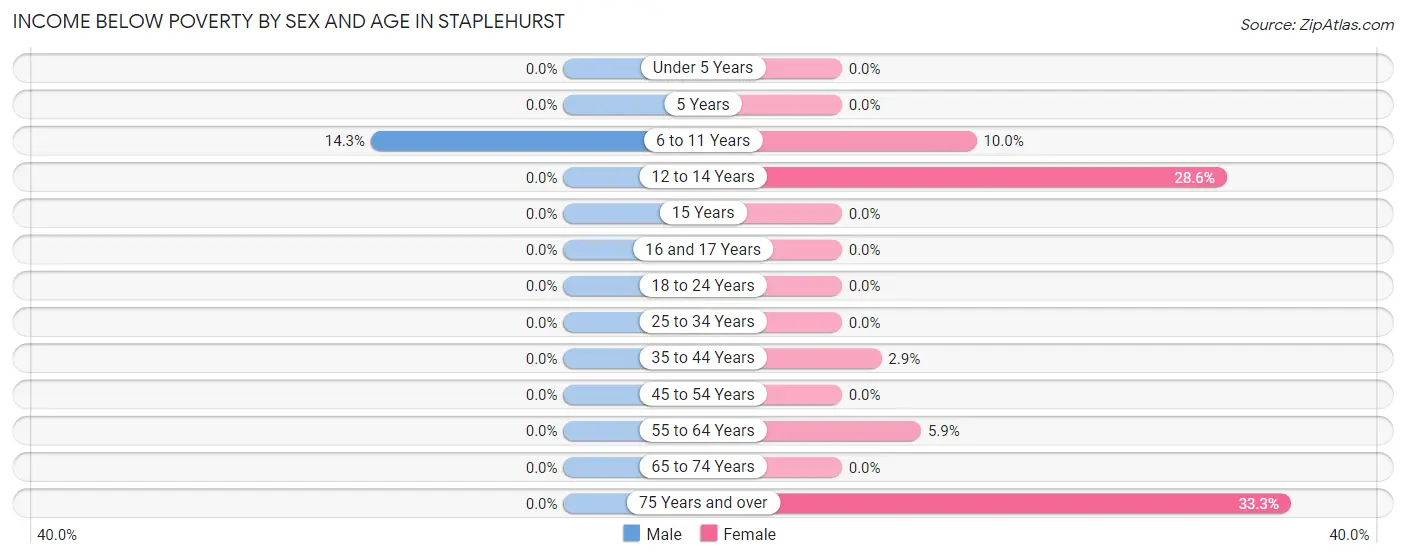
| Age Bracket | Male | Female |
| Under 5 Years | 0 (0.0%) | 0 (0.0%) |
| 5 Years | 0 (0.0%) | 0 (0.0%) |
| 6 to 11 Years | 3 (14.3%) | 1 (10.0%) |
| 12 to 14 Years | 0 (0.0%) | 2 (28.6%) |
| 15 Years | 0 (0.0%) | 0 (0.0%) |
| 16 and 17 Years | 0 (0.0%) | 0 (0.0%) |
| 18 to 24 Years | 0 (0.0%) | 0 (0.0%) |
| 25 to 34 Years | 0 (0.0%) | 0 (0.0%) |
| 35 to 44 Years | 0 (0.0%) | 1 (2.9%) |
| 45 to 54 Years | 0 (0.0%) | 0 (0.0%) |
| 55 to 64 Years | 0 (0.0%) | 1 (5.9%) |
| 65 to 74 Years | 0 (0.0%) | 0 (0.0%) |
| 75 Years and over | 0 (0.0%) | 1 (33.3%) |
| Total | 3 (1.7%) | 6 (4.6%) |
Income Above Poverty by Sex and Age in Staplehurst
According to the poverty statistics in Staplehurst, males aged under 5 years and females aged 5 years are the age groups that are most secure financially, with 100.0% of males and 100.0% of females in these age groups living above the poverty line.
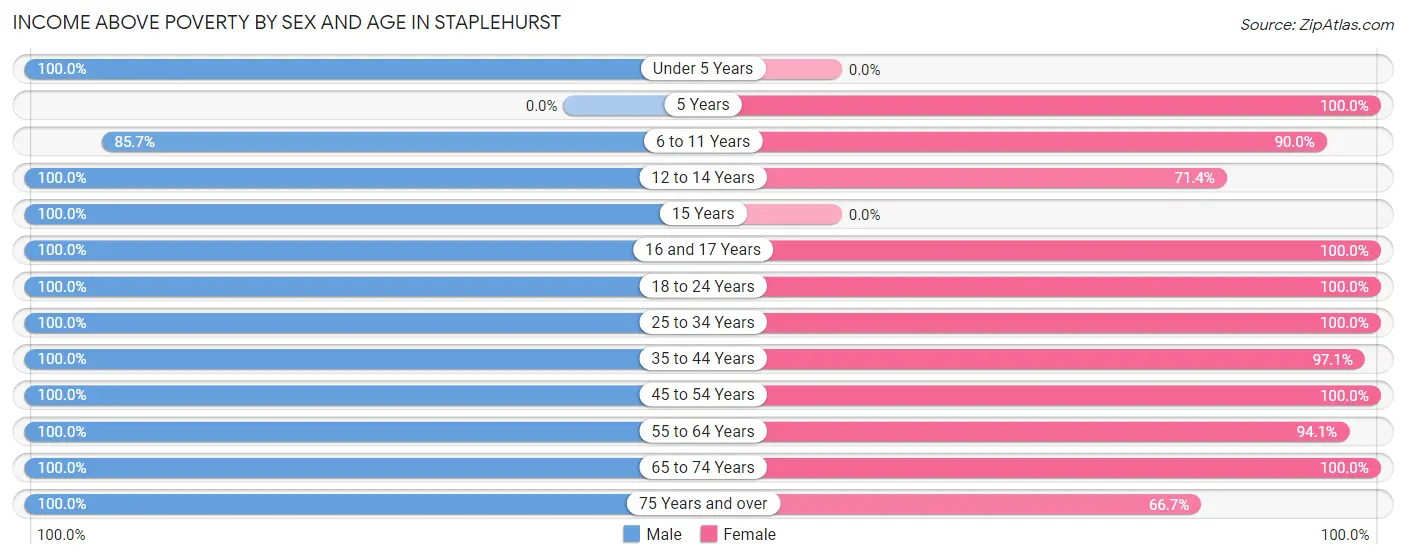
| Age Bracket | Male | Female |
| Under 5 Years | 6 (100.0%) | 0 (0.0%) |
| 5 Years | 0 (0.0%) | 3 (100.0%) |
| 6 to 11 Years | 18 (85.7%) | 9 (90.0%) |
| 12 to 14 Years | 8 (100.0%) | 5 (71.4%) |
| 15 Years | 1 (100.0%) | 0 (0.0%) |
| 16 and 17 Years | 3 (100.0%) | 9 (100.0%) |
| 18 to 24 Years | 3 (100.0%) | 9 (100.0%) |
| 25 to 34 Years | 25 (100.0%) | 5 (100.0%) |
| 35 to 44 Years | 61 (100.0%) | 33 (97.1%) |
| 45 to 54 Years | 16 (100.0%) | 13 (100.0%) |
| 55 to 64 Years | 13 (100.0%) | 16 (94.1%) |
| 65 to 74 Years | 11 (100.0%) | 20 (100.0%) |
| 75 Years and over | 7 (100.0%) | 2 (66.7%) |
| Total | 172 (98.3%) | 124 (95.4%) |
Income Below Poverty Among Married-Couple Families in Staplehurst
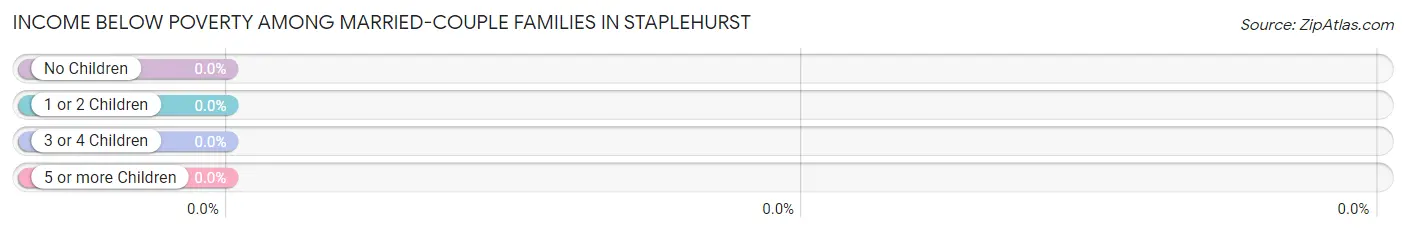
| Children | Above Poverty | Below Poverty |
| No Children | 40 (100.0%) | 0 (0.0%) |
| 1 or 2 Children | 28 (100.0%) | 0 (0.0%) |
| 3 or 4 Children | 1 (100.0%) | 0 (0.0%) |
| 5 or more Children | 0 (0.0%) | 0 (0.0%) |
| Total | 69 (100.0%) | 0 (0.0%) |
Income Below Poverty Among Single-Parent Households in Staplehurst
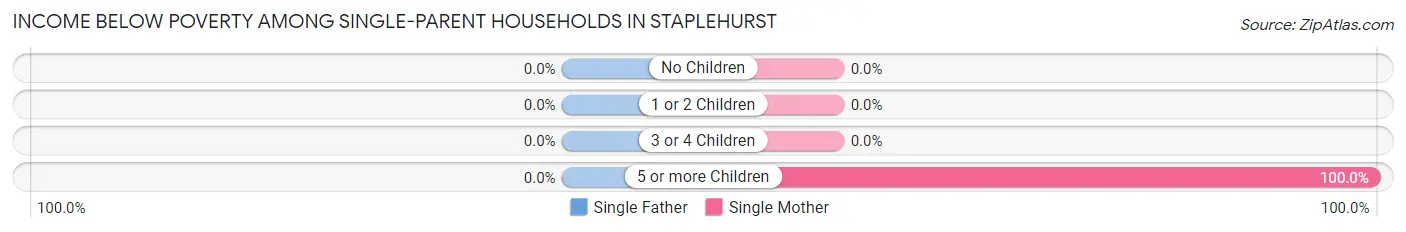
| Children | Single Father | Single Mother |
| No Children | 0 (0.0%) | 0 (0.0%) |
| 1 or 2 Children | 0 (0.0%) | 0 (0.0%) |
| 3 or 4 Children | 0 (0.0%) | 0 (0.0%) |
| 5 or more Children | 0 (0.0%) | 1 (100.0%) |
| Total | 0 (0.0%) | 1 (8.3%) |
Income Below Poverty Among Married-Couple vs Single-Parent Households in Staplehurst
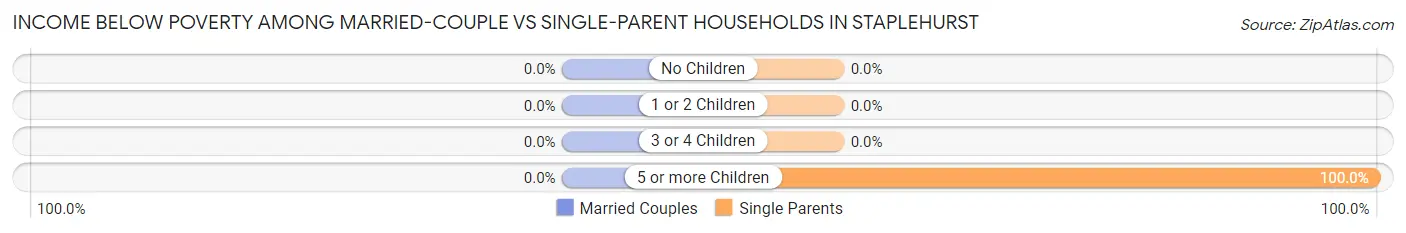
| Children | Married-Couple Families | Single-Parent Households |
| No Children | 0 (0.0%) | 0 (0.0%) |
| 1 or 2 Children | 0 (0.0%) | 0 (0.0%) |
| 3 or 4 Children | 0 (0.0%) | 0 (0.0%) |
| 5 or more Children | 0 (0.0%) | 1 (100.0%) |
| Total | 0 (0.0%) | 1 (2.7%) |
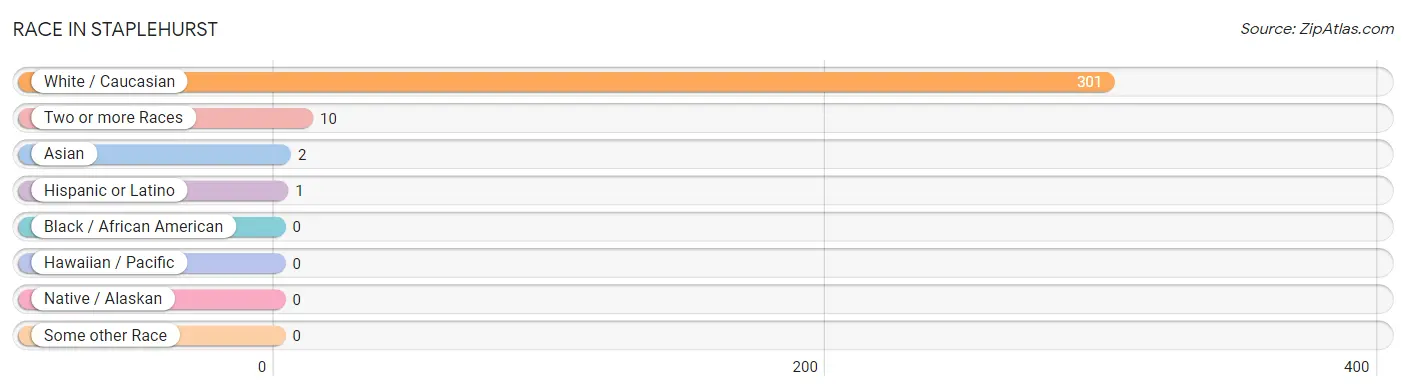
Race in Staplehurst
The most populous races in Staplehurst are White / Caucasian (301 | 96.2%), Two or more Races (10 | 3.2%), and Asian (2 | 0.6%).
| Race | # Population | % Population |
| Asian | 2 | 0.6% |
| Black / African American | 0 | 0.0% |
| Hawaiian / Pacific | 0 | 0.0% |
| Hispanic or Latino | 1 | 0.3% |
| Native / Alaskan | 0 | 0.0% |
| White / Caucasian | 301 | 96.2% |
| Two or more Races | 10 | 3.2% |
| Some other Race | 0 | 0.0% |
| Total | 313 | 100.0% |
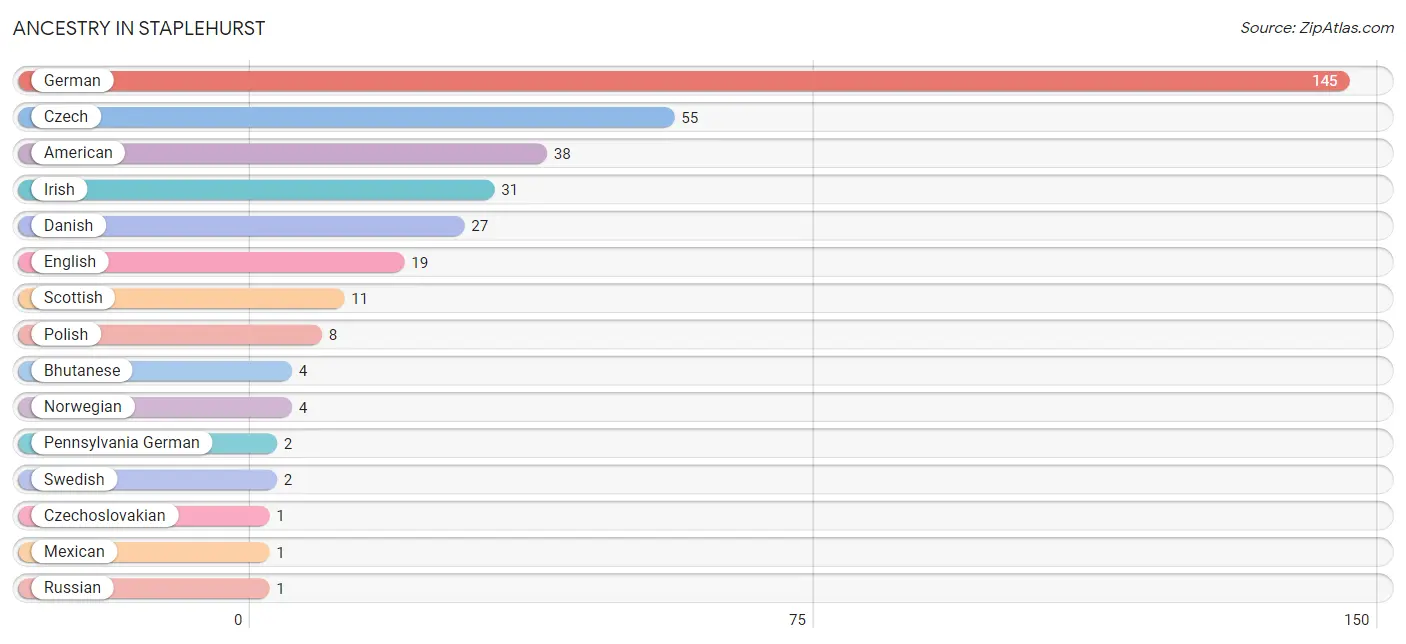
Ancestry in Staplehurst
The most populous ancestries reported in Staplehurst are German (145 | 46.3%), Czech (55 | 17.6%), American (38 | 12.1%), Irish (31 | 9.9%), and Danish (27 | 8.6%), together accounting for 94.6% of all Staplehurst residents.
| Ancestry | # Population | % Population |
| American | 38 | 12.1% |
| Bhutanese | 4 | 1.3% |
| Czech | 55 | 17.6% |
| Czechoslovakian | 1 | 0.3% |
| Danish | 27 | 8.6% |
| English | 19 | 6.1% |
| German | 145 | 46.3% |
| Irish | 31 | 9.9% |
| Mexican | 1 | 0.3% |
| Norwegian | 4 | 1.3% |
| Pennsylvania German | 2 | 0.6% |
| Polish | 8 | 2.6% |
| Russian | 1 | 0.3% |
| Scandinavian | 1 | 0.3% |
| Scottish | 11 | 3.5% |
| Serbian | 1 | 0.3% |
| Swedish | 2 | 0.6% |
| Welsh | 1 | 0.3% | View All 18 Rows |
Immigrants in Staplehurst
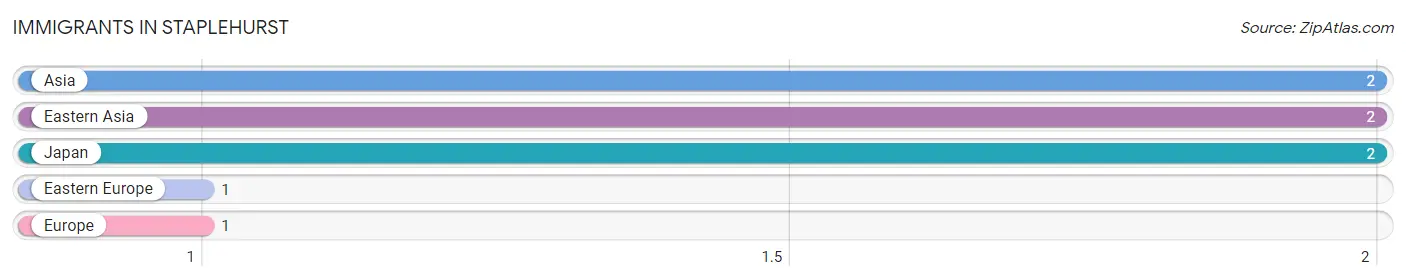
The most numerous immigrant groups reported in Staplehurst came from Asia (2 | 0.6%), Eastern Asia (2 | 0.6%), Japan (2 | 0.6%), Eastern Europe (1 | 0.3%), and Europe (1 | 0.3%), together accounting for 2.6% of all Staplehurst residents.
| Immigration Origin | # Population | % Population |
| Asia | 2 | 0.6% |
| Eastern Asia | 2 | 0.6% |
| Eastern Europe | 1 | 0.3% |
| Europe | 1 | 0.3% |
| Japan | 2 | 0.6% | View All 5 Rows |
Sex and Age in Staplehurst
Sex and Age in Staplehurst
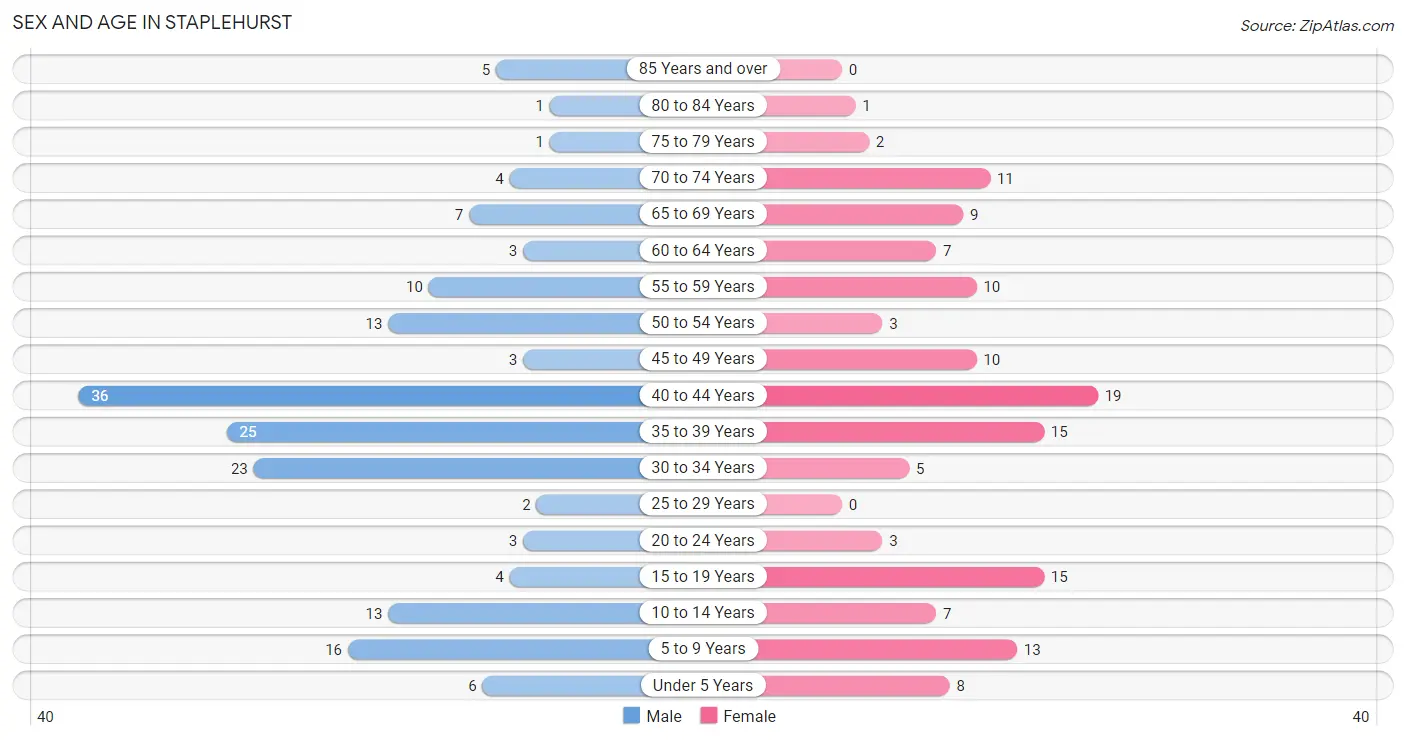
The most populous age groups in Staplehurst are 40 to 44 Years (36 | 20.6%) for men and 40 to 44 Years (19 | 13.8%) for women.
| Age Bracket | Male | Female |
| Under 5 Years | 6 (3.4%) | 8 (5.8%) |
| 5 to 9 Years | 16 (9.1%) | 13 (9.4%) |
| 10 to 14 Years | 13 (7.4%) | 7 (5.1%) |
| 15 to 19 Years | 4 (2.3%) | 15 (10.9%) |
| 20 to 24 Years | 3 (1.7%) | 3 (2.2%) |
| 25 to 29 Years | 2 (1.1%) | 0 (0.0%) |
| 30 to 34 Years | 23 (13.1%) | 5 (3.6%) |
| 35 to 39 Years | 25 (14.3%) | 15 (10.9%) |
| 40 to 44 Years | 36 (20.6%) | 19 (13.8%) |
| 45 to 49 Years | 3 (1.7%) | 10 (7.2%) |
| 50 to 54 Years | 13 (7.4%) | 3 (2.2%) |
| 55 to 59 Years | 10 (5.7%) | 10 (7.2%) |
| 60 to 64 Years | 3 (1.7%) | 7 (5.1%) |
| 65 to 69 Years | 7 (4.0%) | 9 (6.5%) |
| 70 to 74 Years | 4 (2.3%) | 11 (8.0%) |
| 75 to 79 Years | 1 (0.6%) | 2 (1.5%) |
| 80 to 84 Years | 1 (0.6%) | 1 (0.7%) |
| 85 Years and over | 5 (2.9%) | 0 (0.0%) |
| Total | 175 (100.0%) | 138 (100.0%) |
Families and Households in Staplehurst
Median Family Size in Staplehurst
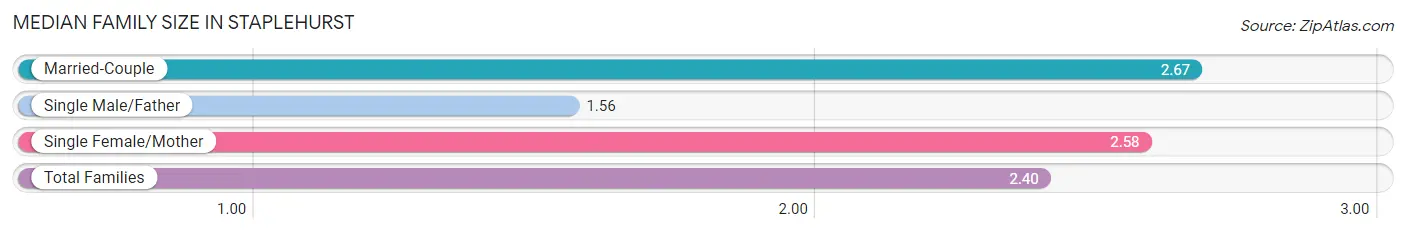
The median family size in Staplehurst is 2.40 persons per family, with married-couple families (69 | 65.1%) accounting for the largest median family size of 2.67 persons per family. On the other hand, single male/father families (25 | 23.6%) represent the smallest median family size with 1.56 persons per family.
| Family Type | # Families | Family Size |
| Married-Couple | 69 (65.1%) | 2.67 |
| Single Male/Father | 25 (23.6%) | 1.56 |
| Single Female/Mother | 12 (11.3%) | 2.58 |
| Total Families | 106 (100.0%) | 2.40 |
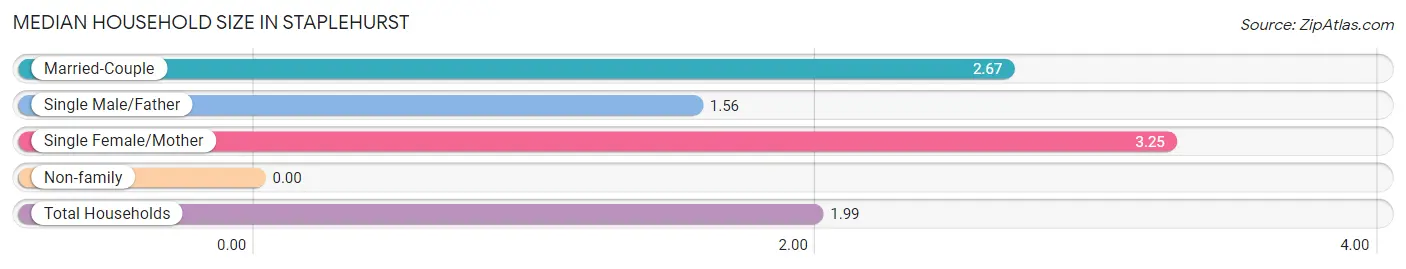
Median Household Size in Staplehurst
| Household Type | # Households | Household Size |
| Married-Couple | 69 (44.0%) | 2.67 |
| Single Male/Father | 25 (15.9%) | 1.56 |
| Single Female/Mother | 12 (7.6%) | 3.25 |
| Non-family | 51 (32.5%) | - |
| Total Households | 157 (100.0%) | 1.99 |
Household Size by Marriage Status in Staplehurst
Out of a total of 157 households in Staplehurst, 106 (67.5%) are family households, while 51 (32.5%) are nonfamily households. The most numerous type of family households are 2-person households, comprising 64, and the most common type of nonfamily households are 1-person households, comprising 51.
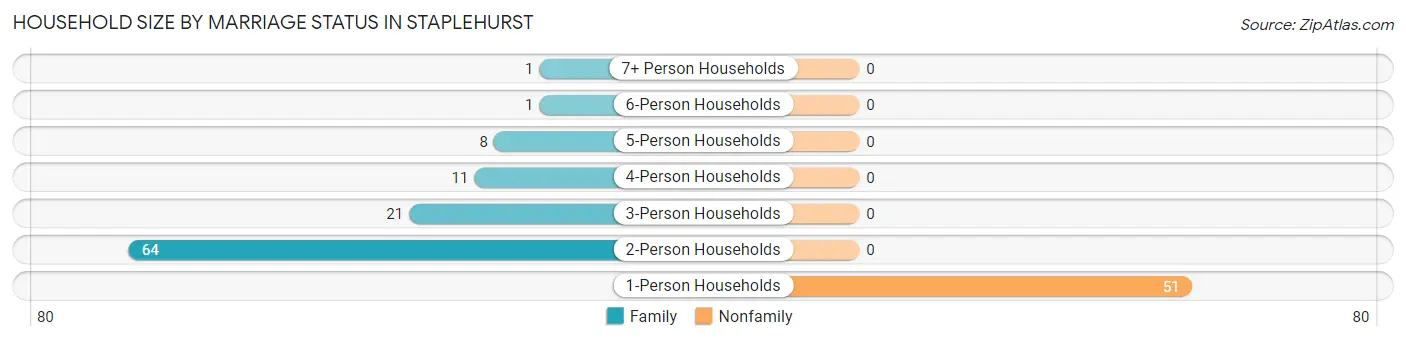
| Household Size | Family Households | Nonfamily Households |
| 1-Person Households | - | 51 (32.5%) |
| 2-Person Households | 64 (40.8%) | 0 (0.0%) |
| 3-Person Households | 21 (13.4%) | 0 (0.0%) |
| 4-Person Households | 11 (7.0%) | 0 (0.0%) |
| 5-Person Households | 8 (5.1%) | 0 (0.0%) |
| 6-Person Households | 1 (0.6%) | 0 (0.0%) |
| 7+ Person Households | 1 (0.6%) | 0 (0.0%) |
| Total | 106 (67.5%) | 51 (32.5%) |
Female Fertility in Staplehurst
Fertility by Age in Staplehurst
| Age Bracket | Women with Births | Births / 1,000 Women |
| 15 to 19 years | 0 (0.0%) | 0.0 |
| 20 to 34 years | 0 (0.0%) | 0.0 |
| 35 to 50 years | 0 (0.0%) | 0.0 |
| Total | 0 (0.0%) | 0.0 |
Fertility by Age by Marriage Status in Staplehurst
| Age Bracket | Married | Unmarried |
| 15 to 19 years | 0 (0.0%) | 0 (0.0%) |
| 20 to 34 years | 0 (0.0%) | 0 (0.0%) |
| 35 to 50 years | 0 (0.0%) | 0 (0.0%) |
| Total | 0 (0.0%) | 0 (0.0%) |
Fertility by Education in Staplehurst
| Educational Attainment | Women with Births | Births / 1,000 Women |
| Less than High School | 0 (0.0%) | 0.0 |
| High School Diploma | 0 (0.0%) | 0.0 |
| College or Associate's Degree | 0 (0.0%) | 0.0 |
| Bachelor's Degree | 0 (0.0%) | 0.0 |
| Graduate Degree | 0 (0.0%) | 0.0 |
| Total | 0 (0.0%) | 0.0 |
Fertility by Education by Marriage Status in Staplehurst
| Educational Attainment | Married | Unmarried |
| Less than High School | 0 (0.0%) | 0 (0.0%) |
| High School Diploma | 0 (0.0%) | 0 (0.0%) |
| College or Associate's Degree | 0 (0.0%) | 0 (0.0%) |
| Bachelor's Degree | 0 (0.0%) | 0 (0.0%) |
| Graduate Degree | 0 (0.0%) | 0 (0.0%) |
| Total | 0 (0.0%) | 0 (0.0%) |
Employment Characteristics in Staplehurst
Employment by Class of Employer in Staplehurst
Among the 202 employed individuals in Staplehurst, private company employees (156 | 77.2%), self-employed (incorporated) (24 | 11.9%), and local government employees (13 | 6.4%) make up the most common classes of employment.
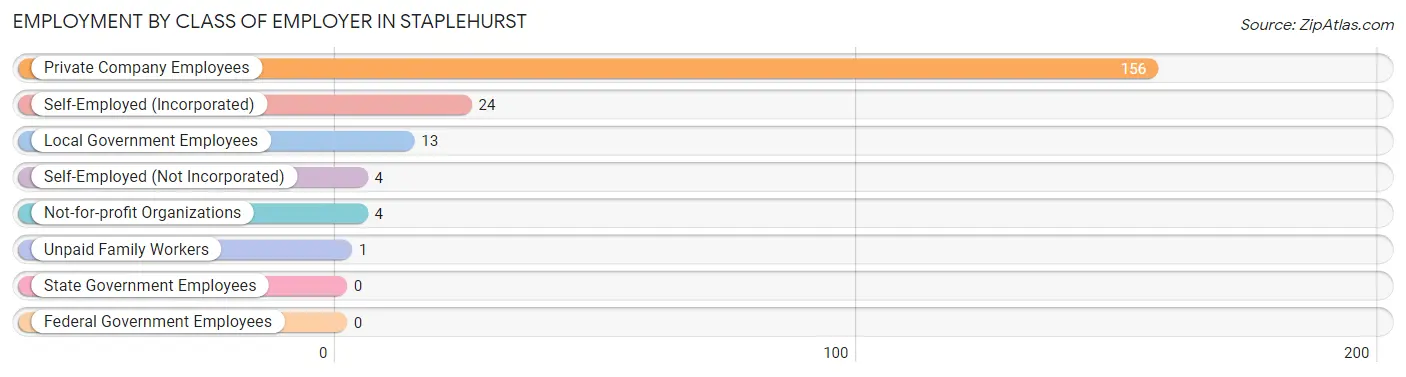
| Employer Class | # Employees | % Employees |
| Private Company Employees | 156 | 77.2% |
| Self-Employed (Incorporated) | 24 | 11.9% |
| Self-Employed (Not Incorporated) | 4 | 2.0% |
| Not-for-profit Organizations | 4 | 2.0% |
| Local Government Employees | 13 | 6.4% |
| State Government Employees | 0 | 0.0% |
| Federal Government Employees | 0 | 0.0% |
| Unpaid Family Workers | 1 | 0.5% |
| Total | 202 | 100.0% |
Employment Status by Age in Staplehurst
According to the labor force statistics for Staplehurst, out of the total population over 16 years of age (249), 81.9% or 204 individuals are in the labor force, with 1.0% or 2 of them unemployed. The age group with the highest labor force participation rate is 20 to 24 years, with 100.0% or 6 individuals in the labor force. Within the labor force, the 16 to 19 years age range has the highest percentage of unemployed individuals, with 8.3% or 1 of them being unemployed.
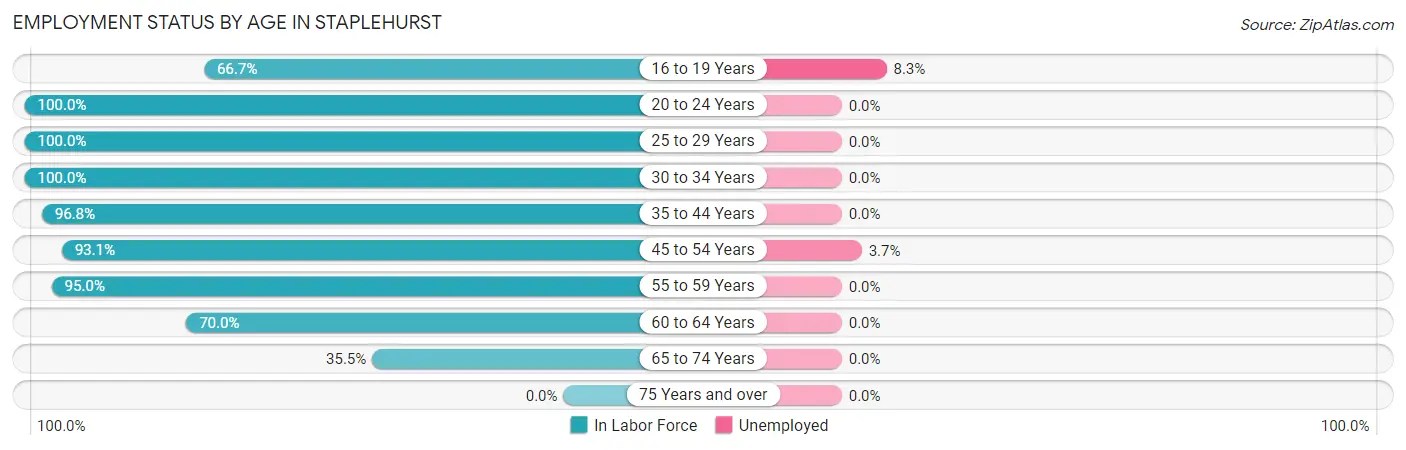
| Age Bracket | In Labor Force | Unemployed |
| 16 to 19 Years | 12 (66.7%) | 1 (8.3%) |
| 20 to 24 Years | 6 (100.0%) | 0 (0.0%) |
| 25 to 29 Years | 2 (100.0%) | 0 (0.0%) |
| 30 to 34 Years | 28 (100.0%) | 0 (0.0%) |
| 35 to 44 Years | 92 (96.8%) | 0 (0.0%) |
| 45 to 54 Years | 27 (93.1%) | 1 (3.7%) |
| 55 to 59 Years | 19 (95.0%) | 0 (0.0%) |
| 60 to 64 Years | 7 (70.0%) | 0 (0.0%) |
| 65 to 74 Years | 11 (35.5%) | 0 (0.0%) |
| 75 Years and over | 0 (0.0%) | 0 (0.0%) |
| Total | 204 (81.9%) | 2 (1.0%) |
Employment Status by Educational Attainment in Staplehurst
According to labor force statistics for Staplehurst, 95.1% of individuals (175) out of the total population between 25 and 64 years of age (184) are in the labor force, with 0.6% or 1 of them being unemployed. The group with the highest labor force participation rate are those with the educational attainment of college / associate degree, with 98.7% or 78 individuals in the labor force. Within the labor force, individuals with high school diploma education have the highest percentage of unemployment, with 2.0% or 1 of them being unemployed.
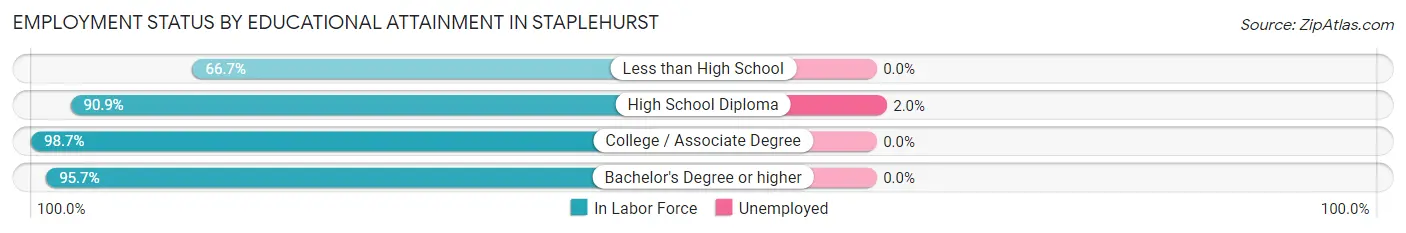
| Educational Attainment | In Labor Force | Unemployed |
| Less than High School | 2 (66.7%) | 0 (0.0%) |
| High School Diploma | 50 (90.9%) | 1 (2.0%) |
| College / Associate Degree | 78 (98.7%) | 0 (0.0%) |
| Bachelor's Degree or higher | 45 (95.7%) | 0 (0.0%) |
| Total | 175 (95.1%) | 1 (0.6%) |
Employment Occupations by Sex in Staplehurst
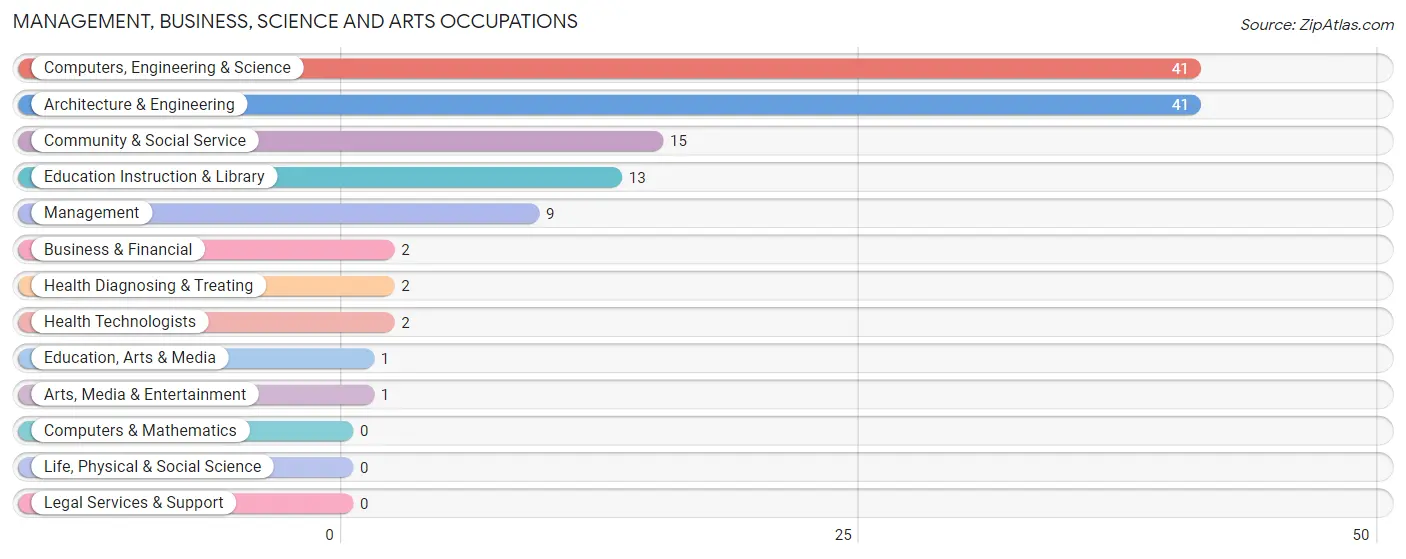
Management, Business, Science and Arts Occupations
The most common Management, Business, Science and Arts occupations in Staplehurst are Computers, Engineering & Science (41 | 20.3%), Architecture & Engineering (41 | 20.3%), Community & Social Service (15 | 7.4%), Education Instruction & Library (13 | 6.4%), and Management (9 | 4.5%).
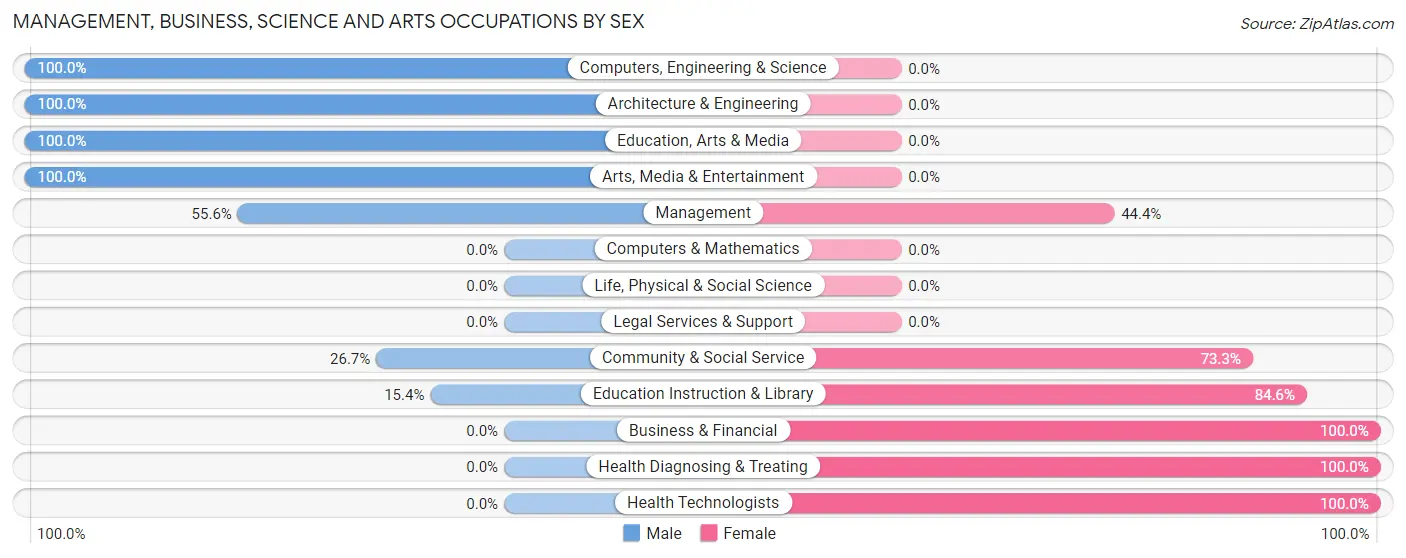
Management, Business, Science and Arts Occupations by Sex
Within the Management, Business, Science and Arts occupations in Staplehurst, the most male-oriented occupations are Computers, Engineering & Science (100.0%), Architecture & Engineering (100.0%), and Education, Arts & Media (100.0%), while the most female-oriented occupations are Business & Financial (100.0%), Health Diagnosing & Treating (100.0%), and Health Technologists (100.0%).
| Occupation | Male | Female |
| Management | 5 (55.6%) | 4 (44.4%) |
| Business & Financial | 0 (0.0%) | 2 (100.0%) |
| Computers, Engineering & Science | 41 (100.0%) | 0 (0.0%) |
| Computers & Mathematics | 0 (0.0%) | 0 (0.0%) |
| Architecture & Engineering | 41 (100.0%) | 0 (0.0%) |
| Life, Physical & Social Science | 0 (0.0%) | 0 (0.0%) |
| Community & Social Service | 4 (26.7%) | 11 (73.3%) |
| Education, Arts & Media | 1 (100.0%) | 0 (0.0%) |
| Legal Services & Support | 0 (0.0%) | 0 (0.0%) |
| Education Instruction & Library | 2 (15.4%) | 11 (84.6%) |
| Arts, Media & Entertainment | 1 (100.0%) | 0 (0.0%) |
| Health Diagnosing & Treating | 0 (0.0%) | 2 (100.0%) |
| Health Technologists | 0 (0.0%) | 2 (100.0%) |
| Total (Category) | 50 (72.5%) | 19 (27.5%) |
| Total (Overall) | 119 (58.9%) | 83 (41.1%) |
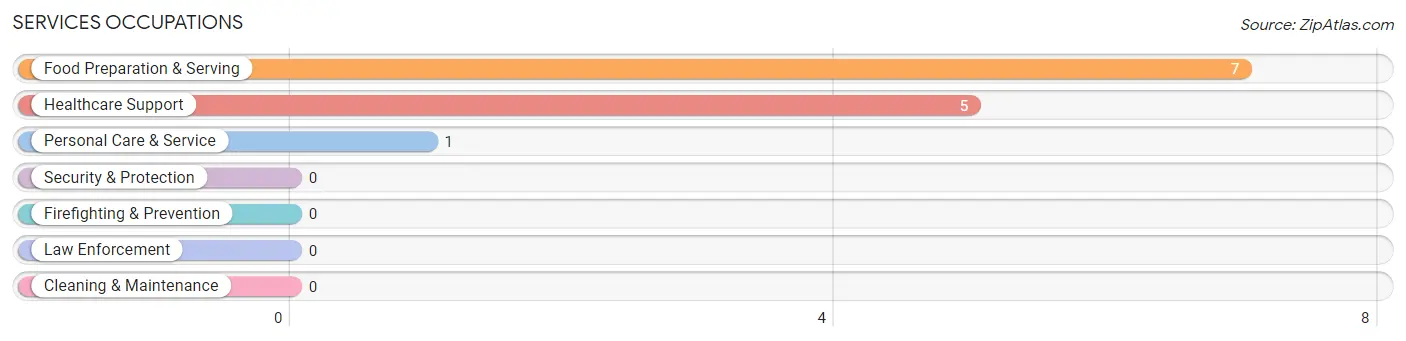
Services Occupations
The most common Services occupations in Staplehurst are Food Preparation & Serving (7 | 3.5%), Healthcare Support (5 | 2.5%), and Personal Care & Service (1 | 0.5%).
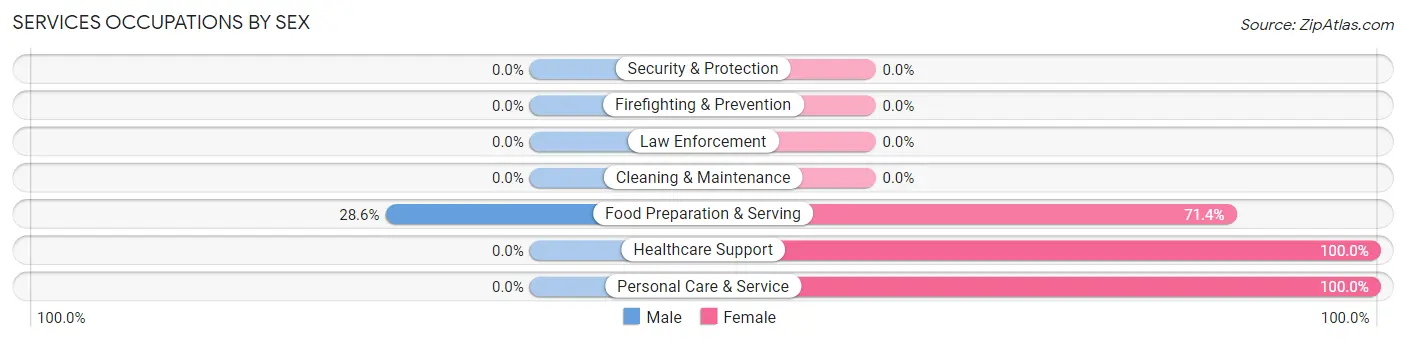
Services Occupations by Sex
| Occupation | Male | Female |
| Healthcare Support | 0 (0.0%) | 5 (100.0%) |
| Security & Protection | 0 (0.0%) | 0 (0.0%) |
| Firefighting & Prevention | 0 (0.0%) | 0 (0.0%) |
| Law Enforcement | 0 (0.0%) | 0 (0.0%) |
| Food Preparation & Serving | 2 (28.6%) | 5 (71.4%) |
| Cleaning & Maintenance | 0 (0.0%) | 0 (0.0%) |
| Personal Care & Service | 0 (0.0%) | 1 (100.0%) |
| Total (Category) | 2 (15.4%) | 11 (84.6%) |
| Total (Overall) | 119 (58.9%) | 83 (41.1%) |
Sales and Office Occupations
The most common Sales and Office occupations in Staplehurst are Office & Administration (39 | 19.3%), and Sales & Related (11 | 5.4%).
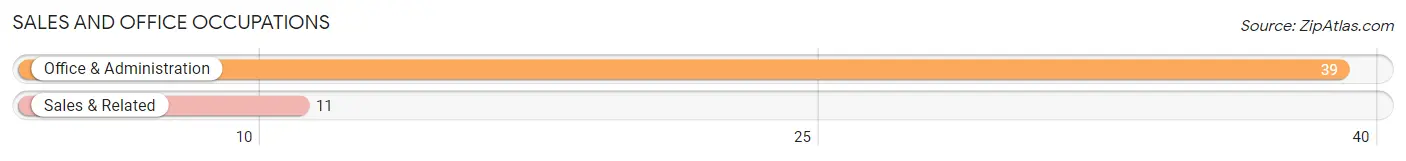
Sales and Office Occupations by Sex
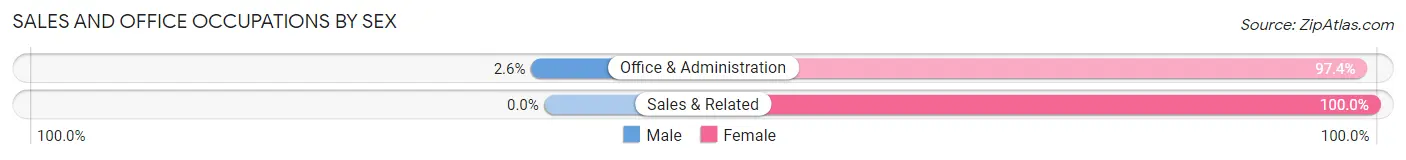
| Occupation | Male | Female |
| Sales & Related | 0 (0.0%) | 11 (100.0%) |
| Office & Administration | 1 (2.6%) | 38 (97.4%) |
| Total (Category) | 1 (2.0%) | 49 (98.0%) |
| Total (Overall) | 119 (58.9%) | 83 (41.1%) |
Natural Resources, Construction and Maintenance Occupations
The most common Natural Resources, Construction and Maintenance occupations in Staplehurst are Installation, Maintenance & Repair (34 | 16.8%), and Farming, Fishing & Forestry (3 | 1.5%).
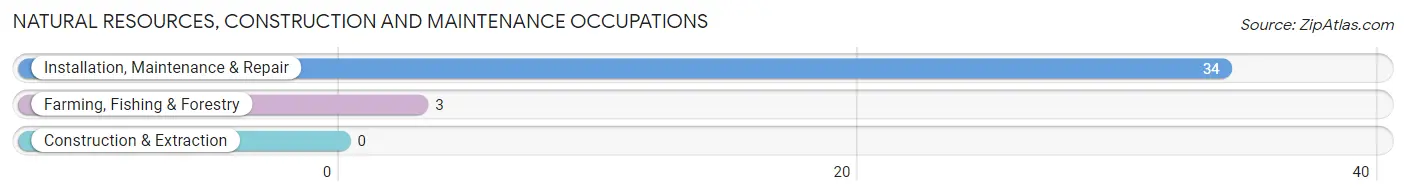
Natural Resources, Construction and Maintenance Occupations by Sex
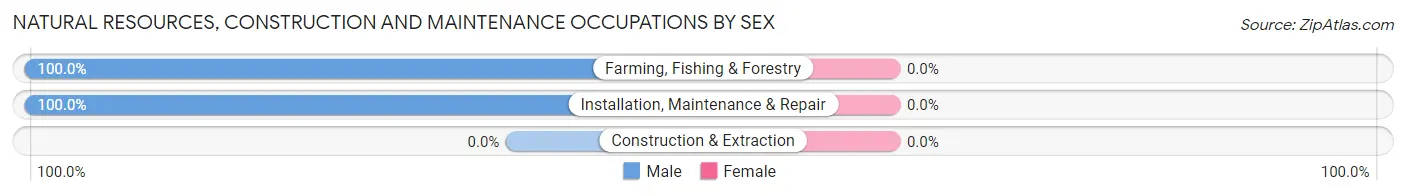
| Occupation | Male | Female |
| Farming, Fishing & Forestry | 3 (100.0%) | 0 (0.0%) |
| Construction & Extraction | 0 (0.0%) | 0 (0.0%) |
| Installation, Maintenance & Repair | 34 (100.0%) | 0 (0.0%) |
| Total (Category) | 37 (100.0%) | 0 (0.0%) |
| Total (Overall) | 119 (58.9%) | 83 (41.1%) |
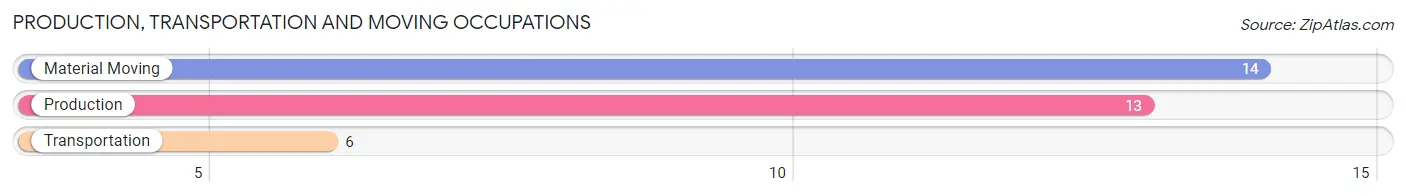
Production, Transportation and Moving Occupations
The most common Production, Transportation and Moving occupations in Staplehurst are Material Moving (14 | 6.9%), Production (13 | 6.4%), and Transportation (6 | 3.0%).
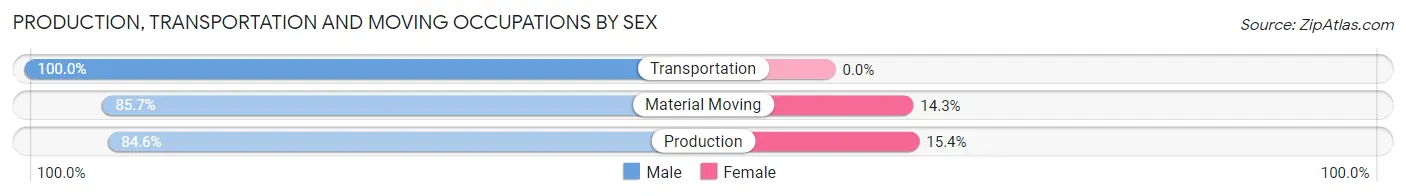
Production, Transportation and Moving Occupations by Sex
| Occupation | Male | Female |
| Production | 11 (84.6%) | 2 (15.4%) |
| Transportation | 6 (100.0%) | 0 (0.0%) |
| Material Moving | 12 (85.7%) | 2 (14.3%) |
| Total (Category) | 29 (87.9%) | 4 (12.1%) |
| Total (Overall) | 119 (58.9%) | 83 (41.1%) |
Employment Industries by Sex in Staplehurst
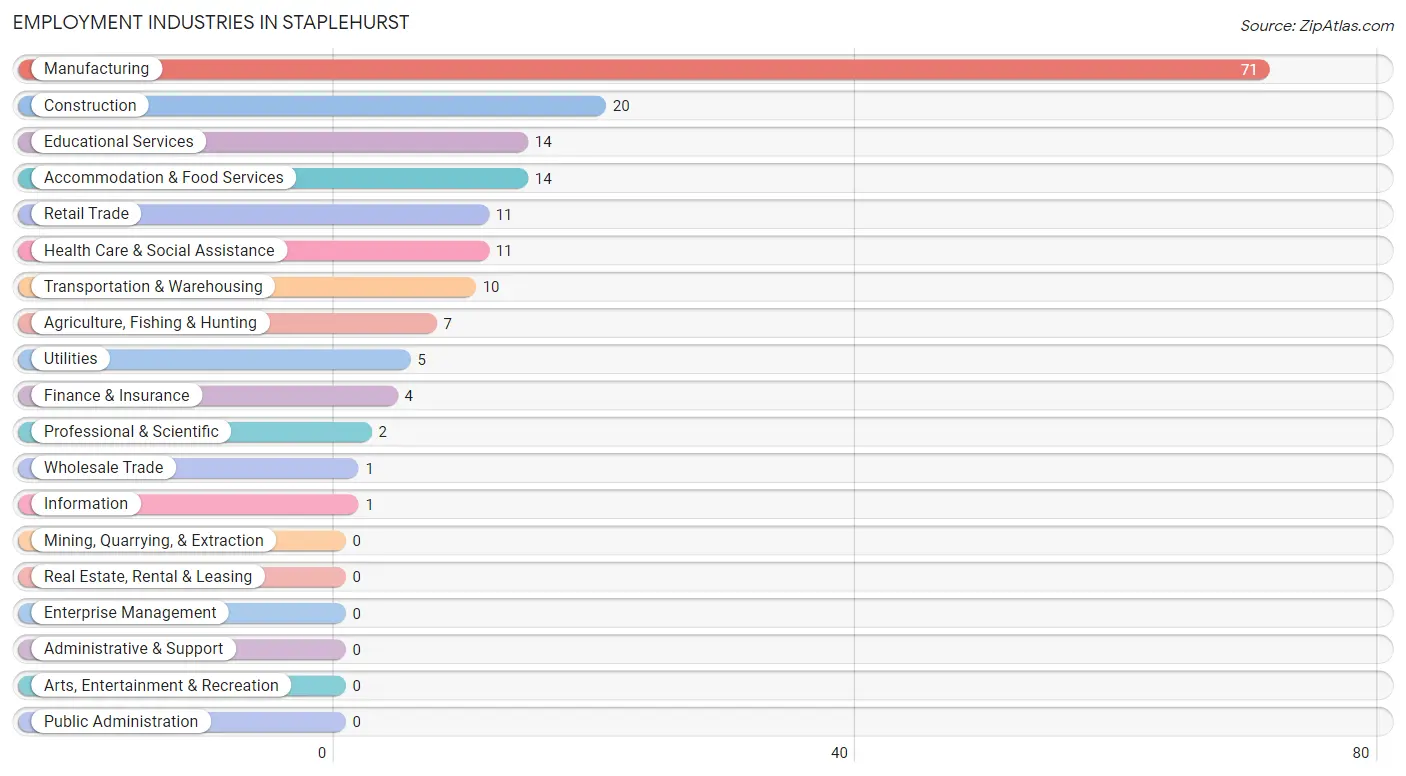
Employment Industries in Staplehurst
The major employment industries in Staplehurst include Manufacturing (71 | 35.1%), Construction (20 | 9.9%), Educational Services (14 | 6.9%), Accommodation & Food Services (14 | 6.9%), and Retail Trade (11 | 5.4%).
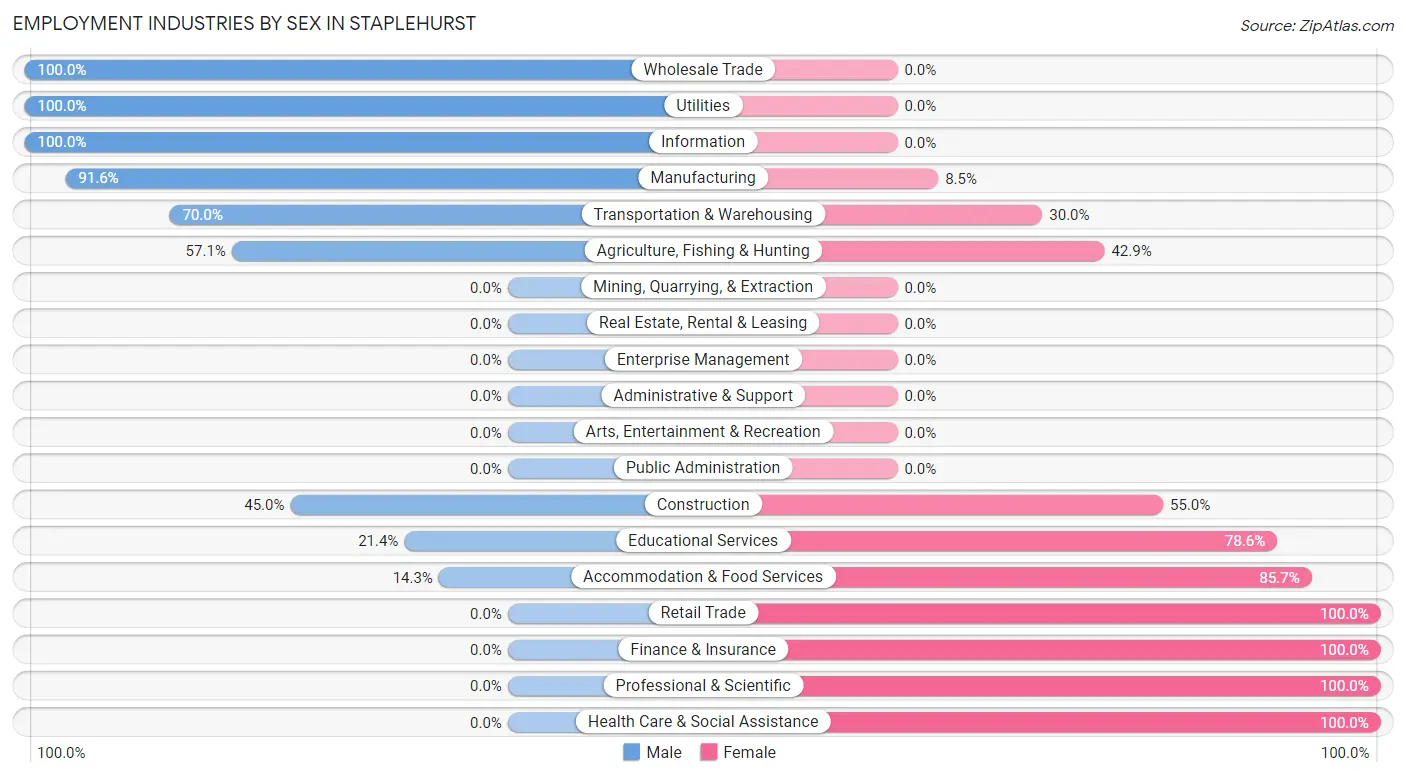
Employment Industries by Sex in Staplehurst
The Staplehurst industries that see more men than women are Wholesale Trade (100.0%), Utilities (100.0%), and Information (100.0%), whereas the industries that tend to have a higher number of women are Retail Trade (100.0%), Finance & Insurance (100.0%), and Professional & Scientific (100.0%).
| Industry | Male | Female |
| Agriculture, Fishing & Hunting | 4 (57.1%) | 3 (42.9%) |
| Mining, Quarrying, & Extraction | 0 (0.0%) | 0 (0.0%) |
| Construction | 9 (45.0%) | 11 (55.0%) |
| Manufacturing | 65 (91.5%) | 6 (8.5%) |
| Wholesale Trade | 1 (100.0%) | 0 (0.0%) |
| Retail Trade | 0 (0.0%) | 11 (100.0%) |
| Transportation & Warehousing | 7 (70.0%) | 3 (30.0%) |
| Utilities | 5 (100.0%) | 0 (0.0%) |
| Information | 1 (100.0%) | 0 (0.0%) |
| Finance & Insurance | 0 (0.0%) | 4 (100.0%) |
| Real Estate, Rental & Leasing | 0 (0.0%) | 0 (0.0%) |
| Professional & Scientific | 0 (0.0%) | 2 (100.0%) |
| Enterprise Management | 0 (0.0%) | 0 (0.0%) |
| Administrative & Support | 0 (0.0%) | 0 (0.0%) |
| Educational Services | 3 (21.4%) | 11 (78.6%) |
| Health Care & Social Assistance | 0 (0.0%) | 11 (100.0%) |
| Arts, Entertainment & Recreation | 0 (0.0%) | 0 (0.0%) |
| Accommodation & Food Services | 2 (14.3%) | 12 (85.7%) |
| Public Administration | 0 (0.0%) | 0 (0.0%) |
| Total | 119 (58.9%) | 83 (41.1%) |
Education in Staplehurst
School Enrollment in Staplehurst
The most common levels of schooling among the 68 students in Staplehurst are middle school (19 | 27.9%), elementary school (17 | 25.0%), and high school (16 | 23.5%).
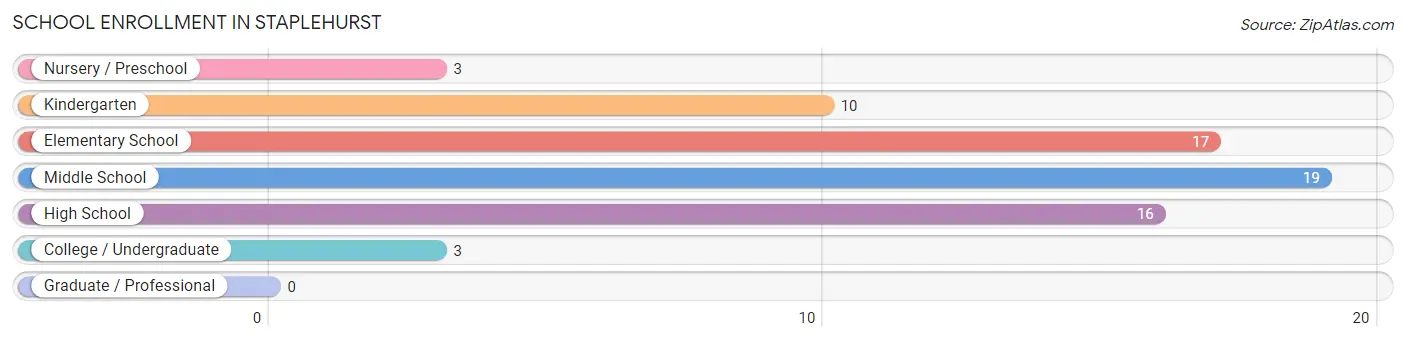
| School Level | # Students | % Students |
| Nursery / Preschool | 3 | 4.4% |
| Kindergarten | 10 | 14.7% |
| Elementary School | 17 | 25.0% |
| Middle School | 19 | 27.9% |
| High School | 16 | 23.5% |
| College / Undergraduate | 3 | 4.4% |
| Graduate / Professional | 0 | 0.0% |
| Total | 68 | 100.0% |
School Enrollment by Age by Funding Source in Staplehurst
Out of a total of 68 students who are enrolled in schools in Staplehurst, 5 (7.4%) attend a private institution, while the remaining 63 (92.6%) are enrolled in public schools. The age group of 20 to 24 year olds has the highest likelihood of being enrolled in private schools, with 2 (66.7% in the age bracket) enrolled. Conversely, the age group of 15 to 17 year olds has the lowest likelihood of being enrolled in a private school, with 13 (100.0% in the age bracket) attending a public institution.
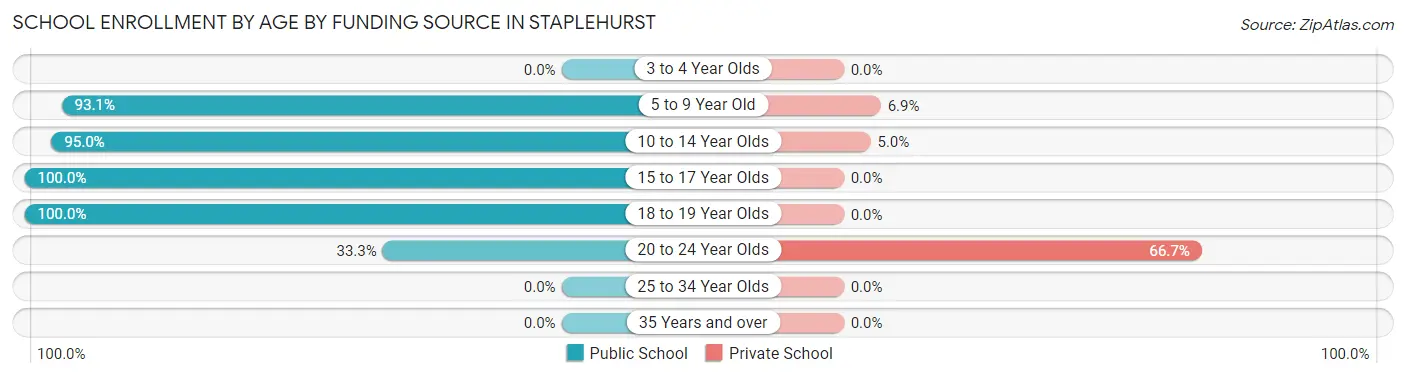
| Age Bracket | Public School | Private School |
| 3 to 4 Year Olds | 0 (0.0%) | 0 (0.0%) |
| 5 to 9 Year Old | 27 (93.1%) | 2 (6.9%) |
| 10 to 14 Year Olds | 19 (95.0%) | 1 (5.0%) |
| 15 to 17 Year Olds | 13 (100.0%) | 0 (0.0%) |
| 18 to 19 Year Olds | 3 (100.0%) | 0 (0.0%) |
| 20 to 24 Year Olds | 1 (33.3%) | 2 (66.7%) |
| 25 to 34 Year Olds | 0 (0.0%) | 0 (0.0%) |
| 35 Years and over | 0 (0.0%) | 0 (0.0%) |
| Total | 63 (92.6%) | 5 (7.4%) |
Educational Attainment by Field of Study in Staplehurst
Science & technology (28 | 53.8%), education (15 | 28.8%), business (5 | 9.6%), liberal arts & history (2 | 3.8%), and visual & performing arts (2 | 3.8%) are the most common fields of study among 52 individuals in Staplehurst who have obtained a bachelor's degree or higher.
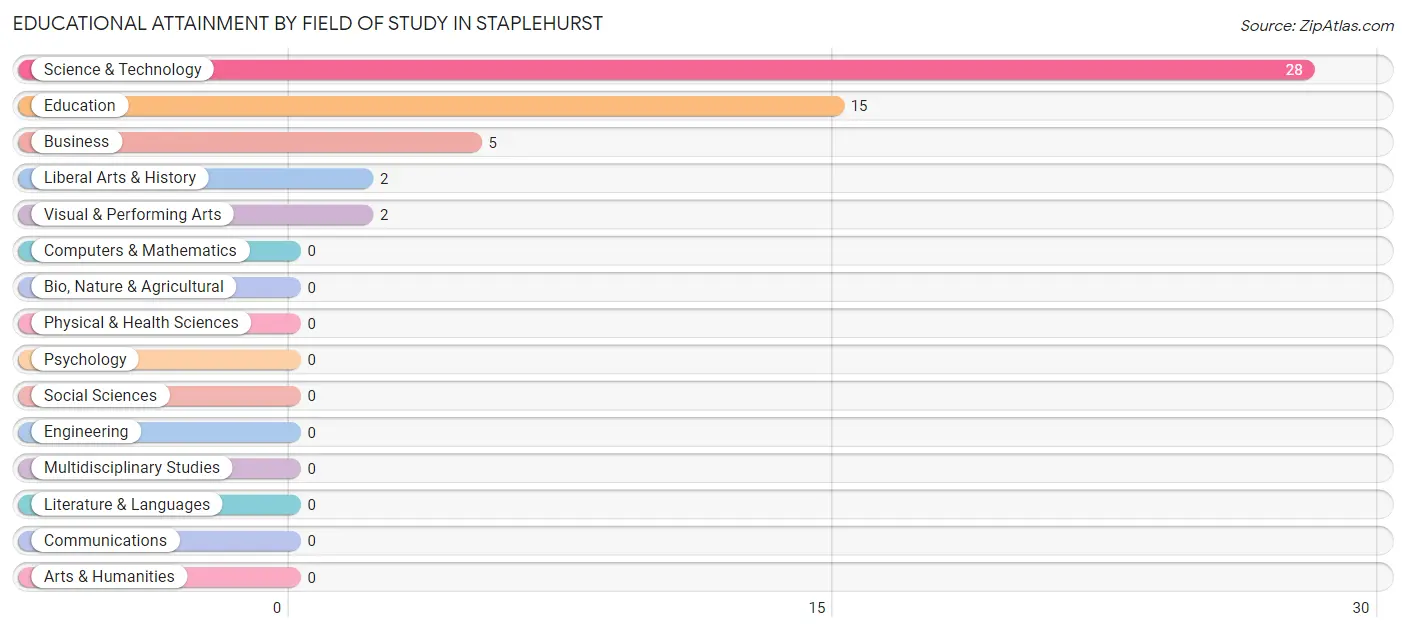
| Field of Study | # Graduates | % Graduates |
| Computers & Mathematics | 0 | 0.0% |
| Bio, Nature & Agricultural | 0 | 0.0% |
| Physical & Health Sciences | 0 | 0.0% |
| Psychology | 0 | 0.0% |
| Social Sciences | 0 | 0.0% |
| Engineering | 0 | 0.0% |
| Multidisciplinary Studies | 0 | 0.0% |
| Science & Technology | 28 | 53.8% |
| Business | 5 | 9.6% |
| Education | 15 | 28.8% |
| Literature & Languages | 0 | 0.0% |
| Liberal Arts & History | 2 | 3.8% |
| Visual & Performing Arts | 2 | 3.8% |
| Communications | 0 | 0.0% |
| Arts & Humanities | 0 | 0.0% |
| Total | 52 | 100.0% |
Transportation & Commute in Staplehurst
Vehicle Availability by Sex in Staplehurst
The most prevalent vehicle ownership categories in Staplehurst are males with 2 vehicles (61, accounting for 51.3%) and females with 2 vehicles (35, making up 73.5%).
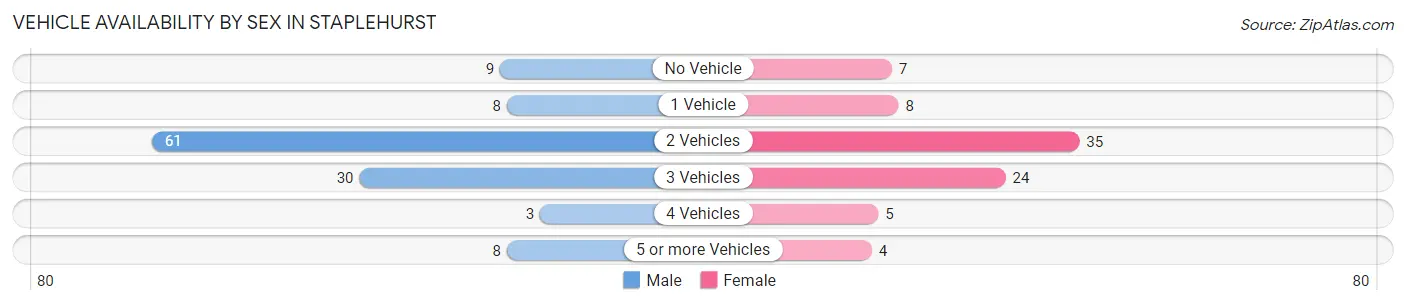
| Vehicles Available | Male | Female |
| No Vehicle | 9 (7.6%) | 7 (8.4%) |
| 1 Vehicle | 8 (6.7%) | 8 (9.6%) |
| 2 Vehicles | 61 (51.3%) | 35 (42.2%) |
| 3 Vehicles | 30 (25.2%) | 24 (28.9%) |
| 4 Vehicles | 3 (2.5%) | 5 (6.0%) |
| 5 or more Vehicles | 8 (6.7%) | 4 (4.8%) |
| Total | 119 (100.0%) | 83 (100.0%) |
Commute Time in Staplehurst
The most frequently occuring commute durations in Staplehurst are 10 to 14 minutes (53 commuters, 27.2%), 15 to 19 minutes (42 commuters, 21.5%), and 40 to 44 minutes (40 commuters, 20.5%).
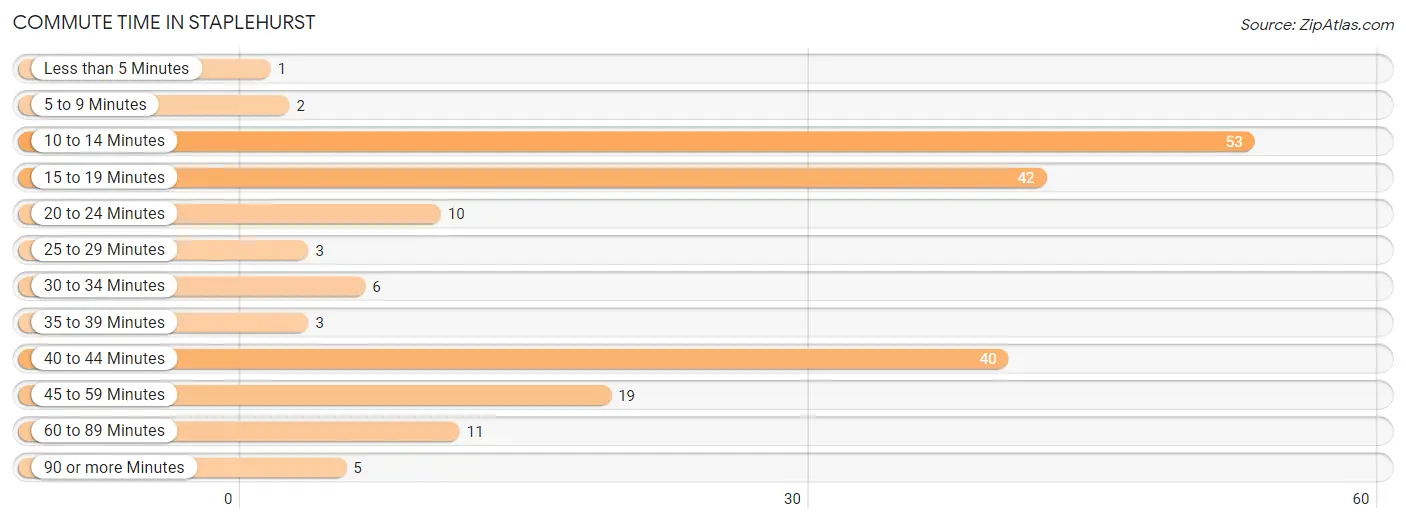
| Commute Time | # Commuters | % Commuters |
| Less than 5 Minutes | 1 | 0.5% |
| 5 to 9 Minutes | 2 | 1.0% |
| 10 to 14 Minutes | 53 | 27.2% |
| 15 to 19 Minutes | 42 | 21.5% |
| 20 to 24 Minutes | 10 | 5.1% |
| 25 to 29 Minutes | 3 | 1.5% |
| 30 to 34 Minutes | 6 | 3.1% |
| 35 to 39 Minutes | 3 | 1.5% |
| 40 to 44 Minutes | 40 | 20.5% |
| 45 to 59 Minutes | 19 | 9.7% |
| 60 to 89 Minutes | 11 | 5.6% |
| 90 or more Minutes | 5 | 2.6% |
Commute Time by Sex in Staplehurst
The most common commute times in Staplehurst are 40 to 44 minutes (35 commuters, 30.2%) for males and 10 to 14 minutes (29 commuters, 36.7%) for females.
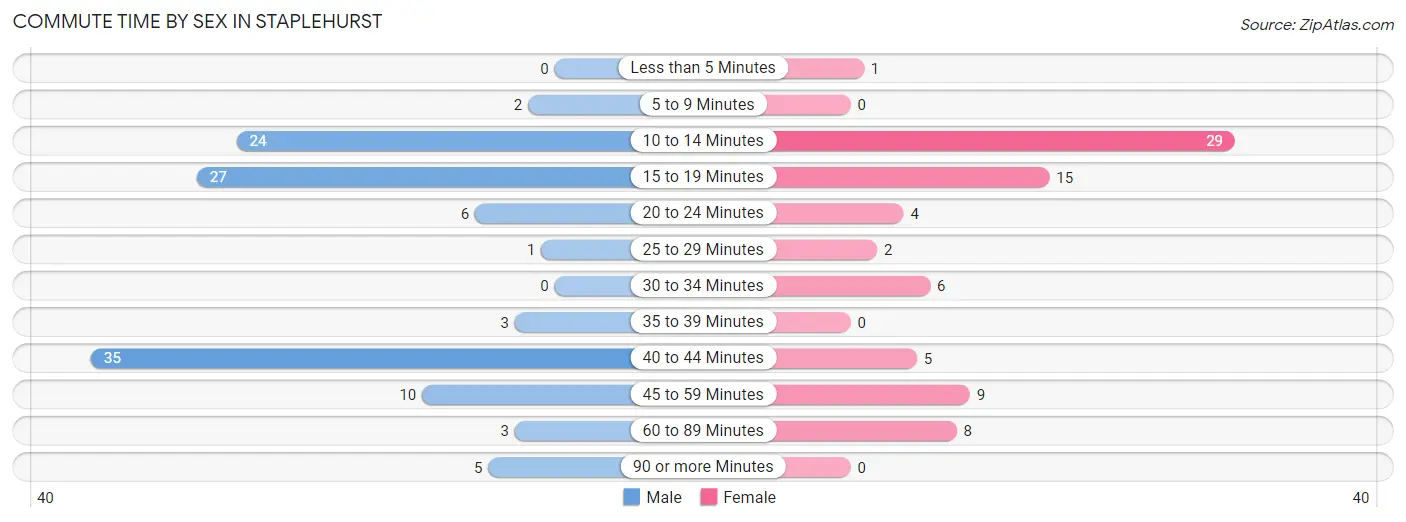
| Commute Time | Male | Female |
| Less than 5 Minutes | 0 (0.0%) | 1 (1.3%) |
| 5 to 9 Minutes | 2 (1.7%) | 0 (0.0%) |
| 10 to 14 Minutes | 24 (20.7%) | 29 (36.7%) |
| 15 to 19 Minutes | 27 (23.3%) | 15 (19.0%) |
| 20 to 24 Minutes | 6 (5.2%) | 4 (5.1%) |
| 25 to 29 Minutes | 1 (0.9%) | 2 (2.5%) |
| 30 to 34 Minutes | 0 (0.0%) | 6 (7.6%) |
| 35 to 39 Minutes | 3 (2.6%) | 0 (0.0%) |
| 40 to 44 Minutes | 35 (30.2%) | 5 (6.3%) |
| 45 to 59 Minutes | 10 (8.6%) | 9 (11.4%) |
| 60 to 89 Minutes | 3 (2.6%) | 8 (10.1%) |
| 90 or more Minutes | 5 (4.3%) | 0 (0.0%) |
Time of Departure to Work by Sex in Staplehurst
The most frequent times of departure to work in Staplehurst are 7:00 AM to 7:29 AM (36, 31.0%) for males and 7:30 AM to 7:59 AM (26, 32.9%) for females.
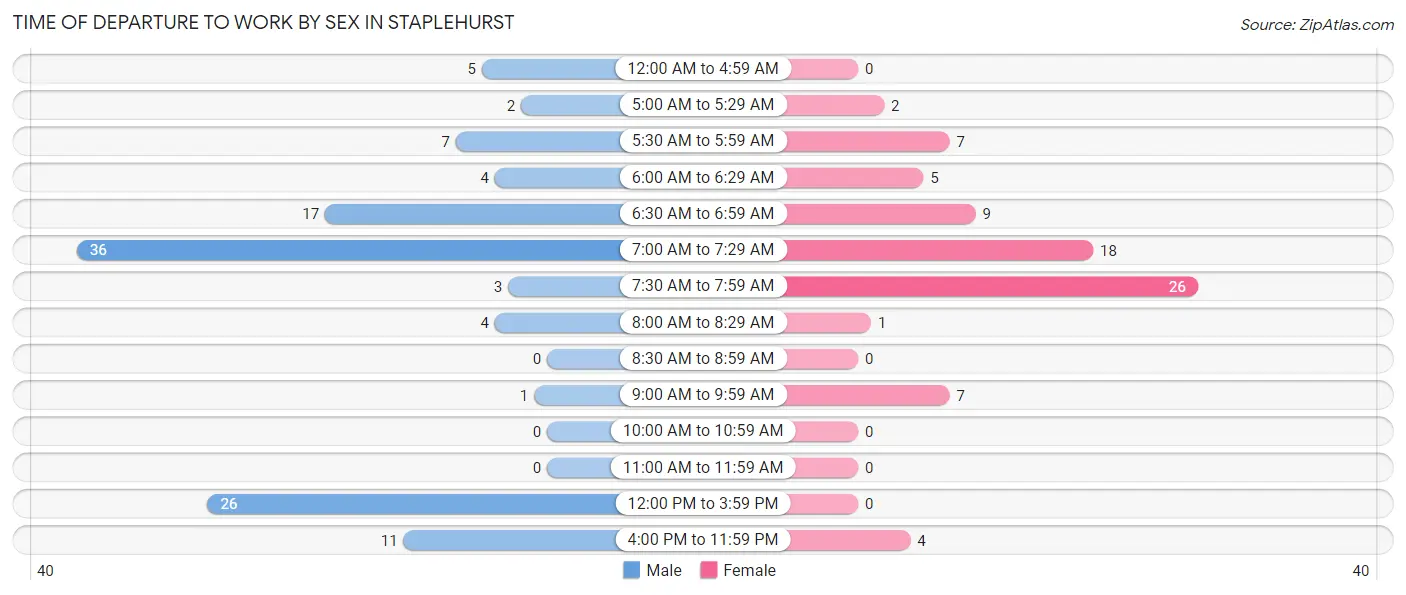
| Time of Departure | Male | Female |
| 12:00 AM to 4:59 AM | 5 (4.3%) | 0 (0.0%) |
| 5:00 AM to 5:29 AM | 2 (1.7%) | 2 (2.5%) |
| 5:30 AM to 5:59 AM | 7 (6.0%) | 7 (8.9%) |
| 6:00 AM to 6:29 AM | 4 (3.5%) | 5 (6.3%) |
| 6:30 AM to 6:59 AM | 17 (14.7%) | 9 (11.4%) |
| 7:00 AM to 7:29 AM | 36 (31.0%) | 18 (22.8%) |
| 7:30 AM to 7:59 AM | 3 (2.6%) | 26 (32.9%) |
| 8:00 AM to 8:29 AM | 4 (3.5%) | 1 (1.3%) |
| 8:30 AM to 8:59 AM | 0 (0.0%) | 0 (0.0%) |
| 9:00 AM to 9:59 AM | 1 (0.9%) | 7 (8.9%) |
| 10:00 AM to 10:59 AM | 0 (0.0%) | 0 (0.0%) |
| 11:00 AM to 11:59 AM | 0 (0.0%) | 0 (0.0%) |
| 12:00 PM to 3:59 PM | 26 (22.4%) | 0 (0.0%) |
| 4:00 PM to 11:59 PM | 11 (9.5%) | 4 (5.1%) |
| Total | 116 (100.0%) | 79 (100.0%) |
Housing Occupancy in Staplehurst
Occupancy by Ownership in Staplehurst
Of the total 157 dwellings in Staplehurst, owner-occupied units account for 148 (94.3%), while renter-occupied units make up 9 (5.7%).
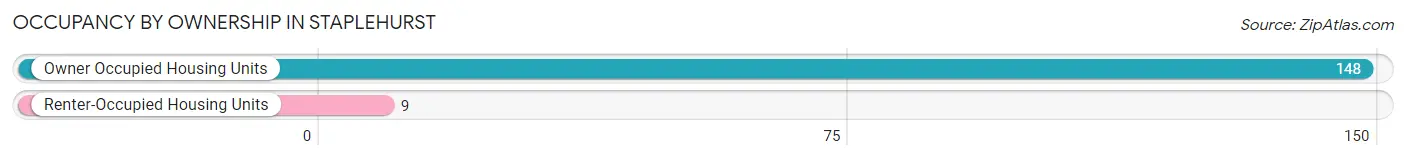
| Occupancy | # Housing Units | % Housing Units |
| Owner Occupied Housing Units | 148 | 94.3% |
| Renter-Occupied Housing Units | 9 | 5.7% |
| Total Occupied Housing Units | 157 | 100.0% |
Occupancy by Household Size in Staplehurst
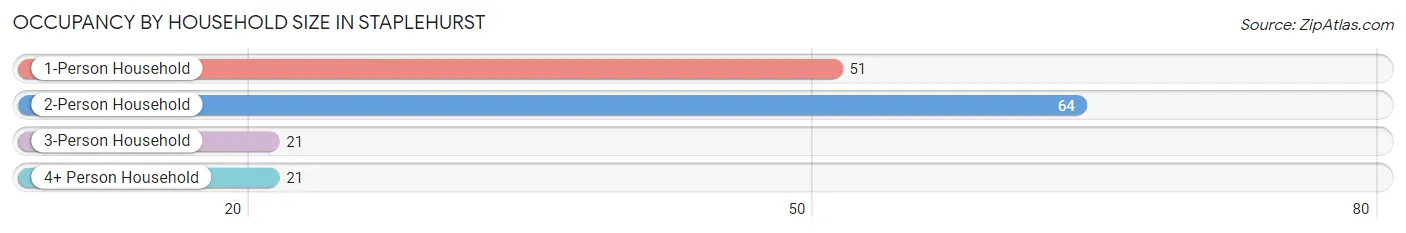
| Household Size | # Housing Units | % Housing Units |
| 1-Person Household | 51 | 32.5% |
| 2-Person Household | 64 | 40.8% |
| 3-Person Household | 21 | 13.4% |
| 4+ Person Household | 21 | 13.4% |
| Total Housing Units | 157 | 100.0% |
Occupancy by Ownership by Household Size in Staplehurst
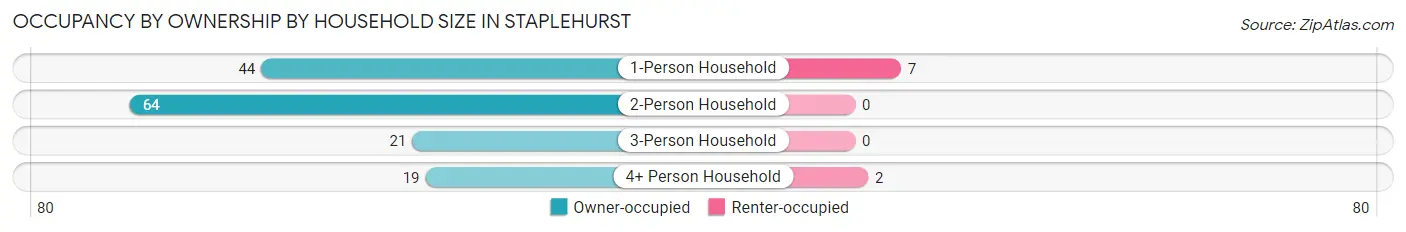
| Household Size | Owner-occupied | Renter-occupied |
| 1-Person Household | 44 (86.3%) | 7 (13.7%) |
| 2-Person Household | 64 (100.0%) | 0 (0.0%) |
| 3-Person Household | 21 (100.0%) | 0 (0.0%) |
| 4+ Person Household | 19 (90.5%) | 2 (9.5%) |
| Total Housing Units | 148 (94.3%) | 9 (5.7%) |
Occupancy by Educational Attainment in Staplehurst
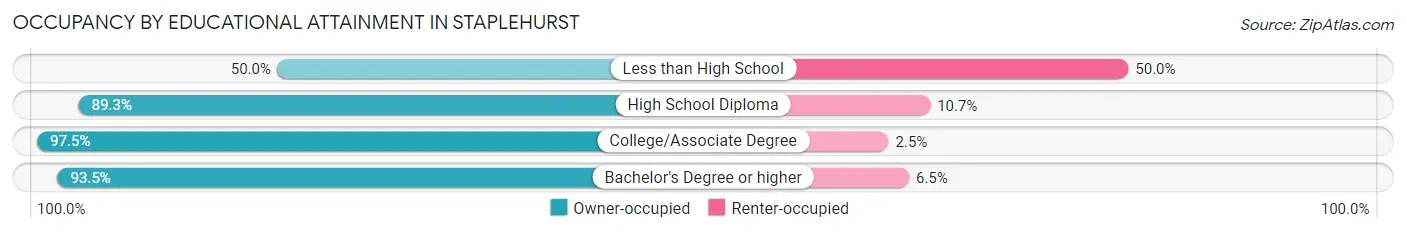
| Household Size | Owner-occupied | Renter-occupied |
| Less than High School | 1 (50.0%) | 1 (50.0%) |
| High School Diploma | 25 (89.3%) | 3 (10.7%) |
| College/Associate Degree | 79 (97.5%) | 2 (2.5%) |
| Bachelor's Degree or higher | 43 (93.5%) | 3 (6.5%) |
Occupancy by Age of Householder in Staplehurst
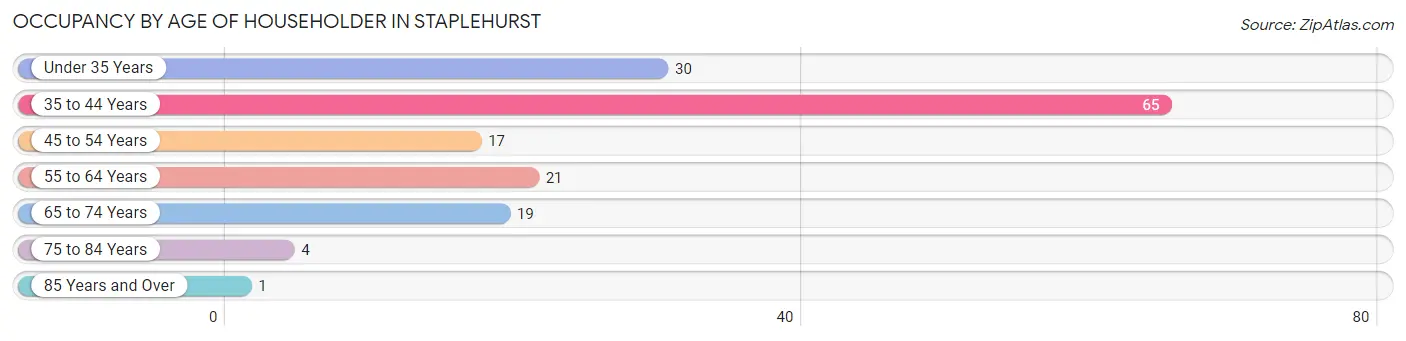
| Age Bracket | # Households | % Households |
| Under 35 Years | 30 | 19.1% |
| 35 to 44 Years | 65 | 41.4% |
| 45 to 54 Years | 17 | 10.8% |
| 55 to 64 Years | 21 | 13.4% |
| 65 to 74 Years | 19 | 12.1% |
| 75 to 84 Years | 4 | 2.5% |
| 85 Years and Over | 1 | 0.6% |
| Total | 157 | 100.0% |
Housing Finances in Staplehurst
Median Income by Occupancy in Staplehurst
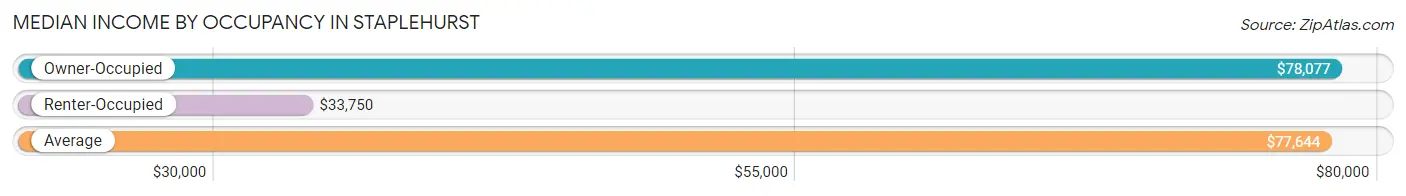
| Occupancy Type | # Households | Median Income |
| Owner-Occupied | 148 (94.3%) | $78,077 |
| Renter-Occupied | 9 (5.7%) | $33,750 |
| Average | 157 (100.0%) | $77,644 |
Occupancy by Householder Income Bracket in Staplehurst
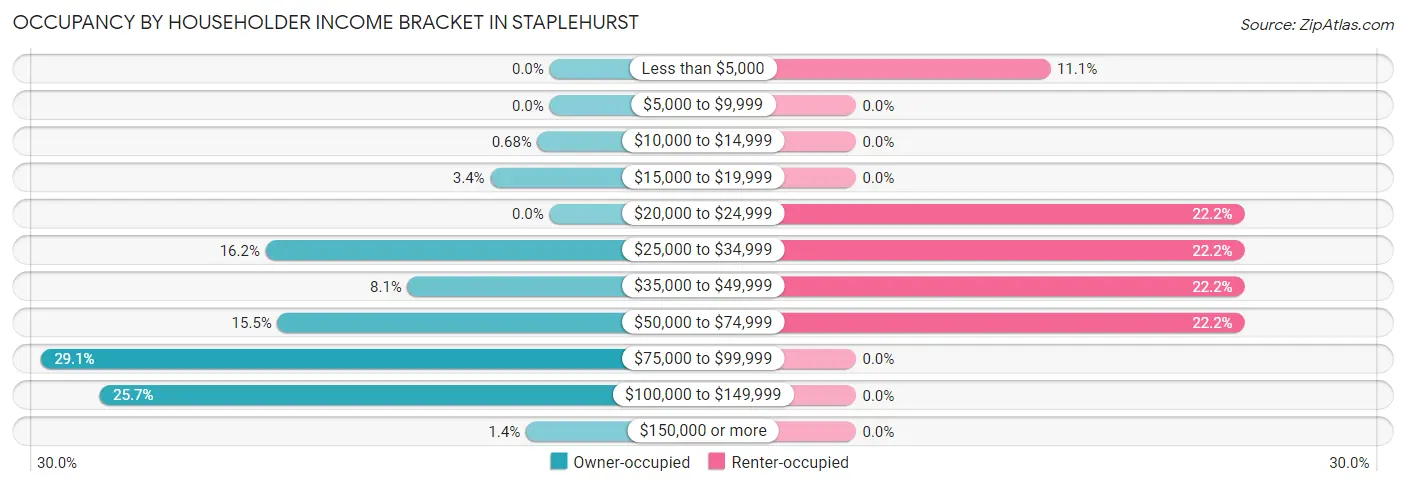
| Income Bracket | Owner-occupied | Renter-occupied |
| Less than $5,000 | 0 (0.0%) | 1 (11.1%) |
| $5,000 to $9,999 | 0 (0.0%) | 0 (0.0%) |
| $10,000 to $14,999 | 1 (0.7%) | 0 (0.0%) |
| $15,000 to $19,999 | 5 (3.4%) | 0 (0.0%) |
| $20,000 to $24,999 | 0 (0.0%) | 2 (22.2%) |
| $25,000 to $34,999 | 24 (16.2%) | 2 (22.2%) |
| $35,000 to $49,999 | 12 (8.1%) | 2 (22.2%) |
| $50,000 to $74,999 | 23 (15.5%) | 2 (22.2%) |
| $75,000 to $99,999 | 43 (29.0%) | 0 (0.0%) |
| $100,000 to $149,999 | 38 (25.7%) | 0 (0.0%) |
| $150,000 or more | 2 (1.3%) | 0 (0.0%) |
| Total | 148 (100.0%) | 9 (100.0%) |
Monthly Housing Cost Tiers in Staplehurst
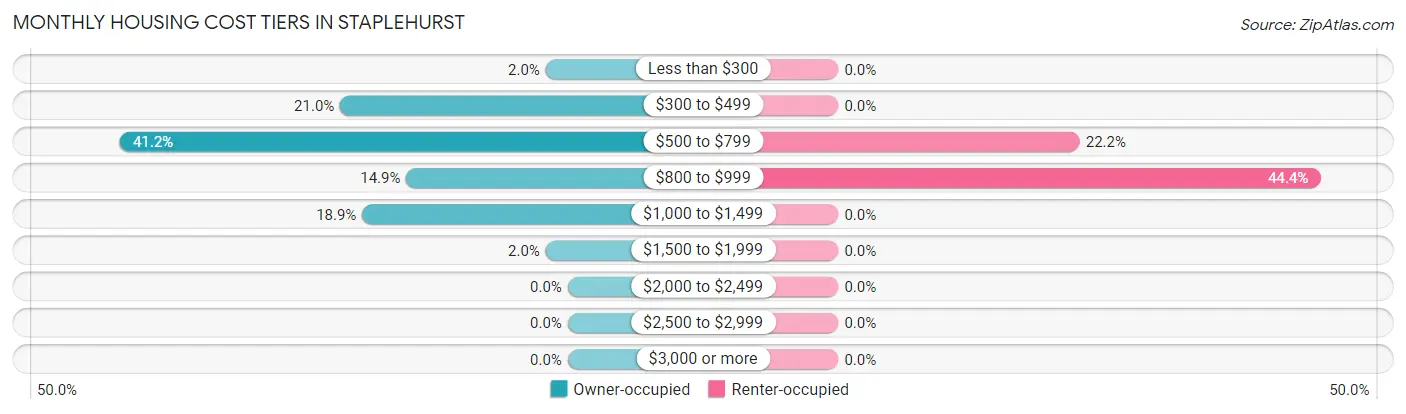
| Monthly Cost | Owner-occupied | Renter-occupied |
| Less than $300 | 3 (2.0%) | 0 (0.0%) |
| $300 to $499 | 31 (20.9%) | 0 (0.0%) |
| $500 to $799 | 61 (41.2%) | 2 (22.2%) |
| $800 to $999 | 22 (14.9%) | 4 (44.4%) |
| $1,000 to $1,499 | 28 (18.9%) | 0 (0.0%) |
| $1,500 to $1,999 | 3 (2.0%) | 0 (0.0%) |
| $2,000 to $2,499 | 0 (0.0%) | 0 (0.0%) |
| $2,500 to $2,999 | 0 (0.0%) | 0 (0.0%) |
| $3,000 or more | 0 (0.0%) | 0 (0.0%) |
| Total | 148 (100.0%) | 9 (100.0%) |
Physical Housing Characteristics in Staplehurst
Housing Structures in Staplehurst
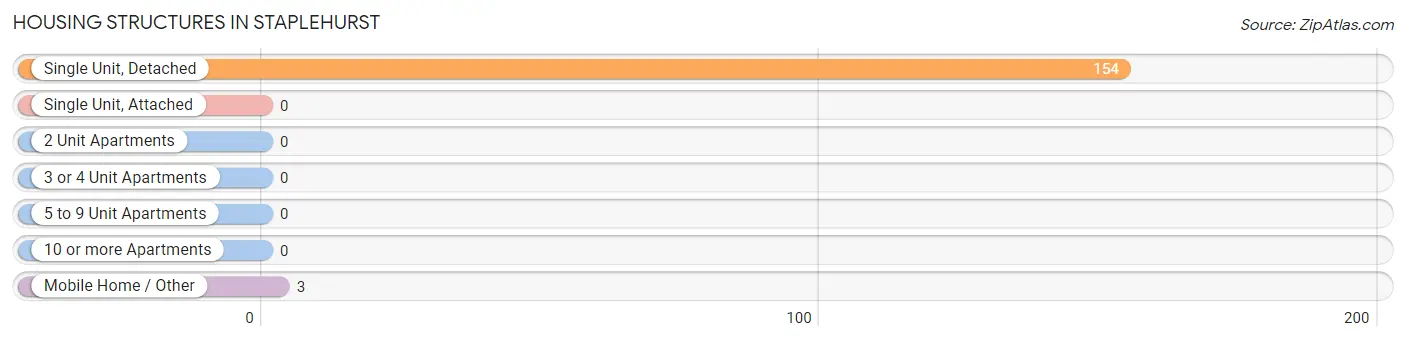
| Structure Type | # Housing Units | % Housing Units |
| Single Unit, Detached | 154 | 98.1% |
| Single Unit, Attached | 0 | 0.0% |
| 2 Unit Apartments | 0 | 0.0% |
| 3 or 4 Unit Apartments | 0 | 0.0% |
| 5 to 9 Unit Apartments | 0 | 0.0% |
| 10 or more Apartments | 0 | 0.0% |
| Mobile Home / Other | 3 | 1.9% |
| Total | 157 | 100.0% |
Housing Structures by Occupancy in Staplehurst
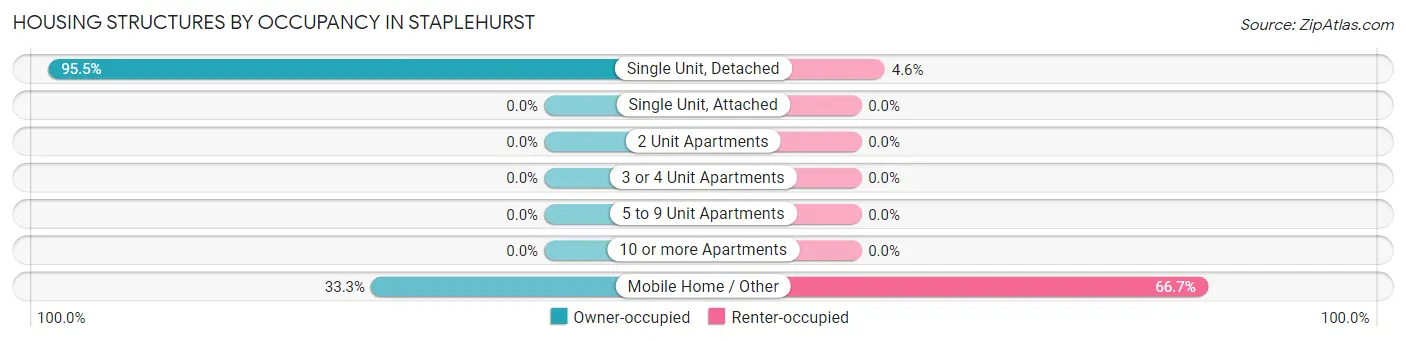
| Structure Type | Owner-occupied | Renter-occupied |
| Single Unit, Detached | 147 (95.5%) | 7 (4.5%) |
| Single Unit, Attached | 0 (0.0%) | 0 (0.0%) |
| 2 Unit Apartments | 0 (0.0%) | 0 (0.0%) |
| 3 or 4 Unit Apartments | 0 (0.0%) | 0 (0.0%) |
| 5 to 9 Unit Apartments | 0 (0.0%) | 0 (0.0%) |
| 10 or more Apartments | 0 (0.0%) | 0 (0.0%) |
| Mobile Home / Other | 1 (33.3%) | 2 (66.7%) |
| Total | 148 (94.3%) | 9 (5.7%) |
Housing Structures by Number of Rooms in Staplehurst
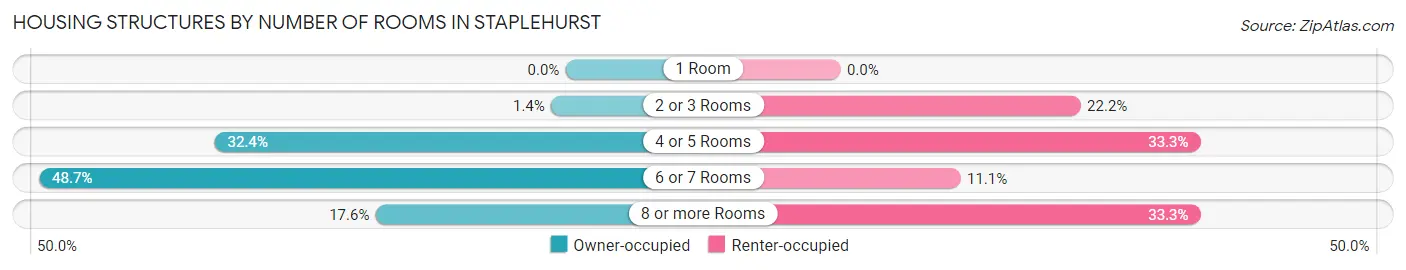
| Number of Rooms | Owner-occupied | Renter-occupied |
| 1 Room | 0 (0.0%) | 0 (0.0%) |
| 2 or 3 Rooms | 2 (1.3%) | 2 (22.2%) |
| 4 or 5 Rooms | 48 (32.4%) | 3 (33.3%) |
| 6 or 7 Rooms | 72 (48.6%) | 1 (11.1%) |
| 8 or more Rooms | 26 (17.6%) | 3 (33.3%) |
| Total | 148 (100.0%) | 9 (100.0%) |
Housing Structure by Heating Type in Staplehurst
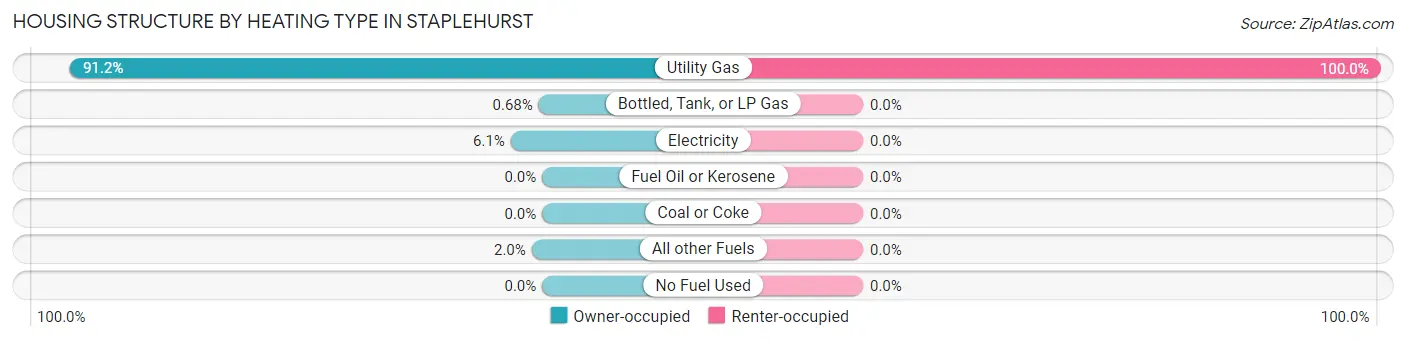
| Heating Type | Owner-occupied | Renter-occupied |
| Utility Gas | 135 (91.2%) | 9 (100.0%) |
| Bottled, Tank, or LP Gas | 1 (0.7%) | 0 (0.0%) |
| Electricity | 9 (6.1%) | 0 (0.0%) |
| Fuel Oil or Kerosene | 0 (0.0%) | 0 (0.0%) |
| Coal or Coke | 0 (0.0%) | 0 (0.0%) |
| All other Fuels | 3 (2.0%) | 0 (0.0%) |
| No Fuel Used | 0 (0.0%) | 0 (0.0%) |
| Total | 148 (100.0%) | 9 (100.0%) |
Household Vehicle Usage in Staplehurst
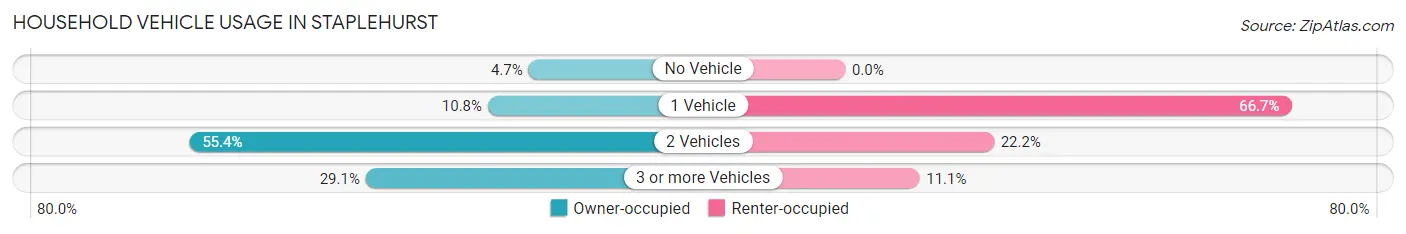
| Vehicles per Household | Owner-occupied | Renter-occupied |
| No Vehicle | 7 (4.7%) | 0 (0.0%) |
| 1 Vehicle | 16 (10.8%) | 6 (66.7%) |
| 2 Vehicles | 82 (55.4%) | 2 (22.2%) |
| 3 or more Vehicles | 43 (29.0%) | 1 (11.1%) |
| Total | 148 (100.0%) | 9 (100.0%) |
Real Estate & Mortgages in Staplehurst
Real Estate and Mortgage Overview in Staplehurst
| Characteristic | Without Mortgage | With Mortgage |
| Housing Units | 44 | 104 |
| Median Property Value | $91,400 | $61,000 |
| Median Household Income | $95,833 | $0 |
| Monthly Housing Costs | $425 | $0 |
| Real Estate Taxes | $1,262 | $0 |
Property Value by Mortgage Status in Staplehurst
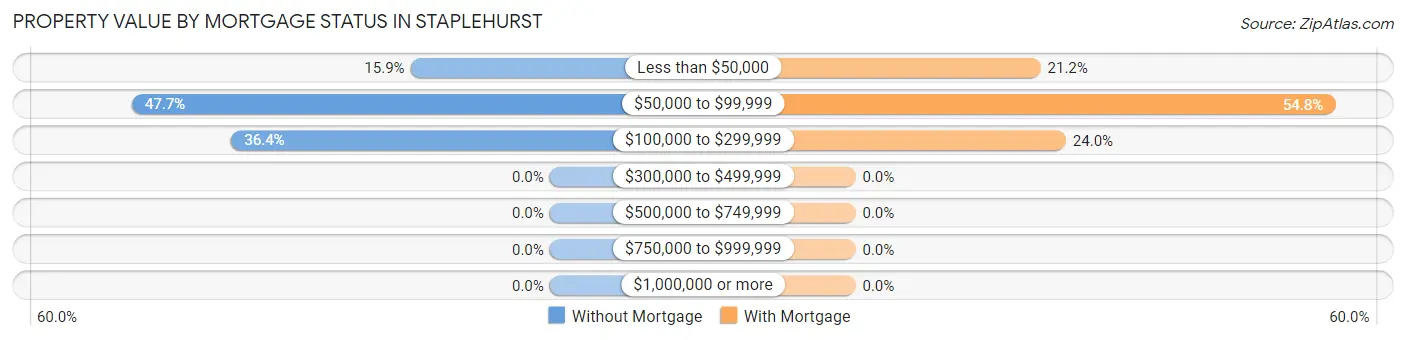
| Property Value | Without Mortgage | With Mortgage |
| Less than $50,000 | 7 (15.9%) | 22 (21.1%) |
| $50,000 to $99,999 | 21 (47.7%) | 57 (54.8%) |
| $100,000 to $299,999 | 16 (36.4%) | 25 (24.0%) |
| $300,000 to $499,999 | 0 (0.0%) | 0 (0.0%) |
| $500,000 to $749,999 | 0 (0.0%) | 0 (0.0%) |
| $750,000 to $999,999 | 0 (0.0%) | 0 (0.0%) |
| $1,000,000 or more | 0 (0.0%) | 0 (0.0%) |
| Total | 44 (100.0%) | 104 (100.0%) |
Household Income by Mortgage Status in Staplehurst
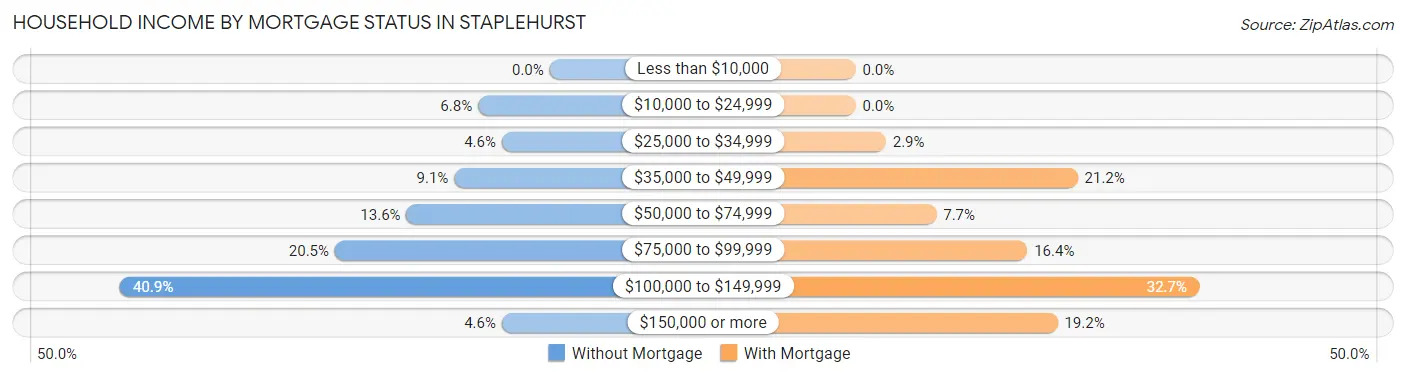
| Household Income | Without Mortgage | With Mortgage |
| Less than $10,000 | 0 (0.0%) | 0 (0.0%) |
| $10,000 to $24,999 | 3 (6.8%) | 0 (0.0%) |
| $25,000 to $34,999 | 2 (4.5%) | 3 (2.9%) |
| $35,000 to $49,999 | 4 (9.1%) | 22 (21.1%) |
| $50,000 to $74,999 | 6 (13.6%) | 8 (7.7%) |
| $75,000 to $99,999 | 9 (20.4%) | 17 (16.4%) |
| $100,000 to $149,999 | 18 (40.9%) | 34 (32.7%) |
| $150,000 or more | 2 (4.5%) | 20 (19.2%) |
| Total | 44 (100.0%) | 104 (100.0%) |
Property Value to Household Income Ratio in Staplehurst
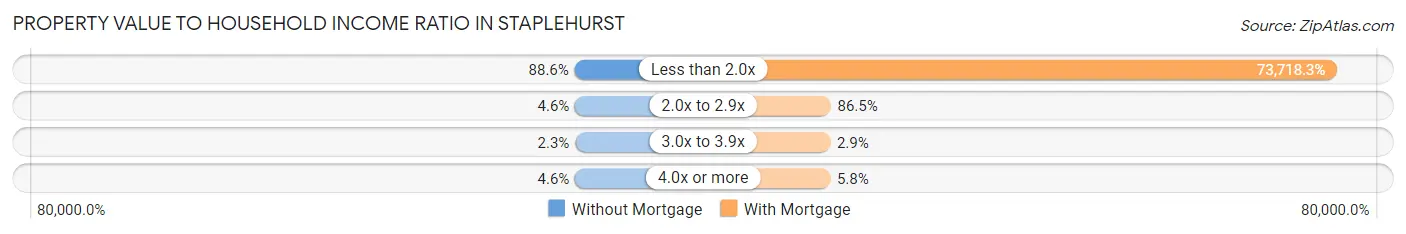
| Value-to-Income Ratio | Without Mortgage | With Mortgage |
| Less than 2.0x | 39 (88.6%) | 76,667 (73,718.3%) |
| 2.0x to 2.9x | 2 (4.5%) | 90 (86.5%) |
| 3.0x to 3.9x | 1 (2.3%) | 3 (2.9%) |
| 4.0x or more | 2 (4.5%) | 6 (5.8%) |
| Total | 44 (100.0%) | 104 (100.0%) |
Real Estate Taxes by Mortgage Status in Staplehurst
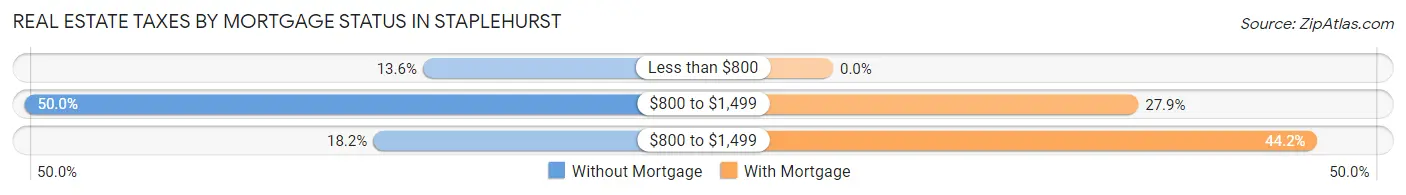
| Property Taxes | Without Mortgage | With Mortgage |
| Less than $800 | 6 (13.6%) | 0 (0.0%) |
| $800 to $1,499 | 22 (50.0%) | 29 (27.9%) |
| $800 to $1,499 | 8 (18.2%) | 46 (44.2%) |
| Total | 44 (100.0%) | 104 (100.0%) |
Health & Disability in Staplehurst
Health Insurance Coverage by Age in Staplehurst
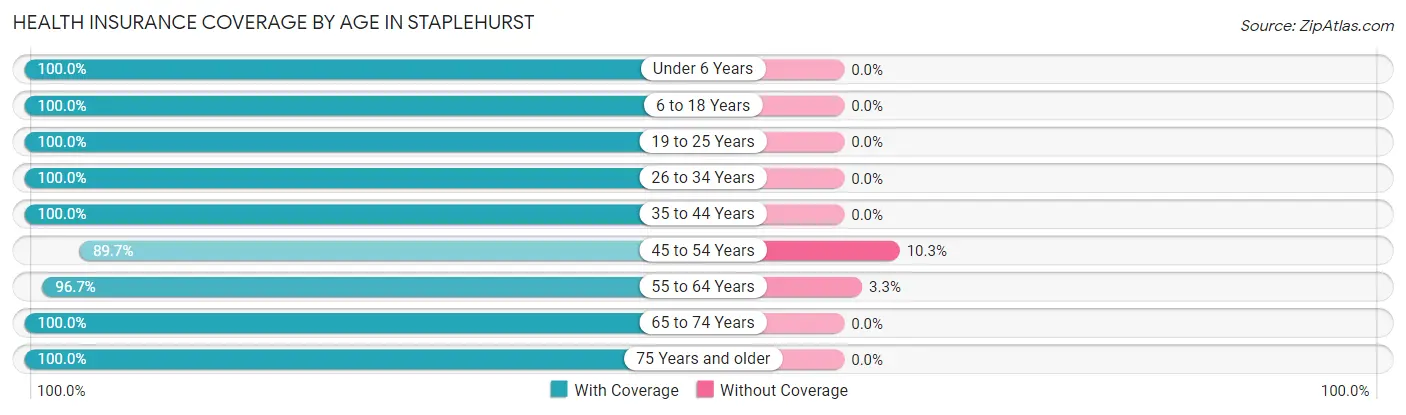
| Age Bracket | With Coverage | Without Coverage |
| Under 6 Years | 17 (100.0%) | 0 (0.0%) |
| 6 to 18 Years | 64 (100.0%) | 0 (0.0%) |
| 19 to 25 Years | 7 (100.0%) | 0 (0.0%) |
| 26 to 34 Years | 30 (100.0%) | 0 (0.0%) |
| 35 to 44 Years | 95 (100.0%) | 0 (0.0%) |
| 45 to 54 Years | 26 (89.7%) | 3 (10.3%) |
| 55 to 64 Years | 29 (96.7%) | 1 (3.3%) |
| 65 to 74 Years | 31 (100.0%) | 0 (0.0%) |
| 75 Years and older | 10 (100.0%) | 0 (0.0%) |
| Total | 309 (98.7%) | 4 (1.3%) |
Health Insurance Coverage by Citizenship Status in Staplehurst
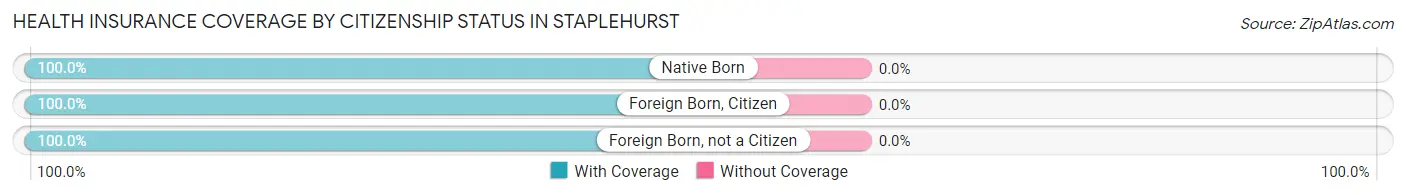
| Citizenship Status | With Coverage | Without Coverage |
| Native Born | 17 (100.0%) | 0 (0.0%) |
| Foreign Born, Citizen | 64 (100.0%) | 0 (0.0%) |
| Foreign Born, not a Citizen | 7 (100.0%) | 0 (0.0%) |
Health Insurance Coverage by Household Income in Staplehurst
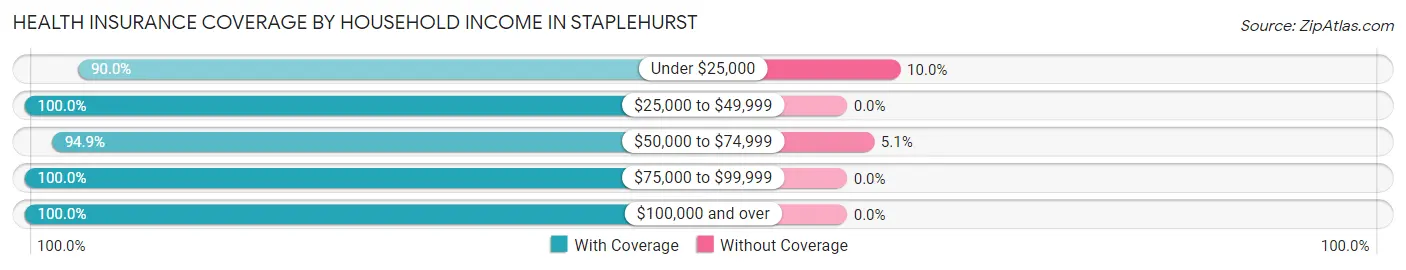
| Household Income | With Coverage | Without Coverage |
| Under $25,000 | 9 (90.0%) | 1 (10.0%) |
| $25,000 to $49,999 | 69 (100.0%) | 0 (0.0%) |
| $50,000 to $74,999 | 56 (94.9%) | 3 (5.1%) |
| $75,000 to $99,999 | 66 (100.0%) | 0 (0.0%) |
| $100,000 and over | 109 (100.0%) | 0 (0.0%) |
Public vs Private Health Insurance Coverage by Age in Staplehurst
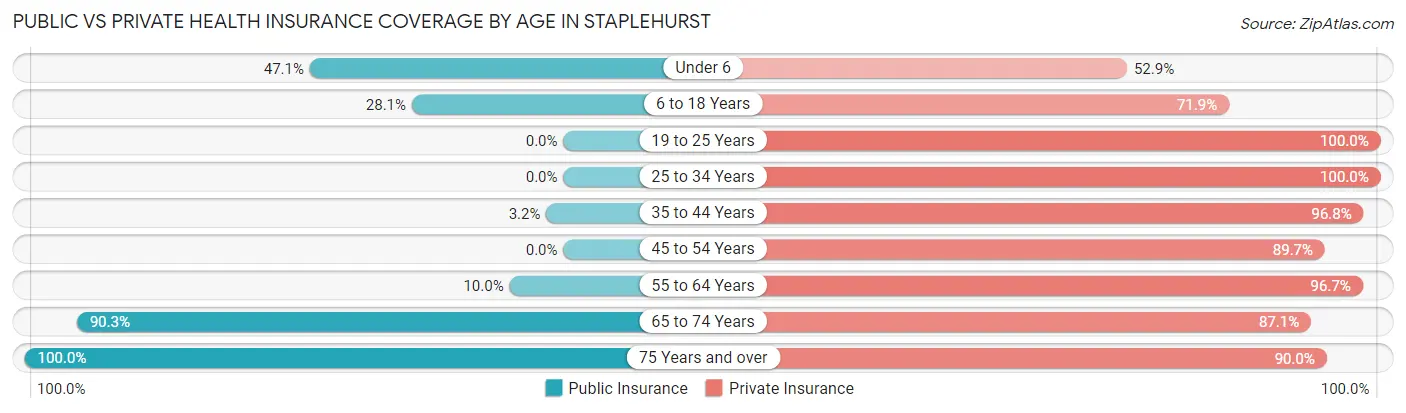
| Age Bracket | Public Insurance | Private Insurance |
| Under 6 | 8 (47.1%) | 9 (52.9%) |
| 6 to 18 Years | 18 (28.1%) | 46 (71.9%) |
| 19 to 25 Years | 0 (0.0%) | 7 (100.0%) |
| 25 to 34 Years | 0 (0.0%) | 30 (100.0%) |
| 35 to 44 Years | 3 (3.2%) | 92 (96.8%) |
| 45 to 54 Years | 0 (0.0%) | 26 (89.7%) |
| 55 to 64 Years | 3 (10.0%) | 29 (96.7%) |
| 65 to 74 Years | 28 (90.3%) | 27 (87.1%) |
| 75 Years and over | 10 (100.0%) | 9 (90.0%) |
| Total | 70 (22.4%) | 275 (87.9%) |
Disability Status by Sex by Age in Staplehurst
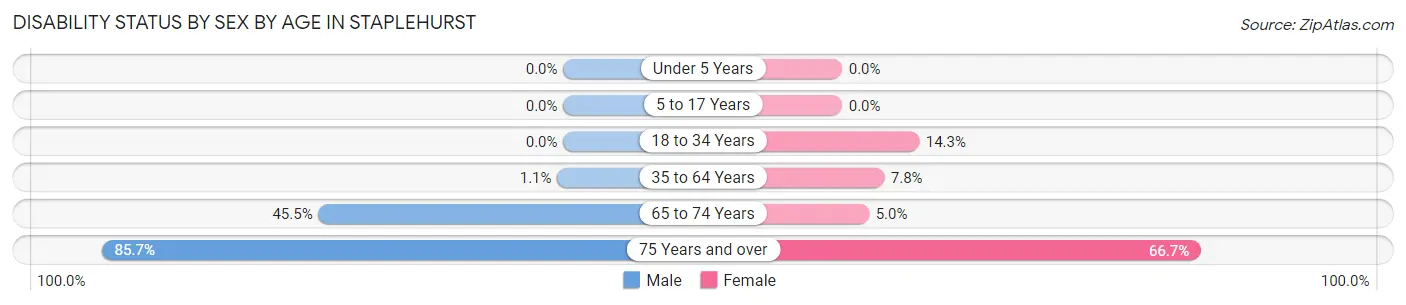
| Age Bracket | Male | Female |
| Under 5 Years | 0 (0.0%) | 0 (0.0%) |
| 5 to 17 Years | 0 (0.0%) | 0 (0.0%) |
| 18 to 34 Years | 0 (0.0%) | 2 (14.3%) |
| 35 to 64 Years | 1 (1.1%) | 5 (7.8%) |
| 65 to 74 Years | 5 (45.5%) | 1 (5.0%) |
| 75 Years and over | 6 (85.7%) | 2 (66.7%) |
Disability Class by Sex by Age in Staplehurst
Disability Class: Hearing Difficulty
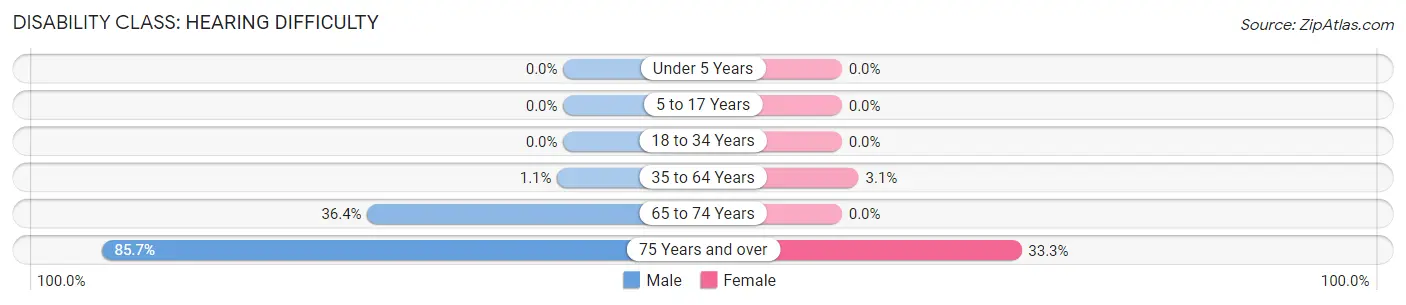
| Age Bracket | Male | Female |
| Under 5 Years | 0 (0.0%) | 0 (0.0%) |
| 5 to 17 Years | 0 (0.0%) | 0 (0.0%) |
| 18 to 34 Years | 0 (0.0%) | 0 (0.0%) |
| 35 to 64 Years | 1 (1.1%) | 2 (3.1%) |
| 65 to 74 Years | 4 (36.4%) | 0 (0.0%) |
| 75 Years and over | 6 (85.7%) | 1 (33.3%) |
Disability Class: Vision Difficulty
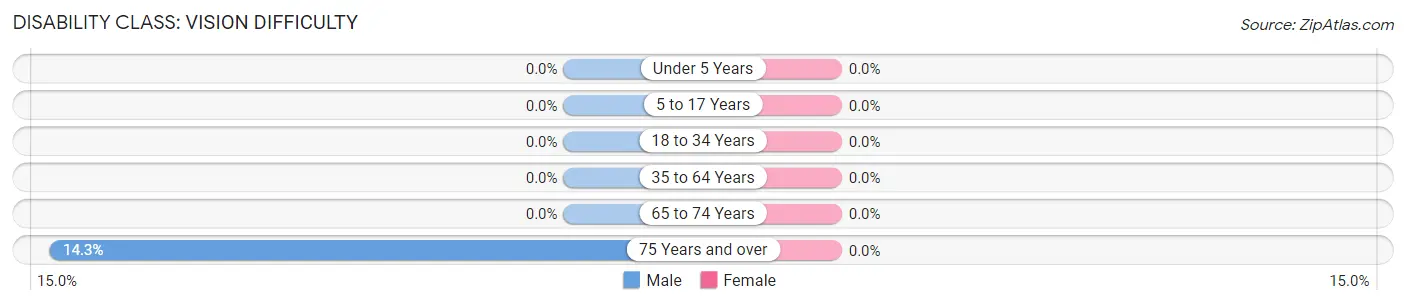
| Age Bracket | Male | Female |
| Under 5 Years | 0 (0.0%) | 0 (0.0%) |
| 5 to 17 Years | 0 (0.0%) | 0 (0.0%) |
| 18 to 34 Years | 0 (0.0%) | 0 (0.0%) |
| 35 to 64 Years | 0 (0.0%) | 0 (0.0%) |
| 65 to 74 Years | 0 (0.0%) | 0 (0.0%) |
| 75 Years and over | 1 (14.3%) | 0 (0.0%) |
Disability Class: Cognitive Difficulty
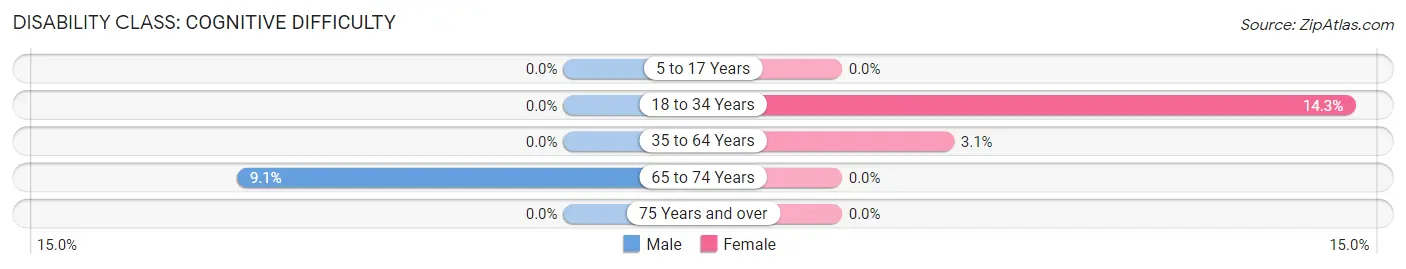
| Age Bracket | Male | Female |
| 5 to 17 Years | 0 (0.0%) | 0 (0.0%) |
| 18 to 34 Years | 0 (0.0%) | 2 (14.3%) |
| 35 to 64 Years | 0 (0.0%) | 2 (3.1%) |
| 65 to 74 Years | 1 (9.1%) | 0 (0.0%) |
| 75 Years and over | 0 (0.0%) | 0 (0.0%) |
Disability Class: Ambulatory Difficulty
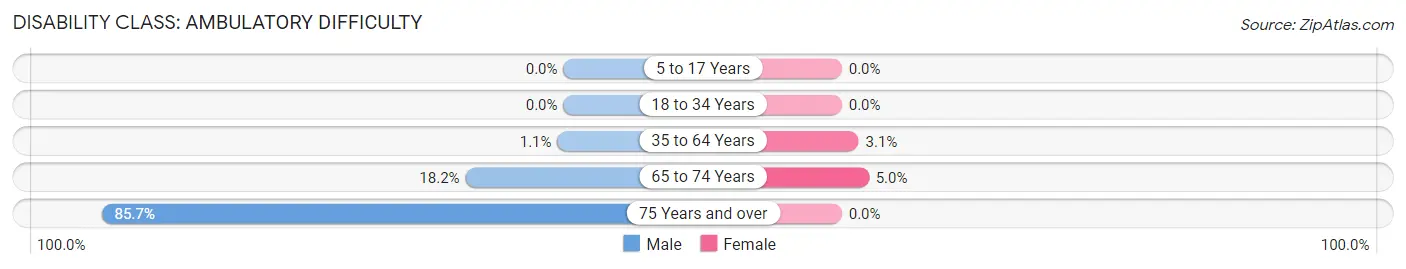
| Age Bracket | Male | Female |
| 5 to 17 Years | 0 (0.0%) | 0 (0.0%) |
| 18 to 34 Years | 0 (0.0%) | 0 (0.0%) |
| 35 to 64 Years | 1 (1.1%) | 2 (3.1%) |
| 65 to 74 Years | 2 (18.2%) | 1 (5.0%) |
| 75 Years and over | 6 (85.7%) | 0 (0.0%) |
Disability Class: Self-Care Difficulty
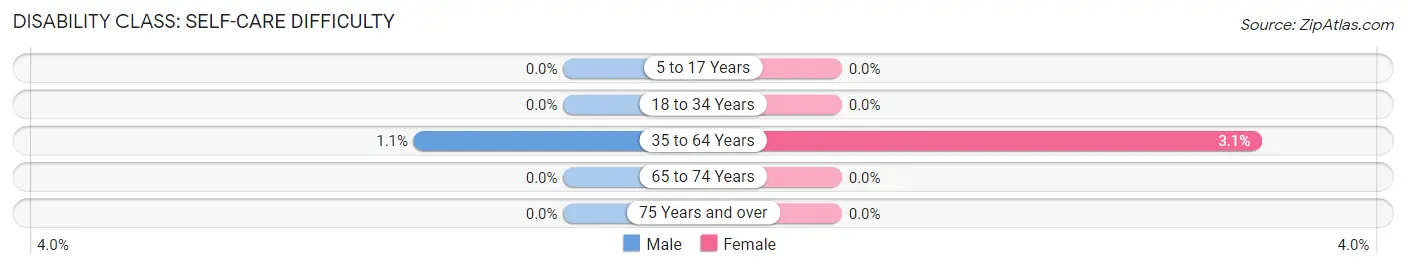
| Age Bracket | Male | Female |
| 5 to 17 Years | 0 (0.0%) | 0 (0.0%) |
| 18 to 34 Years | 0 (0.0%) | 0 (0.0%) |
| 35 to 64 Years | 1 (1.1%) | 2 (3.1%) |
| 65 to 74 Years | 0 (0.0%) | 0 (0.0%) |
| 75 Years and over | 0 (0.0%) | 0 (0.0%) |
Technology Access in Staplehurst
Computing Device Access in Staplehurst
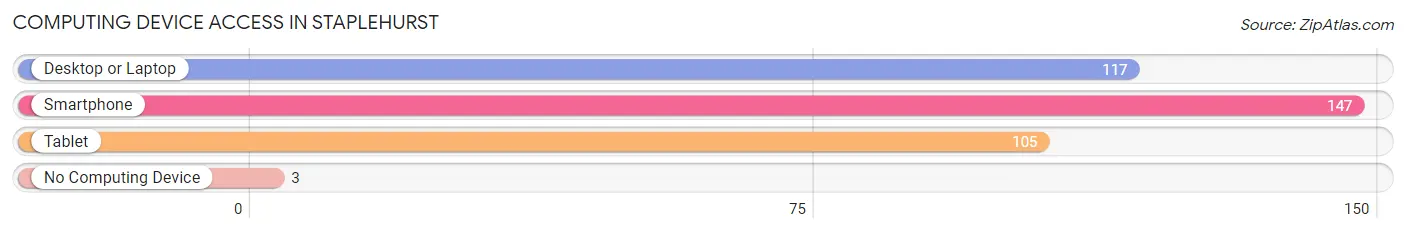
| Device Type | # Households | % Households |
| Desktop or Laptop | 117 | 74.5% |
| Smartphone | 147 | 93.6% |
| Tablet | 105 | 66.9% |
| No Computing Device | 3 | 1.9% |
| Total | 157 | 100.0% |
Internet Access in Staplehurst
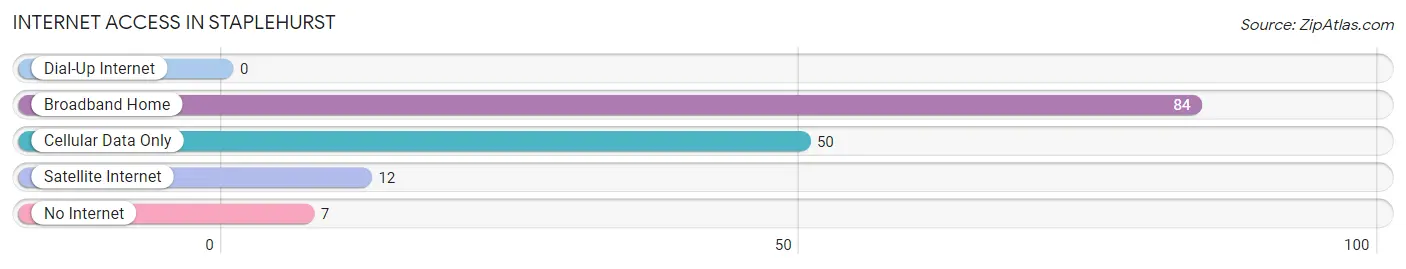
| Internet Type | # Households | % Households |
| Dial-Up Internet | 0 | 0.0% |
| Broadband Home | 84 | 53.5% |
| Cellular Data Only | 50 | 31.9% |
| Satellite Internet | 12 | 7.6% |
| No Internet | 7 | 4.5% |
| Total | 157 | 100.0% |
Staplehurst Summary
Staplehurst is a village located in the county of Kent, England. It is situated on the River Beult, approximately 8 miles (13 km) south-east of Maidstone and 6 miles (10 km) north-west of Ashford. The village has a population of around 2,500 people and is part of the Borough of Tunbridge Wells.
History
Staplehurst has a long and varied history, with evidence of human activity in the area dating back to the Iron Age. The village is mentioned in the Domesday Book of 1086, when it was known as Stapelherst. The name is derived from the Old English words ‘stapol’, meaning post, and ‘herst’, meaning wooded hill.
The village was once part of the manor of Staplehurst, which was owned by the de Stapelherst family from the 12th century until the 16th century. During this period, the manor was held by a succession of families, including the de Stapelherst, the de la Pole, the de la Warr and the de la Zouche.
In the 17th century, the manor was acquired by the Earl of Thanet, who built a large house in the village. This house was later demolished in the 19th century and replaced by a smaller house, which is now known as Staplehurst House.
Geography
Staplehurst is located in the Weald of Kent, an area of low-lying hills and valleys. The village is situated on the River Beult, which flows through the village and is crossed by a number of bridges. The village is surrounded by farmland and woodland, and is close to the North Downs.
The village is located close to the M20 motorway, which provides easy access to London and the south coast. The nearest railway station is Staplehurst, which is on the South Eastern Main Line.
Economy
Staplehurst has a thriving local economy, with a number of small businesses located in the village. These include a number of shops, pubs, restaurants and cafes. The village also has a number of small industrial units, which provide employment for local people.
The village is also home to a number of large employers, including the Staplehurst Nursery and Garden Centre, which employs around 50 people. The village is also home to a number of small-scale agricultural businesses, which provide employment for local people.
Demographics
According to the 2011 census, the population of Staplehurst was 2,521. The majority of the population (90.3%) were White British, with the remaining 9.7% being from other ethnic backgrounds. The largest minority ethnic group was Asian or Asian British, which accounted for 4.2% of the population.
The majority of the population (90.2%) were Christian, with the remaining 9.8% being of other religions or having no religion. The largest non-Christian religion was Islam, which accounted for 2.2% of the population.
The median age of the population was 43.7 years, with the majority of the population (60.2%) being aged between 45 and 64. The median household income was £30,845, which was slightly higher than the national average of £29,800.
Common Questions
What is Per Capita Income in Staplehurst?
Per Capita income in Staplehurst is $37,123.
What is the Median Family Income in Staplehurst?
Median Family Income in Staplehurst is $76,667.
What is the Median Household income in Staplehurst?
Median Household Income in Staplehurst is $77,644.
What is Income or Wage Gap in Staplehurst?
Income or Wage Gap in Staplehurst is 33.1%.
Women in Staplehurst earn 66.9 cents for every dollar earned by a man.
What is Inequality or Gini Index in Staplehurst?
Inequality or Gini Index in Staplehurst is 0.28.
What is the Total Population of Staplehurst?
Total Population of Staplehurst is 313.
What is the Total Male Population of Staplehurst?
Total Male Population of Staplehurst is 175.
What is the Total Female Population of Staplehurst?
Total Female Population of Staplehurst is 138.
What is the Ratio of Males per 100 Females in Staplehurst?
There are 126.81 Males per 100 Females in Staplehurst.
What is the Ratio of Females per 100 Males in Staplehurst?
There are 78.86 Females per 100 Males in Staplehurst.
What is the Median Population Age in Staplehurst?
Median Population Age in Staplehurst is 38.9 Years.
What is the Average Family Size in Staplehurst
Average Family Size in Staplehurst is 2.4 People.
What is the Average Household Size in Staplehurst
Average Household Size in Staplehurst is 2.0 People.
How Large is the Labor Force in Staplehurst?
There are 204 People in the Labor Forcein in Staplehurst.
What is the Percentage of People in the Labor Force in Staplehurst?
81.9% of People are in the Labor Force in Staplehurst.
What is the Unemployment Rate in Staplehurst?
Unemployment Rate in Staplehurst is 1.0%.