Kerr, MT Map & Demographics
Kerr Map
Kerr Overview
$28,650
PER CAPITA INCOME
$56,250
AVG FAMILY INCOME
$37,303
AVG HOUSEHOLD INCOME
0.37
INEQUALITY / GINI INDEX
232
TOTAL POPULATION
149
MALE POPULATION
83
FEMALE POPULATION
179.52
MALES / 100 FEMALES
55.70
FEMALES / 100 MALES
52.0
MEDIAN AGE
3.5
AVG FAMILY SIZE
2.5
AVG HOUSEHOLD SIZE
91
LABOR FORCE [ PEOPLE ]
53.2%
PERCENT IN LABOR FORCE
Income in Kerr
Income Overview in Kerr
Per Capita Income in Kerr is $28,650, while median incomes of families and households are $56,250 and $37,303 respectively.
| Characteristic | Number | Measure |
| Per Capita Income | 232 | $28,650 |
| Median Family Income | 56 | $56,250 |
| Mean Family Income | 56 | $85,300 |
| Median Household Income | 94 | $37,303 |
| Mean Household Income | 94 | $65,524 |
| Income Deficit | 56 | $0 |
| Wage / Income Gap (%) | 232 | 0.00% |
| Wage / Income Gap ($) | 232 | 100.00¢ per $1 |
| Gini / Inequality Index | 232 | 0.37 |
Earnings by Sex in Kerr
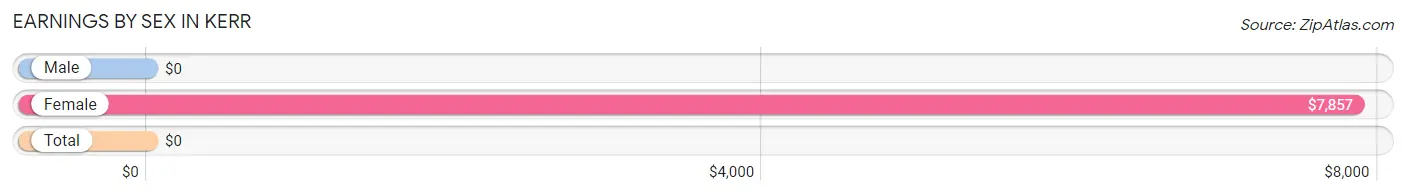
| Sex | Number | Average Earnings |
| Male | 38 (38.0%) | $0 |
| Female | 62 (62.0%) | $7,857 |
| Total | 100 (100.0%) | $0 |
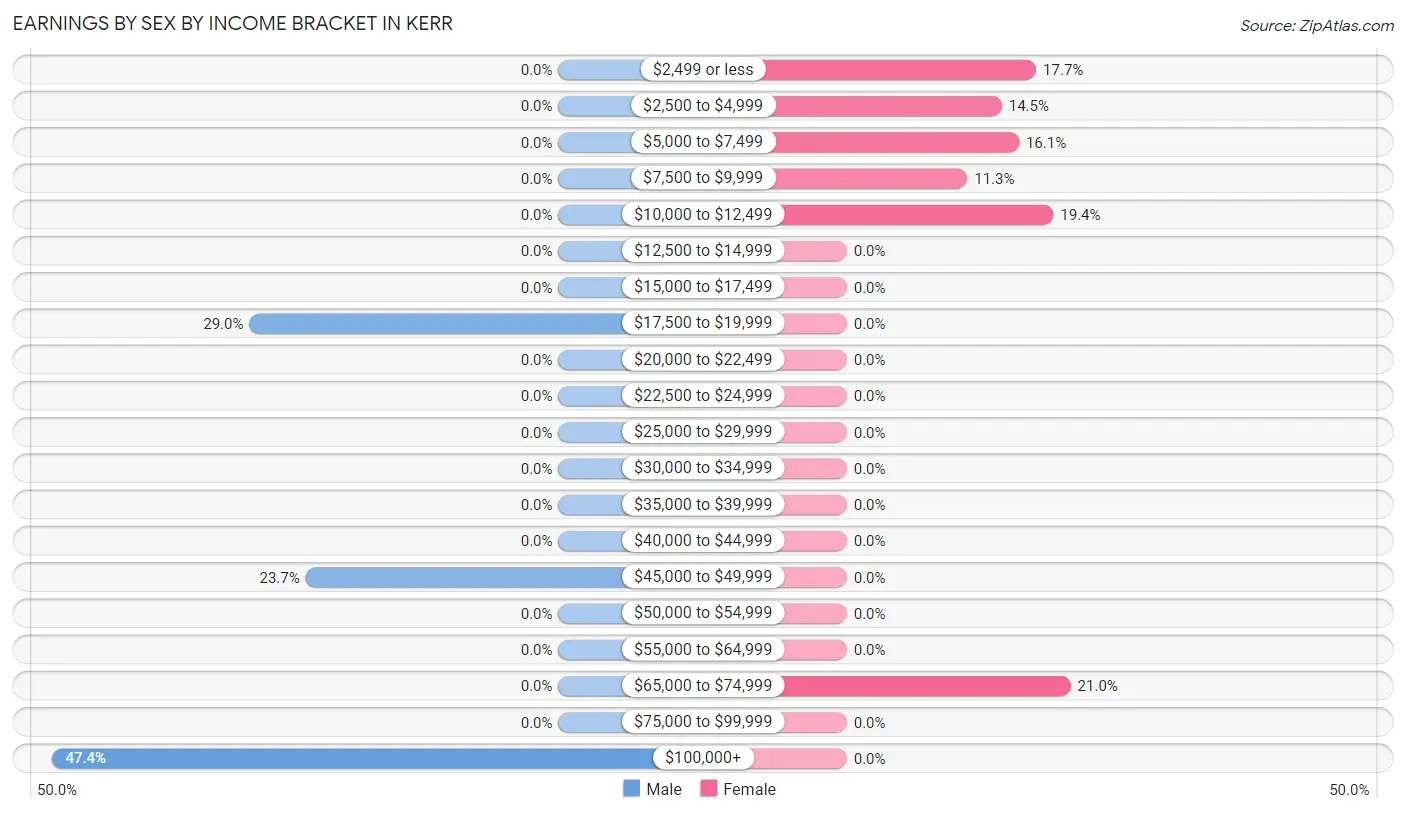
Earnings by Sex by Income Bracket in Kerr
The most common earnings brackets in Kerr are $100,000+ for men (18 | 47.4%) and $65,000 to $74,999 for women (13 | 21.0%).
| Income | Male | Female |
| $2,499 or less | 0 (0.0%) | 11 (17.7%) |
| $2,500 to $4,999 | 0 (0.0%) | 9 (14.5%) |
| $5,000 to $7,499 | 0 (0.0%) | 10 (16.1%) |
| $7,500 to $9,999 | 0 (0.0%) | 7 (11.3%) |
| $10,000 to $12,499 | 0 (0.0%) | 12 (19.4%) |
| $12,500 to $14,999 | 0 (0.0%) | 0 (0.0%) |
| $15,000 to $17,499 | 0 (0.0%) | 0 (0.0%) |
| $17,500 to $19,999 | 11 (28.9%) | 0 (0.0%) |
| $20,000 to $22,499 | 0 (0.0%) | 0 (0.0%) |
| $22,500 to $24,999 | 0 (0.0%) | 0 (0.0%) |
| $25,000 to $29,999 | 0 (0.0%) | 0 (0.0%) |
| $30,000 to $34,999 | 0 (0.0%) | 0 (0.0%) |
| $35,000 to $39,999 | 0 (0.0%) | 0 (0.0%) |
| $40,000 to $44,999 | 0 (0.0%) | 0 (0.0%) |
| $45,000 to $49,999 | 9 (23.7%) | 0 (0.0%) |
| $50,000 to $54,999 | 0 (0.0%) | 0 (0.0%) |
| $55,000 to $64,999 | 0 (0.0%) | 0 (0.0%) |
| $65,000 to $74,999 | 0 (0.0%) | 13 (21.0%) |
| $75,000 to $99,999 | 0 (0.0%) | 0 (0.0%) |
| $100,000+ | 18 (47.4%) | 0 (0.0%) |
| Total | 38 (100.0%) | 62 (100.0%) |
Earnings by Sex by Educational Attainment in Kerr
| Educational Attainment | Male Income | Female Income |
| Less than High School | - | - |
| High School Diploma | - | - |
| College or Associate's Degree | - | - |
| Bachelor's Degree | - | - |
| Graduate Degree | - | - |
| Total | - | - |
Family Income in Kerr
Family Income Brackets in Kerr
According to the Kerr family income data, there are 19 families falling into the $50,000 to $74,999 income range, which is the most common income bracket and makes up 33.9% of all families.
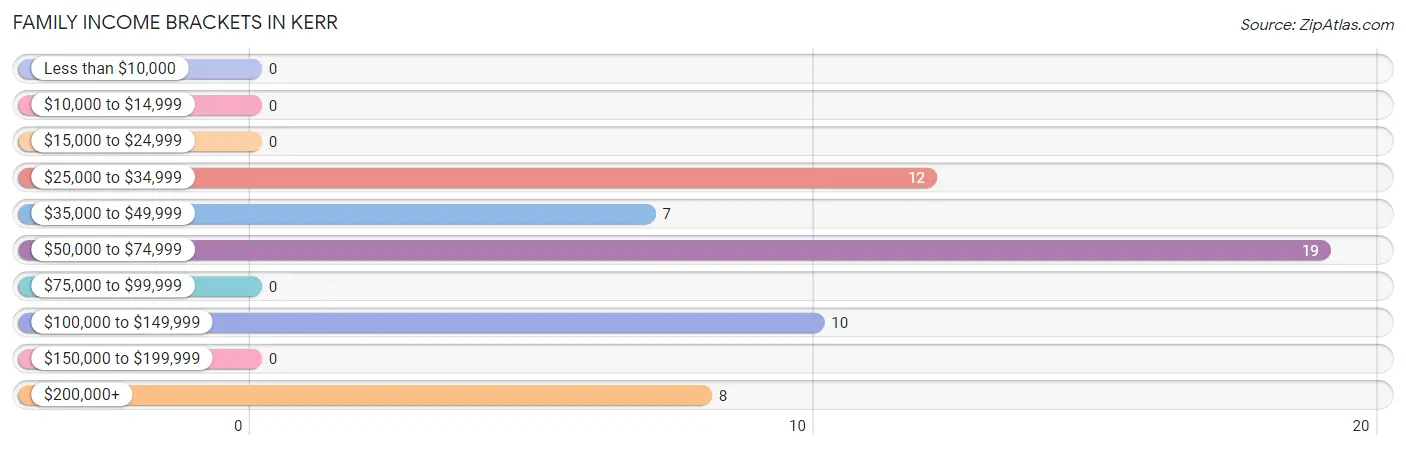
| Income Bracket | # Families | % Families |
| Less than $10,000 | 0 | 0.0% |
| $10,000 to $14,999 | 0 | 0.0% |
| $15,000 to $24,999 | 0 | 0.0% |
| $25,000 to $34,999 | 12 | 21.4% |
| $35,000 to $49,999 | 7 | 12.5% |
| $50,000 to $74,999 | 19 | 33.9% |
| $75,000 to $99,999 | 0 | 0.0% |
| $100,000 to $149,999 | 10 | 17.9% |
| $150,000 to $199,999 | 0 | 0.0% |
| $200,000+ | 8 | 14.3% |
Family Income by Famaliy Size in Kerr
2-person families (36 | 64.3%) account for the highest median family income in Kerr with $60,500 per family, while 2-person families (36 | 64.3%) have the highest median income of $30,250 per family member.
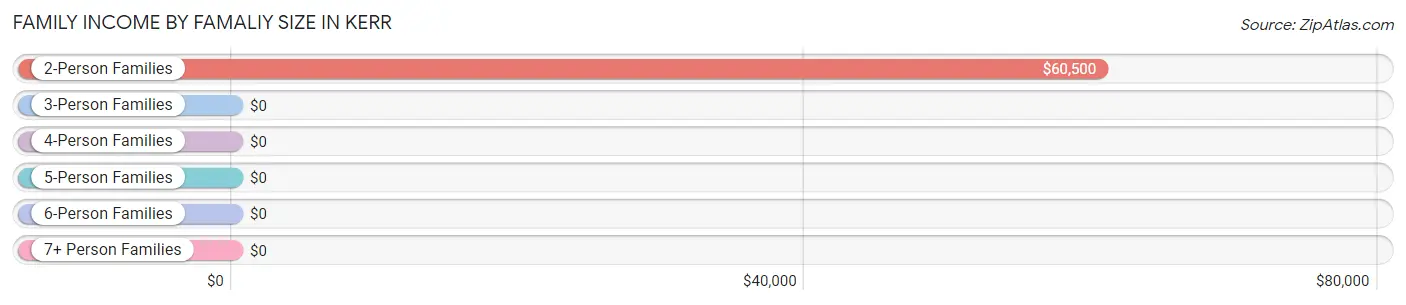
| Income Bracket | # Families | Median Income |
| 2-Person Families | 36 (64.3%) | $60,500 |
| 3-Person Families | 0 (0.0%) | $0 |
| 4-Person Families | 8 (14.3%) | $0 |
| 5-Person Families | 12 (21.4%) | $0 |
| 6-Person Families | 0 (0.0%) | $0 |
| 7+ Person Families | 0 (0.0%) | $0 |
| Total | 56 (100.0%) | $56,250 |
Family Income by Number of Earners in Kerr
| Number of Earners | # Families | Median Income |
| No Earners | 10 (17.9%) | $0 |
| 1 Earner | 7 (12.5%) | $0 |
| 2 Earners | 31 (55.4%) | $0 |
| 3+ Earners | 8 (14.3%) | $0 |
| Total | 56 (100.0%) | $56,250 |
Household Income in Kerr
Household Income Brackets in Kerr
With 45 households falling in the category, the $35,000 to $49,999 income range is the most frequent in Kerr, accounting for 47.9% of all households.
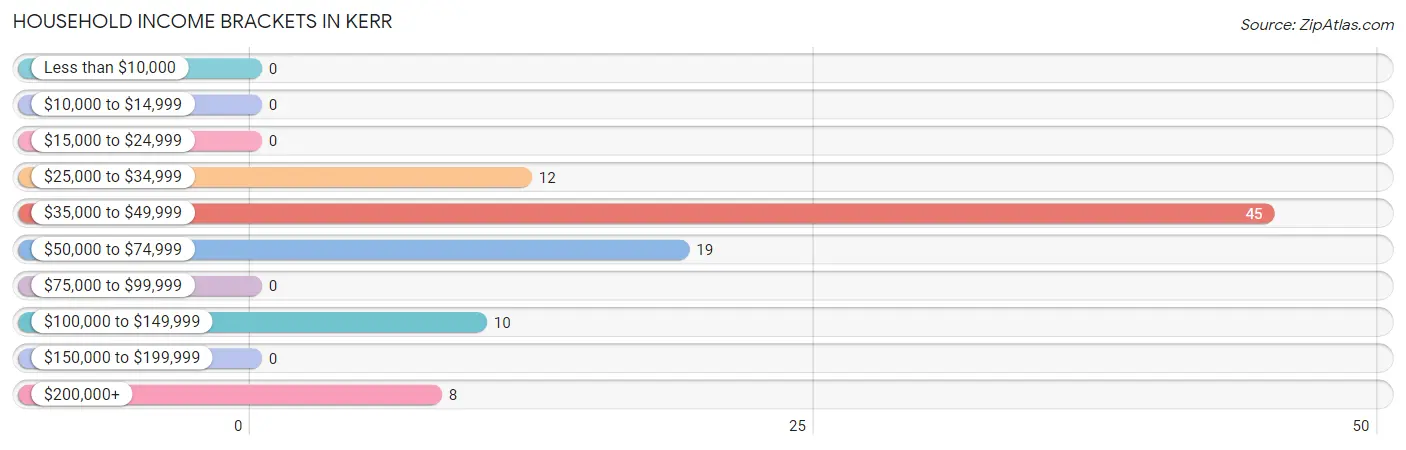
| Income Bracket | # Households | % Households |
| Less than $10,000 | 0 | 0.0% |
| $10,000 to $14,999 | 0 | 0.0% |
| $15,000 to $24,999 | 0 | 0.0% |
| $25,000 to $34,999 | 12 | 12.8% |
| $35,000 to $49,999 | 45 | 47.9% |
| $50,000 to $74,999 | 19 | 20.2% |
| $75,000 to $99,999 | 0 | 0.0% |
| $100,000 to $149,999 | 10 | 10.6% |
| $150,000 to $199,999 | 0 | 0.0% |
| $200,000+ | 8 | 8.5% |
Household Income by Householder Age in Kerr
The median household income in Kerr is $37,303, with the highest median household income of $36,809 found in the 65+ years age bracket for the primary householder. A total of 55 households (58.5%) fall into this category.
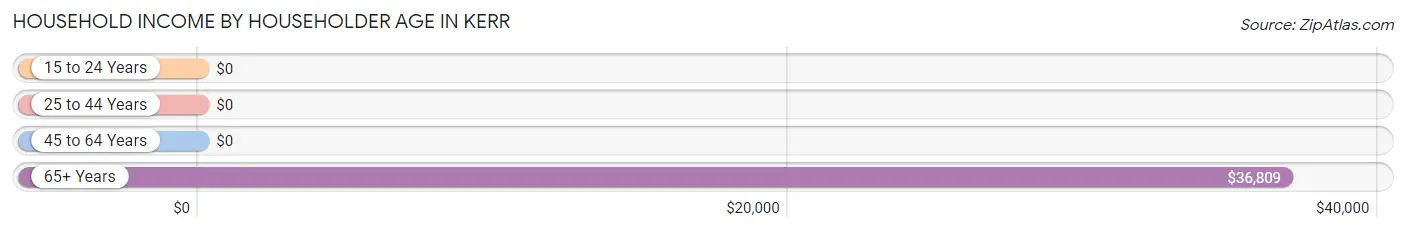
| Income Bracket | # Households | Median Income |
| 15 to 24 Years | 0 (0.0%) | $0 |
| 25 to 44 Years | 12 (12.8%) | $0 |
| 45 to 64 Years | 27 (28.7%) | $0 |
| 65+ Years | 55 (58.5%) | $36,809 |
| Total | 94 (100.0%) | $37,303 |
Poverty in Kerr
Income Below Poverty by Sex and Age in Kerr
With 19.5% poverty level for males and 27.7% for females among the residents of Kerr, 6 to 11 year old males and 6 to 11 year old females are the most vulnerable to poverty, with 9 males (100.0%) and 11 females (100.0%) in their respective age groups living below the poverty level.
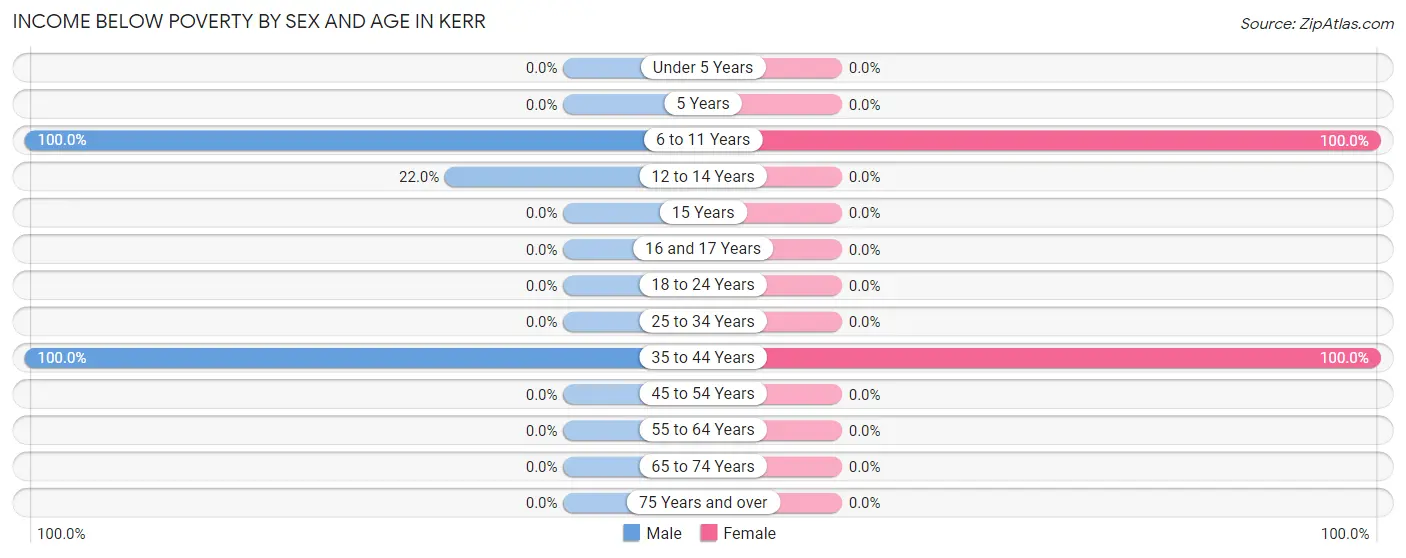
| Age Bracket | Male | Female |
| Under 5 Years | 0 (0.0%) | 0 (0.0%) |
| 5 Years | 0 (0.0%) | 0 (0.0%) |
| 6 to 11 Years | 9 (100.0%) | 11 (100.0%) |
| 12 to 14 Years | 9 (22.0%) | 0 (0.0%) |
| 15 Years | 0 (0.0%) | 0 (0.0%) |
| 16 and 17 Years | 0 (0.0%) | 0 (0.0%) |
| 18 to 24 Years | 0 (0.0%) | 0 (0.0%) |
| 25 to 34 Years | 0 (0.0%) | 0 (0.0%) |
| 35 to 44 Years | 11 (100.0%) | 12 (100.0%) |
| 45 to 54 Years | 0 (0.0%) | 0 (0.0%) |
| 55 to 64 Years | 0 (0.0%) | 0 (0.0%) |
| 65 to 74 Years | 0 (0.0%) | 0 (0.0%) |
| 75 Years and over | 0 (0.0%) | 0 (0.0%) |
| Total | 29 (19.5%) | 23 (27.7%) |
Income Above Poverty by Sex and Age in Kerr
According to the poverty statistics in Kerr, males aged 45 to 54 years and females aged 16 and 17 years are the age groups that are most secure financially, with 100.0% of males and 100.0% of females in these age groups living above the poverty line.
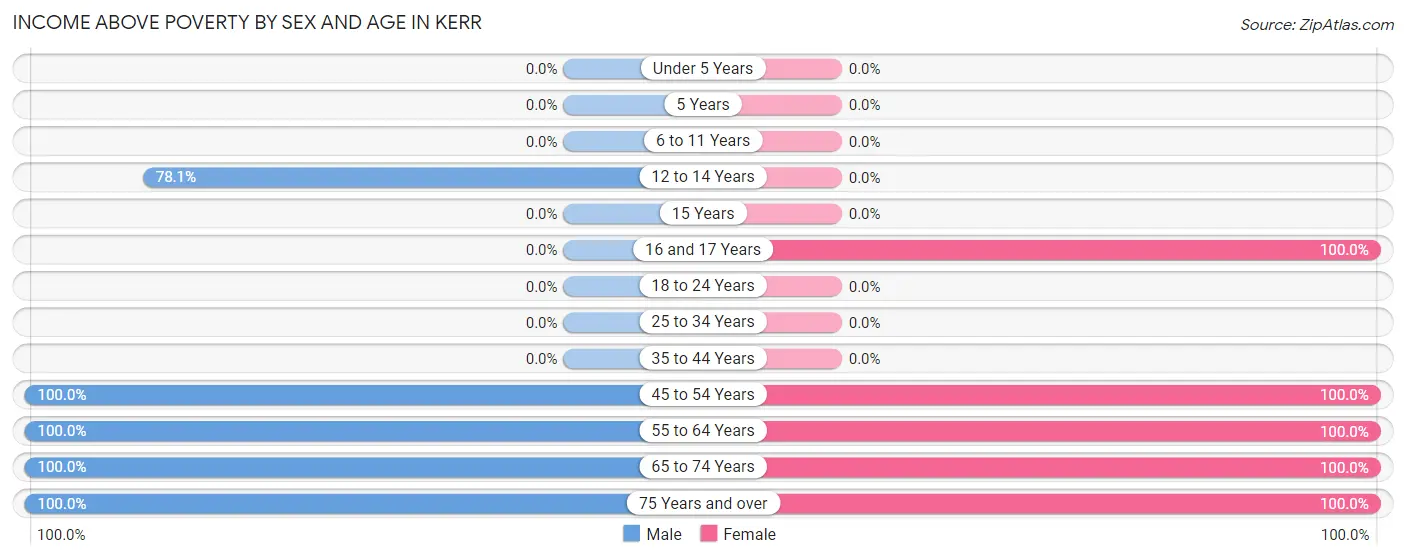
| Age Bracket | Male | Female |
| Under 5 Years | 0 (0.0%) | 0 (0.0%) |
| 5 Years | 0 (0.0%) | 0 (0.0%) |
| 6 to 11 Years | 0 (0.0%) | 0 (0.0%) |
| 12 to 14 Years | 32 (78.0%) | 0 (0.0%) |
| 15 Years | 0 (0.0%) | 0 (0.0%) |
| 16 and 17 Years | 0 (0.0%) | 11 (100.0%) |
| 18 to 24 Years | 0 (0.0%) | 0 (0.0%) |
| 25 to 34 Years | 0 (0.0%) | 0 (0.0%) |
| 35 to 44 Years | 0 (0.0%) | 0 (0.0%) |
| 45 to 54 Years | 8 (100.0%) | 13 (100.0%) |
| 55 to 64 Years | 19 (100.0%) | 19 (100.0%) |
| 65 to 74 Years | 38 (100.0%) | 7 (100.0%) |
| 75 Years and over | 23 (100.0%) | 10 (100.0%) |
| Total | 120 (80.5%) | 60 (72.3%) |
Income Below Poverty Among Married-Couple Families in Kerr
The poverty statistics for married-couple families in Kerr show that 21.4% or 12 of the total 56 families live below the poverty line. Families with 3 or 4 children have the highest poverty rate of 100.0%, comprising of 12 families. On the other hand, families with no children have the lowest poverty rate of 0.0%, which includes 0 families.
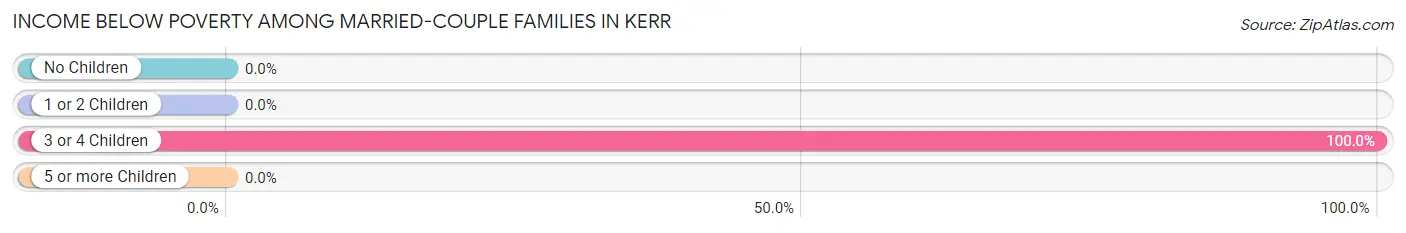
| Children | Above Poverty | Below Poverty |
| No Children | 36 (100.0%) | 0 (0.0%) |
| 1 or 2 Children | 8 (100.0%) | 0 (0.0%) |
| 3 or 4 Children | 0 (0.0%) | 12 (100.0%) |
| 5 or more Children | 0 (0.0%) | 0 (0.0%) |
| Total | 44 (78.6%) | 12 (21.4%) |
Income Below Poverty Among Single-Parent Households in Kerr
| Children | Single Father | Single Mother |
| No Children | 0 (0.0%) | 0 (0.0%) |
| 1 or 2 Children | 0 (0.0%) | 0 (0.0%) |
| 3 or 4 Children | 0 (0.0%) | 0 (0.0%) |
| 5 or more Children | 0 (0.0%) | 0 (0.0%) |
| Total | 0 (0.0%) | 0 (0.0%) |
Income Below Poverty Among Married-Couple vs Single-Parent Households in Kerr
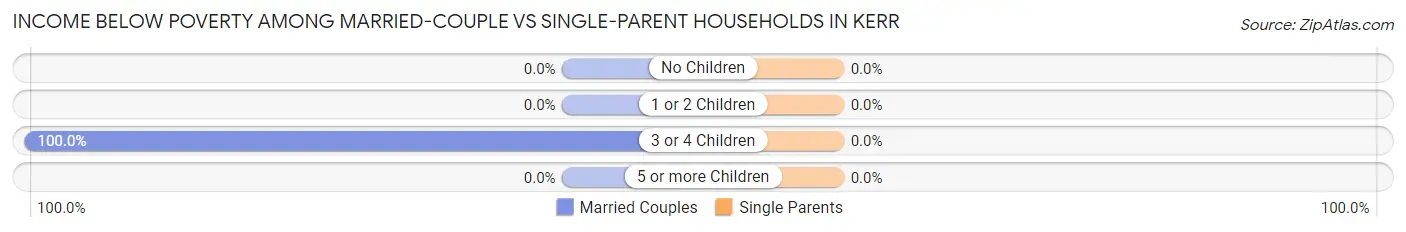
| Children | Married-Couple Families | Single-Parent Households |
| No Children | 0 (0.0%) | 0 (0.0%) |
| 1 or 2 Children | 0 (0.0%) | 0 (0.0%) |
| 3 or 4 Children | 12 (100.0%) | 0 (0.0%) |
| 5 or more Children | 0 (0.0%) | 0 (0.0%) |
| Total | 12 (21.4%) | 0 (0.0%) |
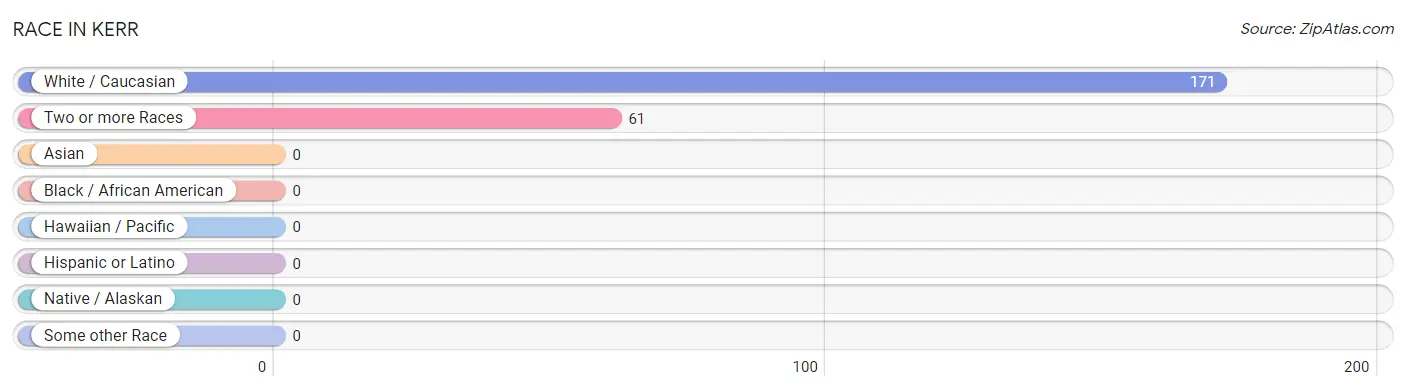
Race in Kerr
The most populous races in Kerr are White / Caucasian (171 | 73.7%), and Two or more Races (61 | 26.3%).
| Race | # Population | % Population |
| Asian | 0 | 0.0% |
| Black / African American | 0 | 0.0% |
| Hawaiian / Pacific | 0 | 0.0% |
| Hispanic or Latino | 0 | 0.0% |
| Native / Alaskan | 0 | 0.0% |
| White / Caucasian | 171 | 73.7% |
| Two or more Races | 61 | 26.3% |
| Some other Race | 0 | 0.0% |
| Total | 232 | 100.0% |
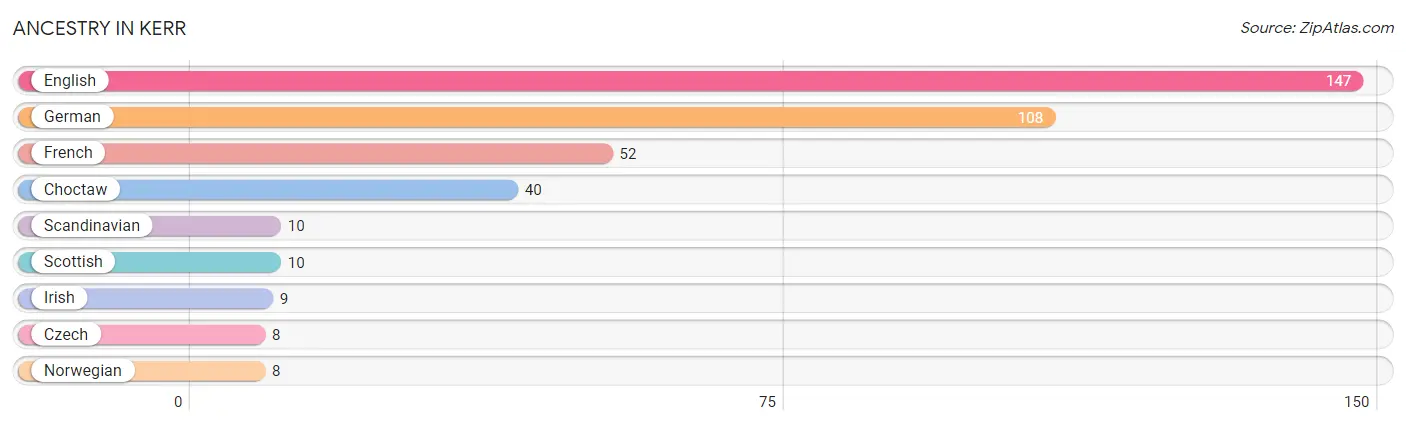
Ancestry in Kerr
The most populous ancestries reported in Kerr are English (147 | 63.4%), German (108 | 46.6%), French (52 | 22.4%), Choctaw (40 | 17.2%), and Scandinavian (10 | 4.3%), together accounting for 153.9% of all Kerr residents.
| Ancestry | # Population | % Population |
| Choctaw | 40 | 17.2% |
| Czech | 8 | 3.5% |
| English | 147 | 63.4% |
| French | 52 | 22.4% |
| German | 108 | 46.6% |
| Irish | 9 | 3.9% |
| Norwegian | 8 | 3.5% |
| Scandinavian | 10 | 4.3% |
| Scottish | 10 | 4.3% | View All 9 Rows |
Immigrants in Kerr

| Immigration Origin | # Population | % Population | View All 0 Rows |
Sex and Age in Kerr
Sex and Age in Kerr
The most populous age groups in Kerr are 10 to 14 Years (41 | 27.5%) for men and 45 to 49 Years (13 | 15.7%) for women.
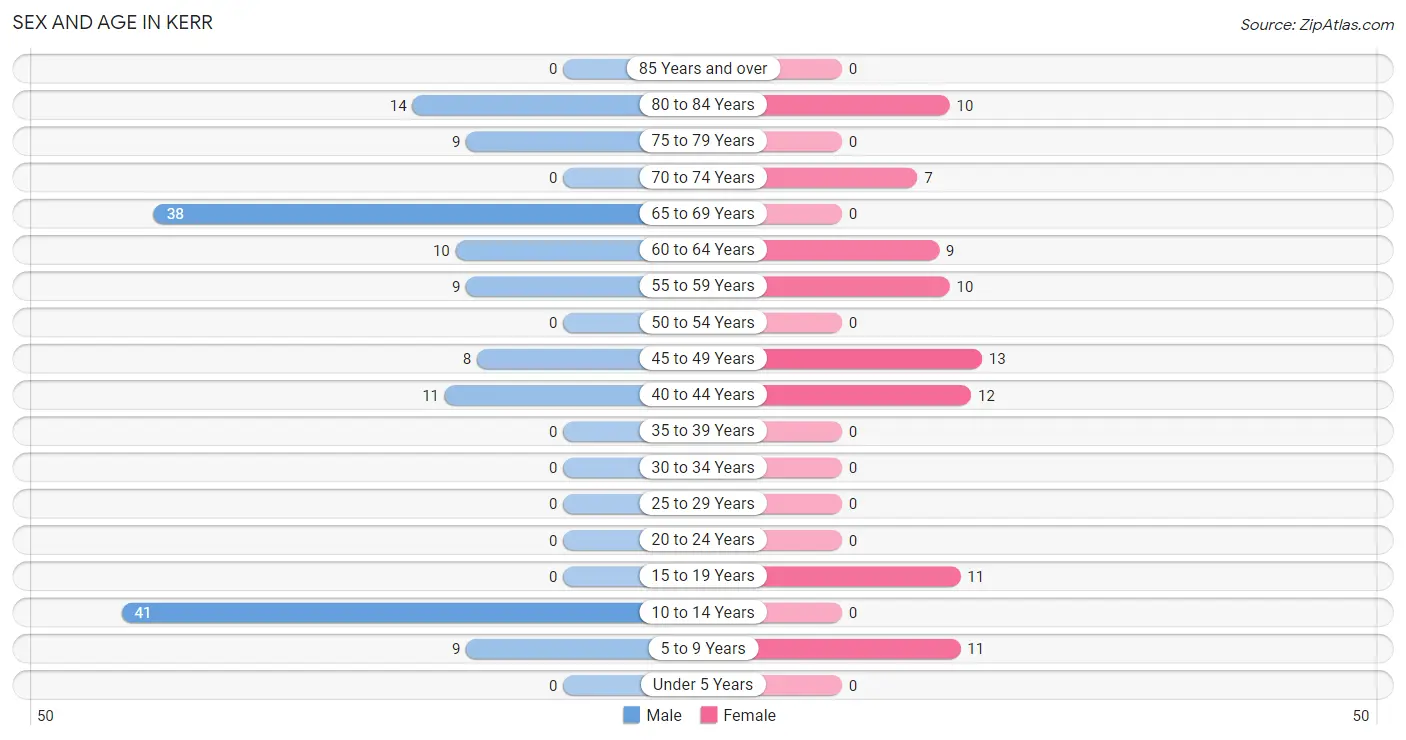
| Age Bracket | Male | Female |
| Under 5 Years | 0 (0.0%) | 0 (0.0%) |
| 5 to 9 Years | 9 (6.0%) | 11 (13.3%) |
| 10 to 14 Years | 41 (27.5%) | 0 (0.0%) |
| 15 to 19 Years | 0 (0.0%) | 11 (13.3%) |
| 20 to 24 Years | 0 (0.0%) | 0 (0.0%) |
| 25 to 29 Years | 0 (0.0%) | 0 (0.0%) |
| 30 to 34 Years | 0 (0.0%) | 0 (0.0%) |
| 35 to 39 Years | 0 (0.0%) | 0 (0.0%) |
| 40 to 44 Years | 11 (7.4%) | 12 (14.5%) |
| 45 to 49 Years | 8 (5.4%) | 13 (15.7%) |
| 50 to 54 Years | 0 (0.0%) | 0 (0.0%) |
| 55 to 59 Years | 9 (6.0%) | 10 (12.0%) |
| 60 to 64 Years | 10 (6.7%) | 9 (10.8%) |
| 65 to 69 Years | 38 (25.5%) | 0 (0.0%) |
| 70 to 74 Years | 0 (0.0%) | 7 (8.4%) |
| 75 to 79 Years | 9 (6.0%) | 0 (0.0%) |
| 80 to 84 Years | 14 (9.4%) | 10 (12.0%) |
| 85 Years and over | 0 (0.0%) | 0 (0.0%) |
| Total | 149 (100.0%) | 83 (100.0%) |
Families and Households in Kerr
Median Family Size in Kerr
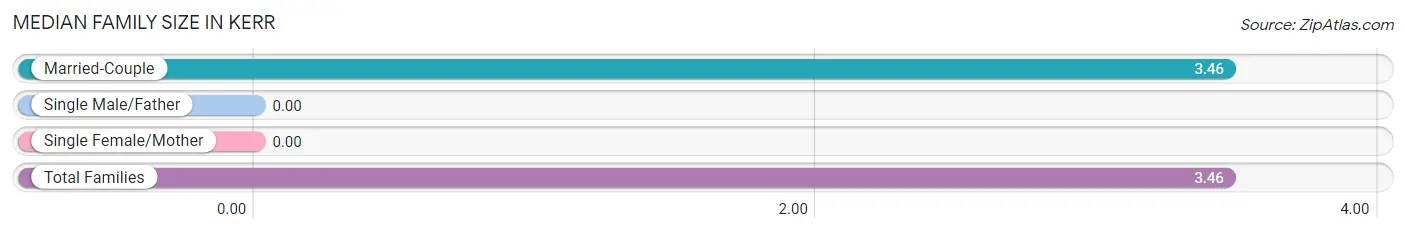
| Family Type | # Families | Family Size |
| Married-Couple | 56 (100.0%) | 3.46 |
| Single Male/Father | 0 (0.0%) | - |
| Single Female/Mother | 0 (0.0%) | - |
| Total Families | 56 (100.0%) | 3.46 |
Median Household Size in Kerr
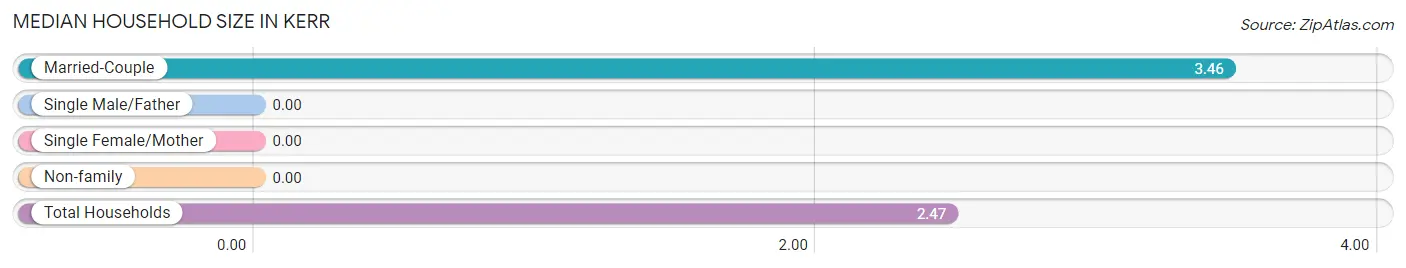
| Household Type | # Households | Household Size |
| Married-Couple | 56 (59.6%) | 3.46 |
| Single Male/Father | 0 (0.0%) | - |
| Single Female/Mother | 0 (0.0%) | - |
| Non-family | 38 (40.4%) | - |
| Total Households | 94 (100.0%) | 2.47 |
Household Size by Marriage Status in Kerr
Out of a total of 94 households in Kerr, 56 (59.6%) are family households, while 38 (40.4%) are nonfamily households. The most numerous type of family households are 2-person households, comprising 36, and the most common type of nonfamily households are 1-person households, comprising 38.
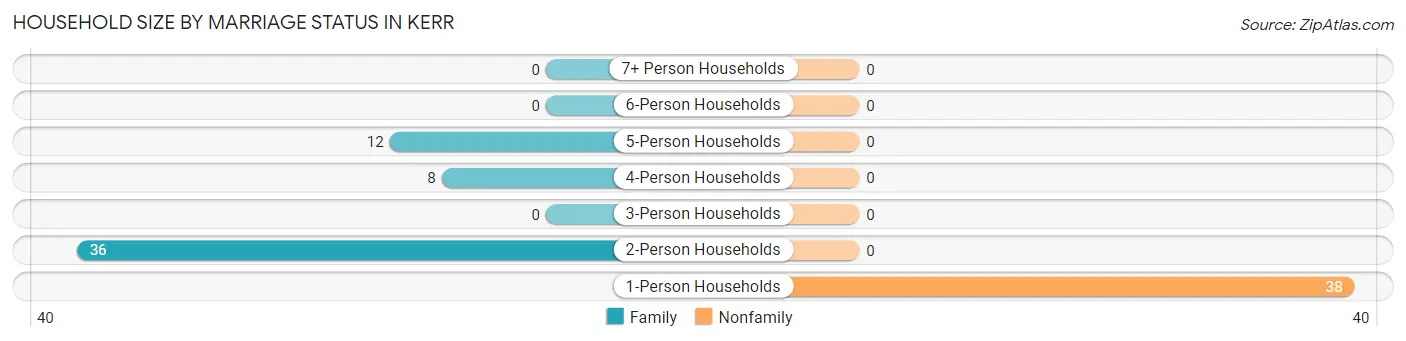
| Household Size | Family Households | Nonfamily Households |
| 1-Person Households | - | 38 (40.4%) |
| 2-Person Households | 36 (38.3%) | 0 (0.0%) |
| 3-Person Households | 0 (0.0%) | 0 (0.0%) |
| 4-Person Households | 8 (8.5%) | 0 (0.0%) |
| 5-Person Households | 12 (12.8%) | 0 (0.0%) |
| 6-Person Households | 0 (0.0%) | 0 (0.0%) |
| 7+ Person Households | 0 (0.0%) | 0 (0.0%) |
| Total | 56 (59.6%) | 38 (40.4%) |
Female Fertility in Kerr
Fertility by Age in Kerr
| Age Bracket | Women with Births | Births / 1,000 Women |
| 15 to 19 years | 0 (0.0%) | 0.0 |
| 20 to 34 years | 0 (0.0%) | 0.0 |
| 35 to 50 years | 0 (0.0%) | 0.0 |
| Total | 0 (0.0%) | 0.0 |
Fertility by Age by Marriage Status in Kerr
| Age Bracket | Married | Unmarried |
| 15 to 19 years | 0 (0.0%) | 0 (0.0%) |
| 20 to 34 years | 0 (0.0%) | 0 (0.0%) |
| 35 to 50 years | 0 (0.0%) | 0 (0.0%) |
| Total | 0 (0.0%) | 0 (0.0%) |
Fertility by Education in Kerr
| Educational Attainment | Women with Births | Births / 1,000 Women |
| Less than High School | 0 (0.0%) | 0.0 |
| High School Diploma | 0 (0.0%) | 0.0 |
| College or Associate's Degree | 0 (0.0%) | 0.0 |
| Bachelor's Degree | 0 (0.0%) | 0.0 |
| Graduate Degree | 0 (0.0%) | 0.0 |
| Total | 0 (0.0%) | 0.0 |
Fertility by Education by Marriage Status in Kerr
| Educational Attainment | Married | Unmarried |
| Less than High School | 0 (0.0%) | 0 (0.0%) |
| High School Diploma | 0 (0.0%) | 0 (0.0%) |
| College or Associate's Degree | 0 (0.0%) | 0 (0.0%) |
| Bachelor's Degree | 0 (0.0%) | 0 (0.0%) |
| Graduate Degree | 0 (0.0%) | 0 (0.0%) |
| Total | 0 (0.0%) | 0 (0.0%) |
Employment Characteristics in Kerr
Employment by Class of Employer in Kerr
Among the 61 employed individuals in Kerr, private company employees (28 | 45.9%), local government employees (23 | 37.7%), and self-employed (incorporated) (10 | 16.4%) make up the most common classes of employment.
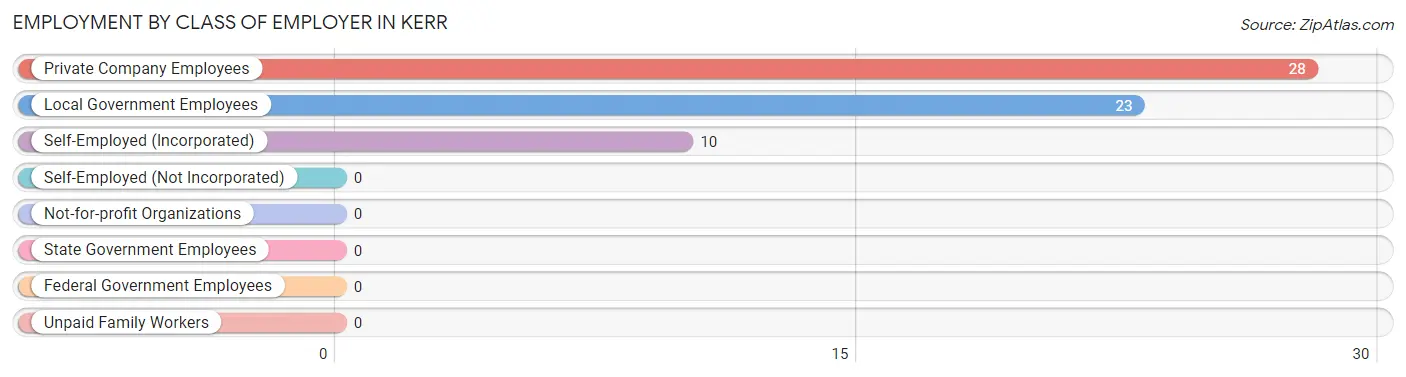
| Employer Class | # Employees | % Employees |
| Private Company Employees | 28 | 45.9% |
| Self-Employed (Incorporated) | 10 | 16.4% |
| Self-Employed (Not Incorporated) | 0 | 0.0% |
| Not-for-profit Organizations | 0 | 0.0% |
| Local Government Employees | 23 | 37.7% |
| State Government Employees | 0 | 0.0% |
| Federal Government Employees | 0 | 0.0% |
| Unpaid Family Workers | 0 | 0.0% |
| Total | 61 | 100.0% |
Employment Status by Age in Kerr
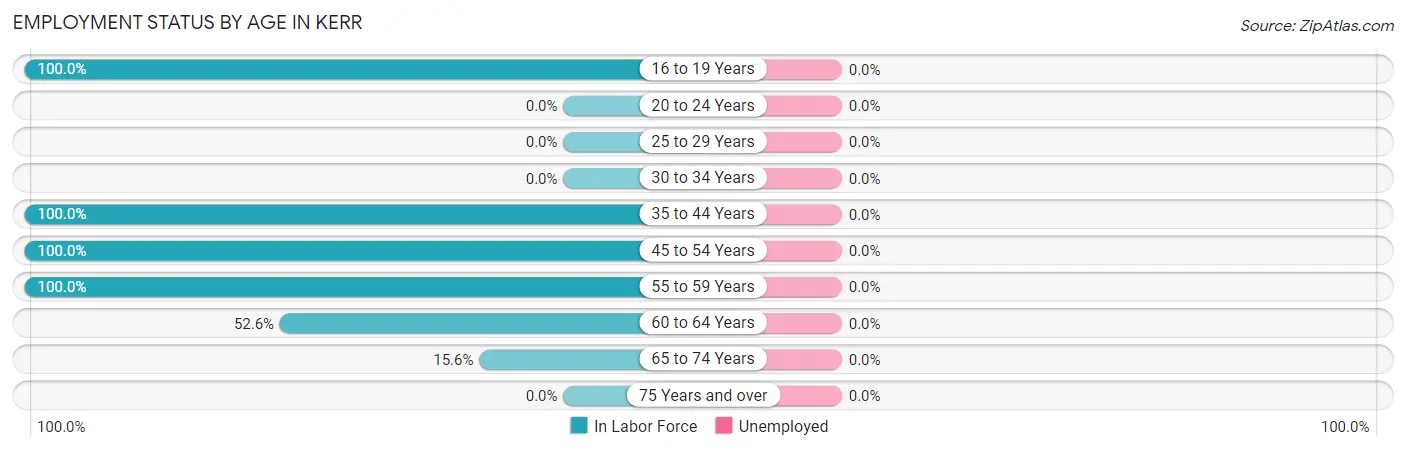
| Age Bracket | In Labor Force | Unemployed |
| 16 to 19 Years | 11 (100.0%) | 0 (0.0%) |
| 20 to 24 Years | 0 (0.0%) | 0 (0.0%) |
| 25 to 29 Years | 0 (0.0%) | 0 (0.0%) |
| 30 to 34 Years | 0 (0.0%) | 0 (0.0%) |
| 35 to 44 Years | 23 (100.0%) | 0 (0.0%) |
| 45 to 54 Years | 21 (100.0%) | 0 (0.0%) |
| 55 to 59 Years | 19 (100.0%) | 0 (0.0%) |
| 60 to 64 Years | 10 (52.6%) | 0 (0.0%) |
| 65 to 74 Years | 7 (15.6%) | 0 (0.0%) |
| 75 Years and over | 0 (0.0%) | 0 (0.0%) |
| Total | 91 (53.2%) | 0 (0.0%) |
Employment Status by Educational Attainment in Kerr
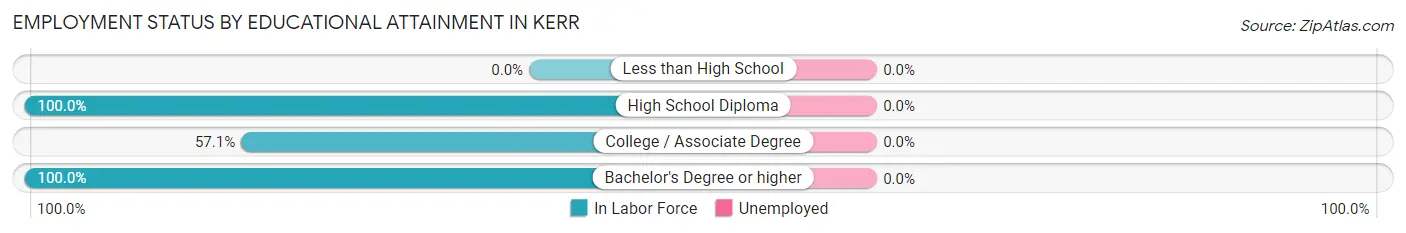
| Educational Attainment | In Labor Force | Unemployed |
| Less than High School | 0 (0.0%) | 0 (0.0%) |
| High School Diploma | 30 (100.0%) | 0 (0.0%) |
| College / Associate Degree | 12 (57.1%) | 0 (0.0%) |
| Bachelor's Degree or higher | 31 (100.0%) | 0 (0.0%) |
| Total | 73 (89.0%) | 0 (0.0%) |
Employment Occupations by Sex in Kerr
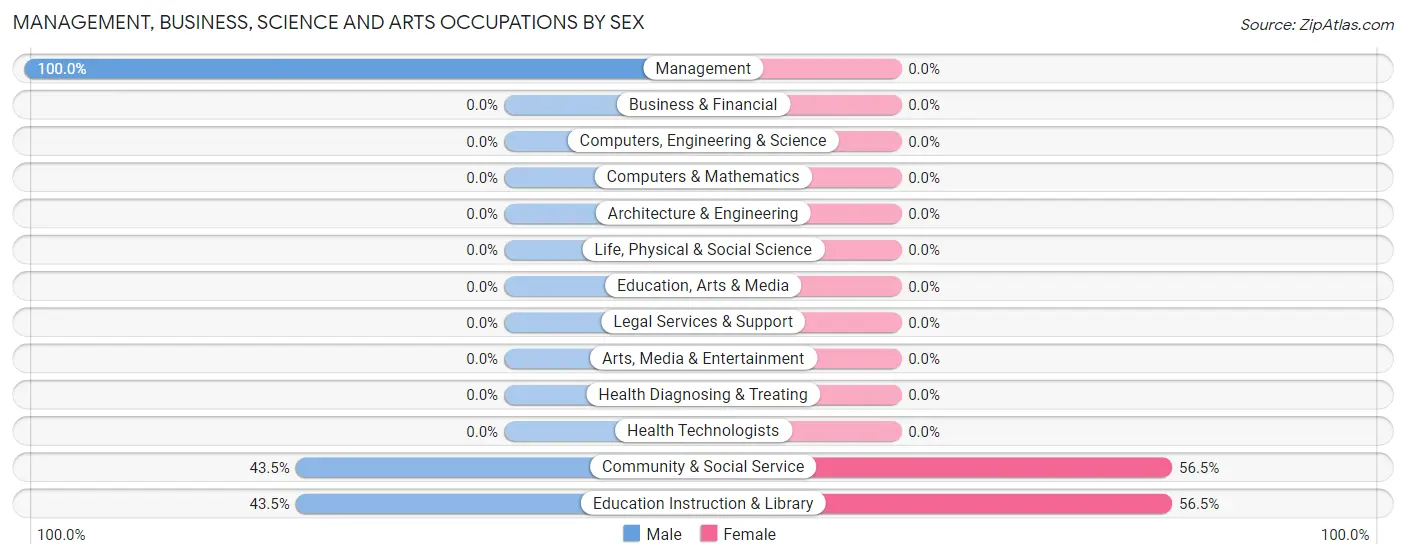
Management, Business, Science and Arts Occupations
The most common Management, Business, Science and Arts occupations in Kerr are Community & Social Service (23 | 25.3%), Education Instruction & Library (23 | 25.3%), and Management (8 | 8.8%).
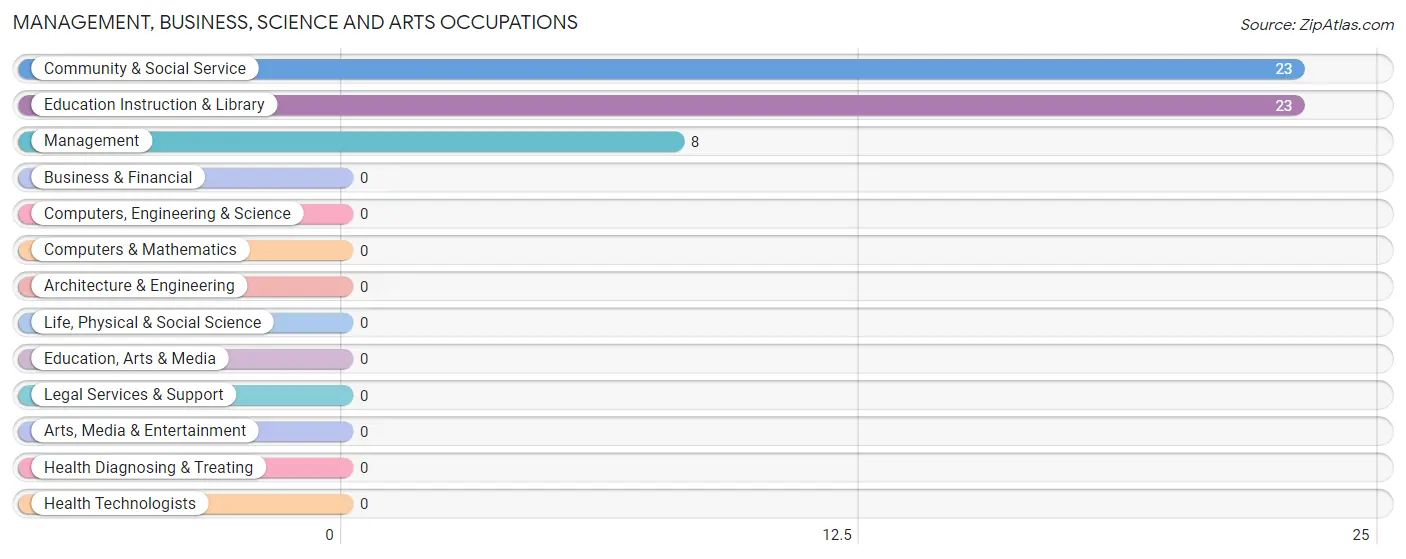
Management, Business, Science and Arts Occupations by Sex
Within the Management, Business, Science and Arts occupations in Kerr, the most male-oriented occupations are Management (100.0%), Community & Social Service (43.5%), and Education Instruction & Library (43.5%), while the most female-oriented occupations are Community & Social Service (56.5%), and Education Instruction & Library (56.5%).
| Occupation | Male | Female |
| Management | 8 (100.0%) | 0 (0.0%) |
| Business & Financial | 0 (0.0%) | 0 (0.0%) |
| Computers, Engineering & Science | 0 (0.0%) | 0 (0.0%) |
| Computers & Mathematics | 0 (0.0%) | 0 (0.0%) |
| Architecture & Engineering | 0 (0.0%) | 0 (0.0%) |
| Life, Physical & Social Science | 0 (0.0%) | 0 (0.0%) |
| Community & Social Service | 10 (43.5%) | 13 (56.5%) |
| Education, Arts & Media | 0 (0.0%) | 0 (0.0%) |
| Legal Services & Support | 0 (0.0%) | 0 (0.0%) |
| Education Instruction & Library | 10 (43.5%) | 13 (56.5%) |
| Arts, Media & Entertainment | 0 (0.0%) | 0 (0.0%) |
| Health Diagnosing & Treating | 0 (0.0%) | 0 (0.0%) |
| Health Technologists | 0 (0.0%) | 0 (0.0%) |
| Total (Category) | 18 (58.1%) | 13 (41.9%) |
| Total (Overall) | 38 (41.8%) | 53 (58.2%) |
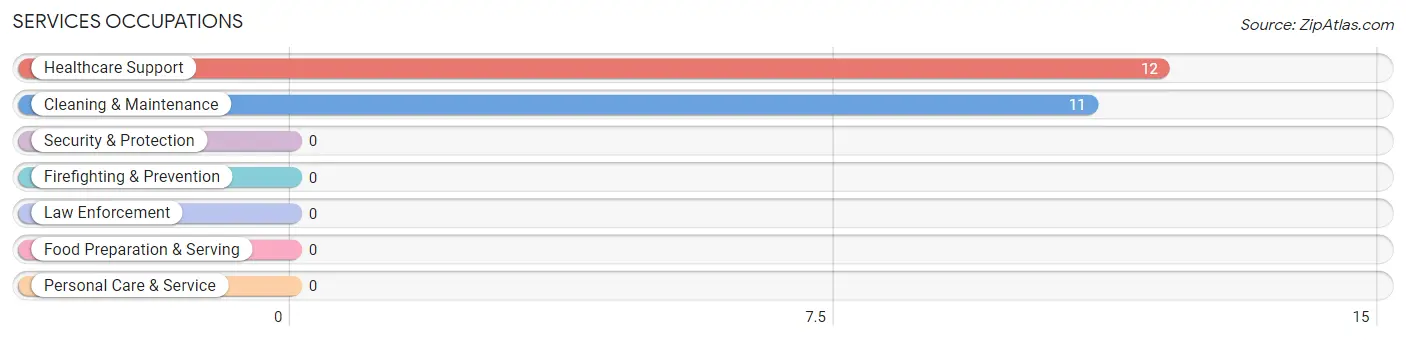
Services Occupations
The most common Services occupations in Kerr are Healthcare Support (12 | 13.2%), and Cleaning & Maintenance (11 | 12.1%).
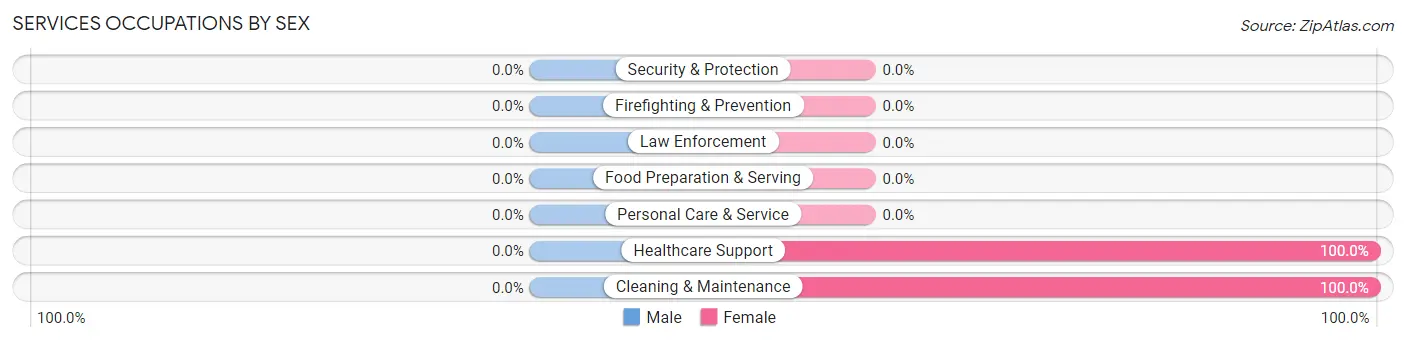
Services Occupations by Sex
| Occupation | Male | Female |
| Healthcare Support | 0 (0.0%) | 12 (100.0%) |
| Security & Protection | 0 (0.0%) | 0 (0.0%) |
| Firefighting & Prevention | 0 (0.0%) | 0 (0.0%) |
| Law Enforcement | 0 (0.0%) | 0 (0.0%) |
| Food Preparation & Serving | 0 (0.0%) | 0 (0.0%) |
| Cleaning & Maintenance | 0 (0.0%) | 11 (100.0%) |
| Personal Care & Service | 0 (0.0%) | 0 (0.0%) |
| Total (Category) | 0 (0.0%) | 23 (100.0%) |
| Total (Overall) | 38 (41.8%) | 53 (58.2%) |
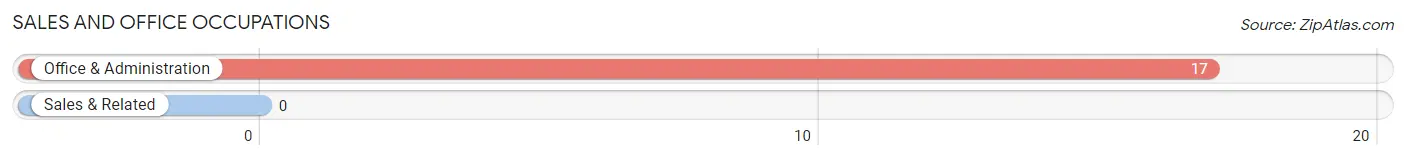
Sales and Office Occupations
The most common Sales and Office occupations in Kerr are , and Office & Administration (17 | 18.7%).
Sales and Office Occupations by Sex
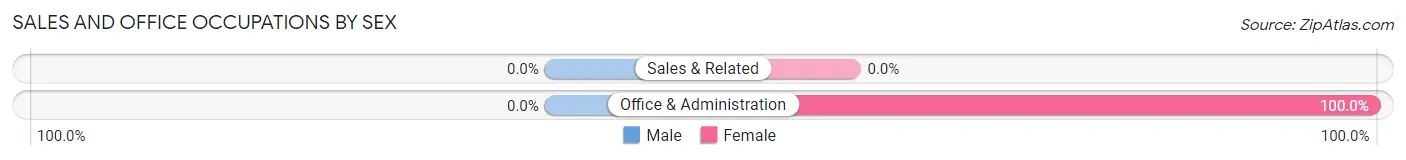
| Occupation | Male | Female |
| Sales & Related | 0 (0.0%) | 0 (0.0%) |
| Office & Administration | 0 (0.0%) | 17 (100.0%) |
| Total (Category) | 0 (0.0%) | 17 (100.0%) |
| Total (Overall) | 38 (41.8%) | 53 (58.2%) |
Natural Resources, Construction and Maintenance Occupations
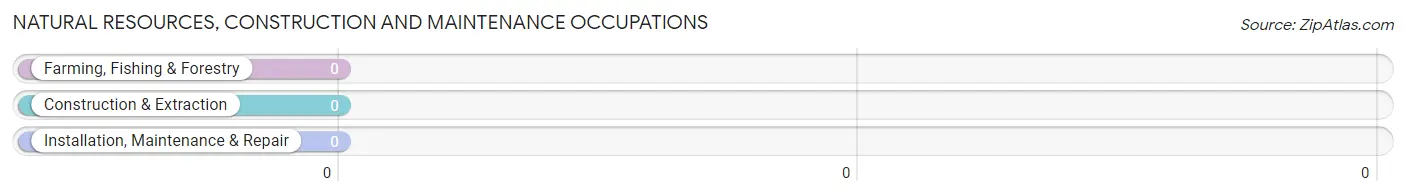
Natural Resources, Construction and Maintenance Occupations by Sex
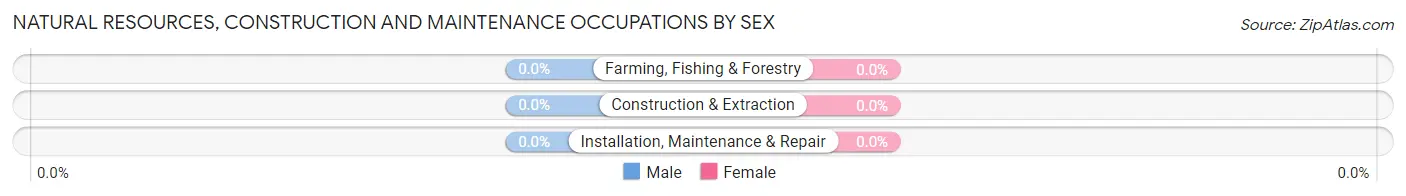
| Occupation | Male | Female |
| Farming, Fishing & Forestry | 0 (0.0%) | 0 (0.0%) |
| Construction & Extraction | 0 (0.0%) | 0 (0.0%) |
| Installation, Maintenance & Repair | 0 (0.0%) | 0 (0.0%) |
| Total (Category) | 0 (0.0%) | 0 (0.0%) |
| Total (Overall) | 38 (41.8%) | 53 (58.2%) |
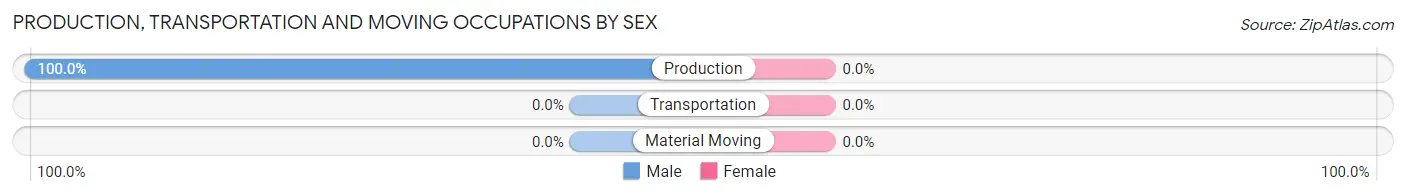
Production, Transportation and Moving Occupations
The most common Production, Transportation and Moving occupations in Kerr are , and Production (20 | 22.0%).
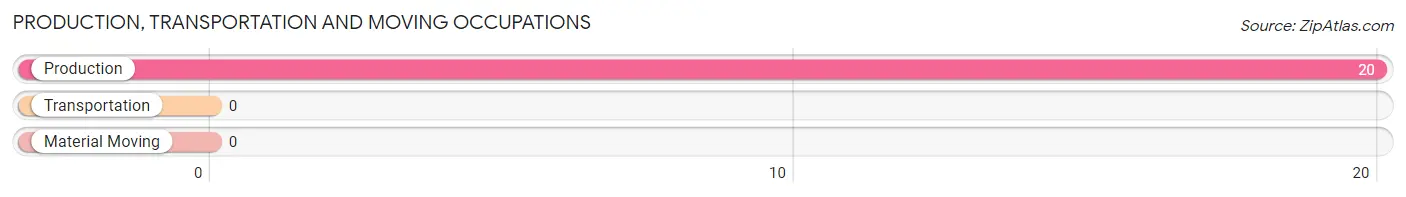
Production, Transportation and Moving Occupations by Sex
| Occupation | Male | Female |
| Production | 20 (100.0%) | 0 (0.0%) |
| Transportation | 0 (0.0%) | 0 (0.0%) |
| Material Moving | 0 (0.0%) | 0 (0.0%) |
| Total (Category) | 20 (100.0%) | 0 (0.0%) |
| Total (Overall) | 38 (41.8%) | 53 (58.2%) |
Employment Industries by Sex in Kerr
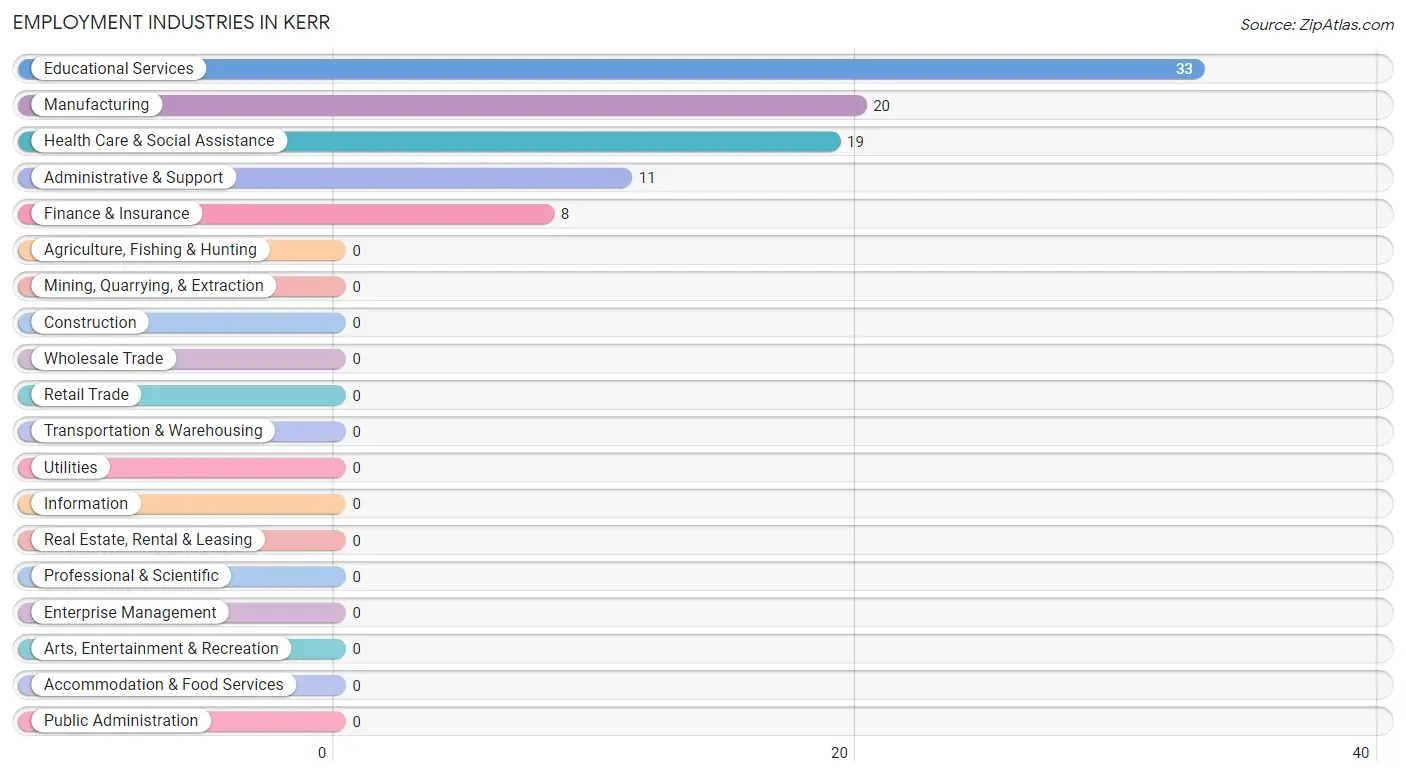
Employment Industries in Kerr
The major employment industries in Kerr include Educational Services (33 | 36.3%), Manufacturing (20 | 22.0%), Health Care & Social Assistance (19 | 20.9%), Administrative & Support (11 | 12.1%), and Finance & Insurance (8 | 8.8%).
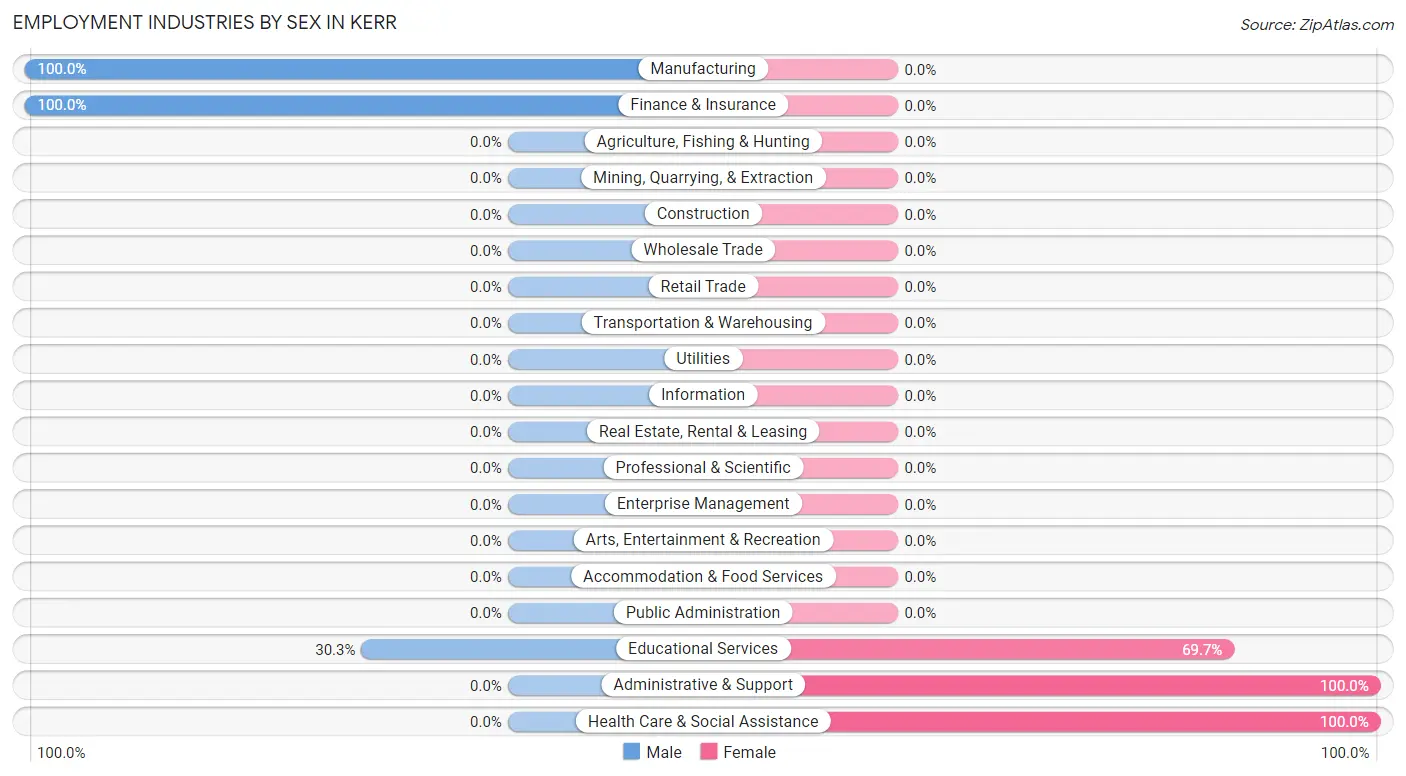
Employment Industries by Sex in Kerr
The Kerr industries that see more men than women are Manufacturing (100.0%), Finance & Insurance (100.0%), and Educational Services (30.3%), whereas the industries that tend to have a higher number of women are Administrative & Support (100.0%), Health Care & Social Assistance (100.0%), and Educational Services (69.7%).
| Industry | Male | Female |
| Agriculture, Fishing & Hunting | 0 (0.0%) | 0 (0.0%) |
| Mining, Quarrying, & Extraction | 0 (0.0%) | 0 (0.0%) |
| Construction | 0 (0.0%) | 0 (0.0%) |
| Manufacturing | 20 (100.0%) | 0 (0.0%) |
| Wholesale Trade | 0 (0.0%) | 0 (0.0%) |
| Retail Trade | 0 (0.0%) | 0 (0.0%) |
| Transportation & Warehousing | 0 (0.0%) | 0 (0.0%) |
| Utilities | 0 (0.0%) | 0 (0.0%) |
| Information | 0 (0.0%) | 0 (0.0%) |
| Finance & Insurance | 8 (100.0%) | 0 (0.0%) |
| Real Estate, Rental & Leasing | 0 (0.0%) | 0 (0.0%) |
| Professional & Scientific | 0 (0.0%) | 0 (0.0%) |
| Enterprise Management | 0 (0.0%) | 0 (0.0%) |
| Administrative & Support | 0 (0.0%) | 11 (100.0%) |
| Educational Services | 10 (30.3%) | 23 (69.7%) |
| Health Care & Social Assistance | 0 (0.0%) | 19 (100.0%) |
| Arts, Entertainment & Recreation | 0 (0.0%) | 0 (0.0%) |
| Accommodation & Food Services | 0 (0.0%) | 0 (0.0%) |
| Public Administration | 0 (0.0%) | 0 (0.0%) |
| Total | 38 (41.8%) | 53 (58.2%) |
Education in Kerr
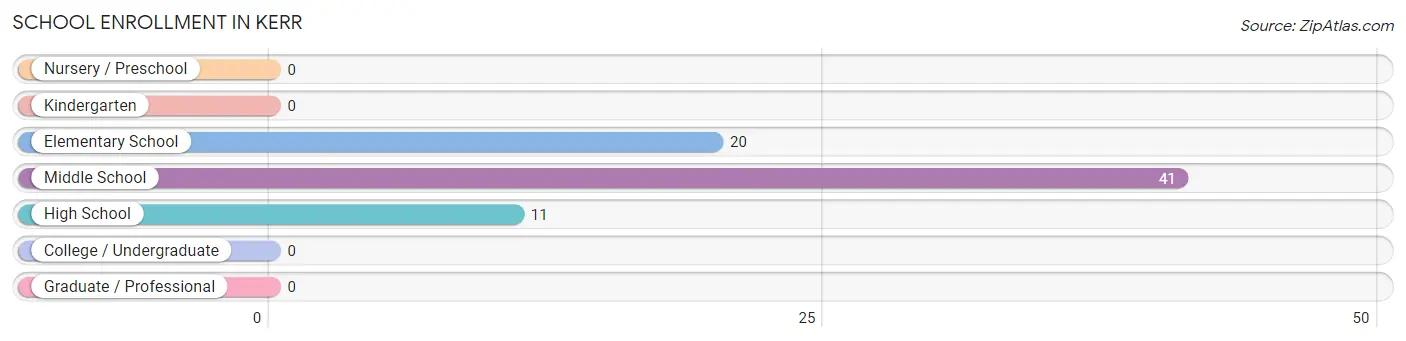
School Enrollment in Kerr
The most common levels of schooling among the 72 students in Kerr are middle school (41 | 56.9%), elementary school (20 | 27.8%), and high school (11 | 15.3%).
| School Level | # Students | % Students |
| Nursery / Preschool | 0 | 0.0% |
| Kindergarten | 0 | 0.0% |
| Elementary School | 20 | 27.8% |
| Middle School | 41 | 56.9% |
| High School | 11 | 15.3% |
| College / Undergraduate | 0 | 0.0% |
| Graduate / Professional | 0 | 0.0% |
| Total | 72 | 100.0% |
School Enrollment by Age by Funding Source in Kerr
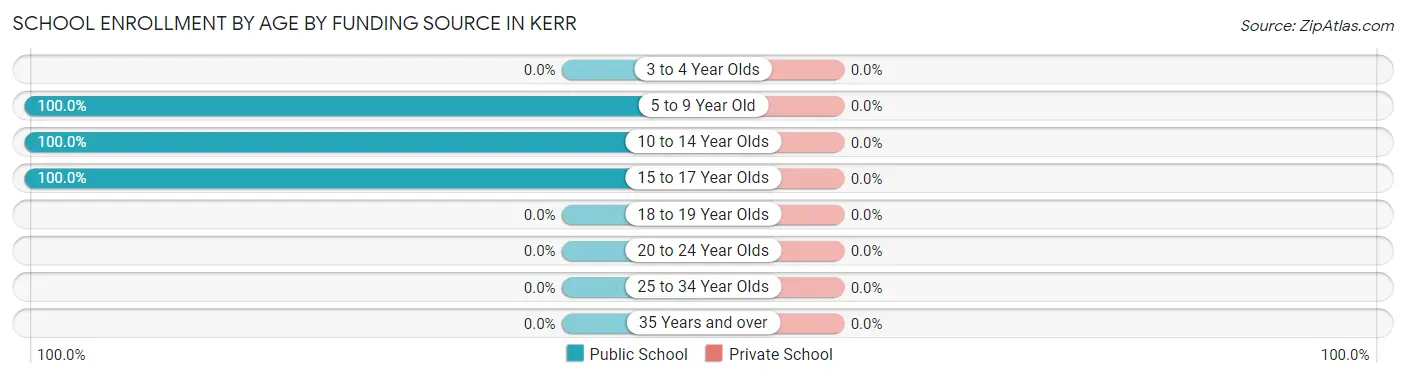
| Age Bracket | Public School | Private School |
| 3 to 4 Year Olds | 0 (0.0%) | 0 (0.0%) |
| 5 to 9 Year Old | 20 (100.0%) | 0 (0.0%) |
| 10 to 14 Year Olds | 41 (100.0%) | 0 (0.0%) |
| 15 to 17 Year Olds | 11 (100.0%) | 0 (0.0%) |
| 18 to 19 Year Olds | 0 (0.0%) | 0 (0.0%) |
| 20 to 24 Year Olds | 0 (0.0%) | 0 (0.0%) |
| 25 to 34 Year Olds | 0 (0.0%) | 0 (0.0%) |
| 35 Years and over | 0 (0.0%) | 0 (0.0%) |
| Total | 72 (100.0%) | 0 (0.0%) |
Educational Attainment by Field of Study in Kerr
Bio, nature & agricultural (22 | 40.0%), arts & humanities (13 | 23.6%), literature & languages (10 | 18.2%), and communications (10 | 18.2%) are the most common fields of study among 55 individuals in Kerr who have obtained a bachelor's degree or higher.
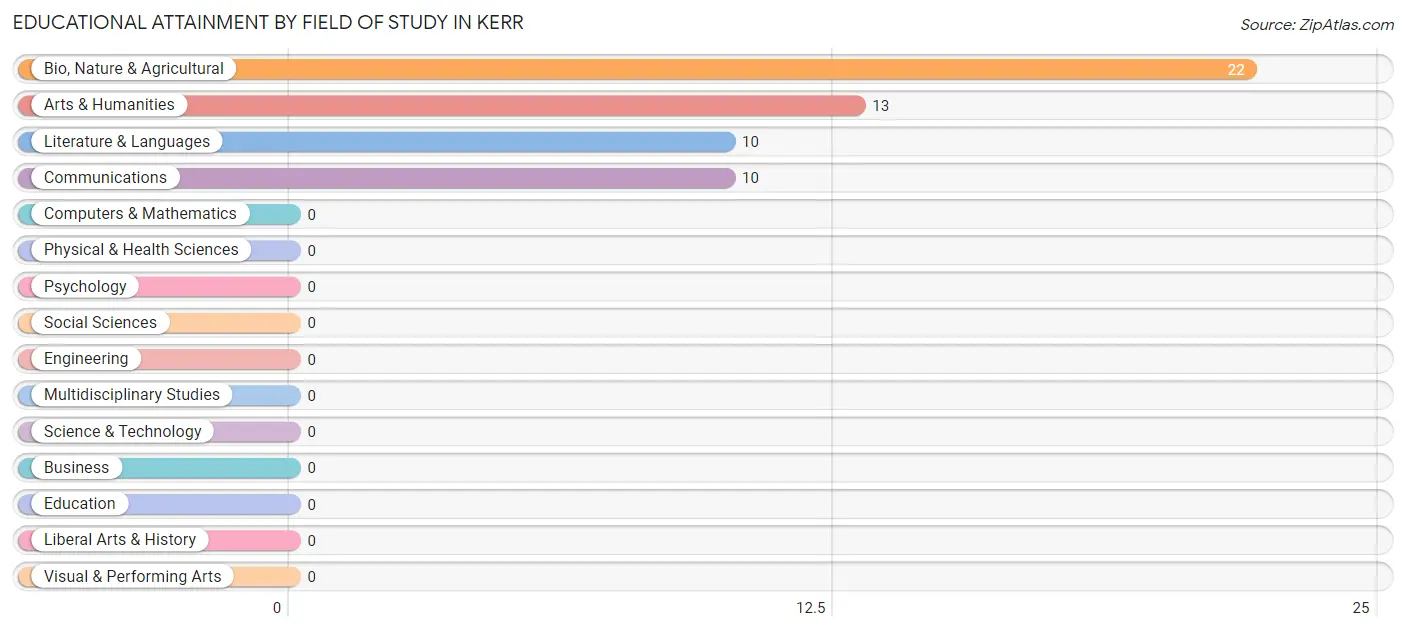
| Field of Study | # Graduates | % Graduates |
| Computers & Mathematics | 0 | 0.0% |
| Bio, Nature & Agricultural | 22 | 40.0% |
| Physical & Health Sciences | 0 | 0.0% |
| Psychology | 0 | 0.0% |
| Social Sciences | 0 | 0.0% |
| Engineering | 0 | 0.0% |
| Multidisciplinary Studies | 0 | 0.0% |
| Science & Technology | 0 | 0.0% |
| Business | 0 | 0.0% |
| Education | 0 | 0.0% |
| Literature & Languages | 10 | 18.2% |
| Liberal Arts & History | 0 | 0.0% |
| Visual & Performing Arts | 0 | 0.0% |
| Communications | 10 | 18.2% |
| Arts & Humanities | 13 | 23.6% |
| Total | 55 | 100.0% |
Transportation & Commute in Kerr
Vehicle Availability by Sex in Kerr
The most prevalent vehicle ownership categories in Kerr are males with 3 vehicles (18, accounting for 66.7%) and females with 3 vehicles (24, making up 52.9%).
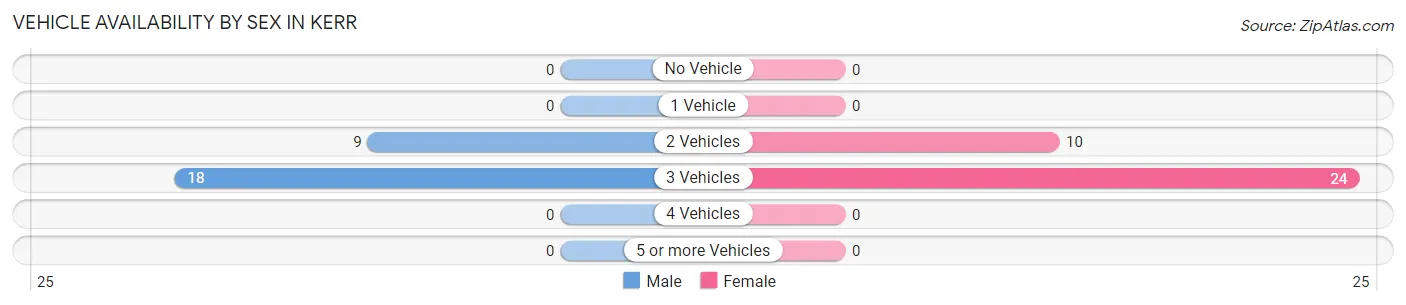
| Vehicles Available | Male | Female |
| No Vehicle | 0 (0.0%) | 0 (0.0%) |
| 1 Vehicle | 0 (0.0%) | 0 (0.0%) |
| 2 Vehicles | 9 (33.3%) | 10 (29.4%) |
| 3 Vehicles | 18 (66.7%) | 24 (70.6%) |
| 4 Vehicles | 0 (0.0%) | 0 (0.0%) |
| 5 or more Vehicles | 0 (0.0%) | 0 (0.0%) |
| Total | 27 (100.0%) | 34 (100.0%) |
Commute Time in Kerr
The most frequently occuring commute durations in Kerr are 5 to 9 minutes (31 commuters, 50.8%), 10 to 14 minutes (20 commuters, 32.8%), and less than 5 minutes (10 commuters, 16.4%).
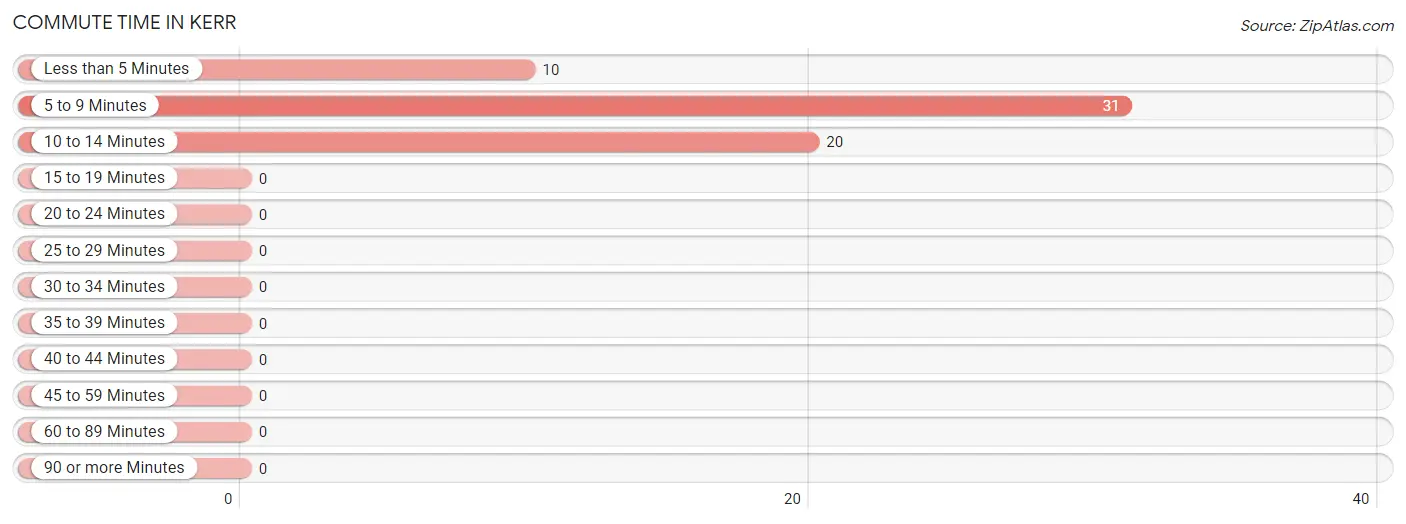
| Commute Time | # Commuters | % Commuters |
| Less than 5 Minutes | 10 | 16.4% |
| 5 to 9 Minutes | 31 | 50.8% |
| 10 to 14 Minutes | 20 | 32.8% |
| 15 to 19 Minutes | 0 | 0.0% |
| 20 to 24 Minutes | 0 | 0.0% |
| 25 to 29 Minutes | 0 | 0.0% |
| 30 to 34 Minutes | 0 | 0.0% |
| 35 to 39 Minutes | 0 | 0.0% |
| 40 to 44 Minutes | 0 | 0.0% |
| 45 to 59 Minutes | 0 | 0.0% |
| 60 to 89 Minutes | 0 | 0.0% |
| 90 or more Minutes | 0 | 0.0% |
Commute Time by Sex in Kerr
The most common commute times in Kerr are less than 5 minutes (10 commuters, 37.0%) for males and 5 to 9 minutes (23 commuters, 67.6%) for females.
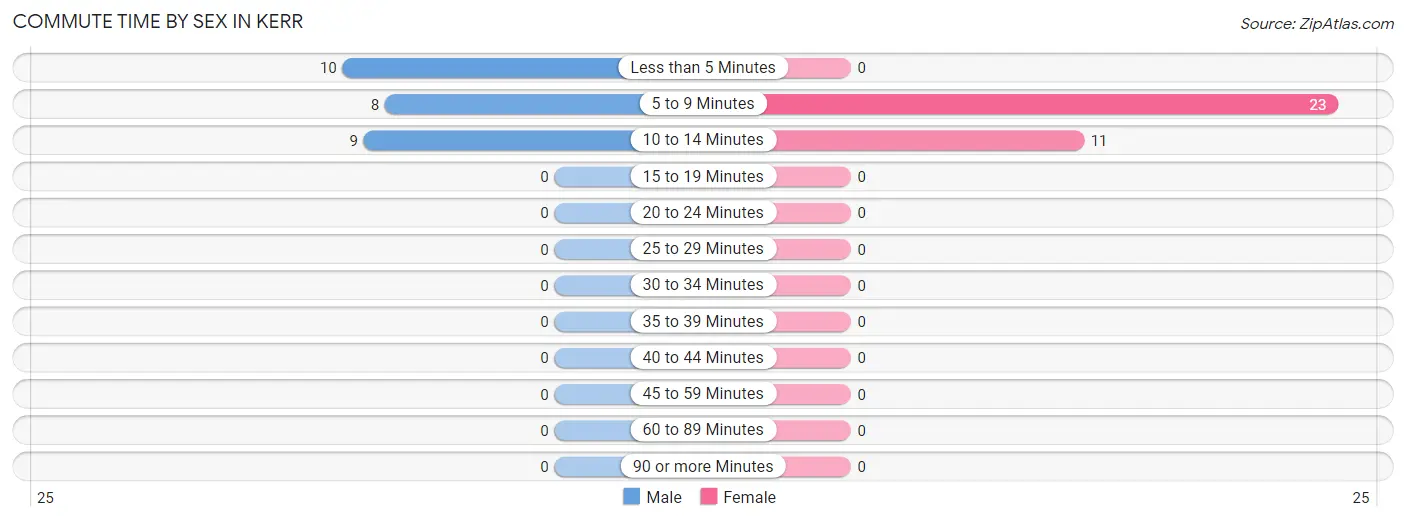
| Commute Time | Male | Female |
| Less than 5 Minutes | 10 (37.0%) | 0 (0.0%) |
| 5 to 9 Minutes | 8 (29.6%) | 23 (67.6%) |
| 10 to 14 Minutes | 9 (33.3%) | 11 (32.4%) |
| 15 to 19 Minutes | 0 (0.0%) | 0 (0.0%) |
| 20 to 24 Minutes | 0 (0.0%) | 0 (0.0%) |
| 25 to 29 Minutes | 0 (0.0%) | 0 (0.0%) |
| 30 to 34 Minutes | 0 (0.0%) | 0 (0.0%) |
| 35 to 39 Minutes | 0 (0.0%) | 0 (0.0%) |
| 40 to 44 Minutes | 0 (0.0%) | 0 (0.0%) |
| 45 to 59 Minutes | 0 (0.0%) | 0 (0.0%) |
| 60 to 89 Minutes | 0 (0.0%) | 0 (0.0%) |
| 90 or more Minutes | 0 (0.0%) | 0 (0.0%) |
Time of Departure to Work by Sex in Kerr
The most frequent times of departure to work in Kerr are 7:30 AM to 7:59 AM (18, 66.7%) for males and 12:00 PM to 3:59 PM (21, 61.8%) for females.
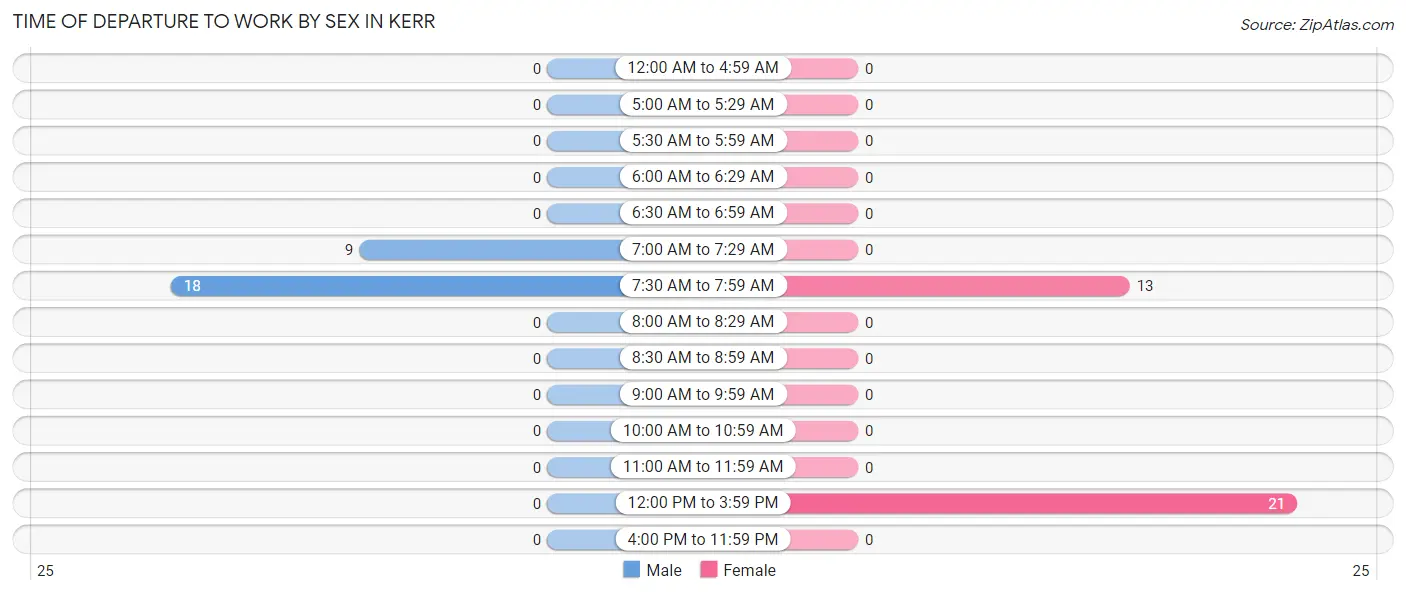
| Time of Departure | Male | Female |
| 12:00 AM to 4:59 AM | 0 (0.0%) | 0 (0.0%) |
| 5:00 AM to 5:29 AM | 0 (0.0%) | 0 (0.0%) |
| 5:30 AM to 5:59 AM | 0 (0.0%) | 0 (0.0%) |
| 6:00 AM to 6:29 AM | 0 (0.0%) | 0 (0.0%) |
| 6:30 AM to 6:59 AM | 0 (0.0%) | 0 (0.0%) |
| 7:00 AM to 7:29 AM | 9 (33.3%) | 0 (0.0%) |
| 7:30 AM to 7:59 AM | 18 (66.7%) | 13 (38.2%) |
| 8:00 AM to 8:29 AM | 0 (0.0%) | 0 (0.0%) |
| 8:30 AM to 8:59 AM | 0 (0.0%) | 0 (0.0%) |
| 9:00 AM to 9:59 AM | 0 (0.0%) | 0 (0.0%) |
| 10:00 AM to 10:59 AM | 0 (0.0%) | 0 (0.0%) |
| 11:00 AM to 11:59 AM | 0 (0.0%) | 0 (0.0%) |
| 12:00 PM to 3:59 PM | 0 (0.0%) | 21 (61.8%) |
| 4:00 PM to 11:59 PM | 0 (0.0%) | 0 (0.0%) |
| Total | 27 (100.0%) | 34 (100.0%) |
Housing Occupancy in Kerr
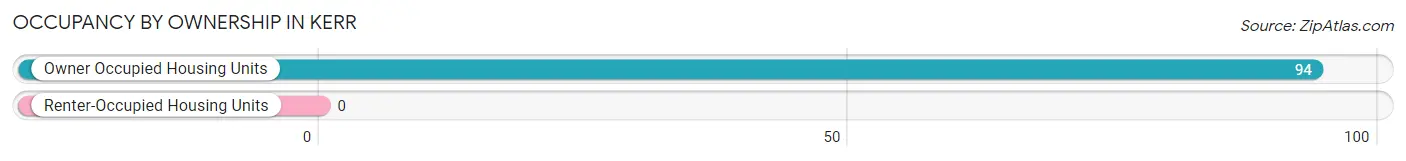
Occupancy by Ownership in Kerr
Of the total 94 dwellings in Kerr, owner-occupied units account for 94 (100.0%), while renter-occupied units make up 0 (0.0%).
| Occupancy | # Housing Units | % Housing Units |
| Owner Occupied Housing Units | 94 | 100.0% |
| Renter-Occupied Housing Units | 0 | 0.0% |
| Total Occupied Housing Units | 94 | 100.0% |
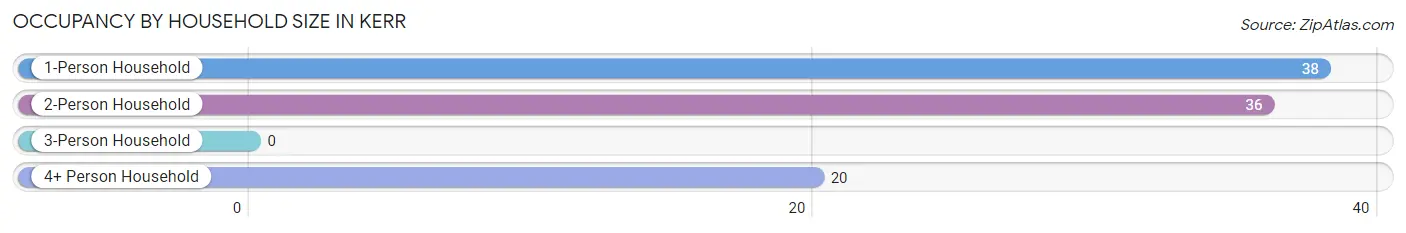
Occupancy by Household Size in Kerr
| Household Size | # Housing Units | % Housing Units |
| 1-Person Household | 38 | 40.4% |
| 2-Person Household | 36 | 38.3% |
| 3-Person Household | 0 | 0.0% |
| 4+ Person Household | 20 | 21.3% |
| Total Housing Units | 94 | 100.0% |
Occupancy by Ownership by Household Size in Kerr
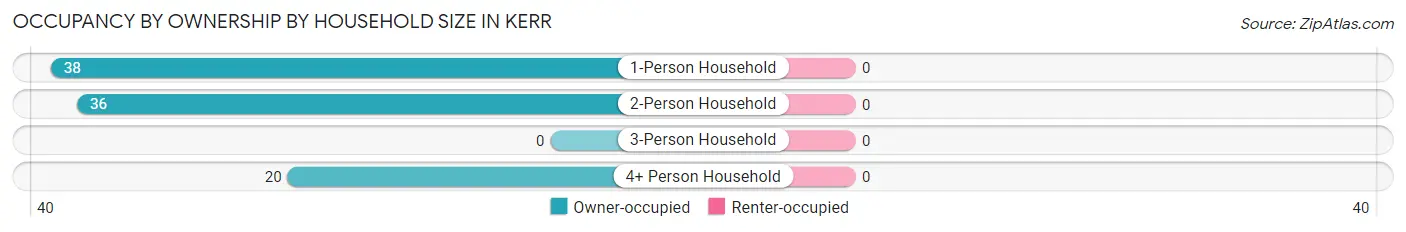
| Household Size | Owner-occupied | Renter-occupied |
| 1-Person Household | 38 (100.0%) | 0 (0.0%) |
| 2-Person Household | 36 (100.0%) | 0 (0.0%) |
| 3-Person Household | 0 (0.0%) | 0 (0.0%) |
| 4+ Person Household | 20 (100.0%) | 0 (0.0%) |
| Total Housing Units | 94 (100.0%) | 0 (0.0%) |
Occupancy by Educational Attainment in Kerr
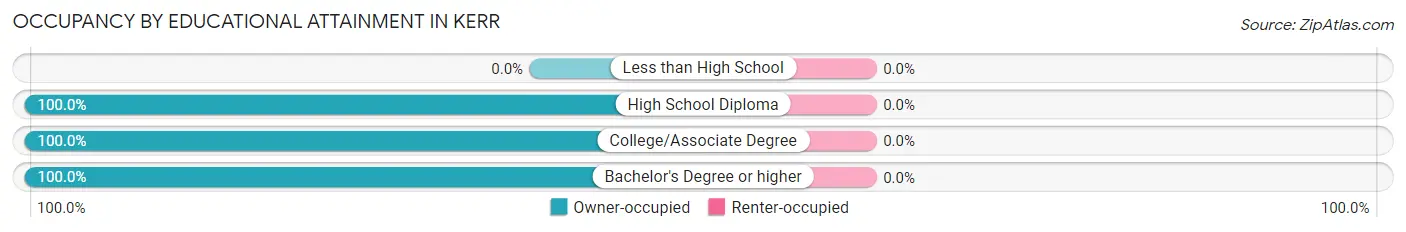
| Household Size | Owner-occupied | Renter-occupied |
| Less than High School | 0 (0.0%) | 0 (0.0%) |
| High School Diploma | 26 (100.0%) | 0 (0.0%) |
| College/Associate Degree | 50 (100.0%) | 0 (0.0%) |
| Bachelor's Degree or higher | 18 (100.0%) | 0 (0.0%) |
Occupancy by Age of Householder in Kerr
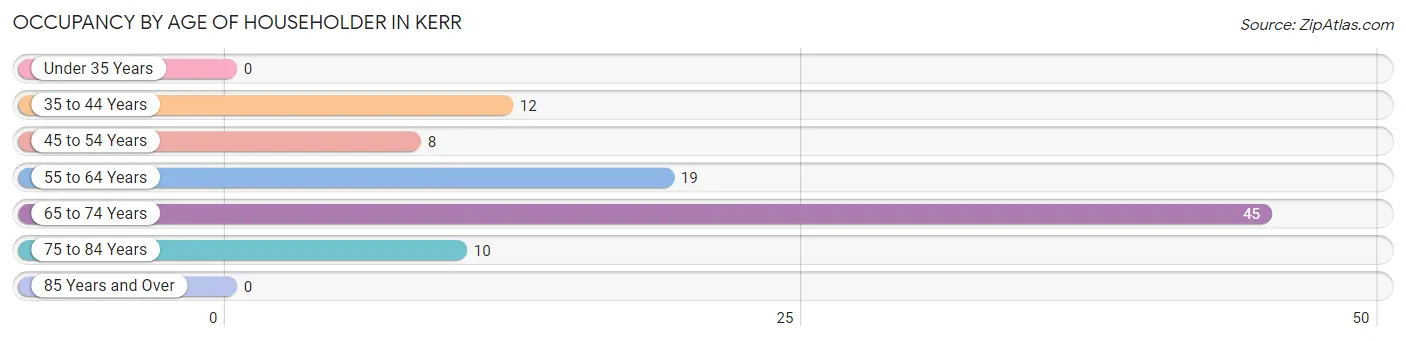
| Age Bracket | # Households | % Households |
| Under 35 Years | 0 | 0.0% |
| 35 to 44 Years | 12 | 12.8% |
| 45 to 54 Years | 8 | 8.5% |
| 55 to 64 Years | 19 | 20.2% |
| 65 to 74 Years | 45 | 47.9% |
| 75 to 84 Years | 10 | 10.6% |
| 85 Years and Over | 0 | 0.0% |
| Total | 94 | 100.0% |
Housing Finances in Kerr
Median Income by Occupancy in Kerr
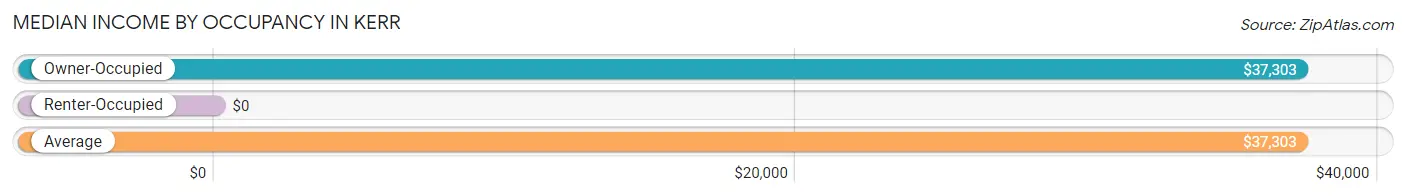
| Occupancy Type | # Households | Median Income |
| Owner-Occupied | 94 (100.0%) | $37,303 |
| Renter-Occupied | 0 (0.0%) | $0 |
| Average | 94 (100.0%) | $37,303 |
Occupancy by Householder Income Bracket in Kerr
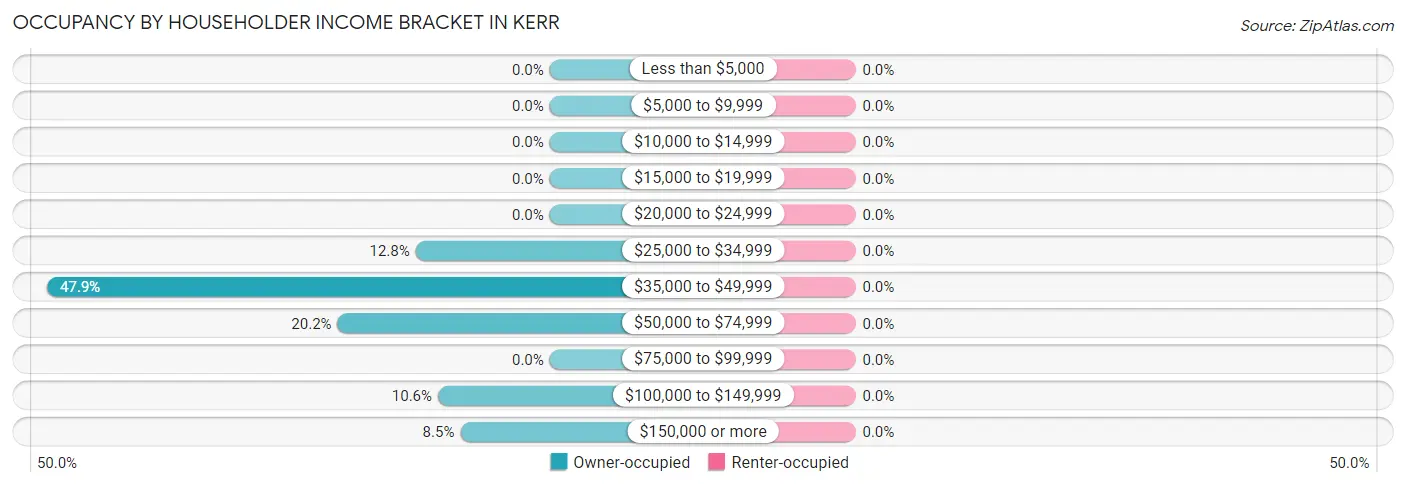
| Income Bracket | Owner-occupied | Renter-occupied |
| Less than $5,000 | 0 (0.0%) | 0 (0.0%) |
| $5,000 to $9,999 | 0 (0.0%) | 0 (0.0%) |
| $10,000 to $14,999 | 0 (0.0%) | 0 (0.0%) |
| $15,000 to $19,999 | 0 (0.0%) | 0 (0.0%) |
| $20,000 to $24,999 | 0 (0.0%) | 0 (0.0%) |
| $25,000 to $34,999 | 12 (12.8%) | 0 (0.0%) |
| $35,000 to $49,999 | 45 (47.9%) | 0 (0.0%) |
| $50,000 to $74,999 | 19 (20.2%) | 0 (0.0%) |
| $75,000 to $99,999 | 0 (0.0%) | 0 (0.0%) |
| $100,000 to $149,999 | 10 (10.6%) | 0 (0.0%) |
| $150,000 or more | 8 (8.5%) | 0 (0.0%) |
| Total | 94 (100.0%) | 0 (0.0%) |
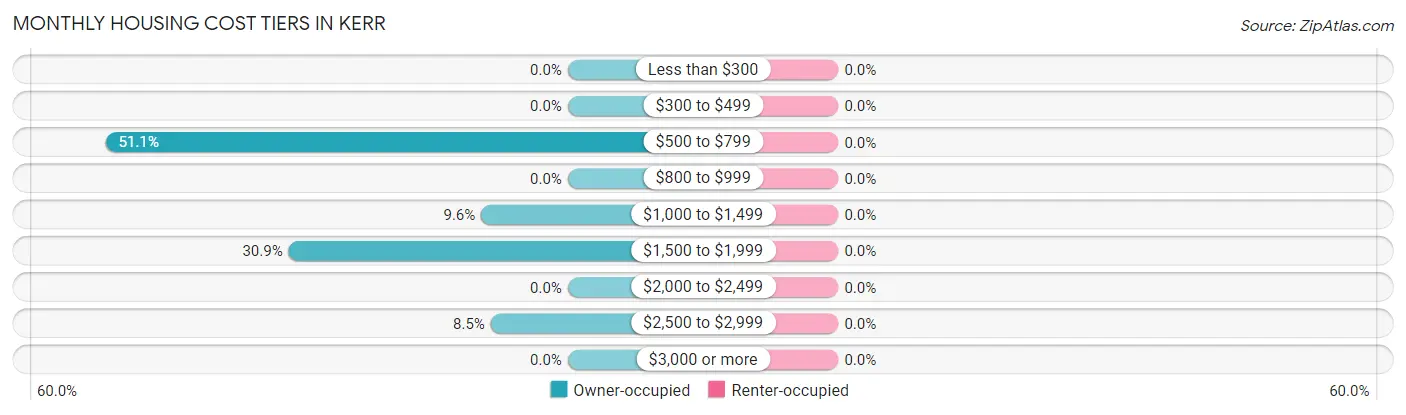
Monthly Housing Cost Tiers in Kerr
| Monthly Cost | Owner-occupied | Renter-occupied |
| Less than $300 | 0 (0.0%) | 0 (0.0%) |
| $300 to $499 | 0 (0.0%) | 0 (0.0%) |
| $500 to $799 | 48 (51.1%) | 0 (0.0%) |
| $800 to $999 | 0 (0.0%) | 0 (0.0%) |
| $1,000 to $1,499 | 9 (9.6%) | 0 (0.0%) |
| $1,500 to $1,999 | 29 (30.8%) | 0 (0.0%) |
| $2,000 to $2,499 | 0 (0.0%) | 0 (0.0%) |
| $2,500 to $2,999 | 8 (8.5%) | 0 (0.0%) |
| $3,000 or more | 0 (0.0%) | 0 (0.0%) |
| Total | 94 (100.0%) | 0 (0.0%) |
Physical Housing Characteristics in Kerr
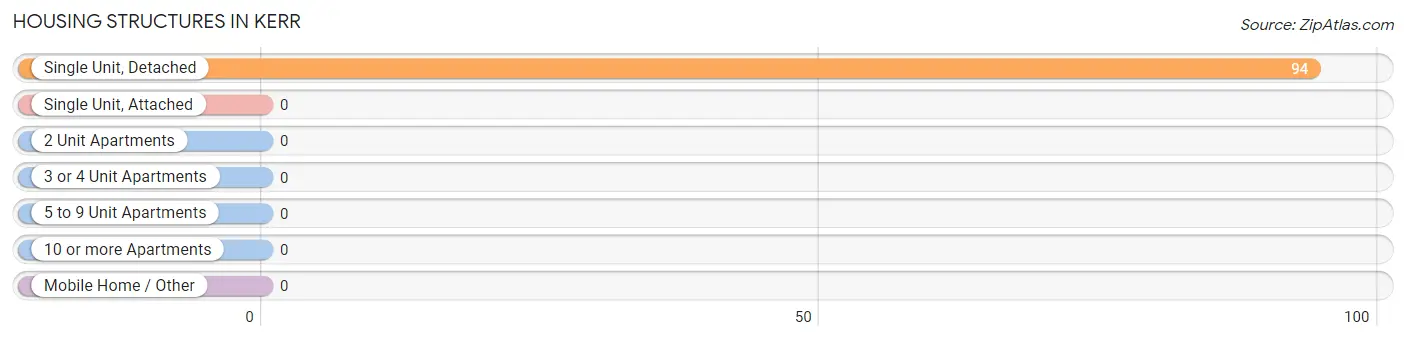
Housing Structures in Kerr
| Structure Type | # Housing Units | % Housing Units |
| Single Unit, Detached | 94 | 100.0% |
| Single Unit, Attached | 0 | 0.0% |
| 2 Unit Apartments | 0 | 0.0% |
| 3 or 4 Unit Apartments | 0 | 0.0% |
| 5 to 9 Unit Apartments | 0 | 0.0% |
| 10 or more Apartments | 0 | 0.0% |
| Mobile Home / Other | 0 | 0.0% |
| Total | 94 | 100.0% |
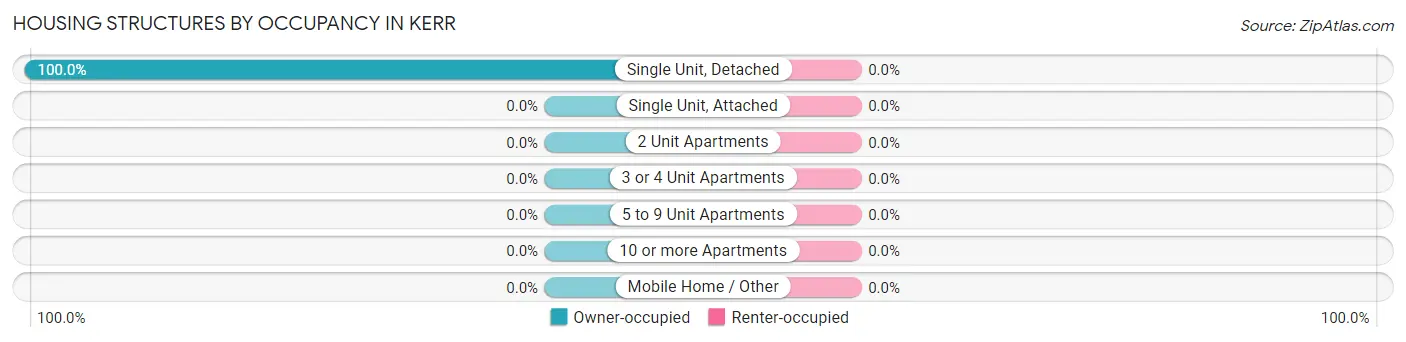
Housing Structures by Occupancy in Kerr
| Structure Type | Owner-occupied | Renter-occupied |
| Single Unit, Detached | 94 (100.0%) | 0 (0.0%) |
| Single Unit, Attached | 0 (0.0%) | 0 (0.0%) |
| 2 Unit Apartments | 0 (0.0%) | 0 (0.0%) |
| 3 or 4 Unit Apartments | 0 (0.0%) | 0 (0.0%) |
| 5 to 9 Unit Apartments | 0 (0.0%) | 0 (0.0%) |
| 10 or more Apartments | 0 (0.0%) | 0 (0.0%) |
| Mobile Home / Other | 0 (0.0%) | 0 (0.0%) |
| Total | 94 (100.0%) | 0 (0.0%) |
Housing Structures by Number of Rooms in Kerr
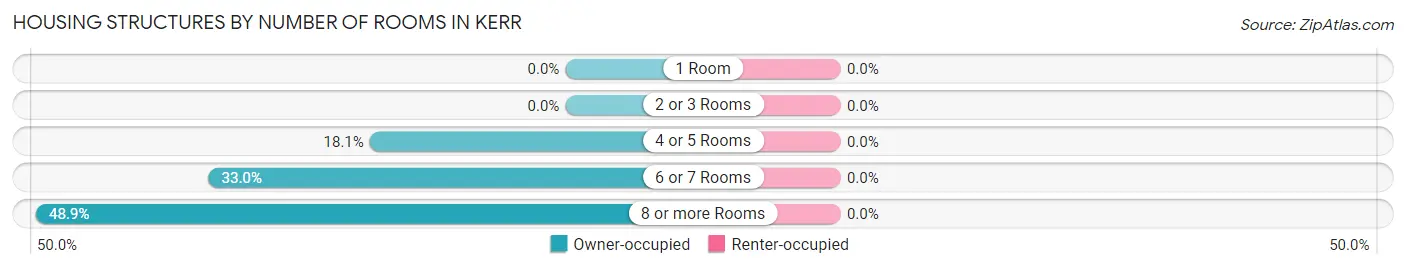
| Number of Rooms | Owner-occupied | Renter-occupied |
| 1 Room | 0 (0.0%) | 0 (0.0%) |
| 2 or 3 Rooms | 0 (0.0%) | 0 (0.0%) |
| 4 or 5 Rooms | 17 (18.1%) | 0 (0.0%) |
| 6 or 7 Rooms | 31 (33.0%) | 0 (0.0%) |
| 8 or more Rooms | 46 (48.9%) | 0 (0.0%) |
| Total | 94 (100.0%) | 0 (0.0%) |
Housing Structure by Heating Type in Kerr
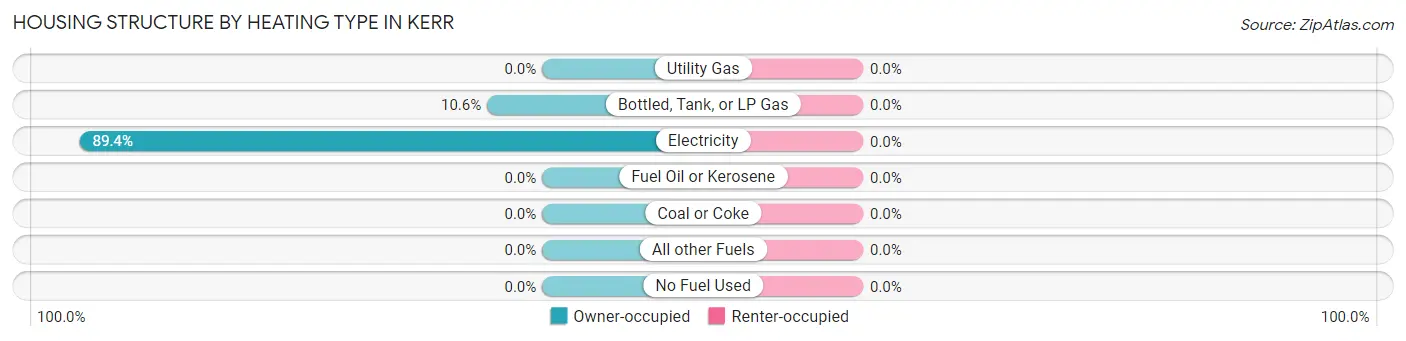
| Heating Type | Owner-occupied | Renter-occupied |
| Utility Gas | 0 (0.0%) | 0 (0.0%) |
| Bottled, Tank, or LP Gas | 10 (10.6%) | 0 (0.0%) |
| Electricity | 84 (89.4%) | 0 (0.0%) |
| Fuel Oil or Kerosene | 0 (0.0%) | 0 (0.0%) |
| Coal or Coke | 0 (0.0%) | 0 (0.0%) |
| All other Fuels | 0 (0.0%) | 0 (0.0%) |
| No Fuel Used | 0 (0.0%) | 0 (0.0%) |
| Total | 94 (100.0%) | 0 (0.0%) |
Household Vehicle Usage in Kerr
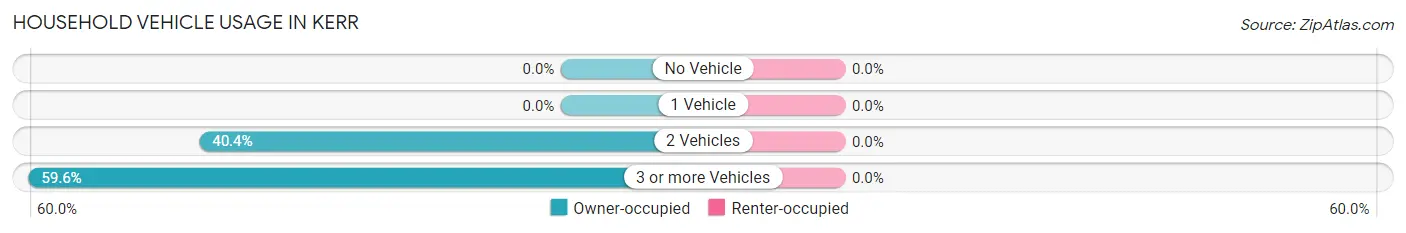
| Vehicles per Household | Owner-occupied | Renter-occupied |
| No Vehicle | 0 (0.0%) | 0 (0.0%) |
| 1 Vehicle | 0 (0.0%) | 0 (0.0%) |
| 2 Vehicles | 38 (40.4%) | 0 (0.0%) |
| 3 or more Vehicles | 56 (59.6%) | 0 (0.0%) |
| Total | 94 (100.0%) | 0 (0.0%) |
Real Estate & Mortgages in Kerr
Real Estate and Mortgage Overview in Kerr
| Characteristic | Without Mortgage | With Mortgage |
| Housing Units | 38 | 56 |
| Median Property Value | - | - |
| Median Household Income | - | - |
| Monthly Housing Costs | - | - |
| Real Estate Taxes | - | - |
Property Value by Mortgage Status in Kerr
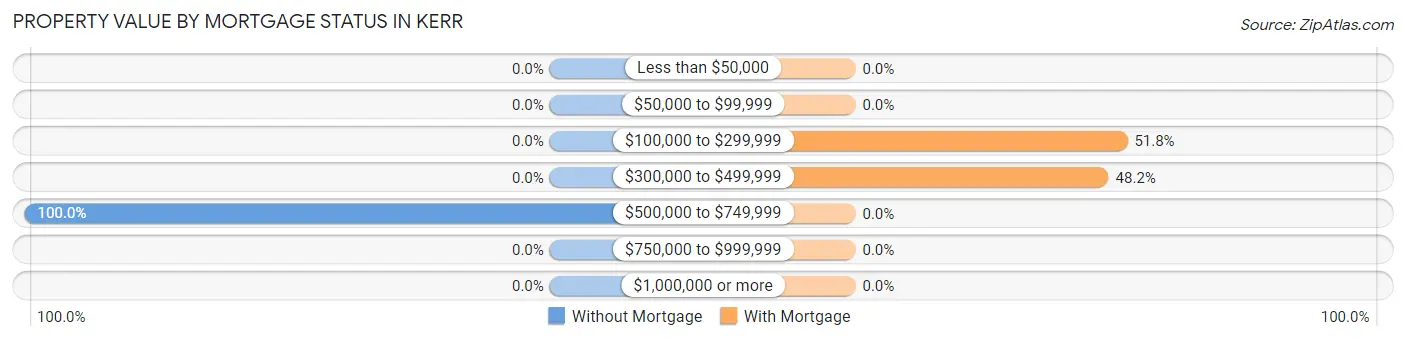
| Property Value | Without Mortgage | With Mortgage |
| Less than $50,000 | 0 (0.0%) | 0 (0.0%) |
| $50,000 to $99,999 | 0 (0.0%) | 0 (0.0%) |
| $100,000 to $299,999 | 0 (0.0%) | 29 (51.8%) |
| $300,000 to $499,999 | 0 (0.0%) | 27 (48.2%) |
| $500,000 to $749,999 | 38 (100.0%) | 0 (0.0%) |
| $750,000 to $999,999 | 0 (0.0%) | 0 (0.0%) |
| $1,000,000 or more | 0 (0.0%) | 0 (0.0%) |
| Total | 38 (100.0%) | 56 (100.0%) |
Household Income by Mortgage Status in Kerr
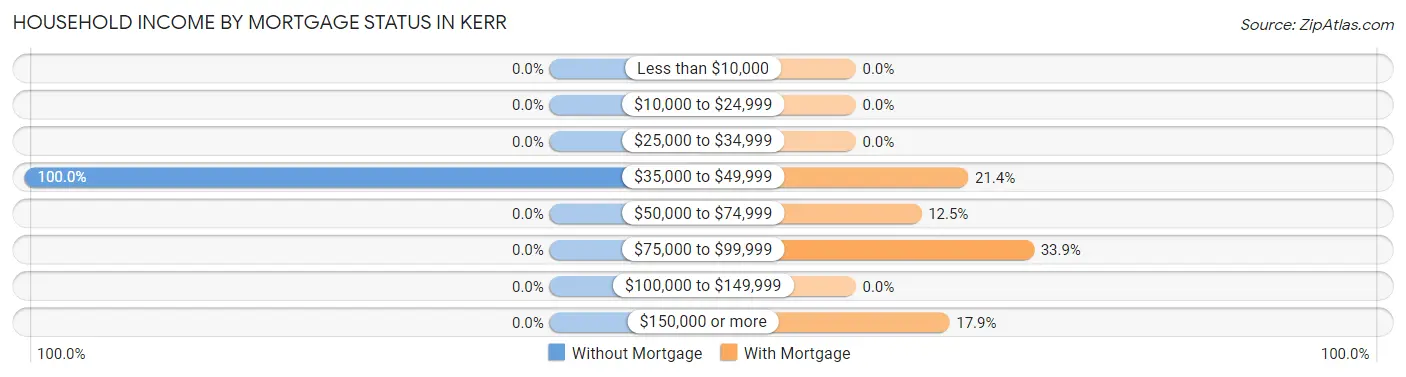
| Household Income | Without Mortgage | With Mortgage |
| Less than $10,000 | 0 (0.0%) | 0 (0.0%) |
| $10,000 to $24,999 | 0 (0.0%) | 0 (0.0%) |
| $25,000 to $34,999 | 0 (0.0%) | 0 (0.0%) |
| $35,000 to $49,999 | 38 (100.0%) | 12 (21.4%) |
| $50,000 to $74,999 | 0 (0.0%) | 7 (12.5%) |
| $75,000 to $99,999 | 0 (0.0%) | 19 (33.9%) |
| $100,000 to $149,999 | 0 (0.0%) | 0 (0.0%) |
| $150,000 or more | 0 (0.0%) | 10 (17.9%) |
| Total | 38 (100.0%) | 56 (100.0%) |
Property Value to Household Income Ratio in Kerr
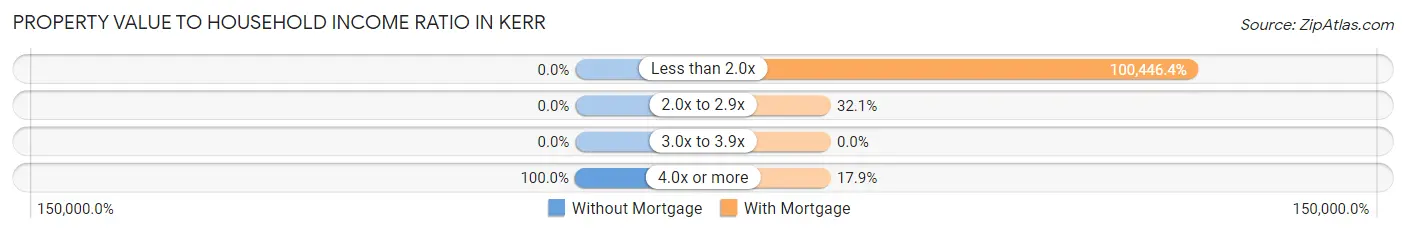
| Value-to-Income Ratio | Without Mortgage | With Mortgage |
| Less than 2.0x | 0 (0.0%) | 56,250 (100,446.4%) |
| 2.0x to 2.9x | 0 (0.0%) | 18 (32.1%) |
| 3.0x to 3.9x | 0 (0.0%) | 0 (0.0%) |
| 4.0x or more | 38 (100.0%) | 10 (17.9%) |
| Total | 38 (100.0%) | 56 (100.0%) |
Real Estate Taxes by Mortgage Status in Kerr
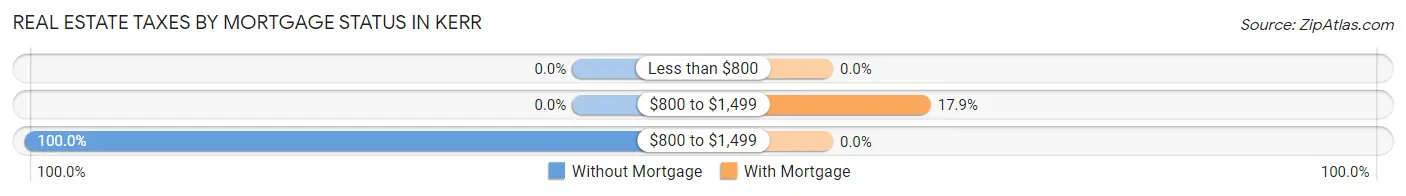
| Property Taxes | Without Mortgage | With Mortgage |
| Less than $800 | 0 (0.0%) | 0 (0.0%) |
| $800 to $1,499 | 0 (0.0%) | 10 (17.9%) |
| $800 to $1,499 | 38 (100.0%) | 0 (0.0%) |
| Total | 38 (100.0%) | 56 (100.0%) |
Health & Disability in Kerr
Health Insurance Coverage by Age in Kerr
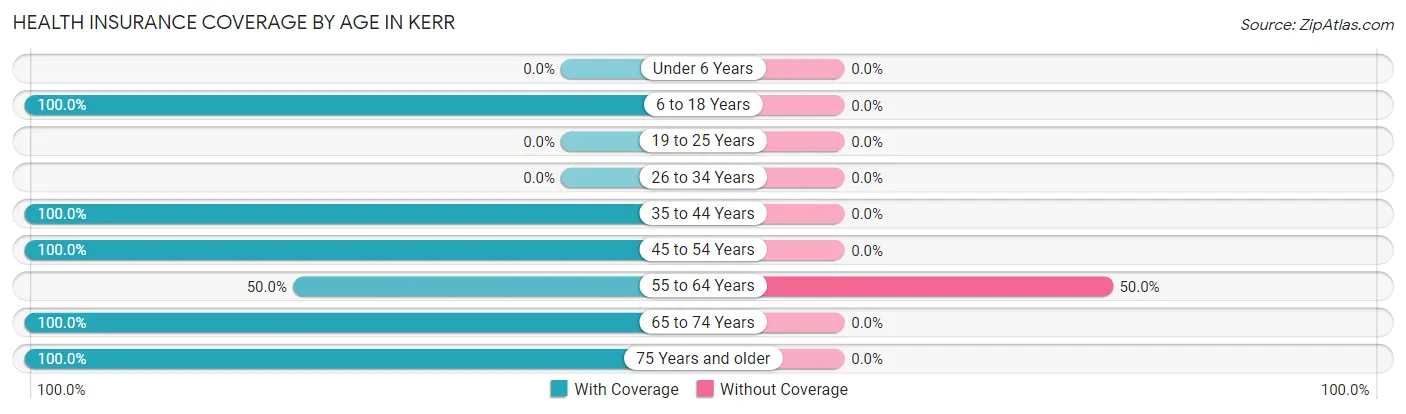
| Age Bracket | With Coverage | Without Coverage |
| Under 6 Years | 0 (0.0%) | 0 (0.0%) |
| 6 to 18 Years | 72 (100.0%) | 0 (0.0%) |
| 19 to 25 Years | 0 (0.0%) | 0 (0.0%) |
| 26 to 34 Years | 0 (0.0%) | 0 (0.0%) |
| 35 to 44 Years | 23 (100.0%) | 0 (0.0%) |
| 45 to 54 Years | 21 (100.0%) | 0 (0.0%) |
| 55 to 64 Years | 19 (50.0%) | 19 (50.0%) |
| 65 to 74 Years | 45 (100.0%) | 0 (0.0%) |
| 75 Years and older | 33 (100.0%) | 0 (0.0%) |
| Total | 213 (91.8%) | 19 (8.2%) |
Health Insurance Coverage by Citizenship Status in Kerr
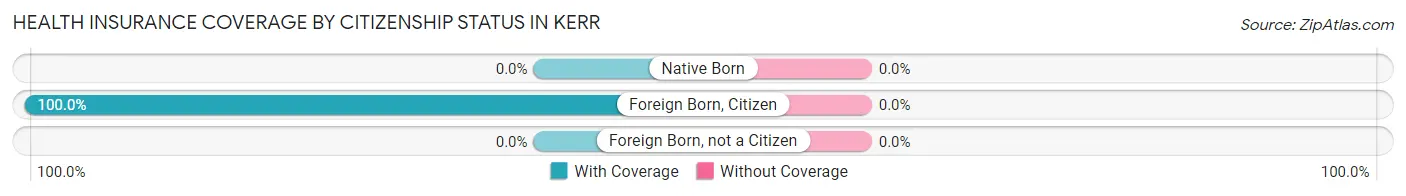
| Citizenship Status | With Coverage | Without Coverage |
| Native Born | 0 (0.0%) | 0 (0.0%) |
| Foreign Born, Citizen | 72 (100.0%) | 0 (0.0%) |
| Foreign Born, not a Citizen | 0 (0.0%) | 0 (0.0%) |
Health Insurance Coverage by Household Income in Kerr
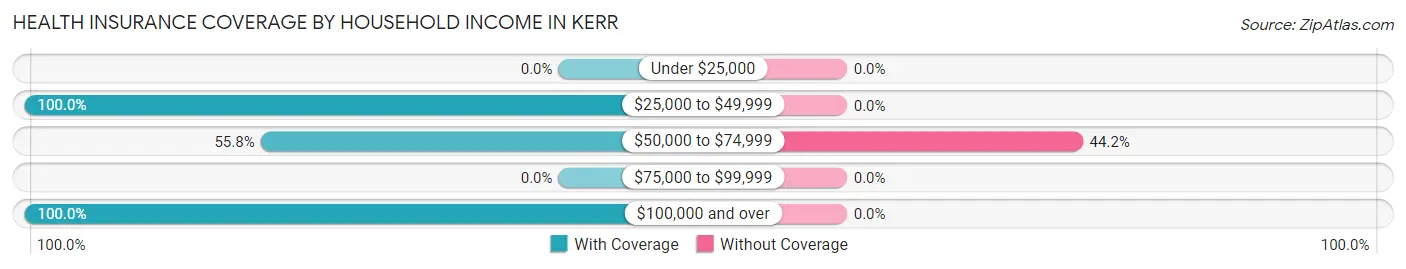
| Household Income | With Coverage | Without Coverage |
| Under $25,000 | 0 (0.0%) | 0 (0.0%) |
| $25,000 to $49,999 | 106 (100.0%) | 0 (0.0%) |
| $50,000 to $74,999 | 24 (55.8%) | 19 (44.2%) |
| $75,000 to $99,999 | 0 (0.0%) | 0 (0.0%) |
| $100,000 and over | 83 (100.0%) | 0 (0.0%) |
Public vs Private Health Insurance Coverage by Age in Kerr
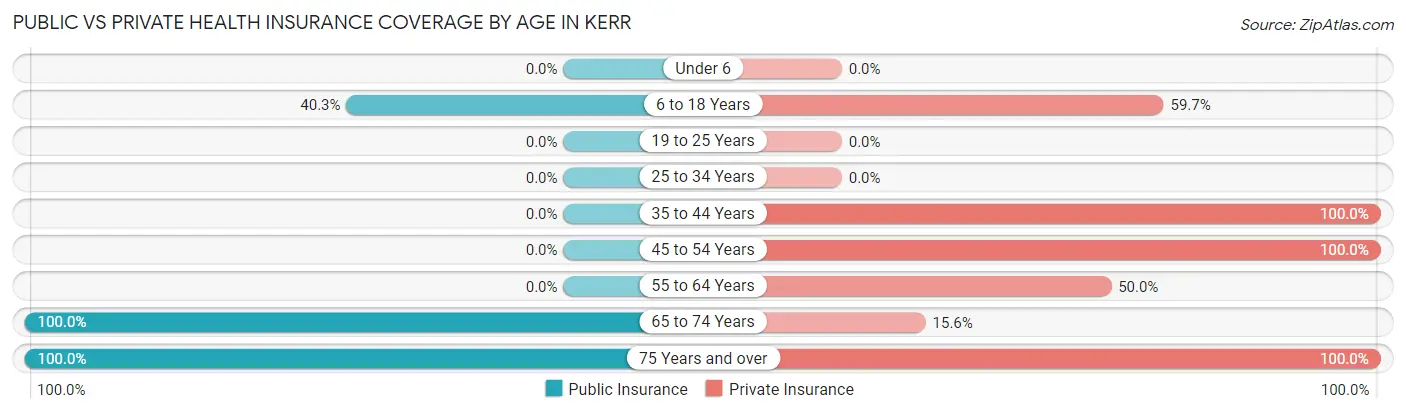
| Age Bracket | Public Insurance | Private Insurance |
| Under 6 | 0 (0.0%) | 0 (0.0%) |
| 6 to 18 Years | 29 (40.3%) | 43 (59.7%) |
| 19 to 25 Years | 0 (0.0%) | 0 (0.0%) |
| 25 to 34 Years | 0 (0.0%) | 0 (0.0%) |
| 35 to 44 Years | 0 (0.0%) | 23 (100.0%) |
| 45 to 54 Years | 0 (0.0%) | 21 (100.0%) |
| 55 to 64 Years | 0 (0.0%) | 19 (50.0%) |
| 65 to 74 Years | 45 (100.0%) | 7 (15.6%) |
| 75 Years and over | 33 (100.0%) | 33 (100.0%) |
| Total | 107 (46.1%) | 146 (62.9%) |
Disability Status by Sex by Age in Kerr
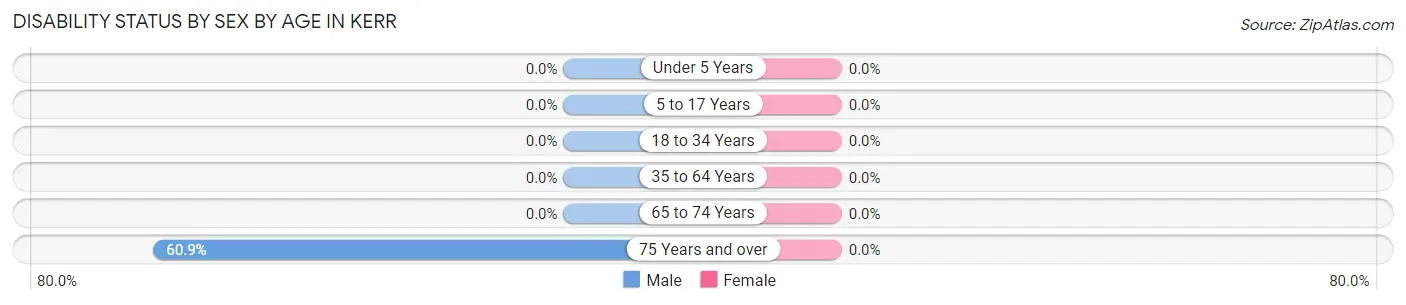
| Age Bracket | Male | Female |
| Under 5 Years | 0 (0.0%) | 0 (0.0%) |
| 5 to 17 Years | 0 (0.0%) | 0 (0.0%) |
| 18 to 34 Years | 0 (0.0%) | 0 (0.0%) |
| 35 to 64 Years | 0 (0.0%) | 0 (0.0%) |
| 65 to 74 Years | 0 (0.0%) | 0 (0.0%) |
| 75 Years and over | 14 (60.9%) | 0 (0.0%) |
Disability Class by Sex by Age in Kerr
Disability Class: Hearing Difficulty
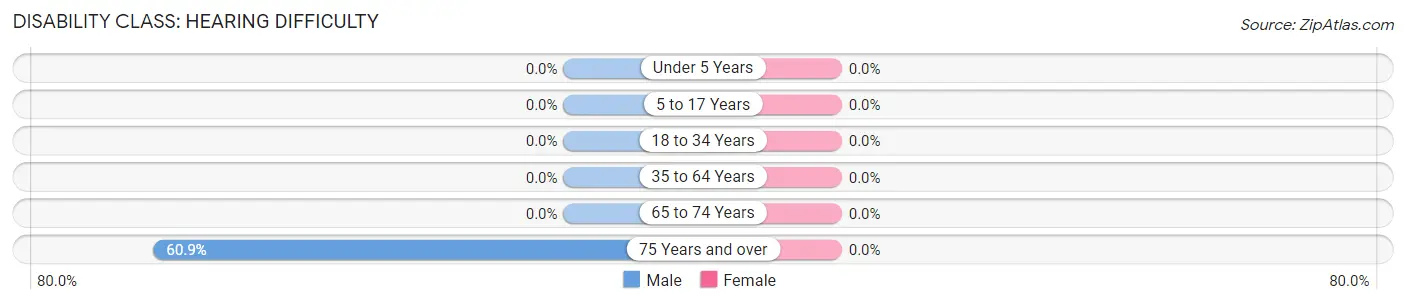
| Age Bracket | Male | Female |
| Under 5 Years | 0 (0.0%) | 0 (0.0%) |
| 5 to 17 Years | 0 (0.0%) | 0 (0.0%) |
| 18 to 34 Years | 0 (0.0%) | 0 (0.0%) |
| 35 to 64 Years | 0 (0.0%) | 0 (0.0%) |
| 65 to 74 Years | 0 (0.0%) | 0 (0.0%) |
| 75 Years and over | 14 (60.9%) | 0 (0.0%) |
Disability Class: Vision Difficulty
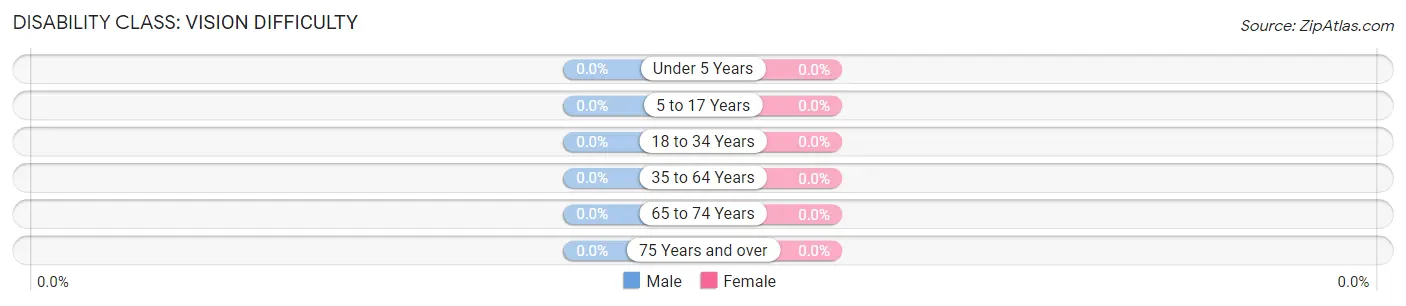
| Age Bracket | Male | Female |
| Under 5 Years | 0 (0.0%) | 0 (0.0%) |
| 5 to 17 Years | 0 (0.0%) | 0 (0.0%) |
| 18 to 34 Years | 0 (0.0%) | 0 (0.0%) |
| 35 to 64 Years | 0 (0.0%) | 0 (0.0%) |
| 65 to 74 Years | 0 (0.0%) | 0 (0.0%) |
| 75 Years and over | 0 (0.0%) | 0 (0.0%) |
Disability Class: Cognitive Difficulty
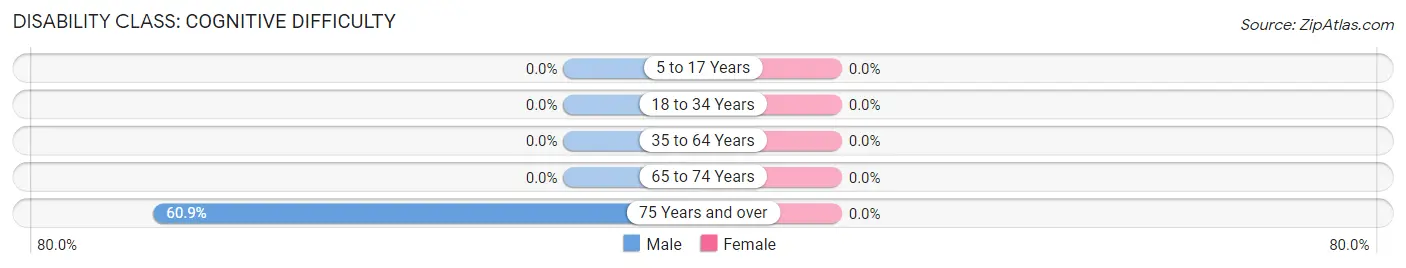
| Age Bracket | Male | Female |
| 5 to 17 Years | 0 (0.0%) | 0 (0.0%) |
| 18 to 34 Years | 0 (0.0%) | 0 (0.0%) |
| 35 to 64 Years | 0 (0.0%) | 0 (0.0%) |
| 65 to 74 Years | 0 (0.0%) | 0 (0.0%) |
| 75 Years and over | 14 (60.9%) | 0 (0.0%) |
Disability Class: Ambulatory Difficulty
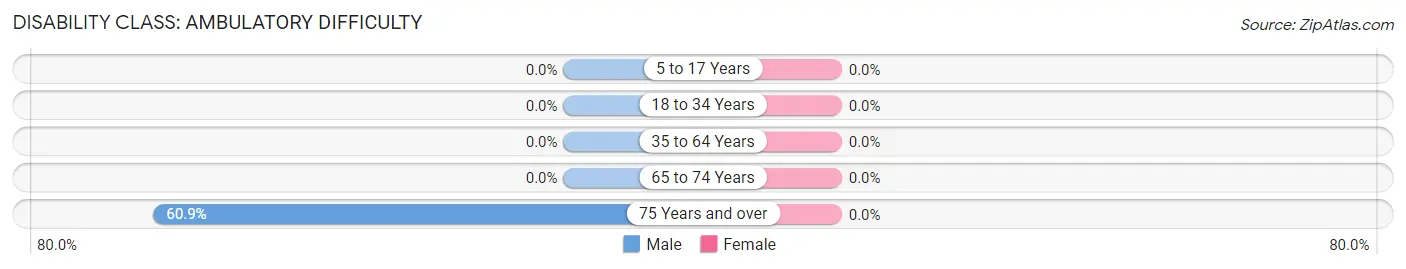
| Age Bracket | Male | Female |
| 5 to 17 Years | 0 (0.0%) | 0 (0.0%) |
| 18 to 34 Years | 0 (0.0%) | 0 (0.0%) |
| 35 to 64 Years | 0 (0.0%) | 0 (0.0%) |
| 65 to 74 Years | 0 (0.0%) | 0 (0.0%) |
| 75 Years and over | 14 (60.9%) | 0 (0.0%) |
Disability Class: Self-Care Difficulty
| Age Bracket | Male | Female |
| 5 to 17 Years | 0 (0.0%) | 0 (0.0%) |
| 18 to 34 Years | 0 (0.0%) | 0 (0.0%) |
| 35 to 64 Years | 0 (0.0%) | 0 (0.0%) |
| 65 to 74 Years | 0 (0.0%) | 0 (0.0%) |
| 75 Years and over | 0 (0.0%) | 0 (0.0%) |
Technology Access in Kerr
Computing Device Access in Kerr
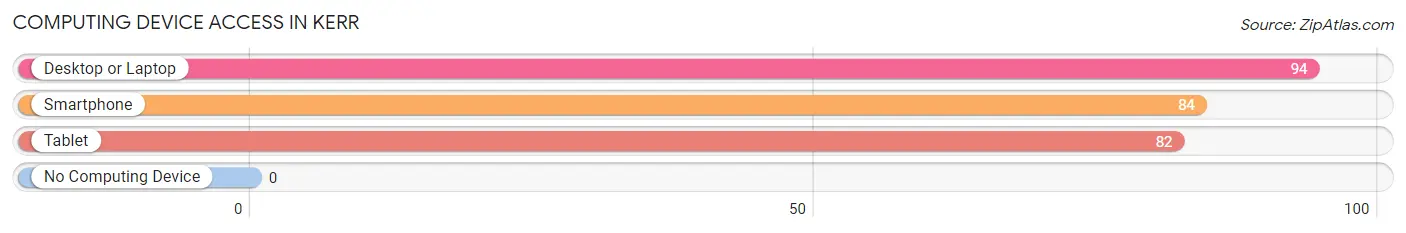
| Device Type | # Households | % Households |
| Desktop or Laptop | 94 | 100.0% |
| Smartphone | 84 | 89.4% |
| Tablet | 82 | 87.2% |
| No Computing Device | 0 | 0.0% |
| Total | 94 | 100.0% |
Internet Access in Kerr
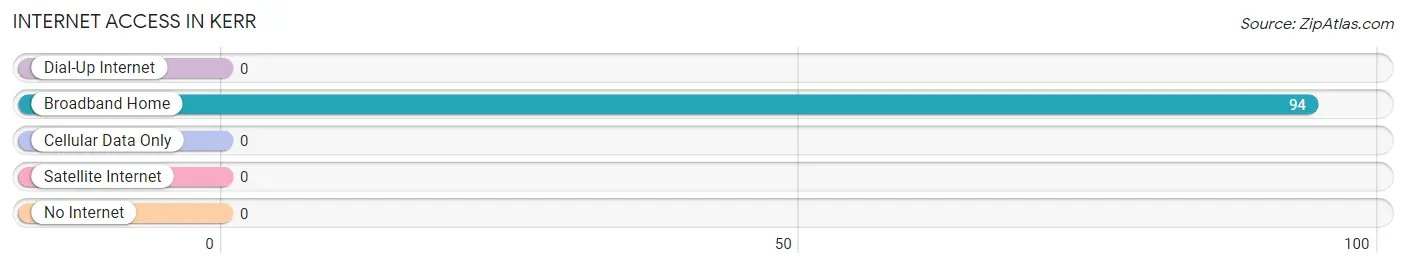
| Internet Type | # Households | % Households |
| Dial-Up Internet | 0 | 0.0% |
| Broadband Home | 94 | 100.0% |
| Cellular Data Only | 0 | 0.0% |
| Satellite Internet | 0 | 0.0% |
| No Internet | 0 | 0.0% |
| Total | 94 | 100.0% |
Kerr Summary
Kerr, Montana is a small town located in the western part of the state, near the Idaho border. It is situated in the Flathead Valley, a region of the Rocky Mountains known for its scenic beauty and outdoor recreation opportunities. The town has a population of just over 500 people, and is the county seat of Lake County.
Kerr was founded in 1883 by a group of settlers from the Midwest. The town was named after a local rancher, William Kerr, who had a large ranch in the area. The town quickly grew, and by the early 1900s, it had become a bustling center of commerce and industry. The town was home to several sawmills, a flour mill, a creamery, and a number of other businesses.
Kerr is located in a region of Montana known for its agricultural production. The area is home to a variety of crops, including wheat, barley, oats, hay, and potatoes. The town is also home to a number of cattle ranches, and is a popular destination for hunters and fishermen.
The economy of Kerr is largely based on agriculture and tourism. The town is home to several small businesses, including a grocery store, a hardware store, and a few restaurants. The town also has a small airport, which serves as a hub for air travel to and from the region.
Kerr is home to a number of historic sites, including the Kerr Museum, which houses artifacts from the town's early days. The town is also home to a number of parks and recreational areas, including the Kerr County Park, which offers camping, fishing, and hiking opportunities.
Kerr is a small town with a rich history and a vibrant economy. The town is home to a diverse population, and is a popular destination for tourists and outdoor enthusiasts. The town is also home to a number of businesses, and is a great place to live and work.
Common Questions
What is Per Capita Income in Kerr?
Per Capita income in Kerr is $28,650.
What is the Median Family Income in Kerr?
Median Family Income in Kerr is $56,250.
What is the Median Household income in Kerr?
Median Household Income in Kerr is $37,303.
What is Inequality or Gini Index in Kerr?
Inequality or Gini Index in Kerr is 0.37.
What is the Total Population of Kerr?
Total Population of Kerr is 232.
What is the Total Male Population of Kerr?
Total Male Population of Kerr is 149.
What is the Total Female Population of Kerr?
Total Female Population of Kerr is 83.
What is the Ratio of Males per 100 Females in Kerr?
There are 179.52 Males per 100 Females in Kerr.
What is the Ratio of Females per 100 Males in Kerr?
There are 55.70 Females per 100 Males in Kerr.
What is the Median Population Age in Kerr?
Median Population Age in Kerr is 52.0 Years.
What is the Average Family Size in Kerr
Average Family Size in Kerr is 3.5 People.
What is the Average Household Size in Kerr
Average Household Size in Kerr is 2.5 People.
How Large is the Labor Force in Kerr?
There are 91 People in the Labor Forcein in Kerr.
What is the Percentage of People in the Labor Force in Kerr?
53.2% of People are in the Labor Force in Kerr.