Evaro, MT Map & Demographics
Evaro Map
Evaro Overview
$26,616
PER CAPITA INCOME
$77,566
AVG FAMILY INCOME
$61,094
AVG HOUSEHOLD INCOME
0.37
INEQUALITY / GINI INDEX
505
TOTAL POPULATION
261
MALE POPULATION
244
FEMALE POPULATION
106.97
MALES / 100 FEMALES
93.49
FEMALES / 100 MALES
40.1
MEDIAN AGE
3.6
AVG FAMILY SIZE
3.0
AVG HOUSEHOLD SIZE
149
LABOR FORCE [ PEOPLE ]
45.7%
PERCENT IN LABOR FORCE
7.4%
UNEMPLOYMENT RATE
Income in Evaro
Income Overview in Evaro
Per Capita Income in Evaro is $26,616, while median incomes of families and households are $77,566 and $61,094 respectively.
| Characteristic | Number | Measure |
| Per Capita Income | 505 | $26,616 |
| Median Family Income | 117 | $77,566 |
| Mean Family Income | 117 | $86,865 |
| Median Household Income | 157 | $61,094 |
| Mean Household Income | 157 | $79,101 |
| Income Deficit | 117 | $0 |
| Wage / Income Gap (%) | 505 | 0.00% |
| Wage / Income Gap ($) | 505 | 100.00¢ per $1 |
| Gini / Inequality Index | 505 | 0.37 |
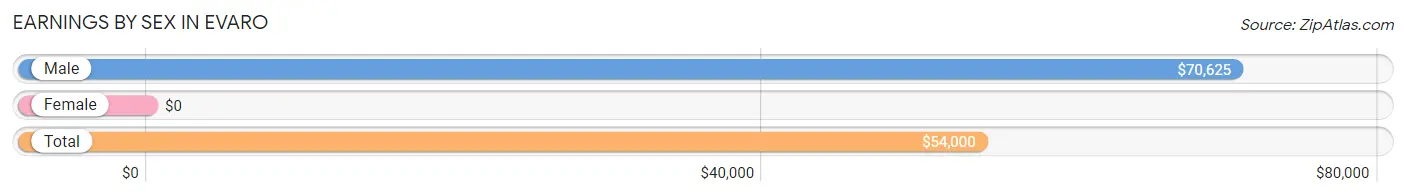
Earnings by Sex in Evaro
| Sex | Number | Average Earnings |
| Male | 86 (55.1%) | $70,625 |
| Female | 70 (44.9%) | $0 |
| Total | 156 (100.0%) | $54,000 |
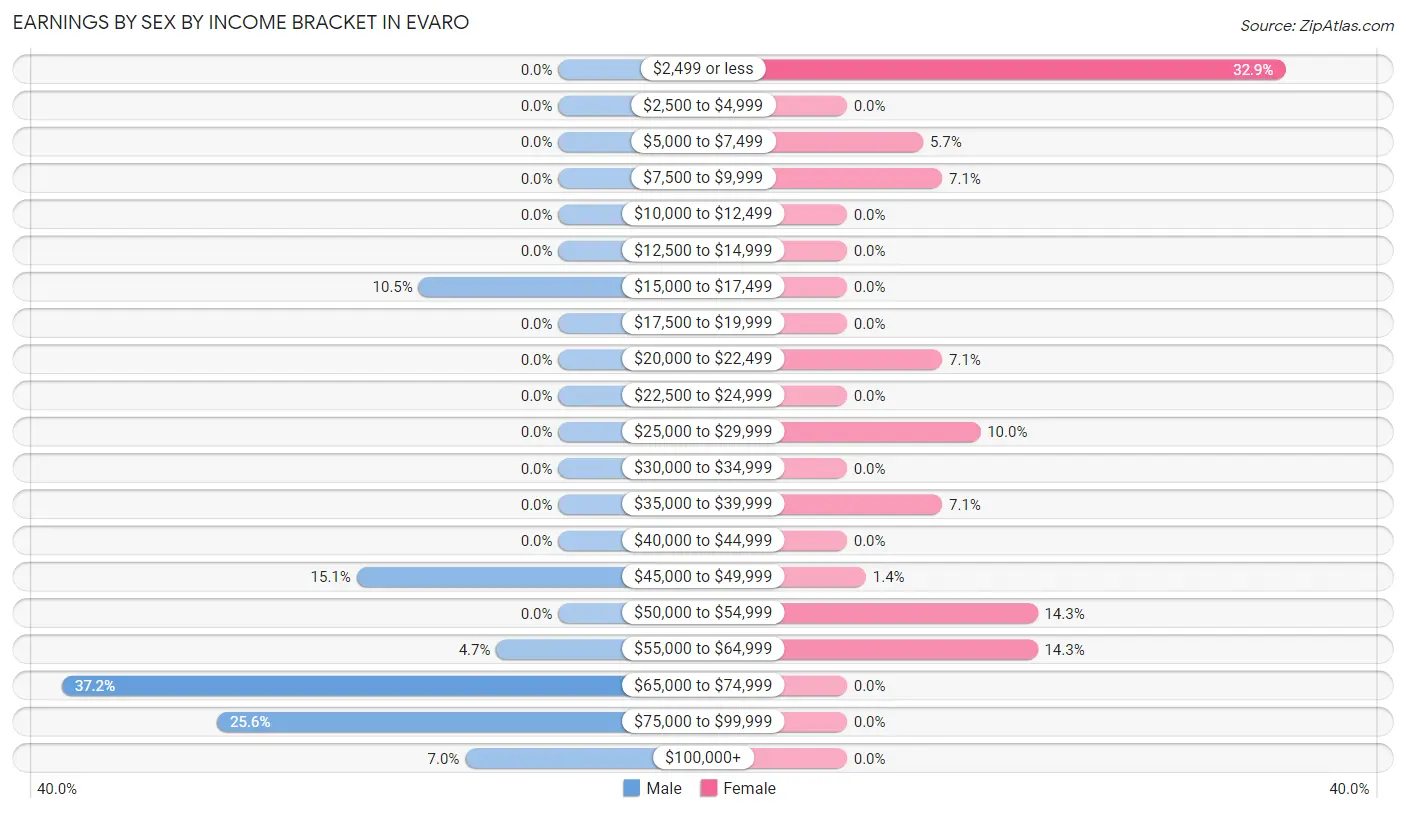
Earnings by Sex by Income Bracket in Evaro
The most common earnings brackets in Evaro are $65,000 to $74,999 for men (32 | 37.2%) and $2,499 or less for women (23 | 32.9%).
| Income | Male | Female |
| $2,499 or less | 0 (0.0%) | 23 (32.9%) |
| $2,500 to $4,999 | 0 (0.0%) | 0 (0.0%) |
| $5,000 to $7,499 | 0 (0.0%) | 4 (5.7%) |
| $7,500 to $9,999 | 0 (0.0%) | 5 (7.1%) |
| $10,000 to $12,499 | 0 (0.0%) | 0 (0.0%) |
| $12,500 to $14,999 | 0 (0.0%) | 0 (0.0%) |
| $15,000 to $17,499 | 9 (10.5%) | 0 (0.0%) |
| $17,500 to $19,999 | 0 (0.0%) | 0 (0.0%) |
| $20,000 to $22,499 | 0 (0.0%) | 5 (7.1%) |
| $22,500 to $24,999 | 0 (0.0%) | 0 (0.0%) |
| $25,000 to $29,999 | 0 (0.0%) | 7 (10.0%) |
| $30,000 to $34,999 | 0 (0.0%) | 0 (0.0%) |
| $35,000 to $39,999 | 0 (0.0%) | 5 (7.1%) |
| $40,000 to $44,999 | 0 (0.0%) | 0 (0.0%) |
| $45,000 to $49,999 | 13 (15.1%) | 1 (1.4%) |
| $50,000 to $54,999 | 0 (0.0%) | 10 (14.3%) |
| $55,000 to $64,999 | 4 (4.6%) | 10 (14.3%) |
| $65,000 to $74,999 | 32 (37.2%) | 0 (0.0%) |
| $75,000 to $99,999 | 22 (25.6%) | 0 (0.0%) |
| $100,000+ | 6 (7.0%) | 0 (0.0%) |
| Total | 86 (100.0%) | 70 (100.0%) |
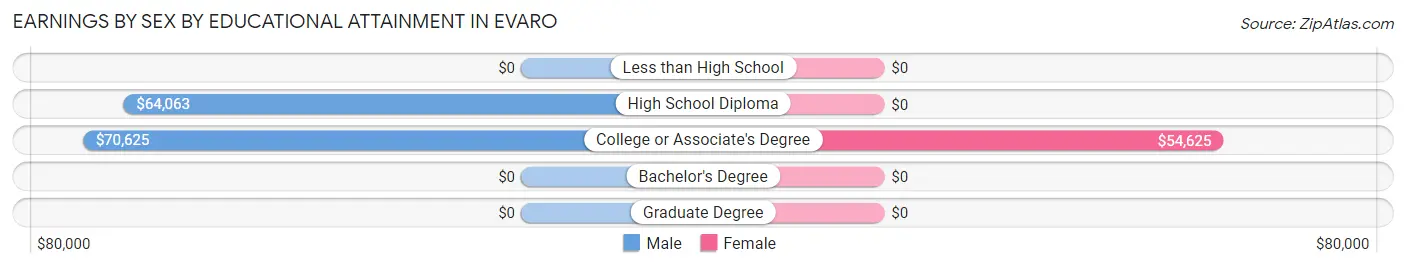
Earnings by Sex by Educational Attainment in Evaro
Average earnings in Evaro are $70,625 for men and $26,250 for women, a difference of 62.8%. Men with an educational attainment of college or associate's degree enjoy the highest average annual earnings of $70,625, while those with high school diploma education earn the least with $64,063. Women with an educational attainment of college or associate's degree earn the most with the average annual earnings of $54,625, while those with college or associate's degree education have the smallest earnings of $54,625.
| Educational Attainment | Male Income | Female Income |
| Less than High School | - | - |
| High School Diploma | $64,063 | $0 |
| College or Associate's Degree | $70,625 | $54,625 |
| Bachelor's Degree | - | - |
| Graduate Degree | - | - |
| Total | $70,625 | $26,250 |
Family Income in Evaro
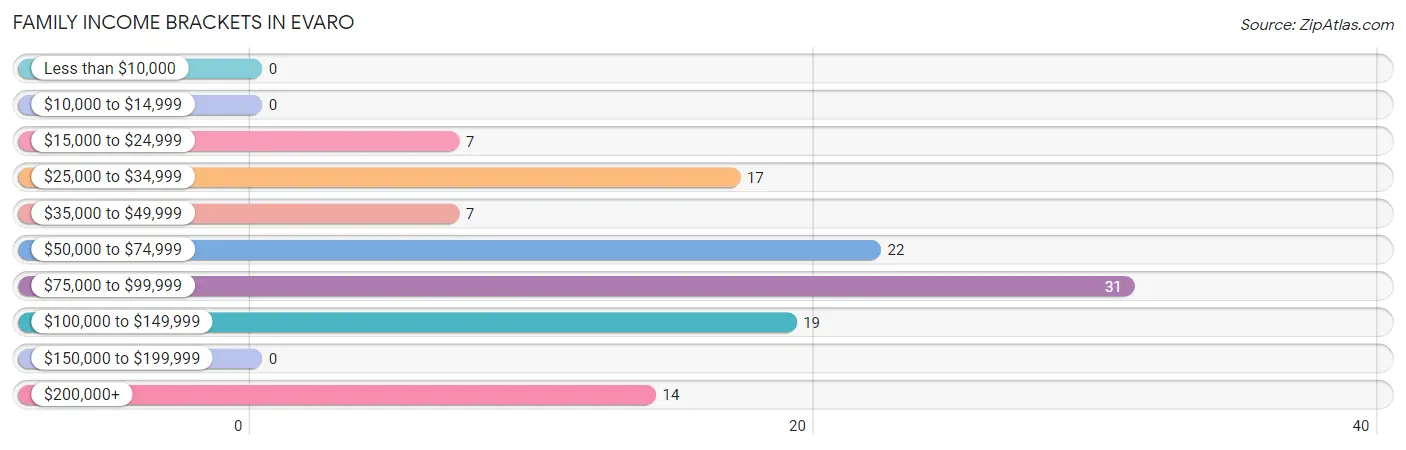
Family Income Brackets in Evaro
According to the Evaro family income data, there are 31 families falling into the $75,000 to $99,999 income range, which is the most common income bracket and makes up 26.5% of all families.
| Income Bracket | # Families | % Families |
| Less than $10,000 | 0 | 0.0% |
| $10,000 to $14,999 | 0 | 0.0% |
| $15,000 to $24,999 | 7 | 6.0% |
| $25,000 to $34,999 | 17 | 14.5% |
| $35,000 to $49,999 | 7 | 6.0% |
| $50,000 to $74,999 | 22 | 18.8% |
| $75,000 to $99,999 | 31 | 26.5% |
| $100,000 to $149,999 | 19 | 16.2% |
| $150,000 to $199,999 | 0 | 0.0% |
| $200,000+ | 14 | 12.0% |
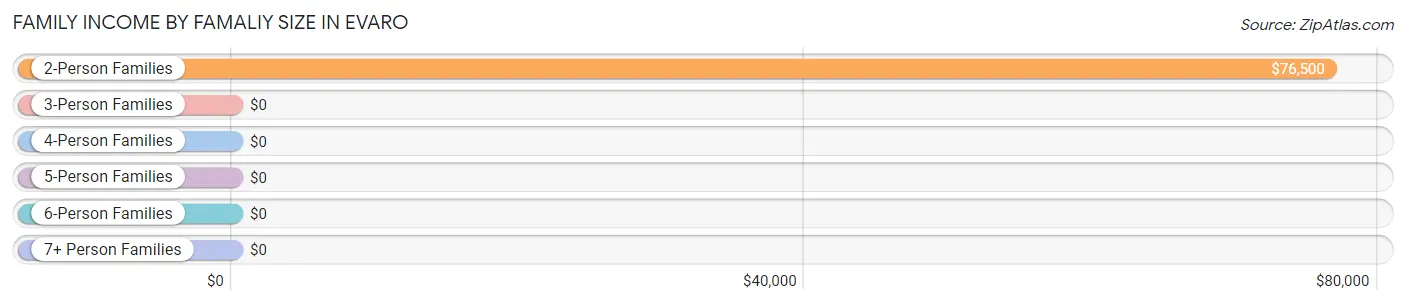
Family Income by Famaliy Size in Evaro
2-person families (84 | 71.8%) account for the highest median family income in Evaro with $76,500 per family, while 2-person families (84 | 71.8%) have the highest median income of $38,250 per family member.
| Income Bracket | # Families | Median Income |
| 2-Person Families | 84 (71.8%) | $76,500 |
| 3-Person Families | 7 (6.0%) | $0 |
| 4-Person Families | 17 (14.5%) | $0 |
| 5-Person Families | 0 (0.0%) | $0 |
| 6-Person Families | 0 (0.0%) | $0 |
| 7+ Person Families | 9 (7.7%) | $0 |
| Total | 117 (100.0%) | $77,566 |
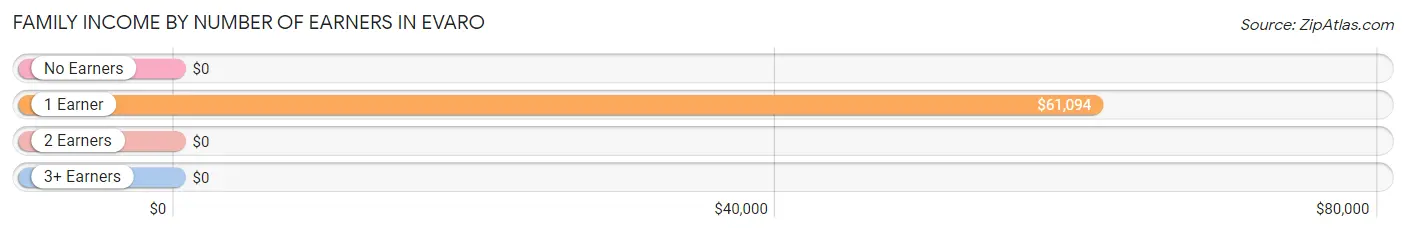
Family Income by Number of Earners in Evaro
| Number of Earners | # Families | Median Income |
| No Earners | 28 (23.9%) | $0 |
| 1 Earner | 61 (52.1%) | $61,094 |
| 2 Earners | 19 (16.2%) | $0 |
| 3+ Earners | 9 (7.7%) | $0 |
| Total | 117 (100.0%) | $77,566 |
Household Income in Evaro
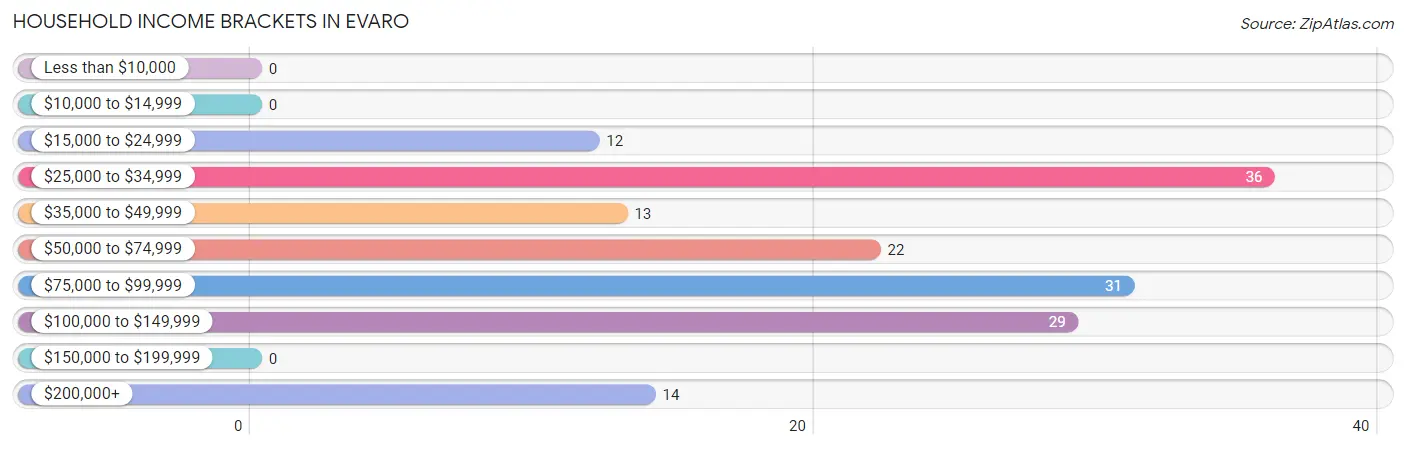
Household Income Brackets in Evaro
With 36 households falling in the category, the $25,000 to $34,999 income range is the most frequent in Evaro, accounting for 22.9% of all households.
| Income Bracket | # Households | % Households |
| Less than $10,000 | 0 | 0.0% |
| $10,000 to $14,999 | 0 | 0.0% |
| $15,000 to $24,999 | 12 | 7.6% |
| $25,000 to $34,999 | 36 | 22.9% |
| $35,000 to $49,999 | 13 | 8.3% |
| $50,000 to $74,999 | 22 | 14.0% |
| $75,000 to $99,999 | 31 | 19.7% |
| $100,000 to $149,999 | 29 | 18.5% |
| $150,000 to $199,999 | 0 | 0.0% |
| $200,000+ | 14 | 8.9% |
Household Income by Householder Age in Evaro
The median household income in Evaro is $61,094, with the highest median household income of $126,354 found in the 25 to 44 years age bracket for the primary householder. A total of 31 households (19.8%) fall into this category.
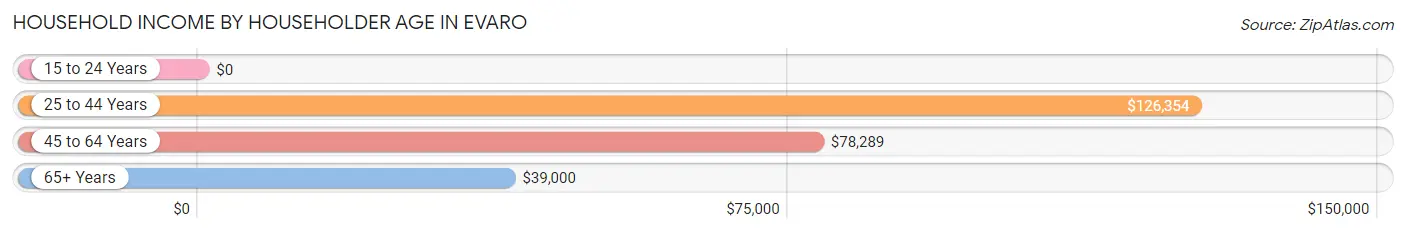
| Income Bracket | # Households | Median Income |
| 15 to 24 Years | 0 (0.0%) | $0 |
| 25 to 44 Years | 31 (19.8%) | $126,354 |
| 45 to 64 Years | 46 (29.3%) | $78,289 |
| 65+ Years | 80 (51.0%) | $39,000 |
| Total | 157 (100.0%) | $61,094 |
Poverty in Evaro
Income Below Poverty by Sex and Age in Evaro
With 23.7% poverty level for males and 22.1% for females among the residents of Evaro, under 5 year old males and 16 and 17 year old females are the most vulnerable to poverty, with 17 males (100.0%) and 11 females (100.0%) in their respective age groups living below the poverty level.
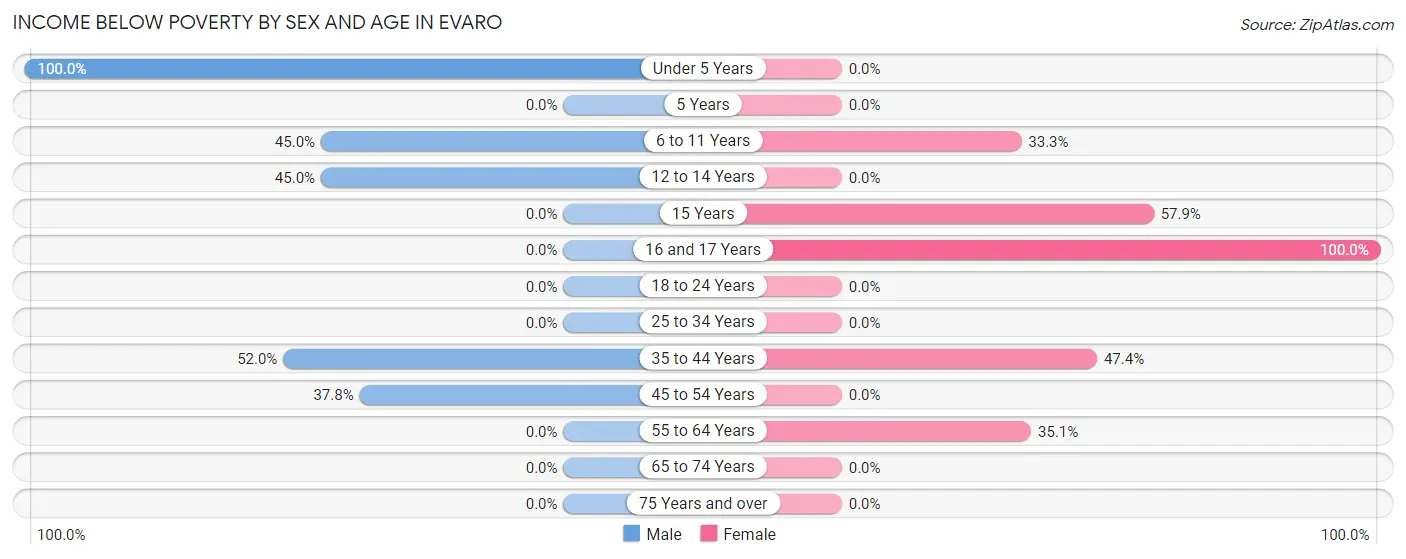
| Age Bracket | Male | Female |
| Under 5 Years | 17 (100.0%) | 0 (0.0%) |
| 5 Years | 0 (0.0%) | 0 (0.0%) |
| 6 to 11 Years | 9 (45.0%) | 10 (33.3%) |
| 12 to 14 Years | 9 (45.0%) | 0 (0.0%) |
| 15 Years | 0 (0.0%) | 11 (57.9%) |
| 16 and 17 Years | 0 (0.0%) | 11 (100.0%) |
| 18 to 24 Years | 0 (0.0%) | 0 (0.0%) |
| 25 to 34 Years | 0 (0.0%) | 0 (0.0%) |
| 35 to 44 Years | 13 (52.0%) | 9 (47.4%) |
| 45 to 54 Years | 14 (37.8%) | 0 (0.0%) |
| 55 to 64 Years | 0 (0.0%) | 13 (35.1%) |
| 65 to 74 Years | 0 (0.0%) | 0 (0.0%) |
| 75 Years and over | 0 (0.0%) | 0 (0.0%) |
| Total | 62 (23.7%) | 54 (22.1%) |
Income Above Poverty by Sex and Age in Evaro
According to the poverty statistics in Evaro, males aged 25 to 34 years and females aged 5 years are the age groups that are most secure financially, with 100.0% of males and 100.0% of females in these age groups living above the poverty line.
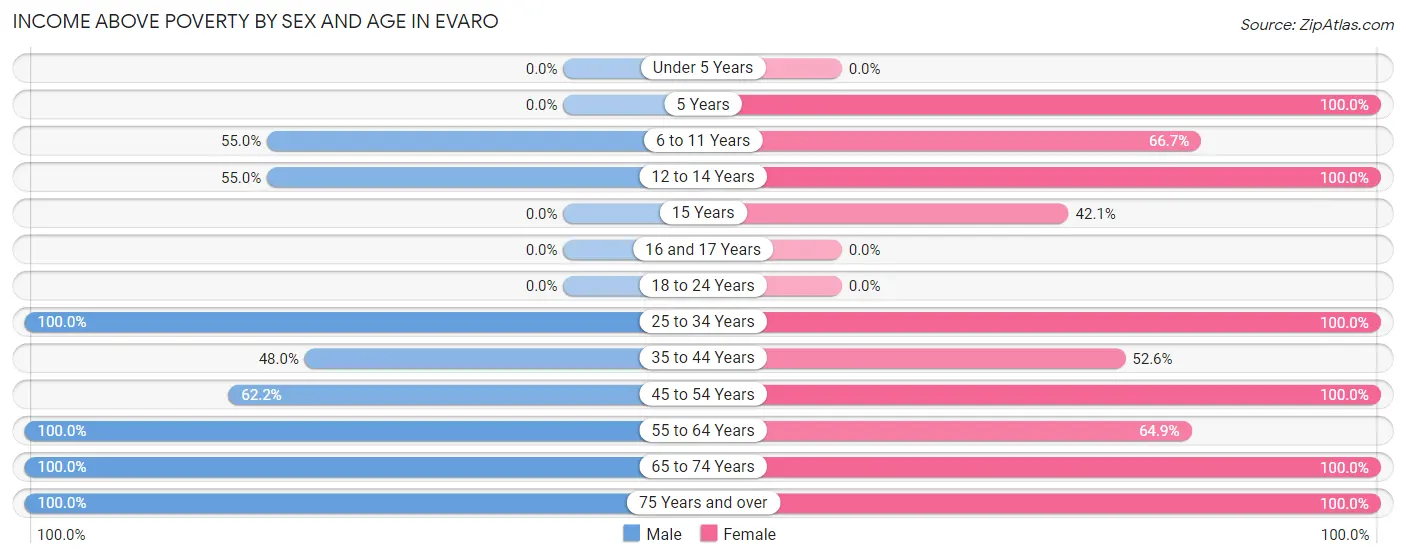
| Age Bracket | Male | Female |
| Under 5 Years | 0 (0.0%) | 0 (0.0%) |
| 5 Years | 0 (0.0%) | 11 (100.0%) |
| 6 to 11 Years | 11 (55.0%) | 20 (66.7%) |
| 12 to 14 Years | 11 (55.0%) | 62 (100.0%) |
| 15 Years | 0 (0.0%) | 8 (42.1%) |
| 16 and 17 Years | 0 (0.0%) | 0 (0.0%) |
| 18 to 24 Years | 0 (0.0%) | 0 (0.0%) |
| 25 to 34 Years | 20 (100.0%) | 10 (100.0%) |
| 35 to 44 Years | 12 (48.0%) | 10 (52.6%) |
| 45 to 54 Years | 23 (62.2%) | 5 (100.0%) |
| 55 to 64 Years | 18 (100.0%) | 24 (64.9%) |
| 65 to 74 Years | 43 (100.0%) | 22 (100.0%) |
| 75 Years and over | 61 (100.0%) | 18 (100.0%) |
| Total | 199 (76.2%) | 190 (77.9%) |
Income Below Poverty Among Married-Couple Families in Evaro
The poverty statistics for married-couple families in Evaro show that 10.1% or 9 of the total 89 families live below the poverty line. Families with 5 or more children have the highest poverty rate of 100.0%, comprising of 9 families. On the other hand, families with no children have the lowest poverty rate of 0.0%, which includes 0 families.
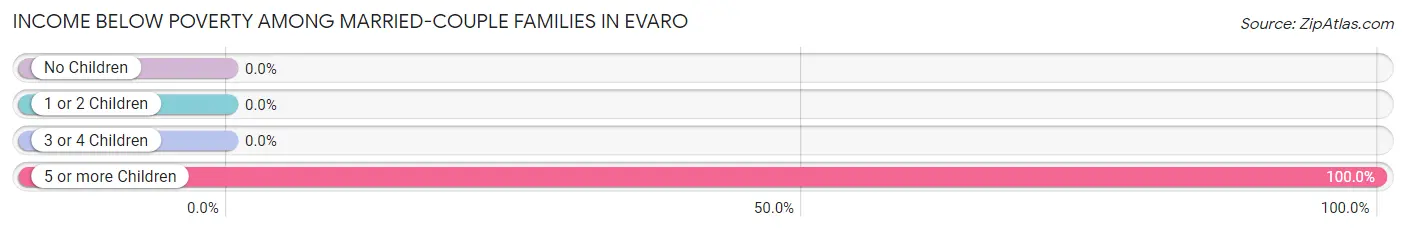
| Children | Above Poverty | Below Poverty |
| No Children | 56 (100.0%) | 0 (0.0%) |
| 1 or 2 Children | 24 (100.0%) | 0 (0.0%) |
| 3 or 4 Children | 0 (0.0%) | 0 (0.0%) |
| 5 or more Children | 0 (0.0%) | 9 (100.0%) |
| Total | 80 (89.9%) | 9 (10.1%) |
Income Below Poverty Among Single-Parent Households in Evaro
| Children | Single Father | Single Mother |
| No Children | 0 (0.0%) | 0 (0.0%) |
| 1 or 2 Children | 0 (0.0%) | 0 (0.0%) |
| 3 or 4 Children | 0 (0.0%) | 0 (0.0%) |
| 5 or more Children | 0 (0.0%) | 0 (0.0%) |
| Total | 0 (0.0%) | 0 (0.0%) |
Income Below Poverty Among Married-Couple vs Single-Parent Households in Evaro
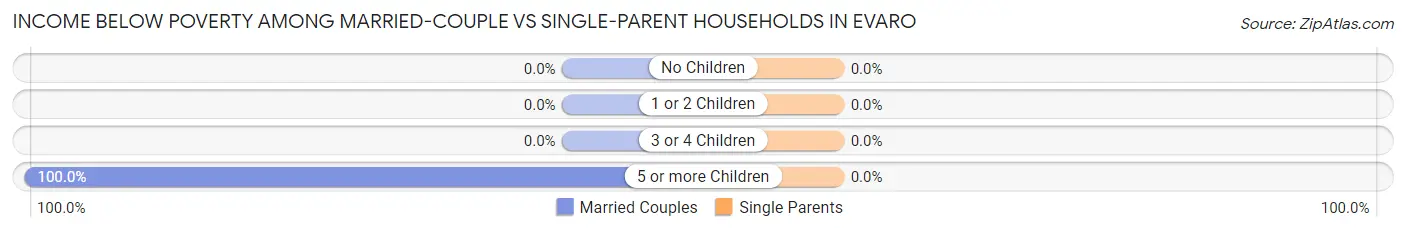
| Children | Married-Couple Families | Single-Parent Households |
| No Children | 0 (0.0%) | 0 (0.0%) |
| 1 or 2 Children | 0 (0.0%) | 0 (0.0%) |
| 3 or 4 Children | 0 (0.0%) | 0 (0.0%) |
| 5 or more Children | 9 (100.0%) | 0 (0.0%) |
| Total | 9 (10.1%) | 0 (0.0%) |
Race in Evaro
The most populous races in Evaro are Native / Alaskan (282 | 55.8%), White / Caucasian (197 | 39.0%), and Two or more Races (18 | 3.6%).
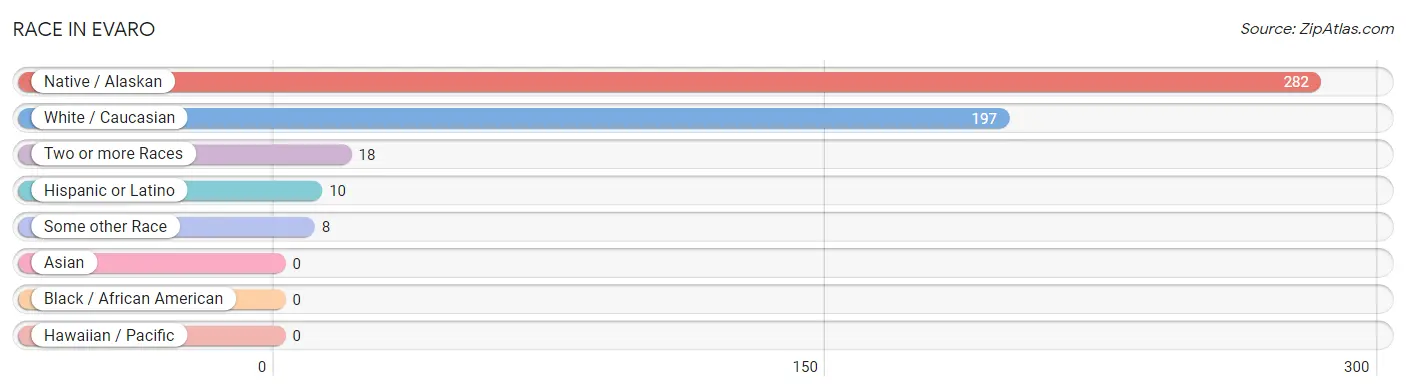
| Race | # Population | % Population |
| Asian | 0 | 0.0% |
| Black / African American | 0 | 0.0% |
| Hawaiian / Pacific | 0 | 0.0% |
| Hispanic or Latino | 10 | 2.0% |
| Native / Alaskan | 282 | 55.8% |
| White / Caucasian | 197 | 39.0% |
| Two or more Races | 18 | 3.6% |
| Some other Race | 8 | 1.6% |
| Total | 505 | 100.0% |
Ancestry in Evaro
The most populous ancestries reported in Evaro are German (55 | 10.9%), English (45 | 8.9%), Irish (25 | 5.0%), Blackfeet (19 | 3.8%), and French (19 | 3.8%), together accounting for 32.3% of all Evaro residents.
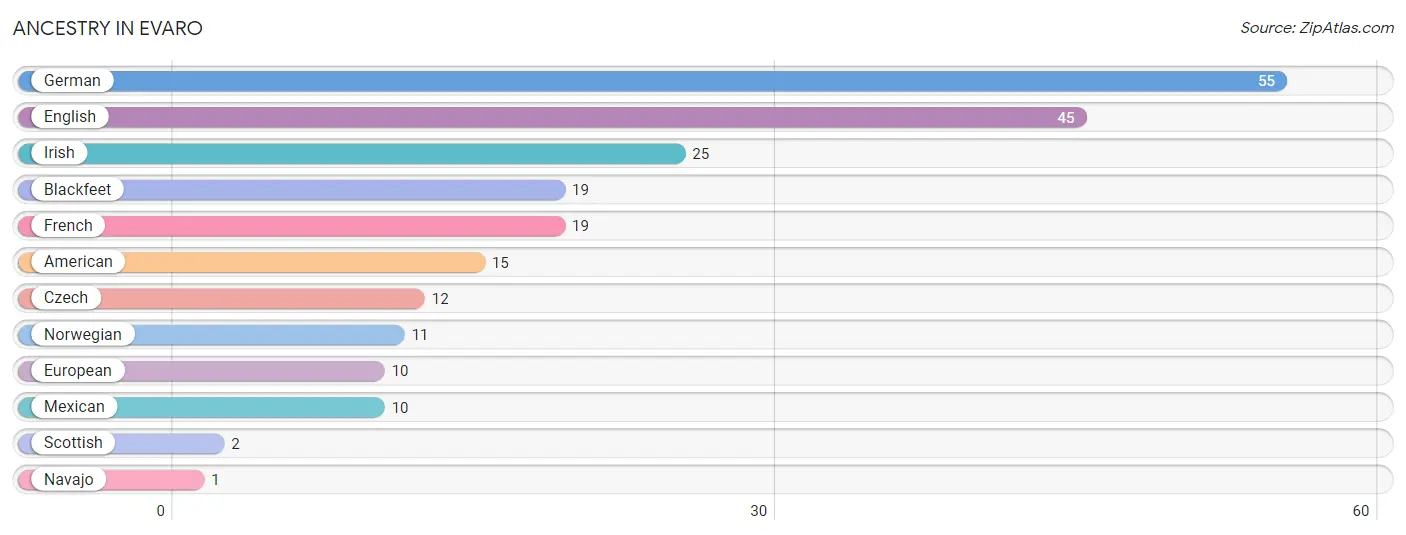
| Ancestry | # Population | % Population |
| American | 15 | 3.0% |
| Blackfeet | 19 | 3.8% |
| Czech | 12 | 2.4% |
| English | 45 | 8.9% |
| European | 10 | 2.0% |
| French | 19 | 3.8% |
| German | 55 | 10.9% |
| Irish | 25 | 5.0% |
| Mexican | 10 | 2.0% |
| Navajo | 1 | 0.2% |
| Norwegian | 11 | 2.2% |
| Scottish | 2 | 0.4% | View All 12 Rows |
Immigrants in Evaro

| Immigration Origin | # Population | % Population | View All 0 Rows |
Sex and Age in Evaro
Sex and Age in Evaro
The most populous age groups in Evaro are 80 to 84 Years (54 | 20.7%) for men and 10 to 14 Years (82 | 33.6%) for women.
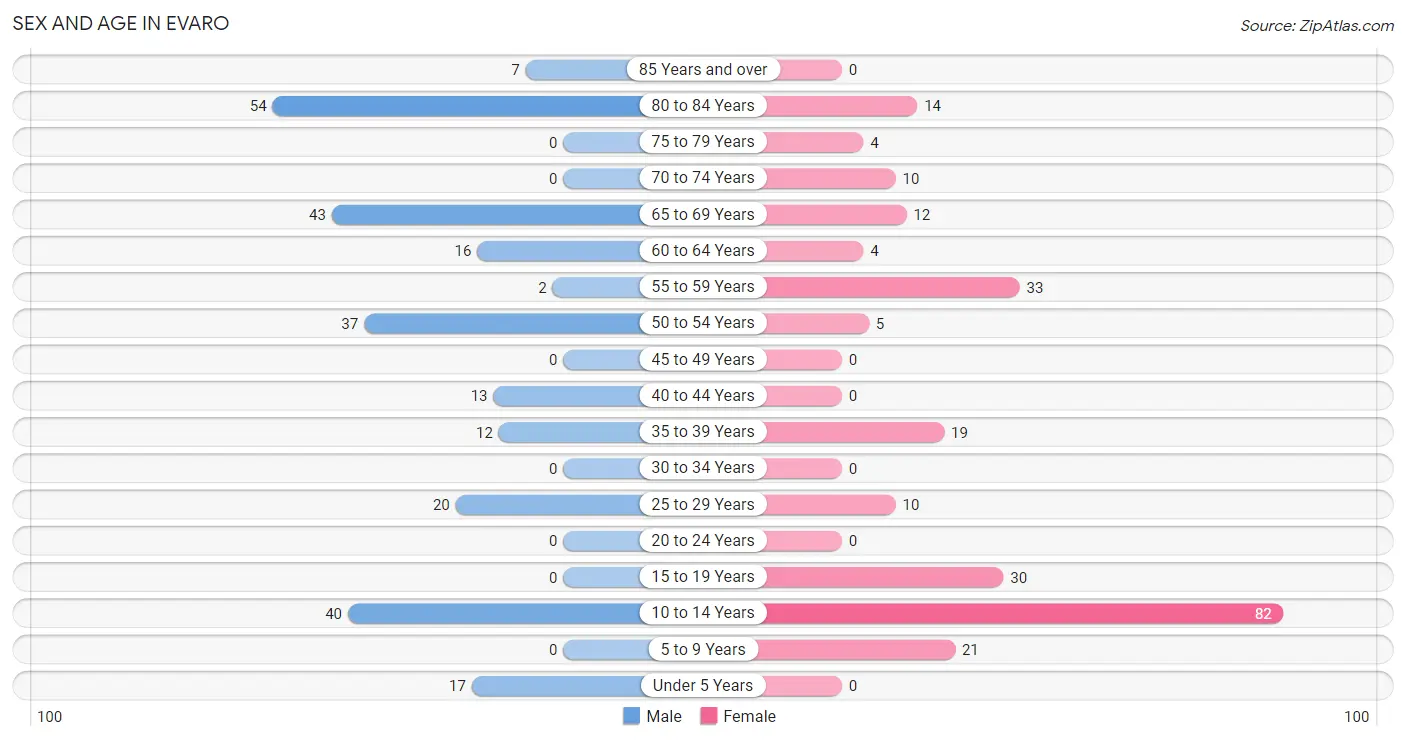
| Age Bracket | Male | Female |
| Under 5 Years | 17 (6.5%) | 0 (0.0%) |
| 5 to 9 Years | 0 (0.0%) | 21 (8.6%) |
| 10 to 14 Years | 40 (15.3%) | 82 (33.6%) |
| 15 to 19 Years | 0 (0.0%) | 30 (12.3%) |
| 20 to 24 Years | 0 (0.0%) | 0 (0.0%) |
| 25 to 29 Years | 20 (7.7%) | 10 (4.1%) |
| 30 to 34 Years | 0 (0.0%) | 0 (0.0%) |
| 35 to 39 Years | 12 (4.6%) | 19 (7.8%) |
| 40 to 44 Years | 13 (5.0%) | 0 (0.0%) |
| 45 to 49 Years | 0 (0.0%) | 0 (0.0%) |
| 50 to 54 Years | 37 (14.2%) | 5 (2.1%) |
| 55 to 59 Years | 2 (0.8%) | 33 (13.5%) |
| 60 to 64 Years | 16 (6.1%) | 4 (1.6%) |
| 65 to 69 Years | 43 (16.5%) | 12 (4.9%) |
| 70 to 74 Years | 0 (0.0%) | 10 (4.1%) |
| 75 to 79 Years | 0 (0.0%) | 4 (1.6%) |
| 80 to 84 Years | 54 (20.7%) | 14 (5.7%) |
| 85 Years and over | 7 (2.7%) | 0 (0.0%) |
| Total | 261 (100.0%) | 244 (100.0%) |
Families and Households in Evaro
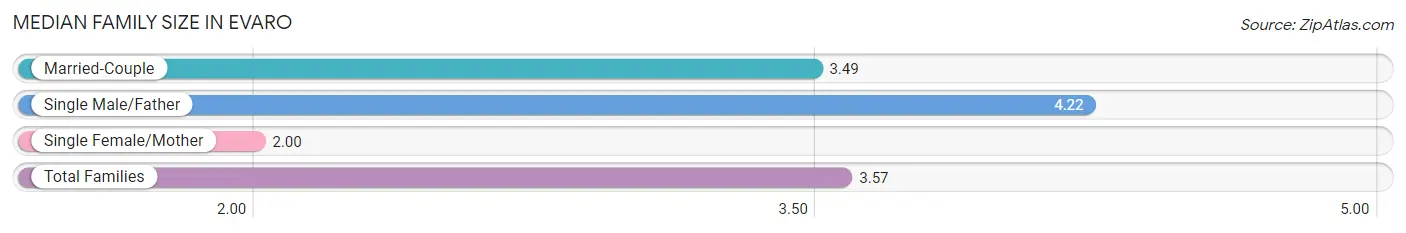
Median Family Size in Evaro
The median family size in Evaro is 3.57 persons per family, with single male/father families (23 | 19.7%) accounting for the largest median family size of 4.22 persons per family. On the other hand, single female/mother families (5 | 4.3%) represent the smallest median family size with 2.00 persons per family.
| Family Type | # Families | Family Size |
| Married-Couple | 89 (76.1%) | 3.49 |
| Single Male/Father | 23 (19.7%) | 4.22 |
| Single Female/Mother | 5 (4.3%) | 2.00 |
| Total Families | 117 (100.0%) | 3.57 |
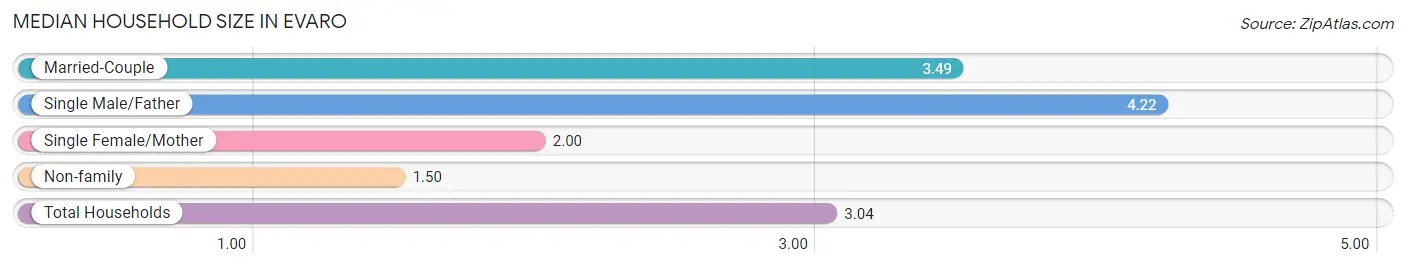
Median Household Size in Evaro
The median household size in Evaro is 3.04 persons per household, with single male/father households (23 | 14.6%) accounting for the largest median household size of 4.22 persons per household. non-family households (40 | 25.5%) represent the smallest median household size with 1.50 persons per household.
| Household Type | # Households | Household Size |
| Married-Couple | 89 (56.7%) | 3.49 |
| Single Male/Father | 23 (14.6%) | 4.22 |
| Single Female/Mother | 5 (3.2%) | 2.00 |
| Non-family | 40 (25.5%) | 1.50 |
| Total Households | 157 (100.0%) | 3.04 |
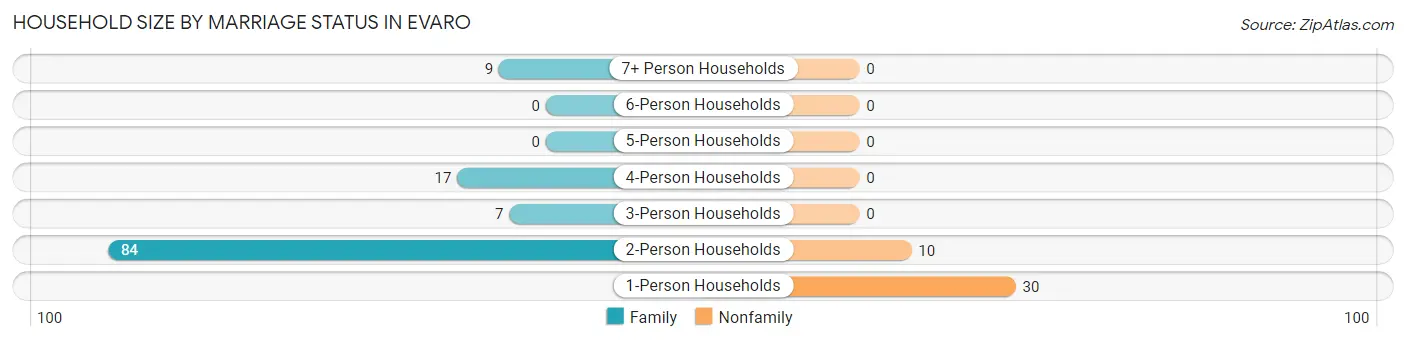
Household Size by Marriage Status in Evaro
Out of a total of 157 households in Evaro, 117 (74.5%) are family households, while 40 (25.5%) are nonfamily households. The most numerous type of family households are 2-person households, comprising 84, and the most common type of nonfamily households are 1-person households, comprising 30.
| Household Size | Family Households | Nonfamily Households |
| 1-Person Households | - | 30 (19.1%) |
| 2-Person Households | 84 (53.5%) | 10 (6.4%) |
| 3-Person Households | 7 (4.5%) | 0 (0.0%) |
| 4-Person Households | 17 (10.8%) | 0 (0.0%) |
| 5-Person Households | 0 (0.0%) | 0 (0.0%) |
| 6-Person Households | 0 (0.0%) | 0 (0.0%) |
| 7+ Person Households | 9 (5.7%) | 0 (0.0%) |
| Total | 117 (74.5%) | 40 (25.5%) |
Female Fertility in Evaro
Fertility by Age in Evaro
Average fertility rate in Evaro is 153.0 births per 1,000 women. Women in the age bracket of 35 to 50 years have the highest fertility rate with 474.0 births per 1,000 women. Women in the age bracket of 35 to 50 years acount for 100.0% of all women with births.
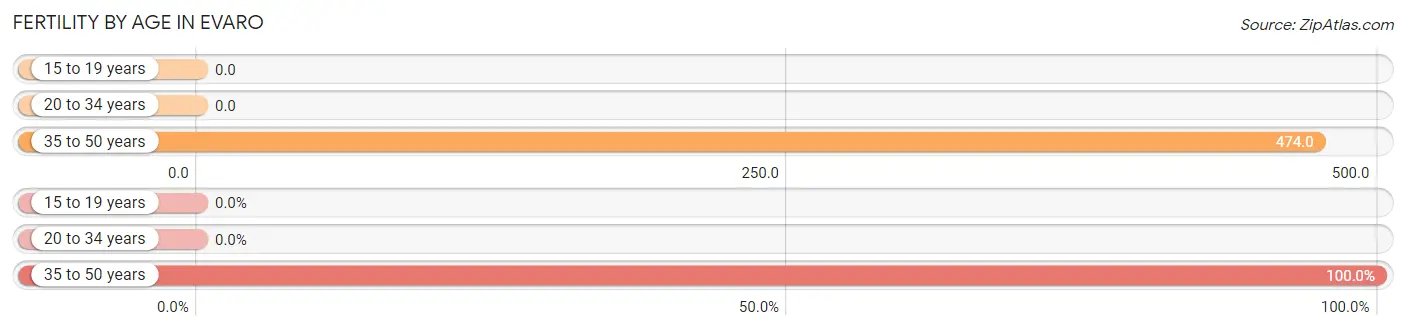
| Age Bracket | Women with Births | Births / 1,000 Women |
| 15 to 19 years | 0 (0.0%) | 0.0 |
| 20 to 34 years | 0 (0.0%) | 0.0 |
| 35 to 50 years | 9 (100.0%) | 474.0 |
| Total | 9 (100.0%) | 153.0 |
Fertility by Age by Marriage Status in Evaro
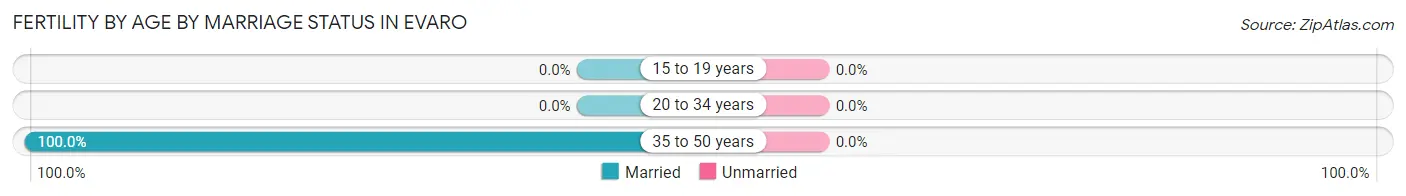
| Age Bracket | Married | Unmarried |
| 15 to 19 years | 0 (0.0%) | 0 (0.0%) |
| 20 to 34 years | 0 (0.0%) | 0 (0.0%) |
| 35 to 50 years | 9 (100.0%) | 0 (0.0%) |
| Total | 9 (100.0%) | 0 (0.0%) |
Fertility by Education in Evaro
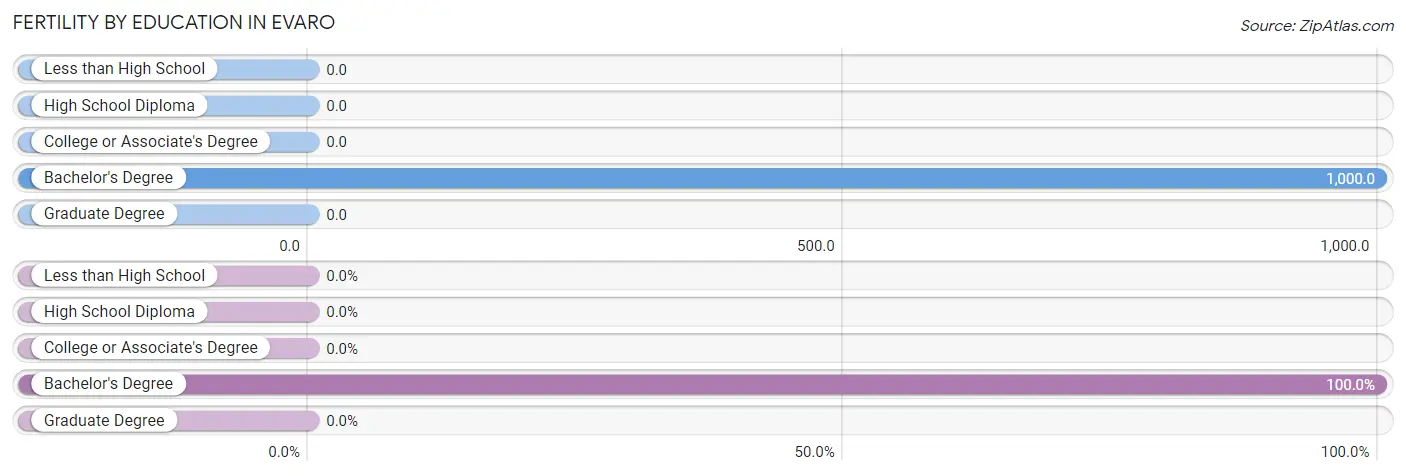
| Educational Attainment | Women with Births | Births / 1,000 Women |
| Less than High School | 0 (0.0%) | 0.0 |
| High School Diploma | 0 (0.0%) | 0.0 |
| College or Associate's Degree | 0 (0.0%) | 0.0 |
| Bachelor's Degree | 9 (100.0%) | 1,000.0 |
| Graduate Degree | 0 (0.0%) | 0.0 |
| Total | 9 (100.0%) | 153.0 |
Fertility by Education by Marriage Status in Evaro
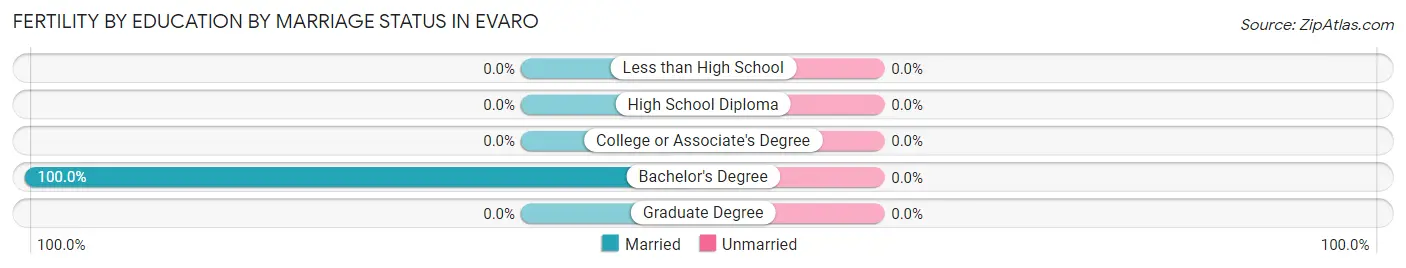
| Educational Attainment | Married | Unmarried |
| Less than High School | 0 (0.0%) | 0 (0.0%) |
| High School Diploma | 0 (0.0%) | 0 (0.0%) |
| College or Associate's Degree | 0 (0.0%) | 0 (0.0%) |
| Bachelor's Degree | 9 (100.0%) | 0 (0.0%) |
| Graduate Degree | 0 (0.0%) | 0 (0.0%) |
| Total | 9 (100.0%) | 0 (0.0%) |
Employment Characteristics in Evaro
Employment by Class of Employer in Evaro
Among the 125 employed individuals in Evaro, private company employees (63 | 50.4%), local government employees (34 | 27.2%), and not-for-profit organizations (15 | 12.0%) make up the most common classes of employment.
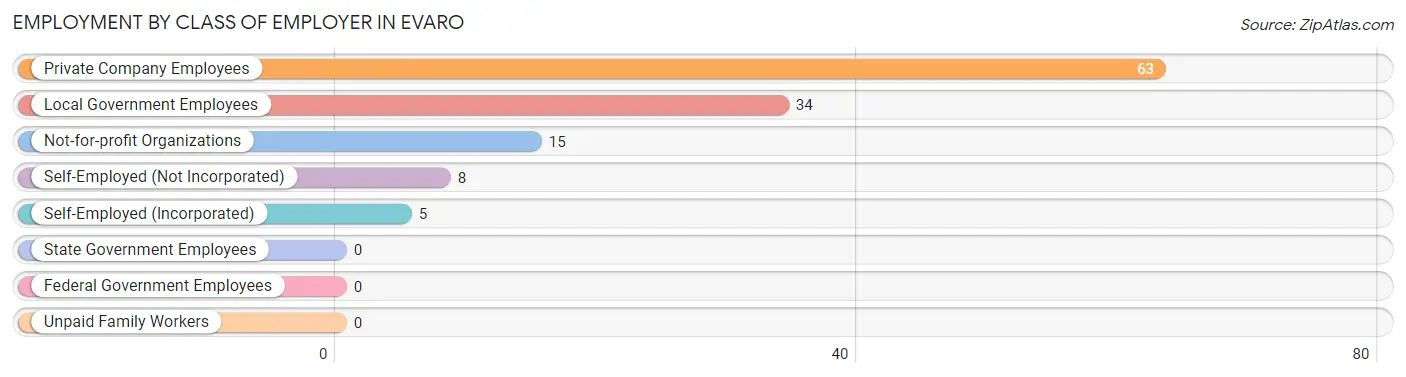
| Employer Class | # Employees | % Employees |
| Private Company Employees | 63 | 50.4% |
| Self-Employed (Incorporated) | 5 | 4.0% |
| Self-Employed (Not Incorporated) | 8 | 6.4% |
| Not-for-profit Organizations | 15 | 12.0% |
| Local Government Employees | 34 | 27.2% |
| State Government Employees | 0 | 0.0% |
| Federal Government Employees | 0 | 0.0% |
| Unpaid Family Workers | 0 | 0.0% |
| Total | 125 | 100.0% |
Employment Status by Age in Evaro
According to the labor force statistics for Evaro, out of the total population over 16 years of age (326), 45.7% or 149 individuals are in the labor force, with 7.4% or 11 of them unemployed. The age group with the highest labor force participation rate is 16 to 19 years, with 100.0% or 11 individuals in the labor force. Within the labor force, the 60 to 64 years age range has the highest percentage of unemployed individuals, with 43.8% or 7 of them being unemployed.
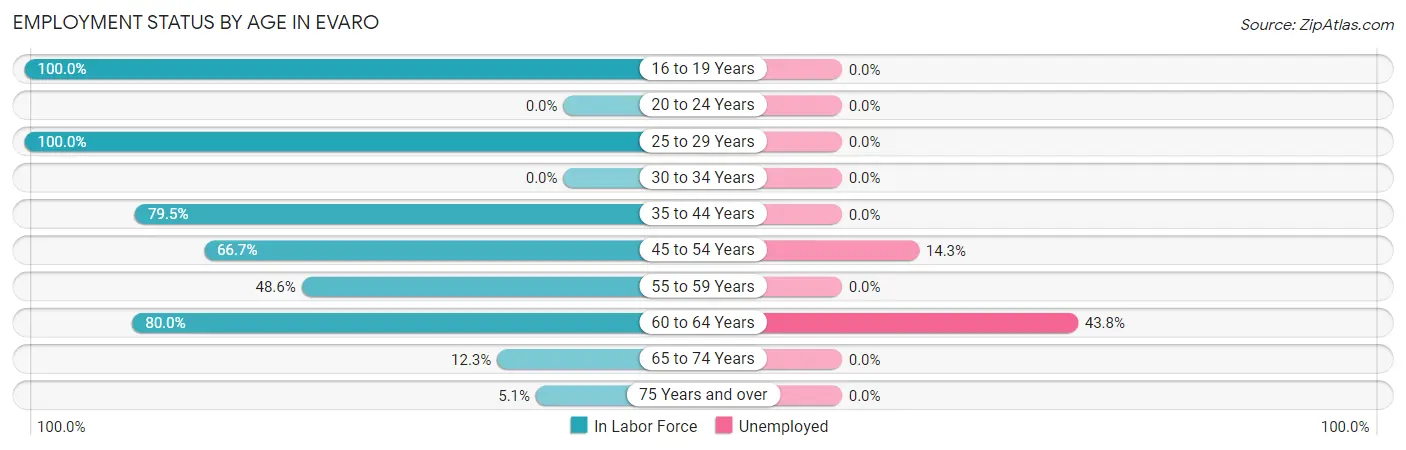
| Age Bracket | In Labor Force | Unemployed |
| 16 to 19 Years | 11 (100.0%) | 0 (0.0%) |
| 20 to 24 Years | 0 (0.0%) | 0 (0.0%) |
| 25 to 29 Years | 30 (100.0%) | 0 (0.0%) |
| 30 to 34 Years | 0 (0.0%) | 0 (0.0%) |
| 35 to 44 Years | 35 (79.5%) | 0 (0.0%) |
| 45 to 54 Years | 28 (66.7%) | 4 (14.3%) |
| 55 to 59 Years | 17 (48.6%) | 0 (0.0%) |
| 60 to 64 Years | 16 (80.0%) | 7 (43.8%) |
| 65 to 74 Years | 8 (12.3%) | 0 (0.0%) |
| 75 Years and over | 4 (5.1%) | 0 (0.0%) |
| Total | 149 (45.7%) | 11 (7.4%) |
Employment Status by Educational Attainment in Evaro
According to labor force statistics for Evaro, 73.7% of individuals (126) out of the total population between 25 and 64 years of age (171) are in the labor force, with 8.7% or 11 of them being unemployed. The group with the highest labor force participation rate are those with the educational attainment of college / associate degree, with 81.6% or 62 individuals in the labor force. Within the labor force, individuals with high school diploma education have the highest percentage of unemployment, with 15.2% or 7 of them being unemployed.
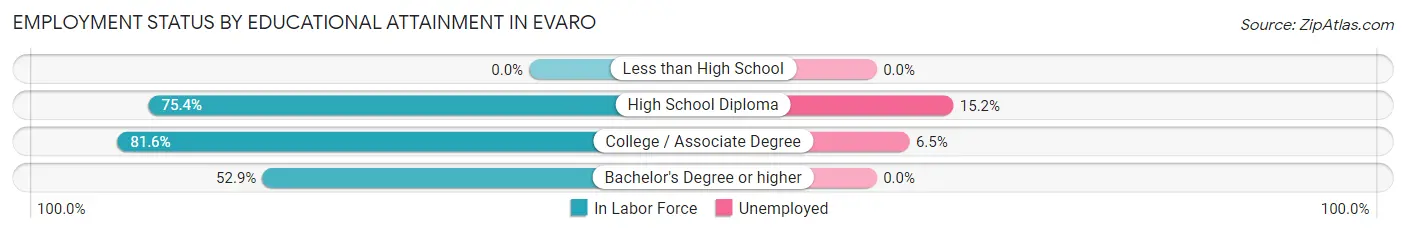
| Educational Attainment | In Labor Force | Unemployed |
| Less than High School | 0 (0.0%) | 0 (0.0%) |
| High School Diploma | 46 (75.4%) | 9 (15.2%) |
| College / Associate Degree | 62 (81.6%) | 5 (6.5%) |
| Bachelor's Degree or higher | 18 (52.9%) | 0 (0.0%) |
| Total | 126 (73.7%) | 15 (8.7%) |
Employment Occupations by Sex in Evaro
Management, Business, Science and Arts Occupations
The most common Management, Business, Science and Arts occupations in Evaro are Management (28 | 20.3%), Community & Social Service (19 | 13.8%), Education Instruction & Library (19 | 13.8%), Health Diagnosing & Treating (10 | 7.2%), and Health Technologists (10 | 7.2%).
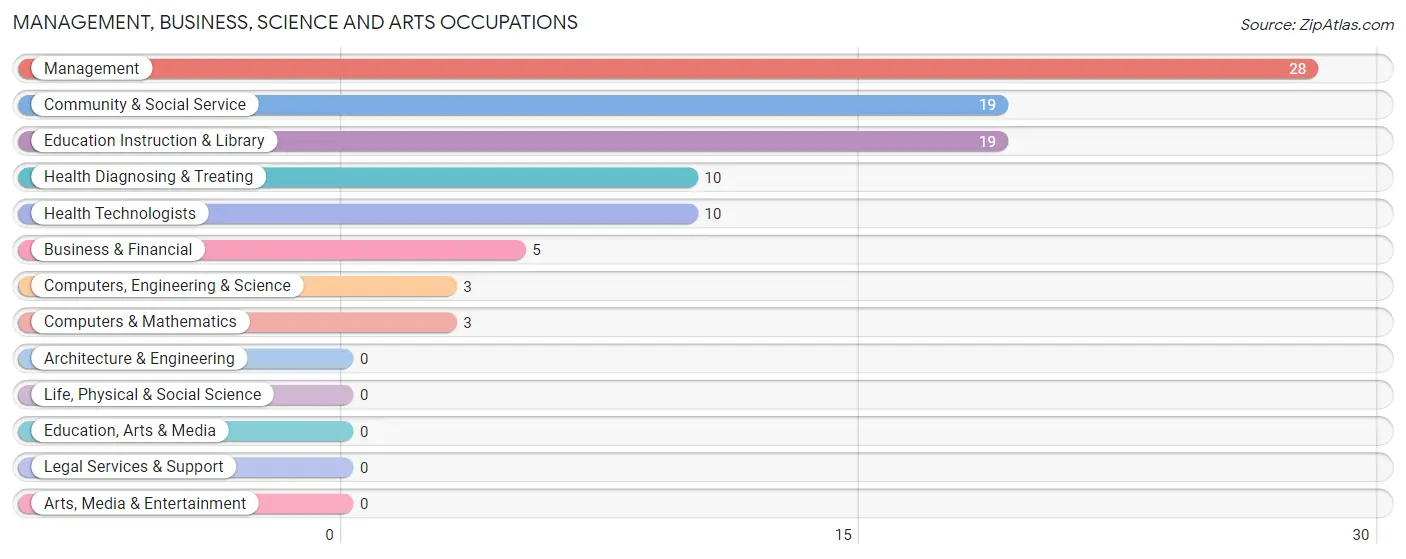
Management, Business, Science and Arts Occupations by Sex
Within the Management, Business, Science and Arts occupations in Evaro, the most male-oriented occupations are Management (100.0%), Computers, Engineering & Science (100.0%), and Computers & Mathematics (100.0%), while the most female-oriented occupations are Business & Financial (100.0%), Community & Social Service (100.0%), and Education Instruction & Library (100.0%).
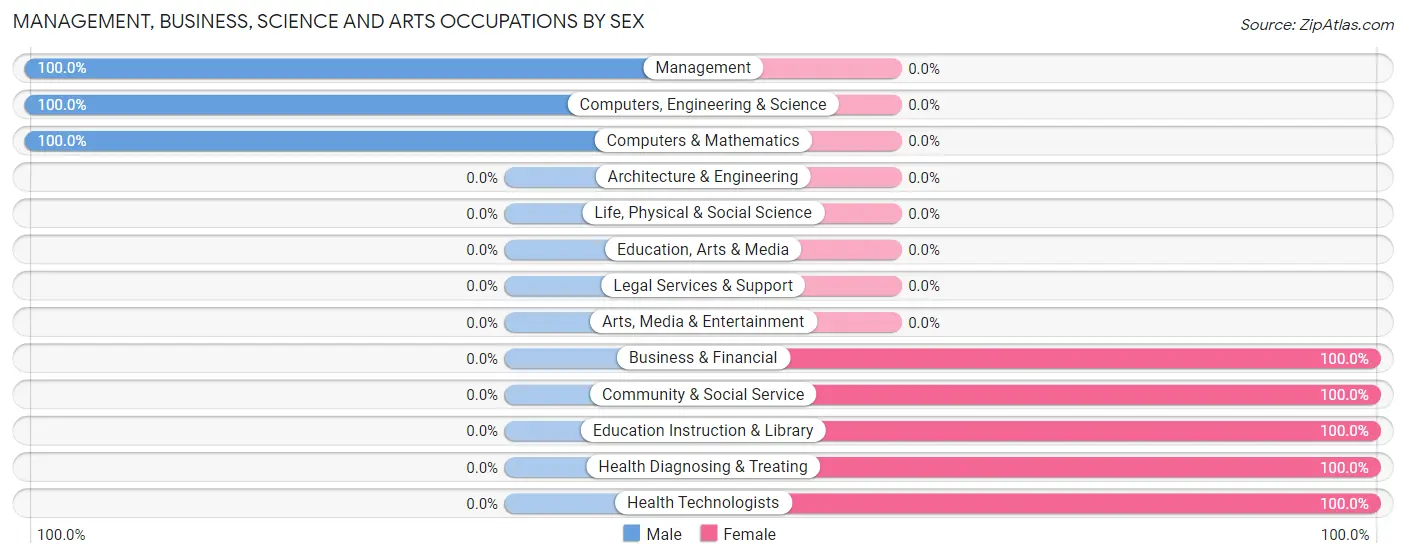
| Occupation | Male | Female |
| Management | 28 (100.0%) | 0 (0.0%) |
| Business & Financial | 0 (0.0%) | 5 (100.0%) |
| Computers, Engineering & Science | 3 (100.0%) | 0 (0.0%) |
| Computers & Mathematics | 3 (100.0%) | 0 (0.0%) |
| Architecture & Engineering | 0 (0.0%) | 0 (0.0%) |
| Life, Physical & Social Science | 0 (0.0%) | 0 (0.0%) |
| Community & Social Service | 0 (0.0%) | 19 (100.0%) |
| Education, Arts & Media | 0 (0.0%) | 0 (0.0%) |
| Legal Services & Support | 0 (0.0%) | 0 (0.0%) |
| Education Instruction & Library | 0 (0.0%) | 19 (100.0%) |
| Arts, Media & Entertainment | 0 (0.0%) | 0 (0.0%) |
| Health Diagnosing & Treating | 0 (0.0%) | 10 (100.0%) |
| Health Technologists | 0 (0.0%) | 10 (100.0%) |
| Total (Category) | 31 (47.7%) | 34 (52.3%) |
| Total (Overall) | 82 (59.4%) | 56 (40.6%) |
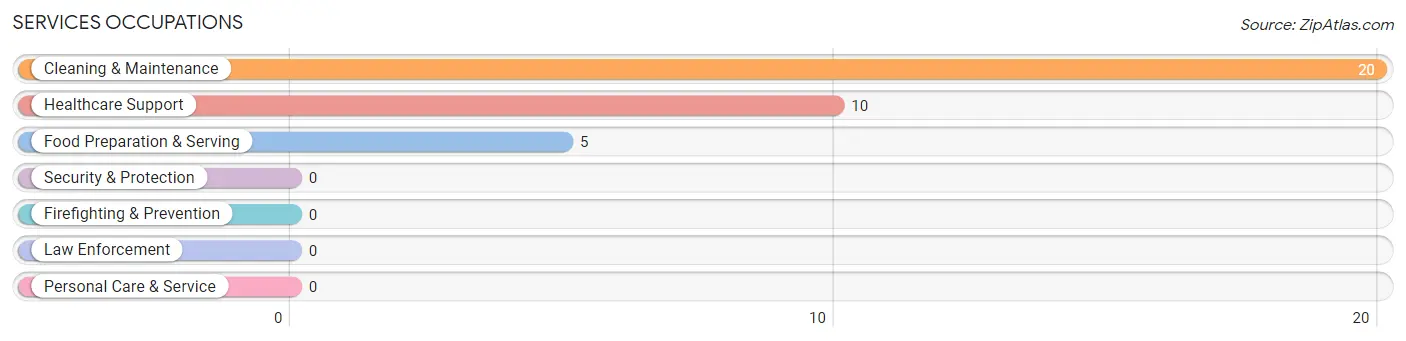
Services Occupations
The most common Services occupations in Evaro are Cleaning & Maintenance (20 | 14.5%), Healthcare Support (10 | 7.2%), and Food Preparation & Serving (5 | 3.6%).
Services Occupations by Sex
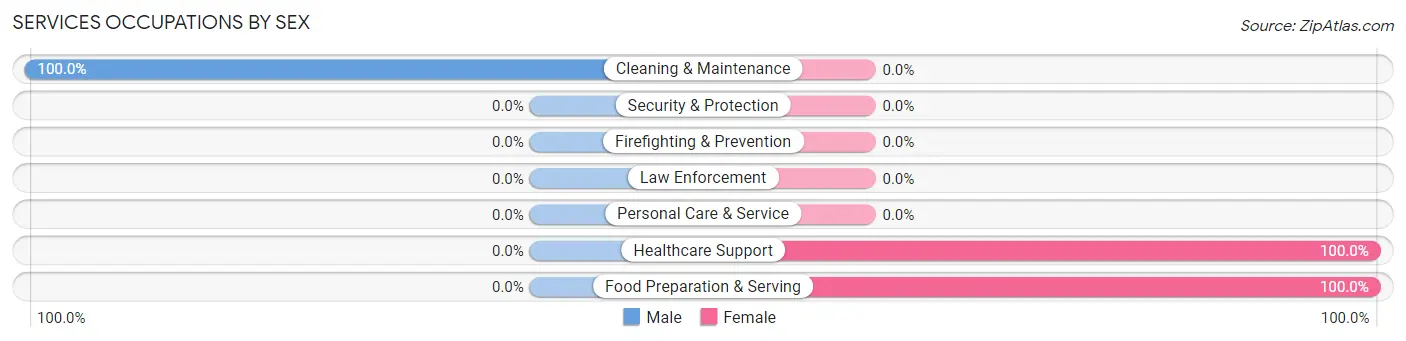
| Occupation | Male | Female |
| Healthcare Support | 0 (0.0%) | 10 (100.0%) |
| Security & Protection | 0 (0.0%) | 0 (0.0%) |
| Firefighting & Prevention | 0 (0.0%) | 0 (0.0%) |
| Law Enforcement | 0 (0.0%) | 0 (0.0%) |
| Food Preparation & Serving | 0 (0.0%) | 5 (100.0%) |
| Cleaning & Maintenance | 20 (100.0%) | 0 (0.0%) |
| Personal Care & Service | 0 (0.0%) | 0 (0.0%) |
| Total (Category) | 20 (57.1%) | 15 (42.9%) |
| Total (Overall) | 82 (59.4%) | 56 (40.6%) |
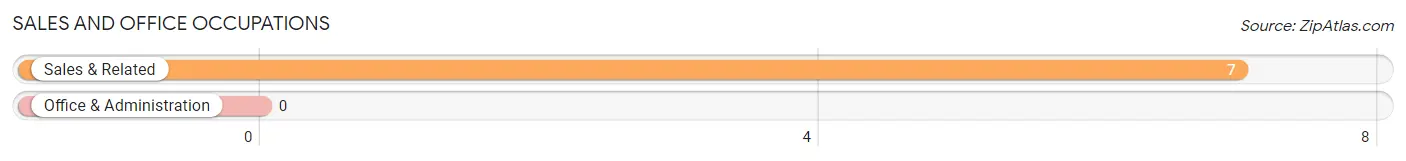
Sales and Office Occupations
The most common Sales and Office occupations in Evaro are , and Sales & Related (7 | 5.1%).
Sales and Office Occupations by Sex
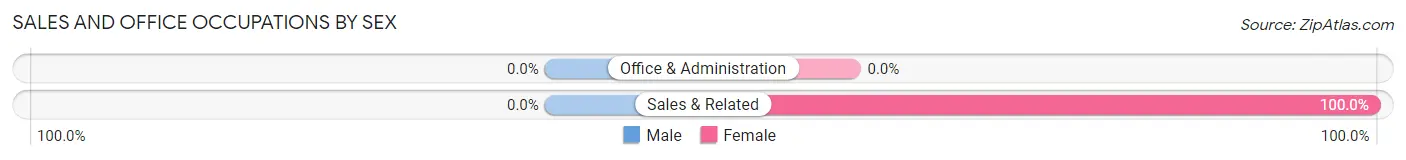
| Occupation | Male | Female |
| Sales & Related | 0 (0.0%) | 7 (100.0%) |
| Office & Administration | 0 (0.0%) | 0 (0.0%) |
| Total (Category) | 0 (0.0%) | 7 (100.0%) |
| Total (Overall) | 82 (59.4%) | 56 (40.6%) |
Natural Resources, Construction and Maintenance Occupations
The most common Natural Resources, Construction and Maintenance occupations in Evaro are Installation, Maintenance & Repair (18 | 13.0%), and Construction & Extraction (13 | 9.4%).
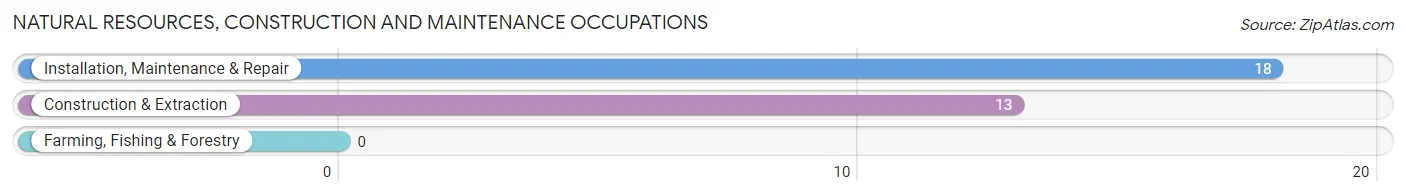
Natural Resources, Construction and Maintenance Occupations by Sex
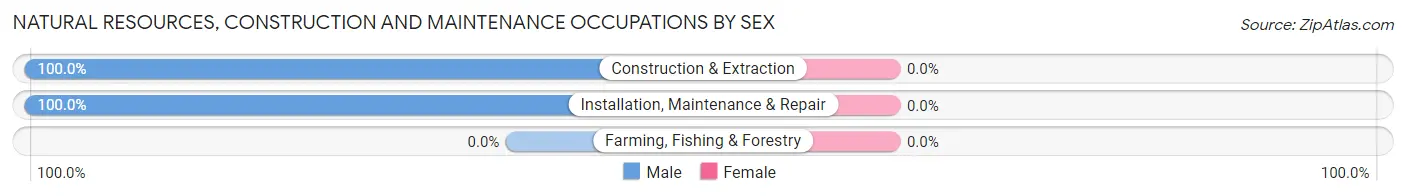
| Occupation | Male | Female |
| Farming, Fishing & Forestry | 0 (0.0%) | 0 (0.0%) |
| Construction & Extraction | 13 (100.0%) | 0 (0.0%) |
| Installation, Maintenance & Repair | 18 (100.0%) | 0 (0.0%) |
| Total (Category) | 31 (100.0%) | 0 (0.0%) |
| Total (Overall) | 82 (59.4%) | 56 (40.6%) |
Production, Transportation and Moving Occupations
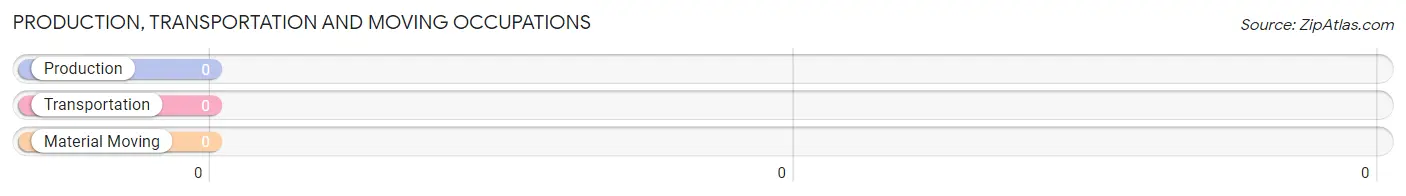
Production, Transportation and Moving Occupations by Sex
| Occupation | Male | Female |
| Production | 0 (0.0%) | 0 (0.0%) |
| Transportation | 0 (0.0%) | 0 (0.0%) |
| Material Moving | 0 (0.0%) | 0 (0.0%) |
| Total (Category) | 0 (0.0%) | 0 (0.0%) |
| Total (Overall) | 82 (59.4%) | 56 (40.6%) |
Employment Industries by Sex in Evaro
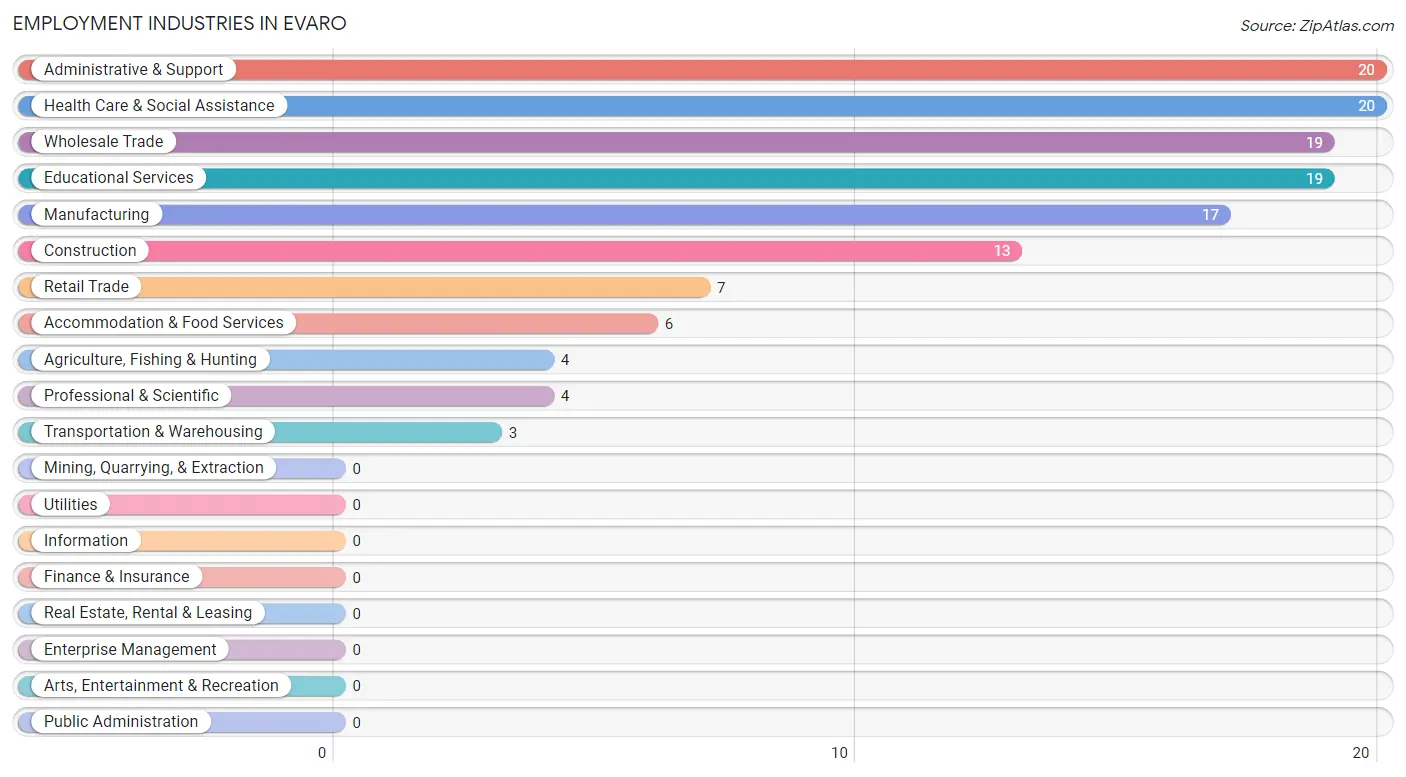
Employment Industries in Evaro
The major employment industries in Evaro include Administrative & Support (20 | 14.5%), Health Care & Social Assistance (20 | 14.5%), Wholesale Trade (19 | 13.8%), Educational Services (19 | 13.8%), and Manufacturing (17 | 12.3%).
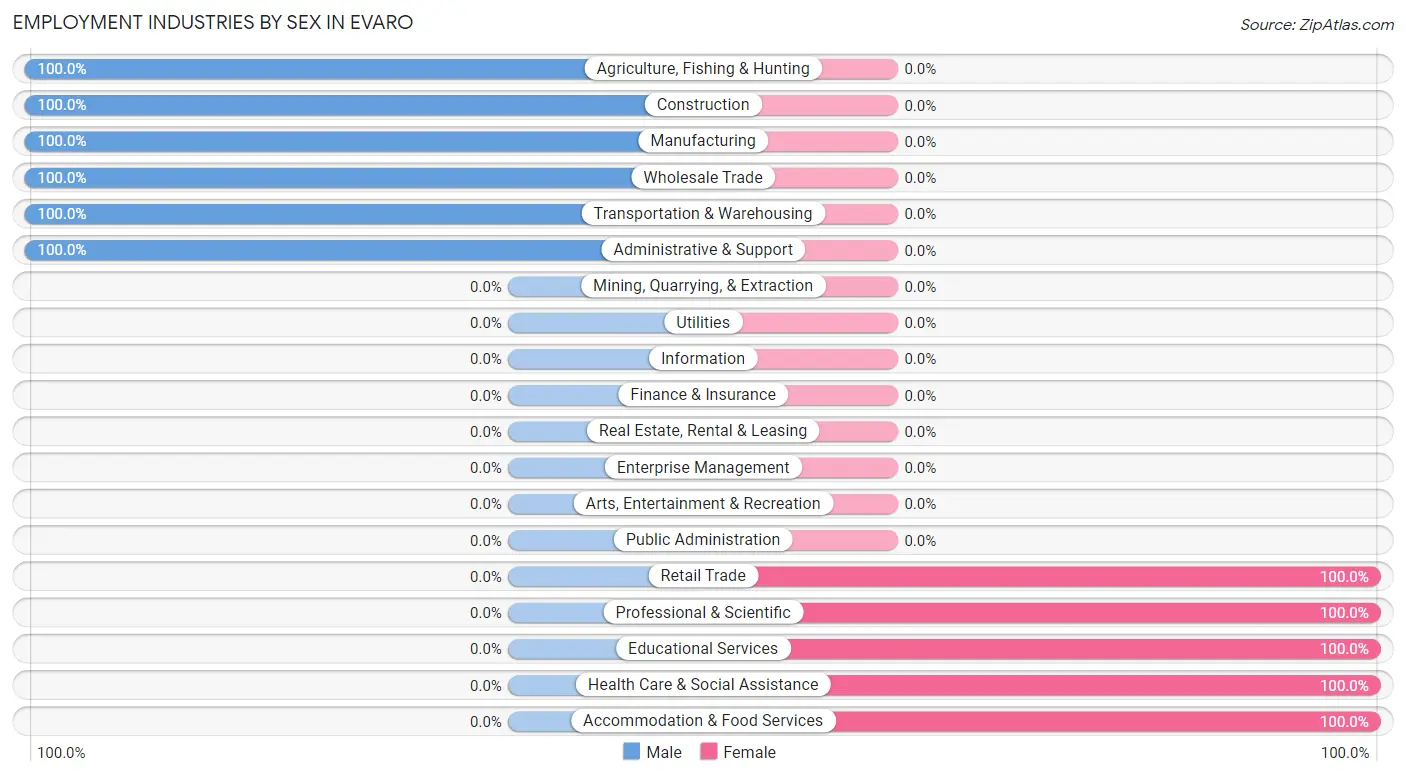
Employment Industries by Sex in Evaro
The Evaro industries that see more men than women are Agriculture, Fishing & Hunting (100.0%), Construction (100.0%), and Manufacturing (100.0%), whereas the industries that tend to have a higher number of women are Retail Trade (100.0%), Professional & Scientific (100.0%), and Educational Services (100.0%).
| Industry | Male | Female |
| Agriculture, Fishing & Hunting | 4 (100.0%) | 0 (0.0%) |
| Mining, Quarrying, & Extraction | 0 (0.0%) | 0 (0.0%) |
| Construction | 13 (100.0%) | 0 (0.0%) |
| Manufacturing | 17 (100.0%) | 0 (0.0%) |
| Wholesale Trade | 19 (100.0%) | 0 (0.0%) |
| Retail Trade | 0 (0.0%) | 7 (100.0%) |
| Transportation & Warehousing | 3 (100.0%) | 0 (0.0%) |
| Utilities | 0 (0.0%) | 0 (0.0%) |
| Information | 0 (0.0%) | 0 (0.0%) |
| Finance & Insurance | 0 (0.0%) | 0 (0.0%) |
| Real Estate, Rental & Leasing | 0 (0.0%) | 0 (0.0%) |
| Professional & Scientific | 0 (0.0%) | 4 (100.0%) |
| Enterprise Management | 0 (0.0%) | 0 (0.0%) |
| Administrative & Support | 20 (100.0%) | 0 (0.0%) |
| Educational Services | 0 (0.0%) | 19 (100.0%) |
| Health Care & Social Assistance | 0 (0.0%) | 20 (100.0%) |
| Arts, Entertainment & Recreation | 0 (0.0%) | 0 (0.0%) |
| Accommodation & Food Services | 0 (0.0%) | 6 (100.0%) |
| Public Administration | 0 (0.0%) | 0 (0.0%) |
| Total | 82 (59.4%) | 56 (40.6%) |
Education in Evaro
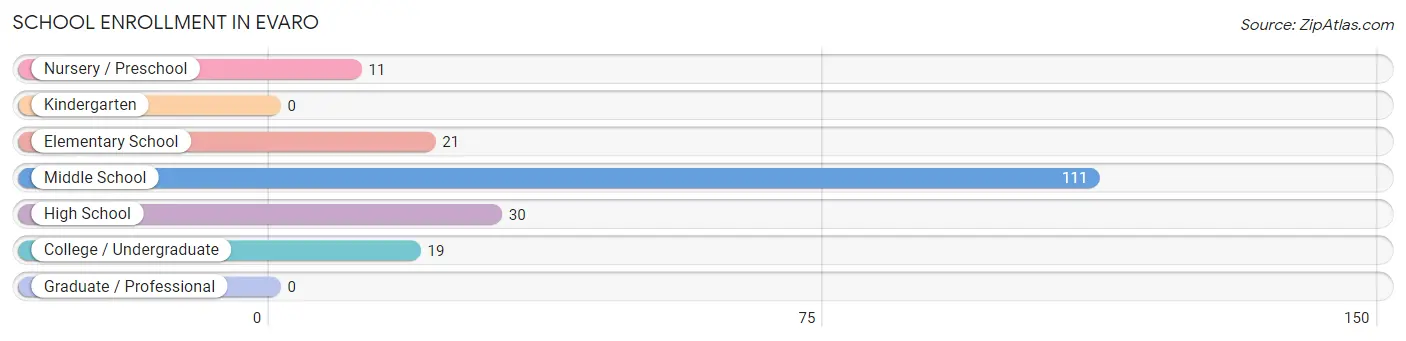
School Enrollment in Evaro
The most common levels of schooling among the 192 students in Evaro are middle school (111 | 57.8%), high school (30 | 15.6%), and elementary school (21 | 10.9%).
| School Level | # Students | % Students |
| Nursery / Preschool | 11 | 5.7% |
| Kindergarten | 0 | 0.0% |
| Elementary School | 21 | 10.9% |
| Middle School | 111 | 57.8% |
| High School | 30 | 15.6% |
| College / Undergraduate | 19 | 9.9% |
| Graduate / Professional | 0 | 0.0% |
| Total | 192 | 100.0% |
School Enrollment by Age by Funding Source in Evaro
Out of a total of 192 students who are enrolled in schools in Evaro, 19 (9.9%) attend a private institution, while the remaining 173 (90.1%) are enrolled in public schools. The age group of 25 to 34 year olds has the highest likelihood of being enrolled in private schools, with 10 (100.0% in the age bracket) enrolled. Conversely, the age group of 5 to 9 year old has the lowest likelihood of being enrolled in a private school, with 21 (100.0% in the age bracket) attending a public institution.
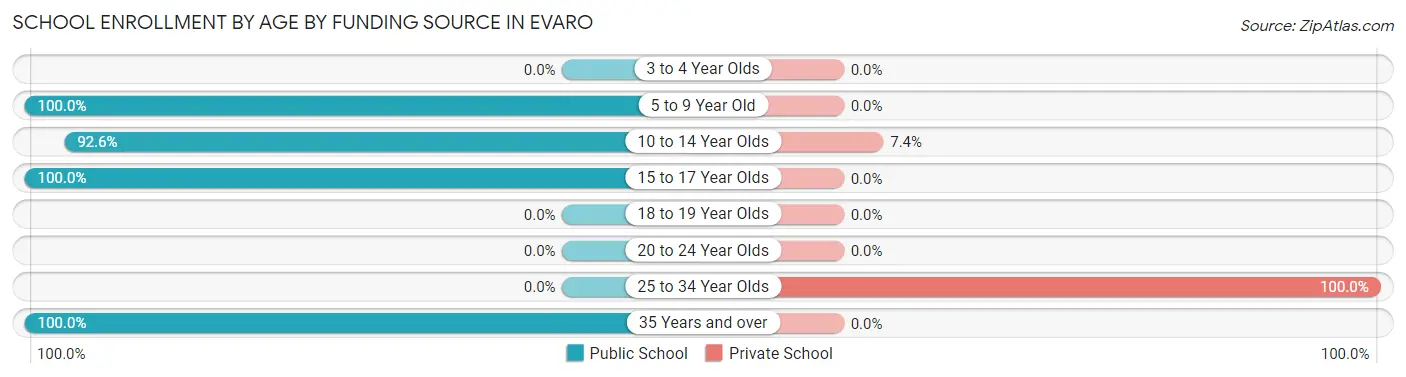
| Age Bracket | Public School | Private School |
| 3 to 4 Year Olds | 0 (0.0%) | 0 (0.0%) |
| 5 to 9 Year Old | 21 (100.0%) | 0 (0.0%) |
| 10 to 14 Year Olds | 113 (92.6%) | 9 (7.4%) |
| 15 to 17 Year Olds | 30 (100.0%) | 0 (0.0%) |
| 18 to 19 Year Olds | 0 (0.0%) | 0 (0.0%) |
| 20 to 24 Year Olds | 0 (0.0%) | 0 (0.0%) |
| 25 to 34 Year Olds | 0 (0.0%) | 10 (100.0%) |
| 35 Years and over | 9 (100.0%) | 0 (0.0%) |
| Total | 173 (90.1%) | 19 (9.9%) |
Educational Attainment by Field of Study in Evaro
Liberal arts & history (18 | 23.4%), social sciences (13 | 16.9%), science & technology (10 | 13.0%), communications (9 | 11.7%), and engineering (8 | 10.4%) are the most common fields of study among 77 individuals in Evaro who have obtained a bachelor's degree or higher.
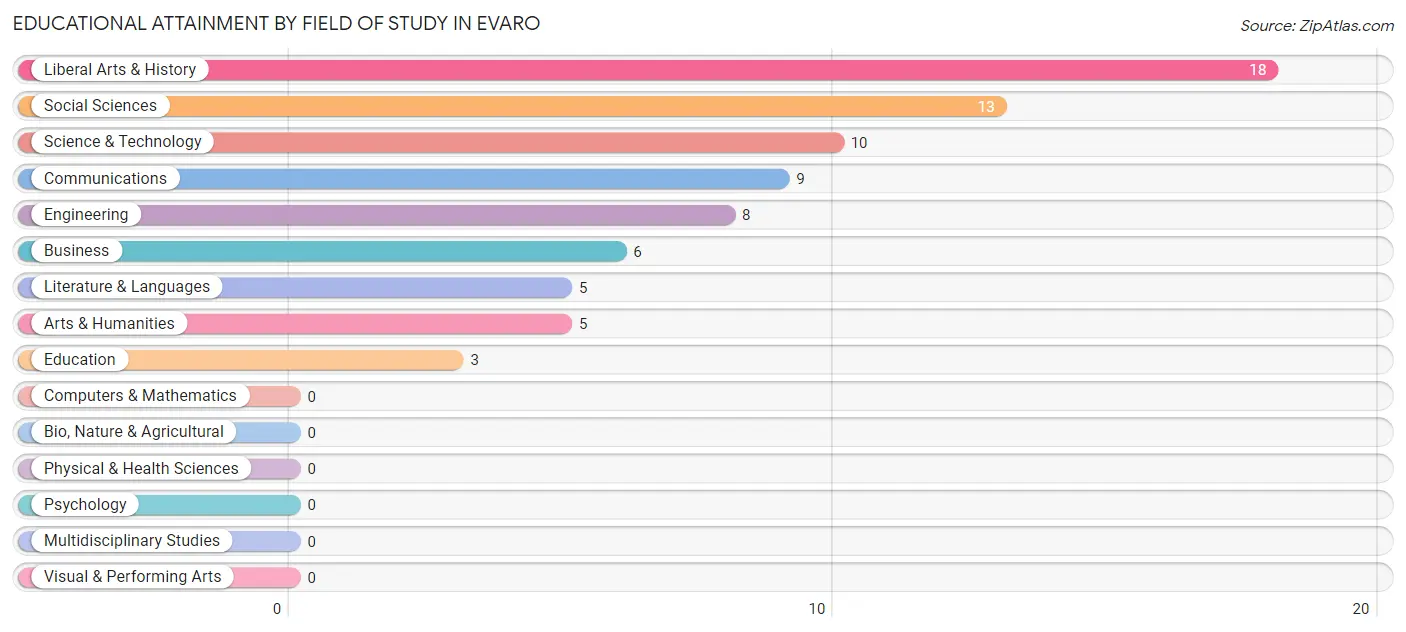
| Field of Study | # Graduates | % Graduates |
| Computers & Mathematics | 0 | 0.0% |
| Bio, Nature & Agricultural | 0 | 0.0% |
| Physical & Health Sciences | 0 | 0.0% |
| Psychology | 0 | 0.0% |
| Social Sciences | 13 | 16.9% |
| Engineering | 8 | 10.4% |
| Multidisciplinary Studies | 0 | 0.0% |
| Science & Technology | 10 | 13.0% |
| Business | 6 | 7.8% |
| Education | 3 | 3.9% |
| Literature & Languages | 5 | 6.5% |
| Liberal Arts & History | 18 | 23.4% |
| Visual & Performing Arts | 0 | 0.0% |
| Communications | 9 | 11.7% |
| Arts & Humanities | 5 | 6.5% |
| Total | 77 | 100.0% |
Transportation & Commute in Evaro
Vehicle Availability by Sex in Evaro
The most prevalent vehicle ownership categories in Evaro are males with 3 vehicles (32, accounting for 46.4%) and females with 3 vehicles (20, making up 57.1%).
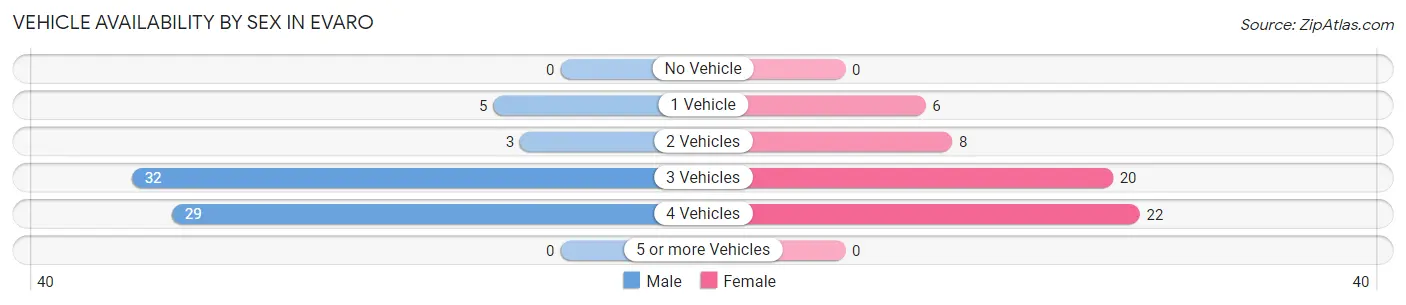
| Vehicles Available | Male | Female |
| No Vehicle | 0 (0.0%) | 0 (0.0%) |
| 1 Vehicle | 5 (7.2%) | 6 (10.7%) |
| 2 Vehicles | 3 (4.3%) | 8 (14.3%) |
| 3 Vehicles | 32 (46.4%) | 20 (35.7%) |
| 4 Vehicles | 29 (42.0%) | 22 (39.3%) |
| 5 or more Vehicles | 0 (0.0%) | 0 (0.0%) |
| Total | 69 (100.0%) | 56 (100.0%) |
Commute Time in Evaro
The most frequently occuring commute durations in Evaro are 45 to 59 minutes (33 commuters, 27.3%), 30 to 34 minutes (19 commuters, 15.7%), and 20 to 24 minutes (15 commuters, 12.4%).
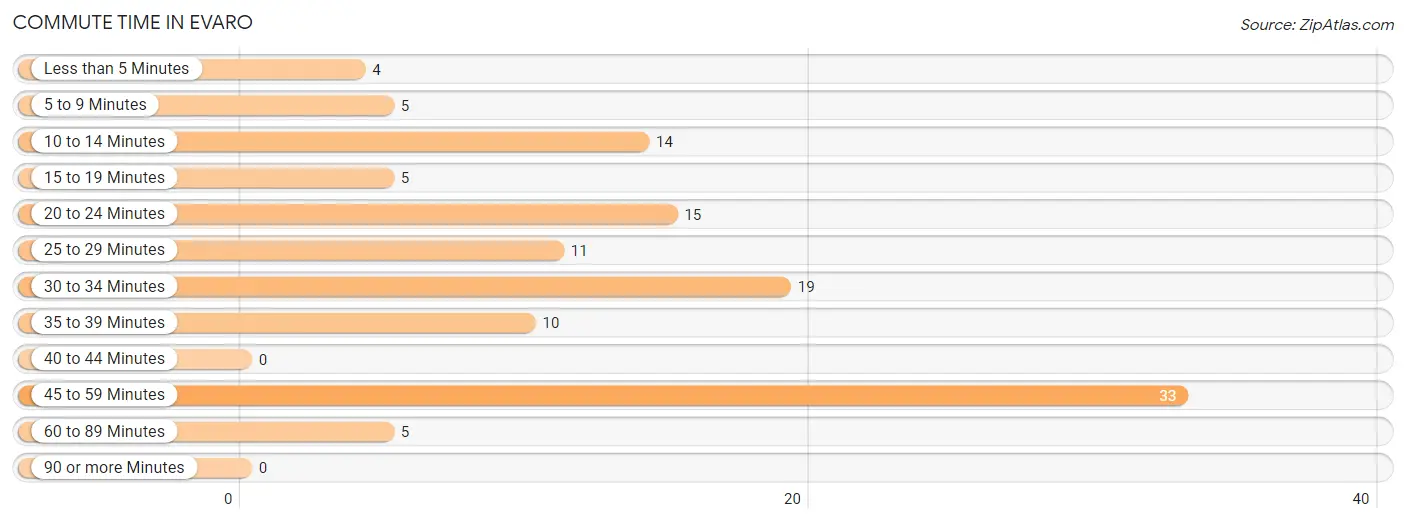
| Commute Time | # Commuters | % Commuters |
| Less than 5 Minutes | 4 | 3.3% |
| 5 to 9 Minutes | 5 | 4.1% |
| 10 to 14 Minutes | 14 | 11.6% |
| 15 to 19 Minutes | 5 | 4.1% |
| 20 to 24 Minutes | 15 | 12.4% |
| 25 to 29 Minutes | 11 | 9.1% |
| 30 to 34 Minutes | 19 | 15.7% |
| 35 to 39 Minutes | 10 | 8.3% |
| 40 to 44 Minutes | 0 | 0.0% |
| 45 to 59 Minutes | 33 | 27.3% |
| 60 to 89 Minutes | 5 | 4.1% |
| 90 or more Minutes | 0 | 0.0% |
Commute Time by Sex in Evaro
The most common commute times in Evaro are 45 to 59 minutes (26 commuters, 37.7%) for males and 10 to 14 minutes (14 commuters, 26.9%) for females.
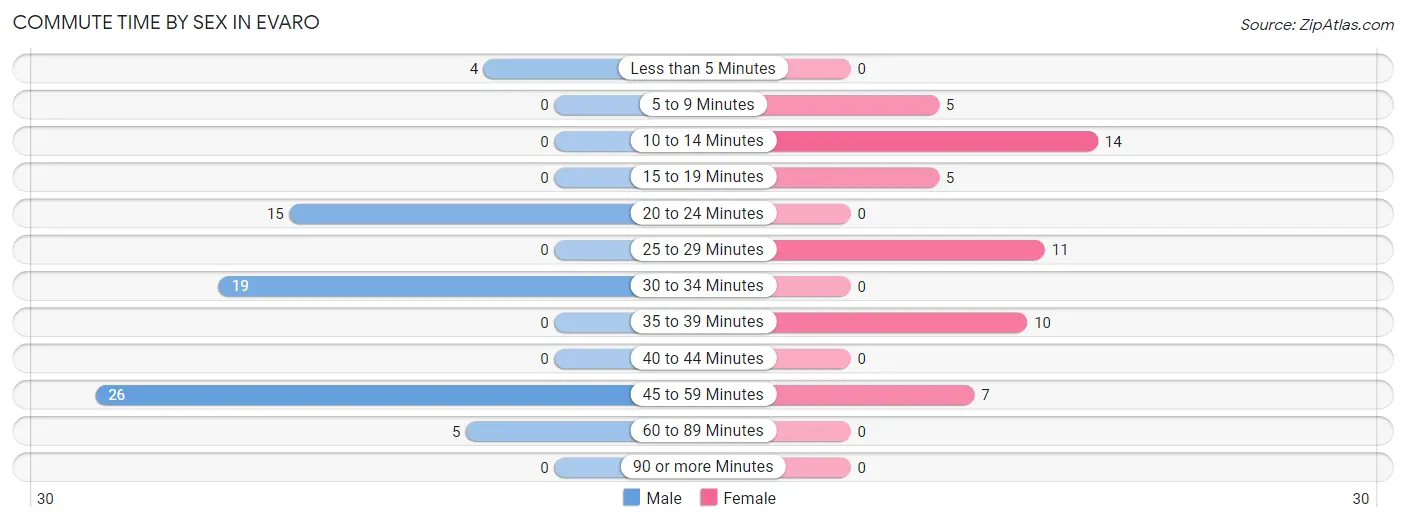
| Commute Time | Male | Female |
| Less than 5 Minutes | 4 (5.8%) | 0 (0.0%) |
| 5 to 9 Minutes | 0 (0.0%) | 5 (9.6%) |
| 10 to 14 Minutes | 0 (0.0%) | 14 (26.9%) |
| 15 to 19 Minutes | 0 (0.0%) | 5 (9.6%) |
| 20 to 24 Minutes | 15 (21.7%) | 0 (0.0%) |
| 25 to 29 Minutes | 0 (0.0%) | 11 (21.1%) |
| 30 to 34 Minutes | 19 (27.5%) | 0 (0.0%) |
| 35 to 39 Minutes | 0 (0.0%) | 10 (19.2%) |
| 40 to 44 Minutes | 0 (0.0%) | 0 (0.0%) |
| 45 to 59 Minutes | 26 (37.7%) | 7 (13.5%) |
| 60 to 89 Minutes | 5 (7.2%) | 0 (0.0%) |
| 90 or more Minutes | 0 (0.0%) | 0 (0.0%) |
Time of Departure to Work by Sex in Evaro
The most frequent times of departure to work in Evaro are 7:00 AM to 7:29 AM (28, 40.6%) for males and 6:30 AM to 6:59 AM (15, 28.8%) for females.
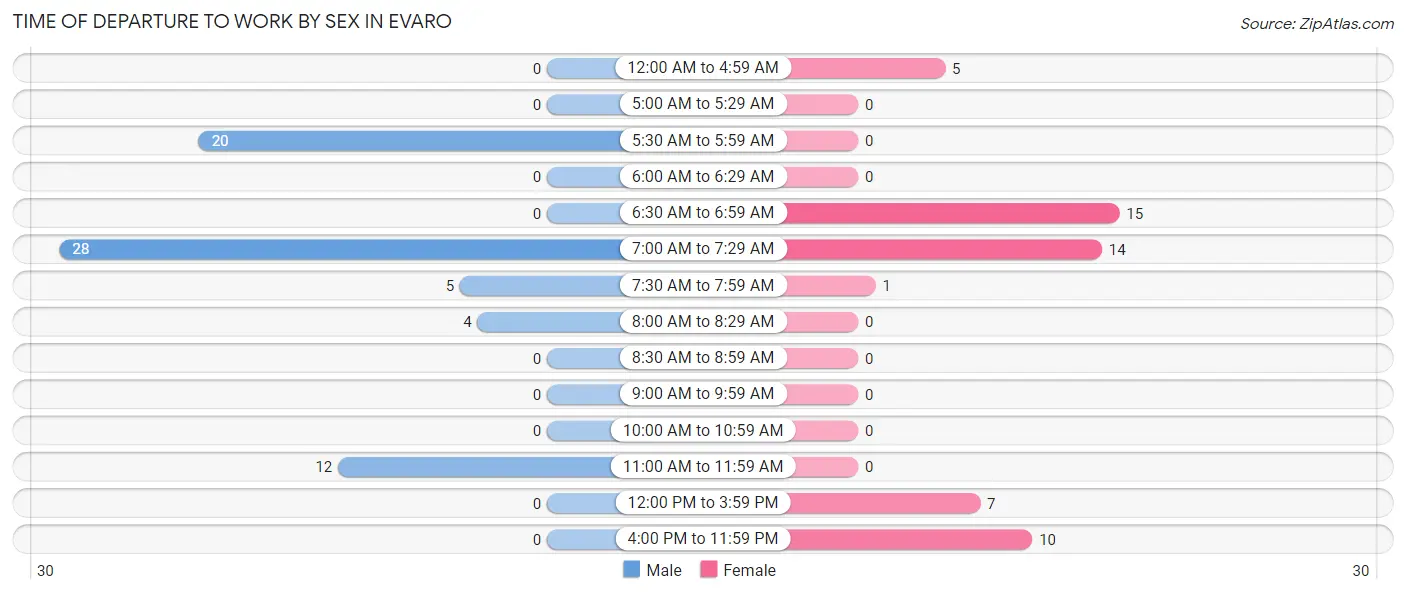
| Time of Departure | Male | Female |
| 12:00 AM to 4:59 AM | 0 (0.0%) | 5 (9.6%) |
| 5:00 AM to 5:29 AM | 0 (0.0%) | 0 (0.0%) |
| 5:30 AM to 5:59 AM | 20 (29.0%) | 0 (0.0%) |
| 6:00 AM to 6:29 AM | 0 (0.0%) | 0 (0.0%) |
| 6:30 AM to 6:59 AM | 0 (0.0%) | 15 (28.8%) |
| 7:00 AM to 7:29 AM | 28 (40.6%) | 14 (26.9%) |
| 7:30 AM to 7:59 AM | 5 (7.2%) | 1 (1.9%) |
| 8:00 AM to 8:29 AM | 4 (5.8%) | 0 (0.0%) |
| 8:30 AM to 8:59 AM | 0 (0.0%) | 0 (0.0%) |
| 9:00 AM to 9:59 AM | 0 (0.0%) | 0 (0.0%) |
| 10:00 AM to 10:59 AM | 0 (0.0%) | 0 (0.0%) |
| 11:00 AM to 11:59 AM | 12 (17.4%) | 0 (0.0%) |
| 12:00 PM to 3:59 PM | 0 (0.0%) | 7 (13.5%) |
| 4:00 PM to 11:59 PM | 0 (0.0%) | 10 (19.2%) |
| Total | 69 (100.0%) | 52 (100.0%) |
Housing Occupancy in Evaro
Occupancy by Ownership in Evaro
Of the total 157 dwellings in Evaro, owner-occupied units account for 112 (71.3%), while renter-occupied units make up 45 (28.7%).
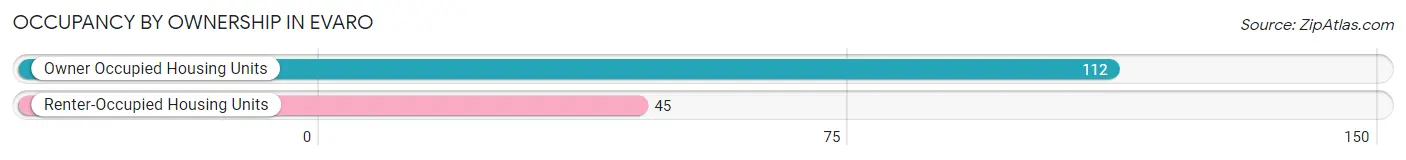
| Occupancy | # Housing Units | % Housing Units |
| Owner Occupied Housing Units | 112 | 71.3% |
| Renter-Occupied Housing Units | 45 | 28.7% |
| Total Occupied Housing Units | 157 | 100.0% |
Occupancy by Household Size in Evaro
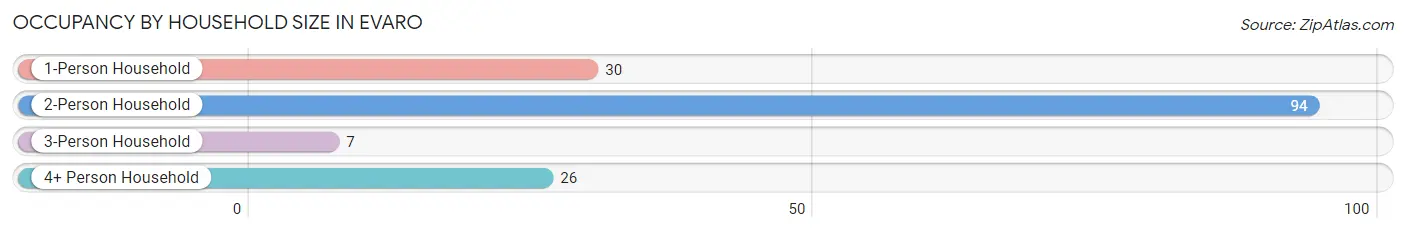
| Household Size | # Housing Units | % Housing Units |
| 1-Person Household | 30 | 19.1% |
| 2-Person Household | 94 | 59.9% |
| 3-Person Household | 7 | 4.5% |
| 4+ Person Household | 26 | 16.6% |
| Total Housing Units | 157 | 100.0% |
Occupancy by Ownership by Household Size in Evaro
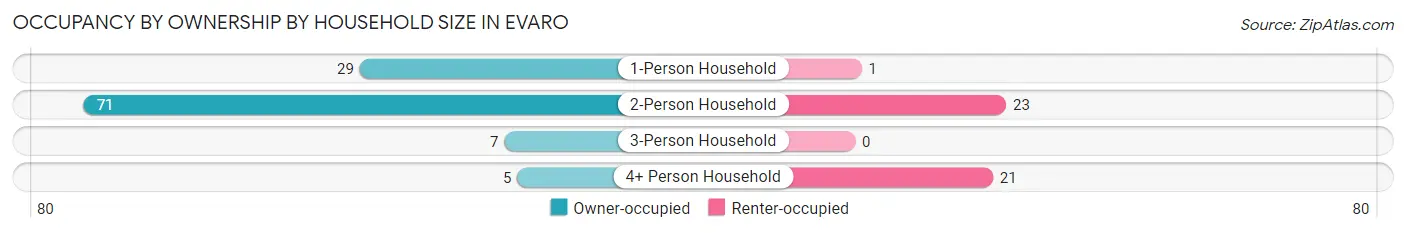
| Household Size | Owner-occupied | Renter-occupied |
| 1-Person Household | 29 (96.7%) | 1 (3.3%) |
| 2-Person Household | 71 (75.5%) | 23 (24.5%) |
| 3-Person Household | 7 (100.0%) | 0 (0.0%) |
| 4+ Person Household | 5 (19.2%) | 21 (80.8%) |
| Total Housing Units | 112 (71.3%) | 45 (28.7%) |
Occupancy by Educational Attainment in Evaro
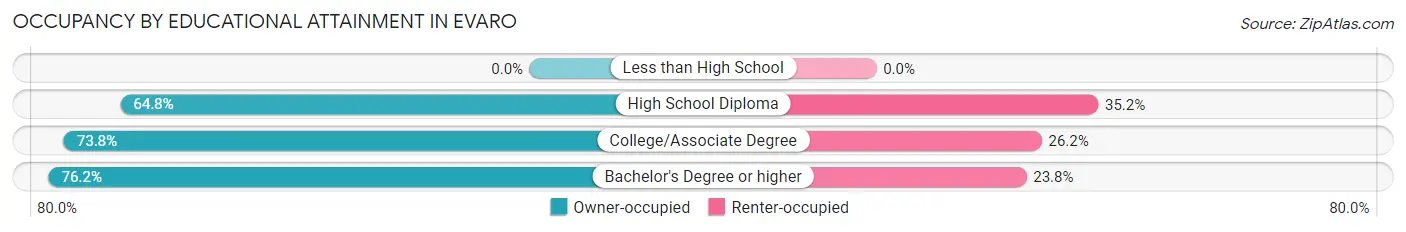
| Household Size | Owner-occupied | Renter-occupied |
| Less than High School | 0 (0.0%) | 0 (0.0%) |
| High School Diploma | 35 (64.8%) | 19 (35.2%) |
| College/Associate Degree | 45 (73.8%) | 16 (26.2%) |
| Bachelor's Degree or higher | 32 (76.2%) | 10 (23.8%) |
Occupancy by Age of Householder in Evaro
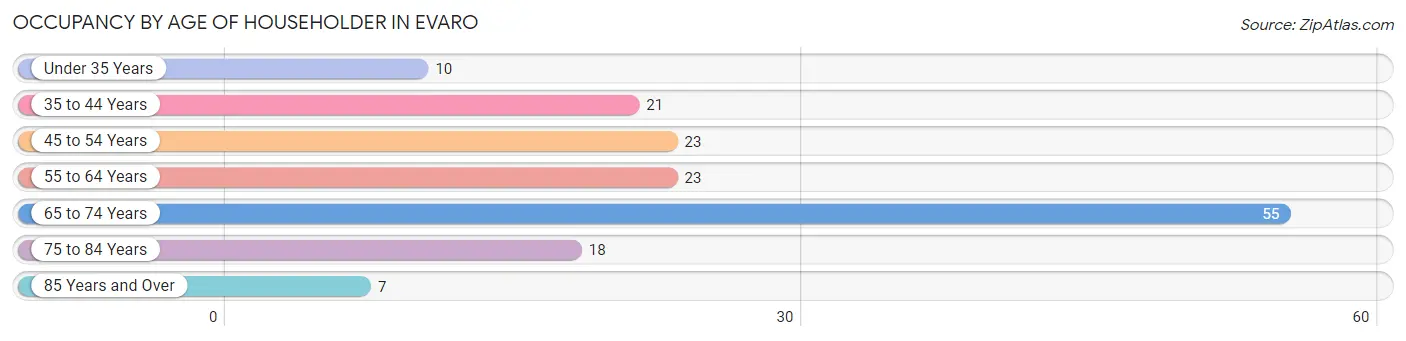
| Age Bracket | # Households | % Households |
| Under 35 Years | 10 | 6.4% |
| 35 to 44 Years | 21 | 13.4% |
| 45 to 54 Years | 23 | 14.6% |
| 55 to 64 Years | 23 | 14.6% |
| 65 to 74 Years | 55 | 35.0% |
| 75 to 84 Years | 18 | 11.5% |
| 85 Years and Over | 7 | 4.5% |
| Total | 157 | 100.0% |
Housing Finances in Evaro
Median Income by Occupancy in Evaro
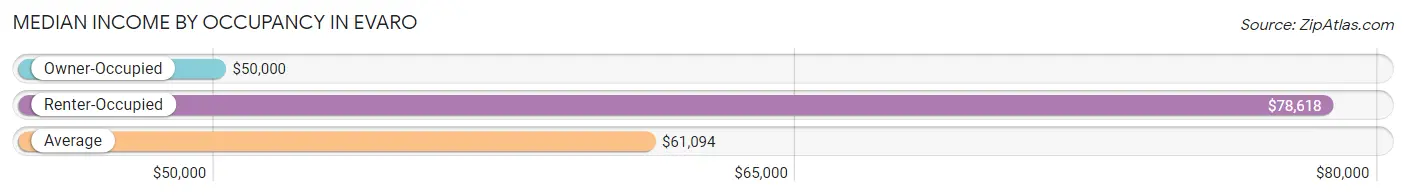
| Occupancy Type | # Households | Median Income |
| Owner-Occupied | 112 (71.3%) | $50,000 |
| Renter-Occupied | 45 (28.7%) | $78,618 |
| Average | 157 (100.0%) | $61,094 |
Occupancy by Householder Income Bracket in Evaro
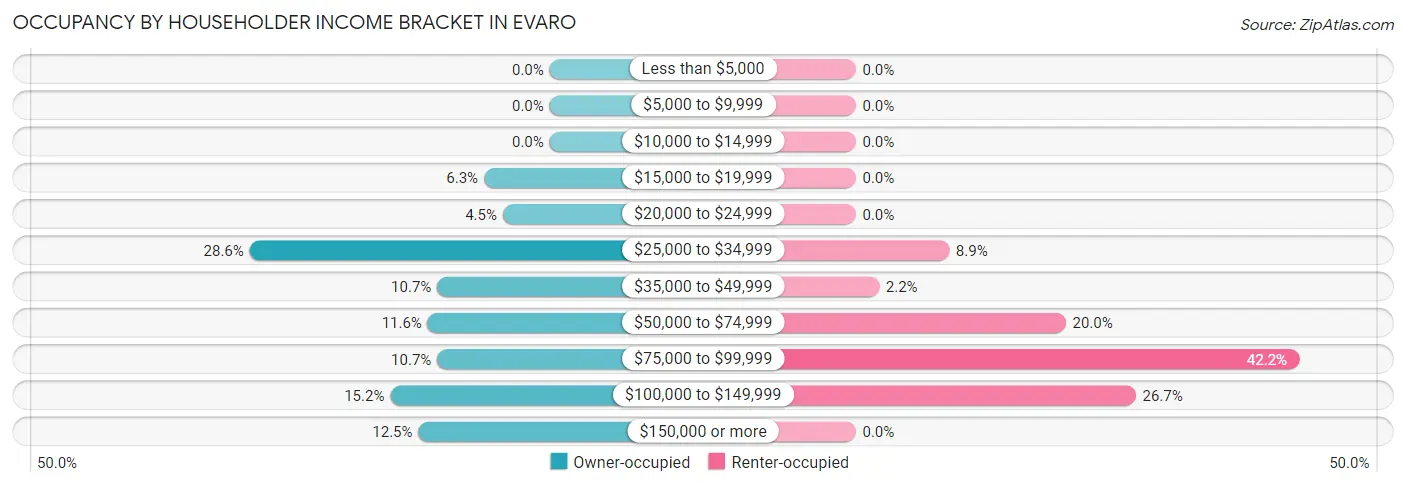
| Income Bracket | Owner-occupied | Renter-occupied |
| Less than $5,000 | 0 (0.0%) | 0 (0.0%) |
| $5,000 to $9,999 | 0 (0.0%) | 0 (0.0%) |
| $10,000 to $14,999 | 0 (0.0%) | 0 (0.0%) |
| $15,000 to $19,999 | 7 (6.2%) | 0 (0.0%) |
| $20,000 to $24,999 | 5 (4.5%) | 0 (0.0%) |
| $25,000 to $34,999 | 32 (28.6%) | 4 (8.9%) |
| $35,000 to $49,999 | 12 (10.7%) | 1 (2.2%) |
| $50,000 to $74,999 | 13 (11.6%) | 9 (20.0%) |
| $75,000 to $99,999 | 12 (10.7%) | 19 (42.2%) |
| $100,000 to $149,999 | 17 (15.2%) | 12 (26.7%) |
| $150,000 or more | 14 (12.5%) | 0 (0.0%) |
| Total | 112 (100.0%) | 45 (100.0%) |
Monthly Housing Cost Tiers in Evaro
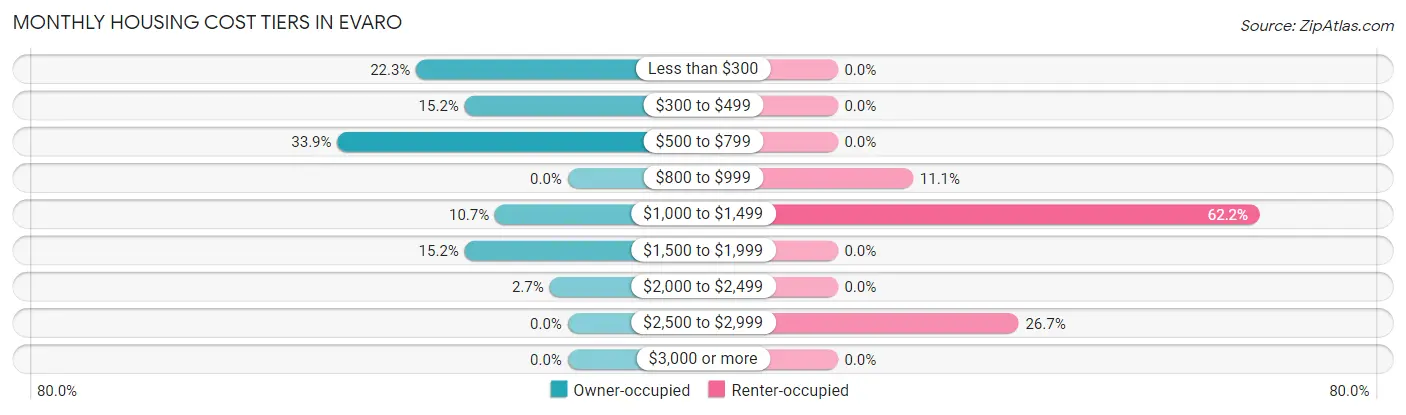
| Monthly Cost | Owner-occupied | Renter-occupied |
| Less than $300 | 25 (22.3%) | 0 (0.0%) |
| $300 to $499 | 17 (15.2%) | 0 (0.0%) |
| $500 to $799 | 38 (33.9%) | 0 (0.0%) |
| $800 to $999 | 0 (0.0%) | 5 (11.1%) |
| $1,000 to $1,499 | 12 (10.7%) | 28 (62.2%) |
| $1,500 to $1,999 | 17 (15.2%) | 0 (0.0%) |
| $2,000 to $2,499 | 3 (2.7%) | 0 (0.0%) |
| $2,500 to $2,999 | 0 (0.0%) | 12 (26.7%) |
| $3,000 or more | 0 (0.0%) | 0 (0.0%) |
| Total | 112 (100.0%) | 45 (100.0%) |
Physical Housing Characteristics in Evaro
Housing Structures in Evaro
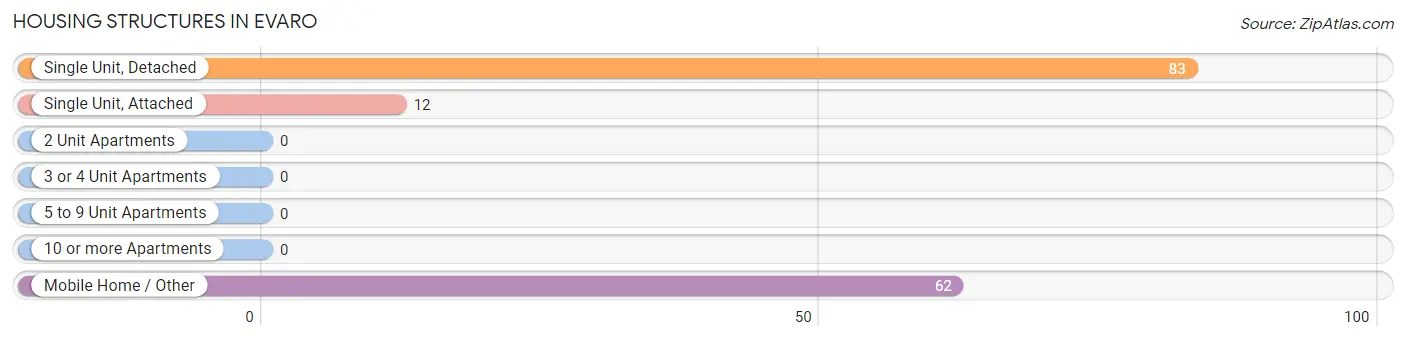
| Structure Type | # Housing Units | % Housing Units |
| Single Unit, Detached | 83 | 52.9% |
| Single Unit, Attached | 12 | 7.6% |
| 2 Unit Apartments | 0 | 0.0% |
| 3 or 4 Unit Apartments | 0 | 0.0% |
| 5 to 9 Unit Apartments | 0 | 0.0% |
| 10 or more Apartments | 0 | 0.0% |
| Mobile Home / Other | 62 | 39.5% |
| Total | 157 | 100.0% |
Housing Structures by Occupancy in Evaro
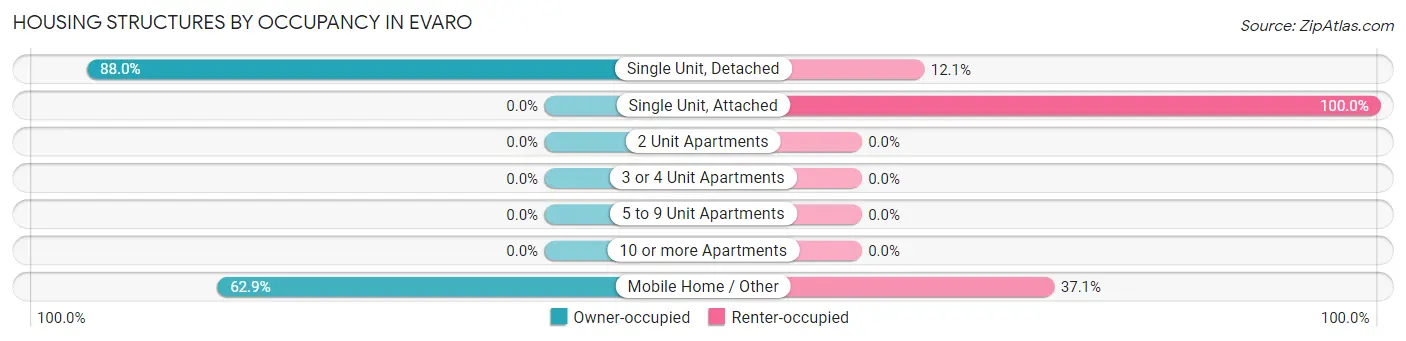
| Structure Type | Owner-occupied | Renter-occupied |
| Single Unit, Detached | 73 (87.9%) | 10 (12.0%) |
| Single Unit, Attached | 0 (0.0%) | 12 (100.0%) |
| 2 Unit Apartments | 0 (0.0%) | 0 (0.0%) |
| 3 or 4 Unit Apartments | 0 (0.0%) | 0 (0.0%) |
| 5 to 9 Unit Apartments | 0 (0.0%) | 0 (0.0%) |
| 10 or more Apartments | 0 (0.0%) | 0 (0.0%) |
| Mobile Home / Other | 39 (62.9%) | 23 (37.1%) |
| Total | 112 (71.3%) | 45 (28.7%) |
Housing Structures by Number of Rooms in Evaro
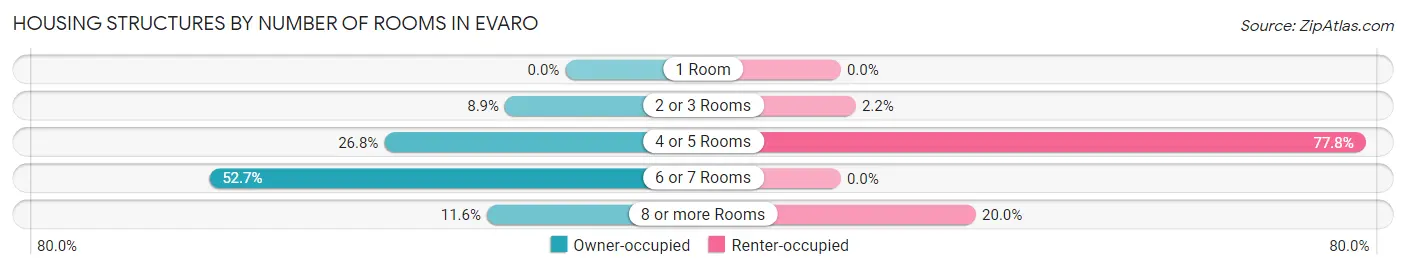
| Number of Rooms | Owner-occupied | Renter-occupied |
| 1 Room | 0 (0.0%) | 0 (0.0%) |
| 2 or 3 Rooms | 10 (8.9%) | 1 (2.2%) |
| 4 or 5 Rooms | 30 (26.8%) | 35 (77.8%) |
| 6 or 7 Rooms | 59 (52.7%) | 0 (0.0%) |
| 8 or more Rooms | 13 (11.6%) | 9 (20.0%) |
| Total | 112 (100.0%) | 45 (100.0%) |
Housing Structure by Heating Type in Evaro
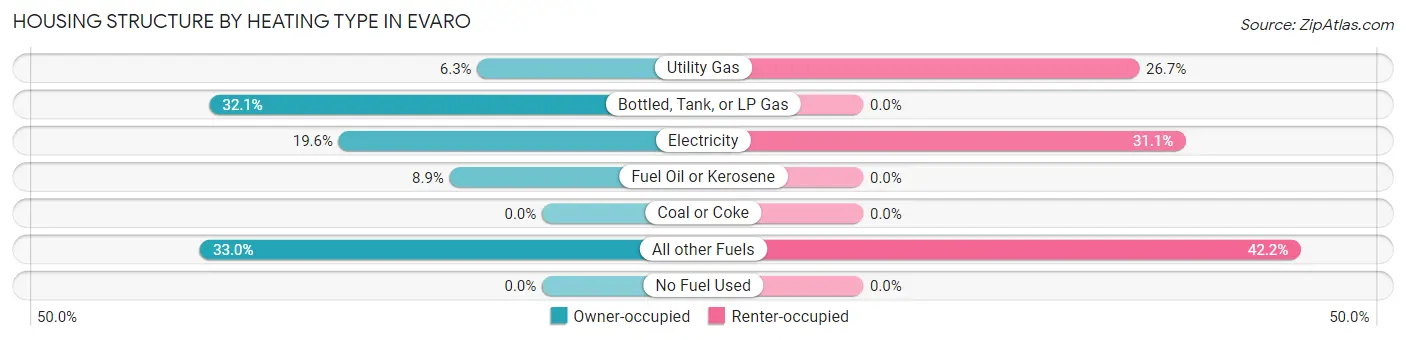
| Heating Type | Owner-occupied | Renter-occupied |
| Utility Gas | 7 (6.2%) | 12 (26.7%) |
| Bottled, Tank, or LP Gas | 36 (32.1%) | 0 (0.0%) |
| Electricity | 22 (19.6%) | 14 (31.1%) |
| Fuel Oil or Kerosene | 10 (8.9%) | 0 (0.0%) |
| Coal or Coke | 0 (0.0%) | 0 (0.0%) |
| All other Fuels | 37 (33.0%) | 19 (42.2%) |
| No Fuel Used | 0 (0.0%) | 0 (0.0%) |
| Total | 112 (100.0%) | 45 (100.0%) |
Household Vehicle Usage in Evaro
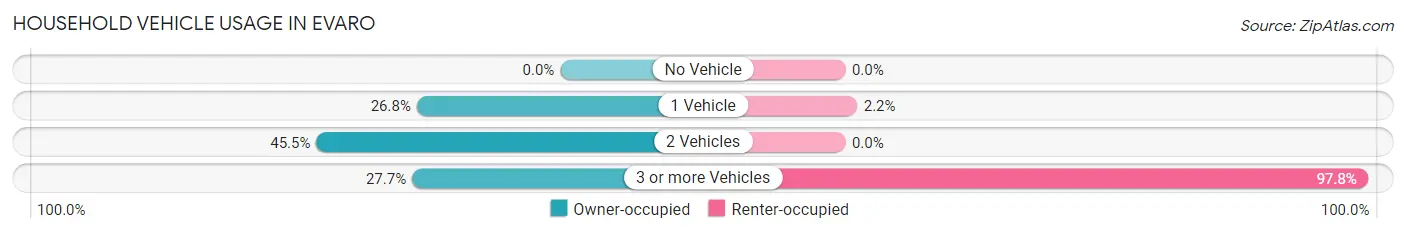
| Vehicles per Household | Owner-occupied | Renter-occupied |
| No Vehicle | 0 (0.0%) | 0 (0.0%) |
| 1 Vehicle | 30 (26.8%) | 1 (2.2%) |
| 2 Vehicles | 51 (45.5%) | 0 (0.0%) |
| 3 or more Vehicles | 31 (27.7%) | 44 (97.8%) |
| Total | 112 (100.0%) | 45 (100.0%) |
Real Estate & Mortgages in Evaro
Real Estate and Mortgage Overview in Evaro
| Characteristic | Without Mortgage | With Mortgage |
| Housing Units | 80 | 32 |
| Median Property Value | $369,200 | $360,000 |
| Median Household Income | $39,000 | $0 |
| Monthly Housing Costs | $480 | $0 |
| Real Estate Taxes | $2,458 | $0 |
Property Value by Mortgage Status in Evaro
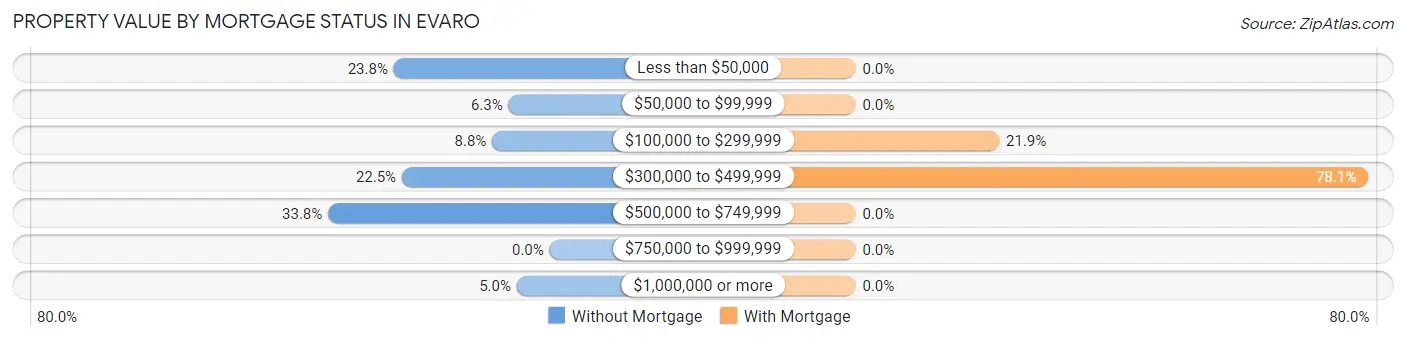
| Property Value | Without Mortgage | With Mortgage |
| Less than $50,000 | 19 (23.7%) | 0 (0.0%) |
| $50,000 to $99,999 | 5 (6.2%) | 0 (0.0%) |
| $100,000 to $299,999 | 7 (8.7%) | 7 (21.9%) |
| $300,000 to $499,999 | 18 (22.5%) | 25 (78.1%) |
| $500,000 to $749,999 | 27 (33.8%) | 0 (0.0%) |
| $750,000 to $999,999 | 0 (0.0%) | 0 (0.0%) |
| $1,000,000 or more | 4 (5.0%) | 0 (0.0%) |
| Total | 80 (100.0%) | 32 (100.0%) |
Household Income by Mortgage Status in Evaro
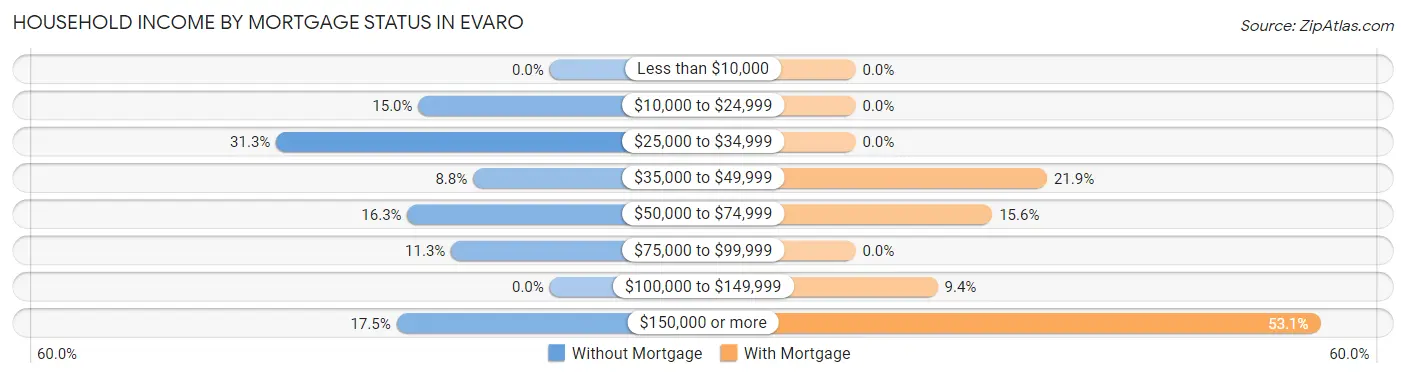
| Household Income | Without Mortgage | With Mortgage |
| Less than $10,000 | 0 (0.0%) | 0 (0.0%) |
| $10,000 to $24,999 | 12 (15.0%) | 0 (0.0%) |
| $25,000 to $34,999 | 25 (31.2%) | 0 (0.0%) |
| $35,000 to $49,999 | 7 (8.7%) | 7 (21.9%) |
| $50,000 to $74,999 | 13 (16.3%) | 5 (15.6%) |
| $75,000 to $99,999 | 9 (11.3%) | 0 (0.0%) |
| $100,000 to $149,999 | 0 (0.0%) | 3 (9.4%) |
| $150,000 or more | 14 (17.5%) | 17 (53.1%) |
| Total | 80 (100.0%) | 32 (100.0%) |
Property Value to Household Income Ratio in Evaro
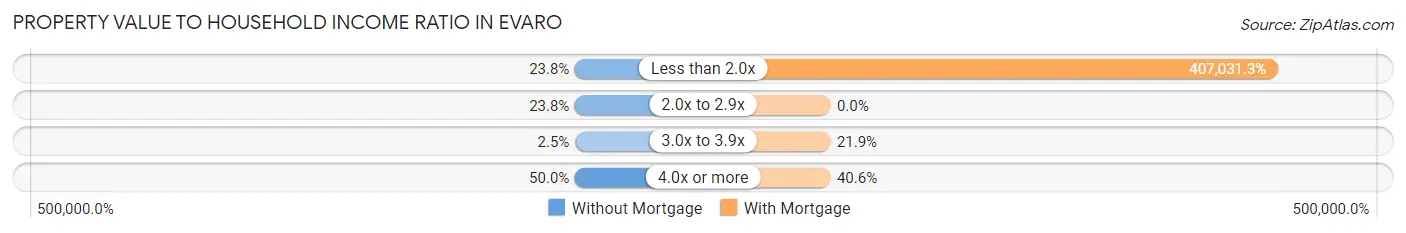
| Value-to-Income Ratio | Without Mortgage | With Mortgage |
| Less than 2.0x | 19 (23.7%) | 130,250 (407,031.2%) |
| 2.0x to 2.9x | 19 (23.7%) | 0 (0.0%) |
| 3.0x to 3.9x | 2 (2.5%) | 7 (21.9%) |
| 4.0x or more | 40 (50.0%) | 13 (40.6%) |
| Total | 80 (100.0%) | 32 (100.0%) |
Real Estate Taxes by Mortgage Status in Evaro
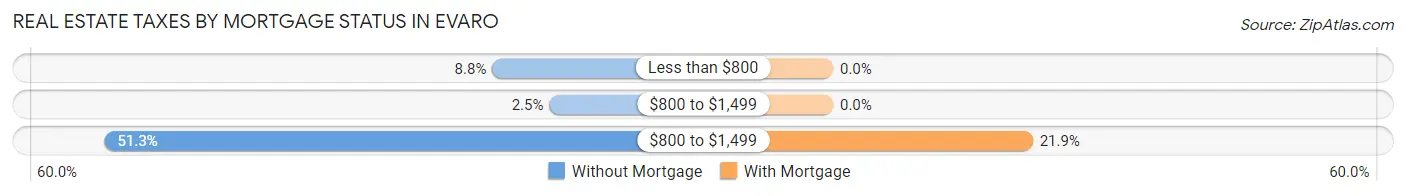
| Property Taxes | Without Mortgage | With Mortgage |
| Less than $800 | 7 (8.7%) | 0 (0.0%) |
| $800 to $1,499 | 2 (2.5%) | 0 (0.0%) |
| $800 to $1,499 | 41 (51.2%) | 7 (21.9%) |
| Total | 80 (100.0%) | 32 (100.0%) |
Health & Disability in Evaro
Health Insurance Coverage by Age in Evaro
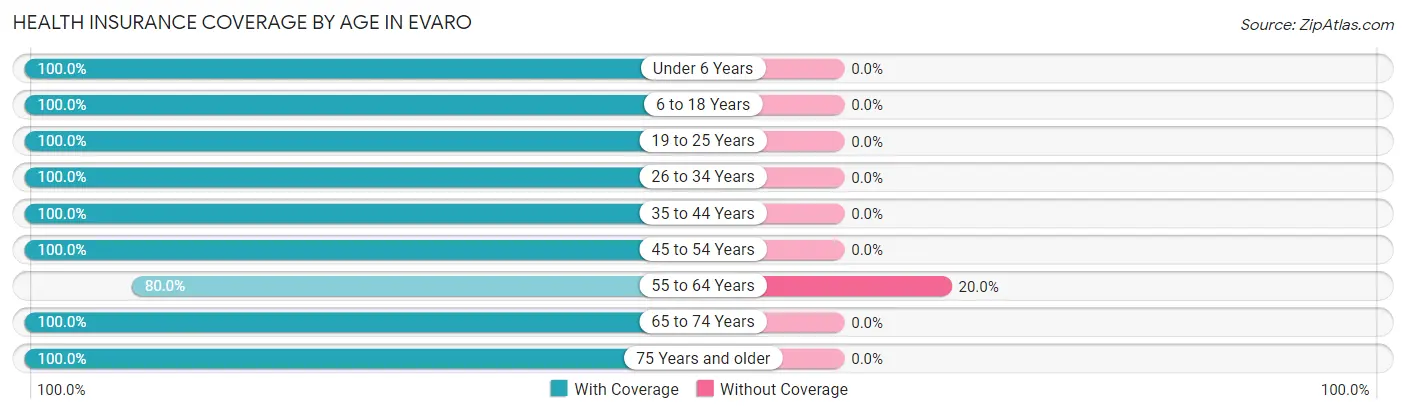
| Age Bracket | With Coverage | Without Coverage |
| Under 6 Years | 28 (100.0%) | 0 (0.0%) |
| 6 to 18 Years | 162 (100.0%) | 0 (0.0%) |
| 19 to 25 Years | 10 (100.0%) | 0 (0.0%) |
| 26 to 34 Years | 20 (100.0%) | 0 (0.0%) |
| 35 to 44 Years | 44 (100.0%) | 0 (0.0%) |
| 45 to 54 Years | 42 (100.0%) | 0 (0.0%) |
| 55 to 64 Years | 44 (80.0%) | 11 (20.0%) |
| 65 to 74 Years | 65 (100.0%) | 0 (0.0%) |
| 75 Years and older | 79 (100.0%) | 0 (0.0%) |
| Total | 494 (97.8%) | 11 (2.2%) |
Health Insurance Coverage by Citizenship Status in Evaro
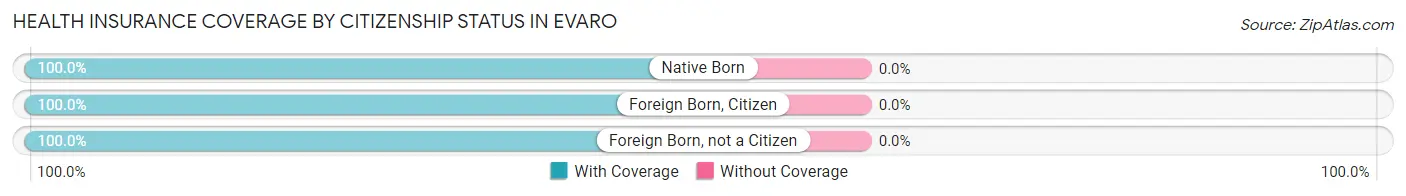
| Citizenship Status | With Coverage | Without Coverage |
| Native Born | 28 (100.0%) | 0 (0.0%) |
| Foreign Born, Citizen | 162 (100.0%) | 0 (0.0%) |
| Foreign Born, not a Citizen | 10 (100.0%) | 0 (0.0%) |
Health Insurance Coverage by Household Income in Evaro
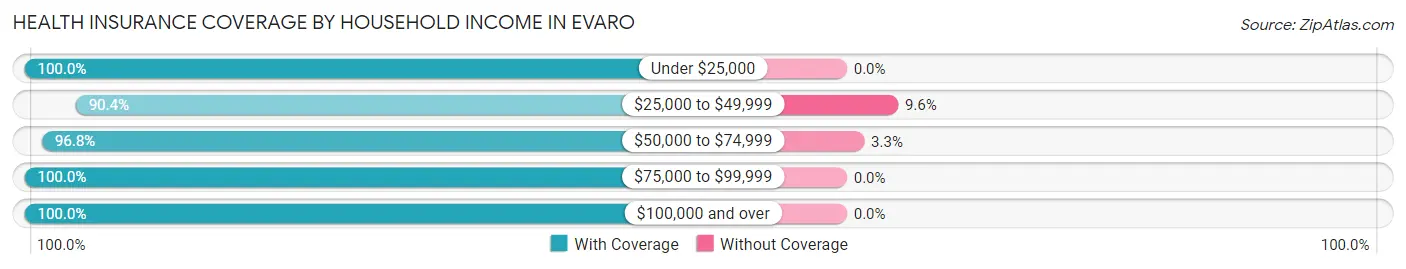
| Household Income | With Coverage | Without Coverage |
| Under $25,000 | 19 (100.0%) | 0 (0.0%) |
| $25,000 to $49,999 | 66 (90.4%) | 7 (9.6%) |
| $50,000 to $74,999 | 119 (96.8%) | 4 (3.3%) |
| $75,000 to $99,999 | 104 (100.0%) | 0 (0.0%) |
| $100,000 and over | 159 (100.0%) | 0 (0.0%) |
Public vs Private Health Insurance Coverage by Age in Evaro
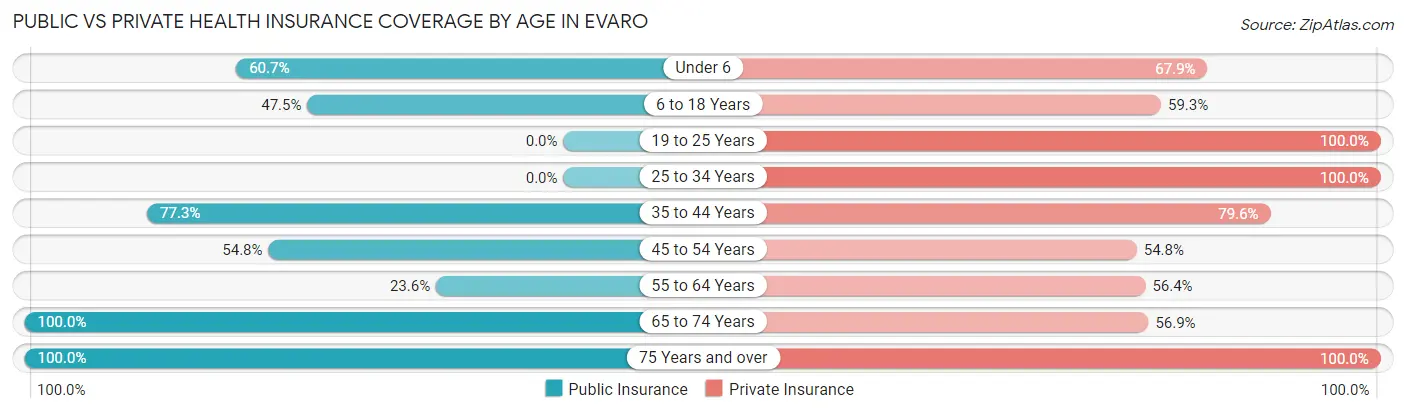
| Age Bracket | Public Insurance | Private Insurance |
| Under 6 | 17 (60.7%) | 19 (67.9%) |
| 6 to 18 Years | 77 (47.5%) | 96 (59.3%) |
| 19 to 25 Years | 0 (0.0%) | 10 (100.0%) |
| 25 to 34 Years | 0 (0.0%) | 20 (100.0%) |
| 35 to 44 Years | 34 (77.3%) | 35 (79.5%) |
| 45 to 54 Years | 23 (54.8%) | 23 (54.8%) |
| 55 to 64 Years | 13 (23.6%) | 31 (56.4%) |
| 65 to 74 Years | 65 (100.0%) | 37 (56.9%) |
| 75 Years and over | 79 (100.0%) | 79 (100.0%) |
| Total | 308 (61.0%) | 350 (69.3%) |
Disability Status by Sex by Age in Evaro
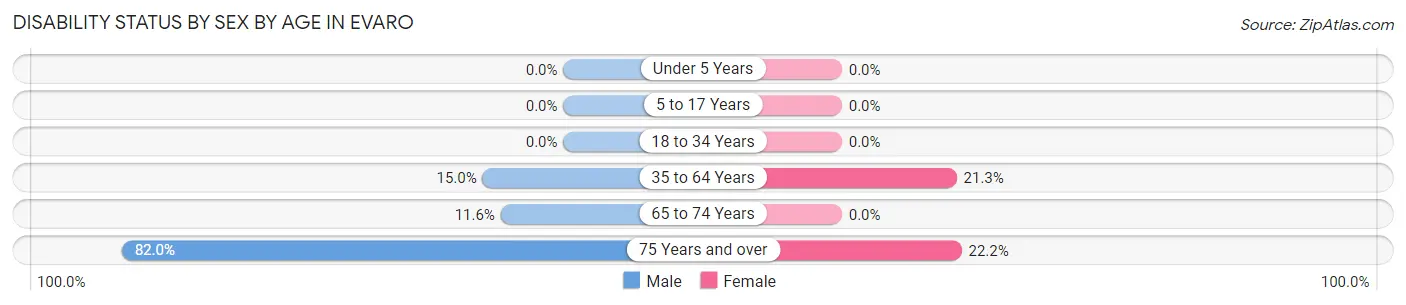
| Age Bracket | Male | Female |
| Under 5 Years | 0 (0.0%) | 0 (0.0%) |
| 5 to 17 Years | 0 (0.0%) | 0 (0.0%) |
| 18 to 34 Years | 0 (0.0%) | 0 (0.0%) |
| 35 to 64 Years | 12 (15.0%) | 13 (21.3%) |
| 65 to 74 Years | 5 (11.6%) | 0 (0.0%) |
| 75 Years and over | 50 (82.0%) | 4 (22.2%) |
Disability Class by Sex by Age in Evaro
Disability Class: Hearing Difficulty
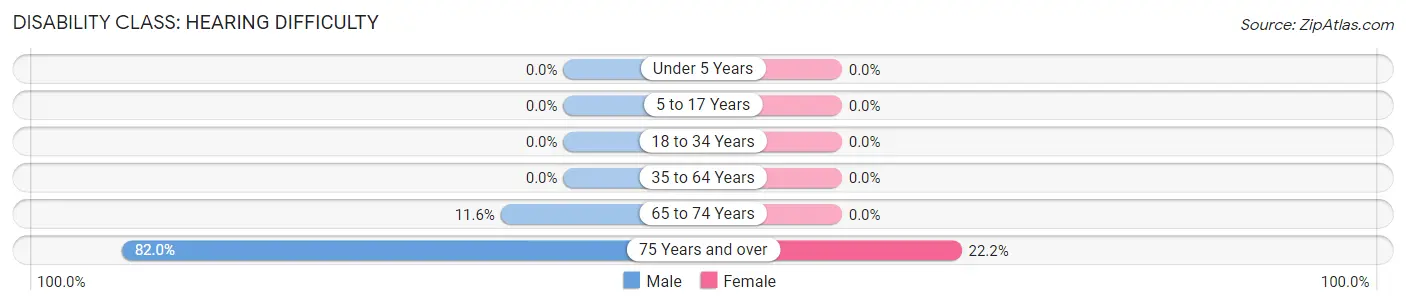
| Age Bracket | Male | Female |
| Under 5 Years | 0 (0.0%) | 0 (0.0%) |
| 5 to 17 Years | 0 (0.0%) | 0 (0.0%) |
| 18 to 34 Years | 0 (0.0%) | 0 (0.0%) |
| 35 to 64 Years | 0 (0.0%) | 0 (0.0%) |
| 65 to 74 Years | 5 (11.6%) | 0 (0.0%) |
| 75 Years and over | 50 (82.0%) | 4 (22.2%) |
Disability Class: Vision Difficulty
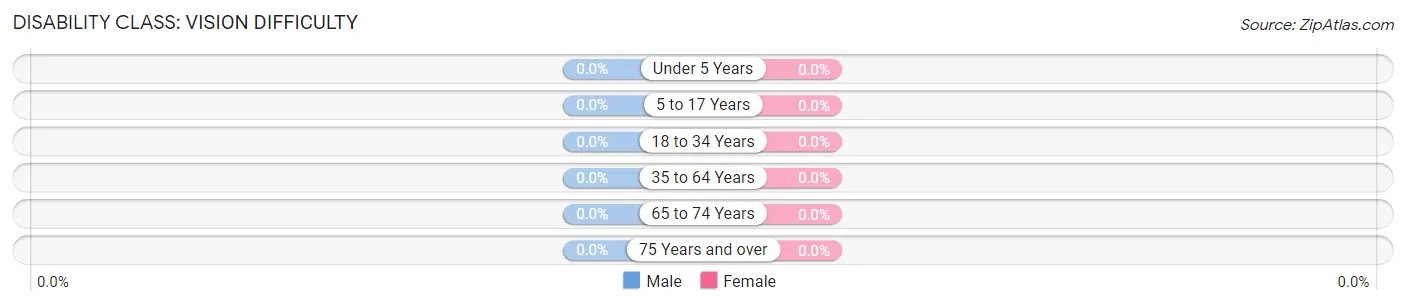
| Age Bracket | Male | Female |
| Under 5 Years | 0 (0.0%) | 0 (0.0%) |
| 5 to 17 Years | 0 (0.0%) | 0 (0.0%) |
| 18 to 34 Years | 0 (0.0%) | 0 (0.0%) |
| 35 to 64 Years | 0 (0.0%) | 0 (0.0%) |
| 65 to 74 Years | 0 (0.0%) | 0 (0.0%) |
| 75 Years and over | 0 (0.0%) | 0 (0.0%) |
Disability Class: Cognitive Difficulty
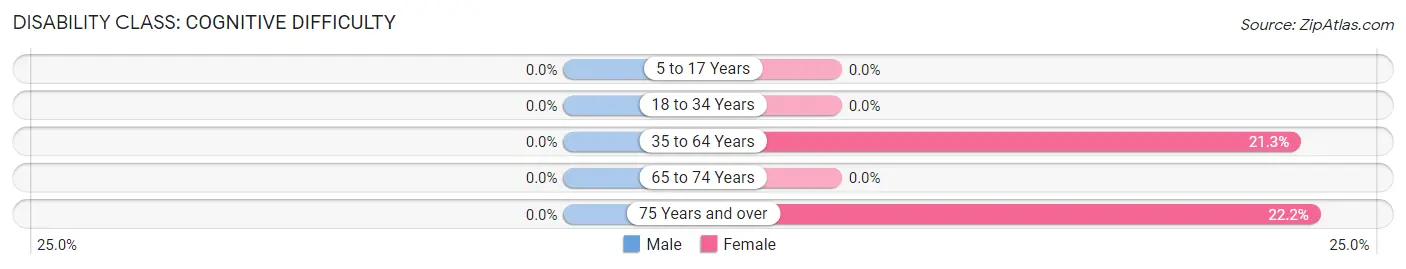
| Age Bracket | Male | Female |
| 5 to 17 Years | 0 (0.0%) | 0 (0.0%) |
| 18 to 34 Years | 0 (0.0%) | 0 (0.0%) |
| 35 to 64 Years | 0 (0.0%) | 13 (21.3%) |
| 65 to 74 Years | 0 (0.0%) | 0 (0.0%) |
| 75 Years and over | 0 (0.0%) | 4 (22.2%) |
Disability Class: Ambulatory Difficulty
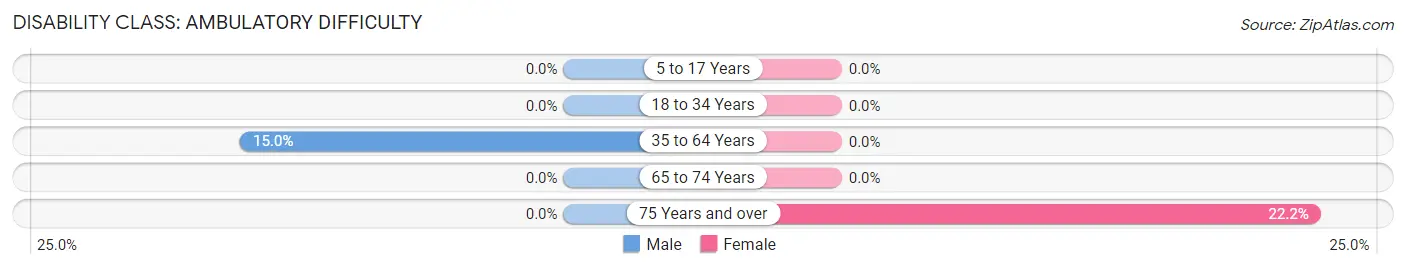
| Age Bracket | Male | Female |
| 5 to 17 Years | 0 (0.0%) | 0 (0.0%) |
| 18 to 34 Years | 0 (0.0%) | 0 (0.0%) |
| 35 to 64 Years | 12 (15.0%) | 0 (0.0%) |
| 65 to 74 Years | 0 (0.0%) | 0 (0.0%) |
| 75 Years and over | 0 (0.0%) | 4 (22.2%) |
Disability Class: Self-Care Difficulty
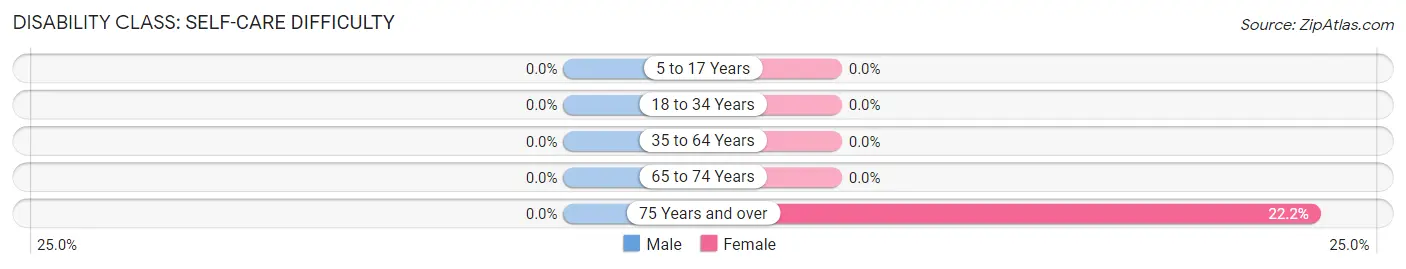
| Age Bracket | Male | Female |
| 5 to 17 Years | 0 (0.0%) | 0 (0.0%) |
| 18 to 34 Years | 0 (0.0%) | 0 (0.0%) |
| 35 to 64 Years | 0 (0.0%) | 0 (0.0%) |
| 65 to 74 Years | 0 (0.0%) | 0 (0.0%) |
| 75 Years and over | 0 (0.0%) | 4 (22.2%) |
Technology Access in Evaro
Computing Device Access in Evaro
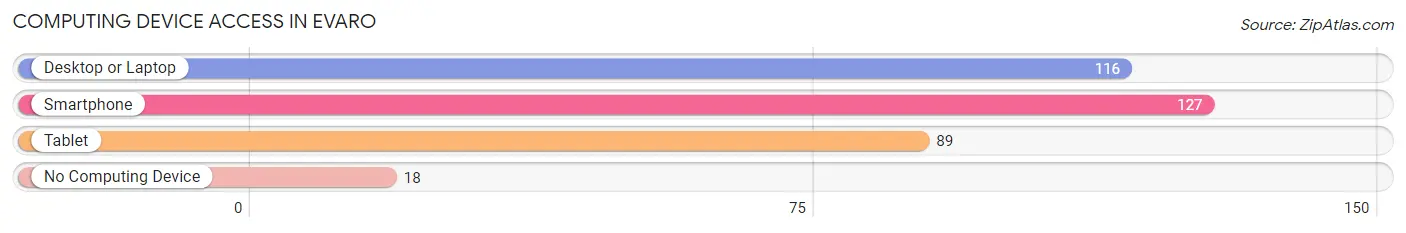
| Device Type | # Households | % Households |
| Desktop or Laptop | 116 | 73.9% |
| Smartphone | 127 | 80.9% |
| Tablet | 89 | 56.7% |
| No Computing Device | 18 | 11.5% |
| Total | 157 | 100.0% |
Internet Access in Evaro
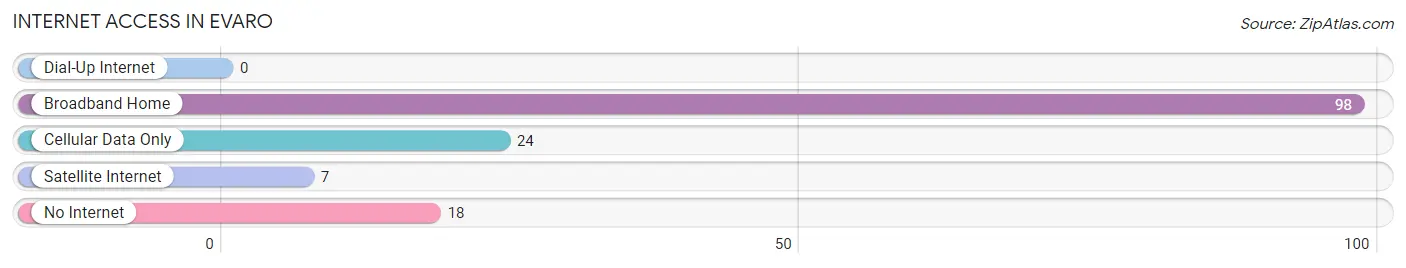
| Internet Type | # Households | % Households |
| Dial-Up Internet | 0 | 0.0% |
| Broadband Home | 98 | 62.4% |
| Cellular Data Only | 24 | 15.3% |
| Satellite Internet | 7 | 4.5% |
| No Internet | 18 | 11.5% |
| Total | 157 | 100.0% |
Evaro Summary
Evaro, Montana is a small unincorporated community located in Missoula County, Montana. It is situated along the Clark Fork River, approximately 10 miles northwest of Missoula. The population of Evaro was estimated to be around 1,000 in 2000.
History
Evaro was first settled in the late 1800s by homesteaders who were attracted to the area by its fertile soil and abundant wildlife. The town was originally known as "Evaro Station" and was a stop on the Northern Pacific Railway. In the early 1900s, the town was renamed "Evaro" after a local Native American chief.
The town grew steadily throughout the 20th century, and by the 1950s, it had become a popular tourist destination. The town was home to several resorts, including the Evaro Resort and the Evaro Inn. The town also had a post office, a general store, and a gas station.
Geography
Evaro is located in the western part of Montana, in the Rocky Mountain region. The town is situated along the Clark Fork River, approximately 10 miles northwest of Missoula. The surrounding area is mostly mountainous, with the highest peak in the area being Mount Evaro, which rises to an elevation of 8,890 feet.
The climate in Evaro is generally mild, with warm summers and cold winters. The average annual temperature is around 45 degrees Fahrenheit, and the average annual precipitation is around 16 inches.
Economy
The economy of Evaro is largely based on tourism. The town is home to several resorts, including the Evaro Resort and the Evaro Inn. The town also has a post office, a general store, and a gas station.
In addition to tourism, the town is also home to several small businesses, including a lumber mill, a sawmill, and a furniture factory. The town also has a small airport, which serves as a hub for private and commercial flights.
Demographics
As of the 2000 census, the population of Evaro was estimated to be around 1,000. The racial makeup of the town was 97.2% White, 0.7% Native American, 0.3% Asian, 0.2% African American, and 1.6% from other races. The median household income was $30,000, and the median family income was $35,000.
Conclusion
Evaro, Montana is a small unincorporated community located in Missoula County, Montana. It is situated along the Clark Fork River, approximately 10 miles northwest of Missoula. The town has a long history, and its economy is largely based on tourism. The population of Evaro was estimated to be around 1,000 in 2000, and the racial makeup of the town was 97.2% White, 0.7% Native American, 0.3% Asian, 0.2% African American, and 1.6% from other races. The median household income was $30,000, and the median family income was $35,000.
Common Questions
What is Per Capita Income in Evaro?
Per Capita income in Evaro is $26,616.
What is the Median Family Income in Evaro?
Median Family Income in Evaro is $77,566.
What is the Median Household income in Evaro?
Median Household Income in Evaro is $61,094.
What is Inequality or Gini Index in Evaro?
Inequality or Gini Index in Evaro is 0.37.
What is the Total Population of Evaro?
Total Population of Evaro is 505.
What is the Total Male Population of Evaro?
Total Male Population of Evaro is 261.
What is the Total Female Population of Evaro?
Total Female Population of Evaro is 244.
What is the Ratio of Males per 100 Females in Evaro?
There are 106.97 Males per 100 Females in Evaro.
What is the Ratio of Females per 100 Males in Evaro?
There are 93.49 Females per 100 Males in Evaro.
What is the Median Population Age in Evaro?
Median Population Age in Evaro is 40.1 Years.
What is the Average Family Size in Evaro
Average Family Size in Evaro is 3.6 People.
What is the Average Household Size in Evaro
Average Household Size in Evaro is 3.0 People.
How Large is the Labor Force in Evaro?
There are 149 People in the Labor Forcein in Evaro.
What is the Percentage of People in the Labor Force in Evaro?
45.7% of People are in the Labor Force in Evaro.
What is the Unemployment Rate in Evaro?
Unemployment Rate in Evaro is 7.4%.