Zip Codes with the Highest Percentage of Population Employed in Administrative & Support Services in Missoula, MT
RELATED REPORTS & OPTIONS
Administrative & Support Services
Missoula
Compare Zip Codes
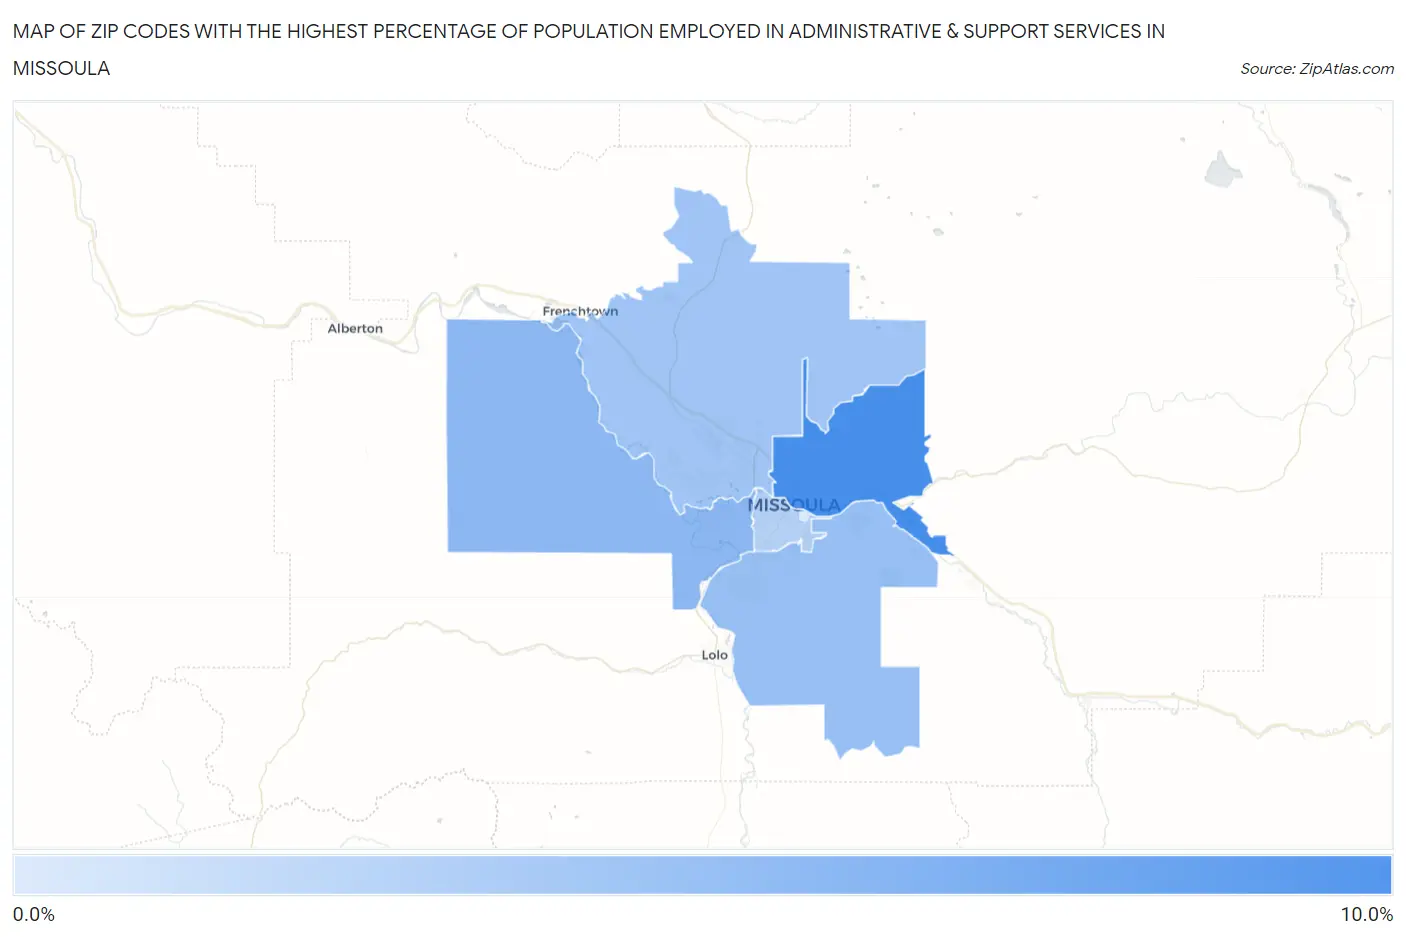
Map of Zip Codes with the Highest Percentage of Population Employed in Administrative & Support Services in Missoula
1.5%
8.2%
Zip Codes with the Highest Percentage of Population Employed in Administrative & Support Services in Missoula, MT
| Zip Code | % Employed | vs State | vs National | |
| 1. | 59802 | 8.2% | 3.3%(+4.95)#18 | 4.1%(+4.07)#2,136 |
| 2. | 59804 | 5.0% | 3.3%(+1.76)#44 | 4.1%(+0.879)#7,028 |
| 3. | 59803 | 4.6% | 3.3%(+1.32)#54 | 4.1%(+0.437)#8,418 |
| 4. | 59808 | 4.2% | 3.3%(+0.887)#68 | 4.1%(+0.003)#10,020 |
| 5. | 59801 | 3.3% | 3.3%(+0.008)#92 | 4.1%(-0.876)#14,091 |
| 6. | 59812 | 1.5% | 3.3%(-1.74)#168 | 4.1%(-2.63)#22,647 |
1
Common Questions
What are the Top 5 Zip Codes with the Highest Percentage of Population Employed in Administrative & Support Services in Missoula, MT?
Top 5 Zip Codes with the Highest Percentage of Population Employed in Administrative & Support Services in Missoula, MT are:
What zip code has the Highest Percentage of Population Employed in Administrative & Support Services in Missoula, MT?
59802 has the Highest Percentage of Population Employed in Administrative & Support Services in Missoula, MT with 8.2%.
What is the Percentage of Population Employed in Administrative & Support Services in Missoula, MT?
Percentage of Population Employed in Administrative & Support Services in Missoula is 4.9%.
What is the Percentage of Population Employed in Administrative & Support Services in Montana?
Percentage of Population Employed in Administrative & Support Services in Montana is 3.3%.
What is the Percentage of Population Employed in Administrative & Support Services in the United States?
Percentage of Population Employed in Administrative & Support Services in the United States is 4.1%.