Zip Codes with the Highest Percentage of Households with Income Below $10,000 in Mississippi
RELATED REPORTS & OPTIONS
Household Income | $0-10k
Mississippi
Compare Zip Codes
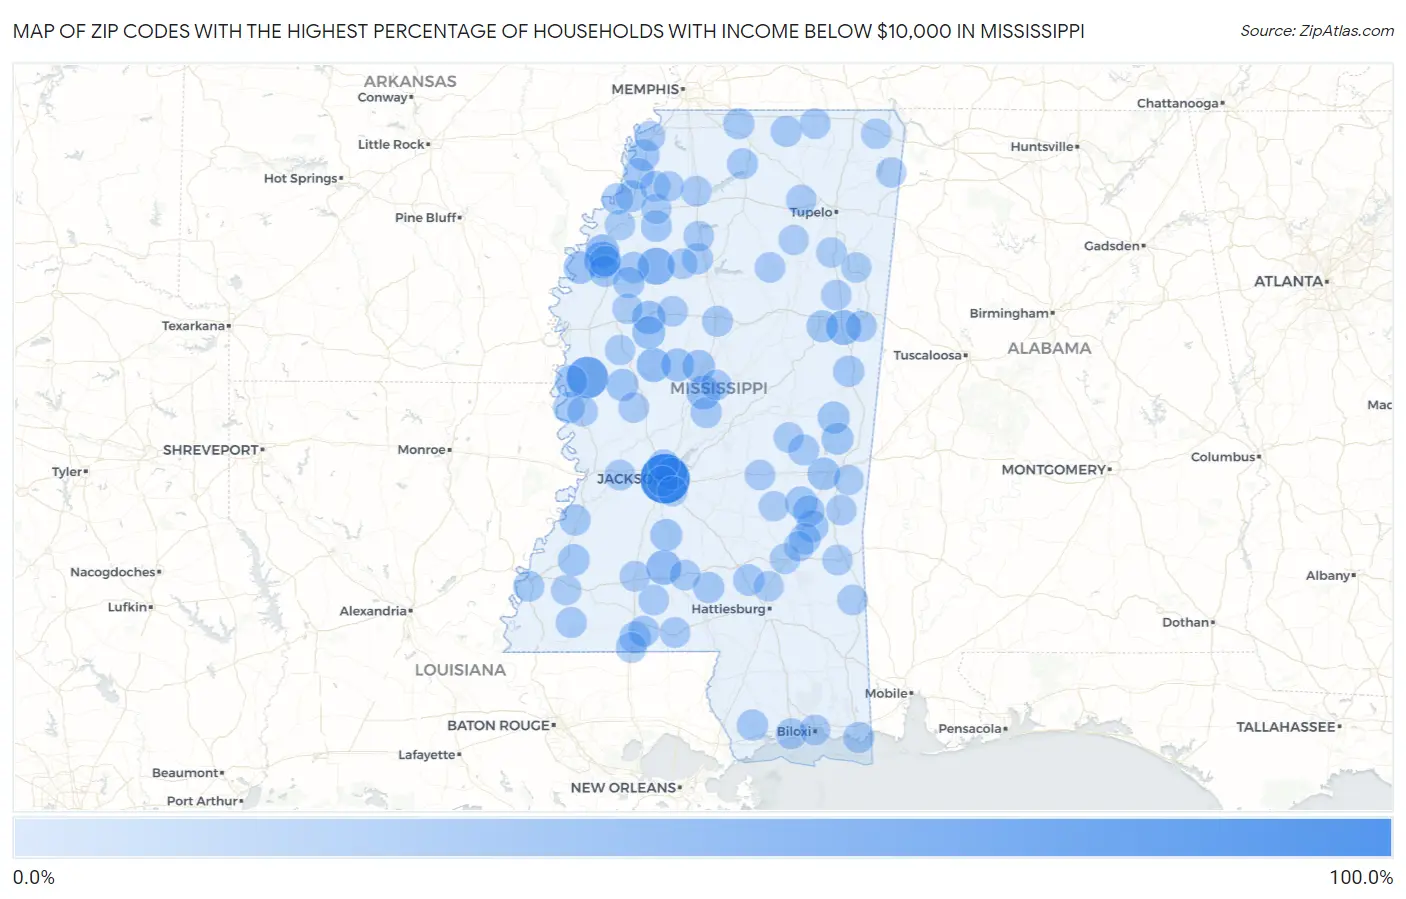
Map of Zip Codes with the Highest Percentage of Households with Income Below $10,000 in Mississippi
0.0%
100.0%
Zip Codes with the Highest Percentage of Households with Income Below $10,000 in Mississippi
| Zip Code | Households with Income < $10k | vs State | vs National | |
| 1. | 39217 | 100.0% | 7.4%(+92.6)#1 | 4.9%(+95.1)#6 |
| 2. | 38765 | 61.9% | 7.4%(+54.5)#2 | 4.9%(+57.0)#70 |
| 3. | 38928 | 40.4% | 7.4%(+33.0)#3 | 4.9%(+35.5)#171 |
| 4. | 38781 | 39.2% | 7.4%(+31.8)#4 | 4.9%(+34.3)#180 |
| 5. | 39736 | 31.5% | 7.4%(+24.1)#5 | 4.9%(+26.6)#296 |
| 6. | 39665 | 30.7% | 7.4%(+23.3)#6 | 4.9%(+25.8)#313 |
| 7. | 39169 | 27.8% | 7.4%(+20.4)#7 | 4.9%(+22.9)#376 |
| 8. | 39079 | 27.0% | 7.4%(+19.6)#8 | 4.9%(+22.1)#400 |
| 9. | 38774 | 25.8% | 7.4%(+18.4)#9 | 4.9%(+20.9)#448 |
| 10. | 38941 | 24.3% | 7.4%(+16.9)#10 | 4.9%(+19.4)#517 |
| 11. | 39095 | 22.5% | 7.4%(+15.1)#11 | 4.9%(+17.6)#609 |
| 12. | 38946 | 22.4% | 7.4%(+15.0)#12 | 4.9%(+17.5)#614 |
| 13. | 39063 | 20.8% | 7.4%(+13.4)#13 | 4.9%(+15.9)#715 |
| 14. | 38769 | 20.5% | 7.4%(+13.1)#14 | 4.9%(+15.6)#748 |
| 15. | 39307 | 20.4% | 7.4%(+13.0)#15 | 4.9%(+15.5)#759 |
| 16. | 39356 | 19.2% | 7.4%(+11.8)#16 | 4.9%(+14.3)#889 |
| 17. | 39097 | 19.1% | 7.4%(+11.7)#17 | 4.9%(+14.2)#896 |
| 18. | 38744 | 18.9% | 7.4%(+11.5)#18 | 4.9%(+14.0)#912 |
| 19. | 39216 | 18.8% | 7.4%(+11.4)#19 | 4.9%(+13.9)#918 |
| 20. | 39078 | 18.5% | 7.4%(+11.1)#20 | 4.9%(+13.6)#951 |
| 21. | 39328 | 18.2% | 7.4%(+10.8)#21 | 4.9%(+13.3)#993 |
| 22. | 39326 | 18.2% | 7.4%(+10.8)#22 | 4.9%(+13.3)#1,005 |
| 23. | 39759 | 17.8% | 7.4%(+10.4)#23 | 4.9%(+12.9)#1,042 |
| 24. | 39366 | 17.7% | 7.4%(+10.3)#24 | 4.9%(+12.8)#1,060 |
| 25. | 39069 | 17.3% | 7.4%(+9.90)#25 | 4.9%(+12.4)#1,114 |
| 26. | 38676 | 16.8% | 7.4%(+9.40)#26 | 4.9%(+11.9)#1,186 |
| 27. | 39347 | 16.7% | 7.4%(+9.30)#27 | 4.9%(+11.8)#1,208 |
| 28. | 39652 | 16.4% | 7.4%(+9.00)#28 | 4.9%(+11.5)#1,259 |
| 29. | 38759 | 16.1% | 7.4%(+8.70)#29 | 4.9%(+11.2)#1,322 |
| 30. | 39113 | 16.0% | 7.4%(+8.60)#30 | 4.9%(+11.1)#1,349 |
| 31. | 38617 | 15.5% | 7.4%(+8.10)#31 | 4.9%(+10.6)#1,433 |
| 32. | 39479 | 15.4% | 7.4%(+8.00)#32 | 4.9%(+10.5)#1,440 |
| 33. | 38737 | 15.3% | 7.4%(+7.90)#33 | 4.9%(+10.4)#1,456 |
| 34. | 38643 | 15.3% | 7.4%(+7.90)#34 | 4.9%(+10.4)#1,460 |
| 35. | 39341 | 15.2% | 7.4%(+7.80)#35 | 4.9%(+10.3)#1,480 |
| 36. | 38626 | 15.2% | 7.4%(+7.80)#36 | 4.9%(+10.3)#1,490 |
| 37. | 38771 | 15.1% | 7.4%(+7.70)#37 | 4.9%(+10.2)#1,503 |
| 38. | 39439 | 15.0% | 7.4%(+7.60)#38 | 4.9%(+10.1)#1,520 |
| 39. | 39427 | 15.0% | 7.4%(+7.60)#39 | 4.9%(+10.1)#1,524 |
| 40. | 39213 | 14.7% | 7.4%(+7.30)#40 | 4.9%(+9.80)#1,591 |
| 41. | 38631 | 14.7% | 7.4%(+7.30)#41 | 4.9%(+9.80)#1,602 |
| 42. | 39556 | 14.6% | 7.4%(+7.20)#42 | 4.9%(+9.70)#1,619 |
| 43. | 38603 | 14.6% | 7.4%(+7.20)#43 | 4.9%(+9.70)#1,623 |
| 44. | 38661 | 14.6% | 7.4%(+7.20)#44 | 4.9%(+9.70)#1,626 |
| 45. | 39045 | 14.6% | 7.4%(+7.20)#45 | 4.9%(+9.70)#1,629 |
| 46. | 39150 | 14.3% | 7.4%(+6.90)#46 | 4.9%(+9.40)#1,692 |
| 47. | 39701 | 14.2% | 7.4%(+6.80)#47 | 4.9%(+9.30)#1,719 |
| 48. | 39581 | 14.2% | 7.4%(+6.80)#48 | 4.9%(+9.30)#1,720 |
| 49. | 39648 | 14.1% | 7.4%(+6.70)#49 | 4.9%(+9.20)#1,740 |
| 50. | 38953 | 14.1% | 7.4%(+6.70)#50 | 4.9%(+9.20)#1,759 |
| 51. | 39120 | 13.6% | 7.4%(+6.20)#51 | 4.9%(+8.70)#1,873 |
| 52. | 39501 | 13.5% | 7.4%(+6.10)#52 | 4.9%(+8.60)#1,909 |
| 53. | 38967 | 13.4% | 7.4%(+6.00)#53 | 4.9%(+8.50)#1,947 |
| 54. | 38762 | 13.4% | 7.4%(+6.00)#54 | 4.9%(+8.50)#1,953 |
| 55. | 39204 | 13.3% | 7.4%(+5.90)#55 | 4.9%(+8.40)#1,979 |
| 56. | 38685 | 13.2% | 7.4%(+5.80)#56 | 4.9%(+8.30)#2,018 |
| 57. | 39638 | 13.1% | 7.4%(+5.70)#57 | 4.9%(+8.20)#2,040 |
| 58. | 39337 | 13.1% | 7.4%(+5.70)#58 | 4.9%(+8.20)#2,047 |
| 59. | 39662 | 12.9% | 7.4%(+5.50)#59 | 4.9%(+8.00)#2,131 |
| 60. | 39657 | 12.8% | 7.4%(+5.40)#60 | 4.9%(+7.90)#2,175 |
| 61. | 38666 | 12.7% | 7.4%(+5.30)#61 | 4.9%(+7.80)#2,199 |
| 62. | 39194 | 12.5% | 7.4%(+5.10)#62 | 4.9%(+7.60)#2,254 |
| 63. | 39667 | 12.5% | 7.4%(+5.10)#63 | 4.9%(+7.60)#2,258 |
| 64. | 39601 | 12.4% | 7.4%(+5.00)#64 | 4.9%(+7.50)#2,295 |
| 65. | 38670 | 12.3% | 7.4%(+4.90)#65 | 4.9%(+7.40)#2,352 |
| 66. | 39663 | 12.2% | 7.4%(+4.80)#66 | 4.9%(+7.30)#2,384 |
| 67. | 39066 | 12.1% | 7.4%(+4.70)#67 | 4.9%(+7.20)#2,422 |
| 68. | 39355 | 12.0% | 7.4%(+4.60)#68 | 4.9%(+7.10)#2,463 |
| 69. | 38683 | 12.0% | 7.4%(+4.60)#69 | 4.9%(+7.10)#2,467 |
| 70. | 38930 | 11.9% | 7.4%(+4.50)#70 | 4.9%(+7.00)#2,504 |
| 71. | 39362 | 11.9% | 7.4%(+4.50)#71 | 4.9%(+7.00)#2,518 |
| 72. | 39160 | 11.9% | 7.4%(+4.50)#72 | 4.9%(+7.00)#2,520 |
| 73. | 39367 | 11.8% | 7.4%(+4.40)#73 | 4.9%(+6.90)#2,546 |
| 74. | 38664 | 11.8% | 7.4%(+4.40)#74 | 4.9%(+6.90)#2,550 |
| 75. | 38948 | 11.8% | 7.4%(+4.40)#75 | 4.9%(+6.90)#2,555 |
| 76. | 39054 | 11.8% | 7.4%(+4.40)#76 | 4.9%(+6.90)#2,575 |
| 77. | 38839 | 11.8% | 7.4%(+4.40)#77 | 4.9%(+6.90)#2,580 |
| 78. | 38841 | 11.6% | 7.4%(+4.20)#78 | 4.9%(+6.70)#2,642 |
| 79. | 39530 | 11.4% | 7.4%(+4.00)#79 | 4.9%(+6.50)#2,735 |
| 80. | 39092 | 11.4% | 7.4%(+4.00)#80 | 4.9%(+6.50)#2,746 |
| 81. | 38833 | 11.4% | 7.4%(+4.00)#81 | 4.9%(+6.50)#2,754 |
| 82. | 39773 | 11.3% | 7.4%(+3.90)#82 | 4.9%(+6.40)#2,789 |
| 83. | 39661 | 11.3% | 7.4%(+3.90)#83 | 4.9%(+6.40)#2,804 |
| 84. | 38778 | 11.3% | 7.4%(+3.90)#84 | 4.9%(+6.40)#2,810 |
| 85. | 39440 | 11.2% | 7.4%(+3.80)#85 | 4.9%(+6.30)#2,841 |
| 86. | 38860 | 11.2% | 7.4%(+3.80)#86 | 4.9%(+6.30)#2,852 |
| 87. | 39459 | 11.2% | 7.4%(+3.80)#87 | 4.9%(+6.30)#2,858 |
| 88. | 38920 | 11.2% | 7.4%(+3.80)#88 | 4.9%(+6.30)#2,873 |
| 89. | 39365 | 11.1% | 7.4%(+3.70)#89 | 4.9%(+6.20)#2,897 |
| 90. | 38614 | 11.0% | 7.4%(+3.60)#90 | 4.9%(+6.10)#2,957 |
| 91. | 39218 | 10.8% | 7.4%(+3.40)#91 | 4.9%(+5.90)#3,076 |
| 92. | 38646 | 10.8% | 7.4%(+3.40)#92 | 4.9%(+5.90)#3,085 |
| 93. | 38621 | 10.8% | 7.4%(+3.40)#93 | 4.9%(+5.90)#3,088 |
| 94. | 39477 | 10.8% | 7.4%(+3.40)#94 | 4.9%(+5.90)#3,099 |
| 95. | 39730 | 10.6% | 7.4%(+3.20)#95 | 4.9%(+5.70)#3,180 |
| 96. | 38754 | 10.6% | 7.4%(+3.20)#96 | 4.9%(+5.70)#3,205 |
| 97. | 39301 | 10.4% | 7.4%(+3.00)#97 | 4.9%(+5.50)#3,295 |
| 98. | 38827 | 10.4% | 7.4%(+3.00)#98 | 4.9%(+5.50)#3,319 |
| 99. | 39338 | 10.4% | 7.4%(+3.00)#99 | 4.9%(+5.50)#3,322 |
| 100. | 38850 | 10.4% | 7.4%(+3.00)#100 | 4.9%(+5.50)#3,324 |
Common Questions
What are the Top 10 Zip Codes with the Highest Percentage of Households with Income Below $10,000 in Mississippi?
Top 10 Zip Codes with the Highest Percentage of Households with Income Below $10,000 in Mississippi are:
What zip code has the Highest Percentage of Households with Income Below $10,000 in Mississippi?
39217 has the Highest Percentage of Households with Income Below $10,000 in Mississippi with 100.0%.
What is the Percentage of Households with Income Below $10,000 in the State of Mississippi?
Percentage of Households with Income Below $10,000 in Mississippi is 7.4%.
What is the Percentage of Households with Income Below $10,000 in the United States?
Percentage of Households with Income Below $10,000 in the United States is 4.9%.