Simmesport, LA Map & Demographics
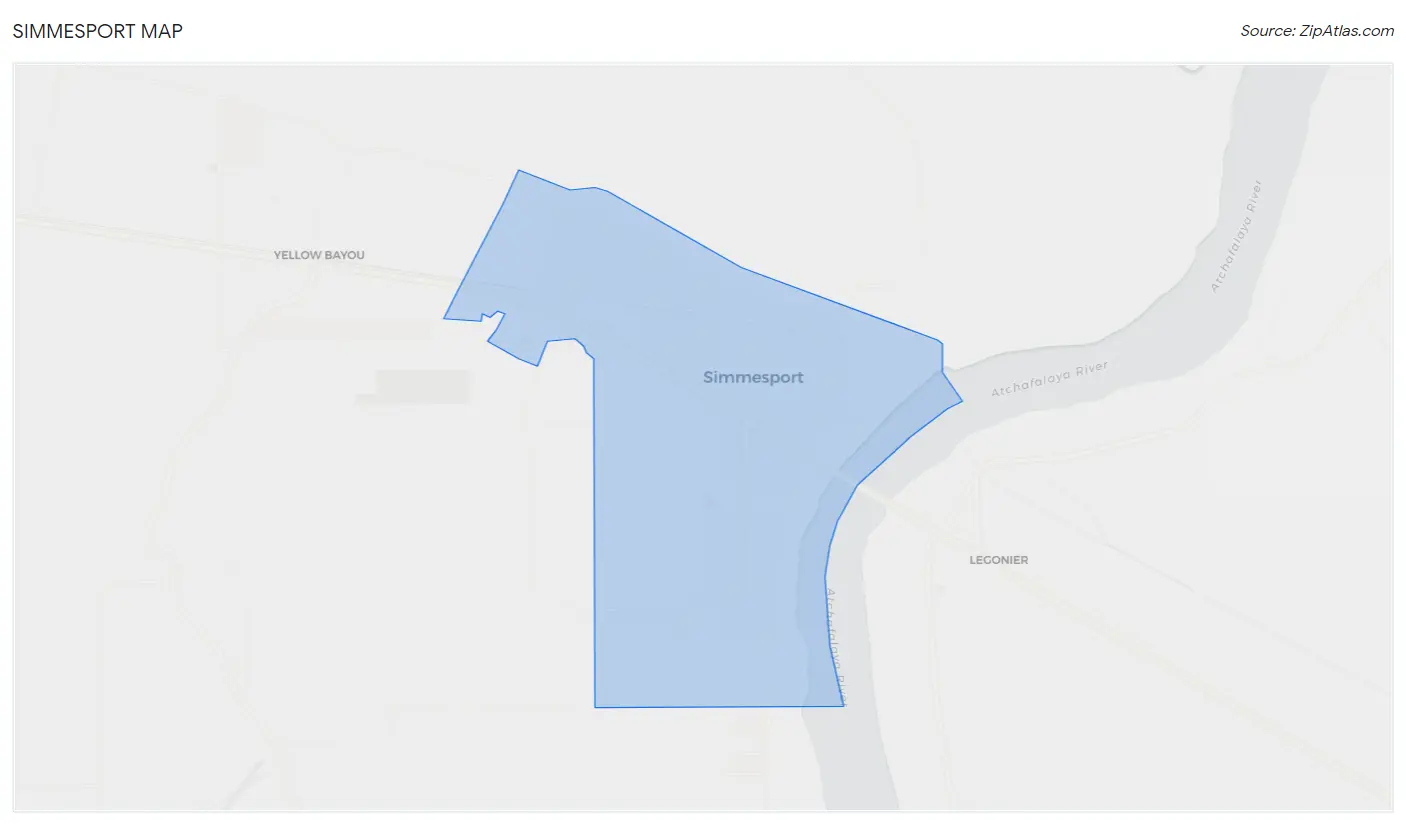
Simmesport Map
Simmesport Overview
$18,363
PER CAPITA INCOME
$29,706
AVG FAMILY INCOME
$19,592
AVG HOUSEHOLD INCOME
55.8%
WAGE / INCOME GAP [ % ]
44.2¢/ $1
WAGE / INCOME GAP [ $ ]
$15,809
FAMILY INCOME DEFICIT
0.62
INEQUALITY / GINI INDEX
1,308
TOTAL POPULATION
572
MALE POPULATION
736
FEMALE POPULATION
77.72
MALES / 100 FEMALES
128.67
FEMALES / 100 MALES
47.2
MEDIAN AGE
3.1
AVG FAMILY SIZE
2.1
AVG HOUSEHOLD SIZE
438
LABOR FORCE [ PEOPLE ]
42.5%
PERCENT IN LABOR FORCE
7.3%
UNEMPLOYMENT RATE
Simmesport Zip Codes
Simmesport Area Codes
Income in Simmesport
Income Overview in Simmesport
Per Capita Income in Simmesport is $18,363, while median incomes of families and households are $29,706 and $19,592 respectively.
| Characteristic | Number | Measure |
| Per Capita Income | 1,308 | $18,363 |
| Median Family Income | 302 | $29,706 |
| Mean Family Income | 302 | $57,966 |
| Median Household Income | 581 | $19,592 |
| Mean Household Income | 581 | $39,187 |
| Income Deficit | 302 | $15,809 |
| Wage / Income Gap (%) | 1,308 | 55.78% |
| Wage / Income Gap ($) | 1,308 | 44.22¢ per $1 |
| Gini / Inequality Index | 1,308 | 0.62 |
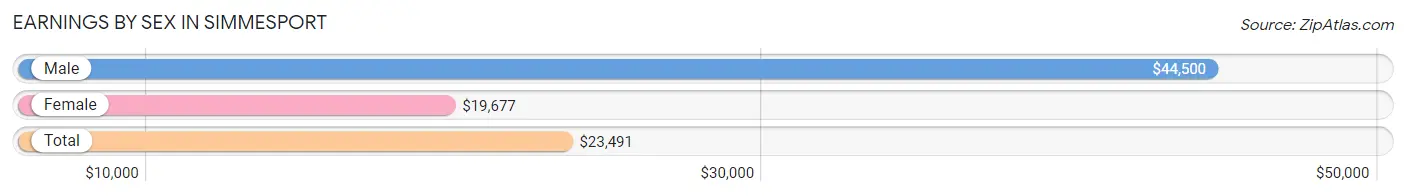
Earnings by Sex in Simmesport
Average Earnings in Simmesport are $23,491, $44,500 for men and $19,677 for women, a difference of 55.8%.
| Sex | Number | Average Earnings |
| Male | 128 (30.4%) | $44,500 |
| Female | 293 (69.6%) | $19,677 |
| Total | 421 (100.0%) | $23,491 |
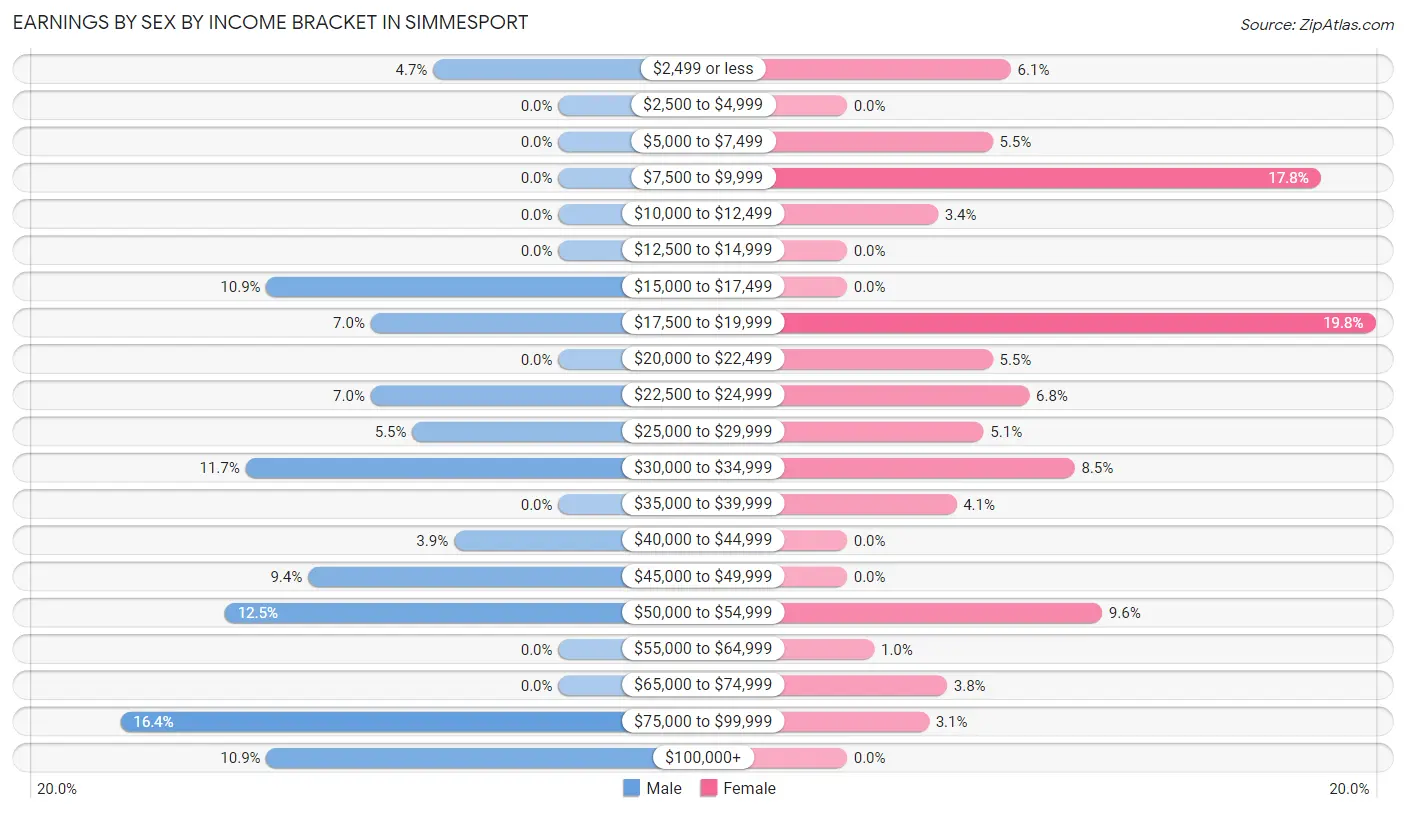
Earnings by Sex by Income Bracket in Simmesport
The most common earnings brackets in Simmesport are $75,000 to $99,999 for men (21 | 16.4%) and $17,500 to $19,999 for women (58 | 19.8%).
| Income | Male | Female |
| $2,499 or less | 6 (4.7%) | 18 (6.1%) |
| $2,500 to $4,999 | 0 (0.0%) | 0 (0.0%) |
| $5,000 to $7,499 | 0 (0.0%) | 16 (5.5%) |
| $7,500 to $9,999 | 0 (0.0%) | 52 (17.7%) |
| $10,000 to $12,499 | 0 (0.0%) | 10 (3.4%) |
| $12,500 to $14,999 | 0 (0.0%) | 0 (0.0%) |
| $15,000 to $17,499 | 14 (10.9%) | 0 (0.0%) |
| $17,500 to $19,999 | 9 (7.0%) | 58 (19.8%) |
| $20,000 to $22,499 | 0 (0.0%) | 16 (5.5%) |
| $22,500 to $24,999 | 9 (7.0%) | 20 (6.8%) |
| $25,000 to $29,999 | 7 (5.5%) | 15 (5.1%) |
| $30,000 to $34,999 | 15 (11.7%) | 25 (8.5%) |
| $35,000 to $39,999 | 0 (0.0%) | 12 (4.1%) |
| $40,000 to $44,999 | 5 (3.9%) | 0 (0.0%) |
| $45,000 to $49,999 | 12 (9.4%) | 0 (0.0%) |
| $50,000 to $54,999 | 16 (12.5%) | 28 (9.6%) |
| $55,000 to $64,999 | 0 (0.0%) | 3 (1.0%) |
| $65,000 to $74,999 | 0 (0.0%) | 11 (3.7%) |
| $75,000 to $99,999 | 21 (16.4%) | 9 (3.1%) |
| $100,000+ | 14 (10.9%) | 0 (0.0%) |
| Total | 128 (100.0%) | 293 (100.0%) |
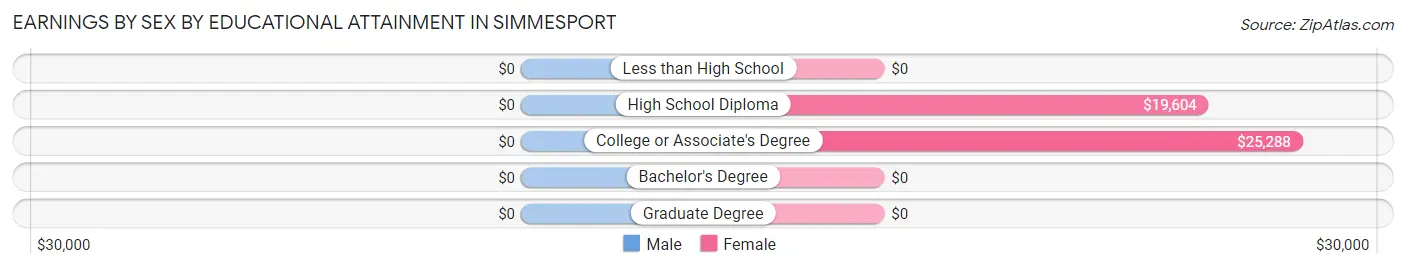
Earnings by Sex by Educational Attainment in Simmesport
| Educational Attainment | Male Income | Female Income |
| Less than High School | - | - |
| High School Diploma | - | - |
| College or Associate's Degree | - | - |
| Bachelor's Degree | - | - |
| Graduate Degree | - | - |
| Total | - | - |
Family Income in Simmesport
Family Income Brackets in Simmesport
According to the Simmesport family income data, there are 58 families falling into the less than $10,000 income range, which is the most common income bracket and makes up 19.2% of all families. Conversely, the $150,000 to $199,999 income bracket is the least frequent group with only 9 families (3.0%) belonging to this category.
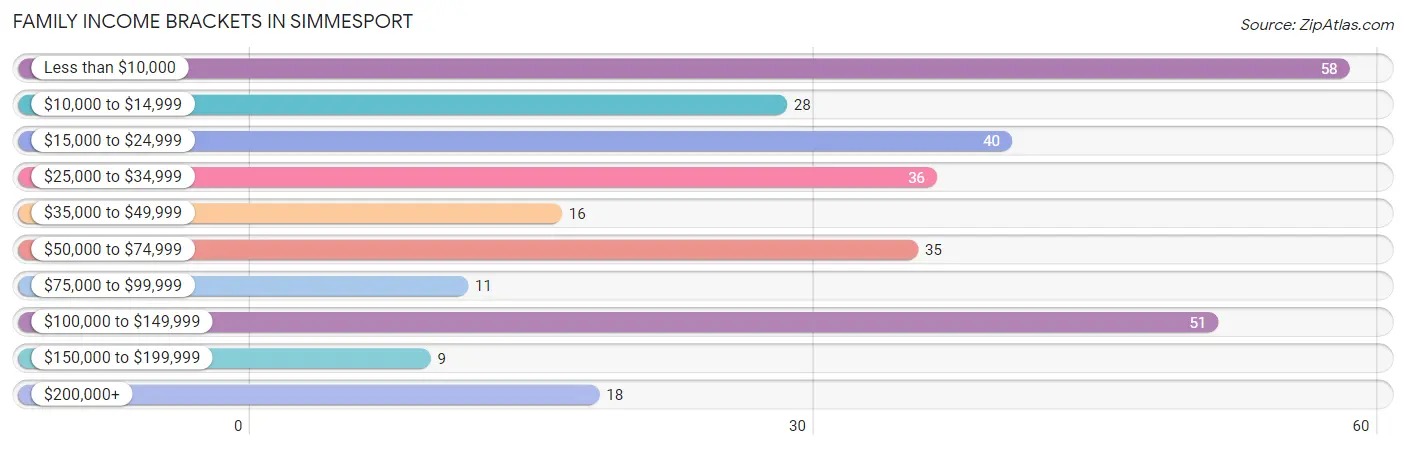
| Income Bracket | # Families | % Families |
| Less than $10,000 | 58 | 19.2% |
| $10,000 to $14,999 | 28 | 9.3% |
| $15,000 to $24,999 | 40 | 13.2% |
| $25,000 to $34,999 | 36 | 11.9% |
| $35,000 to $49,999 | 16 | 5.3% |
| $50,000 to $74,999 | 35 | 11.6% |
| $75,000 to $99,999 | 11 | 3.6% |
| $100,000 to $149,999 | 51 | 16.9% |
| $150,000 to $199,999 | 9 | 3.0% |
| $200,000+ | 18 | 6.0% |
Family Income by Famaliy Size in Simmesport
2-person families (179 | 59.3%) account for the highest median family income in Simmesport with $51,979 per family, while 2-person families (179 | 59.3%) have the highest median income of $25,990 per family member.
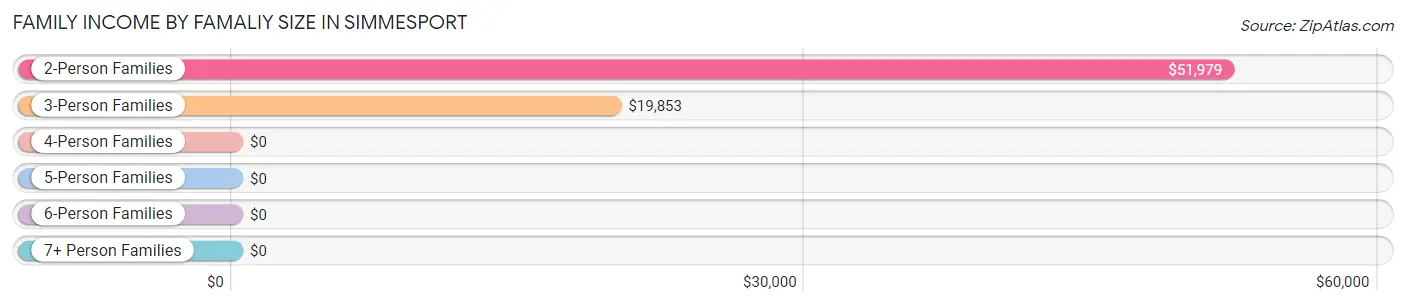
| Income Bracket | # Families | Median Income |
| 2-Person Families | 179 (59.3%) | $51,979 |
| 3-Person Families | 60 (19.9%) | $19,853 |
| 4-Person Families | 12 (4.0%) | $0 |
| 5-Person Families | 27 (8.9%) | $0 |
| 6-Person Families | 24 (8.0%) | $0 |
| 7+ Person Families | 0 (0.0%) | $0 |
| Total | 302 (100.0%) | $29,706 |
Family Income by Number of Earners in Simmesport
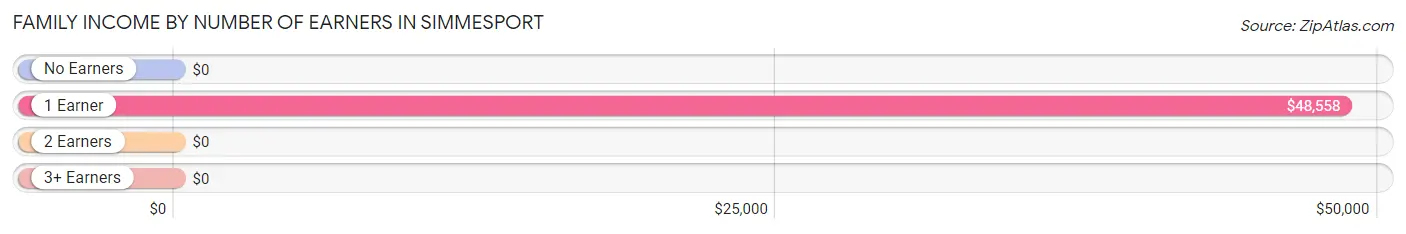
| Number of Earners | # Families | Median Income |
| No Earners | 76 (25.2%) | $0 |
| 1 Earner | 169 (56.0%) | $48,558 |
| 2 Earners | 57 (18.9%) | $0 |
| 3+ Earners | 0 (0.0%) | $0 |
| Total | 302 (100.0%) | $29,706 |
Household Income in Simmesport
Household Income Brackets in Simmesport
With 173 households falling in the category, the less than $10,000 income range is the most frequent in Simmesport, accounting for 29.8% of all households. In contrast, only 11 households (1.9%) fall into the $75,000 to $99,999 income bracket, making it the least populous group.
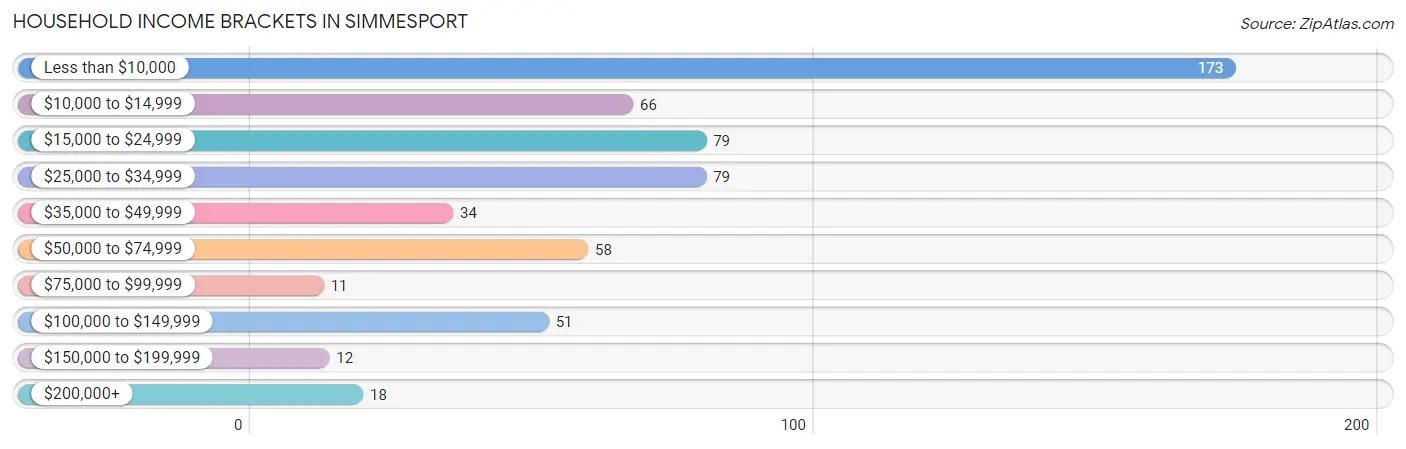
| Income Bracket | # Households | % Households |
| Less than $10,000 | 173 | 29.8% |
| $10,000 to $14,999 | 66 | 11.4% |
| $15,000 to $24,999 | 79 | 13.6% |
| $25,000 to $34,999 | 79 | 13.6% |
| $35,000 to $49,999 | 34 | 5.9% |
| $50,000 to $74,999 | 58 | 10.0% |
| $75,000 to $99,999 | 11 | 1.9% |
| $100,000 to $149,999 | 51 | 8.8% |
| $150,000 to $199,999 | 12 | 2.1% |
| $200,000+ | 18 | 3.1% |
Household Income by Householder Age in Simmesport
The median household income in Simmesport is $19,592, with the highest median household income of $38,214 found in the 65+ years age bracket for the primary householder. A total of 158 households (27.2%) fall into this category. Meanwhile, the 15 to 24 years age bracket for the primary householder has the lowest median household income of $0, with 49 households (8.4%) in this group.
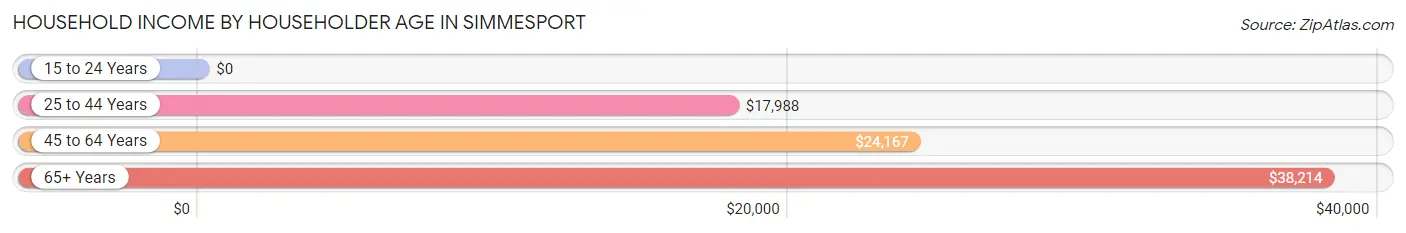
| Income Bracket | # Households | Median Income |
| 15 to 24 Years | 49 (8.4%) | $0 |
| 25 to 44 Years | 146 (25.1%) | $17,988 |
| 45 to 64 Years | 228 (39.2%) | $24,167 |
| 65+ Years | 158 (27.2%) | $38,214 |
| Total | 581 (100.0%) | $19,592 |
Poverty in Simmesport
Income Below Poverty by Sex and Age in Simmesport
With 50.7% poverty level for males and 50.7% for females among the residents of Simmesport, 16 and 17 year old males and under 5 year old females are the most vulnerable to poverty, with 7 males (100.0%) and 12 females (100.0%) in their respective age groups living below the poverty level.
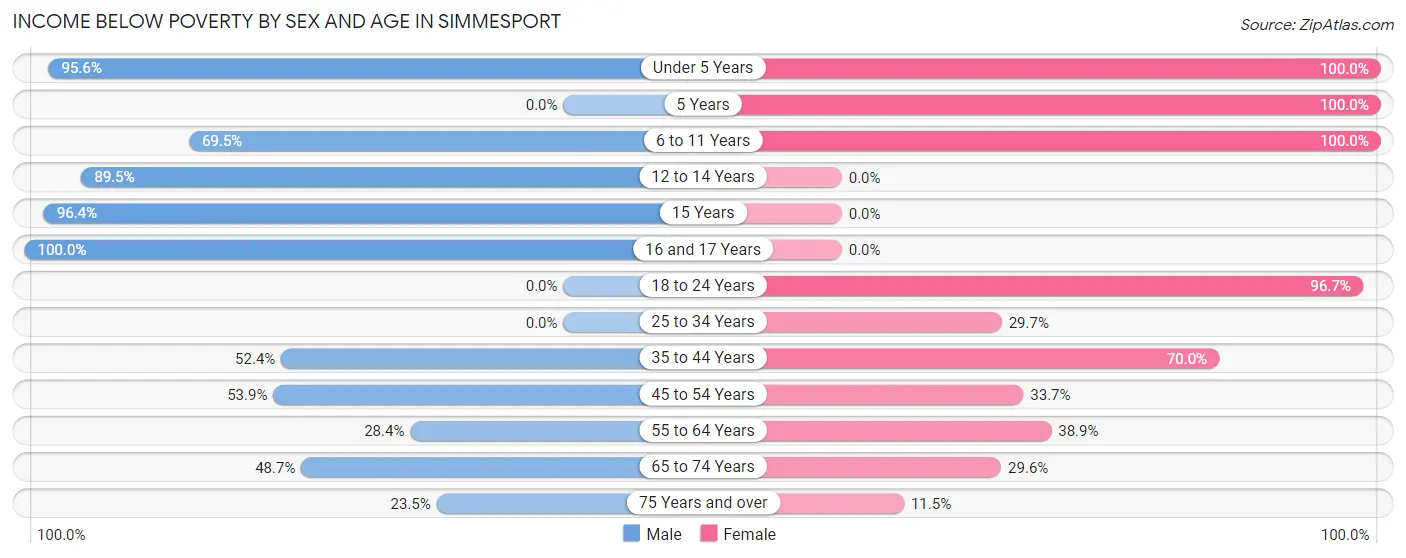
| Age Bracket | Male | Female |
| Under 5 Years | 43 (95.6%) | 12 (100.0%) |
| 5 Years | 0 (0.0%) | 12 (100.0%) |
| 6 to 11 Years | 41 (69.5%) | 69 (100.0%) |
| 12 to 14 Years | 34 (89.5%) | 0 (0.0%) |
| 15 Years | 27 (96.4%) | 0 (0.0%) |
| 16 and 17 Years | 7 (100.0%) | 0 (0.0%) |
| 18 to 24 Years | 0 (0.0%) | 58 (96.7%) |
| 25 to 34 Years | 0 (0.0%) | 19 (29.7%) |
| 35 to 44 Years | 33 (52.4%) | 56 (70.0%) |
| 45 to 54 Years | 14 (53.8%) | 31 (33.7%) |
| 55 to 64 Years | 27 (28.4%) | 63 (38.9%) |
| 65 to 74 Years | 54 (48.6%) | 21 (29.6%) |
| 75 Years and over | 4 (23.5%) | 3 (11.5%) |
| Total | 284 (50.7%) | 344 (50.7%) |
Income Above Poverty by Sex and Age in Simmesport
According to the poverty statistics in Simmesport, males aged 18 to 24 years and females aged 12 to 14 years are the age groups that are most secure financially, with 100.0% of males and 100.0% of females in these age groups living above the poverty line.
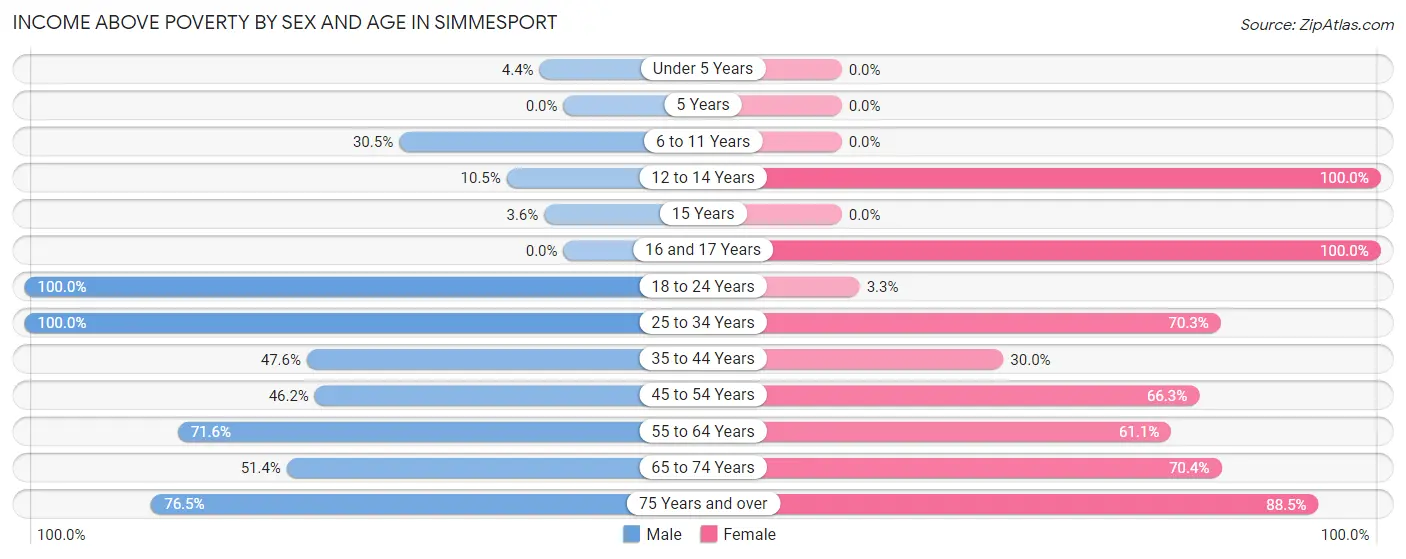
| Age Bracket | Male | Female |
| Under 5 Years | 2 (4.4%) | 0 (0.0%) |
| 5 Years | 0 (0.0%) | 0 (0.0%) |
| 6 to 11 Years | 18 (30.5%) | 0 (0.0%) |
| 12 to 14 Years | 4 (10.5%) | 14 (100.0%) |
| 15 Years | 1 (3.6%) | 0 (0.0%) |
| 16 and 17 Years | 0 (0.0%) | 16 (100.0%) |
| 18 to 24 Years | 66 (100.0%) | 2 (3.3%) |
| 25 to 34 Years | 5 (100.0%) | 45 (70.3%) |
| 35 to 44 Years | 30 (47.6%) | 24 (30.0%) |
| 45 to 54 Years | 12 (46.2%) | 61 (66.3%) |
| 55 to 64 Years | 68 (71.6%) | 99 (61.1%) |
| 65 to 74 Years | 57 (51.3%) | 50 (70.4%) |
| 75 Years and over | 13 (76.5%) | 23 (88.5%) |
| Total | 276 (49.3%) | 334 (49.3%) |
Income Below Poverty Among Married-Couple Families in Simmesport
The poverty statistics for married-couple families in Simmesport show that 20.3% or 41 of the total 202 families live below the poverty line. Families with 3 or 4 children have the highest poverty rate of 48.0%, comprising of 12 families. On the other hand, families with 1 or 2 children have the lowest poverty rate of 0.0%, which includes 0 families.
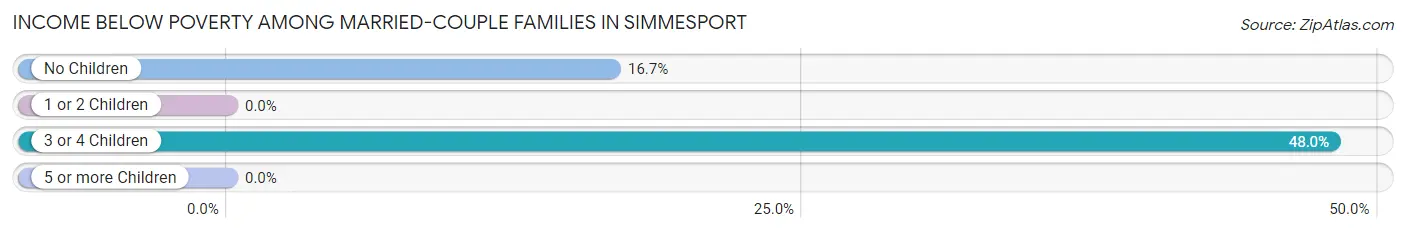
| Children | Above Poverty | Below Poverty |
| No Children | 145 (83.3%) | 29 (16.7%) |
| 1 or 2 Children | 3 (100.0%) | 0 (0.0%) |
| 3 or 4 Children | 13 (52.0%) | 12 (48.0%) |
| 5 or more Children | 0 (0.0%) | 0 (0.0%) |
| Total | 161 (79.7%) | 41 (20.3%) |
Income Below Poverty Among Single-Parent Households in Simmesport
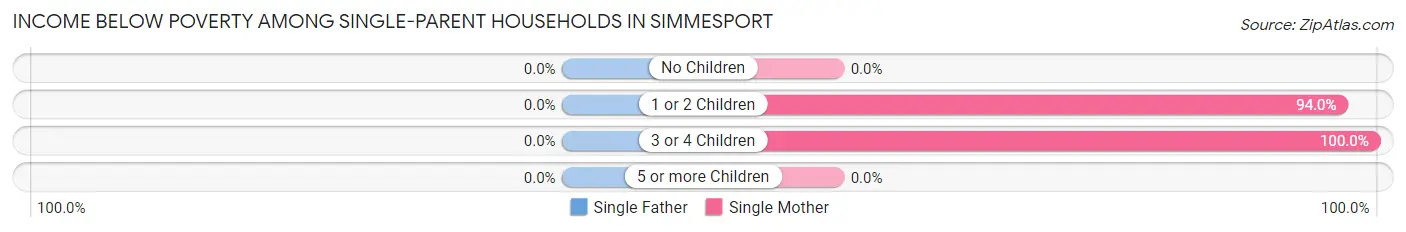
| Children | Single Father | Single Mother |
| No Children | 0 (0.0%) | 0 (0.0%) |
| 1 or 2 Children | 0 (0.0%) | 47 (94.0%) |
| 3 or 4 Children | 0 (0.0%) | 38 (100.0%) |
| 5 or more Children | 0 (0.0%) | 0 (0.0%) |
| Total | 0 (0.0%) | 85 (85.0%) |
Income Below Poverty Among Married-Couple vs Single-Parent Households in Simmesport
The poverty data for Simmesport shows that 41 of the married-couple family households (20.3%) and 85 of the single-parent households (85.0%) are living below the poverty level. Within the married-couple family households, those with 3 or 4 children have the highest poverty rate, with 12 households (48.0%) falling below the poverty line. Among the single-parent households, those with 3 or 4 children have the highest poverty rate, with 38 household (100.0%) living below poverty.
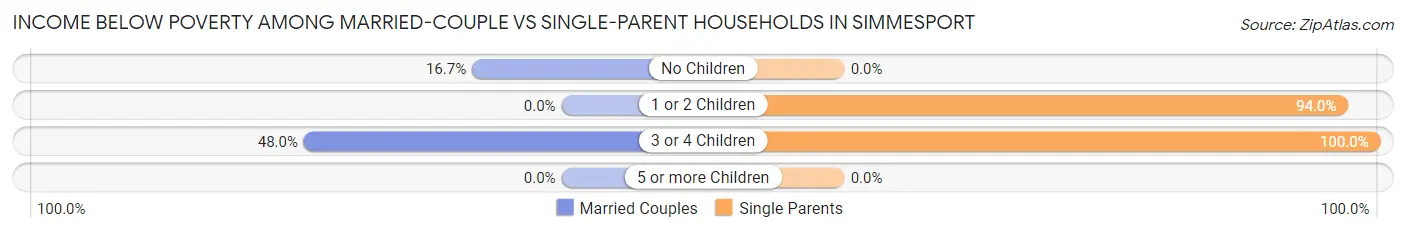
| Children | Married-Couple Families | Single-Parent Households |
| No Children | 29 (16.7%) | 0 (0.0%) |
| 1 or 2 Children | 0 (0.0%) | 47 (94.0%) |
| 3 or 4 Children | 12 (48.0%) | 38 (100.0%) |
| 5 or more Children | 0 (0.0%) | 0 (0.0%) |
| Total | 41 (20.3%) | 85 (85.0%) |
Race in Simmesport
The most populous races in Simmesport are Black / African American (674 | 51.5%), White / Caucasian (584 | 44.7%), and Two or more Races (50 | 3.8%).
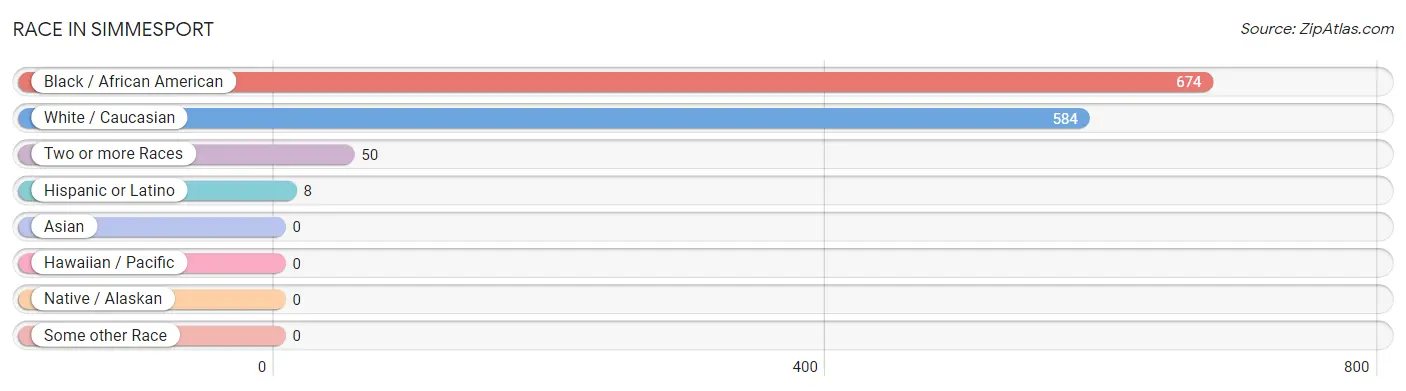
| Race | # Population | % Population |
| Asian | 0 | 0.0% |
| Black / African American | 674 | 51.5% |
| Hawaiian / Pacific | 0 | 0.0% |
| Hispanic or Latino | 8 | 0.6% |
| Native / Alaskan | 0 | 0.0% |
| White / Caucasian | 584 | 44.7% |
| Two or more Races | 50 | 3.8% |
| Some other Race | 0 | 0.0% |
| Total | 1,308 | 100.0% |
Ancestry in Simmesport
The most populous ancestries reported in Simmesport are American (341 | 26.1%), French (225 | 17.2%), German (75 | 5.7%), French Canadian (68 | 5.2%), and English (38 | 2.9%), together accounting for 57.1% of all Simmesport residents.
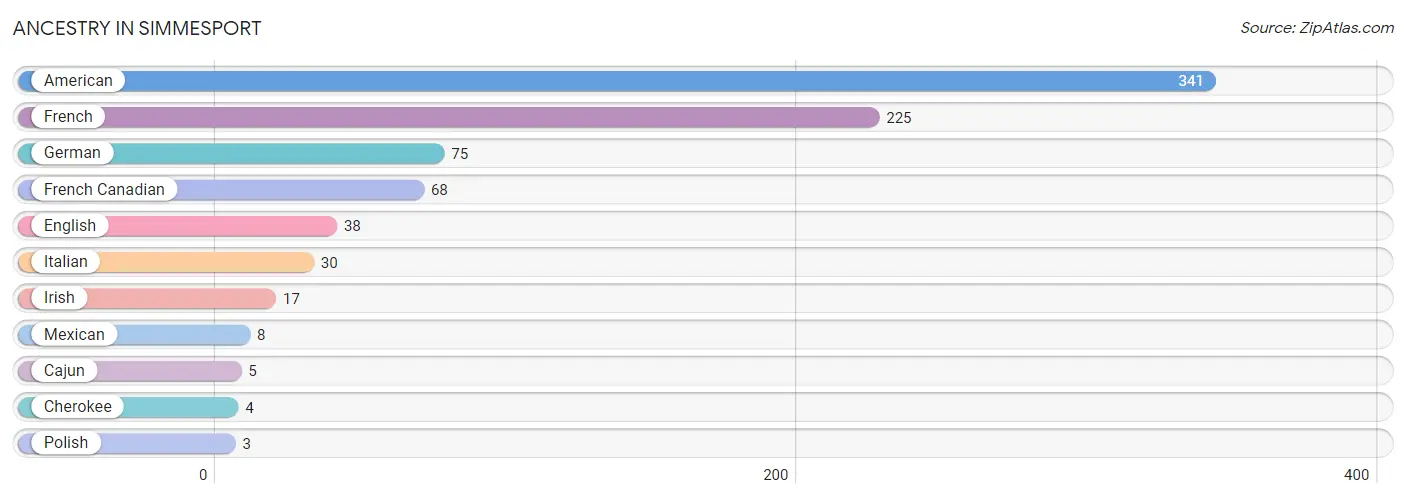
| Ancestry | # Population | % Population |
| American | 341 | 26.1% |
| Cajun | 5 | 0.4% |
| Cherokee | 4 | 0.3% |
| English | 38 | 2.9% |
| French | 225 | 17.2% |
| French Canadian | 68 | 5.2% |
| German | 75 | 5.7% |
| Irish | 17 | 1.3% |
| Italian | 30 | 2.3% |
| Mexican | 8 | 0.6% |
| Polish | 3 | 0.2% | View All 11 Rows |
Immigrants in Simmesport

| Immigration Origin | # Population | % Population | View All 0 Rows |
Sex and Age in Simmesport
Sex and Age in Simmesport
The most populous age groups in Simmesport are 70 to 74 Years (78 | 13.6%) for men and 55 to 59 Years (101 | 13.7%) for women.
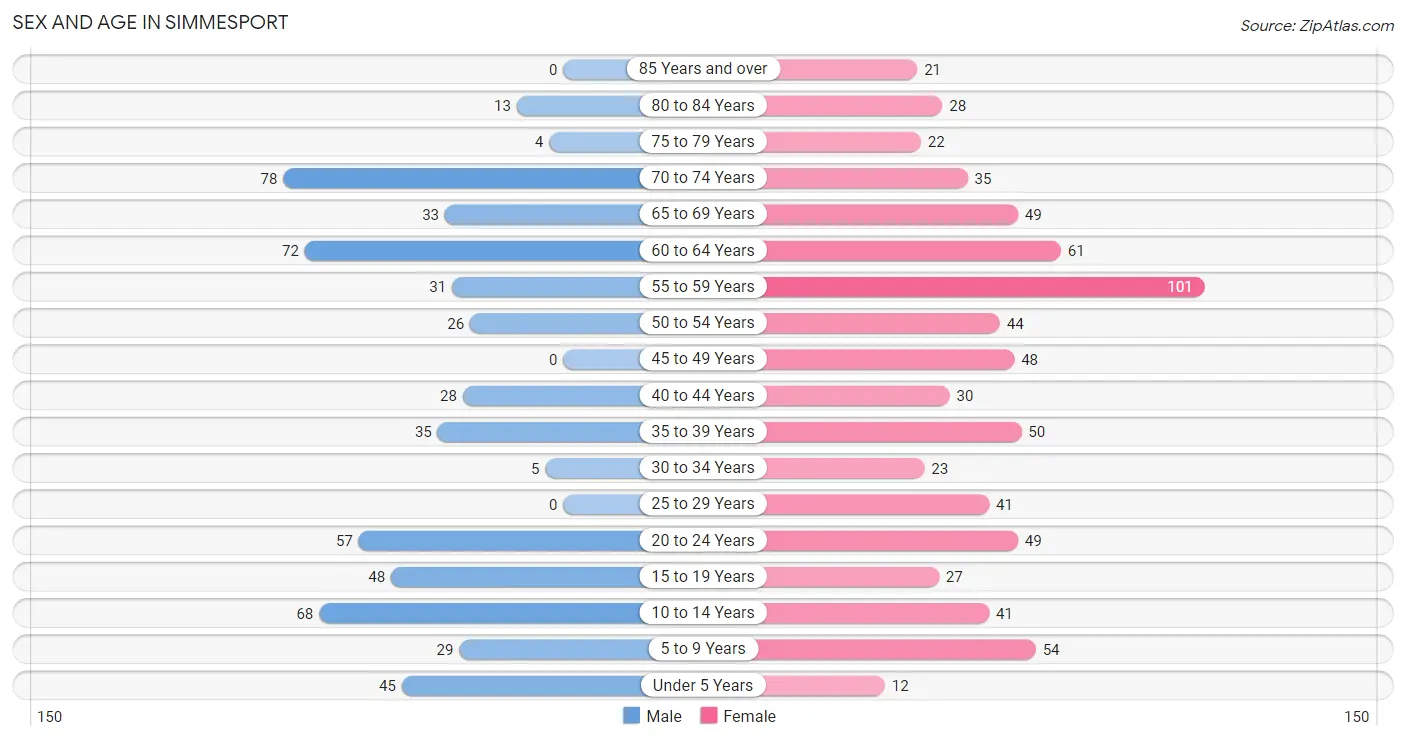
| Age Bracket | Male | Female |
| Under 5 Years | 45 (7.9%) | 12 (1.6%) |
| 5 to 9 Years | 29 (5.1%) | 54 (7.3%) |
| 10 to 14 Years | 68 (11.9%) | 41 (5.6%) |
| 15 to 19 Years | 48 (8.4%) | 27 (3.7%) |
| 20 to 24 Years | 57 (10.0%) | 49 (6.7%) |
| 25 to 29 Years | 0 (0.0%) | 41 (5.6%) |
| 30 to 34 Years | 5 (0.9%) | 23 (3.1%) |
| 35 to 39 Years | 35 (6.1%) | 50 (6.8%) |
| 40 to 44 Years | 28 (4.9%) | 30 (4.1%) |
| 45 to 49 Years | 0 (0.0%) | 48 (6.5%) |
| 50 to 54 Years | 26 (4.5%) | 44 (6.0%) |
| 55 to 59 Years | 31 (5.4%) | 101 (13.7%) |
| 60 to 64 Years | 72 (12.6%) | 61 (8.3%) |
| 65 to 69 Years | 33 (5.8%) | 49 (6.7%) |
| 70 to 74 Years | 78 (13.6%) | 35 (4.8%) |
| 75 to 79 Years | 4 (0.7%) | 22 (3.0%) |
| 80 to 84 Years | 13 (2.3%) | 28 (3.8%) |
| 85 Years and over | 0 (0.0%) | 21 (2.9%) |
| Total | 572 (100.0%) | 736 (100.0%) |
Families and Households in Simmesport
Median Family Size in Simmesport
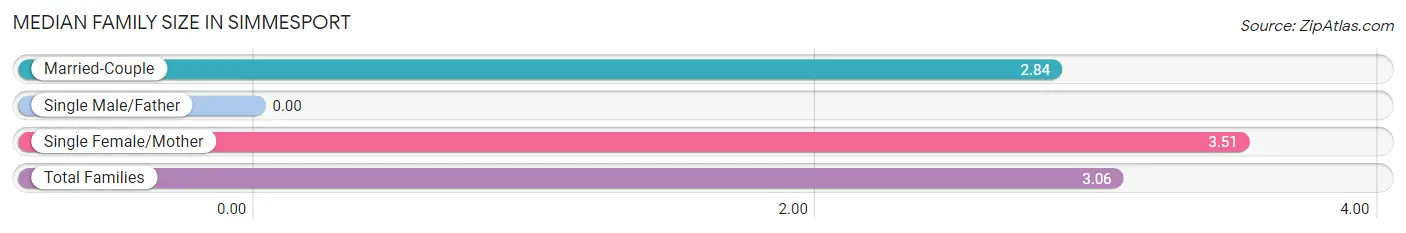
| Family Type | # Families | Family Size |
| Married-Couple | 202 (66.9%) | 2.84 |
| Single Male/Father | 0 (0.0%) | - |
| Single Female/Mother | 100 (33.1%) | 3.51 |
| Total Families | 302 (100.0%) | 3.06 |
Median Household Size in Simmesport
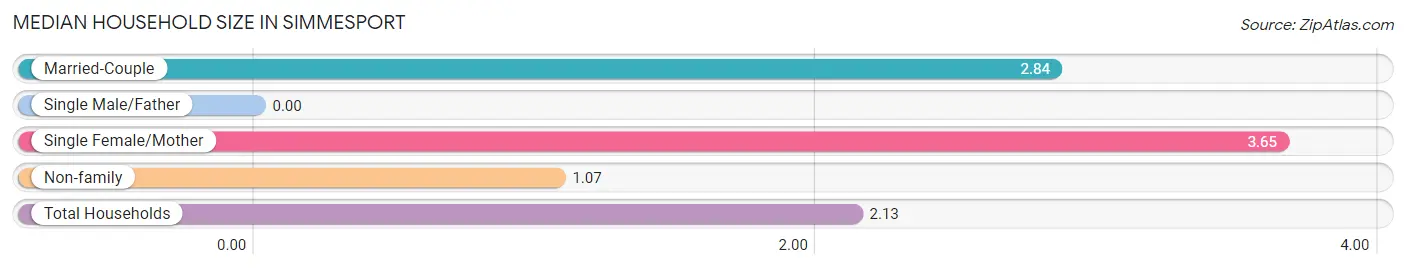
| Household Type | # Households | Household Size |
| Married-Couple | 202 (34.8%) | 2.84 |
| Single Male/Father | 0 (0.0%) | - |
| Single Female/Mother | 100 (17.2%) | 3.65 |
| Non-family | 279 (48.0%) | 1.07 |
| Total Households | 581 (100.0%) | 2.13 |
Household Size by Marriage Status in Simmesport
Out of a total of 581 households in Simmesport, 302 (52.0%) are family households, while 279 (48.0%) are nonfamily households. The most numerous type of family households are 2-person households, comprising 179, and the most common type of nonfamily households are 1-person households, comprising 260.
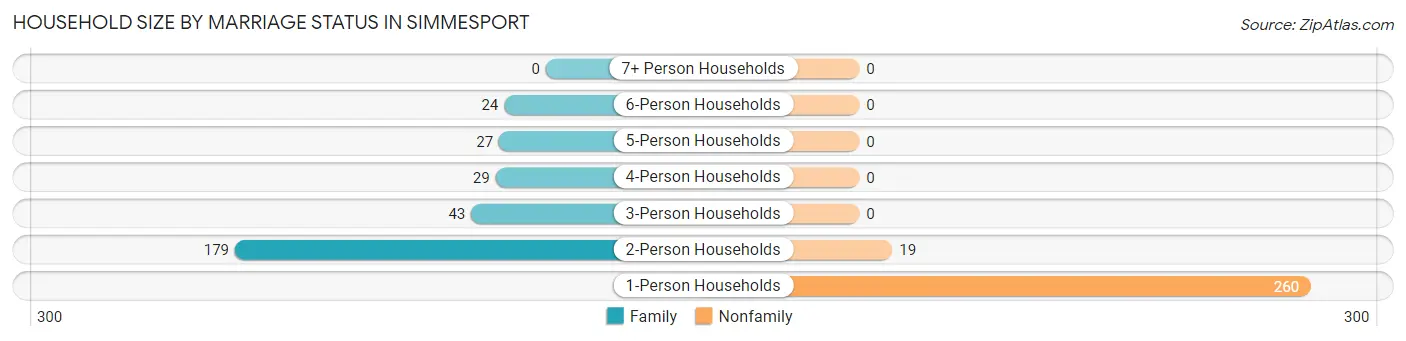
| Household Size | Family Households | Nonfamily Households |
| 1-Person Households | - | 260 (44.8%) |
| 2-Person Households | 179 (30.8%) | 19 (3.3%) |
| 3-Person Households | 43 (7.4%) | 0 (0.0%) |
| 4-Person Households | 29 (5.0%) | 0 (0.0%) |
| 5-Person Households | 27 (4.6%) | 0 (0.0%) |
| 6-Person Households | 24 (4.1%) | 0 (0.0%) |
| 7+ Person Households | 0 (0.0%) | 0 (0.0%) |
| Total | 302 (52.0%) | 279 (48.0%) |
Female Fertility in Simmesport
Fertility by Age in Simmesport
Average fertility rate in Simmesport is 78.0 births per 1,000 women. Women in the age bracket of 20 to 34 years have the highest fertility rate with 186.0 births per 1,000 women. Women in the age bracket of 20 to 34 years acount for 100.0% of all women with births.
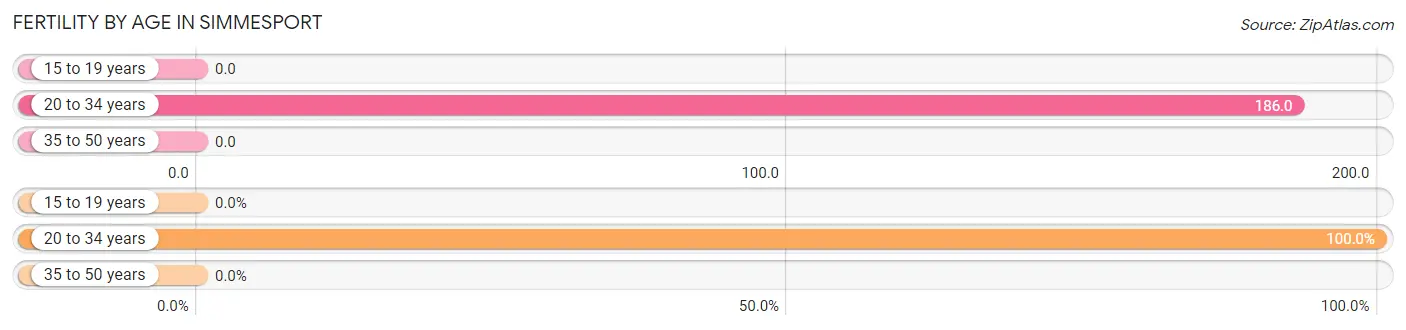
| Age Bracket | Women with Births | Births / 1,000 Women |
| 15 to 19 years | 0 (0.0%) | 0.0 |
| 20 to 34 years | 21 (100.0%) | 186.0 |
| 35 to 50 years | 0 (0.0%) | 0.0 |
| Total | 21 (100.0%) | 78.0 |
Fertility by Age by Marriage Status in Simmesport
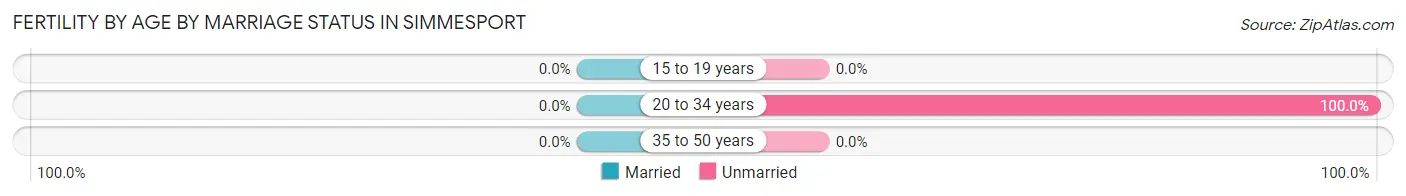
| Age Bracket | Married | Unmarried |
| 15 to 19 years | 0 (0.0%) | 0 (0.0%) |
| 20 to 34 years | 0 (0.0%) | 21 (100.0%) |
| 35 to 50 years | 0 (0.0%) | 0 (0.0%) |
| Total | 0 (0.0%) | 21 (100.0%) |
Fertility by Education in Simmesport
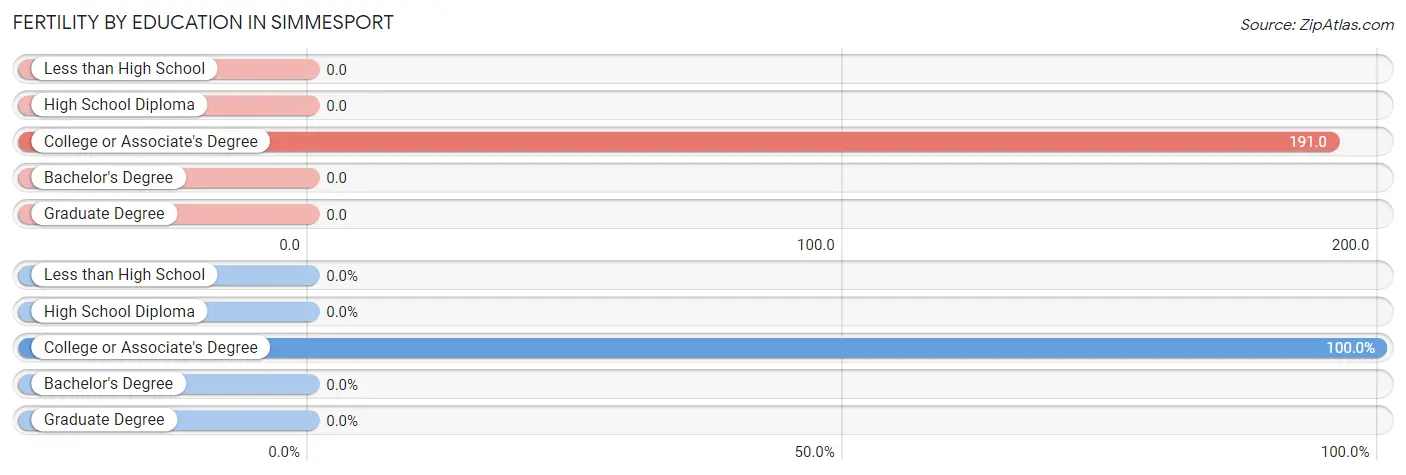
| Educational Attainment | Women with Births | Births / 1,000 Women |
| Less than High School | 0 (0.0%) | 0.0 |
| High School Diploma | 0 (0.0%) | 0.0 |
| College or Associate's Degree | 21 (100.0%) | 191.0 |
| Bachelor's Degree | 0 (0.0%) | 0.0 |
| Graduate Degree | 0 (0.0%) | 0.0 |
| Total | 21 (100.0%) | 78.0 |
Fertility by Education by Marriage Status in Simmesport
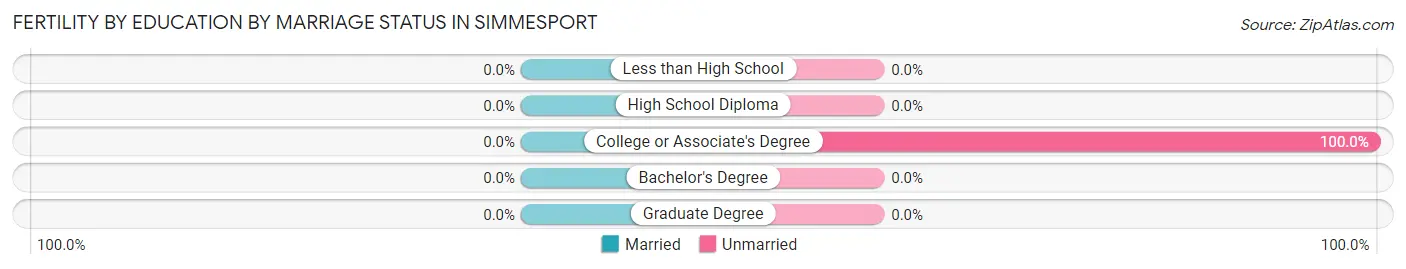
| Educational Attainment | Married | Unmarried |
| Less than High School | 0 (0.0%) | 0 (0.0%) |
| High School Diploma | 0 (0.0%) | 0 (0.0%) |
| College or Associate's Degree | 0 (0.0%) | 21 (100.0%) |
| Bachelor's Degree | 0 (0.0%) | 0 (0.0%) |
| Graduate Degree | 0 (0.0%) | 0 (0.0%) |
| Total | 0 (0.0%) | 21 (100.0%) |
Employment Characteristics in Simmesport
Employment by Class of Employer in Simmesport
Among the 403 employed individuals in Simmesport, private company employees (256 | 63.5%), self-employed (not incorporated) (35 | 8.7%), and local government employees (31 | 7.7%) make up the most common classes of employment.
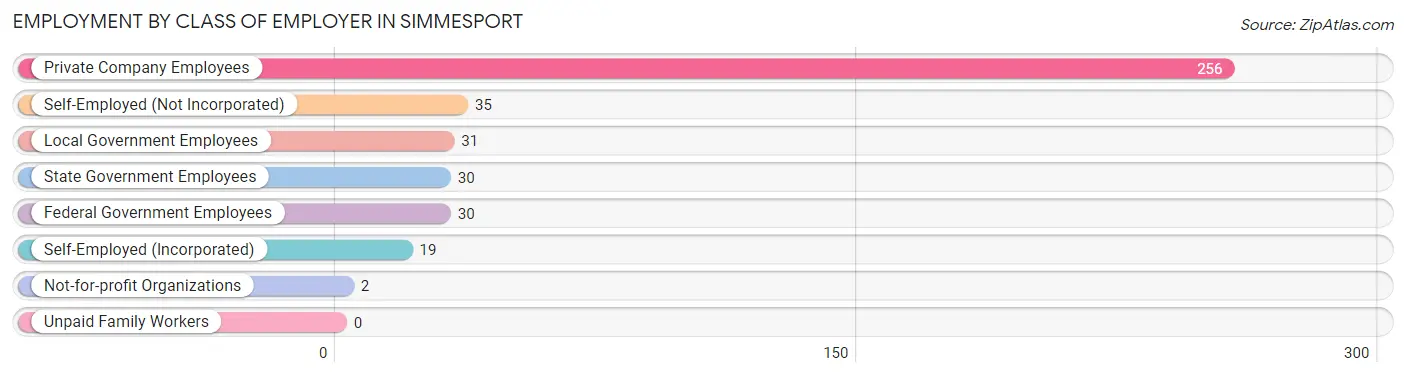
| Employer Class | # Employees | % Employees |
| Private Company Employees | 256 | 63.5% |
| Self-Employed (Incorporated) | 19 | 4.7% |
| Self-Employed (Not Incorporated) | 35 | 8.7% |
| Not-for-profit Organizations | 2 | 0.5% |
| Local Government Employees | 31 | 7.7% |
| State Government Employees | 30 | 7.4% |
| Federal Government Employees | 30 | 7.4% |
| Unpaid Family Workers | 0 | 0.0% |
| Total | 403 | 100.0% |
Employment Status by Age in Simmesport
According to the labor force statistics for Simmesport, out of the total population over 16 years of age (1,031), 42.5% or 438 individuals are in the labor force, with 7.3% or 32 of them unemployed. The age group with the highest labor force participation rate is 25 to 29 years, with 100.0% or 41 individuals in the labor force. Within the labor force, the 30 to 34 years age range has the highest percentage of unemployed individuals, with 45.0% or 9 of them being unemployed.
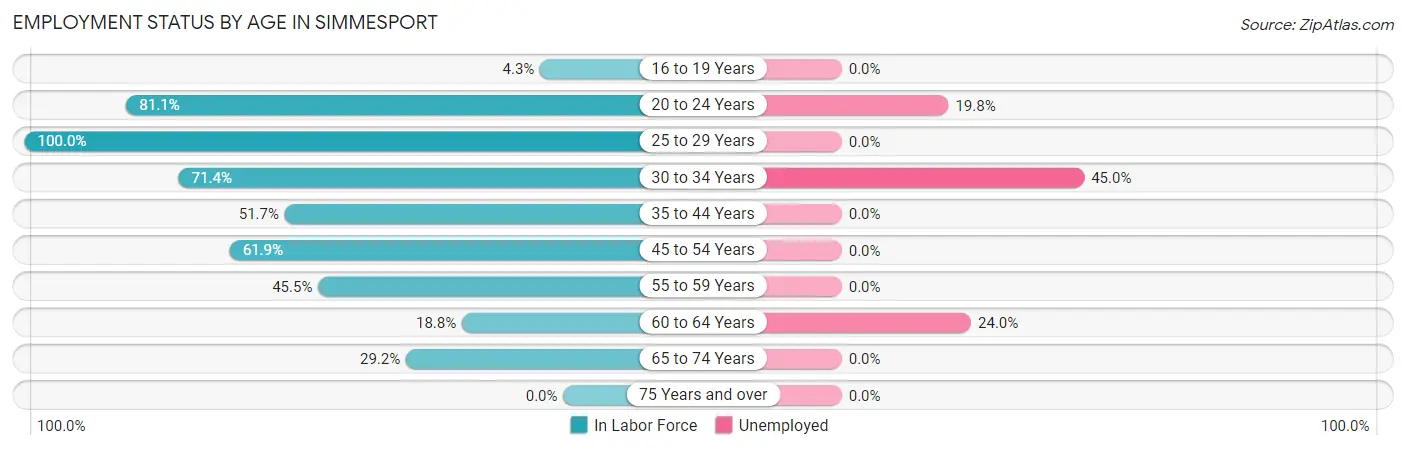
| Age Bracket | In Labor Force | Unemployed |
| 16 to 19 Years | 2 (4.3%) | 0 (0.0%) |
| 20 to 24 Years | 86 (81.1%) | 17 (19.8%) |
| 25 to 29 Years | 41 (100.0%) | 0 (0.0%) |
| 30 to 34 Years | 20 (71.4%) | 9 (45.0%) |
| 35 to 44 Years | 74 (51.7%) | 0 (0.0%) |
| 45 to 54 Years | 73 (61.9%) | 0 (0.0%) |
| 55 to 59 Years | 60 (45.5%) | 0 (0.0%) |
| 60 to 64 Years | 25 (18.8%) | 6 (24.0%) |
| 65 to 74 Years | 57 (29.2%) | 0 (0.0%) |
| 75 Years and over | 0 (0.0%) | 0 (0.0%) |
| Total | 438 (42.5%) | 32 (7.3%) |
Employment Status by Educational Attainment in Simmesport
According to labor force statistics for Simmesport, 49.2% of individuals (293) out of the total population between 25 and 64 years of age (595) are in the labor force, with 5.1% or 15 of them being unemployed. The group with the highest labor force participation rate are those with the educational attainment of college / associate degree, with 76.3% or 90 individuals in the labor force. Within the labor force, individuals with less than high school education have the highest percentage of unemployment, with 8.2% or 6 of them being unemployed.
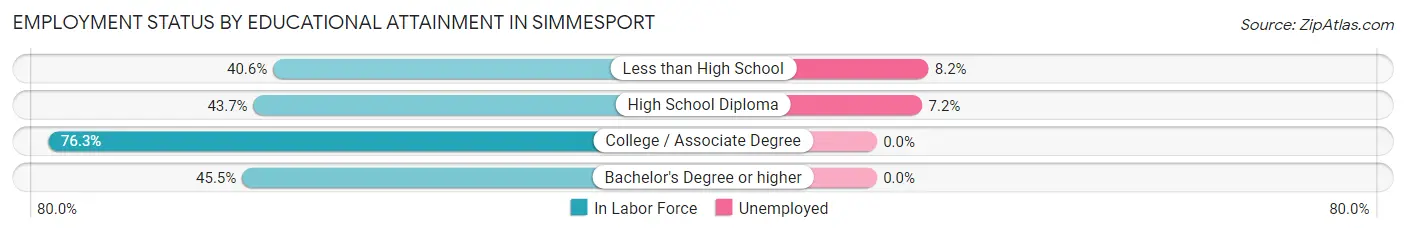
| Educational Attainment | In Labor Force | Unemployed |
| Less than High School | 73 (40.6%) | 15 (8.2%) |
| High School Diploma | 125 (43.7%) | 21 (7.2%) |
| College / Associate Degree | 90 (76.3%) | 0 (0.0%) |
| Bachelor's Degree or higher | 5 (45.5%) | 0 (0.0%) |
| Total | 293 (49.2%) | 30 (5.1%) |
Employment Occupations by Sex in Simmesport
Management, Business, Science and Arts Occupations
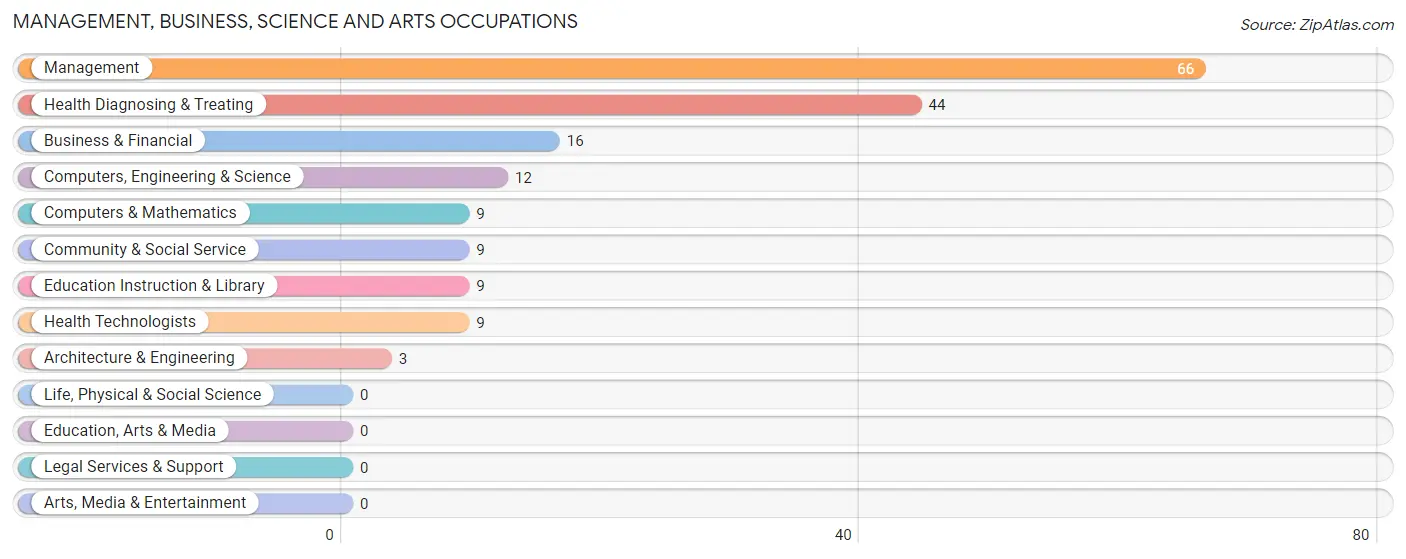
The most common Management, Business, Science and Arts occupations in Simmesport are Management (66 | 16.3%), Health Diagnosing & Treating (44 | 10.8%), Business & Financial (16 | 3.9%), Computers, Engineering & Science (12 | 3.0%), and Computers & Mathematics (9 | 2.2%).
Management, Business, Science and Arts Occupations by Sex
Within the Management, Business, Science and Arts occupations in Simmesport, the most male-oriented occupations are Business & Financial (100.0%), Architecture & Engineering (100.0%), and Management (54.5%), while the most female-oriented occupations are Computers & Mathematics (100.0%), Community & Social Service (100.0%), and Education Instruction & Library (100.0%).
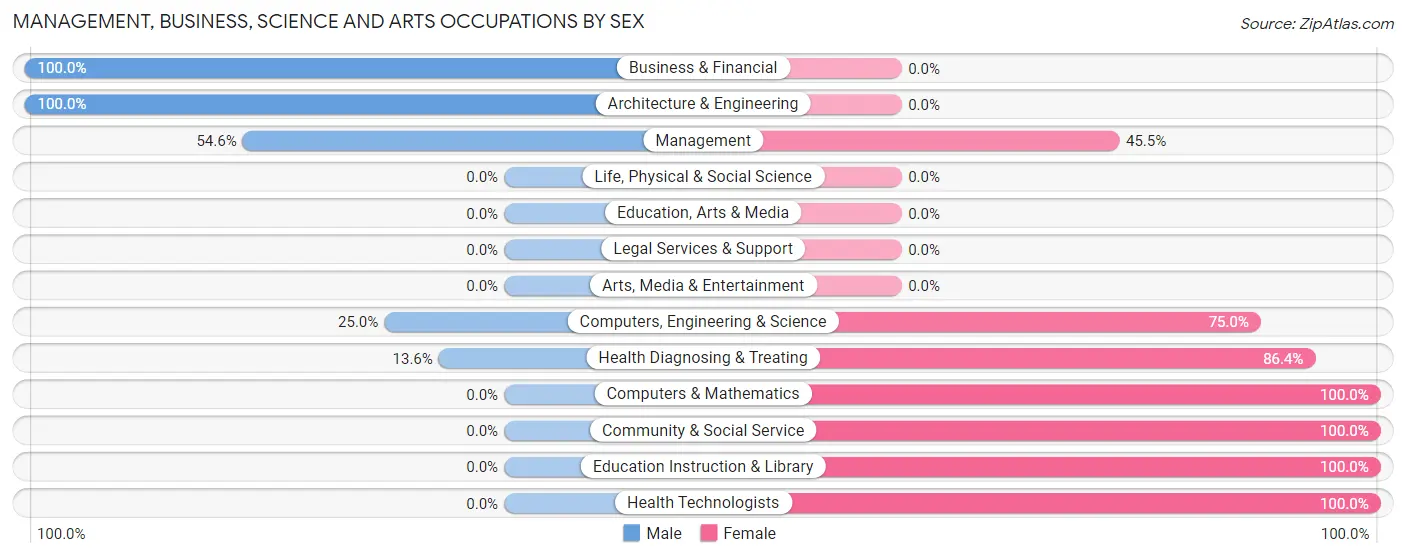
| Occupation | Male | Female |
| Management | 36 (54.5%) | 30 (45.5%) |
| Business & Financial | 16 (100.0%) | 0 (0.0%) |
| Computers, Engineering & Science | 3 (25.0%) | 9 (75.0%) |
| Computers & Mathematics | 0 (0.0%) | 9 (100.0%) |
| Architecture & Engineering | 3 (100.0%) | 0 (0.0%) |
| Life, Physical & Social Science | 0 (0.0%) | 0 (0.0%) |
| Community & Social Service | 0 (0.0%) | 9 (100.0%) |
| Education, Arts & Media | 0 (0.0%) | 0 (0.0%) |
| Legal Services & Support | 0 (0.0%) | 0 (0.0%) |
| Education Instruction & Library | 0 (0.0%) | 9 (100.0%) |
| Arts, Media & Entertainment | 0 (0.0%) | 0 (0.0%) |
| Health Diagnosing & Treating | 6 (13.6%) | 38 (86.4%) |
| Health Technologists | 0 (0.0%) | 9 (100.0%) |
| Total (Category) | 61 (41.5%) | 86 (58.5%) |
| Total (Overall) | 122 (30.0%) | 284 (70.0%) |
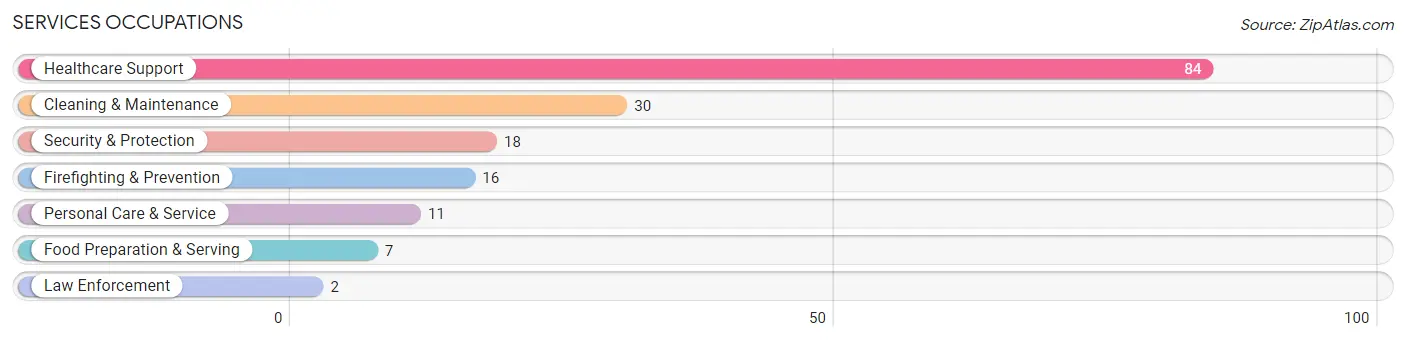
Services Occupations
The most common Services occupations in Simmesport are Healthcare Support (84 | 20.7%), Cleaning & Maintenance (30 | 7.4%), Security & Protection (18 | 4.4%), Firefighting & Prevention (16 | 3.9%), and Personal Care & Service (11 | 2.7%).
Services Occupations by Sex
Within the Services occupations in Simmesport, the most male-oriented occupations are Law Enforcement (100.0%), and Security & Protection (11.1%), while the most female-oriented occupations are Healthcare Support (100.0%), Firefighting & Prevention (100.0%), and Food Preparation & Serving (100.0%).
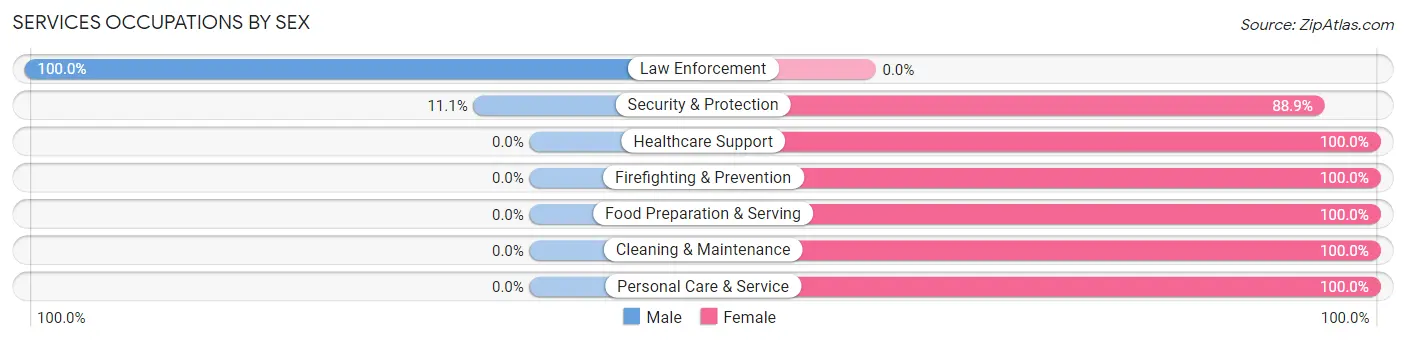
| Occupation | Male | Female |
| Healthcare Support | 0 (0.0%) | 84 (100.0%) |
| Security & Protection | 2 (11.1%) | 16 (88.9%) |
| Firefighting & Prevention | 0 (0.0%) | 16 (100.0%) |
| Law Enforcement | 2 (100.0%) | 0 (0.0%) |
| Food Preparation & Serving | 0 (0.0%) | 7 (100.0%) |
| Cleaning & Maintenance | 0 (0.0%) | 30 (100.0%) |
| Personal Care & Service | 0 (0.0%) | 11 (100.0%) |
| Total (Category) | 2 (1.3%) | 148 (98.7%) |
| Total (Overall) | 122 (30.0%) | 284 (70.0%) |
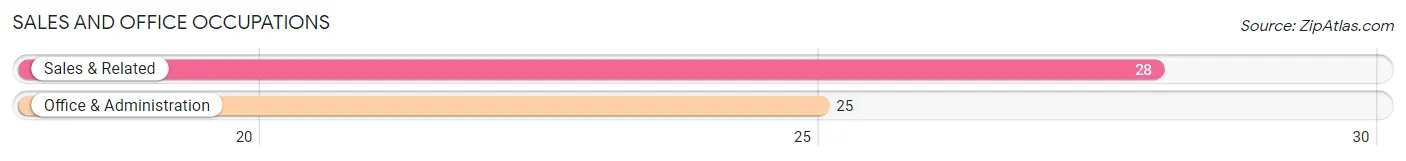
Sales and Office Occupations
The most common Sales and Office occupations in Simmesport are Sales & Related (28 | 6.9%), and Office & Administration (25 | 6.2%).
Sales and Office Occupations by Sex
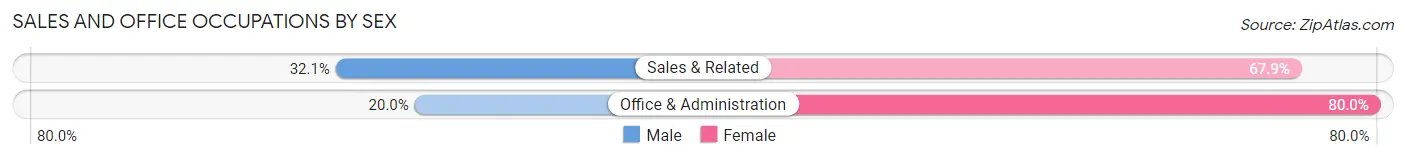
| Occupation | Male | Female |
| Sales & Related | 9 (32.1%) | 19 (67.9%) |
| Office & Administration | 5 (20.0%) | 20 (80.0%) |
| Total (Category) | 14 (26.4%) | 39 (73.6%) |
| Total (Overall) | 122 (30.0%) | 284 (70.0%) |
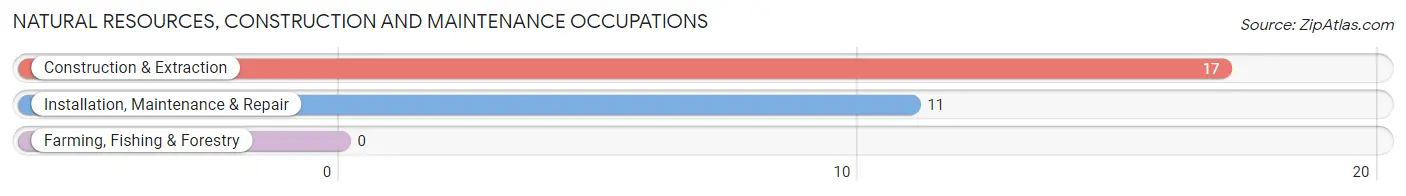
Natural Resources, Construction and Maintenance Occupations
The most common Natural Resources, Construction and Maintenance occupations in Simmesport are Construction & Extraction (17 | 4.2%), and Installation, Maintenance & Repair (11 | 2.7%).
Natural Resources, Construction and Maintenance Occupations by Sex
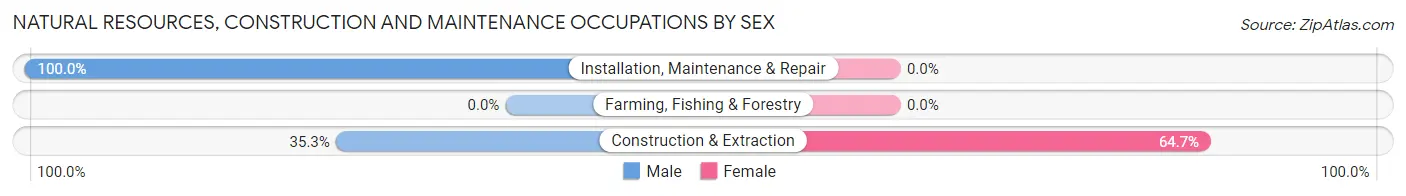
| Occupation | Male | Female |
| Farming, Fishing & Forestry | 0 (0.0%) | 0 (0.0%) |
| Construction & Extraction | 6 (35.3%) | 11 (64.7%) |
| Installation, Maintenance & Repair | 11 (100.0%) | 0 (0.0%) |
| Total (Category) | 17 (60.7%) | 11 (39.3%) |
| Total (Overall) | 122 (30.0%) | 284 (70.0%) |
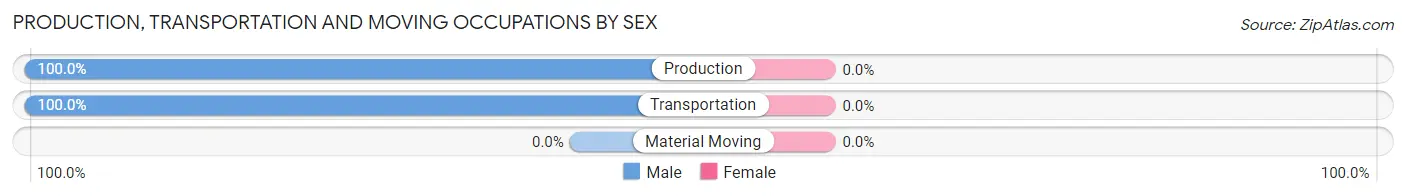
Production, Transportation and Moving Occupations
The most common Production, Transportation and Moving occupations in Simmesport are Production (21 | 5.2%), and Transportation (7 | 1.7%).
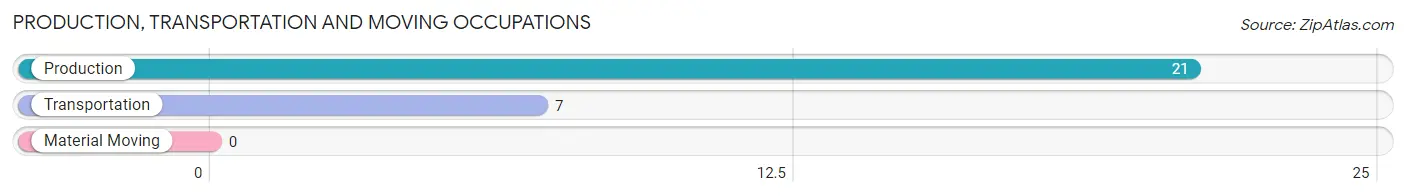
Production, Transportation and Moving Occupations by Sex
| Occupation | Male | Female |
| Production | 21 (100.0%) | 0 (0.0%) |
| Transportation | 7 (100.0%) | 0 (0.0%) |
| Material Moving | 0 (0.0%) | 0 (0.0%) |
| Total (Category) | 28 (100.0%) | 0 (0.0%) |
| Total (Overall) | 122 (30.0%) | 284 (70.0%) |
Employment Industries by Sex in Simmesport
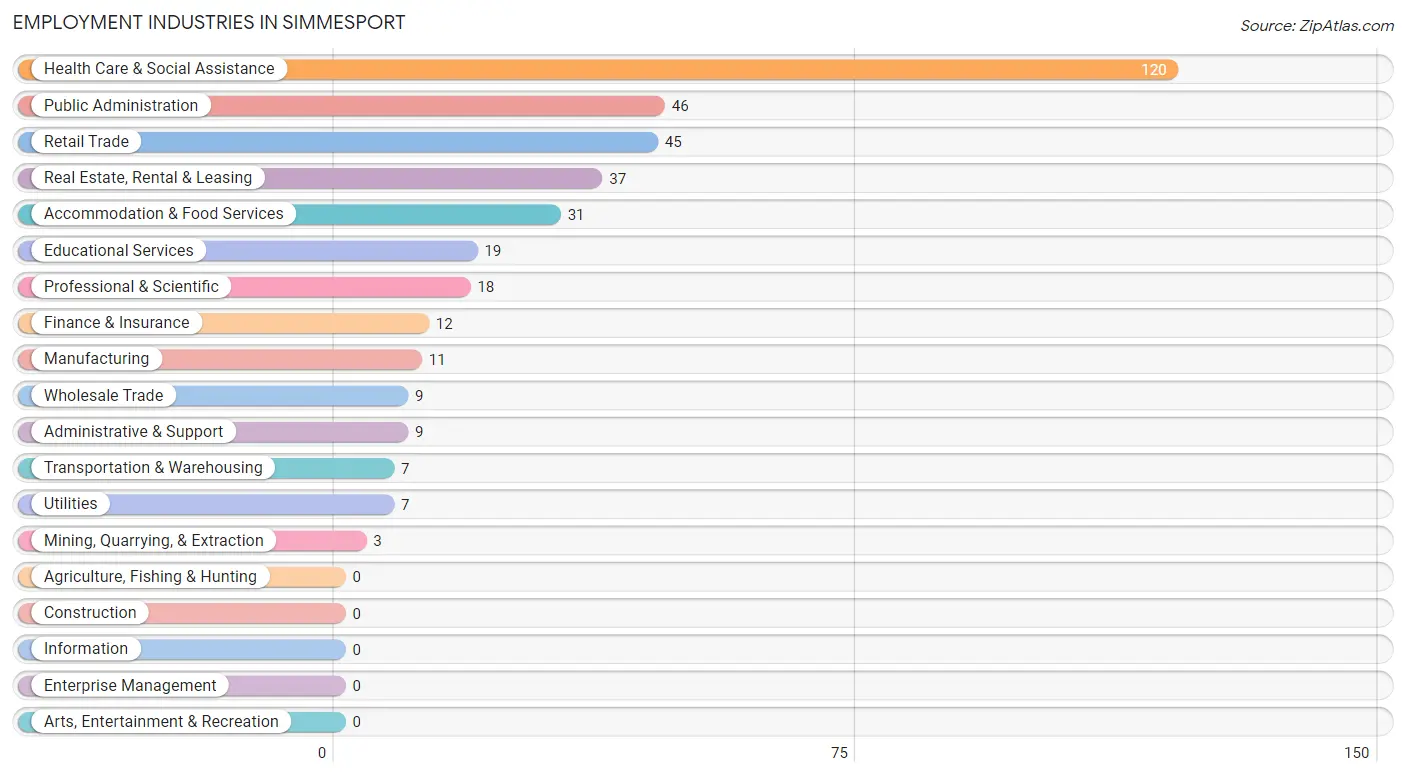
Employment Industries in Simmesport
The major employment industries in Simmesport include Health Care & Social Assistance (120 | 29.6%), Public Administration (46 | 11.3%), Retail Trade (45 | 11.1%), Real Estate, Rental & Leasing (37 | 9.1%), and Accommodation & Food Services (31 | 7.6%).
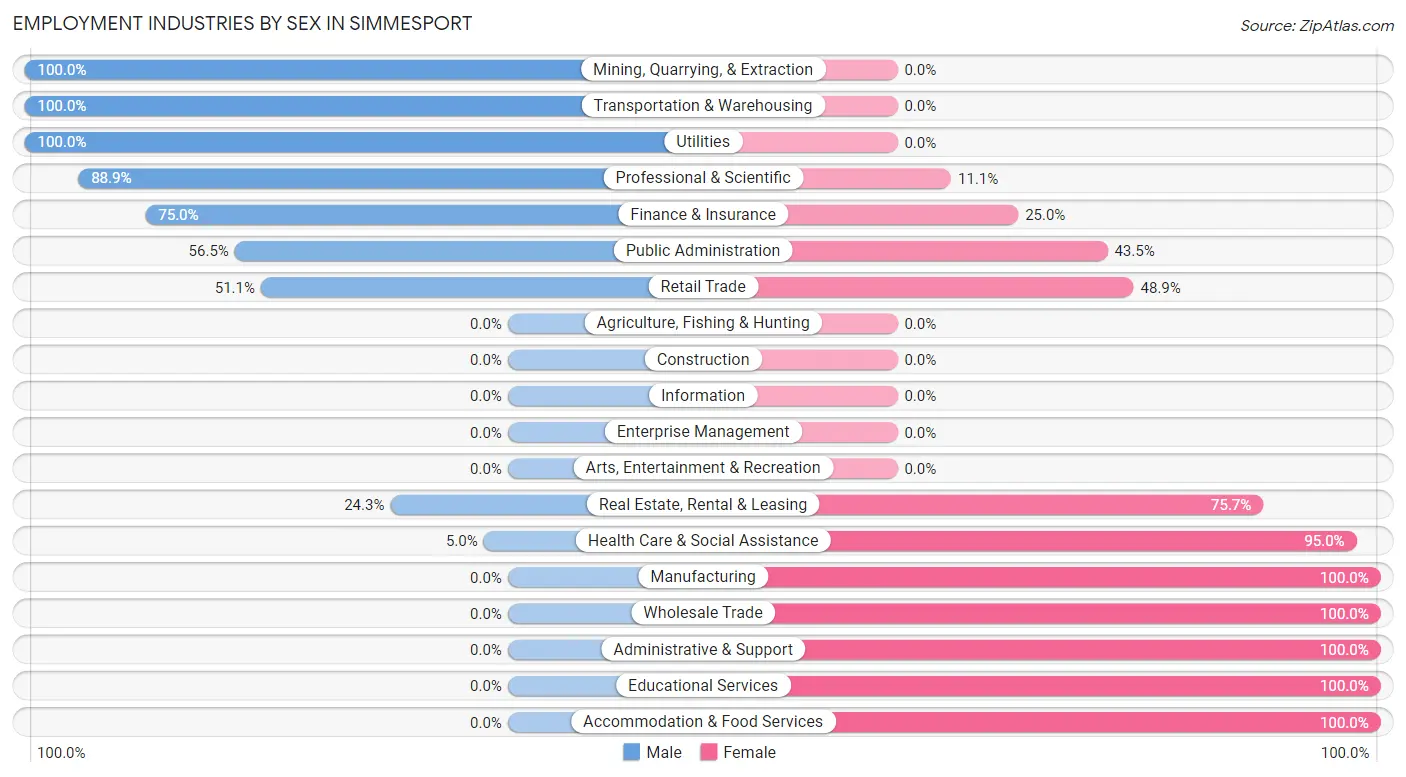
Employment Industries by Sex in Simmesport
The Simmesport industries that see more men than women are Mining, Quarrying, & Extraction (100.0%), Transportation & Warehousing (100.0%), and Utilities (100.0%), whereas the industries that tend to have a higher number of women are Manufacturing (100.0%), Wholesale Trade (100.0%), and Administrative & Support (100.0%).
| Industry | Male | Female |
| Agriculture, Fishing & Hunting | 0 (0.0%) | 0 (0.0%) |
| Mining, Quarrying, & Extraction | 3 (100.0%) | 0 (0.0%) |
| Construction | 0 (0.0%) | 0 (0.0%) |
| Manufacturing | 0 (0.0%) | 11 (100.0%) |
| Wholesale Trade | 0 (0.0%) | 9 (100.0%) |
| Retail Trade | 23 (51.1%) | 22 (48.9%) |
| Transportation & Warehousing | 7 (100.0%) | 0 (0.0%) |
| Utilities | 7 (100.0%) | 0 (0.0%) |
| Information | 0 (0.0%) | 0 (0.0%) |
| Finance & Insurance | 9 (75.0%) | 3 (25.0%) |
| Real Estate, Rental & Leasing | 9 (24.3%) | 28 (75.7%) |
| Professional & Scientific | 16 (88.9%) | 2 (11.1%) |
| Enterprise Management | 0 (0.0%) | 0 (0.0%) |
| Administrative & Support | 0 (0.0%) | 9 (100.0%) |
| Educational Services | 0 (0.0%) | 19 (100.0%) |
| Health Care & Social Assistance | 6 (5.0%) | 114 (95.0%) |
| Arts, Entertainment & Recreation | 0 (0.0%) | 0 (0.0%) |
| Accommodation & Food Services | 0 (0.0%) | 31 (100.0%) |
| Public Administration | 26 (56.5%) | 20 (43.5%) |
| Total | 122 (30.0%) | 284 (70.0%) |
Education in Simmesport
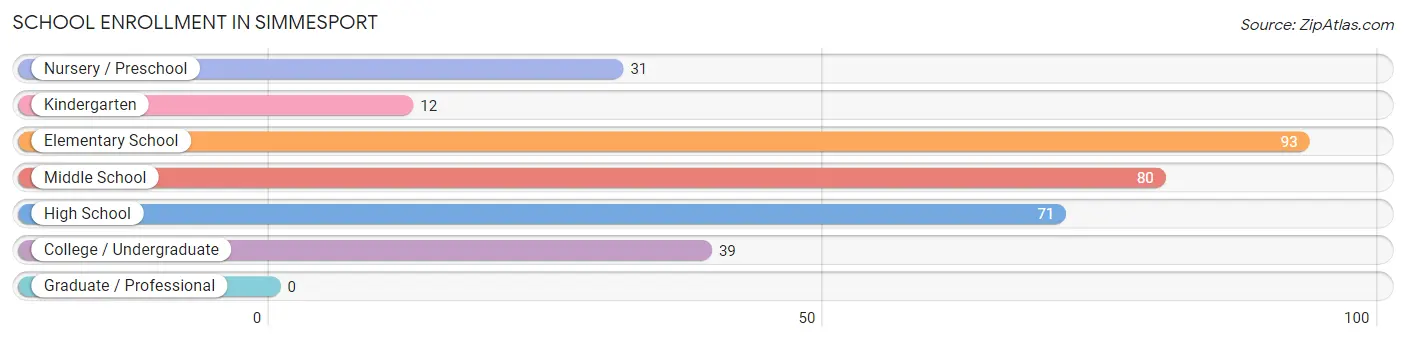
School Enrollment in Simmesport
The most common levels of schooling among the 326 students in Simmesport are elementary school (93 | 28.5%), middle school (80 | 24.5%), and high school (71 | 21.8%).
| School Level | # Students | % Students |
| Nursery / Preschool | 31 | 9.5% |
| Kindergarten | 12 | 3.7% |
| Elementary School | 93 | 28.5% |
| Middle School | 80 | 24.5% |
| High School | 71 | 21.8% |
| College / Undergraduate | 39 | 12.0% |
| Graduate / Professional | 0 | 0.0% |
| Total | 326 | 100.0% |
School Enrollment by Age by Funding Source in Simmesport
Out of a total of 326 students who are enrolled in schools in Simmesport, 29 (8.9%) attend a private institution, while the remaining 297 (91.1%) are enrolled in public schools. The age group of 5 to 9 year old has the highest likelihood of being enrolled in private schools, with 18 (21.7% in the age bracket) enrolled. Conversely, the age group of 3 to 4 year olds has the lowest likelihood of being enrolled in a private school, with 31 (100.0% in the age bracket) attending a public institution.
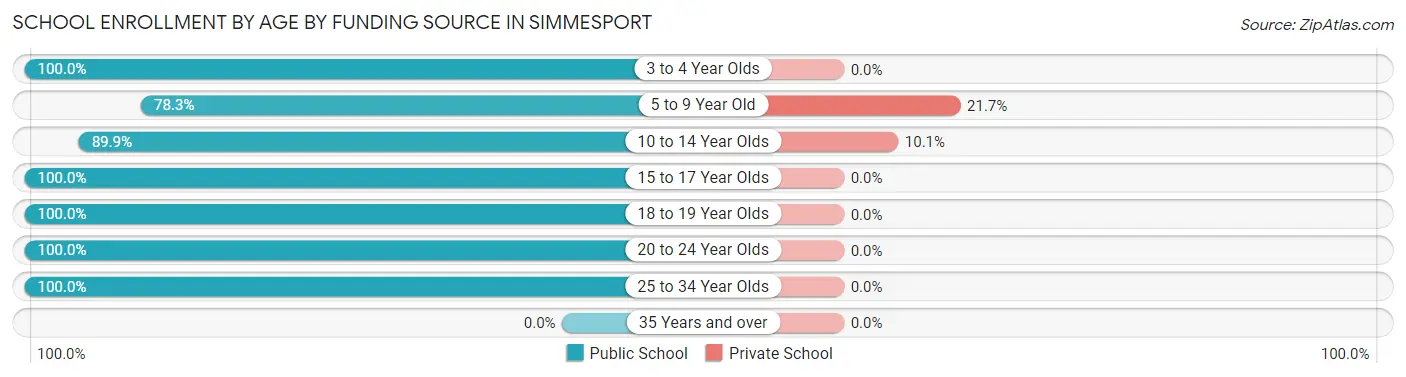
| Age Bracket | Public School | Private School |
| 3 to 4 Year Olds | 31 (100.0%) | 0 (0.0%) |
| 5 to 9 Year Old | 65 (78.3%) | 18 (21.7%) |
| 10 to 14 Year Olds | 98 (89.9%) | 11 (10.1%) |
| 15 to 17 Year Olds | 51 (100.0%) | 0 (0.0%) |
| 18 to 19 Year Olds | 13 (100.0%) | 0 (0.0%) |
| 20 to 24 Year Olds | 33 (100.0%) | 0 (0.0%) |
| 25 to 34 Year Olds | 6 (100.0%) | 0 (0.0%) |
| 35 Years and over | 0 (0.0%) | 0 (0.0%) |
| Total | 297 (91.1%) | 29 (8.9%) |
Educational Attainment by Field of Study in Simmesport
Engineering (9 | 25.0%), business (9 | 25.0%), education (7 | 19.4%), arts & humanities (6 | 16.7%), and science & technology (5 | 13.9%) are the most common fields of study among 36 individuals in Simmesport who have obtained a bachelor's degree or higher.
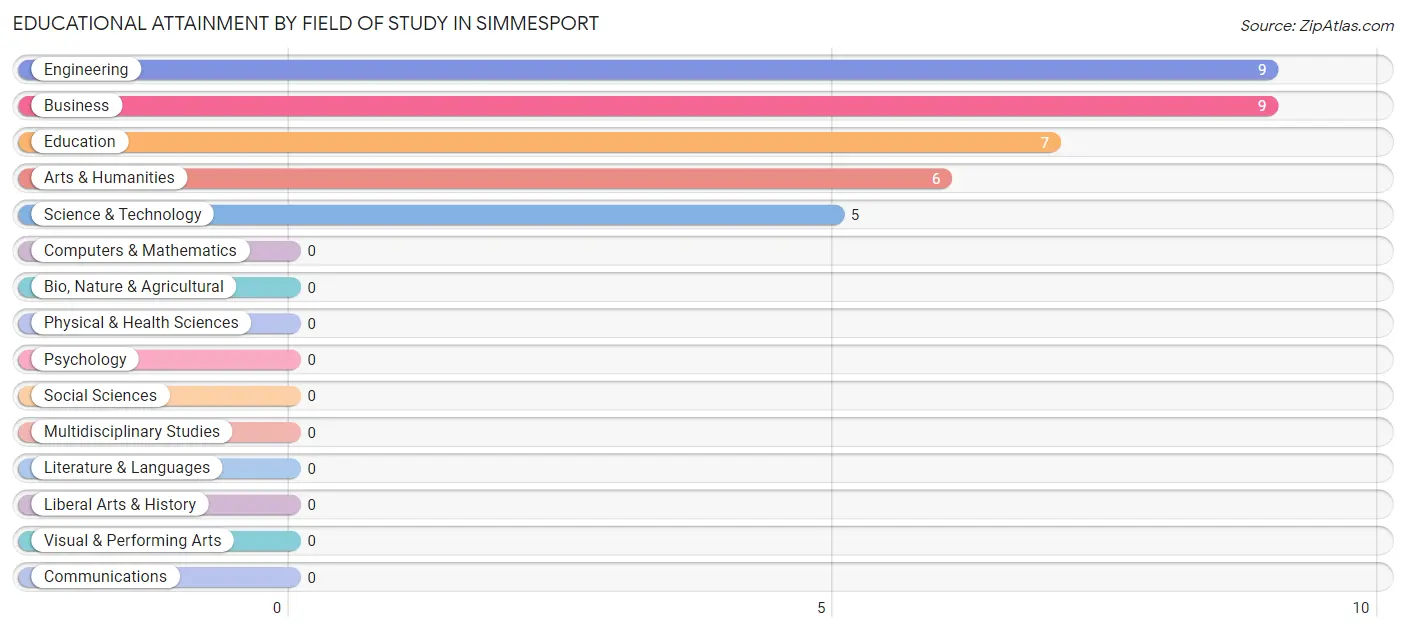
| Field of Study | # Graduates | % Graduates |
| Computers & Mathematics | 0 | 0.0% |
| Bio, Nature & Agricultural | 0 | 0.0% |
| Physical & Health Sciences | 0 | 0.0% |
| Psychology | 0 | 0.0% |
| Social Sciences | 0 | 0.0% |
| Engineering | 9 | 25.0% |
| Multidisciplinary Studies | 0 | 0.0% |
| Science & Technology | 5 | 13.9% |
| Business | 9 | 25.0% |
| Education | 7 | 19.4% |
| Literature & Languages | 0 | 0.0% |
| Liberal Arts & History | 0 | 0.0% |
| Visual & Performing Arts | 0 | 0.0% |
| Communications | 0 | 0.0% |
| Arts & Humanities | 6 | 16.7% |
| Total | 36 | 100.0% |
Transportation & Commute in Simmesport
Vehicle Availability by Sex in Simmesport
The most prevalent vehicle ownership categories in Simmesport are males with 2 vehicles (60, accounting for 50.4%) and females with 2 vehicles (96, making up 21.1%).
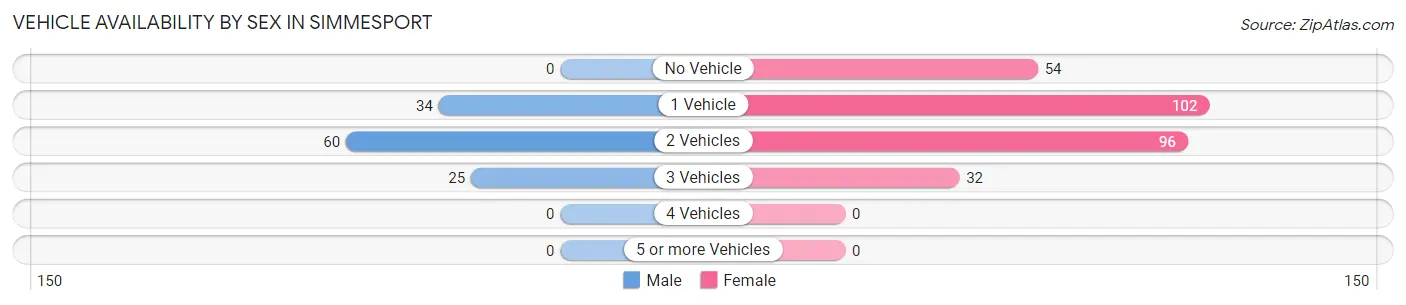
| Vehicles Available | Male | Female |
| No Vehicle | 0 (0.0%) | 54 (19.0%) |
| 1 Vehicle | 34 (28.6%) | 102 (35.9%) |
| 2 Vehicles | 60 (50.4%) | 96 (33.8%) |
| 3 Vehicles | 25 (21.0%) | 32 (11.3%) |
| 4 Vehicles | 0 (0.0%) | 0 (0.0%) |
| 5 or more Vehicles | 0 (0.0%) | 0 (0.0%) |
| Total | 119 (100.0%) | 284 (100.0%) |
Commute Time in Simmesport
The most frequently occuring commute durations in Simmesport are 5 to 9 minutes (121 commuters, 30.6%), 30 to 34 minutes (87 commuters, 22.0%), and 60 to 89 minutes (58 commuters, 14.6%).
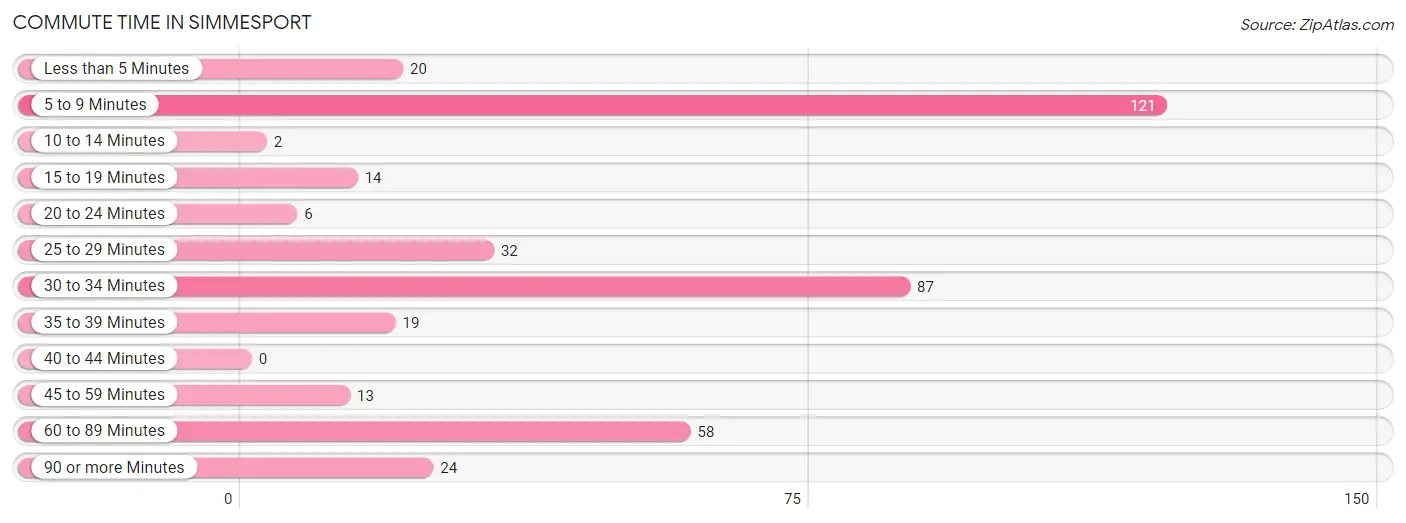
| Commute Time | # Commuters | % Commuters |
| Less than 5 Minutes | 20 | 5.1% |
| 5 to 9 Minutes | 121 | 30.6% |
| 10 to 14 Minutes | 2 | 0.5% |
| 15 to 19 Minutes | 14 | 3.5% |
| 20 to 24 Minutes | 6 | 1.5% |
| 25 to 29 Minutes | 32 | 8.1% |
| 30 to 34 Minutes | 87 | 22.0% |
| 35 to 39 Minutes | 19 | 4.8% |
| 40 to 44 Minutes | 0 | 0.0% |
| 45 to 59 Minutes | 13 | 3.3% |
| 60 to 89 Minutes | 58 | 14.6% |
| 90 or more Minutes | 24 | 6.1% |
Commute Time by Sex in Simmesport
The most common commute times in Simmesport are 5 to 9 minutes (45 commuters, 40.2%) for males and 30 to 34 minutes (87 commuters, 30.6%) for females.
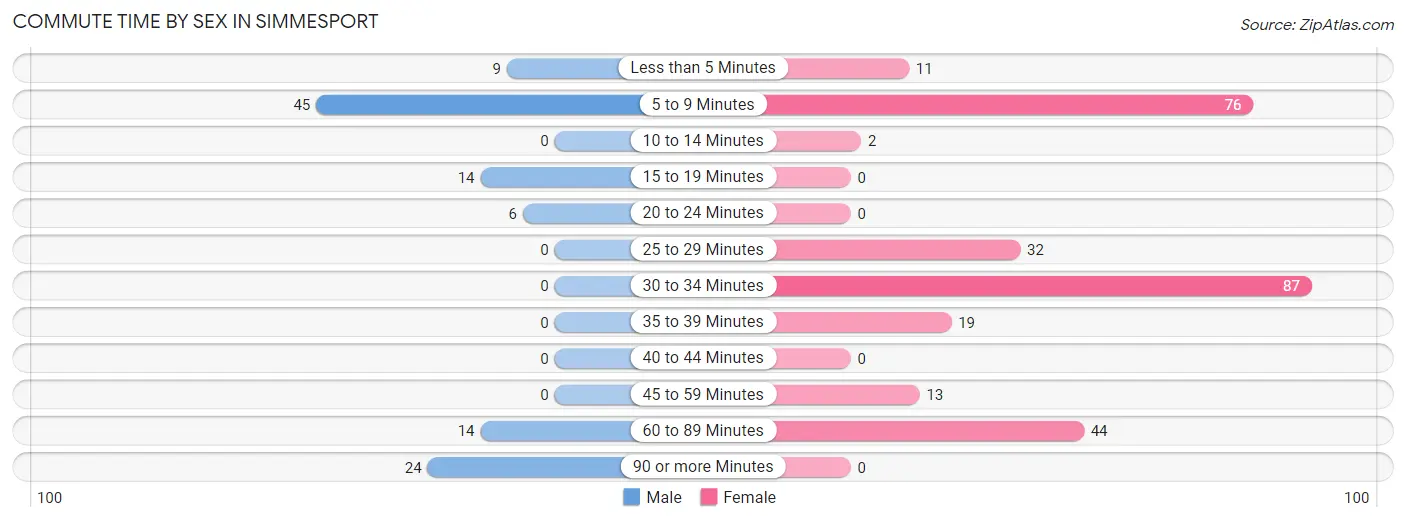
| Commute Time | Male | Female |
| Less than 5 Minutes | 9 (8.0%) | 11 (3.9%) |
| 5 to 9 Minutes | 45 (40.2%) | 76 (26.8%) |
| 10 to 14 Minutes | 0 (0.0%) | 2 (0.7%) |
| 15 to 19 Minutes | 14 (12.5%) | 0 (0.0%) |
| 20 to 24 Minutes | 6 (5.4%) | 0 (0.0%) |
| 25 to 29 Minutes | 0 (0.0%) | 32 (11.3%) |
| 30 to 34 Minutes | 0 (0.0%) | 87 (30.6%) |
| 35 to 39 Minutes | 0 (0.0%) | 19 (6.7%) |
| 40 to 44 Minutes | 0 (0.0%) | 0 (0.0%) |
| 45 to 59 Minutes | 0 (0.0%) | 13 (4.6%) |
| 60 to 89 Minutes | 14 (12.5%) | 44 (15.5%) |
| 90 or more Minutes | 24 (21.4%) | 0 (0.0%) |
Time of Departure to Work by Sex in Simmesport
The most frequent times of departure to work in Simmesport are 12:00 AM to 4:59 AM (38, 33.9%) for males and 6:00 AM to 6:29 AM (52, 18.3%) for females.
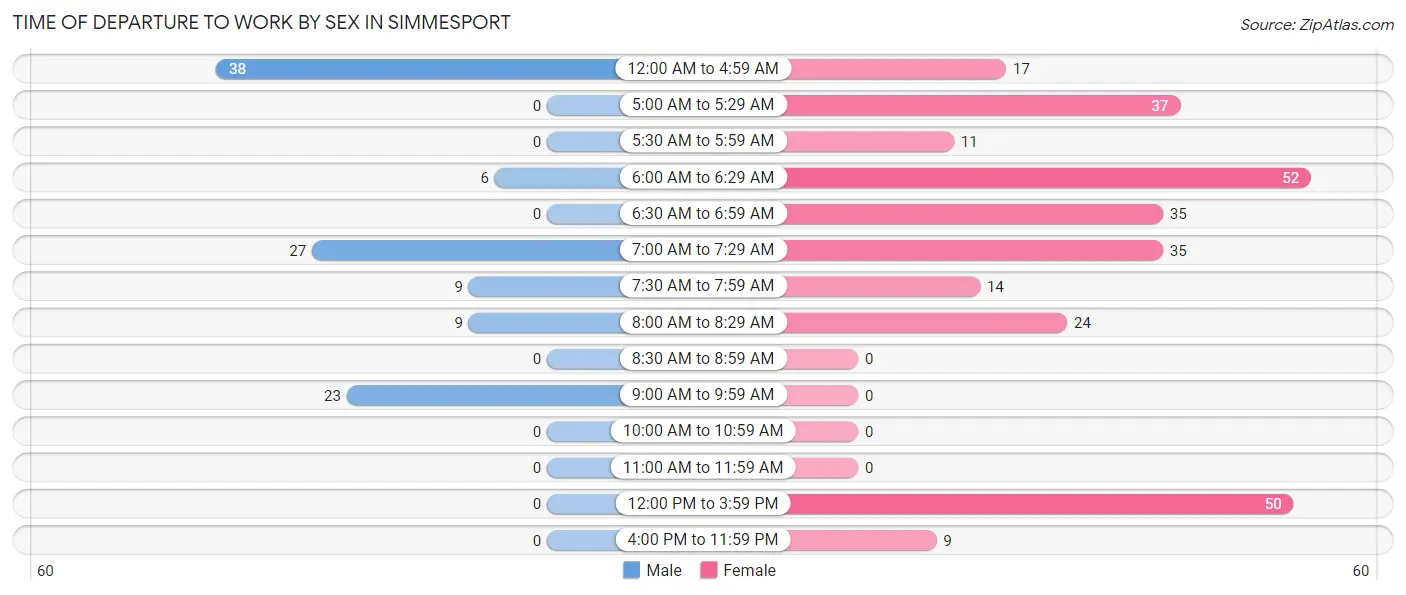
| Time of Departure | Male | Female |
| 12:00 AM to 4:59 AM | 38 (33.9%) | 17 (6.0%) |
| 5:00 AM to 5:29 AM | 0 (0.0%) | 37 (13.0%) |
| 5:30 AM to 5:59 AM | 0 (0.0%) | 11 (3.9%) |
| 6:00 AM to 6:29 AM | 6 (5.4%) | 52 (18.3%) |
| 6:30 AM to 6:59 AM | 0 (0.0%) | 35 (12.3%) |
| 7:00 AM to 7:29 AM | 27 (24.1%) | 35 (12.3%) |
| 7:30 AM to 7:59 AM | 9 (8.0%) | 14 (4.9%) |
| 8:00 AM to 8:29 AM | 9 (8.0%) | 24 (8.5%) |
| 8:30 AM to 8:59 AM | 0 (0.0%) | 0 (0.0%) |
| 9:00 AM to 9:59 AM | 23 (20.5%) | 0 (0.0%) |
| 10:00 AM to 10:59 AM | 0 (0.0%) | 0 (0.0%) |
| 11:00 AM to 11:59 AM | 0 (0.0%) | 0 (0.0%) |
| 12:00 PM to 3:59 PM | 0 (0.0%) | 50 (17.6%) |
| 4:00 PM to 11:59 PM | 0 (0.0%) | 9 (3.2%) |
| Total | 112 (100.0%) | 284 (100.0%) |
Housing Occupancy in Simmesport
Occupancy by Ownership in Simmesport
Of the total 581 dwellings in Simmesport, owner-occupied units account for 346 (59.6%), while renter-occupied units make up 235 (40.5%).
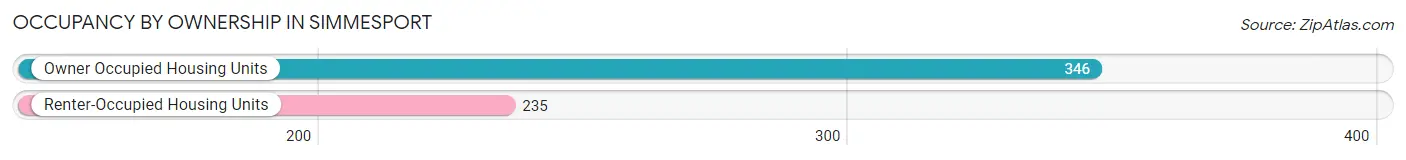
| Occupancy | # Housing Units | % Housing Units |
| Owner Occupied Housing Units | 346 | 59.6% |
| Renter-Occupied Housing Units | 235 | 40.5% |
| Total Occupied Housing Units | 581 | 100.0% |
Occupancy by Household Size in Simmesport
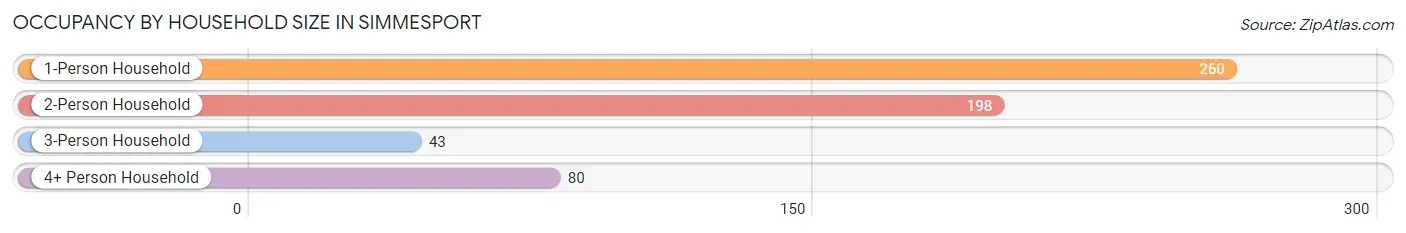
| Household Size | # Housing Units | % Housing Units |
| 1-Person Household | 260 | 44.8% |
| 2-Person Household | 198 | 34.1% |
| 3-Person Household | 43 | 7.4% |
| 4+ Person Household | 80 | 13.8% |
| Total Housing Units | 581 | 100.0% |
Occupancy by Ownership by Household Size in Simmesport
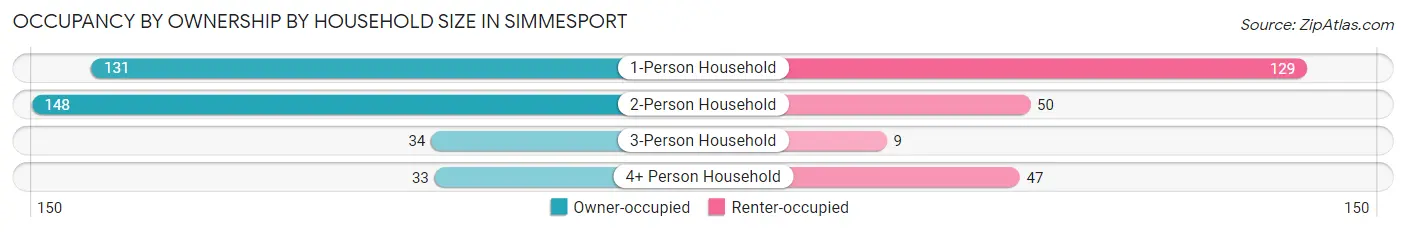
| Household Size | Owner-occupied | Renter-occupied |
| 1-Person Household | 131 (50.4%) | 129 (49.6%) |
| 2-Person Household | 148 (74.8%) | 50 (25.3%) |
| 3-Person Household | 34 (79.1%) | 9 (20.9%) |
| 4+ Person Household | 33 (41.2%) | 47 (58.8%) |
| Total Housing Units | 346 (59.6%) | 235 (40.5%) |
Occupancy by Educational Attainment in Simmesport
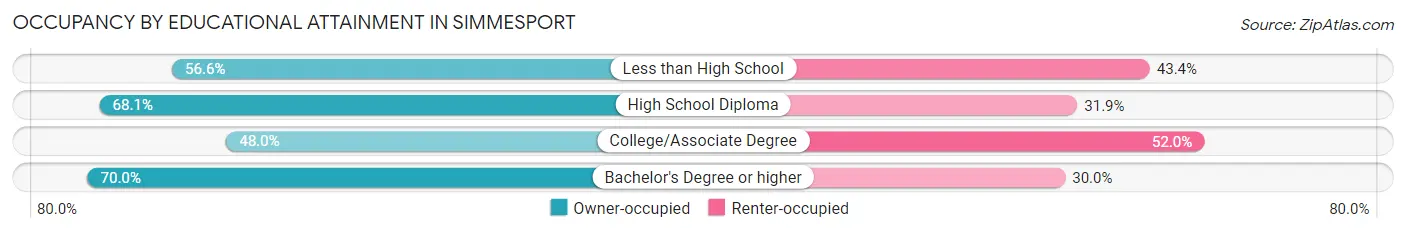
| Household Size | Owner-occupied | Renter-occupied |
| Less than High School | 73 (56.6%) | 56 (43.4%) |
| High School Diploma | 175 (68.1%) | 82 (31.9%) |
| College/Associate Degree | 84 (48.0%) | 91 (52.0%) |
| Bachelor's Degree or higher | 14 (70.0%) | 6 (30.0%) |
Occupancy by Age of Householder in Simmesport
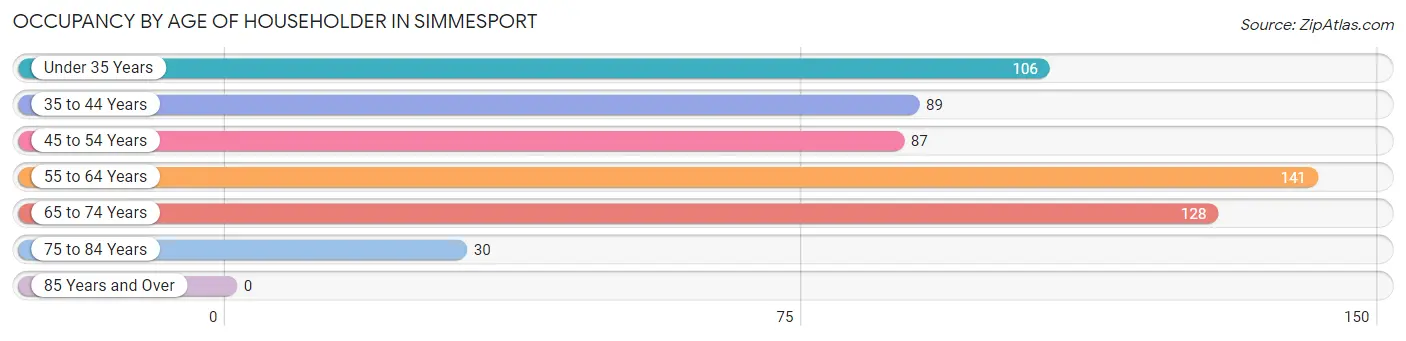
| Age Bracket | # Households | % Households |
| Under 35 Years | 106 | 18.2% |
| 35 to 44 Years | 89 | 15.3% |
| 45 to 54 Years | 87 | 15.0% |
| 55 to 64 Years | 141 | 24.3% |
| 65 to 74 Years | 128 | 22.0% |
| 75 to 84 Years | 30 | 5.2% |
| 85 Years and Over | 0 | 0.0% |
| Total | 581 | 100.0% |
Housing Finances in Simmesport
Median Income by Occupancy in Simmesport
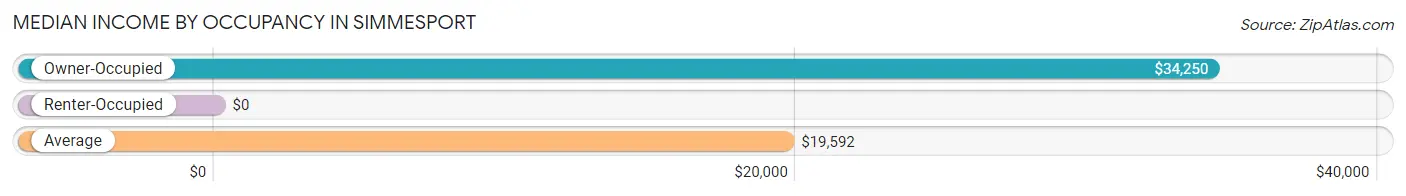
| Occupancy Type | # Households | Median Income |
| Owner-Occupied | 346 (59.6%) | $34,250 |
| Renter-Occupied | 235 (40.5%) | $0 |
| Average | 581 (100.0%) | $19,592 |
Occupancy by Householder Income Bracket in Simmesport
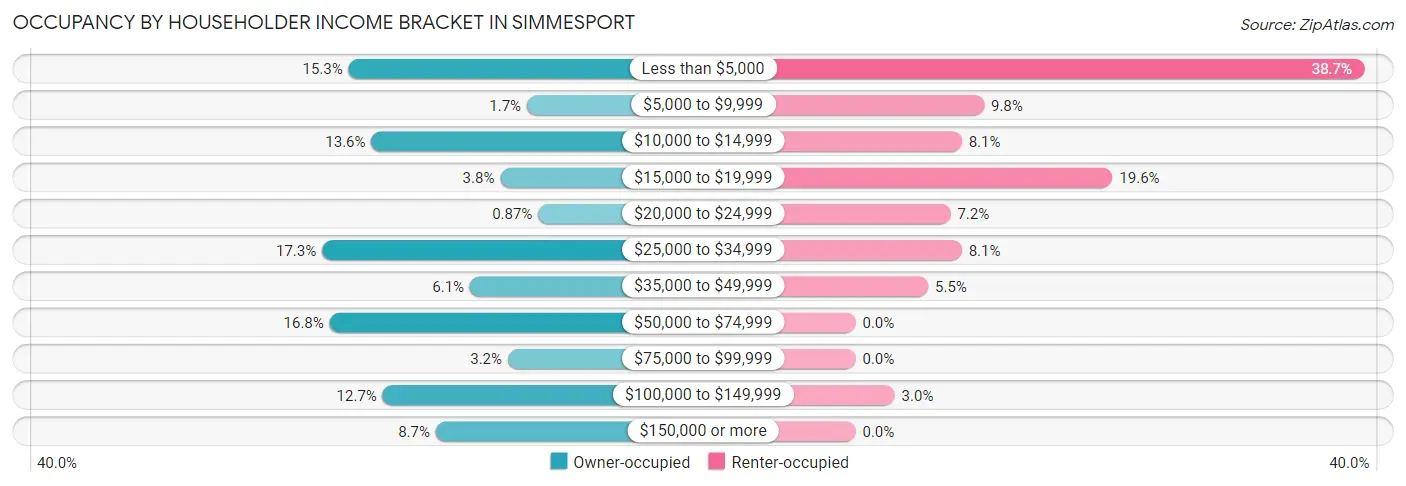
| Income Bracket | Owner-occupied | Renter-occupied |
| Less than $5,000 | 53 (15.3%) | 91 (38.7%) |
| $5,000 to $9,999 | 6 (1.7%) | 23 (9.8%) |
| $10,000 to $14,999 | 47 (13.6%) | 19 (8.1%) |
| $15,000 to $19,999 | 13 (3.8%) | 46 (19.6%) |
| $20,000 to $24,999 | 3 (0.9%) | 17 (7.2%) |
| $25,000 to $34,999 | 60 (17.3%) | 19 (8.1%) |
| $35,000 to $49,999 | 21 (6.1%) | 13 (5.5%) |
| $50,000 to $74,999 | 58 (16.8%) | 0 (0.0%) |
| $75,000 to $99,999 | 11 (3.2%) | 0 (0.0%) |
| $100,000 to $149,999 | 44 (12.7%) | 7 (3.0%) |
| $150,000 or more | 30 (8.7%) | 0 (0.0%) |
| Total | 346 (100.0%) | 235 (100.0%) |
Monthly Housing Cost Tiers in Simmesport
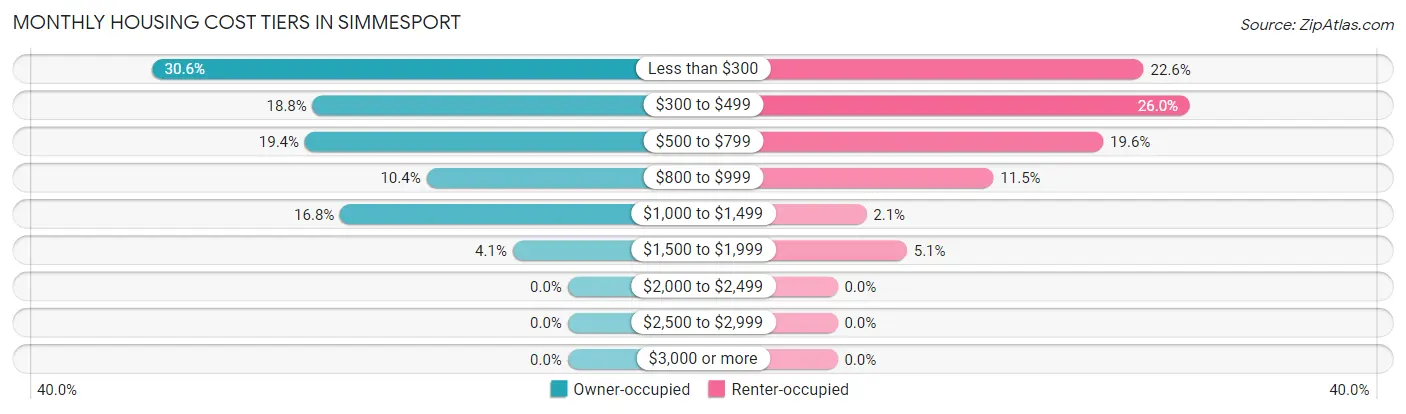
| Monthly Cost | Owner-occupied | Renter-occupied |
| Less than $300 | 106 (30.6%) | 53 (22.6%) |
| $300 to $499 | 65 (18.8%) | 61 (26.0%) |
| $500 to $799 | 67 (19.4%) | 46 (19.6%) |
| $800 to $999 | 36 (10.4%) | 27 (11.5%) |
| $1,000 to $1,499 | 58 (16.8%) | 5 (2.1%) |
| $1,500 to $1,999 | 14 (4.1%) | 12 (5.1%) |
| $2,000 to $2,499 | 0 (0.0%) | 0 (0.0%) |
| $2,500 to $2,999 | 0 (0.0%) | 0 (0.0%) |
| $3,000 or more | 0 (0.0%) | 0 (0.0%) |
| Total | 346 (100.0%) | 235 (100.0%) |
Physical Housing Characteristics in Simmesport
Housing Structures in Simmesport
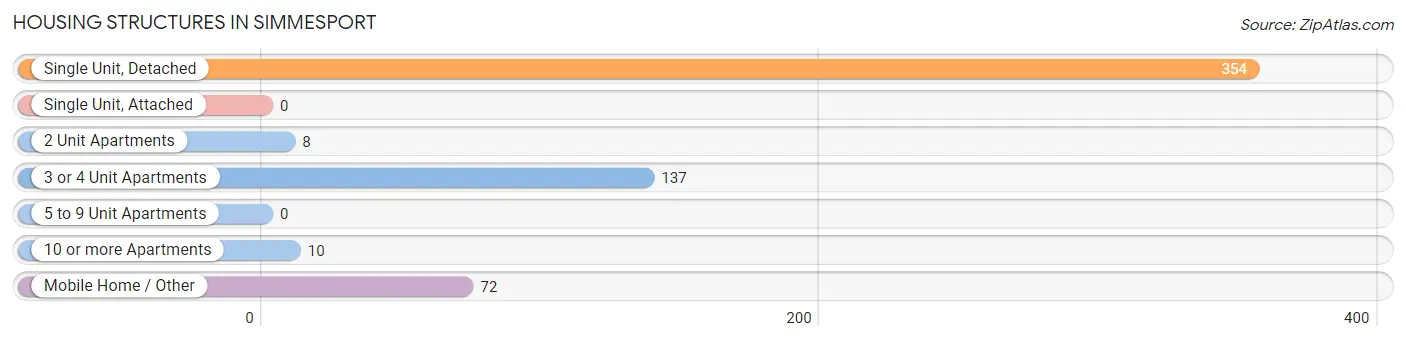
| Structure Type | # Housing Units | % Housing Units |
| Single Unit, Detached | 354 | 60.9% |
| Single Unit, Attached | 0 | 0.0% |
| 2 Unit Apartments | 8 | 1.4% |
| 3 or 4 Unit Apartments | 137 | 23.6% |
| 5 to 9 Unit Apartments | 0 | 0.0% |
| 10 or more Apartments | 10 | 1.7% |
| Mobile Home / Other | 72 | 12.4% |
| Total | 581 | 100.0% |
Housing Structures by Occupancy in Simmesport
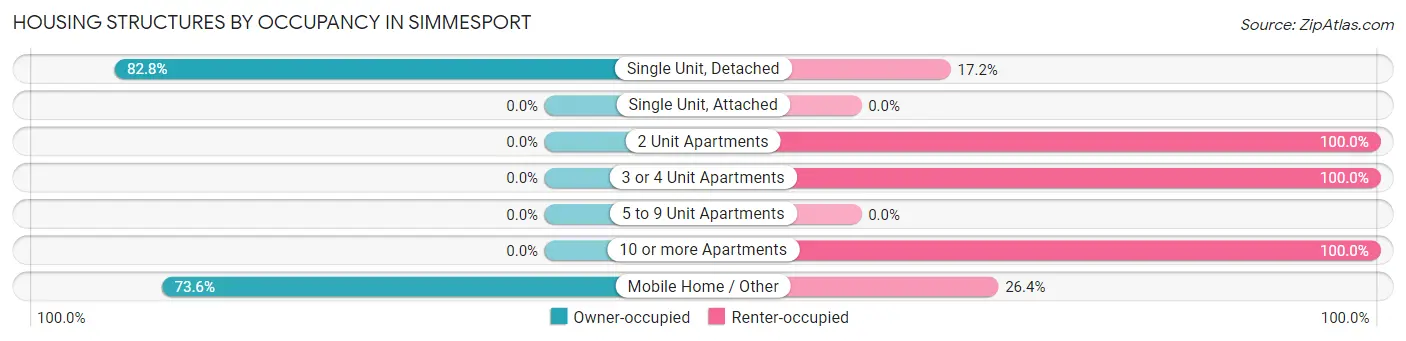
| Structure Type | Owner-occupied | Renter-occupied |
| Single Unit, Detached | 293 (82.8%) | 61 (17.2%) |
| Single Unit, Attached | 0 (0.0%) | 0 (0.0%) |
| 2 Unit Apartments | 0 (0.0%) | 8 (100.0%) |
| 3 or 4 Unit Apartments | 0 (0.0%) | 137 (100.0%) |
| 5 to 9 Unit Apartments | 0 (0.0%) | 0 (0.0%) |
| 10 or more Apartments | 0 (0.0%) | 10 (100.0%) |
| Mobile Home / Other | 53 (73.6%) | 19 (26.4%) |
| Total | 346 (59.6%) | 235 (40.5%) |
Housing Structures by Number of Rooms in Simmesport
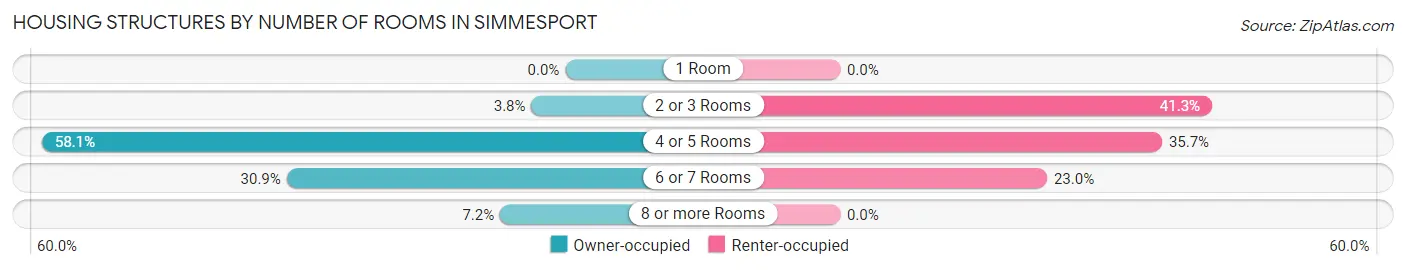
| Number of Rooms | Owner-occupied | Renter-occupied |
| 1 Room | 0 (0.0%) | 0 (0.0%) |
| 2 or 3 Rooms | 13 (3.8%) | 97 (41.3%) |
| 4 or 5 Rooms | 201 (58.1%) | 84 (35.7%) |
| 6 or 7 Rooms | 107 (30.9%) | 54 (23.0%) |
| 8 or more Rooms | 25 (7.2%) | 0 (0.0%) |
| Total | 346 (100.0%) | 235 (100.0%) |
Housing Structure by Heating Type in Simmesport
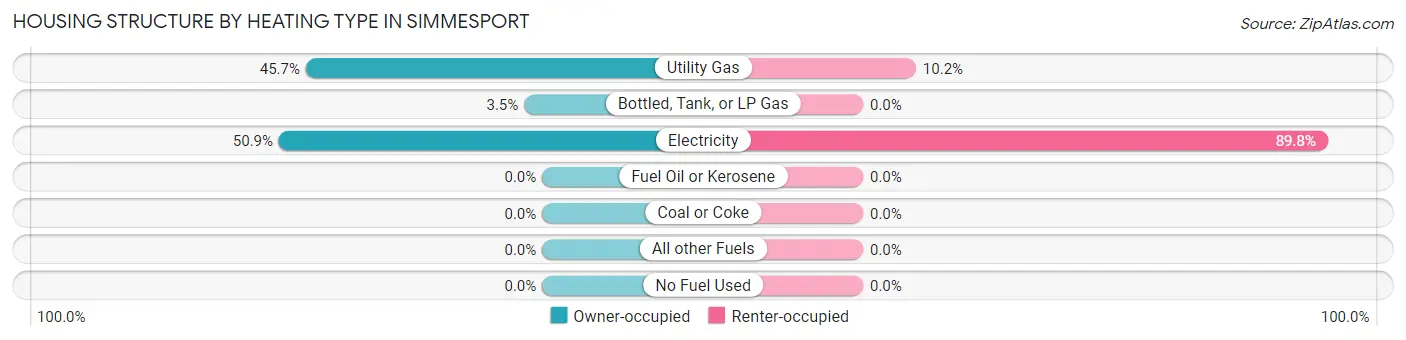
| Heating Type | Owner-occupied | Renter-occupied |
| Utility Gas | 158 (45.7%) | 24 (10.2%) |
| Bottled, Tank, or LP Gas | 12 (3.5%) | 0 (0.0%) |
| Electricity | 176 (50.9%) | 211 (89.8%) |
| Fuel Oil or Kerosene | 0 (0.0%) | 0 (0.0%) |
| Coal or Coke | 0 (0.0%) | 0 (0.0%) |
| All other Fuels | 0 (0.0%) | 0 (0.0%) |
| No Fuel Used | 0 (0.0%) | 0 (0.0%) |
| Total | 346 (100.0%) | 235 (100.0%) |
Household Vehicle Usage in Simmesport
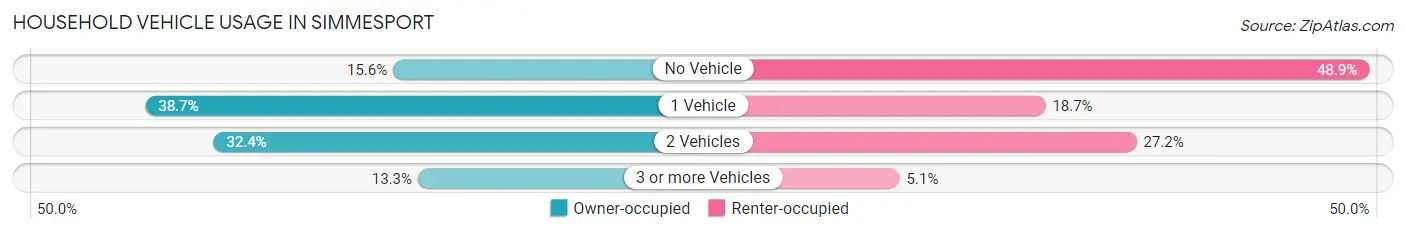
| Vehicles per Household | Owner-occupied | Renter-occupied |
| No Vehicle | 54 (15.6%) | 115 (48.9%) |
| 1 Vehicle | 134 (38.7%) | 44 (18.7%) |
| 2 Vehicles | 112 (32.4%) | 64 (27.2%) |
| 3 or more Vehicles | 46 (13.3%) | 12 (5.1%) |
| Total | 346 (100.0%) | 235 (100.0%) |
Real Estate & Mortgages in Simmesport
Real Estate and Mortgage Overview in Simmesport
| Characteristic | Without Mortgage | With Mortgage |
| Housing Units | 194 | 152 |
| Median Property Value | $59,800 | $87,300 |
| Median Household Income | $32,656 | $27 |
| Monthly Housing Costs | $283 | $0 |
| Real Estate Taxes | $199 | $10 |
Property Value by Mortgage Status in Simmesport
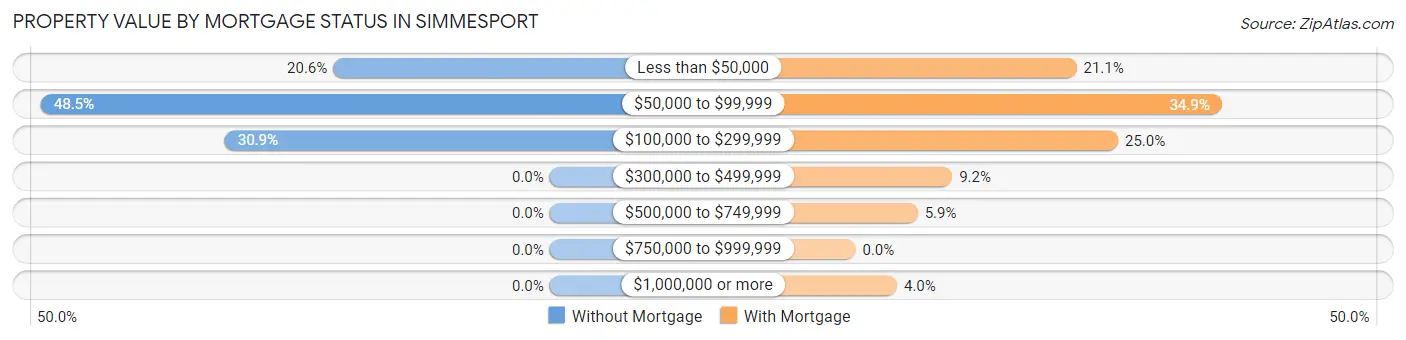
| Property Value | Without Mortgage | With Mortgage |
| Less than $50,000 | 40 (20.6%) | 32 (21.0%) |
| $50,000 to $99,999 | 94 (48.4%) | 53 (34.9%) |
| $100,000 to $299,999 | 60 (30.9%) | 38 (25.0%) |
| $300,000 to $499,999 | 0 (0.0%) | 14 (9.2%) |
| $500,000 to $749,999 | 0 (0.0%) | 9 (5.9%) |
| $750,000 to $999,999 | 0 (0.0%) | 0 (0.0%) |
| $1,000,000 or more | 0 (0.0%) | 6 (4.0%) |
| Total | 194 (100.0%) | 152 (100.0%) |
Household Income by Mortgage Status in Simmesport
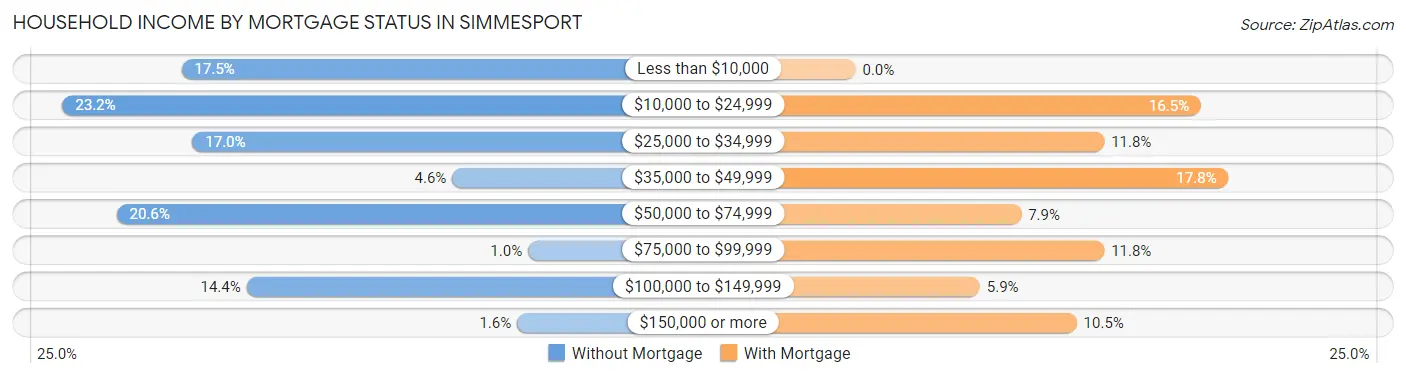
| Household Income | Without Mortgage | With Mortgage |
| Less than $10,000 | 34 (17.5%) | 0 (0.0%) |
| $10,000 to $24,999 | 45 (23.2%) | 25 (16.5%) |
| $25,000 to $34,999 | 33 (17.0%) | 18 (11.8%) |
| $35,000 to $49,999 | 9 (4.6%) | 27 (17.8%) |
| $50,000 to $74,999 | 40 (20.6%) | 12 (7.9%) |
| $75,000 to $99,999 | 2 (1.0%) | 18 (11.8%) |
| $100,000 to $149,999 | 28 (14.4%) | 9 (5.9%) |
| $150,000 or more | 3 (1.5%) | 16 (10.5%) |
| Total | 194 (100.0%) | 152 (100.0%) |
Property Value to Household Income Ratio in Simmesport
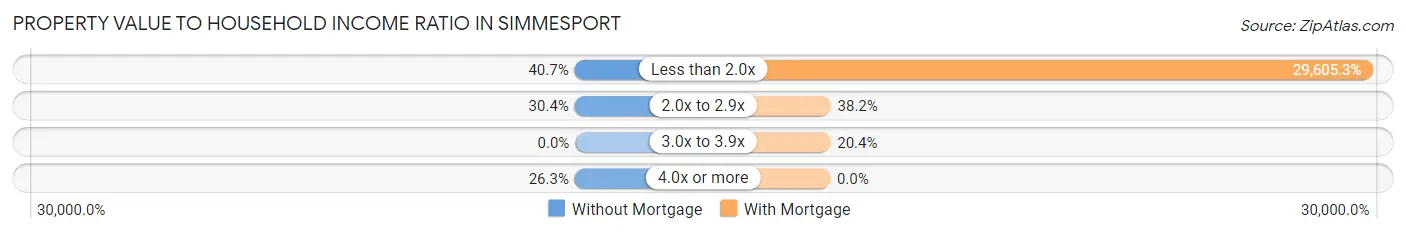
| Value-to-Income Ratio | Without Mortgage | With Mortgage |
| Less than 2.0x | 79 (40.7%) | 45,000 (29,605.3%) |
| 2.0x to 2.9x | 59 (30.4%) | 58 (38.2%) |
| 3.0x to 3.9x | 0 (0.0%) | 31 (20.4%) |
| 4.0x or more | 51 (26.3%) | 0 (0.0%) |
| Total | 194 (100.0%) | 152 (100.0%) |
Real Estate Taxes by Mortgage Status in Simmesport
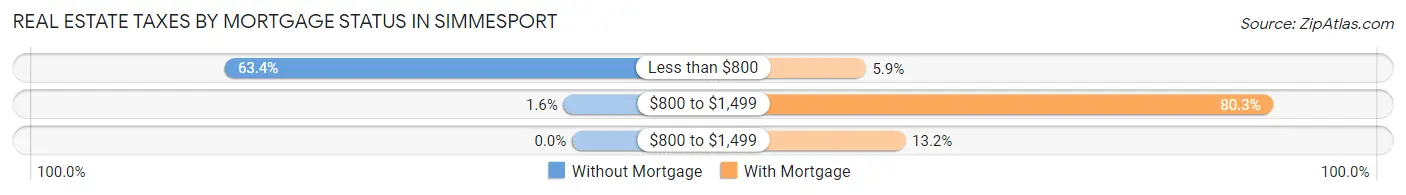
| Property Taxes | Without Mortgage | With Mortgage |
| Less than $800 | 123 (63.4%) | 9 (5.9%) |
| $800 to $1,499 | 3 (1.5%) | 122 (80.3%) |
| $800 to $1,499 | 0 (0.0%) | 20 (13.2%) |
| Total | 194 (100.0%) | 152 (100.0%) |
Health & Disability in Simmesport
Health Insurance Coverage by Age in Simmesport
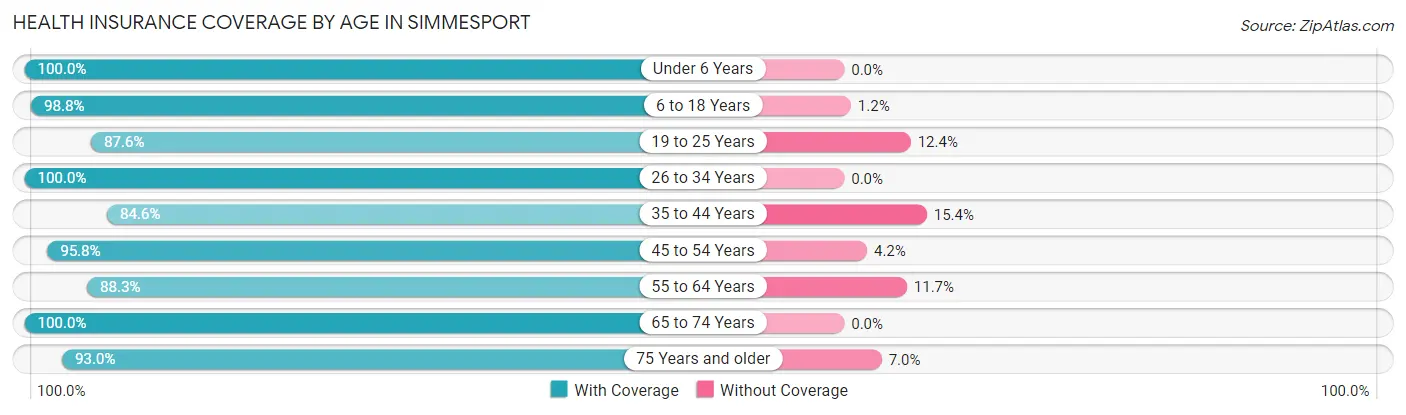
| Age Bracket | With Coverage | Without Coverage |
| Under 6 Years | 69 (100.0%) | 0 (0.0%) |
| 6 to 18 Years | 241 (98.8%) | 3 (1.2%) |
| 19 to 25 Years | 99 (87.6%) | 14 (12.4%) |
| 26 to 34 Years | 69 (100.0%) | 0 (0.0%) |
| 35 to 44 Years | 121 (84.6%) | 22 (15.4%) |
| 45 to 54 Years | 113 (95.8%) | 5 (4.2%) |
| 55 to 64 Years | 227 (88.3%) | 30 (11.7%) |
| 65 to 74 Years | 182 (100.0%) | 0 (0.0%) |
| 75 Years and older | 40 (93.0%) | 3 (7.0%) |
| Total | 1,161 (93.8%) | 77 (6.2%) |
Health Insurance Coverage by Citizenship Status in Simmesport
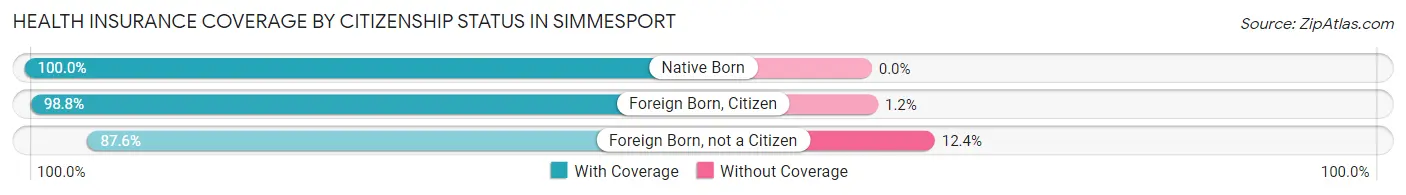
| Citizenship Status | With Coverage | Without Coverage |
| Native Born | 69 (100.0%) | 0 (0.0%) |
| Foreign Born, Citizen | 241 (98.8%) | 3 (1.2%) |
| Foreign Born, not a Citizen | 99 (87.6%) | 14 (12.4%) |
Health Insurance Coverage by Household Income in Simmesport
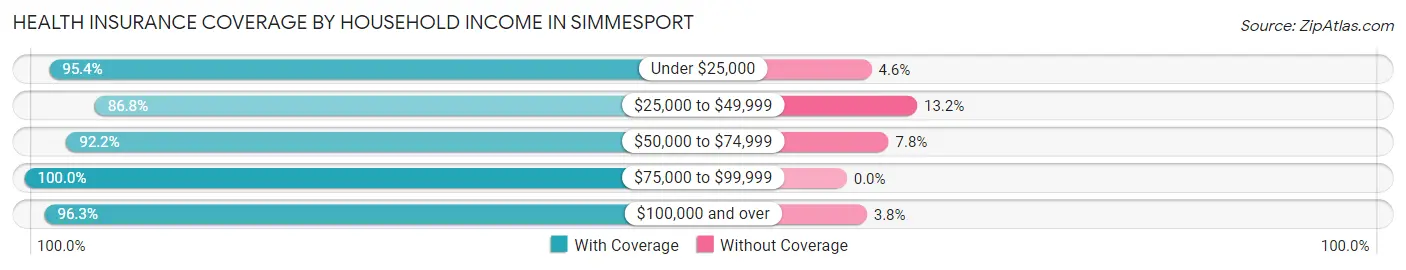
| Household Income | With Coverage | Without Coverage |
| Under $25,000 | 597 (95.4%) | 29 (4.6%) |
| $25,000 to $49,999 | 198 (86.8%) | 30 (13.2%) |
| $50,000 to $74,999 | 106 (92.2%) | 9 (7.8%) |
| $75,000 to $99,999 | 29 (100.0%) | 0 (0.0%) |
| $100,000 and over | 231 (96.3%) | 9 (3.7%) |
Public vs Private Health Insurance Coverage by Age in Simmesport
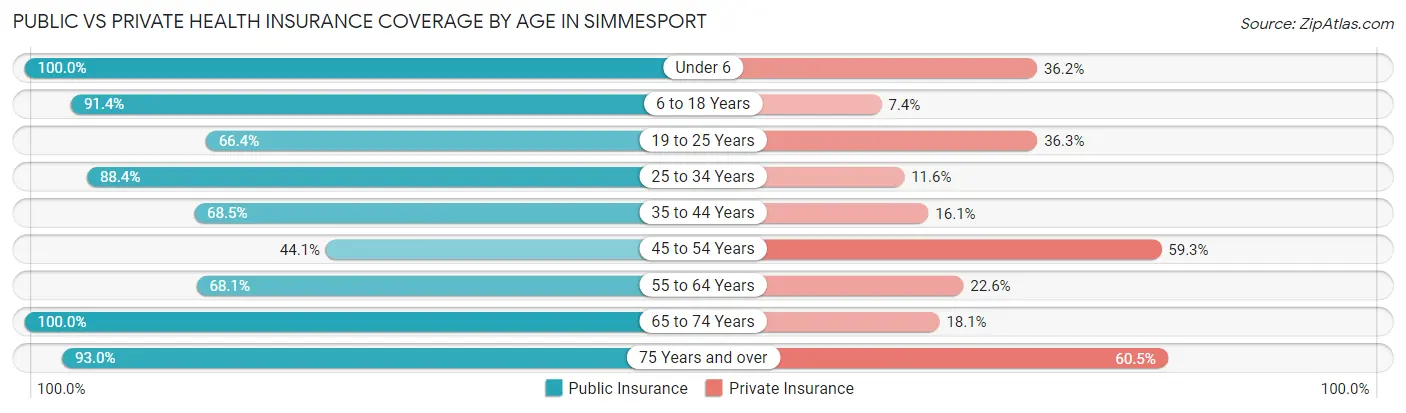
| Age Bracket | Public Insurance | Private Insurance |
| Under 6 | 69 (100.0%) | 25 (36.2%) |
| 6 to 18 Years | 223 (91.4%) | 18 (7.4%) |
| 19 to 25 Years | 75 (66.4%) | 41 (36.3%) |
| 25 to 34 Years | 61 (88.4%) | 8 (11.6%) |
| 35 to 44 Years | 98 (68.5%) | 23 (16.1%) |
| 45 to 54 Years | 52 (44.1%) | 70 (59.3%) |
| 55 to 64 Years | 175 (68.1%) | 58 (22.6%) |
| 65 to 74 Years | 182 (100.0%) | 33 (18.1%) |
| 75 Years and over | 40 (93.0%) | 26 (60.5%) |
| Total | 975 (78.8%) | 302 (24.4%) |
Disability Status by Sex by Age in Simmesport
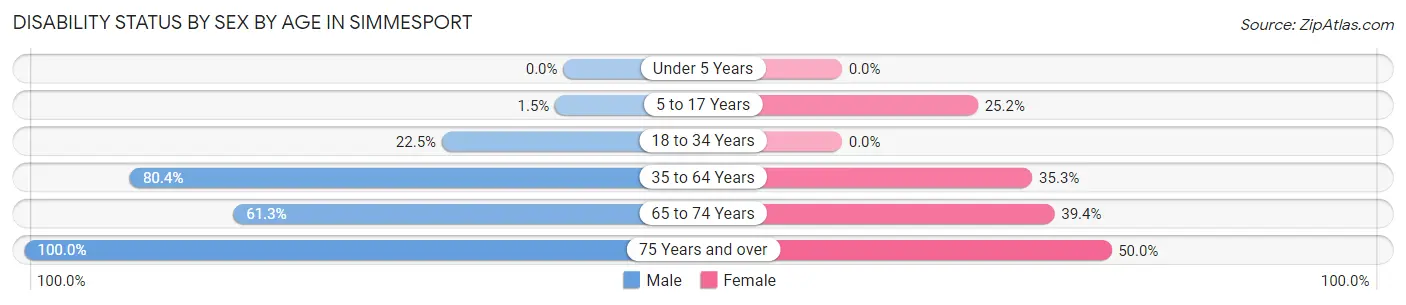
| Age Bracket | Male | Female |
| Under 5 Years | 0 (0.0%) | 0 (0.0%) |
| 5 to 17 Years | 2 (1.5%) | 28 (25.2%) |
| 18 to 34 Years | 16 (22.5%) | 0 (0.0%) |
| 35 to 64 Years | 148 (80.4%) | 118 (35.3%) |
| 65 to 74 Years | 68 (61.3%) | 28 (39.4%) |
| 75 Years and over | 17 (100.0%) | 13 (50.0%) |
Disability Class by Sex by Age in Simmesport
Disability Class: Hearing Difficulty
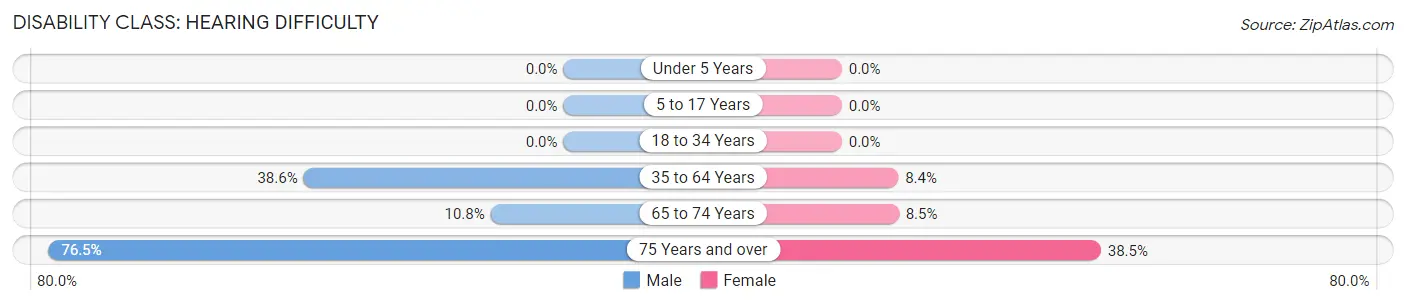
| Age Bracket | Male | Female |
| Under 5 Years | 0 (0.0%) | 0 (0.0%) |
| 5 to 17 Years | 0 (0.0%) | 0 (0.0%) |
| 18 to 34 Years | 0 (0.0%) | 0 (0.0%) |
| 35 to 64 Years | 71 (38.6%) | 28 (8.4%) |
| 65 to 74 Years | 12 (10.8%) | 6 (8.5%) |
| 75 Years and over | 13 (76.5%) | 10 (38.5%) |
Disability Class: Vision Difficulty
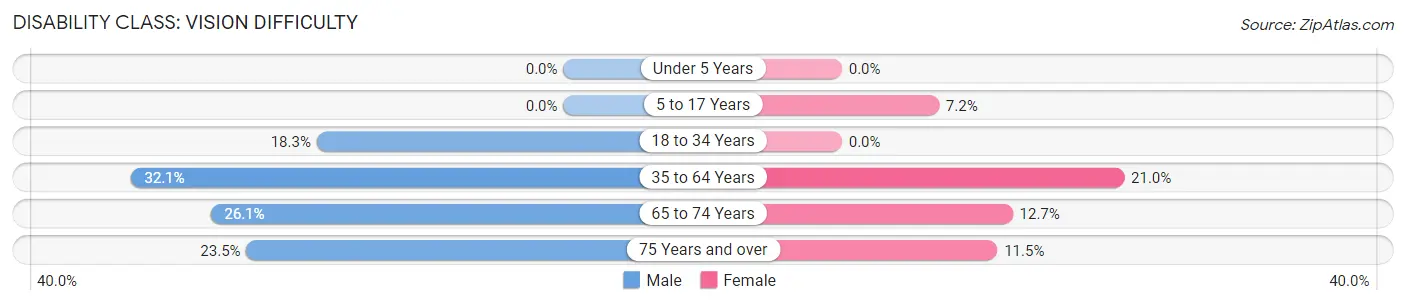
| Age Bracket | Male | Female |
| Under 5 Years | 0 (0.0%) | 0 (0.0%) |
| 5 to 17 Years | 0 (0.0%) | 8 (7.2%) |
| 18 to 34 Years | 13 (18.3%) | 0 (0.0%) |
| 35 to 64 Years | 59 (32.1%) | 70 (21.0%) |
| 65 to 74 Years | 29 (26.1%) | 9 (12.7%) |
| 75 Years and over | 4 (23.5%) | 3 (11.5%) |
Disability Class: Cognitive Difficulty
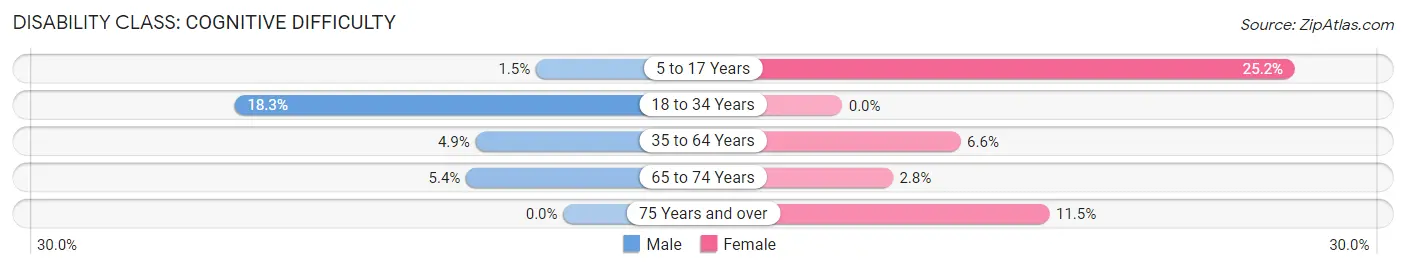
| Age Bracket | Male | Female |
| 5 to 17 Years | 2 (1.5%) | 28 (25.2%) |
| 18 to 34 Years | 13 (18.3%) | 0 (0.0%) |
| 35 to 64 Years | 9 (4.9%) | 22 (6.6%) |
| 65 to 74 Years | 6 (5.4%) | 2 (2.8%) |
| 75 Years and over | 0 (0.0%) | 3 (11.5%) |
Disability Class: Ambulatory Difficulty
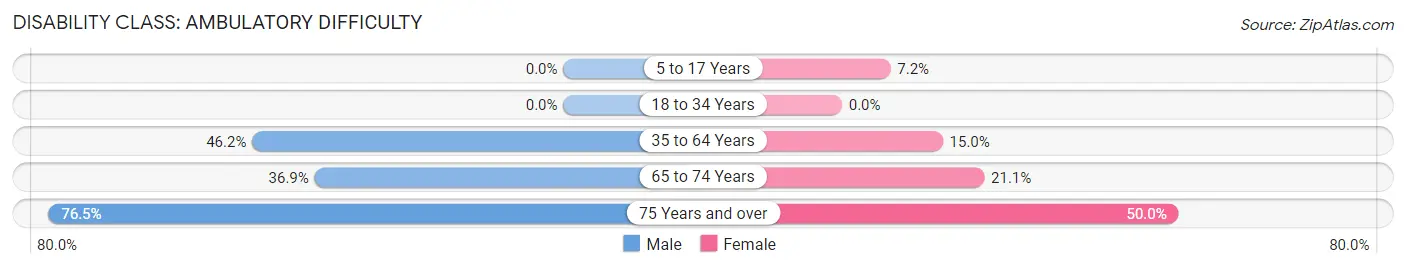
| Age Bracket | Male | Female |
| 5 to 17 Years | 0 (0.0%) | 8 (7.2%) |
| 18 to 34 Years | 0 (0.0%) | 0 (0.0%) |
| 35 to 64 Years | 85 (46.2%) | 50 (15.0%) |
| 65 to 74 Years | 41 (36.9%) | 15 (21.1%) |
| 75 Years and over | 13 (76.5%) | 13 (50.0%) |
Disability Class: Self-Care Difficulty
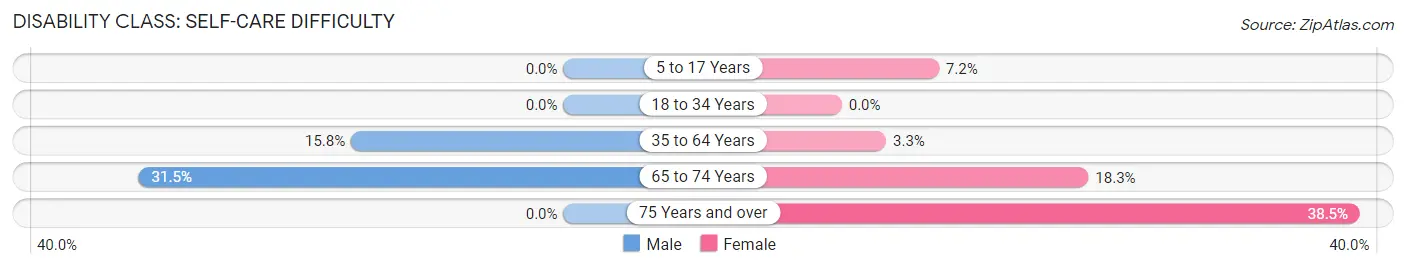
| Age Bracket | Male | Female |
| 5 to 17 Years | 0 (0.0%) | 8 (7.2%) |
| 18 to 34 Years | 0 (0.0%) | 0 (0.0%) |
| 35 to 64 Years | 29 (15.8%) | 11 (3.3%) |
| 65 to 74 Years | 35 (31.5%) | 13 (18.3%) |
| 75 Years and over | 0 (0.0%) | 10 (38.5%) |
Technology Access in Simmesport
Computing Device Access in Simmesport
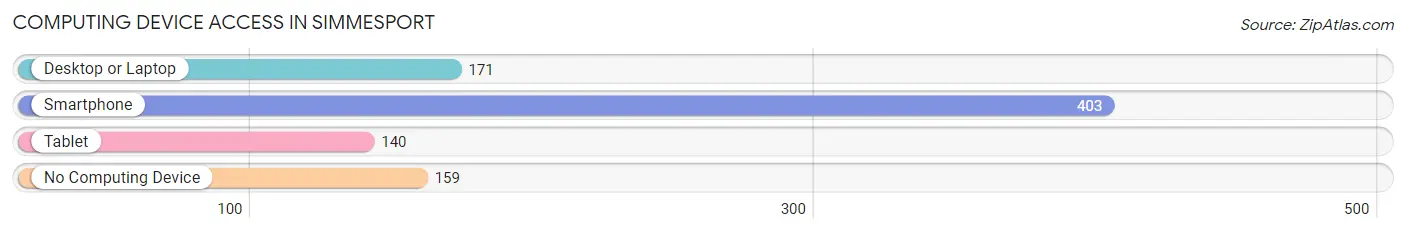
| Device Type | # Households | % Households |
| Desktop or Laptop | 171 | 29.4% |
| Smartphone | 403 | 69.4% |
| Tablet | 140 | 24.1% |
| No Computing Device | 159 | 27.4% |
| Total | 581 | 100.0% |
Internet Access in Simmesport
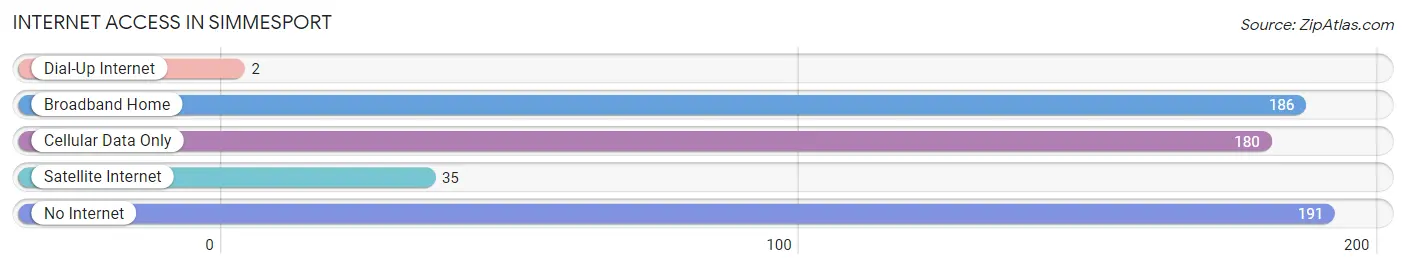
| Internet Type | # Households | % Households |
| Dial-Up Internet | 2 | 0.3% |
| Broadband Home | 186 | 32.0% |
| Cellular Data Only | 180 | 31.0% |
| Satellite Internet | 35 | 6.0% |
| No Internet | 191 | 32.9% |
| Total | 581 | 100.0% |
Simmesport Summary
Simmesport is a small town located in Avoyelles Parish, Louisiana. It is situated on the banks of the Atchafalaya River, approximately 40 miles northwest of Baton Rouge. The town has a population of 1,845 people, according to the 2010 census.
History
Simmesport was founded in 1820 by William Simmes, a planter from Virginia. He purchased the land from the local Native Americans and named the town after himself. The town was incorporated in 1845 and quickly became a thriving port town. It was a major shipping point for cotton, sugar, and other goods. The town was also a major stop on the New Orleans, Opelousas, and Great Western Railroad.
In the late 19th century, Simmesport was a popular destination for tourists. It was known for its beautiful scenery and its many outdoor activities, such as fishing, hunting, and boating. The town also had a number of hotels and restaurants.
In the early 20th century, Simmesport began to decline. The railroad stopped running and the town’s economy suffered. The Great Depression further weakened the town’s economy. In the 1950s, the town began to revive with the construction of the Simmesport Lock and Dam. The dam was built to control flooding on the Atchafalaya River.
Geography
Simmesport is located in Avoyelles Parish, Louisiana. It is situated on the banks of the Atchafalaya River, approximately 40 miles northwest of Baton Rouge. The town is surrounded by swampland and is located in the heart of Cajun Country.
The town has a total area of 1.3 square miles, all of which is land. The town is located at an elevation of 28 feet above sea level. The climate is humid subtropical, with hot, humid summers and mild winters.
Economy
Simmesport’s economy is largely based on agriculture and tourism. The town is home to several farms, which produce cotton, soybeans, corn, and other crops. The town is also home to several restaurants, hotels, and other businesses that cater to tourists.
The town is also home to the Simmesport Lock and Dam, which was built in the 1950s to control flooding on the Atchafalaya River. The dam is operated by the U.S. Army Corps of Engineers and provides jobs for many of the town’s residents.
Demographics
According to the 2010 census, Simmesport has a population of 1,845 people. The town has a median household income of $30,938 and a median age of 37.7 years. The town is predominantly white (77.3%) and African American (20.2%). The town also has a small Hispanic population (2.5%).
Conclusion
Simmesport is a small town located in Avoyelles Parish, Louisiana. It is situated on the banks of the Atchafalaya River, approximately 40 miles northwest of Baton Rouge. The town has a population of 1,845 people, according to the 2010 census. The town’s economy is largely based on agriculture and tourism. The town is also home to the Simmesport Lock and Dam, which was built in the 1950s to control flooding on the Atchafalaya River. The town is predominantly white (77.3%) and African American (20.2%). The town also has a small Hispanic population (2.5%).
Common Questions
What is Per Capita Income in Simmesport?
Per Capita income in Simmesport is $18,363.
What is the Median Family Income in Simmesport?
Median Family Income in Simmesport is $29,706.
What is the Median Household income in Simmesport?
Median Household Income in Simmesport is $19,592.
What is Income or Wage Gap in Simmesport?
Income or Wage Gap in Simmesport is 55.8%.
Women in Simmesport earn 44.2 cents for every dollar earned by a man.
What is Family Income Deficit in Simmesport?
Family Income Deficit in Simmesport is $15,809.
Families that are below poverty line in Simmesport earn $15,809 less on average than the poverty threshold level.
What is Inequality or Gini Index in Simmesport?
Inequality or Gini Index in Simmesport is 0.62.
What is the Total Population of Simmesport?
Total Population of Simmesport is 1,308.
What is the Total Male Population of Simmesport?
Total Male Population of Simmesport is 572.
What is the Total Female Population of Simmesport?
Total Female Population of Simmesport is 736.
What is the Ratio of Males per 100 Females in Simmesport?
There are 77.72 Males per 100 Females in Simmesport.
What is the Ratio of Females per 100 Males in Simmesport?
There are 128.67 Females per 100 Males in Simmesport.
What is the Median Population Age in Simmesport?
Median Population Age in Simmesport is 47.2 Years.
What is the Average Family Size in Simmesport
Average Family Size in Simmesport is 3.1 People.
What is the Average Household Size in Simmesport
Average Household Size in Simmesport is 2.1 People.
How Large is the Labor Force in Simmesport?
There are 438 People in the Labor Forcein in Simmesport.
What is the Percentage of People in the Labor Force in Simmesport?
42.5% of People are in the Labor Force in Simmesport.
What is the Unemployment Rate in Simmesport?
Unemployment Rate in Simmesport is 7.3%.