Zip Codes with the Highest Percentage of Population Employed in Computer & Mathematics in Louisiana
RELATED REPORTS & OPTIONS
Computer & Mathematics
Louisiana
Compare Zip Codes
Map of Zip Codes with the Highest Percentage of Population Employed in Computer & Mathematics in Louisiana
0.0%
20.0%
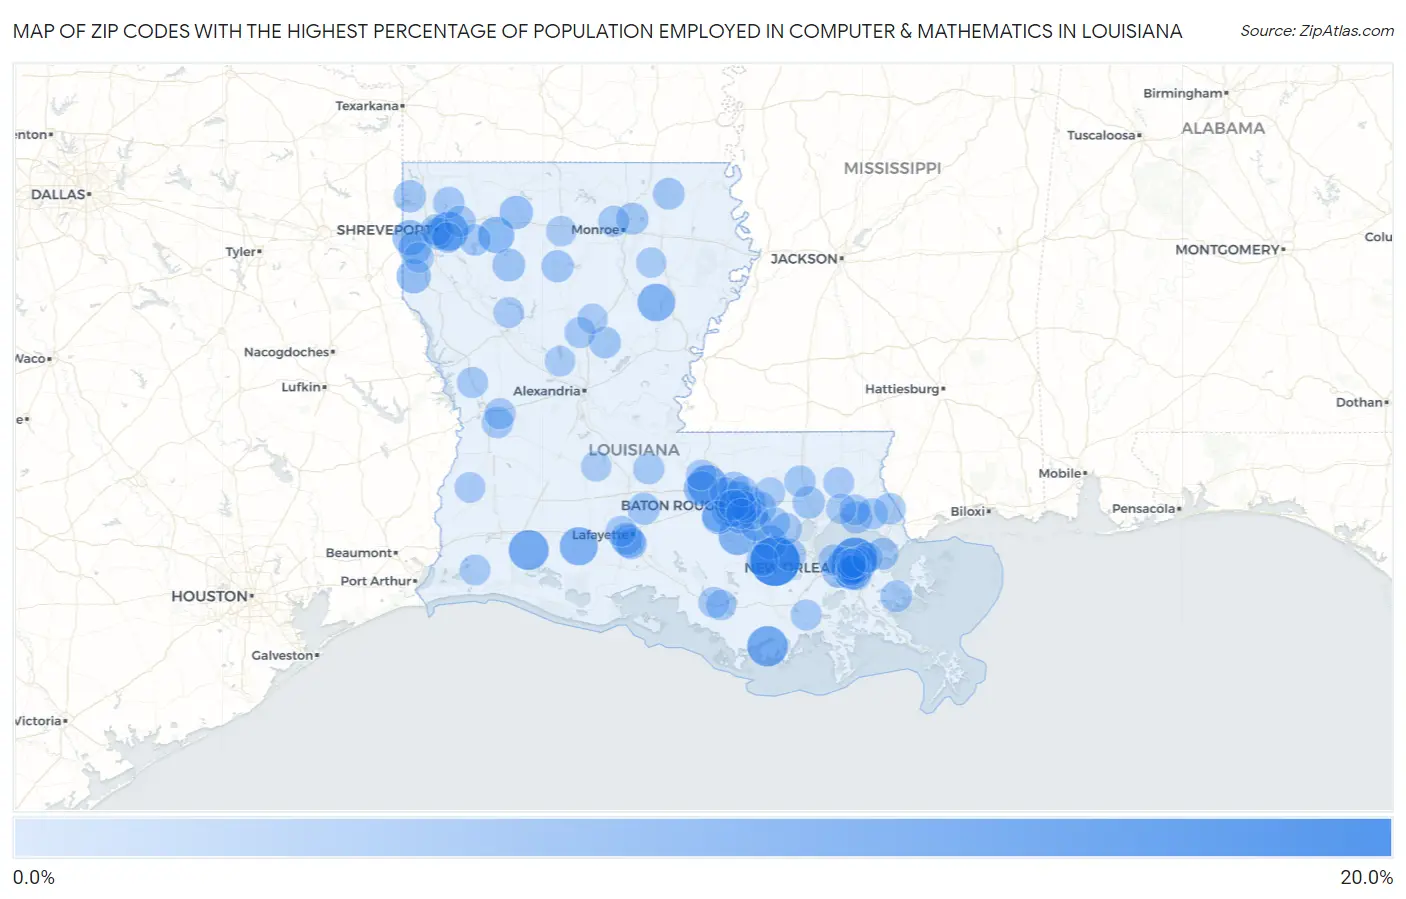
Zip Codes with the Highest Percentage of Population Employed in Computer & Mathematics in Louisiana
| Zip Code | % Employed | vs State | vs National | |
| 1. | 70743 | 16.2% | 1.7%(+14.5)#1 | 3.5%(+12.7)#212 |
| 2. | 70148 | 12.7% | 1.7%(+11.0)#2 | 3.5%(+9.20)#380 |
| 3. | 70397 | 9.5% | 1.7%(+7.80)#3 | 3.5%(+5.96)#801 |
| 4. | 70646 | 9.1% | 1.7%(+7.40)#4 | 3.5%(+5.57)#886 |
| 5. | 70729 | 9.0% | 1.7%(+7.27)#5 | 3.5%(+5.43)#908 |
| 6. | 71110 | 8.5% | 1.7%(+6.80)#6 | 3.5%(+4.96)#1,054 |
| 7. | 70559 | 7.7% | 1.7%(+6.01)#7 | 3.5%(+4.17)#1,318 |
| 8. | 70721 | 7.4% | 1.7%(+5.72)#8 | 3.5%(+3.88)#1,423 |
| 9. | 71243 | 7.3% | 1.7%(+5.63)#9 | 3.5%(+3.79)#1,455 |
| 10. | 71024 | 6.3% | 1.7%(+4.62)#10 | 3.5%(+2.78)#2,077 |
| 11. | 70752 | 5.5% | 1.7%(+3.85)#11 | 3.5%(+2.01)#2,741 |
| 12. | 70812 | 5.5% | 1.7%(+3.79)#12 | 3.5%(+1.96)#2,806 |
| 13. | 71033 | 5.4% | 1.7%(+3.73)#13 | 3.5%(+1.89)#2,876 |
| 14. | 70803 | 5.0% | 1.7%(+3.35)#14 | 3.5%(+1.51)#3,321 |
| 15. | 71046 | 5.0% | 1.7%(+3.28)#15 | 3.5%(+1.44)#3,393 |
| 16. | 70778 | 4.9% | 1.7%(+3.22)#16 | 3.5%(+1.38)#3,497 |
| 17. | 70710 | 4.4% | 1.7%(+2.71)#17 | 3.5%(+0.873)#4,273 |
| 18. | 71003 | 4.3% | 1.7%(+2.61)#18 | 3.5%(+0.776)#4,432 |
| 19. | 70130 | 4.3% | 1.7%(+2.58)#19 | 3.5%(+0.739)#4,490 |
| 20. | 71129 | 4.2% | 1.7%(+2.51)#20 | 3.5%(+0.671)#4,618 |
| 21. | 70819 | 4.2% | 1.7%(+2.49)#21 | 3.5%(+0.649)#4,667 |
| 22. | 70123 | 4.1% | 1.7%(+2.44)#22 | 3.5%(+0.605)#4,759 |
| 23. | 70118 | 4.1% | 1.7%(+2.43)#23 | 3.5%(+0.593)#4,780 |
| 24. | 71016 | 3.9% | 1.7%(+2.23)#24 | 3.5%(+0.397)#5,206 |
| 25. | 70503 | 3.7% | 1.7%(+2.02)#25 | 3.5%(+0.181)#5,711 |
| 26. | 71061 | 3.6% | 1.7%(+1.88)#26 | 3.5%(+0.047)#6,005 |
| 27. | 70403 | 3.5% | 1.7%(+1.83)#27 | 3.5%(-0.009)#6,166 |
| 28. | 70051 | 3.5% | 1.7%(+1.82)#28 | 3.5%(-0.013)#6,180 |
| 29. | 70810 | 3.5% | 1.7%(+1.76)#29 | 3.5%(-0.074)#6,343 |
| 30. | 71251 | 3.4% | 1.7%(+1.73)#30 | 3.5%(-0.110)#6,440 |
| 31. | 70115 | 3.4% | 1.7%(+1.73)#31 | 3.5%(-0.111)#6,443 |
| 32. | 70448 | 3.4% | 1.7%(+1.70)#32 | 3.5%(-0.139)#6,526 |
| 33. | 71203 | 3.3% | 1.7%(+1.65)#33 | 3.5%(-0.190)#6,664 |
| 34. | 70512 | 3.3% | 1.7%(+1.64)#34 | 3.5%(-0.197)#6,690 |
| 35. | 70086 | 3.3% | 1.7%(+1.63)#35 | 3.5%(-0.205)#6,720 |
| 36. | 70726 | 3.3% | 1.7%(+1.63)#36 | 3.5%(-0.210)#6,733 |
| 37. | 70129 | 3.3% | 1.7%(+1.60)#37 | 3.5%(-0.240)#6,829 |
| 38. | 71104 | 3.2% | 1.7%(+1.54)#38 | 3.5%(-0.297)#7,006 |
| 39. | 70769 | 3.2% | 1.7%(+1.48)#39 | 3.5%(-0.362)#7,214 |
| 40. | 70506 | 3.1% | 1.7%(+1.44)#40 | 3.5%(-0.397)#7,333 |
| 41. | 70808 | 3.1% | 1.7%(+1.43)#41 | 3.5%(-0.405)#7,354 |
| 42. | 71371 | 3.1% | 1.7%(+1.43)#42 | 3.5%(-0.406)#7,359 |
| 43. | 71261 | 3.1% | 1.7%(+1.42)#43 | 3.5%(-0.416)#7,383 |
| 44. | 70714 | 3.1% | 1.7%(+1.40)#44 | 3.5%(-0.435)#7,439 |
| 45. | 70817 | 3.0% | 1.7%(+1.35)#45 | 3.5%(-0.482)#7,592 |
| 46. | 70085 | 3.0% | 1.7%(+1.32)#46 | 3.5%(-0.513)#7,699 |
| 47. | 70452 | 3.0% | 1.7%(+1.32)#47 | 3.5%(-0.515)#7,707 |
| 48. | 71459 | 3.0% | 1.7%(+1.30)#48 | 3.5%(-0.540)#7,804 |
| 49. | 70443 | 3.0% | 1.7%(+1.28)#49 | 3.5%(-0.561)#7,867 |
| 50. | 71023 | 2.9% | 1.7%(+1.26)#50 | 3.5%(-0.581)#7,956 |
| 51. | 71006 | 2.9% | 1.7%(+1.21)#51 | 3.5%(-0.631)#8,126 |
| 52. | 70002 | 2.9% | 1.7%(+1.18)#52 | 3.5%(-0.657)#8,223 |
| 53. | 71101 | 2.8% | 1.7%(+1.16)#53 | 3.5%(-0.680)#8,295 |
| 54. | 70449 | 2.8% | 1.7%(+1.15)#54 | 3.5%(-0.691)#8,333 |
| 55. | 71037 | 2.8% | 1.7%(+1.09)#55 | 3.5%(-0.749)#8,544 |
| 56. | 71358 | 2.8% | 1.7%(+1.08)#56 | 3.5%(-0.756)#8,569 |
| 57. | 70802 | 2.7% | 1.7%(+1.04)#57 | 3.5%(-0.802)#8,739 |
| 58. | 70508 | 2.7% | 1.7%(+1.03)#58 | 3.5%(-0.809)#8,762 |
| 59. | 70719 | 2.7% | 1.7%(+0.999)#59 | 3.5%(-0.839)#8,895 |
| 60. | 71432 | 2.7% | 1.7%(+0.983)#60 | 3.5%(-0.854)#8,950 |
| 61. | 71291 | 2.7% | 1.7%(+0.982)#61 | 3.5%(-0.855)#8,953 |
| 62. | 71446 | 2.6% | 1.7%(+0.956)#62 | 3.5%(-0.882)#9,051 |
| 63. | 70065 | 2.6% | 1.7%(+0.954)#63 | 3.5%(-0.883)#9,057 |
| 64. | 70445 | 2.6% | 1.7%(+0.951)#64 | 3.5%(-0.887)#9,075 |
| 65. | 71429 | 2.6% | 1.7%(+0.950)#65 | 3.5%(-0.888)#9,076 |
| 66. | 70583 | 2.6% | 1.7%(+0.936)#66 | 3.5%(-0.902)#9,136 |
| 67. | 70126 | 2.6% | 1.7%(+0.920)#67 | 3.5%(-0.918)#9,182 |
| 68. | 70471 | 2.6% | 1.7%(+0.914)#68 | 3.5%(-0.924)#9,208 |
| 69. | 70374 | 2.6% | 1.7%(+0.894)#69 | 3.5%(-0.943)#9,286 |
| 70. | 70119 | 2.6% | 1.7%(+0.881)#70 | 3.5%(-0.956)#9,337 |
| 71. | 70392 | 2.6% | 1.7%(+0.871)#71 | 3.5%(-0.967)#9,387 |
| 72. | 71411 | 2.5% | 1.7%(+0.836)#72 | 3.5%(-1.00)#9,545 |
| 73. | 70116 | 2.5% | 1.7%(+0.819)#73 | 3.5%(-1.02)#9,613 |
| 74. | 70645 | 2.5% | 1.7%(+0.794)#74 | 3.5%(-1.04)#9,726 |
| 75. | 70437 | 2.5% | 1.7%(+0.789)#75 | 3.5%(-1.05)#9,742 |
| 76. | 70053 | 2.4% | 1.7%(+0.750)#76 | 3.5%(-1.09)#9,896 |
| 77. | 70660 | 2.4% | 1.7%(+0.714)#77 | 3.5%(-1.12)#10,031 |
| 78. | 70807 | 2.4% | 1.7%(+0.713)#78 | 3.5%(-1.12)#10,037 |
| 79. | 70113 | 2.4% | 1.7%(+0.699)#79 | 3.5%(-1.14)#10,091 |
| 80. | 70783 | 2.4% | 1.7%(+0.689)#80 | 3.5%(-1.15)#10,130 |
| 81. | 70816 | 2.4% | 1.7%(+0.669)#81 | 3.5%(-1.17)#10,204 |
| 82. | 70815 | 2.3% | 1.7%(+0.653)#82 | 3.5%(-1.18)#10,268 |
| 83. | 70818 | 2.3% | 1.7%(+0.651)#83 | 3.5%(-1.19)#10,277 |
| 84. | 70342 | 2.3% | 1.7%(+0.629)#84 | 3.5%(-1.21)#10,381 |
| 85. | 71112 | 2.3% | 1.7%(+0.608)#85 | 3.5%(-1.23)#10,480 |
| 86. | 71270 | 2.2% | 1.7%(+0.552)#86 | 3.5%(-1.29)#10,716 |
| 87. | 70586 | 2.2% | 1.7%(+0.542)#87 | 3.5%(-1.30)#10,762 |
| 88. | 70447 | 2.2% | 1.7%(+0.516)#88 | 3.5%(-1.32)#10,872 |
| 89. | 70733 | 2.2% | 1.7%(+0.511)#89 | 3.5%(-1.33)#10,899 |
| 90. | 70806 | 2.2% | 1.7%(+0.510)#90 | 3.5%(-1.33)#10,905 |
| 91. | 70785 | 2.2% | 1.7%(+0.500)#91 | 3.5%(-1.34)#10,943 |
| 92. | 71479 | 2.2% | 1.7%(+0.499)#92 | 3.5%(-1.34)#10,953 |
| 93. | 71417 | 2.2% | 1.7%(+0.492)#93 | 3.5%(-1.35)#10,990 |
| 94. | 70809 | 2.2% | 1.7%(+0.480)#94 | 3.5%(-1.36)#11,043 |
| 95. | 70125 | 2.2% | 1.7%(+0.474)#95 | 3.5%(-1.36)#11,066 |
| 96. | 71047 | 2.2% | 1.7%(+0.472)#96 | 3.5%(-1.37)#11,079 |
| 97. | 70122 | 2.2% | 1.7%(+0.465)#97 | 3.5%(-1.37)#11,107 |
| 98. | 70128 | 2.1% | 1.7%(+0.460)#98 | 3.5%(-1.38)#11,133 |
| 99. | 70124 | 2.1% | 1.7%(+0.429)#99 | 3.5%(-1.41)#11,270 |
| 100. | 71259 | 2.1% | 1.7%(+0.427)#100 | 3.5%(-1.41)#11,285 |
Common Questions
What are the Top 10 Zip Codes with the Highest Percentage of Population Employed in Computer & Mathematics in Louisiana?
Top 10 Zip Codes with the Highest Percentage of Population Employed in Computer & Mathematics in Louisiana are:
What zip code has the Highest Percentage of Population Employed in Computer & Mathematics in Louisiana?
70743 has the Highest Percentage of Population Employed in Computer & Mathematics in Louisiana with 16.2%.
What is the Percentage of Population Employed in Computer & Mathematics in the State of Louisiana?
Percentage of Population Employed in Computer & Mathematics in Louisiana is 1.7%.
What is the Percentage of Population Employed in Computer & Mathematics in the United States?
Percentage of Population Employed in Computer & Mathematics in the United States is 3.5%.