Zip Codes with the Highest Percentage of Population Employed in Computer & Mathematics in Ruston, LA
RELATED REPORTS & OPTIONS
Computer & Mathematics
Ruston
Compare Zip Codes
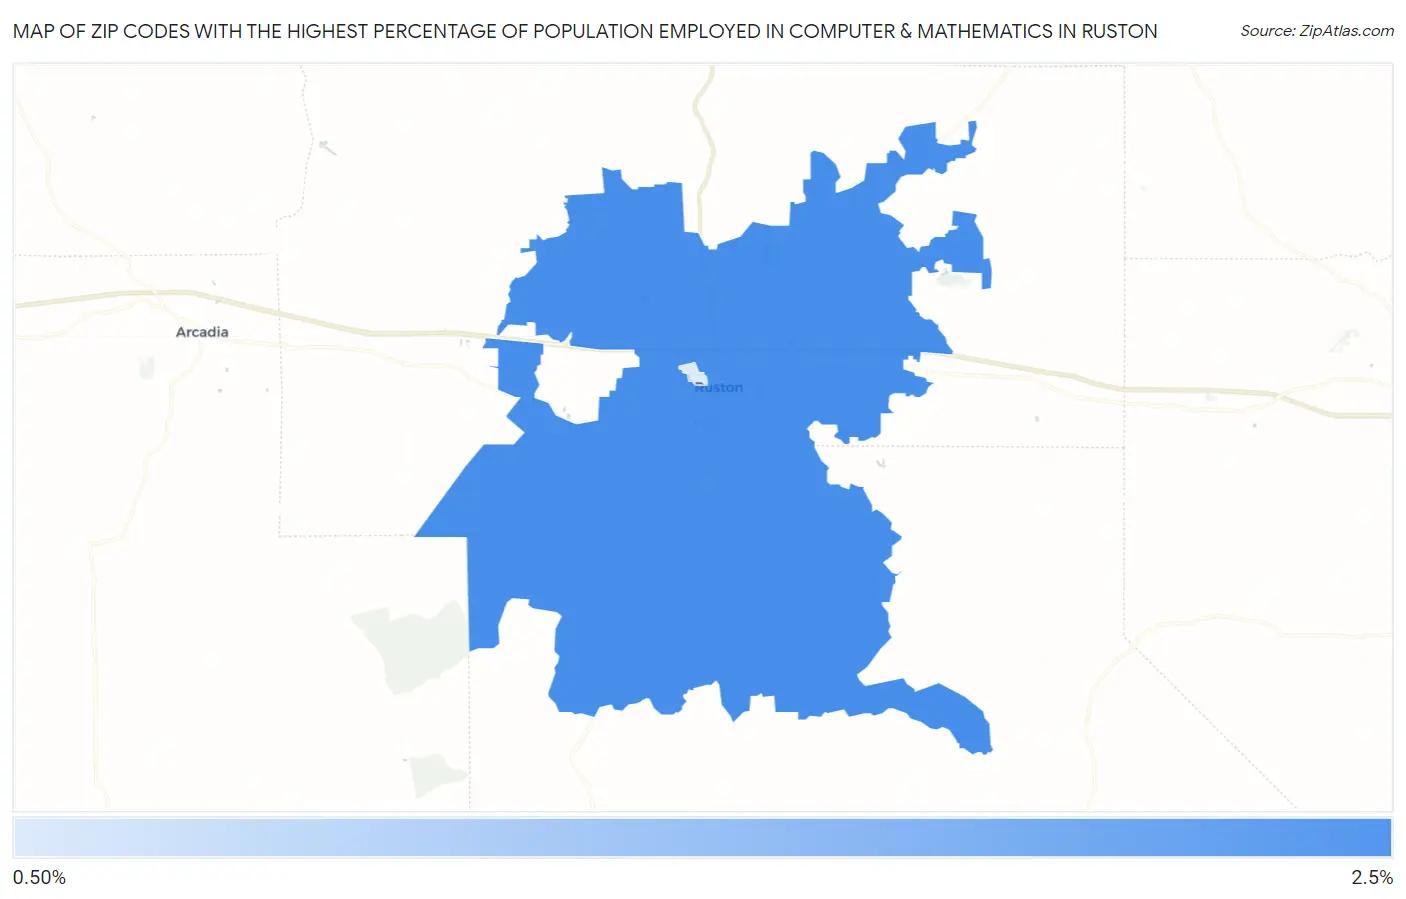
Map of Zip Codes with the Highest Percentage of Population Employed in Computer & Mathematics in Ruston
1.2%
2.2%
Zip Codes with the Highest Percentage of Population Employed in Computer & Mathematics in Ruston, LA
| Zip Code | % Employed | vs State | vs National | |
| 1. | 71270 | 2.2% | 1.7%(+0.552)#86 | 3.5%(-1.29)#10,716 |
| 2. | 71272 | 1.2% | 1.7%(-0.457)#178 | 3.5%(-2.29)#15,964 |
1
Common Questions
What are the Top Zip Codes with the Highest Percentage of Population Employed in Computer & Mathematics in Ruston, LA?
Top Zip Codes with the Highest Percentage of Population Employed in Computer & Mathematics in Ruston, LA are:
What zip code has the Highest Percentage of Population Employed in Computer & Mathematics in Ruston, LA?
71270 has the Highest Percentage of Population Employed in Computer & Mathematics in Ruston, LA with 2.2%.
What is the Percentage of Population Employed in Computer & Mathematics in Ruston, LA?
Percentage of Population Employed in Computer & Mathematics in Ruston is 2.2%.
What is the Percentage of Population Employed in Computer & Mathematics in Louisiana?
Percentage of Population Employed in Computer & Mathematics in Louisiana is 1.7%.
What is the Percentage of Population Employed in Computer & Mathematics in the United States?
Percentage of Population Employed in Computer & Mathematics in the United States is 3.5%.