Lee, FL Map & Demographics
Lee Map
Lee Overview
$16,654
PER CAPITA INCOME
$40,588
AVG HOUSEHOLD INCOME
0.49
INEQUALITY / GINI INDEX
778
TOTAL POPULATION
420
MALE POPULATION
358
FEMALE POPULATION
117.32
MALES / 100 FEMALES
85.24
FEMALES / 100 MALES
38.0
MEDIAN AGE
3.2
AVG FAMILY SIZE
2.7
AVG HOUSEHOLD SIZE
383
LABOR FORCE [ PEOPLE ]
60.6%
PERCENT IN LABOR FORCE
1.6%
UNEMPLOYMENT RATE
Lee Zip Codes
Income in Lee
Income Overview in Lee
| Characteristic | Number | Measure |
| Per Capita Income | 778 | $16,654 |
| Median Family Income | 178 | $0 |
| Mean Family Income | 178 | $44,190 |
| Median Household Income | 286 | $40,588 |
| Mean Household Income | 286 | $44,040 |
| Income Deficit | 178 | $0 |
| Wage / Income Gap (%) | 778 | 0.00% |
| Wage / Income Gap ($) | 778 | 100.00¢ per $1 |
| Gini / Inequality Index | 778 | 0.49 |
Earnings by Sex in Lee
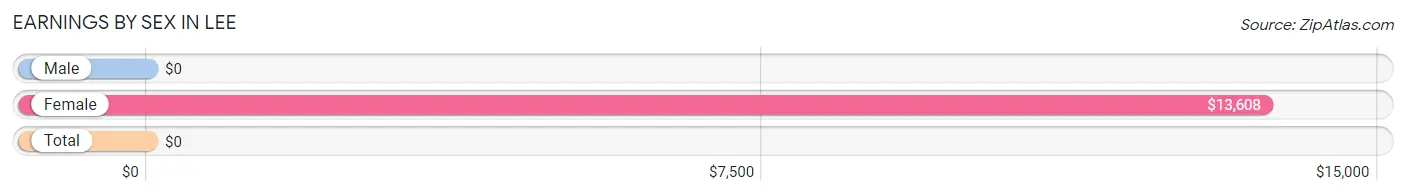
| Sex | Number | Average Earnings |
| Male | 192 (48.1%) | $0 |
| Female | 207 (51.9%) | $13,608 |
| Total | 399 (100.0%) | $0 |
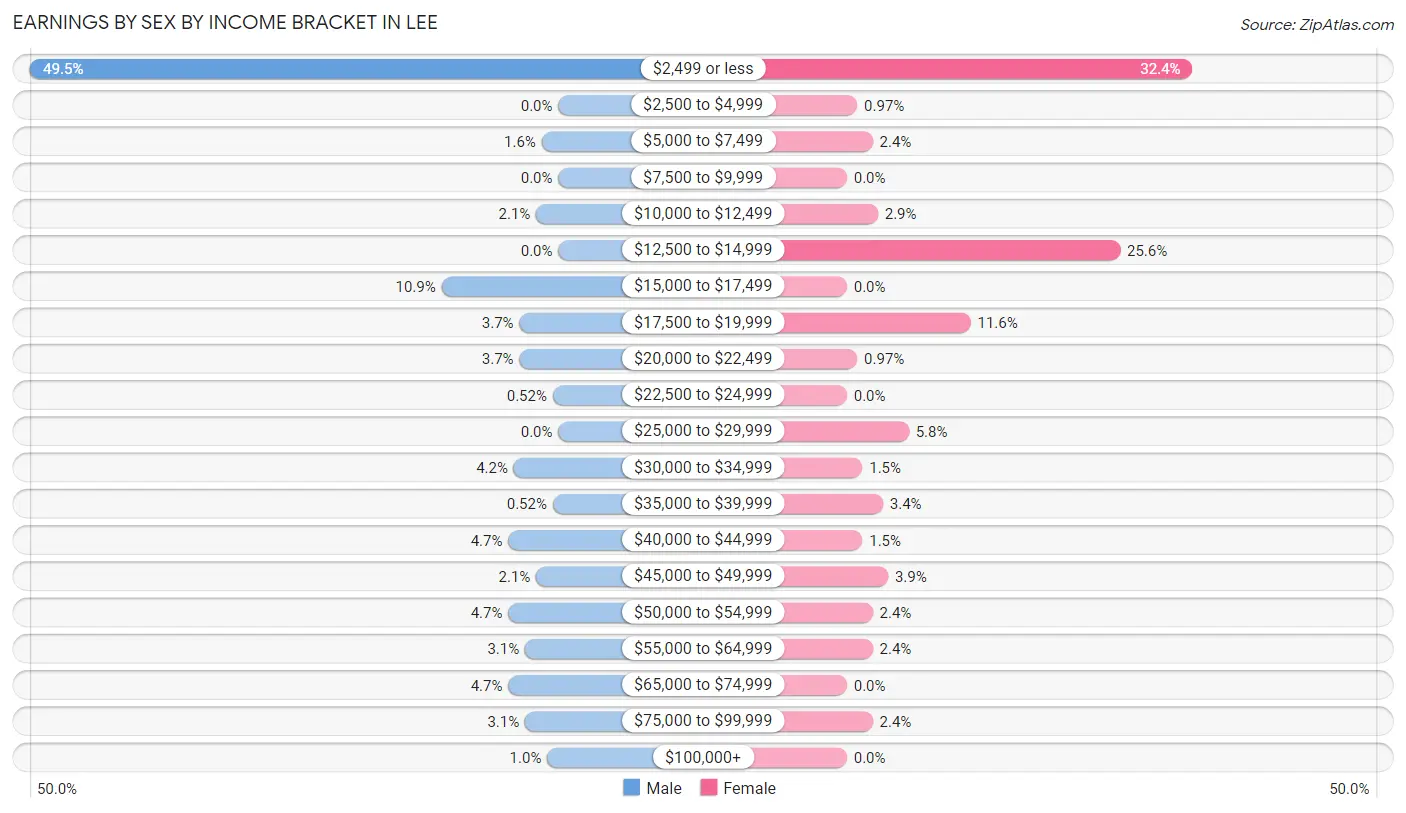
Earnings by Sex by Income Bracket in Lee
The most common earnings brackets in Lee are $2,499 or less for men (95 | 49.5%) and $2,499 or less for women (67 | 32.4%).
| Income | Male | Female |
| $2,499 or less | 95 (49.5%) | 67 (32.4%) |
| $2,500 to $4,999 | 0 (0.0%) | 2 (1.0%) |
| $5,000 to $7,499 | 3 (1.6%) | 5 (2.4%) |
| $7,500 to $9,999 | 0 (0.0%) | 0 (0.0%) |
| $10,000 to $12,499 | 4 (2.1%) | 6 (2.9%) |
| $12,500 to $14,999 | 0 (0.0%) | 53 (25.6%) |
| $15,000 to $17,499 | 21 (10.9%) | 0 (0.0%) |
| $17,500 to $19,999 | 7 (3.6%) | 24 (11.6%) |
| $20,000 to $22,499 | 7 (3.6%) | 2 (1.0%) |
| $22,500 to $24,999 | 1 (0.5%) | 0 (0.0%) |
| $25,000 to $29,999 | 0 (0.0%) | 12 (5.8%) |
| $30,000 to $34,999 | 8 (4.2%) | 3 (1.5%) |
| $35,000 to $39,999 | 1 (0.5%) | 7 (3.4%) |
| $40,000 to $44,999 | 9 (4.7%) | 3 (1.5%) |
| $45,000 to $49,999 | 4 (2.1%) | 8 (3.9%) |
| $50,000 to $54,999 | 9 (4.7%) | 5 (2.4%) |
| $55,000 to $64,999 | 6 (3.1%) | 5 (2.4%) |
| $65,000 to $74,999 | 9 (4.7%) | 0 (0.0%) |
| $75,000 to $99,999 | 6 (3.1%) | 5 (2.4%) |
| $100,000+ | 2 (1.0%) | 0 (0.0%) |
| Total | 192 (100.0%) | 207 (100.0%) |
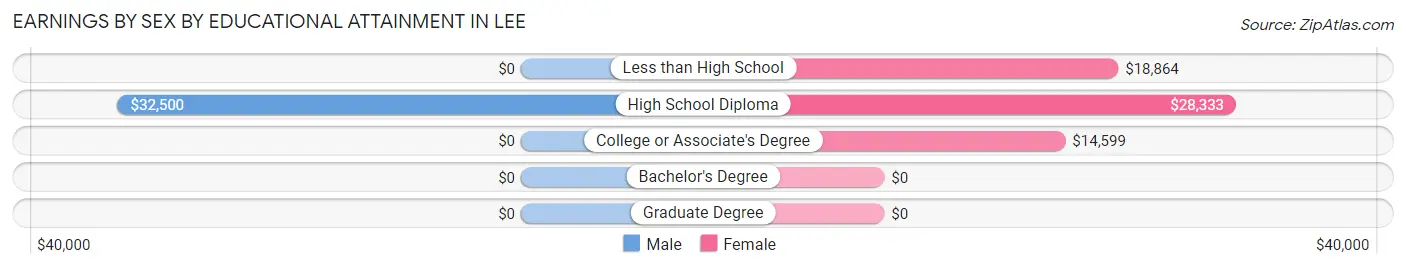
Earnings by Sex by Educational Attainment in Lee
Average earnings in Lee are $35,000 for men and $18,229 for women, a difference of 47.9%. Men with an educational attainment of high school diploma enjoy the highest average annual earnings of $32,500, while those with high school diploma education earn the least with $32,500. Women with an educational attainment of high school diploma earn the most with the average annual earnings of $28,333, while those with college or associate's degree education have the smallest earnings of $14,599.
| Educational Attainment | Male Income | Female Income |
| Less than High School | - | - |
| High School Diploma | $32,500 | $28,333 |
| College or Associate's Degree | - | - |
| Bachelor's Degree | - | - |
| Graduate Degree | - | - |
| Total | $35,000 | $18,229 |
Family Income in Lee
Family Income Brackets in Lee
According to the Lee family income data, there are 64 families falling into the less than $10,000 income range, which is the most common income bracket and makes up 36.0% of all families. Conversely, the $150,000 to $199,999 income bracket is the least frequent group with only 1 families (0.6%) belonging to this category.
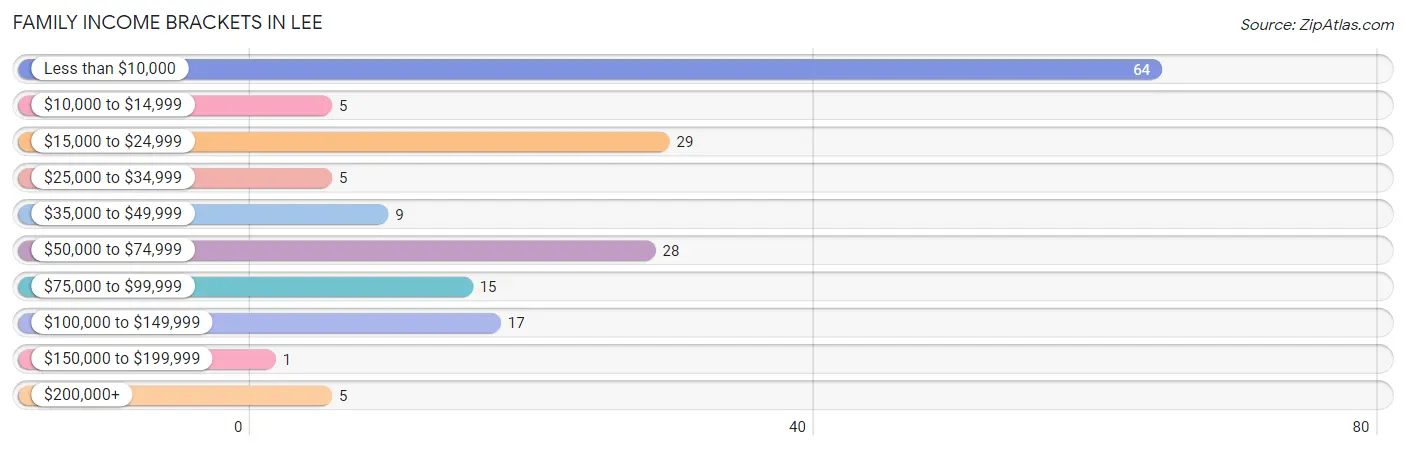
| Income Bracket | # Families | % Families |
| Less than $10,000 | 64 | 36.0% |
| $10,000 to $14,999 | 5 | 2.8% |
| $15,000 to $24,999 | 29 | 16.3% |
| $25,000 to $34,999 | 5 | 2.8% |
| $35,000 to $49,999 | 9 | 5.1% |
| $50,000 to $74,999 | 28 | 15.7% |
| $75,000 to $99,999 | 15 | 8.4% |
| $100,000 to $149,999 | 17 | 9.6% |
| $150,000 to $199,999 | 1 | 0.6% |
| $200,000+ | 5 | 2.8% |
Family Income by Famaliy Size in Lee
| Income Bracket | # Families | Median Income |
| 2-Person Families | 91 (51.1%) | $0 |
| 3-Person Families | 40 (22.5%) | $0 |
| 4-Person Families | 34 (19.1%) | $0 |
| 5-Person Families | 8 (4.5%) | $0 |
| 6-Person Families | 0 (0.0%) | $0 |
| 7+ Person Families | 5 (2.8%) | $0 |
| Total | 178 (100.0%) | $0 |
Family Income by Number of Earners in Lee
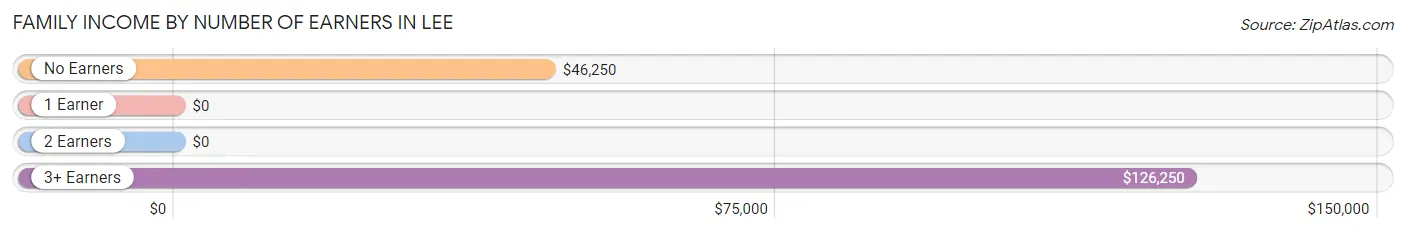
| Number of Earners | # Families | Median Income |
| No Earners | 16 (9.0%) | $46,250 |
| 1 Earner | 45 (25.3%) | $0 |
| 2 Earners | 98 (55.1%) | $0 |
| 3+ Earners | 19 (10.7%) | $126,250 |
| Total | 178 (100.0%) | $0 |
Household Income in Lee
Household Income Brackets in Lee
With 85 households falling in the category, the $35,000 to $49,999 income range is the most frequent in Lee, accounting for 29.7% of all households. In contrast, only 3 households (1.1%) fall into the $150,000 to $199,999 income bracket, making it the least populous group.
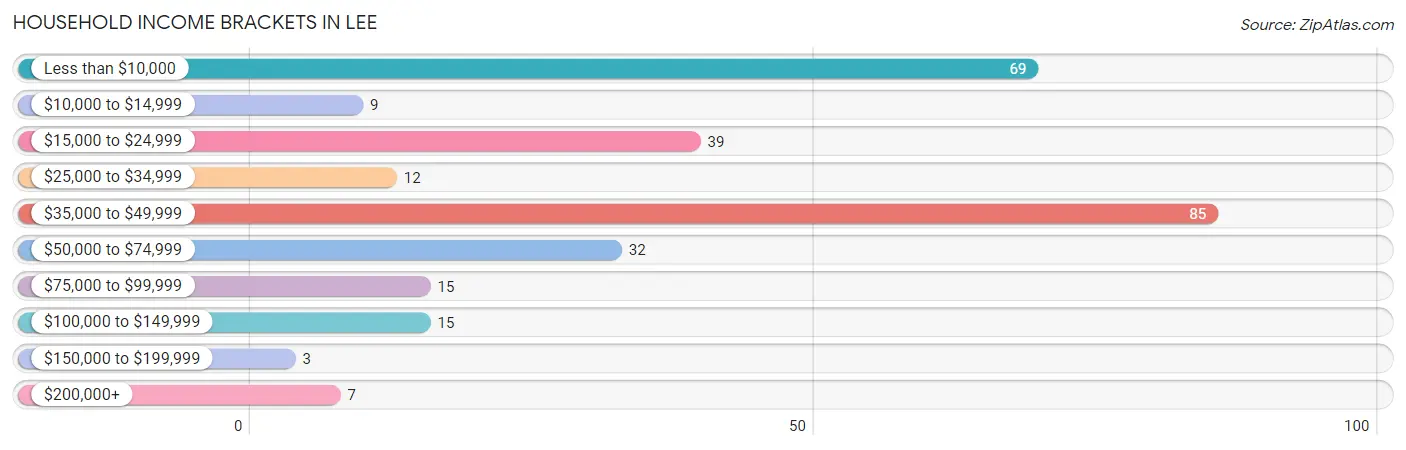
| Income Bracket | # Households | % Households |
| Less than $10,000 | 69 | 24.1% |
| $10,000 to $14,999 | 9 | 3.1% |
| $15,000 to $24,999 | 39 | 13.6% |
| $25,000 to $34,999 | 12 | 4.2% |
| $35,000 to $49,999 | 85 | 29.7% |
| $50,000 to $74,999 | 32 | 11.2% |
| $75,000 to $99,999 | 15 | 5.2% |
| $100,000 to $149,999 | 15 | 5.2% |
| $150,000 to $199,999 | 3 | 1.0% |
| $200,000+ | 7 | 2.4% |
Household Income by Householder Age in Lee
The median household income in Lee is $40,588, with the highest median household income of $65,000 found in the 25 to 44 years age bracket for the primary householder. A total of 54 households (18.9%) fall into this category. Meanwhile, the 15 to 24 years age bracket for the primary householder has the lowest median household income of $0, with 69 households (24.1%) in this group.
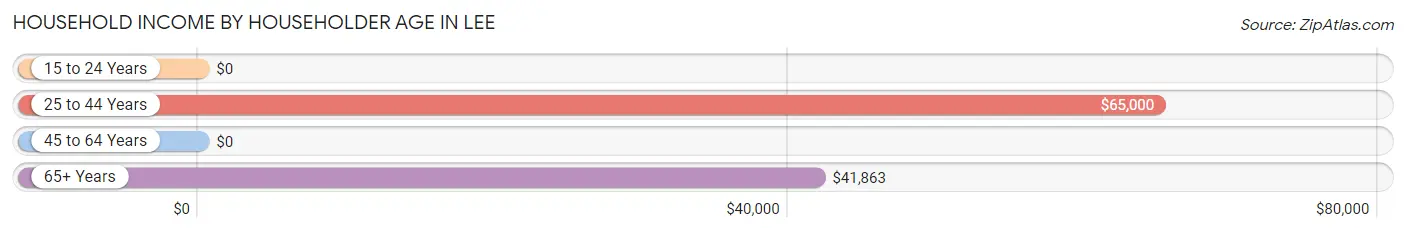
| Income Bracket | # Households | Median Income |
| 15 to 24 Years | 69 (24.1%) | $0 |
| 25 to 44 Years | 54 (18.9%) | $65,000 |
| 45 to 64 Years | 51 (17.8%) | $0 |
| 65+ Years | 112 (39.2%) | $41,863 |
| Total | 286 (100.0%) | $40,588 |
Poverty in Lee
Income Below Poverty by Sex and Age in Lee
With 58.8% poverty level for males and 41.3% for females among the residents of Lee, 18 to 24 year old males and 18 to 24 year old females are the most vulnerable to poverty, with 96 males (94.1%) and 69 females (98.6%) in their respective age groups living below the poverty level.
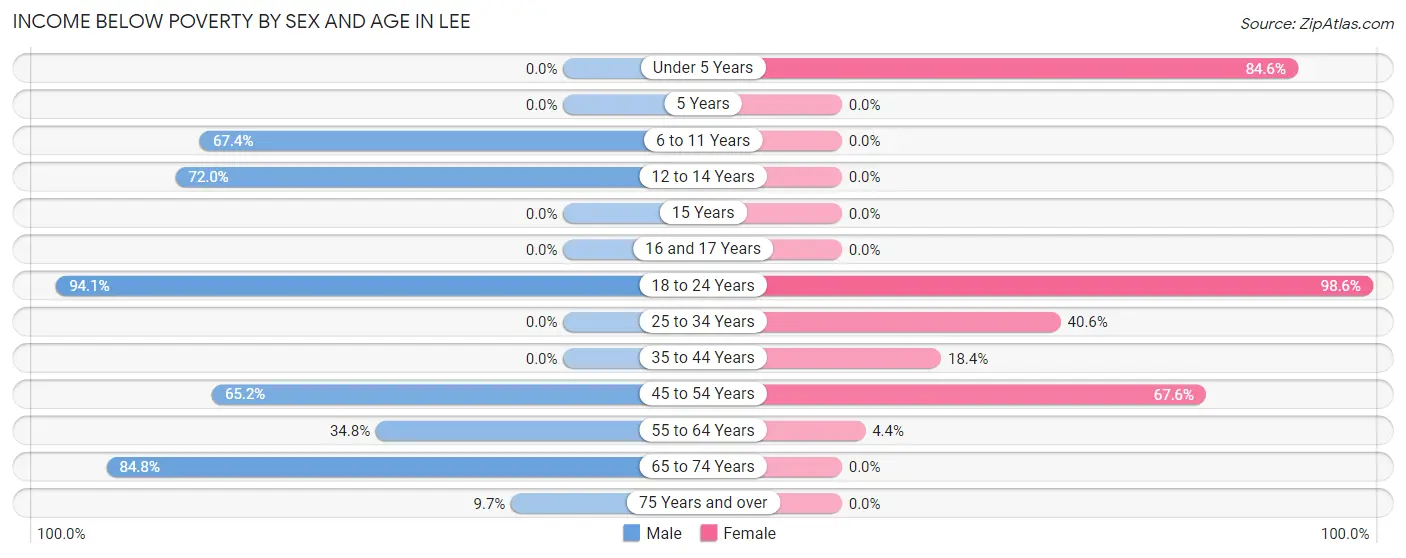
| Age Bracket | Male | Female |
| Under 5 Years | 0 (0.0%) | 33 (84.6%) |
| 5 Years | 0 (0.0%) | 0 (0.0%) |
| 6 to 11 Years | 29 (67.4%) | 0 (0.0%) |
| 12 to 14 Years | 18 (72.0%) | 0 (0.0%) |
| 15 Years | 0 (0.0%) | 0 (0.0%) |
| 16 and 17 Years | 0 (0.0%) | 0 (0.0%) |
| 18 to 24 Years | 96 (94.1%) | 69 (98.6%) |
| 25 to 34 Years | 0 (0.0%) | 13 (40.6%) |
| 35 to 44 Years | 0 (0.0%) | 7 (18.4%) |
| 45 to 54 Years | 15 (65.2%) | 25 (67.6%) |
| 55 to 64 Years | 8 (34.8%) | 1 (4.3%) |
| 65 to 74 Years | 78 (84.8%) | 0 (0.0%) |
| 75 Years and over | 3 (9.7%) | 0 (0.0%) |
| Total | 247 (58.8%) | 148 (41.3%) |
Income Above Poverty by Sex and Age in Lee
According to the poverty statistics in Lee, males aged under 5 years and females aged 6 to 11 years are the age groups that are most secure financially, with 100.0% of males and 100.0% of females in these age groups living above the poverty line.
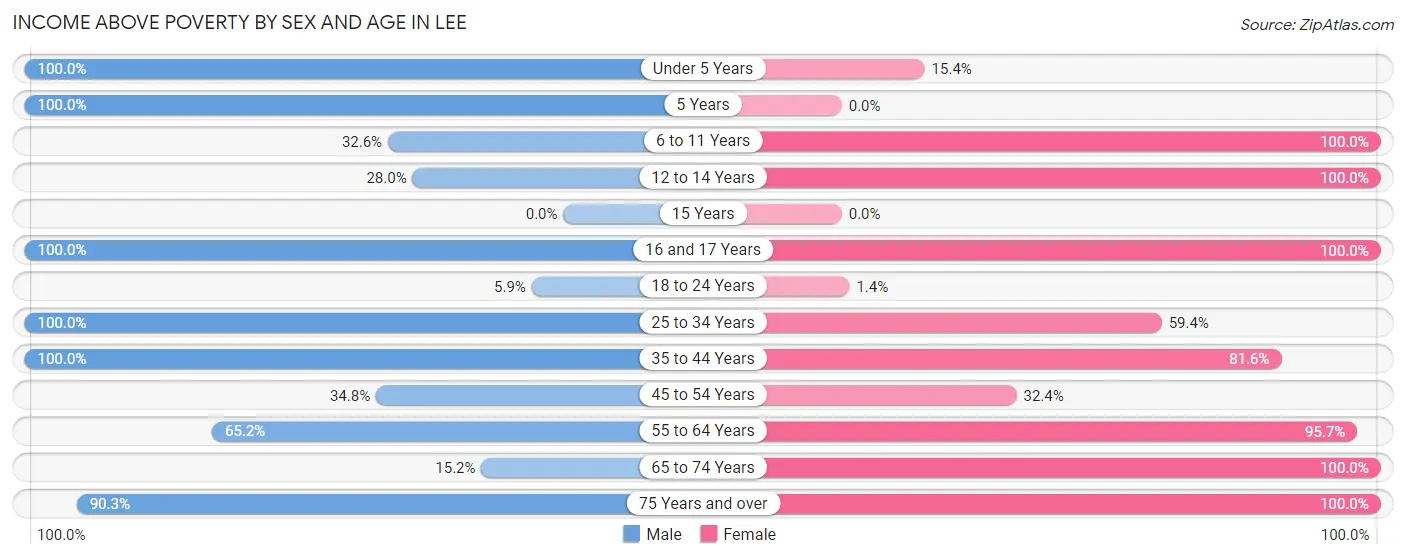
| Age Bracket | Male | Female |
| Under 5 Years | 8 (100.0%) | 6 (15.4%) |
| 5 Years | 4 (100.0%) | 0 (0.0%) |
| 6 to 11 Years | 14 (32.6%) | 21 (100.0%) |
| 12 to 14 Years | 7 (28.0%) | 6 (100.0%) |
| 15 Years | 0 (0.0%) | 0 (0.0%) |
| 16 and 17 Years | 7 (100.0%) | 8 (100.0%) |
| 18 to 24 Years | 6 (5.9%) | 1 (1.4%) |
| 25 to 34 Years | 12 (100.0%) | 19 (59.4%) |
| 35 to 44 Years | 50 (100.0%) | 31 (81.6%) |
| 45 to 54 Years | 8 (34.8%) | 12 (32.4%) |
| 55 to 64 Years | 15 (65.2%) | 22 (95.7%) |
| 65 to 74 Years | 14 (15.2%) | 81 (100.0%) |
| 75 Years and over | 28 (90.3%) | 3 (100.0%) |
| Total | 173 (41.2%) | 210 (58.7%) |
Income Below Poverty Among Married-Couple Families in Lee
The poverty statistics for married-couple families in Lee show that 57.5% or 84 of the total 146 families live below the poverty line. Families with no children have the highest poverty rate of 65.3%, comprising of 64 families. On the other hand, families with 3 or 4 children have the lowest poverty rate of 0.0%, which includes 0 families.
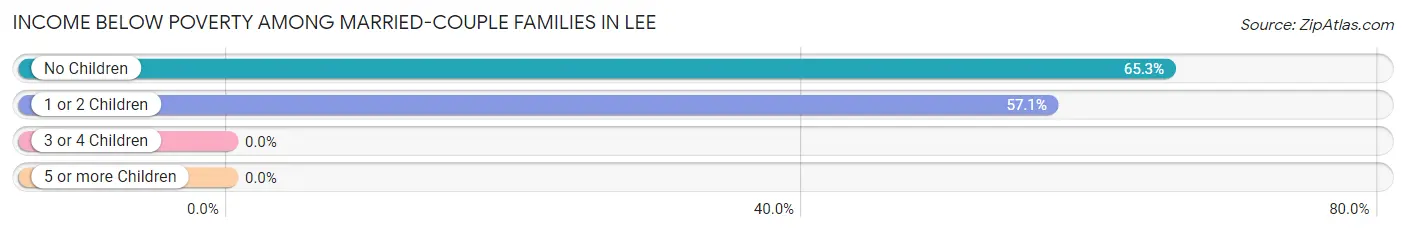
| Children | Above Poverty | Below Poverty |
| No Children | 34 (34.7%) | 64 (65.3%) |
| 1 or 2 Children | 15 (42.9%) | 20 (57.1%) |
| 3 or 4 Children | 13 (100.0%) | 0 (0.0%) |
| 5 or more Children | 0 (0.0%) | 0 (0.0%) |
| Total | 62 (42.5%) | 84 (57.5%) |
Income Below Poverty Among Single-Parent Households in Lee
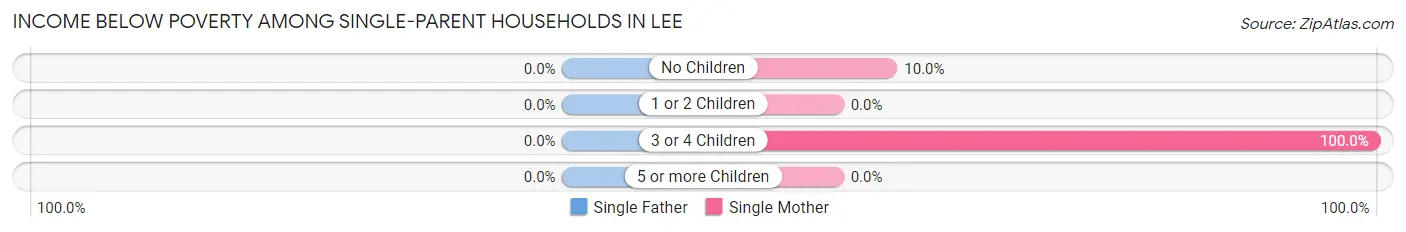
| Children | Single Father | Single Mother |
| No Children | 0 (0.0%) | 1 (10.0%) |
| 1 or 2 Children | 0 (0.0%) | 0 (0.0%) |
| 3 or 4 Children | 0 (0.0%) | 13 (100.0%) |
| 5 or more Children | 0 (0.0%) | 0 (0.0%) |
| Total | 0 (0.0%) | 14 (60.9%) |
Income Below Poverty Among Married-Couple vs Single-Parent Households in Lee
The poverty data for Lee shows that 84 of the married-couple family households (57.5%) and 14 of the single-parent households (43.8%) are living below the poverty level. Within the married-couple family households, those with no children have the highest poverty rate, with 64 households (65.3%) falling below the poverty line. Among the single-parent households, those with 3 or 4 children have the highest poverty rate, with 13 household (68.4%) living below poverty.
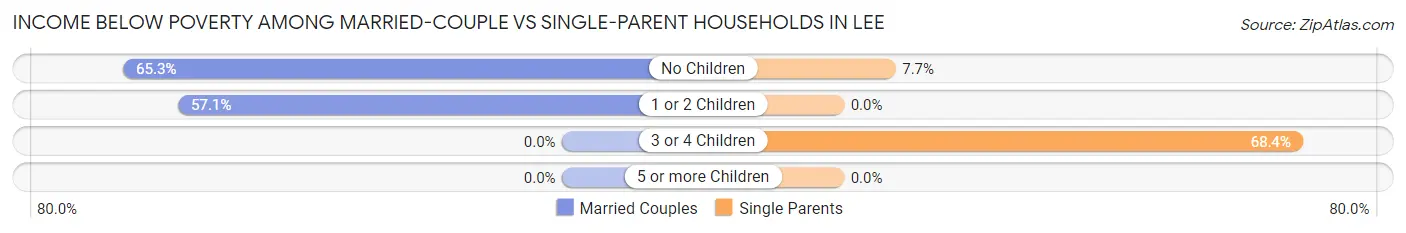
| Children | Married-Couple Families | Single-Parent Households |
| No Children | 64 (65.3%) | 1 (7.7%) |
| 1 or 2 Children | 20 (57.1%) | 0 (0.0%) |
| 3 or 4 Children | 0 (0.0%) | 13 (68.4%) |
| 5 or more Children | 0 (0.0%) | 0 (0.0%) |
| Total | 84 (57.5%) | 14 (43.8%) |
Race in Lee
The most populous races in Lee are White / Caucasian (459 | 59.0%), Hispanic or Latino (316 | 40.6%), and Some other Race (205 | 26.4%).
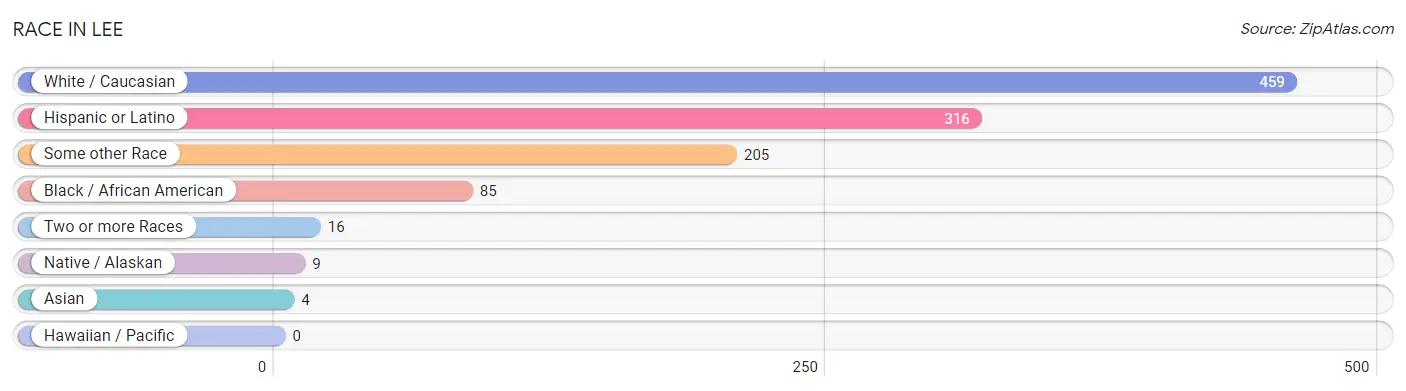
| Race | # Population | % Population |
| Asian | 4 | 0.5% |
| Black / African American | 85 | 10.9% |
| Hawaiian / Pacific | 0 | 0.0% |
| Hispanic or Latino | 316 | 40.6% |
| Native / Alaskan | 9 | 1.2% |
| White / Caucasian | 459 | 59.0% |
| Two or more Races | 16 | 2.1% |
| Some other Race | 205 | 26.4% |
| Total | 778 | 100.0% |
Ancestry in Lee
The most populous ancestries reported in Lee are Central American (101 | 13.0%), Nicaraguan (93 | 11.9%), Cuban (88 | 11.3%), American (87 | 11.2%), and Mexican (65 | 8.4%), together accounting for 55.8% of all Lee residents.
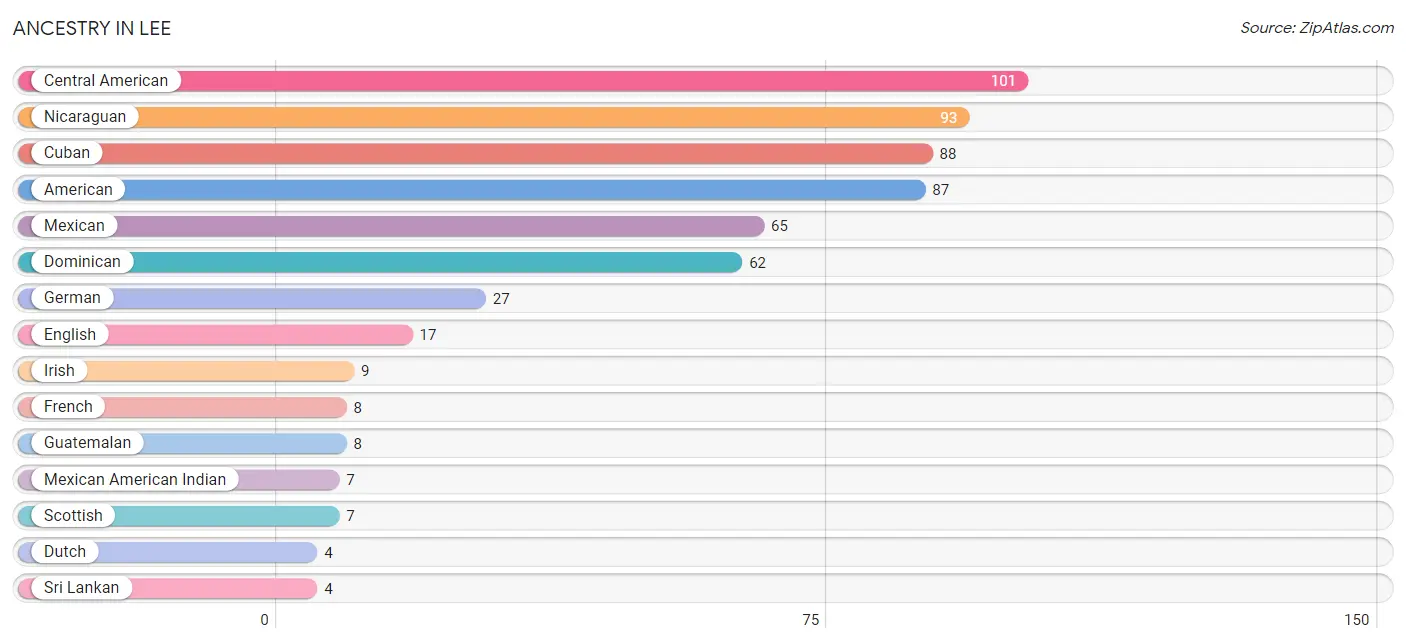
| Ancestry | # Population | % Population |
| American | 87 | 11.2% |
| Canadian | 2 | 0.3% |
| Central American | 101 | 13.0% |
| Central American Indian | 2 | 0.3% |
| Cuban | 88 | 11.3% |
| Dominican | 62 | 8.0% |
| Dutch | 4 | 0.5% |
| English | 17 | 2.2% |
| European | 3 | 0.4% |
| French | 8 | 1.0% |
| French Canadian | 2 | 0.3% |
| German | 27 | 3.5% |
| Guatemalan | 8 | 1.0% |
| Irish | 9 | 1.2% |
| Italian | 2 | 0.3% |
| Mexican | 65 | 8.4% |
| Mexican American Indian | 7 | 0.9% |
| Nicaraguan | 93 | 11.9% |
| Scottish | 7 | 0.9% |
| Sri Lankan | 4 | 0.5% |
| Swiss | 2 | 0.3% | View All 21 Rows |
Immigrants in Lee
The most numerous immigrant groups reported in Lee came from Central America (142 | 18.2%), Latin America (142 | 18.2%), Nicaragua (93 | 11.9%), Mexico (32 | 4.1%), and Guatemala (17 | 2.2%), together accounting for 54.7% of all Lee residents.
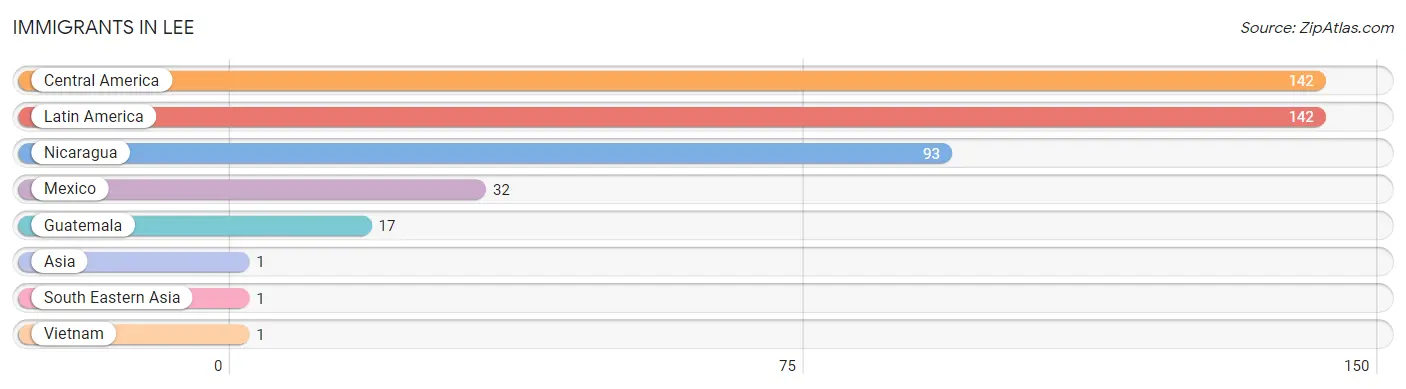
| Immigration Origin | # Population | % Population |
| Asia | 1 | 0.1% |
| Central America | 142 | 18.2% |
| Guatemala | 17 | 2.2% |
| Latin America | 142 | 18.2% |
| Mexico | 32 | 4.1% |
| Nicaragua | 93 | 11.9% |
| South Eastern Asia | 1 | 0.1% |
| Vietnam | 1 | 0.1% | View All 8 Rows |
Sex and Age in Lee
Sex and Age in Lee
The most populous age groups in Lee are 20 to 24 Years (102 | 24.3%) for men and 65 to 69 Years (70 | 19.6%) for women.
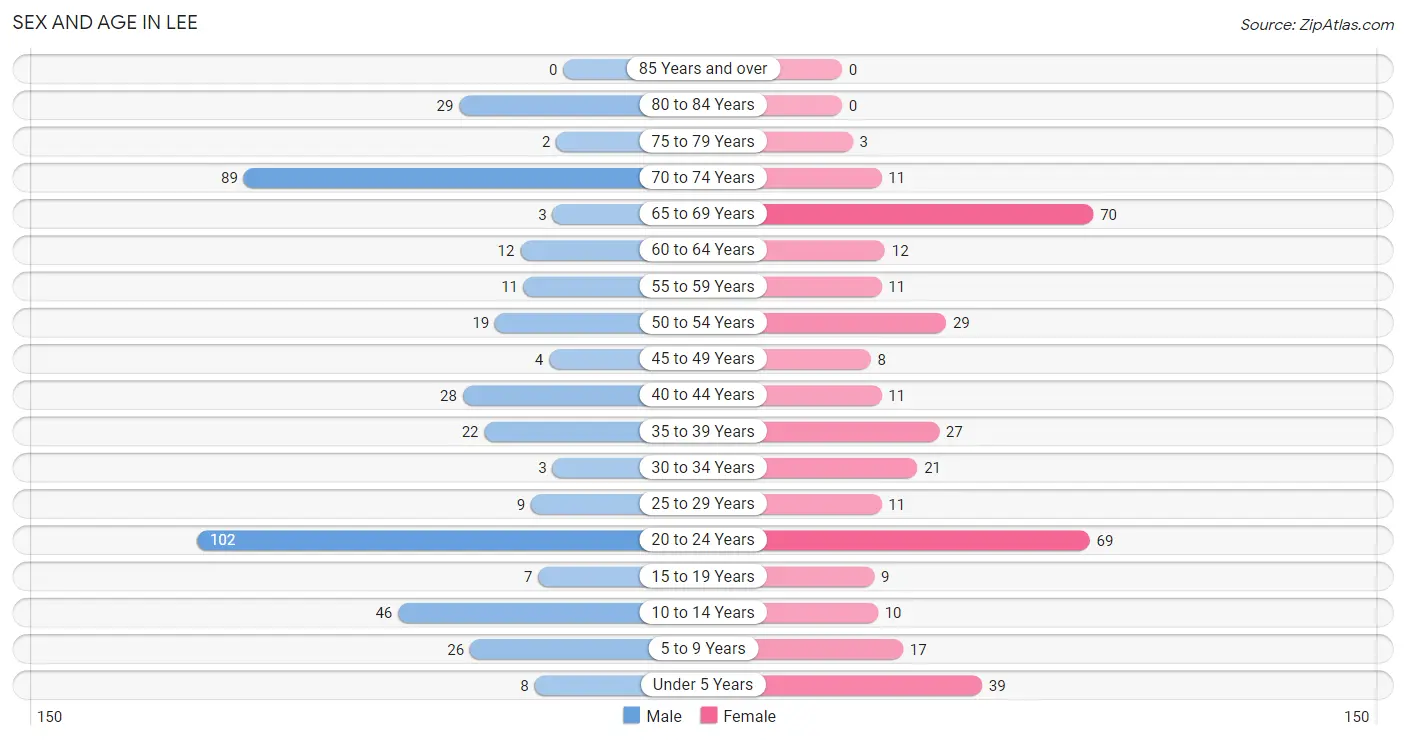
| Age Bracket | Male | Female |
| Under 5 Years | 8 (1.9%) | 39 (10.9%) |
| 5 to 9 Years | 26 (6.2%) | 17 (4.8%) |
| 10 to 14 Years | 46 (11.0%) | 10 (2.8%) |
| 15 to 19 Years | 7 (1.7%) | 9 (2.5%) |
| 20 to 24 Years | 102 (24.3%) | 69 (19.3%) |
| 25 to 29 Years | 9 (2.1%) | 11 (3.1%) |
| 30 to 34 Years | 3 (0.7%) | 21 (5.9%) |
| 35 to 39 Years | 22 (5.2%) | 27 (7.5%) |
| 40 to 44 Years | 28 (6.7%) | 11 (3.1%) |
| 45 to 49 Years | 4 (0.9%) | 8 (2.2%) |
| 50 to 54 Years | 19 (4.5%) | 29 (8.1%) |
| 55 to 59 Years | 11 (2.6%) | 11 (3.1%) |
| 60 to 64 Years | 12 (2.9%) | 12 (3.4%) |
| 65 to 69 Years | 3 (0.7%) | 70 (19.6%) |
| 70 to 74 Years | 89 (21.2%) | 11 (3.1%) |
| 75 to 79 Years | 2 (0.5%) | 3 (0.8%) |
| 80 to 84 Years | 29 (6.9%) | 0 (0.0%) |
| 85 Years and over | 0 (0.0%) | 0 (0.0%) |
| Total | 420 (100.0%) | 358 (100.0%) |
Families and Households in Lee
Median Family Size in Lee
The median family size in Lee is 3.23 persons per family, with single female/mother families (23 | 12.9%) accounting for the largest median family size of 4.04 persons per family. On the other hand, single male/father families (9 | 5.1%) represent the smallest median family size with 2.89 persons per family.
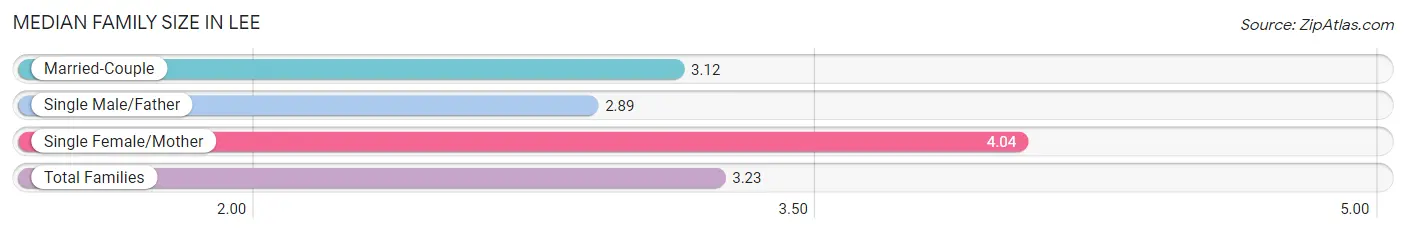
| Family Type | # Families | Family Size |
| Married-Couple | 146 (82.0%) | 3.12 |
| Single Male/Father | 9 (5.1%) | 2.89 |
| Single Female/Mother | 23 (12.9%) | 4.04 |
| Total Families | 178 (100.0%) | 3.23 |
Median Household Size in Lee
The median household size in Lee is 2.72 persons per household, with single female/mother households (23 | 8.0%) accounting for the largest median household size of 4.04 persons per household. non-family households (108 | 37.8%) represent the smallest median household size with 1.80 persons per household.
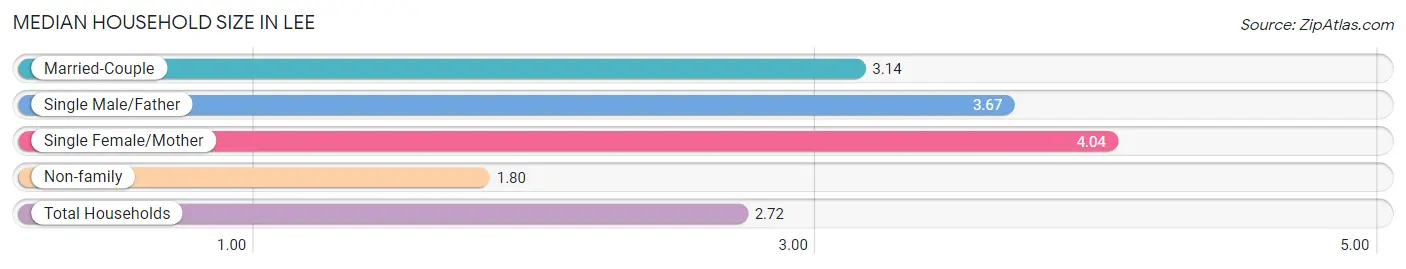
| Household Type | # Households | Household Size |
| Married-Couple | 146 (51.0%) | 3.14 |
| Single Male/Father | 9 (3.2%) | 3.67 |
| Single Female/Mother | 23 (8.0%) | 4.04 |
| Non-family | 108 (37.8%) | 1.80 |
| Total Households | 286 (100.0%) | 2.72 |
Household Size by Marriage Status in Lee
Out of a total of 286 households in Lee, 178 (62.2%) are family households, while 108 (37.8%) are nonfamily households. The most numerous type of family households are 2-person households, comprising 91, and the most common type of nonfamily households are 2-person households, comprising 58.
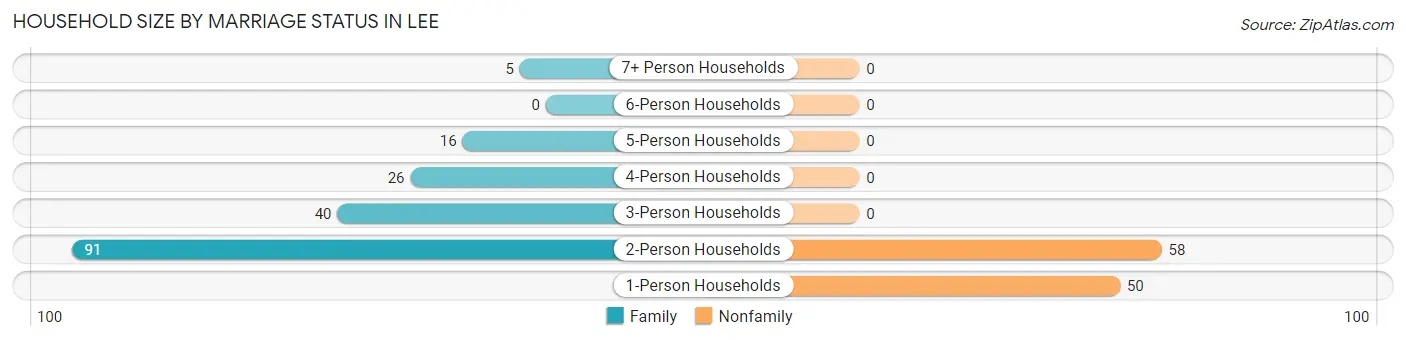
| Household Size | Family Households | Nonfamily Households |
| 1-Person Households | - | 50 (17.5%) |
| 2-Person Households | 91 (31.8%) | 58 (20.3%) |
| 3-Person Households | 40 (14.0%) | 0 (0.0%) |
| 4-Person Households | 26 (9.1%) | 0 (0.0%) |
| 5-Person Households | 16 (5.6%) | 0 (0.0%) |
| 6-Person Households | 0 (0.0%) | 0 (0.0%) |
| 7+ Person Households | 5 (1.8%) | 0 (0.0%) |
| Total | 178 (62.2%) | 108 (37.8%) |
Female Fertility in Lee
Fertility by Age in Lee
Average fertility rate in Lee is 210.0 births per 1,000 women. Women in the age bracket of 35 to 50 years have the highest fertility rate with 298.0 births per 1,000 women. Women in the age bracket of 20 to 34 years acount for 51.4% of all women with births.
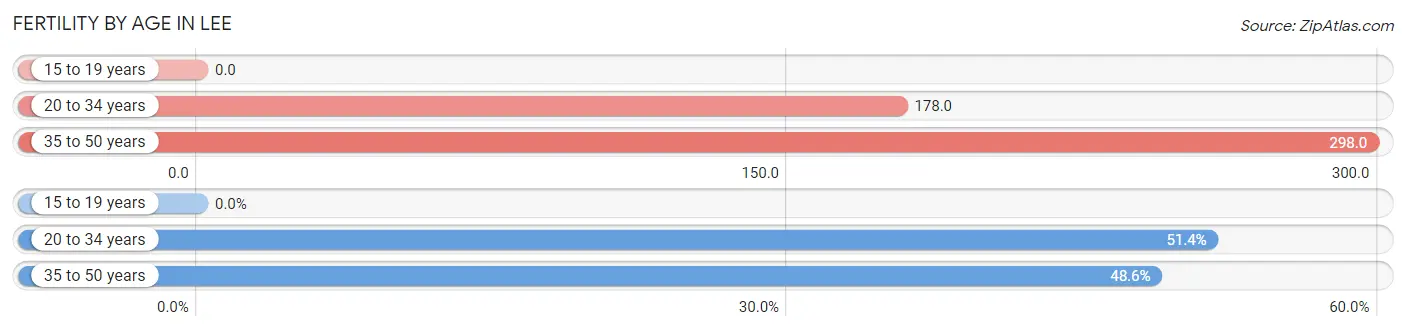
| Age Bracket | Women with Births | Births / 1,000 Women |
| 15 to 19 years | 0 (0.0%) | 0.0 |
| 20 to 34 years | 18 (51.4%) | 178.0 |
| 35 to 50 years | 17 (48.6%) | 298.0 |
| Total | 35 (100.0%) | 210.0 |
Fertility by Age by Marriage Status in Lee
31.4% of women with births (35) in Lee are married. The highest percentage of unmarried women with births falls into 20 to 34 years age bracket with 72.2% of them unmarried at the time of birth, while the lowest percentage of unmarried women with births belong to 35 to 50 years age bracket with 64.7% of them unmarried.
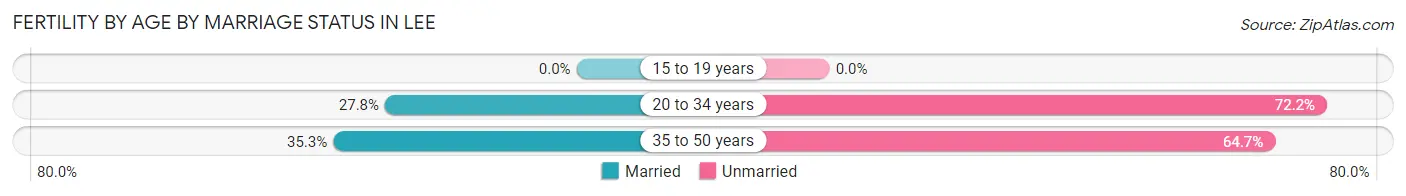
| Age Bracket | Married | Unmarried |
| 15 to 19 years | 0 (0.0%) | 0 (0.0%) |
| 20 to 34 years | 5 (27.8%) | 13 (72.2%) |
| 35 to 50 years | 6 (35.3%) | 11 (64.7%) |
| Total | 11 (31.4%) | 24 (68.6%) |
Fertility by Education in Lee
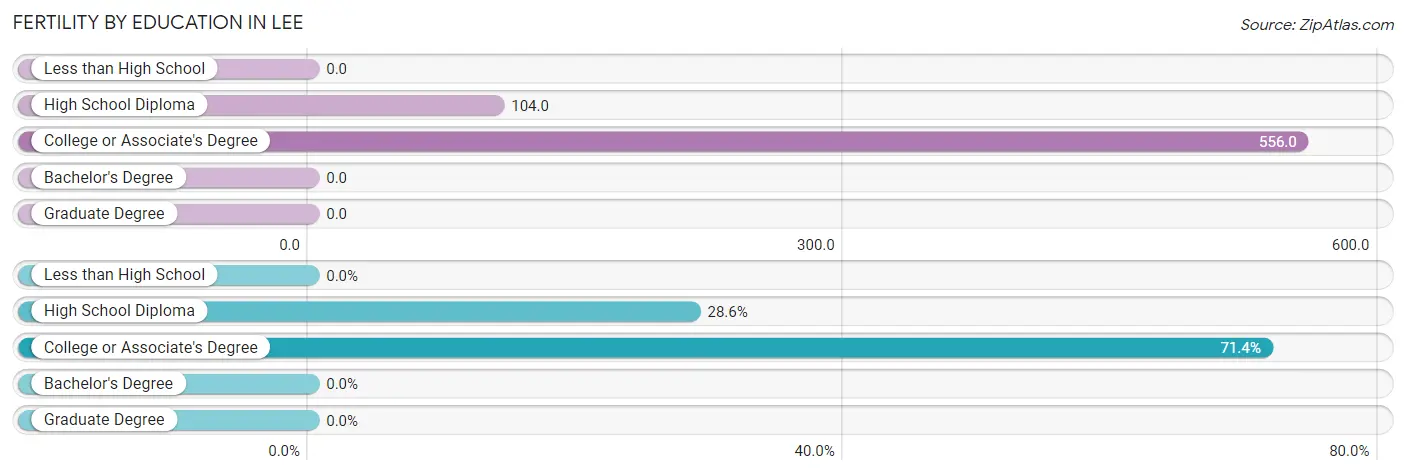
| Educational Attainment | Women with Births | Births / 1,000 Women |
| Less than High School | 0 (0.0%) | 0.0 |
| High School Diploma | 10 (28.6%) | 104.0 |
| College or Associate's Degree | 25 (71.4%) | 556.0 |
| Bachelor's Degree | 0 (0.0%) | 0.0 |
| Graduate Degree | 0 (0.0%) | 0.0 |
| Total | 35 (100.0%) | 210.0 |
Fertility by Education by Marriage Status in Lee
68.6% of women with births in Lee are unmarried. Women with the educational attainment of high school diploma are most likely to be married with 60.0% of them married at childbirth, while women with the educational attainment of college or associate's degree are least likely to be married with 80.0% of them unmarried at childbirth.
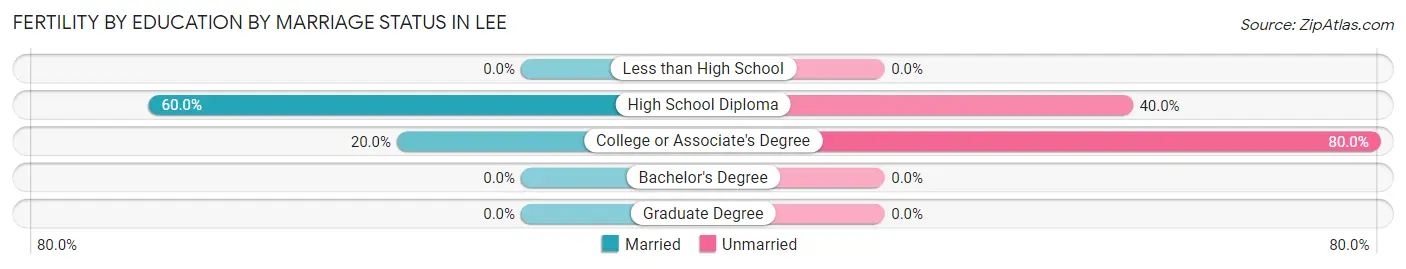
| Educational Attainment | Married | Unmarried |
| Less than High School | 0 (0.0%) | 0 (0.0%) |
| High School Diploma | 6 (60.0%) | 4 (40.0%) |
| College or Associate's Degree | 5 (20.0%) | 20 (80.0%) |
| Bachelor's Degree | 0 (0.0%) | 0 (0.0%) |
| Graduate Degree | 0 (0.0%) | 0 (0.0%) |
| Total | 11 (31.4%) | 24 (68.6%) |
Employment Characteristics in Lee
Employment by Class of Employer in Lee
Among the 375 employed individuals in Lee, private company employees (259 | 69.1%), state government employees (68 | 18.1%), and not-for-profit organizations (24 | 6.4%) make up the most common classes of employment.
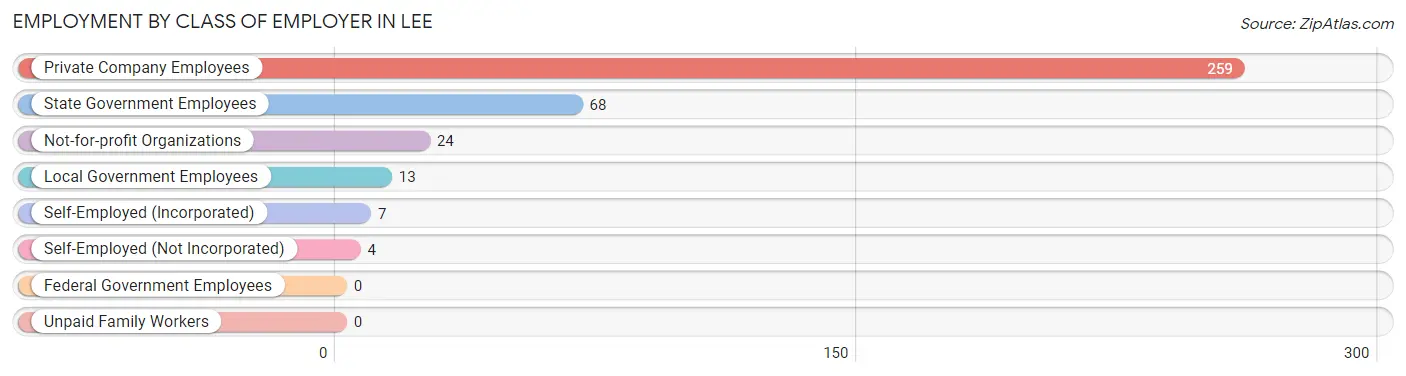
| Employer Class | # Employees | % Employees |
| Private Company Employees | 259 | 69.1% |
| Self-Employed (Incorporated) | 7 | 1.9% |
| Self-Employed (Not Incorporated) | 4 | 1.1% |
| Not-for-profit Organizations | 24 | 6.4% |
| Local Government Employees | 13 | 3.5% |
| State Government Employees | 68 | 18.1% |
| Federal Government Employees | 0 | 0.0% |
| Unpaid Family Workers | 0 | 0.0% |
| Total | 375 | 100.0% |
Employment Status by Age in Lee
According to the labor force statistics for Lee, out of the total population over 16 years of age (632), 60.6% or 383 individuals are in the labor force, with 1.6% or 6 of them unemployed. The age group with the highest labor force participation rate is 20 to 24 years, with 98.2% or 168 individuals in the labor force. Within the labor force, the 25 to 29 years age range has the highest percentage of unemployed individuals, with 35.3% or 6 of them being unemployed.
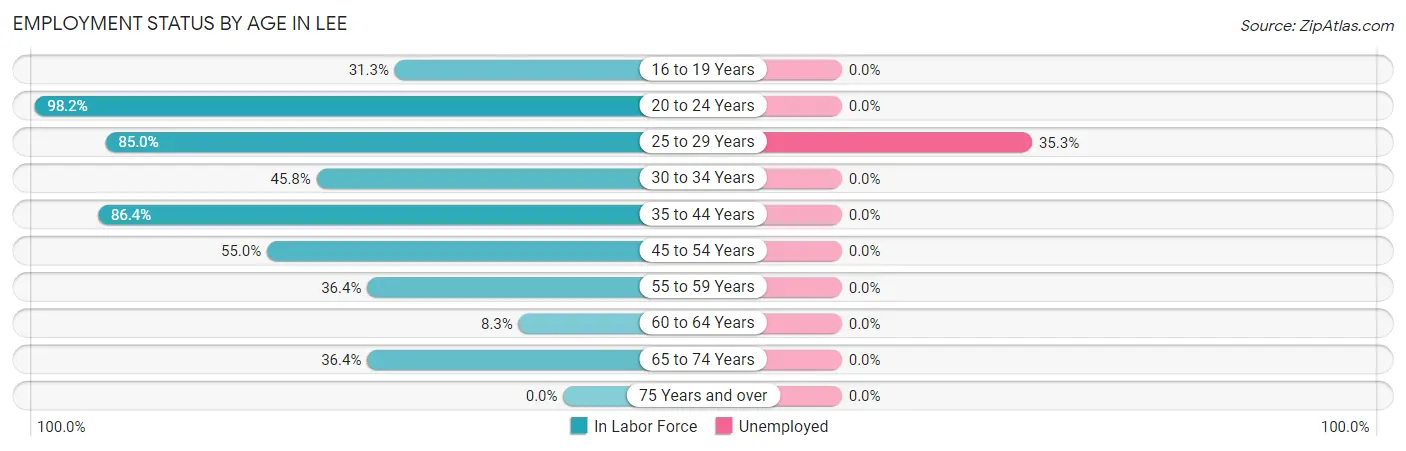
| Age Bracket | In Labor Force | Unemployed |
| 16 to 19 Years | 5 (31.3%) | 0 (0.0%) |
| 20 to 24 Years | 168 (98.2%) | 0 (0.0%) |
| 25 to 29 Years | 17 (85.0%) | 6 (35.3%) |
| 30 to 34 Years | 11 (45.8%) | 0 (0.0%) |
| 35 to 44 Years | 76 (86.4%) | 0 (0.0%) |
| 45 to 54 Years | 33 (55.0%) | 0 (0.0%) |
| 55 to 59 Years | 8 (36.4%) | 0 (0.0%) |
| 60 to 64 Years | 2 (8.3%) | 0 (0.0%) |
| 65 to 74 Years | 63 (36.4%) | 0 (0.0%) |
| 75 Years and over | 0 (0.0%) | 0 (0.0%) |
| Total | 383 (60.6%) | 6 (1.6%) |
Employment Status by Educational Attainment in Lee
According to labor force statistics for Lee, 61.8% of individuals (147) out of the total population between 25 and 64 years of age (238) are in the labor force, with 4.1% or 6 of them being unemployed. The group with the highest labor force participation rate are those with the educational attainment of bachelor's degree or higher, with 93.3% or 14 individuals in the labor force. Within the labor force, individuals with high school diploma education have the highest percentage of unemployment, with 11.8% or 6 of them being unemployed.
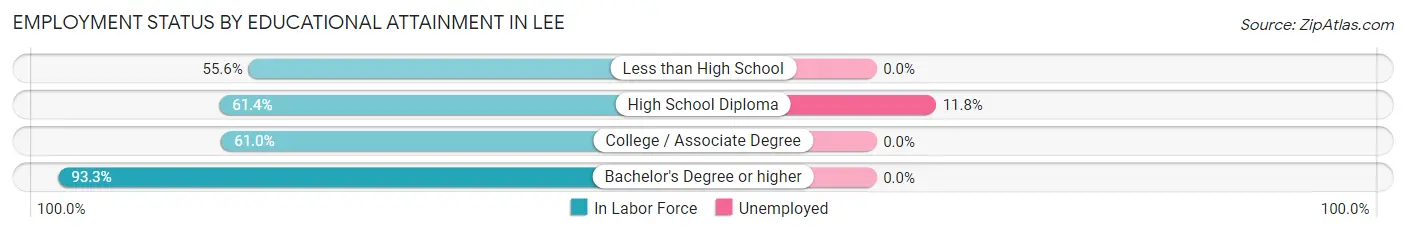
| Educational Attainment | In Labor Force | Unemployed |
| Less than High School | 35 (55.6%) | 0 (0.0%) |
| High School Diploma | 51 (61.4%) | 10 (11.8%) |
| College / Associate Degree | 47 (61.0%) | 0 (0.0%) |
| Bachelor's Degree or higher | 14 (93.3%) | 0 (0.0%) |
| Total | 147 (61.8%) | 10 (4.1%) |
Employment Occupations by Sex in Lee
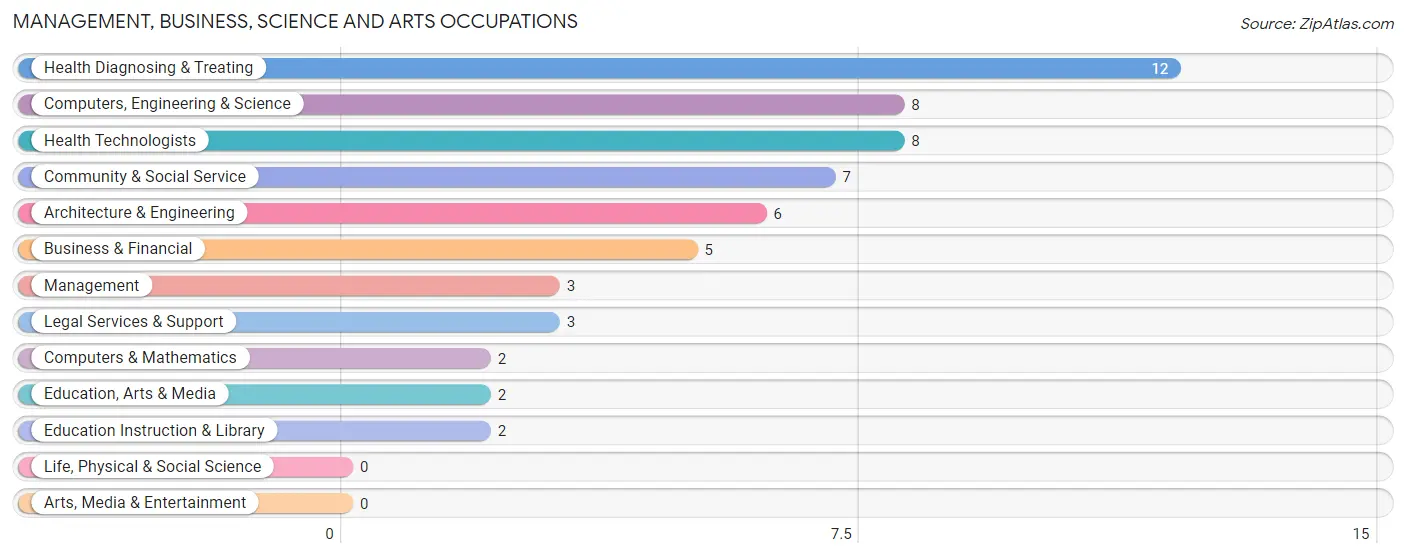
Management, Business, Science and Arts Occupations
The most common Management, Business, Science and Arts occupations in Lee are Health Diagnosing & Treating (12 | 3.2%), Computers, Engineering & Science (8 | 2.1%), Health Technologists (8 | 2.1%), Community & Social Service (7 | 1.9%), and Architecture & Engineering (6 | 1.6%).
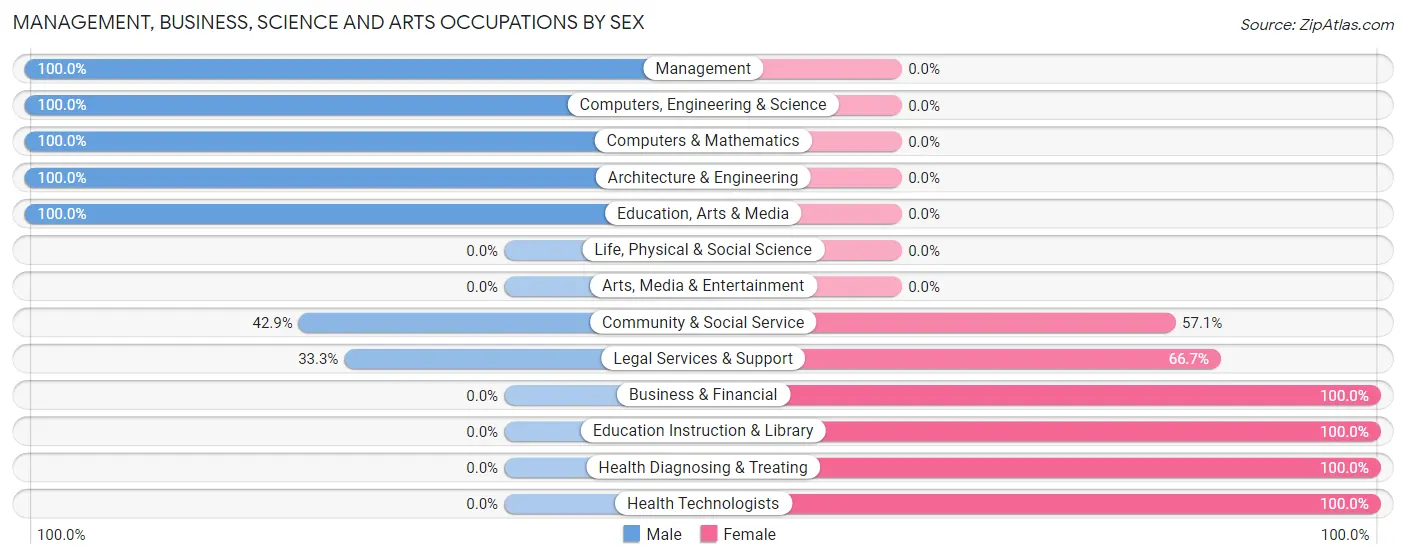
Management, Business, Science and Arts Occupations by Sex
Within the Management, Business, Science and Arts occupations in Lee, the most male-oriented occupations are Management (100.0%), Computers, Engineering & Science (100.0%), and Computers & Mathematics (100.0%), while the most female-oriented occupations are Business & Financial (100.0%), Education Instruction & Library (100.0%), and Health Diagnosing & Treating (100.0%).
| Occupation | Male | Female |
| Management | 3 (100.0%) | 0 (0.0%) |
| Business & Financial | 0 (0.0%) | 5 (100.0%) |
| Computers, Engineering & Science | 8 (100.0%) | 0 (0.0%) |
| Computers & Mathematics | 2 (100.0%) | 0 (0.0%) |
| Architecture & Engineering | 6 (100.0%) | 0 (0.0%) |
| Life, Physical & Social Science | 0 (0.0%) | 0 (0.0%) |
| Community & Social Service | 3 (42.9%) | 4 (57.1%) |
| Education, Arts & Media | 2 (100.0%) | 0 (0.0%) |
| Legal Services & Support | 1 (33.3%) | 2 (66.7%) |
| Education Instruction & Library | 0 (0.0%) | 2 (100.0%) |
| Arts, Media & Entertainment | 0 (0.0%) | 0 (0.0%) |
| Health Diagnosing & Treating | 0 (0.0%) | 12 (100.0%) |
| Health Technologists | 0 (0.0%) | 8 (100.0%) |
| Total (Category) | 14 (40.0%) | 21 (60.0%) |
| Total (Overall) | 184 (48.8%) | 193 (51.2%) |
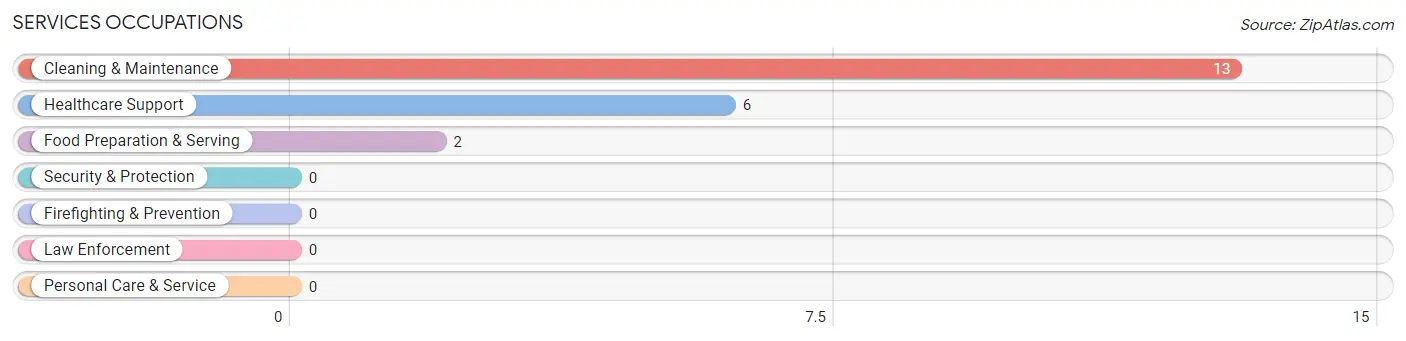
Services Occupations
The most common Services occupations in Lee are Cleaning & Maintenance (13 | 3.5%), Healthcare Support (6 | 1.6%), and Food Preparation & Serving (2 | 0.5%).
Services Occupations by Sex
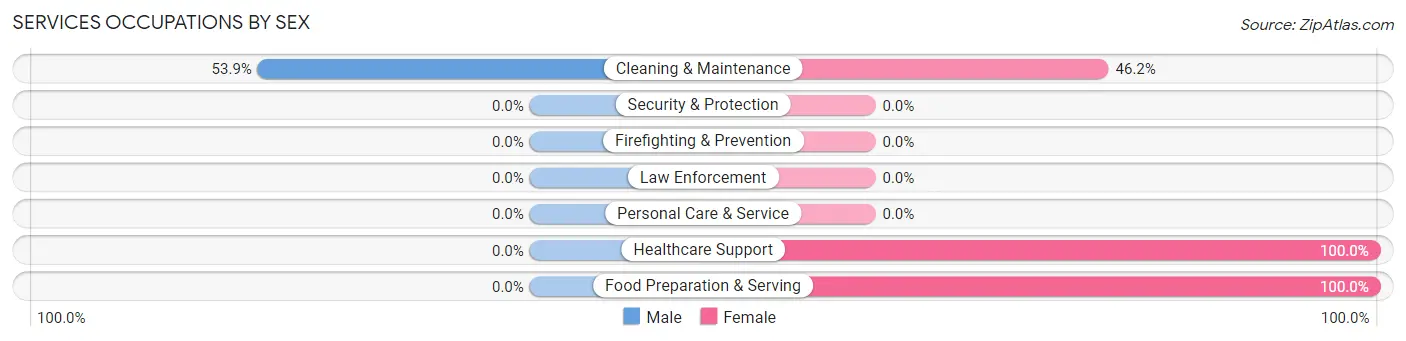
| Occupation | Male | Female |
| Healthcare Support | 0 (0.0%) | 6 (100.0%) |
| Security & Protection | 0 (0.0%) | 0 (0.0%) |
| Firefighting & Prevention | 0 (0.0%) | 0 (0.0%) |
| Law Enforcement | 0 (0.0%) | 0 (0.0%) |
| Food Preparation & Serving | 0 (0.0%) | 2 (100.0%) |
| Cleaning & Maintenance | 7 (53.8%) | 6 (46.2%) |
| Personal Care & Service | 0 (0.0%) | 0 (0.0%) |
| Total (Category) | 7 (33.3%) | 14 (66.7%) |
| Total (Overall) | 184 (48.8%) | 193 (51.2%) |
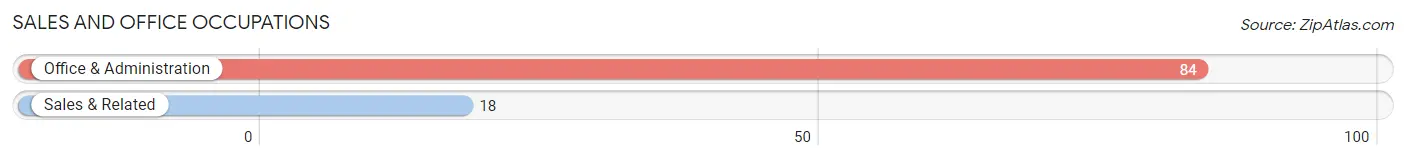
Sales and Office Occupations
The most common Sales and Office occupations in Lee are Office & Administration (84 | 22.3%), and Sales & Related (18 | 4.8%).
Sales and Office Occupations by Sex
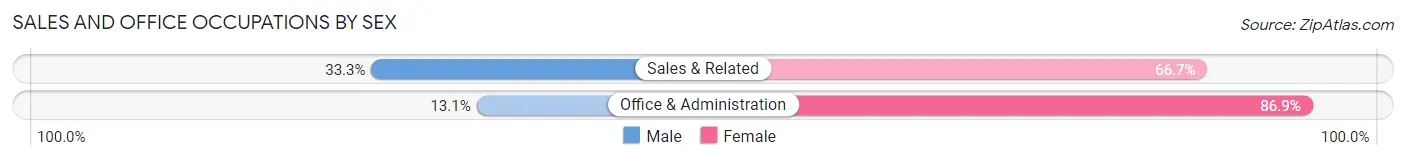
| Occupation | Male | Female |
| Sales & Related | 6 (33.3%) | 12 (66.7%) |
| Office & Administration | 11 (13.1%) | 73 (86.9%) |
| Total (Category) | 17 (16.7%) | 85 (83.3%) |
| Total (Overall) | 184 (48.8%) | 193 (51.2%) |
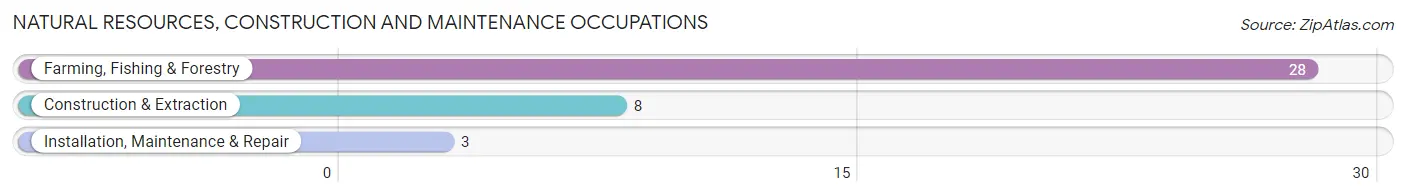
Natural Resources, Construction and Maintenance Occupations
The most common Natural Resources, Construction and Maintenance occupations in Lee are Farming, Fishing & Forestry (28 | 7.4%), Construction & Extraction (8 | 2.1%), and Installation, Maintenance & Repair (3 | 0.8%).
Natural Resources, Construction and Maintenance Occupations by Sex
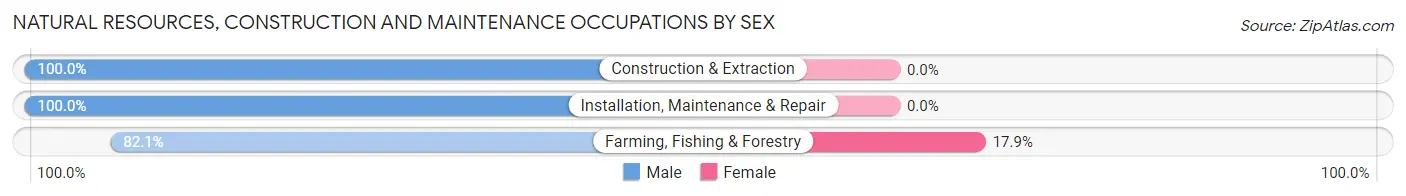
| Occupation | Male | Female |
| Farming, Fishing & Forestry | 23 (82.1%) | 5 (17.9%) |
| Construction & Extraction | 8 (100.0%) | 0 (0.0%) |
| Installation, Maintenance & Repair | 3 (100.0%) | 0 (0.0%) |
| Total (Category) | 34 (87.2%) | 5 (12.8%) |
| Total (Overall) | 184 (48.8%) | 193 (51.2%) |
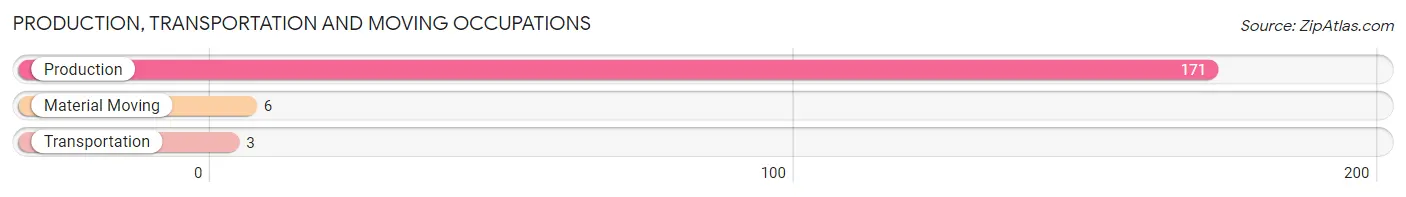
Production, Transportation and Moving Occupations
The most common Production, Transportation and Moving occupations in Lee are Production (171 | 45.4%), Material Moving (6 | 1.6%), and Transportation (3 | 0.8%).
Production, Transportation and Moving Occupations by Sex
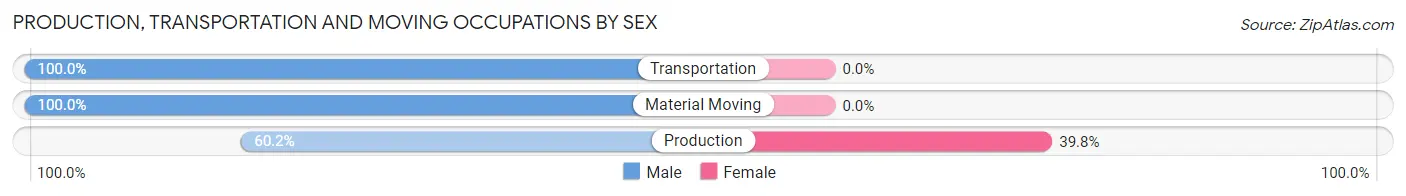
| Occupation | Male | Female |
| Production | 103 (60.2%) | 68 (39.8%) |
| Transportation | 3 (100.0%) | 0 (0.0%) |
| Material Moving | 6 (100.0%) | 0 (0.0%) |
| Total (Category) | 112 (62.2%) | 68 (37.8%) |
| Total (Overall) | 184 (48.8%) | 193 (51.2%) |
Employment Industries by Sex in Lee
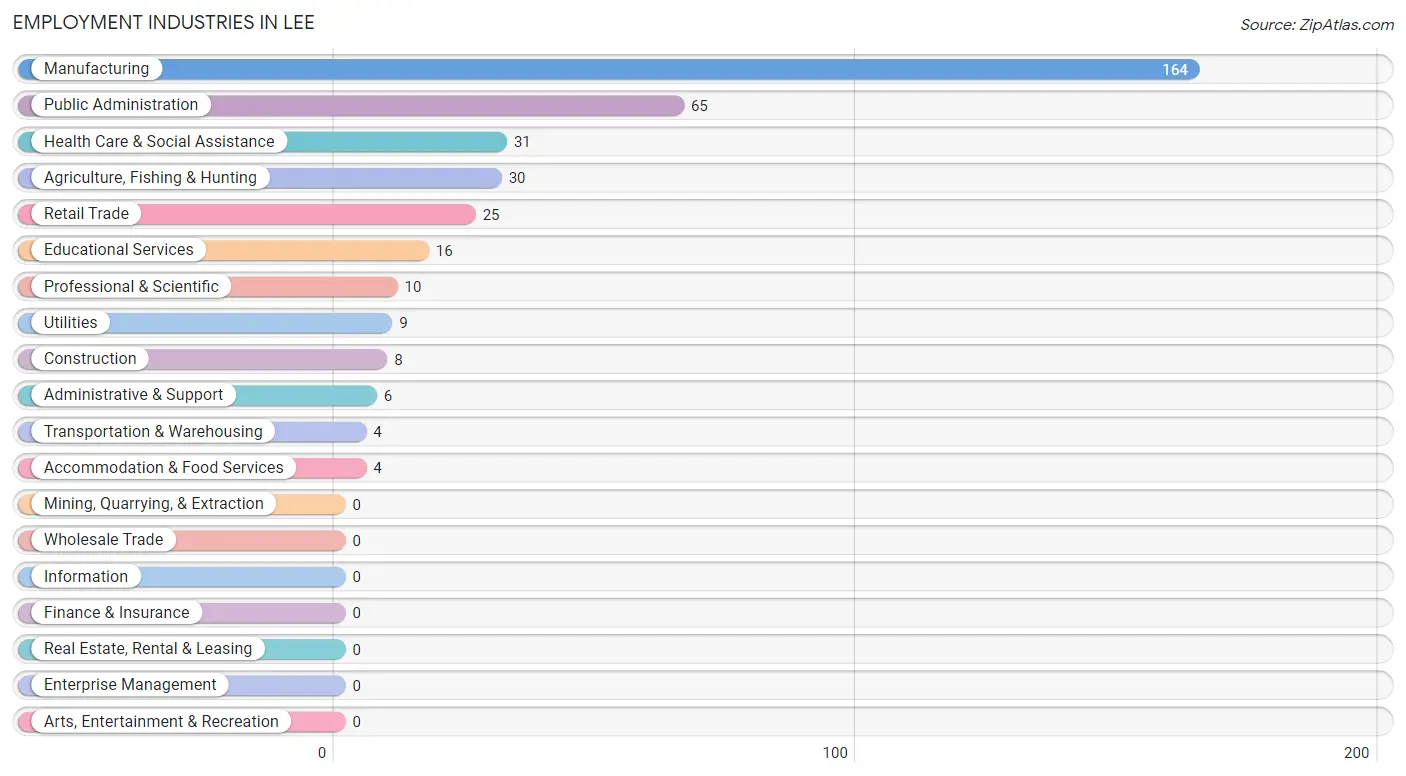
Employment Industries in Lee
The major employment industries in Lee include Manufacturing (164 | 43.5%), Public Administration (65 | 17.2%), Health Care & Social Assistance (31 | 8.2%), Agriculture, Fishing & Hunting (30 | 8.0%), and Retail Trade (25 | 6.6%).
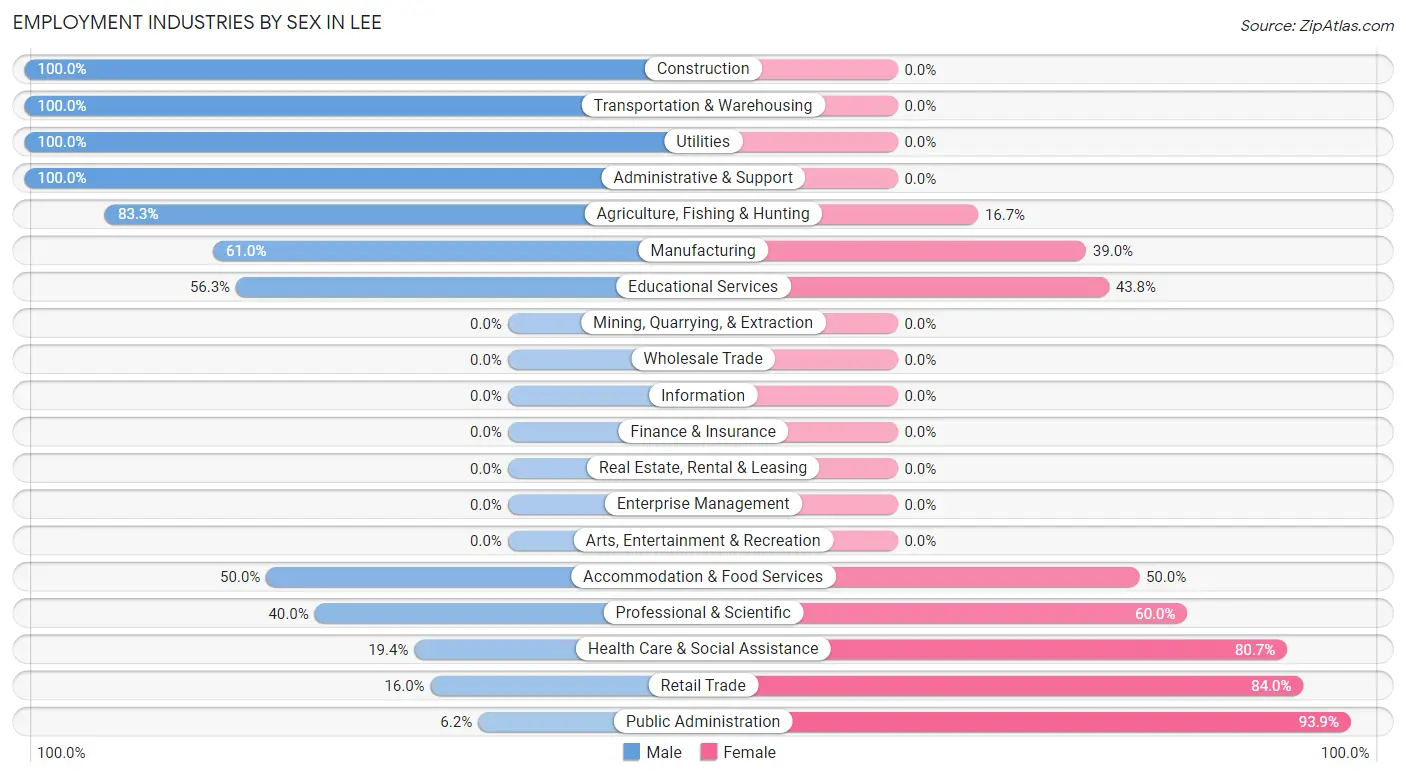
Employment Industries by Sex in Lee
The Lee industries that see more men than women are Construction (100.0%), Transportation & Warehousing (100.0%), and Utilities (100.0%), whereas the industries that tend to have a higher number of women are Public Administration (93.9%), Retail Trade (84.0%), and Health Care & Social Assistance (80.6%).
| Industry | Male | Female |
| Agriculture, Fishing & Hunting | 25 (83.3%) | 5 (16.7%) |
| Mining, Quarrying, & Extraction | 0 (0.0%) | 0 (0.0%) |
| Construction | 8 (100.0%) | 0 (0.0%) |
| Manufacturing | 100 (61.0%) | 64 (39.0%) |
| Wholesale Trade | 0 (0.0%) | 0 (0.0%) |
| Retail Trade | 4 (16.0%) | 21 (84.0%) |
| Transportation & Warehousing | 4 (100.0%) | 0 (0.0%) |
| Utilities | 9 (100.0%) | 0 (0.0%) |
| Information | 0 (0.0%) | 0 (0.0%) |
| Finance & Insurance | 0 (0.0%) | 0 (0.0%) |
| Real Estate, Rental & Leasing | 0 (0.0%) | 0 (0.0%) |
| Professional & Scientific | 4 (40.0%) | 6 (60.0%) |
| Enterprise Management | 0 (0.0%) | 0 (0.0%) |
| Administrative & Support | 6 (100.0%) | 0 (0.0%) |
| Educational Services | 9 (56.2%) | 7 (43.8%) |
| Health Care & Social Assistance | 6 (19.4%) | 25 (80.6%) |
| Arts, Entertainment & Recreation | 0 (0.0%) | 0 (0.0%) |
| Accommodation & Food Services | 2 (50.0%) | 2 (50.0%) |
| Public Administration | 4 (6.1%) | 61 (93.9%) |
| Total | 184 (48.8%) | 193 (51.2%) |
Education in Lee
School Enrollment in Lee
The most common levels of schooling among the 126 students in Lee are elementary school (36 | 28.6%), high school (35 | 27.8%), and middle school (23 | 18.2%).
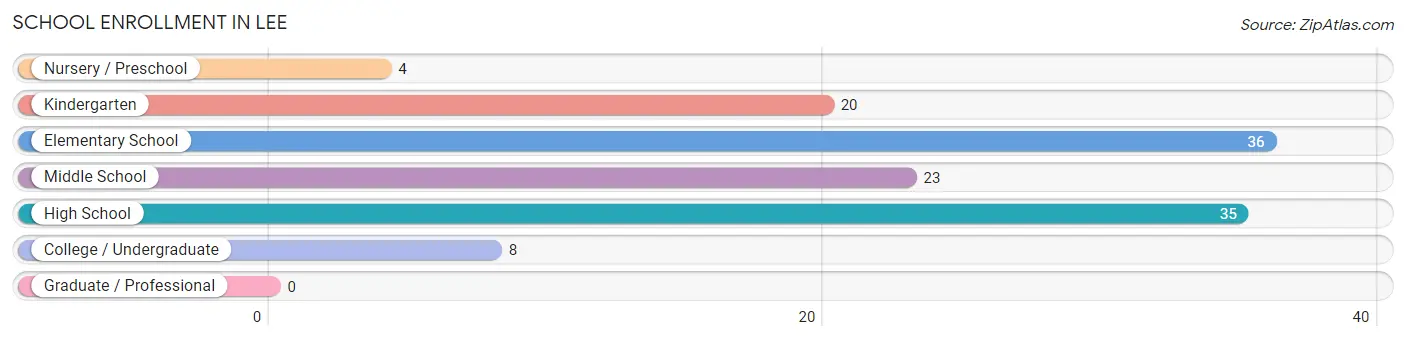
| School Level | # Students | % Students |
| Nursery / Preschool | 4 | 3.2% |
| Kindergarten | 20 | 15.9% |
| Elementary School | 36 | 28.6% |
| Middle School | 23 | 18.2% |
| High School | 35 | 27.8% |
| College / Undergraduate | 8 | 6.4% |
| Graduate / Professional | 0 | 0.0% |
| Total | 126 | 100.0% |
School Enrollment by Age by Funding Source in Lee
Out of a total of 126 students who are enrolled in schools in Lee, 5 (4.0%) attend a private institution, while the remaining 121 (96.0%) are enrolled in public schools. The age group of 35 years and over has the highest likelihood of being enrolled in private schools, with 2 (100.0% in the age bracket) enrolled. Conversely, the age group of 3 to 4 year olds has the lowest likelihood of being enrolled in a private school, with 4 (100.0% in the age bracket) attending a public institution.
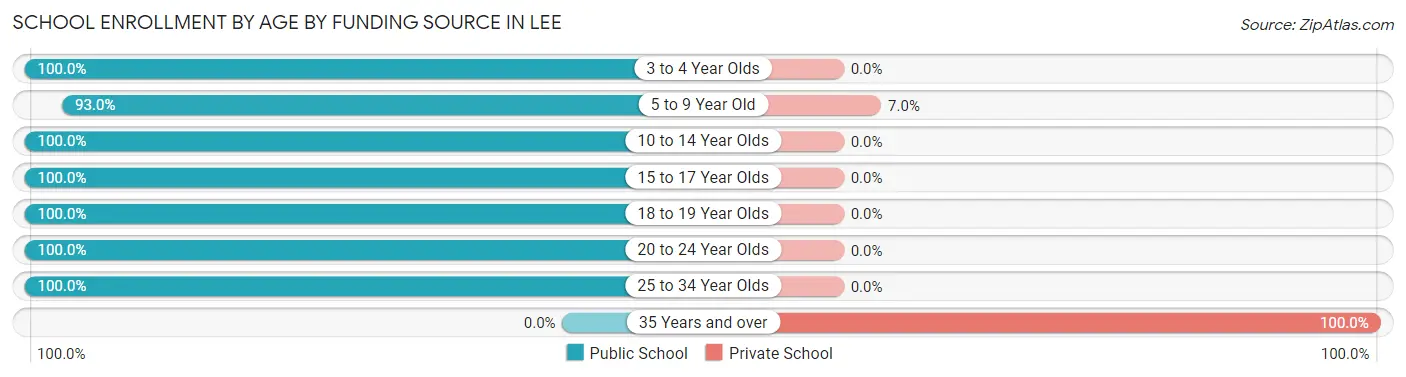
| Age Bracket | Public School | Private School |
| 3 to 4 Year Olds | 4 (100.0%) | 0 (0.0%) |
| 5 to 9 Year Old | 40 (93.0%) | 3 (7.0%) |
| 10 to 14 Year Olds | 56 (100.0%) | 0 (0.0%) |
| 15 to 17 Year Olds | 15 (100.0%) | 0 (0.0%) |
| 18 to 19 Year Olds | 1 (100.0%) | 0 (0.0%) |
| 20 to 24 Year Olds | 3 (100.0%) | 0 (0.0%) |
| 25 to 34 Year Olds | 2 (100.0%) | 0 (0.0%) |
| 35 Years and over | 0 (0.0%) | 2 (100.0%) |
| Total | 121 (96.0%) | 5 (4.0%) |
Educational Attainment by Field of Study in Lee
Education (6 | 31.6%), social sciences (4 | 21.0%), computers & mathematics (2 | 10.5%), engineering (2 | 10.5%), and liberal arts & history (2 | 10.5%) are the most common fields of study among 19 individuals in Lee who have obtained a bachelor's degree or higher.
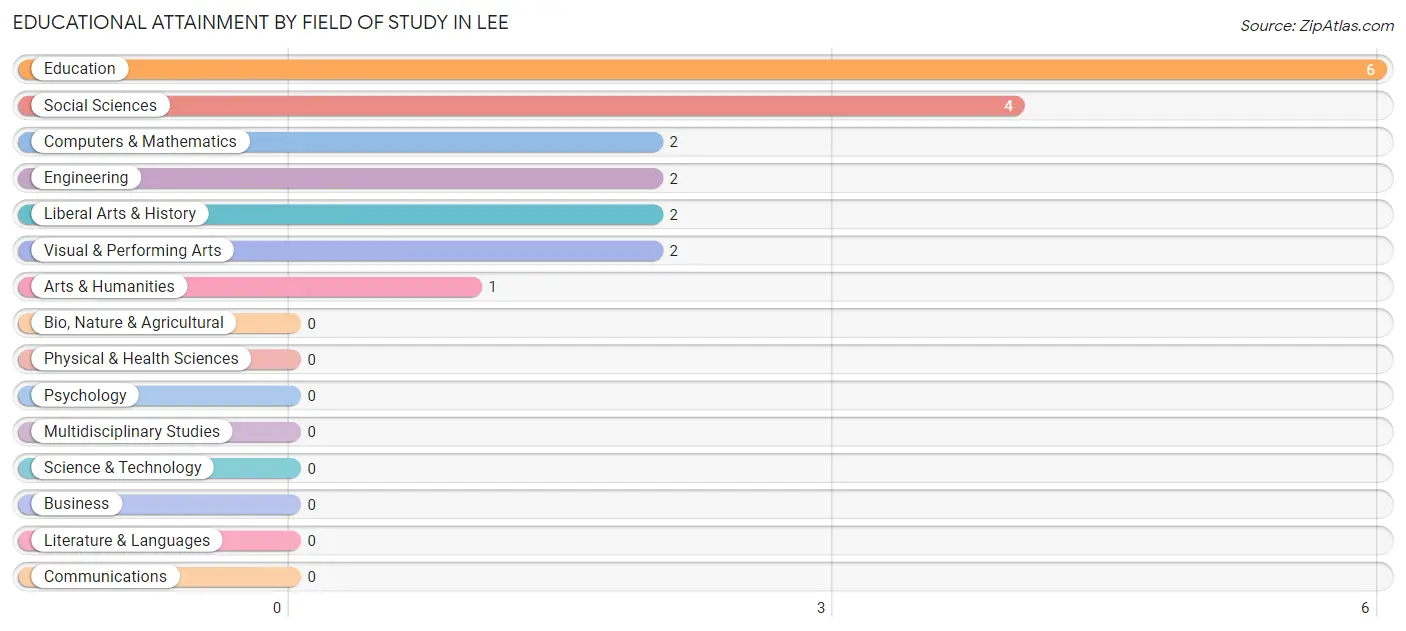
| Field of Study | # Graduates | % Graduates |
| Computers & Mathematics | 2 | 10.5% |
| Bio, Nature & Agricultural | 0 | 0.0% |
| Physical & Health Sciences | 0 | 0.0% |
| Psychology | 0 | 0.0% |
| Social Sciences | 4 | 21.0% |
| Engineering | 2 | 10.5% |
| Multidisciplinary Studies | 0 | 0.0% |
| Science & Technology | 0 | 0.0% |
| Business | 0 | 0.0% |
| Education | 6 | 31.6% |
| Literature & Languages | 0 | 0.0% |
| Liberal Arts & History | 2 | 10.5% |
| Visual & Performing Arts | 2 | 10.5% |
| Communications | 0 | 0.0% |
| Arts & Humanities | 1 | 5.3% |
| Total | 19 | 100.0% |
Transportation & Commute in Lee
Vehicle Availability by Sex in Lee
The most prevalent vehicle ownership categories in Lee are males with 2 vehicles (140, accounting for 76.9%) and females with 2 vehicles (148, making up 72.5%).
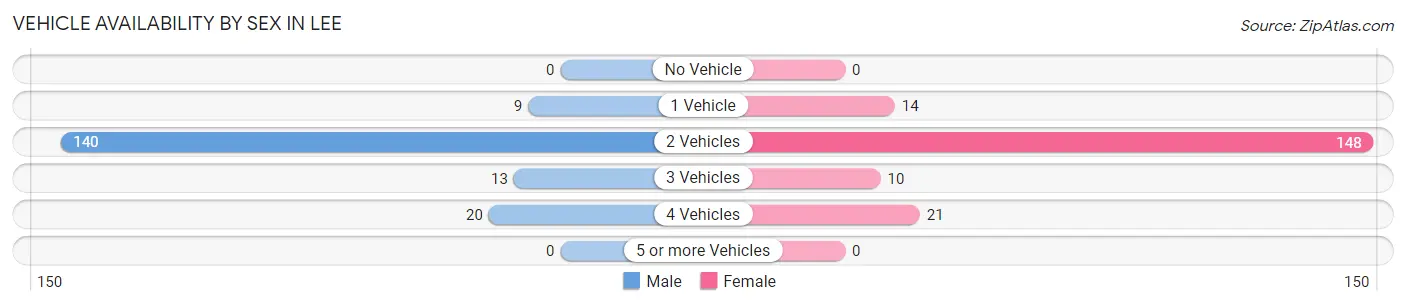
| Vehicles Available | Male | Female |
| No Vehicle | 0 (0.0%) | 0 (0.0%) |
| 1 Vehicle | 9 (5.0%) | 14 (7.2%) |
| 2 Vehicles | 140 (76.9%) | 148 (76.7%) |
| 3 Vehicles | 13 (7.1%) | 10 (5.2%) |
| 4 Vehicles | 20 (11.0%) | 21 (10.9%) |
| 5 or more Vehicles | 0 (0.0%) | 0 (0.0%) |
| Total | 182 (100.0%) | 193 (100.0%) |
Commute Time in Lee
The most frequently occuring commute durations in Lee are 30 to 34 minutes (103 commuters, 27.7%), 15 to 19 minutes (82 commuters, 22.0%), and 25 to 29 minutes (81 commuters, 21.8%).
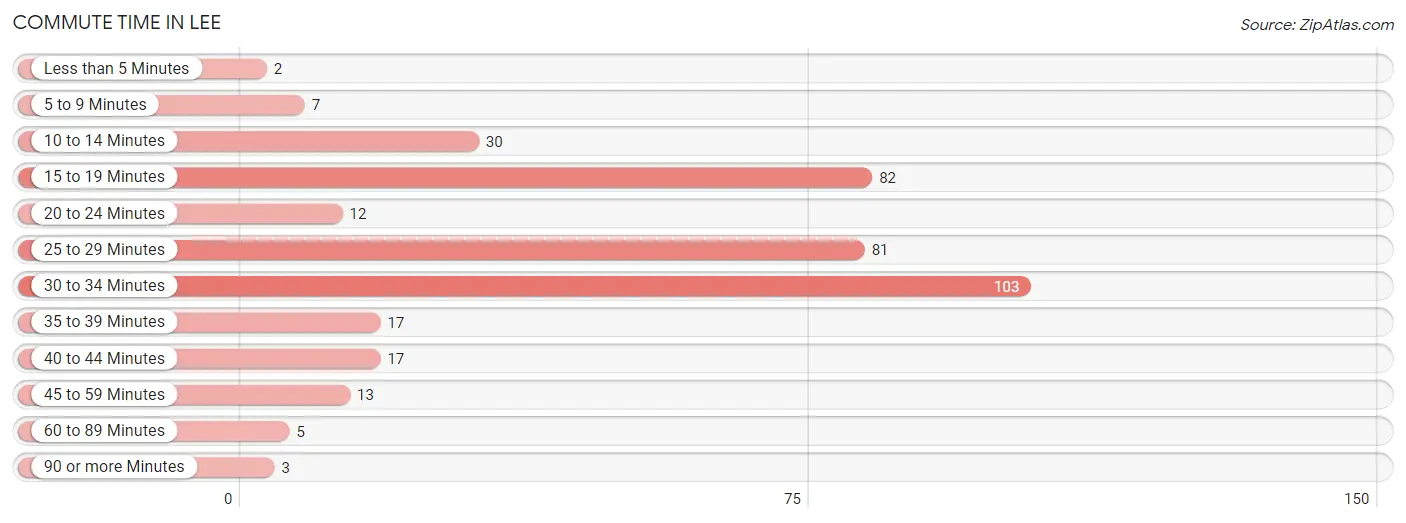
| Commute Time | # Commuters | % Commuters |
| Less than 5 Minutes | 2 | 0.5% |
| 5 to 9 Minutes | 7 | 1.9% |
| 10 to 14 Minutes | 30 | 8.1% |
| 15 to 19 Minutes | 82 | 22.0% |
| 20 to 24 Minutes | 12 | 3.2% |
| 25 to 29 Minutes | 81 | 21.8% |
| 30 to 34 Minutes | 103 | 27.7% |
| 35 to 39 Minutes | 17 | 4.6% |
| 40 to 44 Minutes | 17 | 4.6% |
| 45 to 59 Minutes | 13 | 3.5% |
| 60 to 89 Minutes | 5 | 1.3% |
| 90 or more Minutes | 3 | 0.8% |
Commute Time by Sex in Lee
The most common commute times in Lee are 30 to 34 minutes (95 commuters, 52.5%) for males and 25 to 29 minutes (76 commuters, 39.8%) for females.
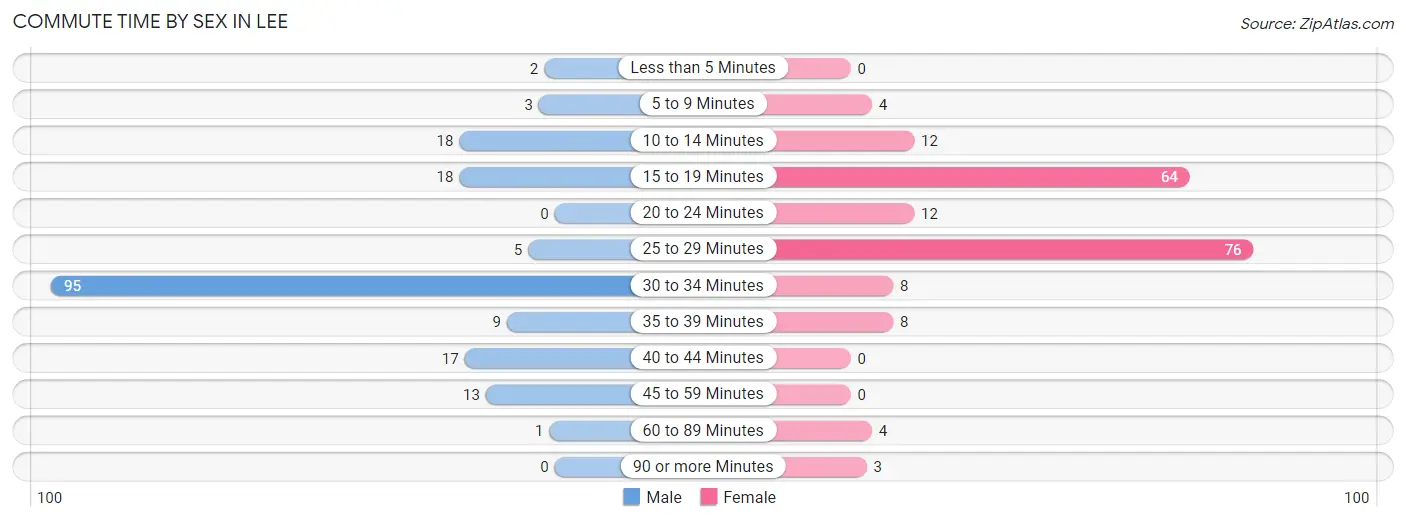
| Commute Time | Male | Female |
| Less than 5 Minutes | 2 (1.1%) | 0 (0.0%) |
| 5 to 9 Minutes | 3 (1.7%) | 4 (2.1%) |
| 10 to 14 Minutes | 18 (9.9%) | 12 (6.3%) |
| 15 to 19 Minutes | 18 (9.9%) | 64 (33.5%) |
| 20 to 24 Minutes | 0 (0.0%) | 12 (6.3%) |
| 25 to 29 Minutes | 5 (2.8%) | 76 (39.8%) |
| 30 to 34 Minutes | 95 (52.5%) | 8 (4.2%) |
| 35 to 39 Minutes | 9 (5.0%) | 8 (4.2%) |
| 40 to 44 Minutes | 17 (9.4%) | 0 (0.0%) |
| 45 to 59 Minutes | 13 (7.2%) | 0 (0.0%) |
| 60 to 89 Minutes | 1 (0.5%) | 4 (2.1%) |
| 90 or more Minutes | 0 (0.0%) | 3 (1.6%) |
Time of Departure to Work by Sex in Lee
The most frequent times of departure to work in Lee are 12:00 PM to 3:59 PM (99, 54.7%) for males and 12:00 PM to 3:59 PM (64, 33.5%) for females.
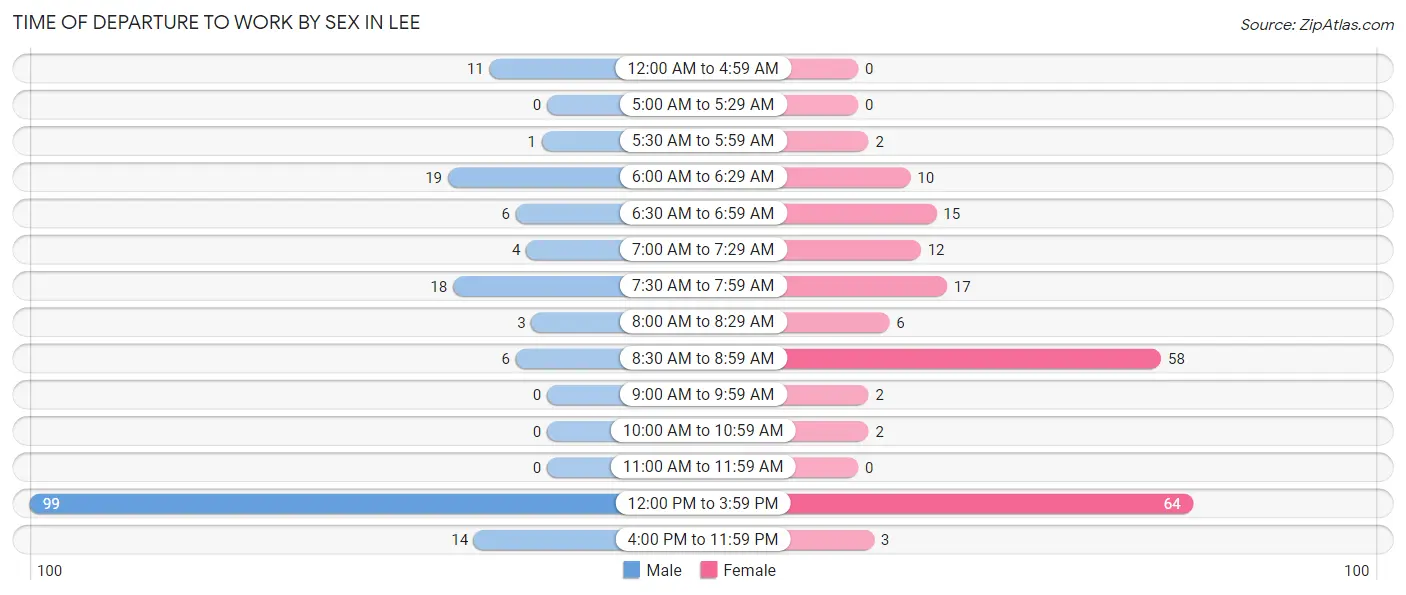
| Time of Departure | Male | Female |
| 12:00 AM to 4:59 AM | 11 (6.1%) | 0 (0.0%) |
| 5:00 AM to 5:29 AM | 0 (0.0%) | 0 (0.0%) |
| 5:30 AM to 5:59 AM | 1 (0.5%) | 2 (1.1%) |
| 6:00 AM to 6:29 AM | 19 (10.5%) | 10 (5.2%) |
| 6:30 AM to 6:59 AM | 6 (3.3%) | 15 (7.9%) |
| 7:00 AM to 7:29 AM | 4 (2.2%) | 12 (6.3%) |
| 7:30 AM to 7:59 AM | 18 (9.9%) | 17 (8.9%) |
| 8:00 AM to 8:29 AM | 3 (1.7%) | 6 (3.1%) |
| 8:30 AM to 8:59 AM | 6 (3.3%) | 58 (30.4%) |
| 9:00 AM to 9:59 AM | 0 (0.0%) | 2 (1.1%) |
| 10:00 AM to 10:59 AM | 0 (0.0%) | 2 (1.1%) |
| 11:00 AM to 11:59 AM | 0 (0.0%) | 0 (0.0%) |
| 12:00 PM to 3:59 PM | 99 (54.7%) | 64 (33.5%) |
| 4:00 PM to 11:59 PM | 14 (7.7%) | 3 (1.6%) |
| Total | 181 (100.0%) | 191 (100.0%) |
Housing Occupancy in Lee
Occupancy by Ownership in Lee
Of the total 286 dwellings in Lee, owner-occupied units account for 155 (54.2%), while renter-occupied units make up 131 (45.8%).
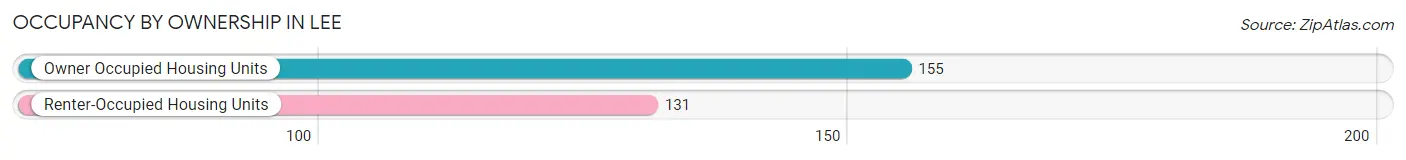
| Occupancy | # Housing Units | % Housing Units |
| Owner Occupied Housing Units | 155 | 54.2% |
| Renter-Occupied Housing Units | 131 | 45.8% |
| Total Occupied Housing Units | 286 | 100.0% |
Occupancy by Household Size in Lee
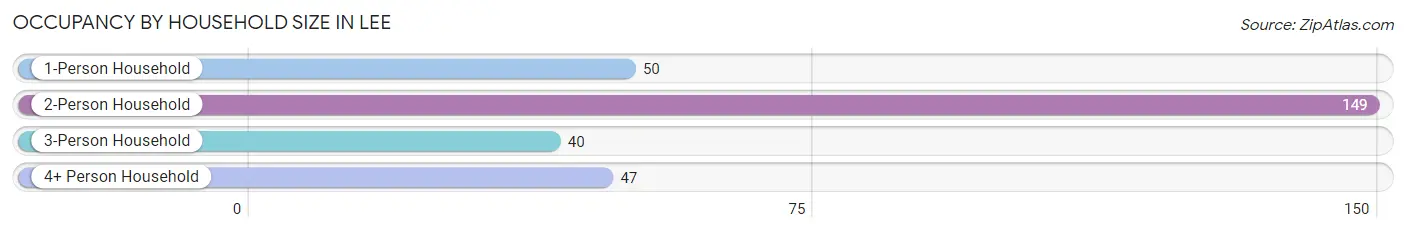
| Household Size | # Housing Units | % Housing Units |
| 1-Person Household | 50 | 17.5% |
| 2-Person Household | 149 | 52.1% |
| 3-Person Household | 40 | 14.0% |
| 4+ Person Household | 47 | 16.4% |
| Total Housing Units | 286 | 100.0% |
Occupancy by Ownership by Household Size in Lee
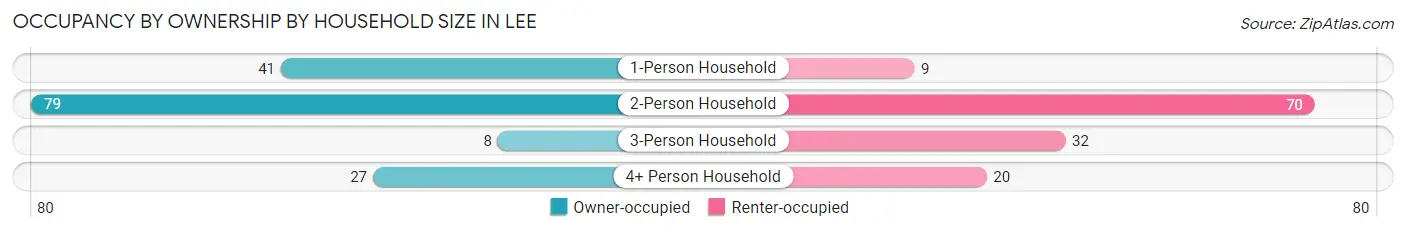
| Household Size | Owner-occupied | Renter-occupied |
| 1-Person Household | 41 (82.0%) | 9 (18.0%) |
| 2-Person Household | 79 (53.0%) | 70 (47.0%) |
| 3-Person Household | 8 (20.0%) | 32 (80.0%) |
| 4+ Person Household | 27 (57.5%) | 20 (42.5%) |
| Total Housing Units | 155 (54.2%) | 131 (45.8%) |
Occupancy by Educational Attainment in Lee
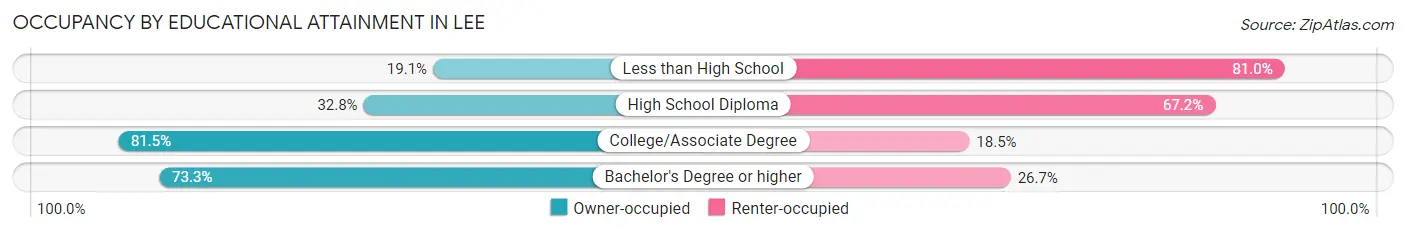
| Household Size | Owner-occupied | Renter-occupied |
| Less than High School | 4 (19.1%) | 17 (80.9%) |
| High School Diploma | 43 (32.8%) | 88 (67.2%) |
| College/Associate Degree | 97 (81.5%) | 22 (18.5%) |
| Bachelor's Degree or higher | 11 (73.3%) | 4 (26.7%) |
Occupancy by Age of Householder in Lee
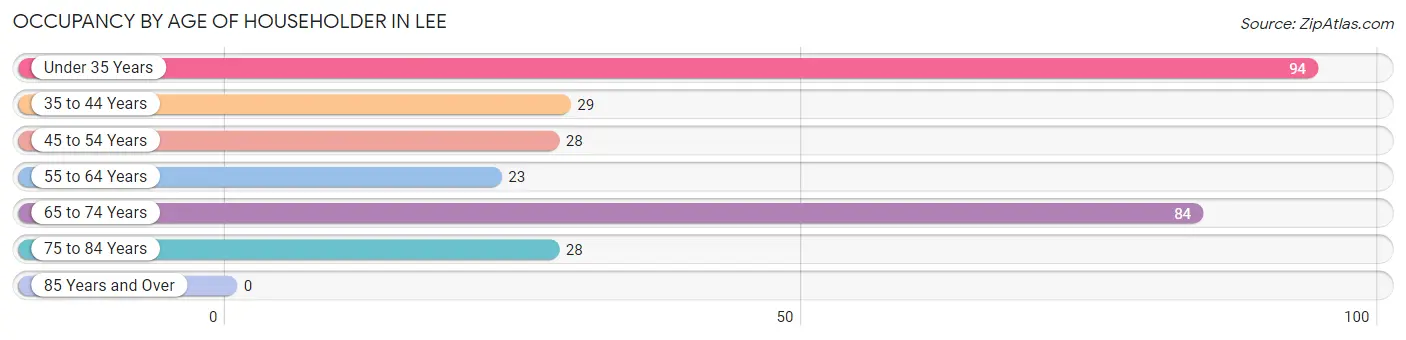
| Age Bracket | # Households | % Households |
| Under 35 Years | 94 | 32.9% |
| 35 to 44 Years | 29 | 10.1% |
| 45 to 54 Years | 28 | 9.8% |
| 55 to 64 Years | 23 | 8.0% |
| 65 to 74 Years | 84 | 29.4% |
| 75 to 84 Years | 28 | 9.8% |
| 85 Years and Over | 0 | 0.0% |
| Total | 286 | 100.0% |
Housing Finances in Lee
Median Income by Occupancy in Lee
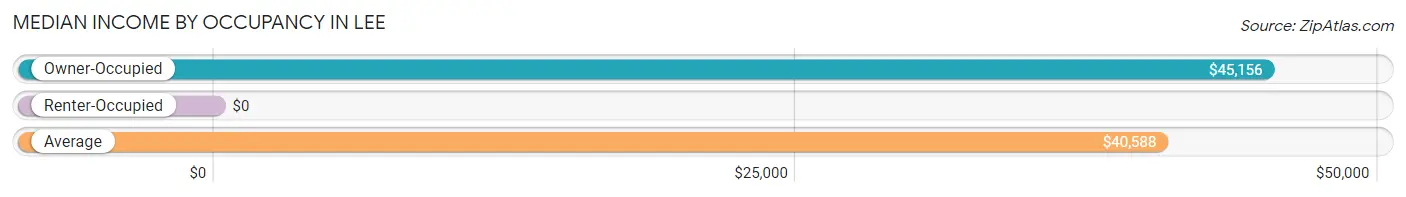
| Occupancy Type | # Households | Median Income |
| Owner-Occupied | 155 (54.2%) | $45,156 |
| Renter-Occupied | 131 (45.8%) | $0 |
| Average | 286 (100.0%) | $40,588 |
Occupancy by Householder Income Bracket in Lee
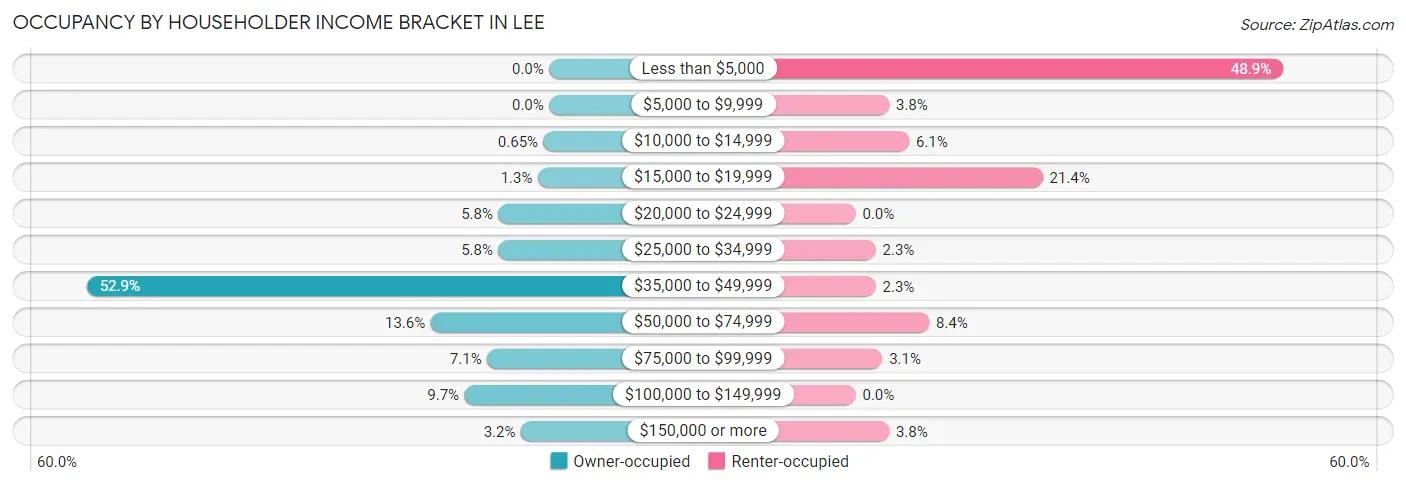
| Income Bracket | Owner-occupied | Renter-occupied |
| Less than $5,000 | 0 (0.0%) | 64 (48.8%) |
| $5,000 to $9,999 | 0 (0.0%) | 5 (3.8%) |
| $10,000 to $14,999 | 1 (0.6%) | 8 (6.1%) |
| $15,000 to $19,999 | 2 (1.3%) | 28 (21.4%) |
| $20,000 to $24,999 | 9 (5.8%) | 0 (0.0%) |
| $25,000 to $34,999 | 9 (5.8%) | 3 (2.3%) |
| $35,000 to $49,999 | 82 (52.9%) | 3 (2.3%) |
| $50,000 to $74,999 | 21 (13.6%) | 11 (8.4%) |
| $75,000 to $99,999 | 11 (7.1%) | 4 (3.0%) |
| $100,000 to $149,999 | 15 (9.7%) | 0 (0.0%) |
| $150,000 or more | 5 (3.2%) | 5 (3.8%) |
| Total | 155 (100.0%) | 131 (100.0%) |
Monthly Housing Cost Tiers in Lee
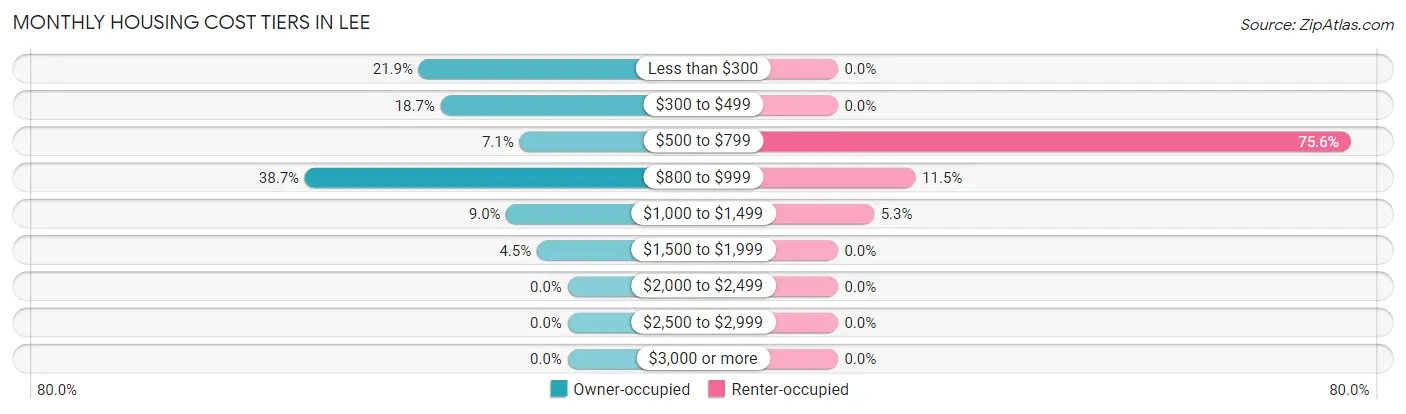
| Monthly Cost | Owner-occupied | Renter-occupied |
| Less than $300 | 34 (21.9%) | 0 (0.0%) |
| $300 to $499 | 29 (18.7%) | 0 (0.0%) |
| $500 to $799 | 11 (7.1%) | 99 (75.6%) |
| $800 to $999 | 60 (38.7%) | 15 (11.5%) |
| $1,000 to $1,499 | 14 (9.0%) | 7 (5.3%) |
| $1,500 to $1,999 | 7 (4.5%) | 0 (0.0%) |
| $2,000 to $2,499 | 0 (0.0%) | 0 (0.0%) |
| $2,500 to $2,999 | 0 (0.0%) | 0 (0.0%) |
| $3,000 or more | 0 (0.0%) | 0 (0.0%) |
| Total | 155 (100.0%) | 131 (100.0%) |
Physical Housing Characteristics in Lee
Housing Structures in Lee
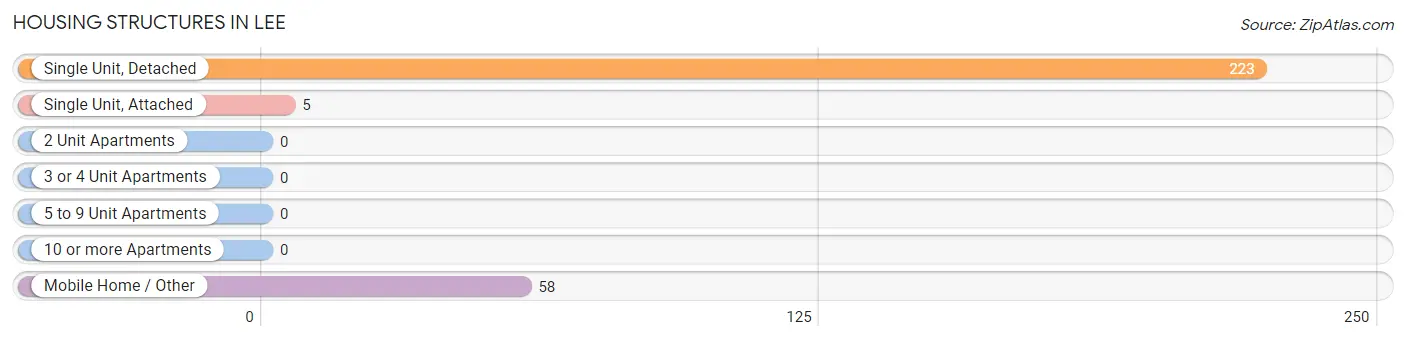
| Structure Type | # Housing Units | % Housing Units |
| Single Unit, Detached | 223 | 78.0% |
| Single Unit, Attached | 5 | 1.8% |
| 2 Unit Apartments | 0 | 0.0% |
| 3 or 4 Unit Apartments | 0 | 0.0% |
| 5 to 9 Unit Apartments | 0 | 0.0% |
| 10 or more Apartments | 0 | 0.0% |
| Mobile Home / Other | 58 | 20.3% |
| Total | 286 | 100.0% |
Housing Structures by Occupancy in Lee
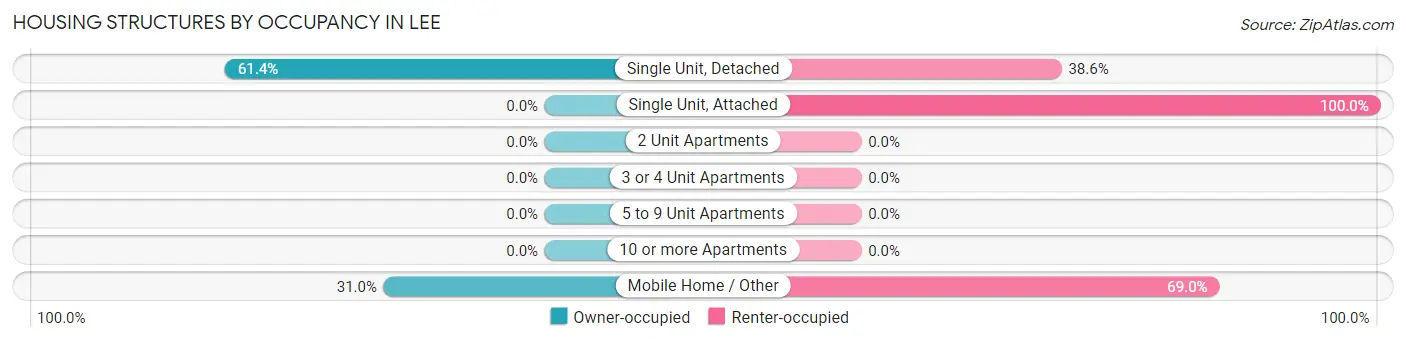
| Structure Type | Owner-occupied | Renter-occupied |
| Single Unit, Detached | 137 (61.4%) | 86 (38.6%) |
| Single Unit, Attached | 0 (0.0%) | 5 (100.0%) |
| 2 Unit Apartments | 0 (0.0%) | 0 (0.0%) |
| 3 or 4 Unit Apartments | 0 (0.0%) | 0 (0.0%) |
| 5 to 9 Unit Apartments | 0 (0.0%) | 0 (0.0%) |
| 10 or more Apartments | 0 (0.0%) | 0 (0.0%) |
| Mobile Home / Other | 18 (31.0%) | 40 (69.0%) |
| Total | 155 (54.2%) | 131 (45.8%) |
Housing Structures by Number of Rooms in Lee
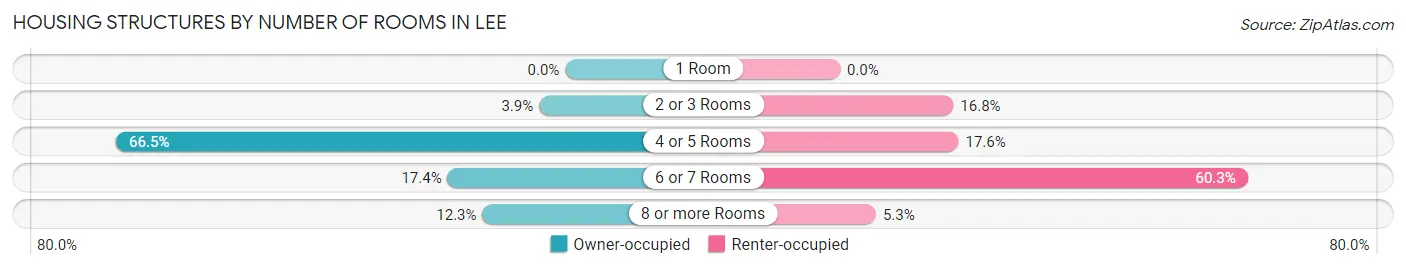
| Number of Rooms | Owner-occupied | Renter-occupied |
| 1 Room | 0 (0.0%) | 0 (0.0%) |
| 2 or 3 Rooms | 6 (3.9%) | 22 (16.8%) |
| 4 or 5 Rooms | 103 (66.4%) | 23 (17.6%) |
| 6 or 7 Rooms | 27 (17.4%) | 79 (60.3%) |
| 8 or more Rooms | 19 (12.3%) | 7 (5.3%) |
| Total | 155 (100.0%) | 131 (100.0%) |
Housing Structure by Heating Type in Lee
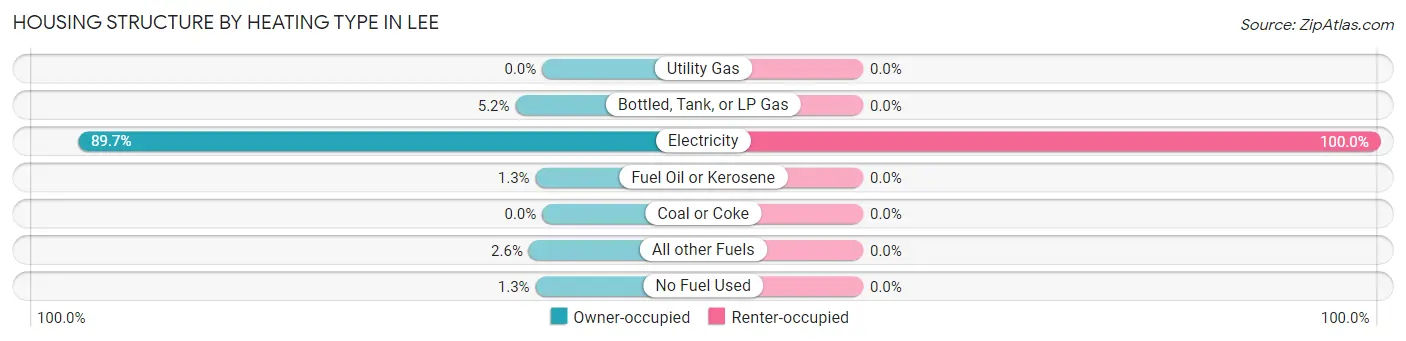
| Heating Type | Owner-occupied | Renter-occupied |
| Utility Gas | 0 (0.0%) | 0 (0.0%) |
| Bottled, Tank, or LP Gas | 8 (5.2%) | 0 (0.0%) |
| Electricity | 139 (89.7%) | 131 (100.0%) |
| Fuel Oil or Kerosene | 2 (1.3%) | 0 (0.0%) |
| Coal or Coke | 0 (0.0%) | 0 (0.0%) |
| All other Fuels | 4 (2.6%) | 0 (0.0%) |
| No Fuel Used | 2 (1.3%) | 0 (0.0%) |
| Total | 155 (100.0%) | 131 (100.0%) |
Household Vehicle Usage in Lee
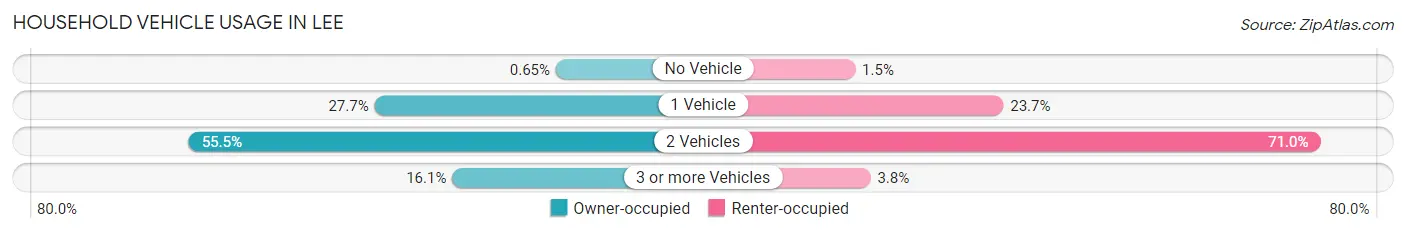
| Vehicles per Household | Owner-occupied | Renter-occupied |
| No Vehicle | 1 (0.6%) | 2 (1.5%) |
| 1 Vehicle | 43 (27.7%) | 31 (23.7%) |
| 2 Vehicles | 86 (55.5%) | 93 (71.0%) |
| 3 or more Vehicles | 25 (16.1%) | 5 (3.8%) |
| Total | 155 (100.0%) | 131 (100.0%) |
Real Estate & Mortgages in Lee
Real Estate and Mortgage Overview in Lee
| Characteristic | Without Mortgage | With Mortgage |
| Housing Units | 67 | 88 |
| Median Property Value | $84,800 | $88,000 |
| Median Household Income | $46,193 | $2 |
| Monthly Housing Costs | $299 | $0 |
| Real Estate Taxes | $1,022 | $9 |
Property Value by Mortgage Status in Lee
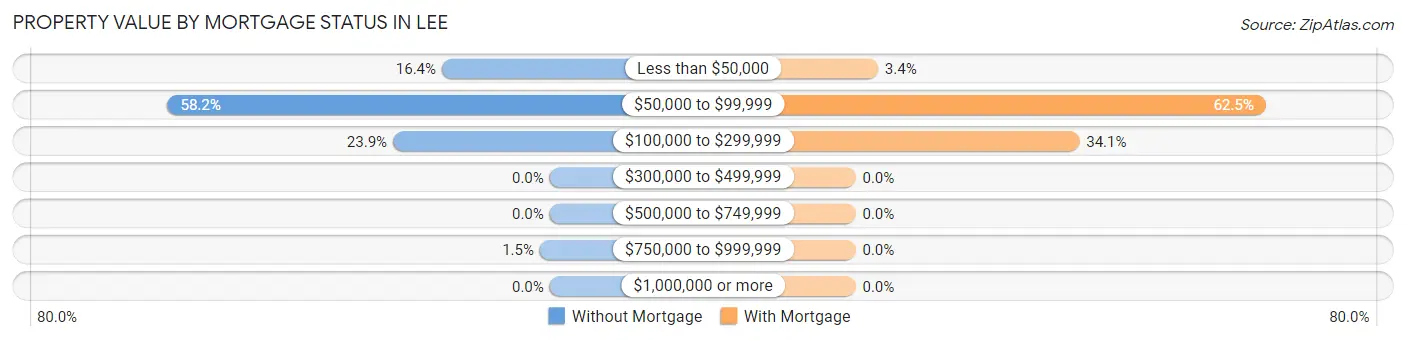
| Property Value | Without Mortgage | With Mortgage |
| Less than $50,000 | 11 (16.4%) | 3 (3.4%) |
| $50,000 to $99,999 | 39 (58.2%) | 55 (62.5%) |
| $100,000 to $299,999 | 16 (23.9%) | 30 (34.1%) |
| $300,000 to $499,999 | 0 (0.0%) | 0 (0.0%) |
| $500,000 to $749,999 | 0 (0.0%) | 0 (0.0%) |
| $750,000 to $999,999 | 1 (1.5%) | 0 (0.0%) |
| $1,000,000 or more | 0 (0.0%) | 0 (0.0%) |
| Total | 67 (100.0%) | 88 (100.0%) |
Household Income by Mortgage Status in Lee
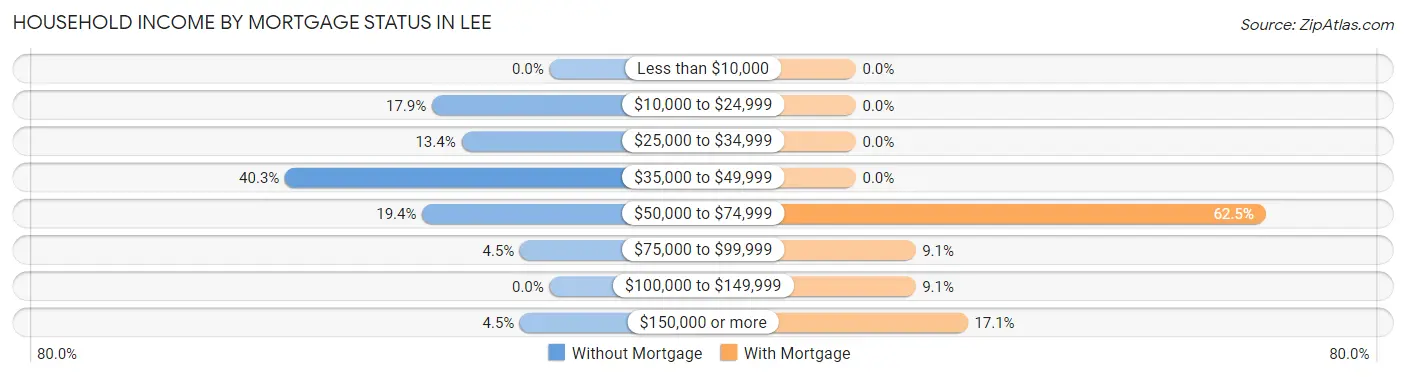
| Household Income | Without Mortgage | With Mortgage |
| Less than $10,000 | 0 (0.0%) | 0 (0.0%) |
| $10,000 to $24,999 | 12 (17.9%) | 0 (0.0%) |
| $25,000 to $34,999 | 9 (13.4%) | 0 (0.0%) |
| $35,000 to $49,999 | 27 (40.3%) | 0 (0.0%) |
| $50,000 to $74,999 | 13 (19.4%) | 55 (62.5%) |
| $75,000 to $99,999 | 3 (4.5%) | 8 (9.1%) |
| $100,000 to $149,999 | 0 (0.0%) | 8 (9.1%) |
| $150,000 or more | 3 (4.5%) | 15 (17.1%) |
| Total | 67 (100.0%) | 88 (100.0%) |
Property Value to Household Income Ratio in Lee
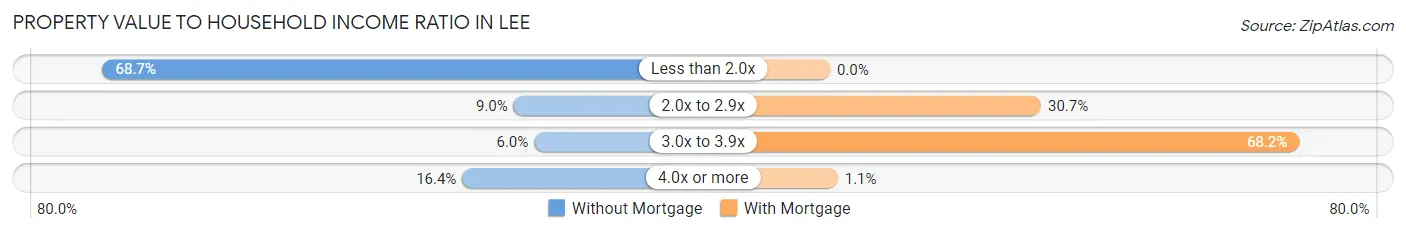
| Value-to-Income Ratio | Without Mortgage | With Mortgage |
| Less than 2.0x | 46 (68.7%) | 0 (0.0%) |
| 2.0x to 2.9x | 6 (9.0%) | 27 (30.7%) |
| 3.0x to 3.9x | 4 (6.0%) | 60 (68.2%) |
| 4.0x or more | 11 (16.4%) | 1 (1.1%) |
| Total | 67 (100.0%) | 88 (100.0%) |
Real Estate Taxes by Mortgage Status in Lee
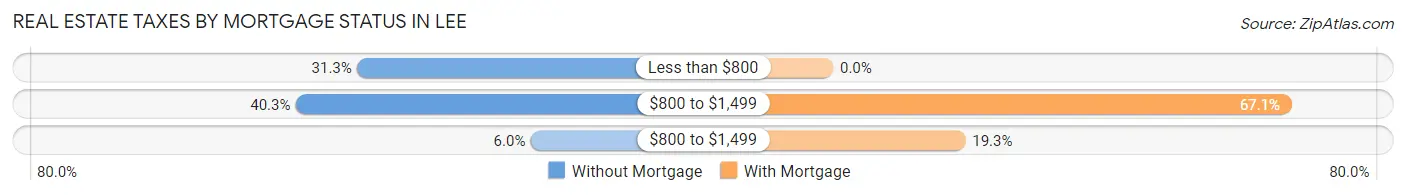
| Property Taxes | Without Mortgage | With Mortgage |
| Less than $800 | 21 (31.3%) | 0 (0.0%) |
| $800 to $1,499 | 27 (40.3%) | 59 (67.0%) |
| $800 to $1,499 | 4 (6.0%) | 17 (19.3%) |
| Total | 67 (100.0%) | 88 (100.0%) |
Health & Disability in Lee
Health Insurance Coverage by Age in Lee
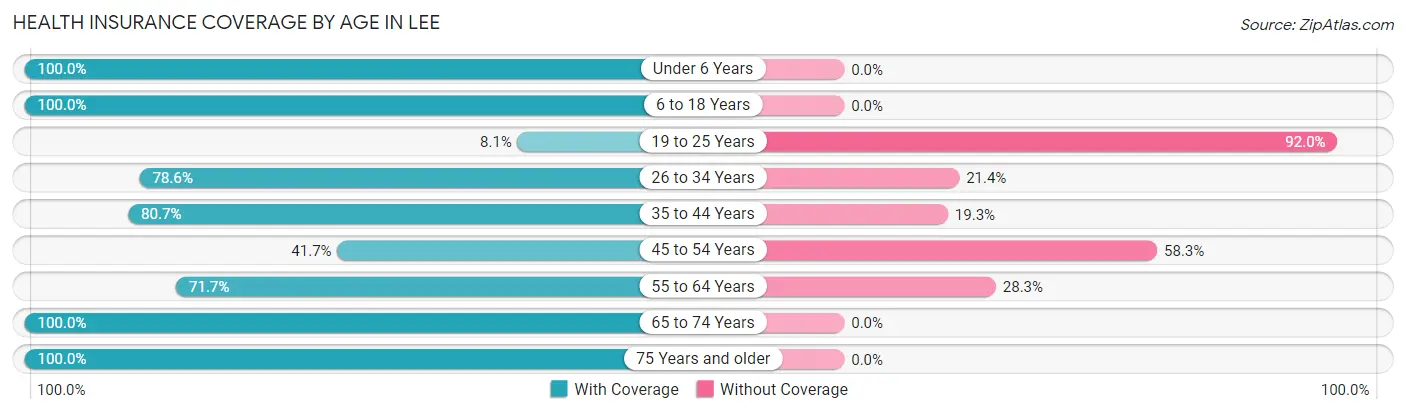
| Age Bracket | With Coverage | Without Coverage |
| Under 6 Years | 51 (100.0%) | 0 (0.0%) |
| 6 to 18 Years | 110 (100.0%) | 0 (0.0%) |
| 19 to 25 Years | 14 (8.1%) | 160 (91.9%) |
| 26 to 34 Years | 33 (78.6%) | 9 (21.4%) |
| 35 to 44 Years | 71 (80.7%) | 17 (19.3%) |
| 45 to 54 Years | 25 (41.7%) | 35 (58.3%) |
| 55 to 64 Years | 33 (71.7%) | 13 (28.3%) |
| 65 to 74 Years | 173 (100.0%) | 0 (0.0%) |
| 75 Years and older | 34 (100.0%) | 0 (0.0%) |
| Total | 544 (69.9%) | 234 (30.1%) |
Health Insurance Coverage by Citizenship Status in Lee
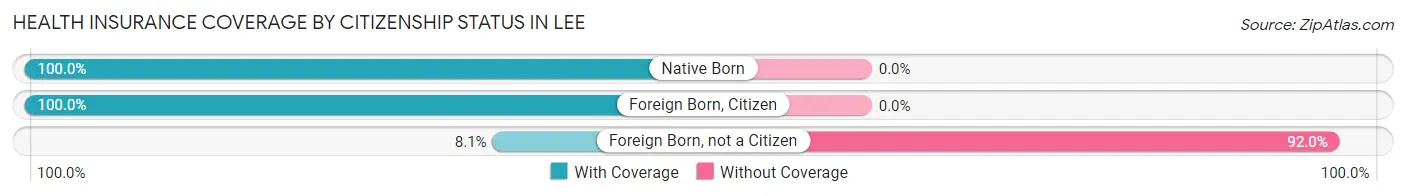
| Citizenship Status | With Coverage | Without Coverage |
| Native Born | 51 (100.0%) | 0 (0.0%) |
| Foreign Born, Citizen | 110 (100.0%) | 0 (0.0%) |
| Foreign Born, not a Citizen | 14 (8.1%) | 160 (91.9%) |
Health Insurance Coverage by Household Income in Lee
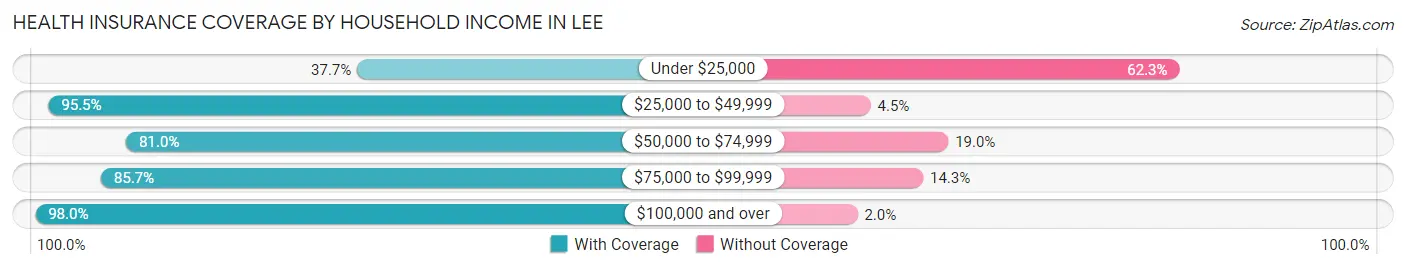
| Household Income | With Coverage | Without Coverage |
| Under $25,000 | 118 (37.7%) | 195 (62.3%) |
| $25,000 to $49,999 | 193 (95.5%) | 9 (4.5%) |
| $50,000 to $74,999 | 81 (81.0%) | 19 (19.0%) |
| $75,000 to $99,999 | 54 (85.7%) | 9 (14.3%) |
| $100,000 and over | 98 (98.0%) | 2 (2.0%) |
Public vs Private Health Insurance Coverage by Age in Lee

| Age Bracket | Public Insurance | Private Insurance |
| Under 6 | 34 (66.7%) | 17 (33.3%) |
| 6 to 18 Years | 86 (78.2%) | 42 (38.2%) |
| 19 to 25 Years | 0 (0.0%) | 14 (8.1%) |
| 25 to 34 Years | 13 (30.9%) | 20 (47.6%) |
| 35 to 44 Years | 2 (2.3%) | 71 (80.7%) |
| 45 to 54 Years | 12 (20.0%) | 15 (25.0%) |
| 55 to 64 Years | 19 (41.3%) | 22 (47.8%) |
| 65 to 74 Years | 173 (100.0%) | 82 (47.4%) |
| 75 Years and over | 34 (100.0%) | 27 (79.4%) |
| Total | 373 (47.9%) | 310 (39.9%) |
Disability Status by Sex by Age in Lee
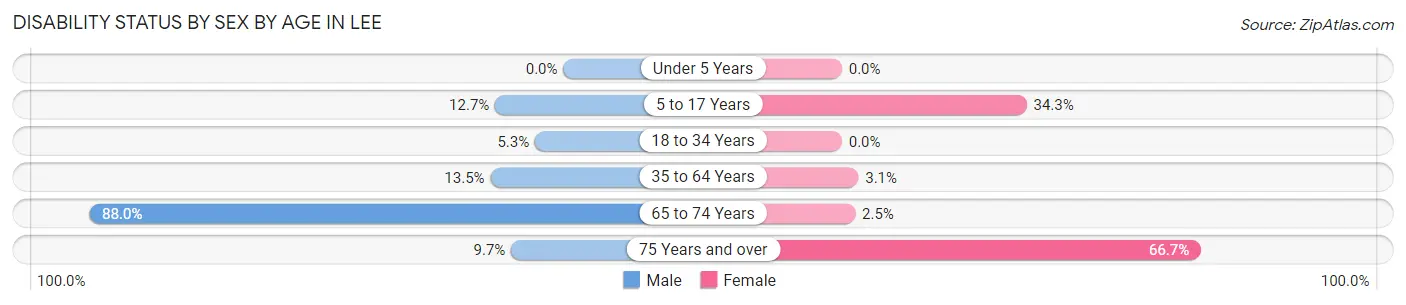
| Age Bracket | Male | Female |
| Under 5 Years | 0 (0.0%) | 0 (0.0%) |
| 5 to 17 Years | 10 (12.7%) | 12 (34.3%) |
| 18 to 34 Years | 6 (5.3%) | 0 (0.0%) |
| 35 to 64 Years | 13 (13.5%) | 3 (3.1%) |
| 65 to 74 Years | 81 (88.0%) | 2 (2.5%) |
| 75 Years and over | 3 (9.7%) | 2 (66.7%) |
Disability Class by Sex by Age in Lee
Disability Class: Hearing Difficulty
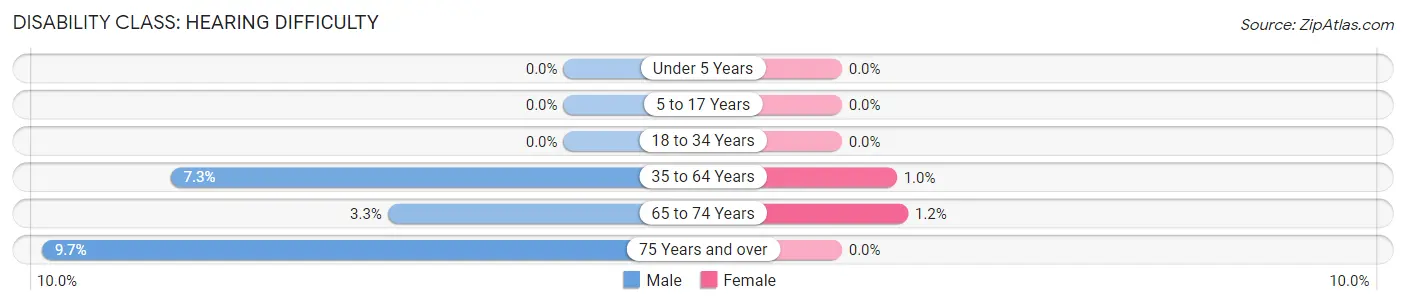
| Age Bracket | Male | Female |
| Under 5 Years | 0 (0.0%) | 0 (0.0%) |
| 5 to 17 Years | 0 (0.0%) | 0 (0.0%) |
| 18 to 34 Years | 0 (0.0%) | 0 (0.0%) |
| 35 to 64 Years | 7 (7.3%) | 1 (1.0%) |
| 65 to 74 Years | 3 (3.3%) | 1 (1.2%) |
| 75 Years and over | 3 (9.7%) | 0 (0.0%) |
Disability Class: Vision Difficulty
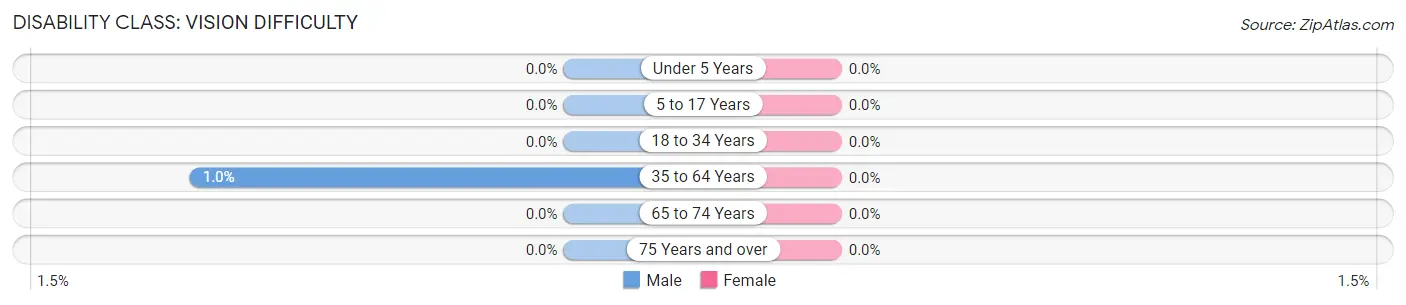
| Age Bracket | Male | Female |
| Under 5 Years | 0 (0.0%) | 0 (0.0%) |
| 5 to 17 Years | 0 (0.0%) | 0 (0.0%) |
| 18 to 34 Years | 0 (0.0%) | 0 (0.0%) |
| 35 to 64 Years | 1 (1.0%) | 0 (0.0%) |
| 65 to 74 Years | 0 (0.0%) | 0 (0.0%) |
| 75 Years and over | 0 (0.0%) | 0 (0.0%) |
Disability Class: Cognitive Difficulty
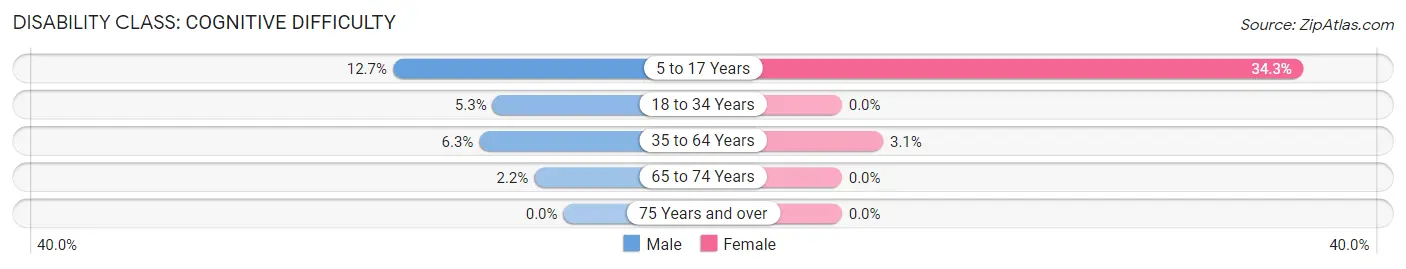
| Age Bracket | Male | Female |
| 5 to 17 Years | 10 (12.7%) | 12 (34.3%) |
| 18 to 34 Years | 6 (5.3%) | 0 (0.0%) |
| 35 to 64 Years | 6 (6.2%) | 3 (3.1%) |
| 65 to 74 Years | 2 (2.2%) | 0 (0.0%) |
| 75 Years and over | 0 (0.0%) | 0 (0.0%) |
Disability Class: Ambulatory Difficulty
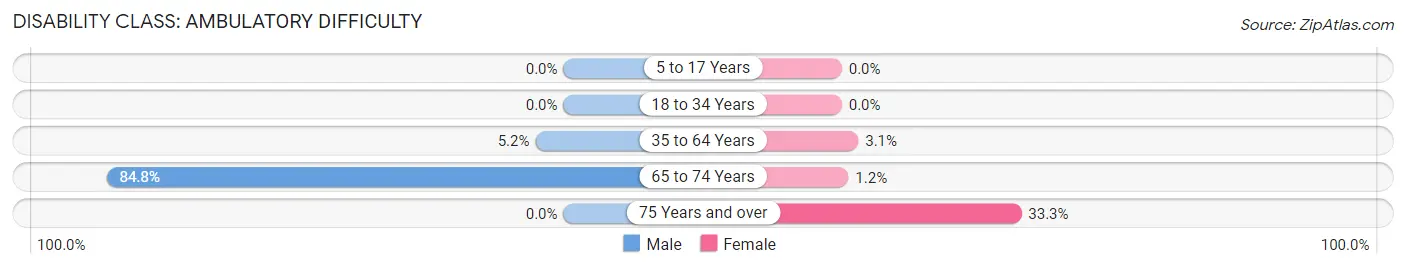
| Age Bracket | Male | Female |
| 5 to 17 Years | 0 (0.0%) | 0 (0.0%) |
| 18 to 34 Years | 0 (0.0%) | 0 (0.0%) |
| 35 to 64 Years | 5 (5.2%) | 3 (3.1%) |
| 65 to 74 Years | 78 (84.8%) | 1 (1.2%) |
| 75 Years and over | 0 (0.0%) | 1 (33.3%) |
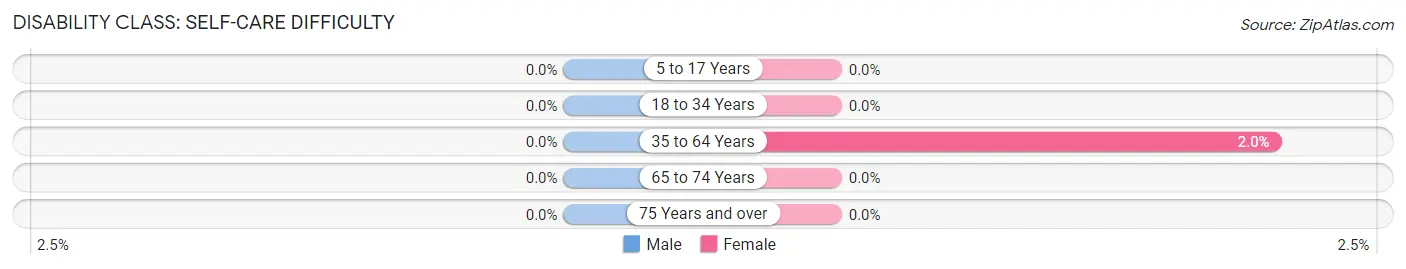
Disability Class: Self-Care Difficulty
| Age Bracket | Male | Female |
| 5 to 17 Years | 0 (0.0%) | 0 (0.0%) |
| 18 to 34 Years | 0 (0.0%) | 0 (0.0%) |
| 35 to 64 Years | 0 (0.0%) | 2 (2.0%) |
| 65 to 74 Years | 0 (0.0%) | 0 (0.0%) |
| 75 Years and over | 0 (0.0%) | 0 (0.0%) |
Technology Access in Lee
Computing Device Access in Lee
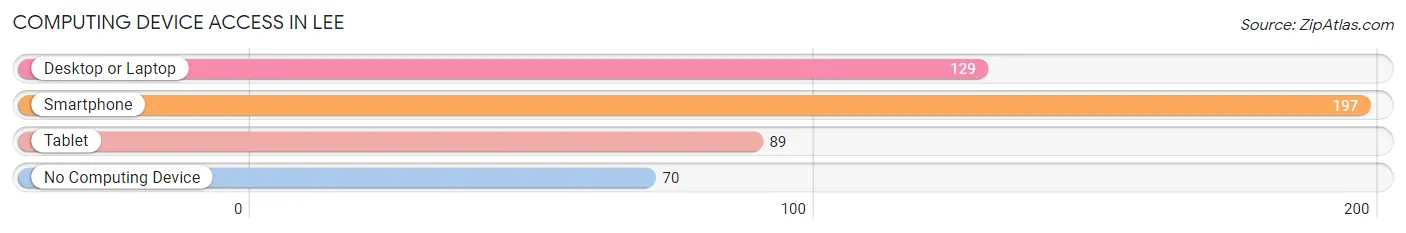
| Device Type | # Households | % Households |
| Desktop or Laptop | 129 | 45.1% |
| Smartphone | 197 | 68.9% |
| Tablet | 89 | 31.1% |
| No Computing Device | 70 | 24.5% |
| Total | 286 | 100.0% |
Internet Access in Lee
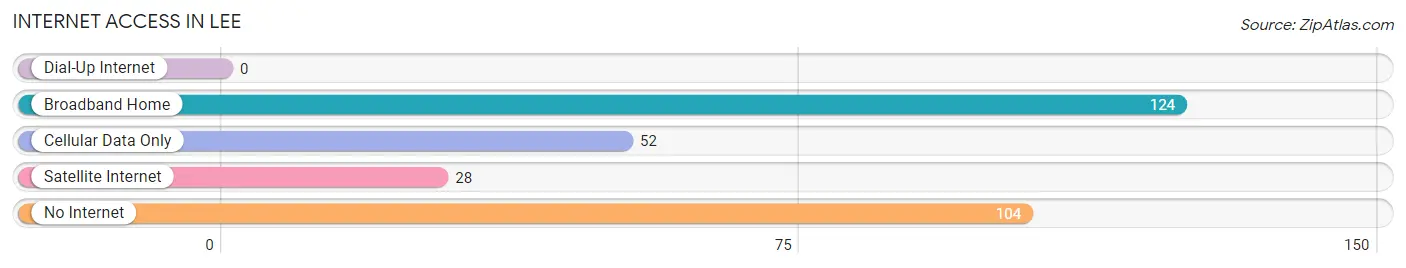
| Internet Type | # Households | % Households |
| Dial-Up Internet | 0 | 0.0% |
| Broadband Home | 124 | 43.4% |
| Cellular Data Only | 52 | 18.2% |
| Satellite Internet | 28 | 9.8% |
| No Internet | 104 | 36.4% |
| Total | 286 | 100.0% |
Lee Summary
Lee County is located in the southwestern corner of Florida, along the Gulf of Mexico. It is bordered by Collier County to the south, Charlotte County to the north, and Hendry and Glades Counties to the east. The county seat is Fort Myers, and the largest city is Cape Coral. Lee County covers an area of 1,214 square miles and has a population of 676,455 as of 2019.
History
Lee County was created in 1887 from parts of Monroe and Hillsborough Counties. It was named for Robert E. Lee, the Confederate general. The county was originally inhabited by the Calusa Indians, who were later displaced by the Seminole Indians. The first European settlers arrived in the area in the late 1700s, and the county was officially established in 1887.
In the early 1900s, the county experienced a population boom due to the arrival of the railroad. This led to the development of several towns, including Fort Myers, which was established in 1886. The city quickly became a popular tourist destination, and by the 1920s, it was known as the “City of Palms” due to its many palm trees.
In the 1950s, the county experienced another population boom due to the development of the Cape Coral area. The city was developed as a planned community, and it quickly became one of the fastest-growing cities in the United States.
Geography
Lee County is located in the southwestern corner of Florida, along the Gulf of Mexico. It is bordered by Collier County to the south, Charlotte County to the north, and Hendry and Glades Counties to the east. The county covers an area of 1,214 square miles and has a population of 676,455 as of 2019.
The county is divided into two distinct regions: the coastal region and the inland region. The coastal region is located along the Gulf of Mexico and is characterized by sandy beaches, mangrove swamps, and estuaries. The inland region is located further inland and is characterized by pine flatwoods, cypress swamps, and hardwood hammocks.
Economy
Lee County has a diverse economy that is driven by tourism, agriculture, and manufacturing. The county is home to several major employers, including Lee Memorial Health System, Lee County Public Schools, and Lee County Government.
Tourism is a major industry in Lee County, and the county is home to several popular tourist attractions, including Fort Myers Beach, Sanibel Island, and Captiva Island. The county also has several golf courses, marinas, and other recreational facilities.
Agriculture is also an important part of the county’s economy. The county is home to several large farms, and the main crops grown in the area include citrus, tomatoes, and sugarcane.
Manufacturing is also an important part of the county’s economy. The county is home to several large manufacturing companies, including Chico’s FAS, Inc., and Alico, Inc.
Demographics
As of 2019, Lee County had a population of 676,455. The population is made up of a diverse mix of ethnicities, including White (63.2%), Hispanic or Latino (25.2%), African American (7.7%), and Asian (2.3%). The median household income in the county is $50,945, and the median home value is $219,400. The county’s unemployment rate is 3.7%.
Common Questions
What is Per Capita Income in Lee?
Per Capita income in Lee is $16,654.
What is the Median Household income in Lee?
Median Household Income in Lee is $40,588.
What is Inequality or Gini Index in Lee?
Inequality or Gini Index in Lee is 0.49.
What is the Total Population of Lee?
Total Population of Lee is 778.
What is the Total Male Population of Lee?
Total Male Population of Lee is 420.
What is the Total Female Population of Lee?
Total Female Population of Lee is 358.
What is the Ratio of Males per 100 Females in Lee?
There are 117.32 Males per 100 Females in Lee.
What is the Ratio of Females per 100 Males in Lee?
There are 85.24 Females per 100 Males in Lee.
What is the Median Population Age in Lee?
Median Population Age in Lee is 38.0 Years.
What is the Average Family Size in Lee
Average Family Size in Lee is 3.2 People.
What is the Average Household Size in Lee
Average Household Size in Lee is 2.7 People.
How Large is the Labor Force in Lee?
There are 383 People in the Labor Forcein in Lee.
What is the Percentage of People in the Labor Force in Lee?
60.6% of People are in the Labor Force in Lee.
What is the Unemployment Rate in Lee?
Unemployment Rate in Lee is 1.6%.