Campbell, FL Map & Demographics
Campbell Map
Campbell Overview
$27,250
PER CAPITA INCOME
$33,250
AVG FAMILY INCOME
$38,117
AVG HOUSEHOLD INCOME
26.5%
WAGE / INCOME GAP [ % ]
73.5¢/ $1
WAGE / INCOME GAP [ $ ]
0.51
INEQUALITY / GINI INDEX
2,262
TOTAL POPULATION
1,092
MALE POPULATION
1,170
FEMALE POPULATION
93.33
MALES / 100 FEMALES
107.14
FEMALES / 100 MALES
64.5
MEDIAN AGE
2.2
AVG FAMILY SIZE
1.9
AVG HOUSEHOLD SIZE
846
LABOR FORCE [ PEOPLE ]
38.7%
PERCENT IN LABOR FORCE
11.6%
UNEMPLOYMENT RATE
Income in Campbell
Income Overview in Campbell
Per Capita Income in Campbell is $27,250, while median incomes of families and households are $33,250 and $38,117 respectively.
| Characteristic | Number | Measure |
| Per Capita Income | 2,262 | $27,250 |
| Median Family Income | 536 | $33,250 |
| Mean Family Income | 536 | $44,333 |
| Median Household Income | 1,099 | $38,117 |
| Mean Household Income | 1,099 | $44,490 |
| Income Deficit | 536 | $0 |
| Wage / Income Gap (%) | 2,262 | 26.51% |
| Wage / Income Gap ($) | 2,262 | 73.49¢ per $1 |
| Gini / Inequality Index | 2,262 | 0.51 |
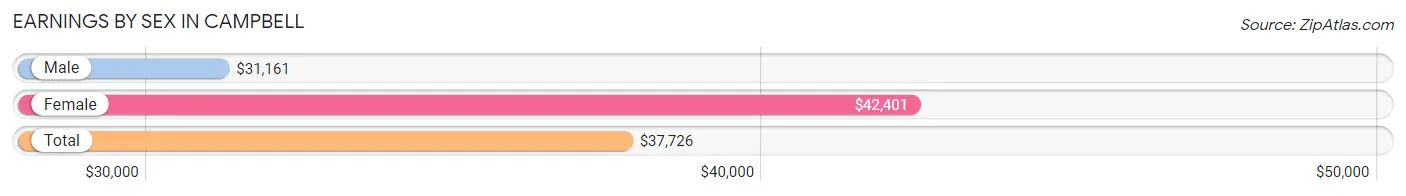
Earnings by Sex in Campbell
Average Earnings in Campbell are $37,726, $31,161 for men and $42,401 for women, a difference of 26.5%.
| Sex | Number | Average Earnings |
| Male | 489 (58.5%) | $31,161 |
| Female | 347 (41.5%) | $42,401 |
| Total | 836 (100.0%) | $37,726 |
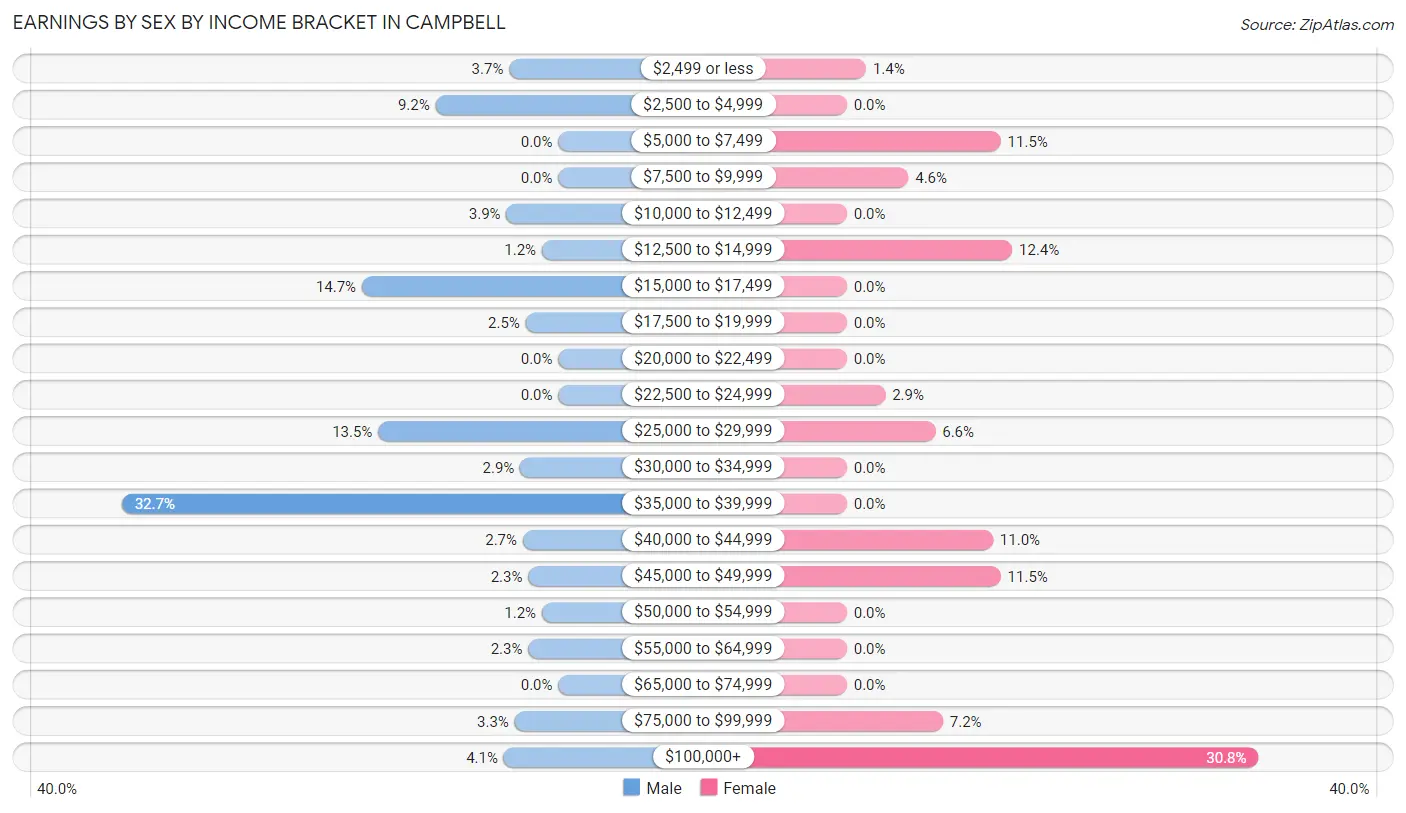
Earnings by Sex by Income Bracket in Campbell
The most common earnings brackets in Campbell are $35,000 to $39,999 for men (160 | 32.7%) and $100,000+ for women (107 | 30.8%).
| Income | Male | Female |
| $2,499 or less | 18 (3.7%) | 5 (1.4%) |
| $2,500 to $4,999 | 45 (9.2%) | 0 (0.0%) |
| $5,000 to $7,499 | 0 (0.0%) | 40 (11.5%) |
| $7,500 to $9,999 | 0 (0.0%) | 16 (4.6%) |
| $10,000 to $12,499 | 19 (3.9%) | 0 (0.0%) |
| $12,500 to $14,999 | 6 (1.2%) | 43 (12.4%) |
| $15,000 to $17,499 | 72 (14.7%) | 0 (0.0%) |
| $17,500 to $19,999 | 12 (2.5%) | 0 (0.0%) |
| $20,000 to $22,499 | 0 (0.0%) | 0 (0.0%) |
| $22,500 to $24,999 | 0 (0.0%) | 10 (2.9%) |
| $25,000 to $29,999 | 66 (13.5%) | 23 (6.6%) |
| $30,000 to $34,999 | 14 (2.9%) | 0 (0.0%) |
| $35,000 to $39,999 | 160 (32.7%) | 0 (0.0%) |
| $40,000 to $44,999 | 13 (2.7%) | 38 (11.0%) |
| $45,000 to $49,999 | 11 (2.2%) | 40 (11.5%) |
| $50,000 to $54,999 | 6 (1.2%) | 0 (0.0%) |
| $55,000 to $64,999 | 11 (2.2%) | 0 (0.0%) |
| $65,000 to $74,999 | 0 (0.0%) | 0 (0.0%) |
| $75,000 to $99,999 | 16 (3.3%) | 25 (7.2%) |
| $100,000+ | 20 (4.1%) | 107 (30.8%) |
| Total | 489 (100.0%) | 347 (100.0%) |
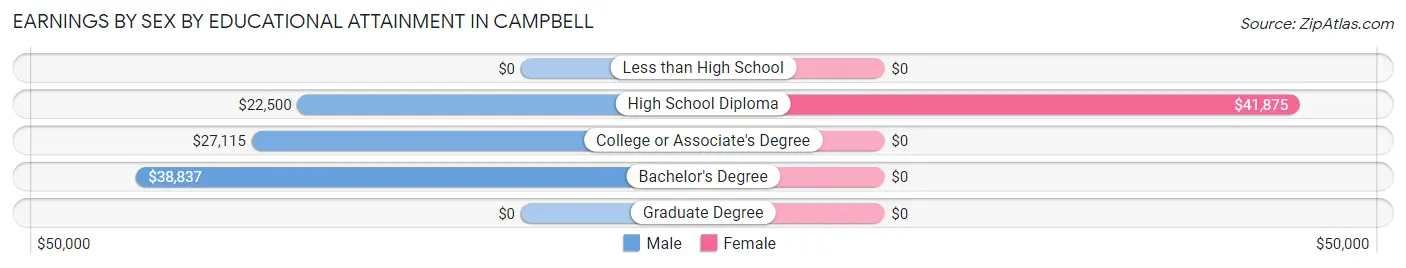
Earnings by Sex by Educational Attainment in Campbell
Average earnings in Campbell are $36,953 for men and $42,401 for women, a difference of 12.9%. Men with an educational attainment of bachelor's degree enjoy the highest average annual earnings of $38,837, while those with high school diploma education earn the least with $22,500. Women with an educational attainment of high school diploma earn the most with the average annual earnings of $41,875, while those with high school diploma education have the smallest earnings of $41,875.
| Educational Attainment | Male Income | Female Income |
| Less than High School | - | - |
| High School Diploma | $22,500 | $41,875 |
| College or Associate's Degree | $27,115 | $0 |
| Bachelor's Degree | $38,837 | $0 |
| Graduate Degree | - | - |
| Total | $36,953 | $42,401 |
Family Income in Campbell
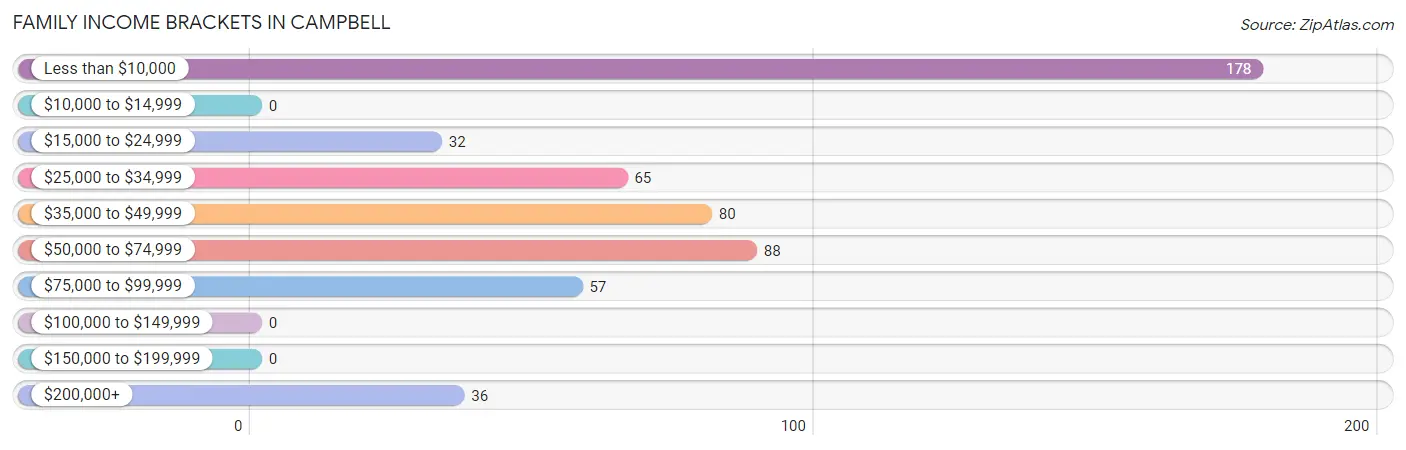
Family Income Brackets in Campbell
According to the Campbell family income data, there are 178 families falling into the less than $10,000 income range, which is the most common income bracket and makes up 33.2% of all families.
| Income Bracket | # Families | % Families |
| Less than $10,000 | 178 | 33.2% |
| $10,000 to $14,999 | 0 | 0.0% |
| $15,000 to $24,999 | 32 | 6.0% |
| $25,000 to $34,999 | 65 | 12.1% |
| $35,000 to $49,999 | 80 | 14.9% |
| $50,000 to $74,999 | 88 | 16.4% |
| $75,000 to $99,999 | 57 | 10.6% |
| $100,000 to $149,999 | 0 | 0.0% |
| $150,000 to $199,999 | 0 | 0.0% |
| $200,000+ | 36 | 6.7% |
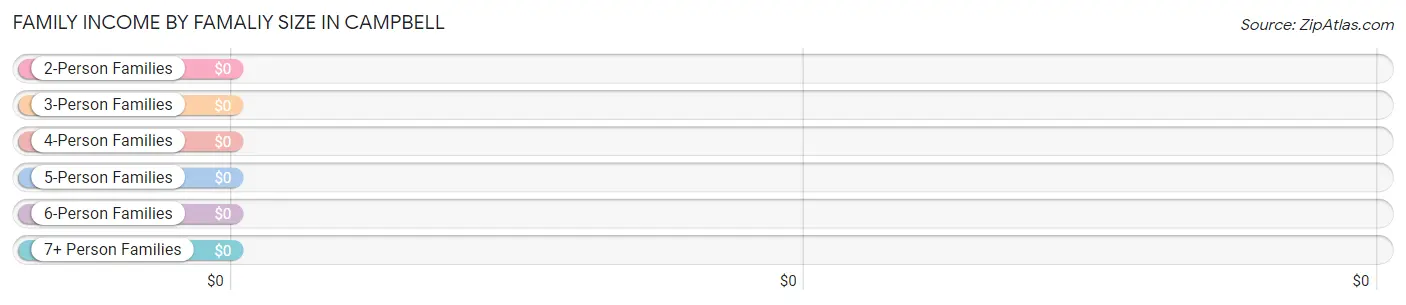
Family Income by Famaliy Size in Campbell
| Income Bracket | # Families | Median Income |
| 2-Person Families | 457 (85.3%) | $0 |
| 3-Person Families | 73 (13.6%) | $0 |
| 4-Person Families | 0 (0.0%) | $0 |
| 5-Person Families | 6 (1.1%) | $0 |
| 6-Person Families | 0 (0.0%) | $0 |
| 7+ Person Families | 0 (0.0%) | $0 |
| Total | 536 (100.0%) | $33,250 |
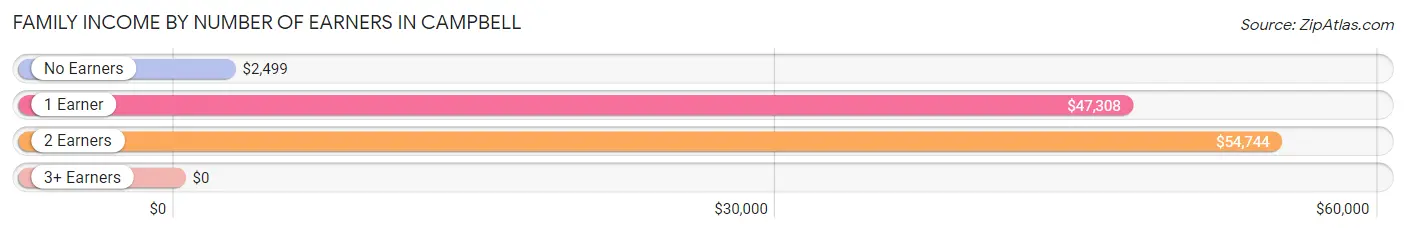
Family Income by Number of Earners in Campbell
| Number of Earners | # Families | Median Income |
| No Earners | 328 (61.2%) | $2,499 |
| 1 Earner | 126 (23.5%) | $47,308 |
| 2 Earners | 82 (15.3%) | $54,744 |
| 3+ Earners | 0 (0.0%) | $0 |
| Total | 536 (100.0%) | $33,250 |
Household Income in Campbell
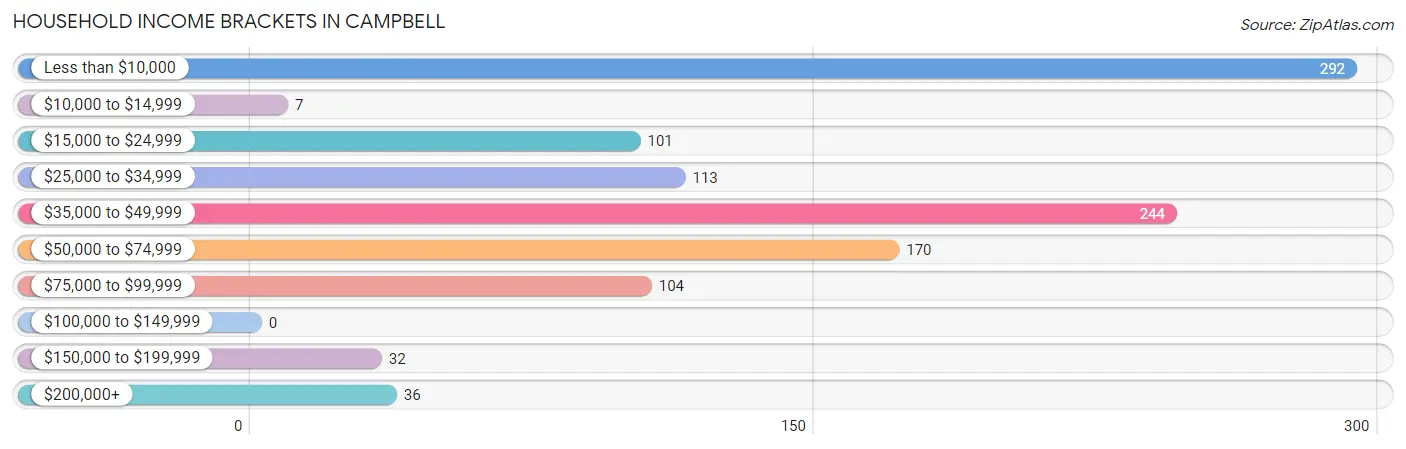
Household Income Brackets in Campbell
With 292 households falling in the category, the less than $10,000 income range is the most frequent in Campbell, accounting for 26.6% of all households.
| Income Bracket | # Households | % Households |
| Less than $10,000 | 292 | 26.6% |
| $10,000 to $14,999 | 7 | 0.6% |
| $15,000 to $24,999 | 101 | 9.2% |
| $25,000 to $34,999 | 113 | 10.3% |
| $35,000 to $49,999 | 244 | 22.2% |
| $50,000 to $74,999 | 170 | 15.5% |
| $75,000 to $99,999 | 104 | 9.5% |
| $100,000 to $149,999 | 0 | 0.0% |
| $150,000 to $199,999 | 32 | 2.9% |
| $200,000+ | 36 | 3.3% |
Household Income by Householder Age in Campbell
The median household income in Campbell is $38,117, with the highest median household income of $31,771 found in the 65+ years age bracket for the primary householder. A total of 511 households (46.5%) fall into this category.
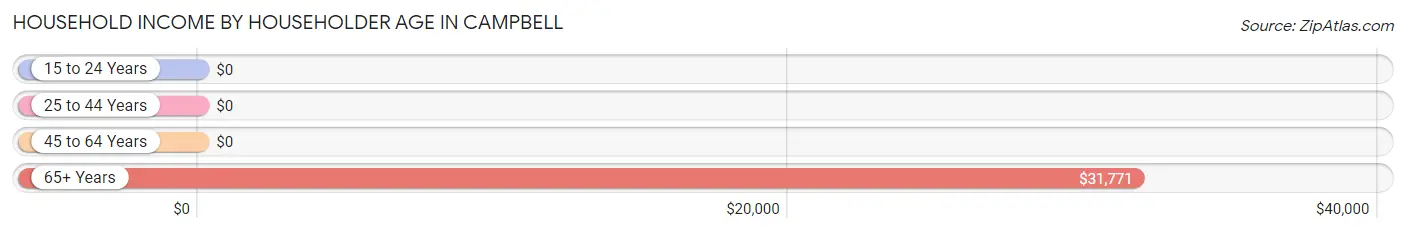
| Income Bracket | # Households | Median Income |
| 15 to 24 Years | 0 (0.0%) | $0 |
| 25 to 44 Years | 112 (10.2%) | $0 |
| 45 to 64 Years | 476 (43.3%) | $0 |
| 65+ Years | 511 (46.5%) | $31,771 |
| Total | 1,099 (100.0%) | $38,117 |
Poverty in Campbell
Income Below Poverty by Sex and Age in Campbell
With 28.9% poverty level for males and 23.9% for females among the residents of Campbell, 6 to 11 year old males and 18 to 24 year old females are the most vulnerable to poverty, with 42 males (100.0%) and 35 females (100.0%) in their respective age groups living below the poverty level.
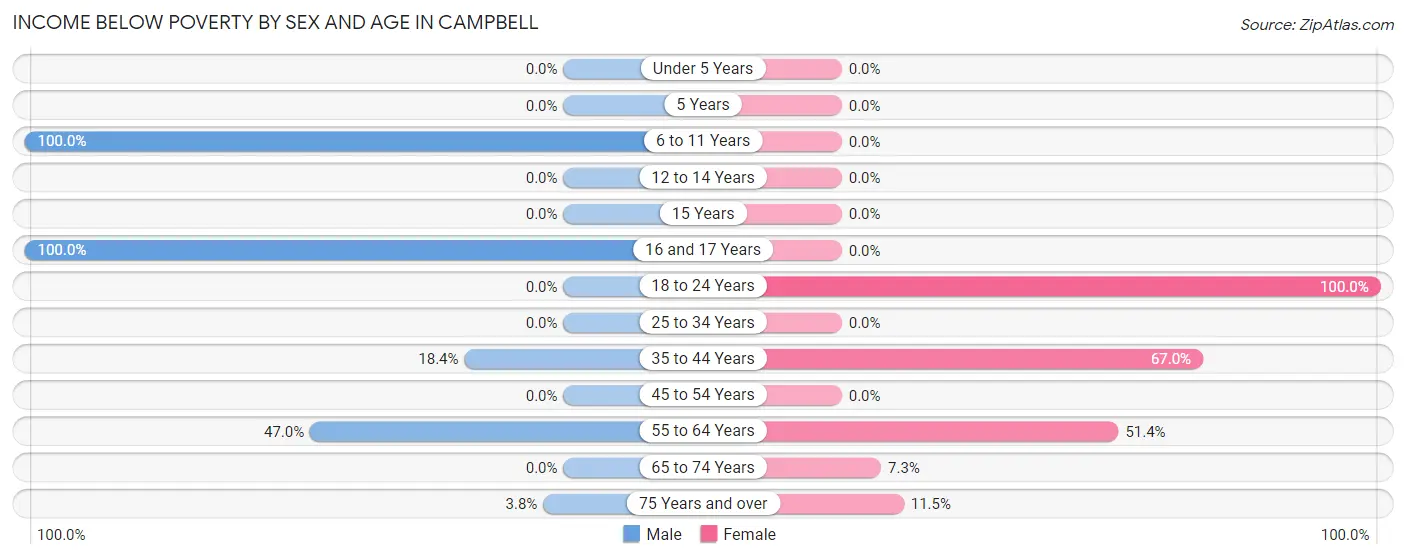
| Age Bracket | Male | Female |
| Under 5 Years | 0 (0.0%) | 0 (0.0%) |
| 5 Years | 0 (0.0%) | 0 (0.0%) |
| 6 to 11 Years | 42 (100.0%) | 0 (0.0%) |
| 12 to 14 Years | 0 (0.0%) | 0 (0.0%) |
| 15 Years | 0 (0.0%) | 0 (0.0%) |
| 16 and 17 Years | 40 (100.0%) | 0 (0.0%) |
| 18 to 24 Years | 0 (0.0%) | 35 (100.0%) |
| 25 to 34 Years | 0 (0.0%) | 0 (0.0%) |
| 35 to 44 Years | 18 (18.4%) | 61 (67.0%) |
| 45 to 54 Years | 0 (0.0%) | 0 (0.0%) |
| 55 to 64 Years | 189 (47.0%) | 95 (51.3%) |
| 65 to 74 Years | 0 (0.0%) | 7 (7.3%) |
| 75 Years and over | 9 (3.7%) | 54 (11.5%) |
| Total | 298 (28.9%) | 252 (23.9%) |
Income Above Poverty by Sex and Age in Campbell
According to the poverty statistics in Campbell, males aged under 5 years and females aged under 5 years are the age groups that are most secure financially, with 100.0% of males and 100.0% of females in these age groups living above the poverty line.
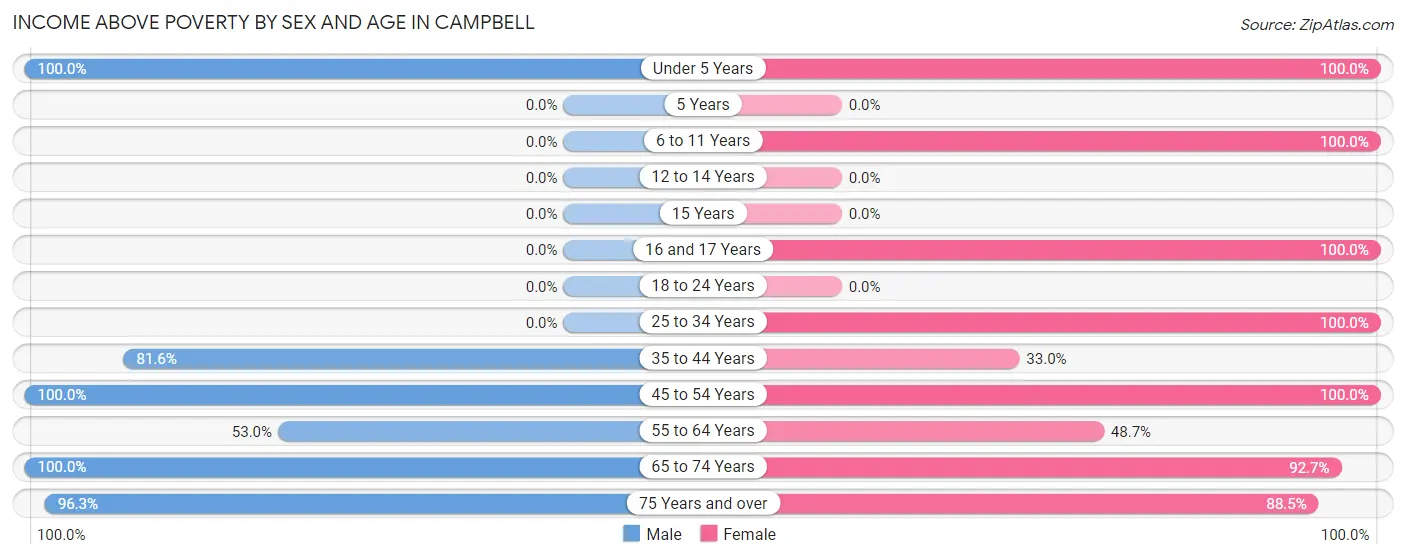
| Age Bracket | Male | Female |
| Under 5 Years | 16 (100.0%) | 14 (100.0%) |
| 5 Years | 0 (0.0%) | 0 (0.0%) |
| 6 to 11 Years | 0 (0.0%) | 5 (100.0%) |
| 12 to 14 Years | 0 (0.0%) | 0 (0.0%) |
| 15 Years | 0 (0.0%) | 0 (0.0%) |
| 16 and 17 Years | 0 (0.0%) | 5 (100.0%) |
| 18 to 24 Years | 0 (0.0%) | 0 (0.0%) |
| 25 to 34 Years | 0 (0.0%) | 40 (100.0%) |
| 35 to 44 Years | 80 (81.6%) | 30 (33.0%) |
| 45 to 54 Years | 154 (100.0%) | 112 (100.0%) |
| 55 to 64 Years | 213 (53.0%) | 90 (48.6%) |
| 65 to 74 Years | 40 (100.0%) | 89 (92.7%) |
| 75 Years and over | 231 (96.3%) | 415 (88.5%) |
| Total | 734 (71.1%) | 800 (76.0%) |
Income Below Poverty Among Married-Couple Families in Campbell
The poverty statistics for married-couple families in Campbell show that 42.6% or 178 of the total 418 families live below the poverty line. Families with no children have the highest poverty rate of 43.2%, comprising of 178 families. On the other hand, families with 3 or 4 children have the lowest poverty rate of 0.0%, which includes 0 families.
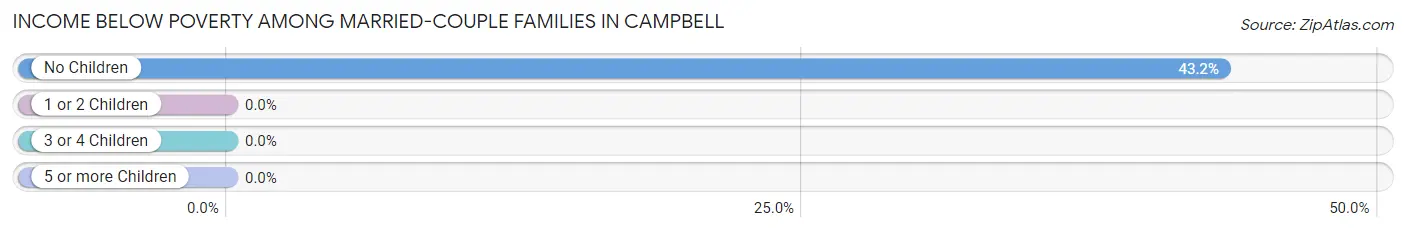
| Children | Above Poverty | Below Poverty |
| No Children | 234 (56.8%) | 178 (43.2%) |
| 1 or 2 Children | 0 (0.0%) | 0 (0.0%) |
| 3 or 4 Children | 6 (100.0%) | 0 (0.0%) |
| 5 or more Children | 0 (0.0%) | 0 (0.0%) |
| Total | 240 (57.4%) | 178 (42.6%) |
Income Below Poverty Among Single-Parent Households in Campbell
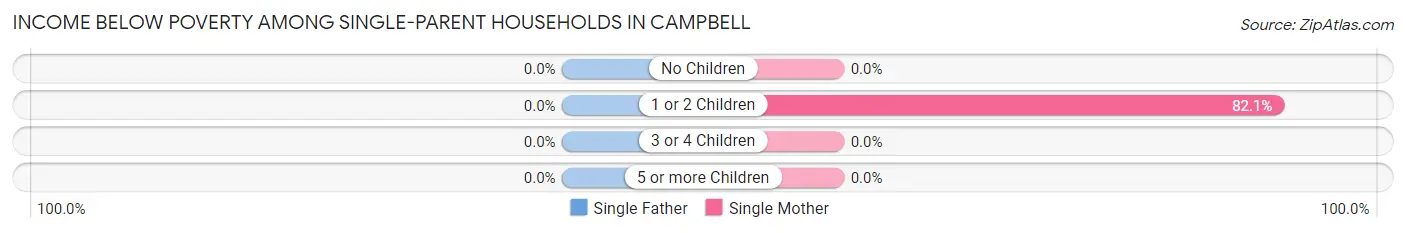
| Children | Single Father | Single Mother |
| No Children | 0 (0.0%) | 0 (0.0%) |
| 1 or 2 Children | 0 (0.0%) | 32 (82.1%) |
| 3 or 4 Children | 0 (0.0%) | 0 (0.0%) |
| 5 or more Children | 0 (0.0%) | 0 (0.0%) |
| Total | 0 (0.0%) | 32 (30.8%) |
Income Below Poverty Among Married-Couple vs Single-Parent Households in Campbell
The poverty data for Campbell shows that 178 of the married-couple family households (42.6%) and 32 of the single-parent households (27.1%) are living below the poverty level. Within the married-couple family households, those with no children have the highest poverty rate, with 178 households (43.2%) falling below the poverty line. Among the single-parent households, those with 1 or 2 children have the highest poverty rate, with 32 household (82.1%) living below poverty.
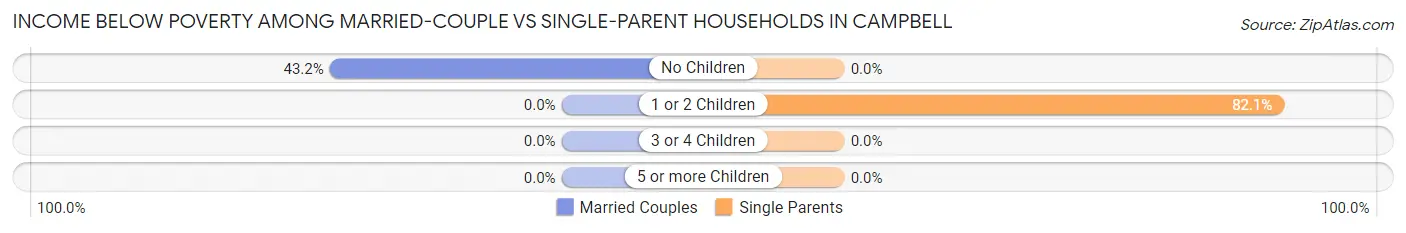
| Children | Married-Couple Families | Single-Parent Households |
| No Children | 178 (43.2%) | 0 (0.0%) |
| 1 or 2 Children | 0 (0.0%) | 32 (82.1%) |
| 3 or 4 Children | 0 (0.0%) | 0 (0.0%) |
| 5 or more Children | 0 (0.0%) | 0 (0.0%) |
| Total | 178 (42.6%) | 32 (27.1%) |
Race in Campbell
The most populous races in Campbell are White / Caucasian (1,271 | 56.2%), Hispanic or Latino (830 | 36.7%), and Some other Race (552 | 24.4%).
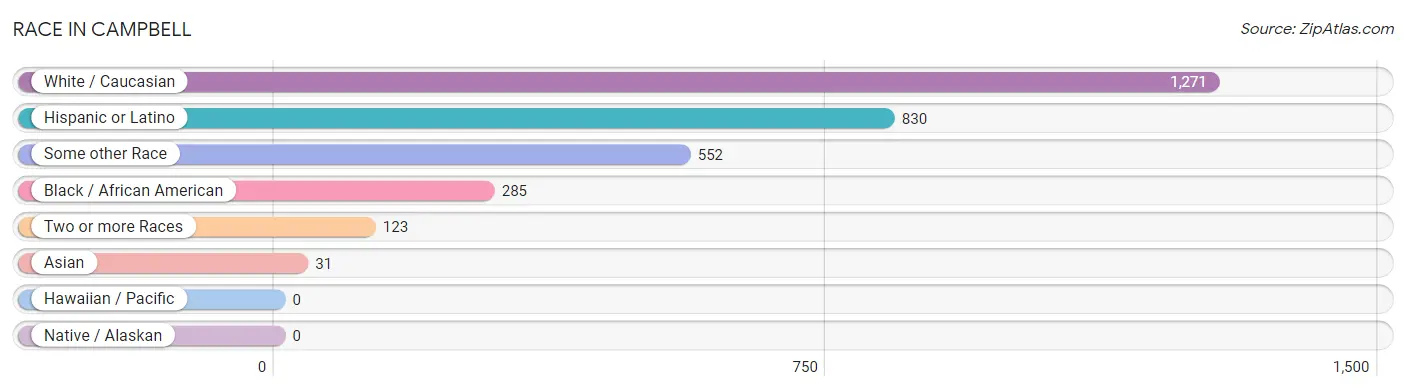
| Race | # Population | % Population |
| Asian | 31 | 1.4% |
| Black / African American | 285 | 12.6% |
| Hawaiian / Pacific | 0 | 0.0% |
| Hispanic or Latino | 830 | 36.7% |
| Native / Alaskan | 0 | 0.0% |
| White / Caucasian | 1,271 | 56.2% |
| Two or more Races | 123 | 5.4% |
| Some other Race | 552 | 24.4% |
| Total | 2,262 | 100.0% |
Ancestry in Campbell
The most populous ancestries reported in Campbell are Puerto Rican (681 | 30.1%), Irish (149 | 6.6%), English (144 | 6.4%), French (121 | 5.3%), and Scottish (94 | 4.2%), together accounting for 52.6% of all Campbell residents.
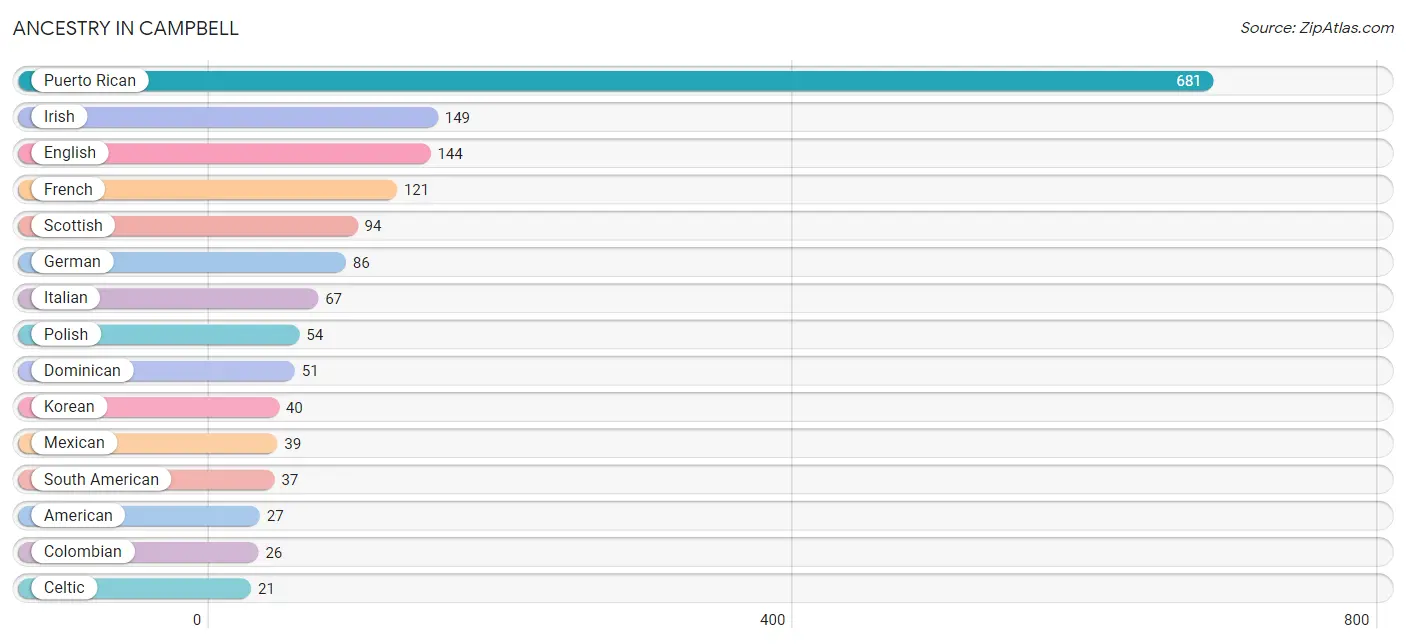
| Ancestry | # Population | % Population |
| American | 27 | 1.2% |
| Arab | 20 | 0.9% |
| Burmese | 15 | 0.7% |
| Celtic | 21 | 0.9% |
| Central American | 3 | 0.1% |
| Cherokee | 16 | 0.7% |
| Chippewa | 4 | 0.2% |
| Colombian | 26 | 1.1% |
| Czech | 11 | 0.5% |
| Dominican | 51 | 2.2% |
| Dutch | 19 | 0.8% |
| English | 144 | 6.4% |
| European | 11 | 0.5% |
| French | 121 | 5.3% |
| German | 86 | 3.8% |
| Indian (Asian) | 16 | 0.7% |
| Irish | 149 | 6.6% |
| Italian | 67 | 3.0% |
| Jamaican | 8 | 0.4% |
| Korean | 40 | 1.8% |
| Lithuanian | 6 | 0.3% |
| Mexican | 39 | 1.7% |
| Moroccan | 20 | 0.9% |
| Norwegian | 14 | 0.6% |
| Panamanian | 3 | 0.1% |
| Polish | 54 | 2.4% |
| Portuguese | 5 | 0.2% |
| Puerto Rican | 681 | 30.1% |
| Romanian | 6 | 0.3% |
| Scottish | 94 | 4.2% |
| South American | 37 | 1.6% |
| Venezuelan | 11 | 0.5% |
| Welsh | 20 | 0.9% | View All 33 Rows |
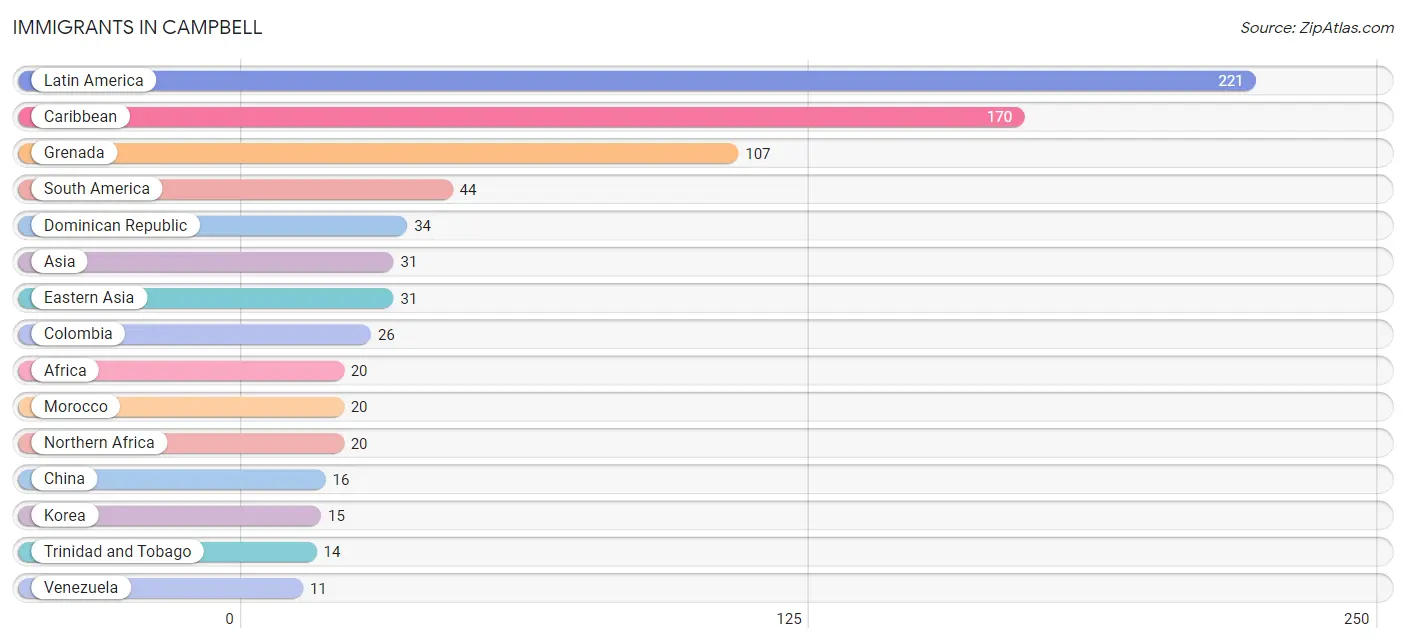
Immigrants in Campbell
The most numerous immigrant groups reported in Campbell came from Latin America (221 | 9.8%), Caribbean (170 | 7.5%), Grenada (107 | 4.7%), South America (44 | 1.9%), and Dominican Republic (34 | 1.5%), together accounting for 25.5% of all Campbell residents.
| Immigration Origin | # Population | % Population |
| Africa | 20 | 0.9% |
| Asia | 31 | 1.4% |
| Caribbean | 170 | 7.5% |
| Central America | 7 | 0.3% |
| China | 16 | 0.7% |
| Colombia | 26 | 1.1% |
| Dominican Republic | 34 | 1.5% |
| Eastern Asia | 31 | 1.4% |
| Grenada | 107 | 4.7% |
| Guyana | 7 | 0.3% |
| Haiti | 7 | 0.3% |
| Jamaica | 8 | 0.4% |
| Korea | 15 | 0.7% |
| Latin America | 221 | 9.8% |
| Morocco | 20 | 0.9% |
| Northern Africa | 20 | 0.9% |
| Panama | 7 | 0.3% |
| South America | 44 | 1.9% |
| Trinidad and Tobago | 14 | 0.6% |
| Venezuela | 11 | 0.5% | View All 20 Rows |
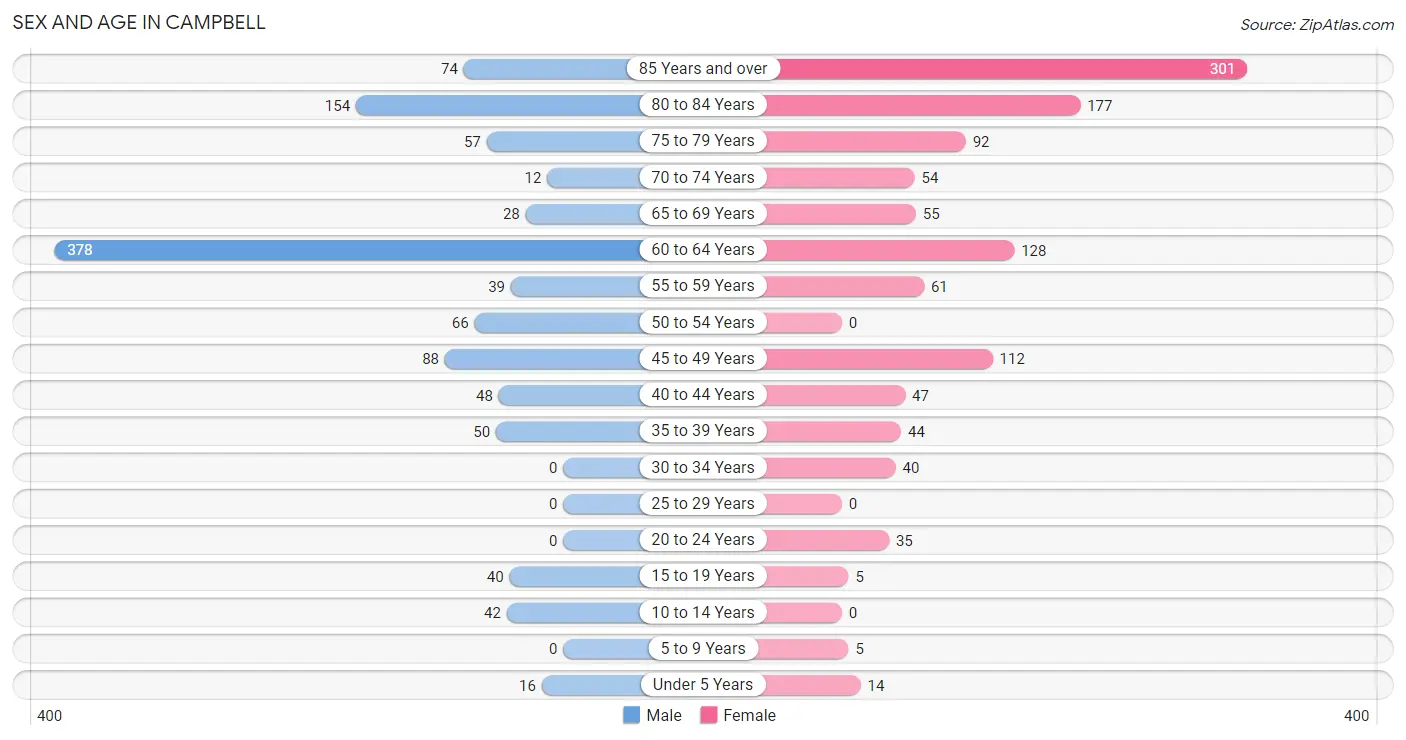
Sex and Age in Campbell
Sex and Age in Campbell
The most populous age groups in Campbell are 60 to 64 Years (378 | 34.6%) for men and 85 Years and over (301 | 25.7%) for women.
| Age Bracket | Male | Female |
| Under 5 Years | 16 (1.5%) | 14 (1.2%) |
| 5 to 9 Years | 0 (0.0%) | 5 (0.4%) |
| 10 to 14 Years | 42 (3.8%) | 0 (0.0%) |
| 15 to 19 Years | 40 (3.7%) | 5 (0.4%) |
| 20 to 24 Years | 0 (0.0%) | 35 (3.0%) |
| 25 to 29 Years | 0 (0.0%) | 0 (0.0%) |
| 30 to 34 Years | 0 (0.0%) | 40 (3.4%) |
| 35 to 39 Years | 50 (4.6%) | 44 (3.8%) |
| 40 to 44 Years | 48 (4.4%) | 47 (4.0%) |
| 45 to 49 Years | 88 (8.1%) | 112 (9.6%) |
| 50 to 54 Years | 66 (6.0%) | 0 (0.0%) |
| 55 to 59 Years | 39 (3.6%) | 61 (5.2%) |
| 60 to 64 Years | 378 (34.6%) | 128 (10.9%) |
| 65 to 69 Years | 28 (2.6%) | 55 (4.7%) |
| 70 to 74 Years | 12 (1.1%) | 54 (4.6%) |
| 75 to 79 Years | 57 (5.2%) | 92 (7.9%) |
| 80 to 84 Years | 154 (14.1%) | 177 (15.1%) |
| 85 Years and over | 74 (6.8%) | 301 (25.7%) |
| Total | 1,092 (100.0%) | 1,170 (100.0%) |
Families and Households in Campbell
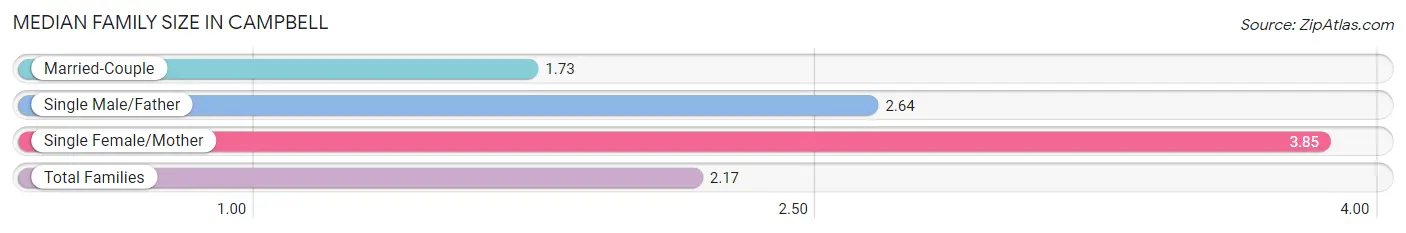
Median Family Size in Campbell
The median family size in Campbell is 2.17 persons per family, with single female/mother families (104 | 19.4%) accounting for the largest median family size of 3.85 persons per family. On the other hand, married-couple families (418 | 78.0%) represent the smallest median family size with 1.73 persons per family.
| Family Type | # Families | Family Size |
| Married-Couple | 418 (78.0%) | 1.73 |
| Single Male/Father | 14 (2.6%) | 2.64 |
| Single Female/Mother | 104 (19.4%) | 3.85 |
| Total Families | 536 (100.0%) | 2.17 |
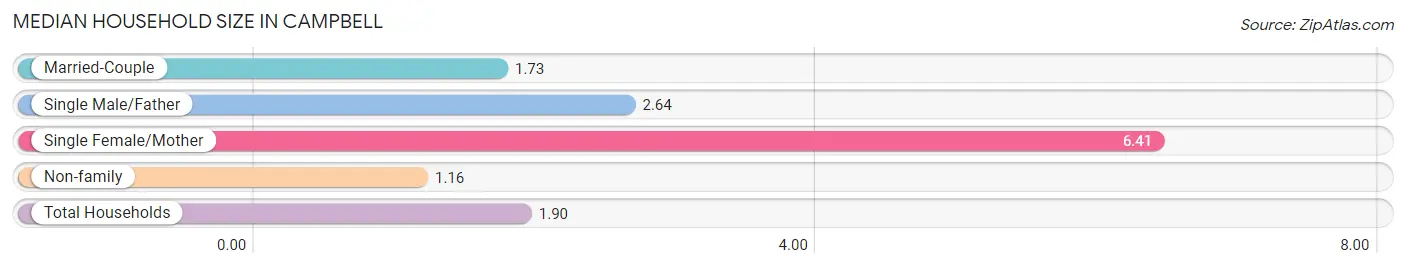
Median Household Size in Campbell
The median household size in Campbell is 1.90 persons per household, with single female/mother households (104 | 9.5%) accounting for the largest median household size of 6.41 persons per household. non-family households (563 | 51.2%) represent the smallest median household size with 1.16 persons per household.
| Household Type | # Households | Household Size |
| Married-Couple | 418 (38.0%) | 1.73 |
| Single Male/Father | 14 (1.3%) | 2.64 |
| Single Female/Mother | 104 (9.5%) | 6.41 |
| Non-family | 563 (51.2%) | 1.16 |
| Total Households | 1,099 (100.0%) | 1.90 |
Household Size by Marriage Status in Campbell
Out of a total of 1,099 households in Campbell, 536 (48.8%) are family households, while 563 (51.2%) are nonfamily households. The most numerous type of family households are 2-person households, comprising 457, and the most common type of nonfamily households are 1-person households, comprising 502.
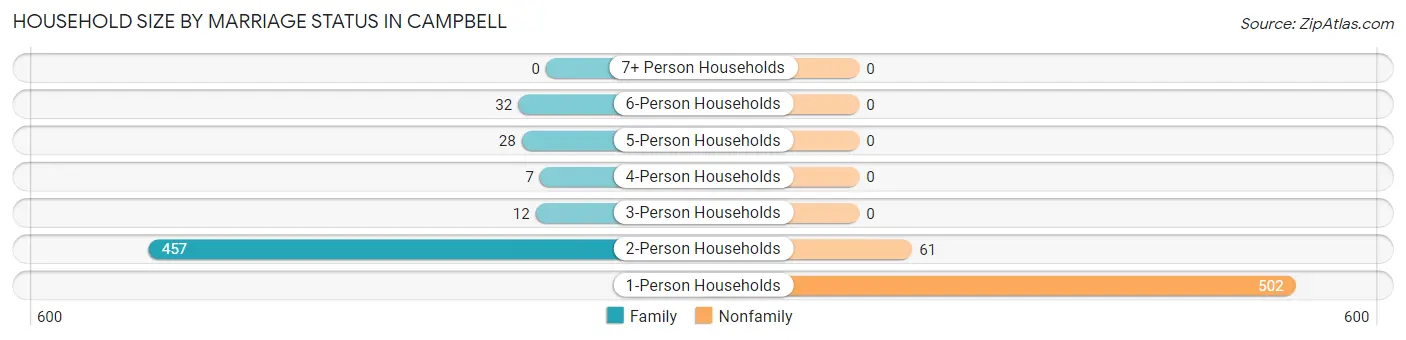
| Household Size | Family Households | Nonfamily Households |
| 1-Person Households | - | 502 (45.7%) |
| 2-Person Households | 457 (41.6%) | 61 (5.6%) |
| 3-Person Households | 12 (1.1%) | 0 (0.0%) |
| 4-Person Households | 7 (0.6%) | 0 (0.0%) |
| 5-Person Households | 28 (2.5%) | 0 (0.0%) |
| 6-Person Households | 32 (2.9%) | 0 (0.0%) |
| 7+ Person Households | 0 (0.0%) | 0 (0.0%) |
| Total | 536 (48.8%) | 563 (51.2%) |
Female Fertility in Campbell
Fertility by Age in Campbell
| Age Bracket | Women with Births | Births / 1,000 Women |
| 15 to 19 years | 0 (0.0%) | 0.0 |
| 20 to 34 years | 0 (0.0%) | 0.0 |
| 35 to 50 years | 0 (0.0%) | 0.0 |
| Total | 0 (0.0%) | 0.0 |
Fertility by Age by Marriage Status in Campbell
| Age Bracket | Married | Unmarried |
| 15 to 19 years | 0 (0.0%) | 0 (0.0%) |
| 20 to 34 years | 0 (0.0%) | 0 (0.0%) |
| 35 to 50 years | 0 (0.0%) | 0 (0.0%) |
| Total | 0 (0.0%) | 0 (0.0%) |
Fertility by Education in Campbell
| Educational Attainment | Women with Births | Births / 1,000 Women |
| Less than High School | 0 (0.0%) | 0.0 |
| High School Diploma | 0 (0.0%) | 0.0 |
| College or Associate's Degree | 0 (0.0%) | 0.0 |
| Bachelor's Degree | 0 (0.0%) | 0.0 |
| Graduate Degree | 0 (0.0%) | 0.0 |
| Total | 0 (0.0%) | 0.0 |
Fertility by Education by Marriage Status in Campbell
| Educational Attainment | Married | Unmarried |
| Less than High School | 0 (0.0%) | 0 (0.0%) |
| High School Diploma | 0 (0.0%) | 0 (0.0%) |
| College or Associate's Degree | 0 (0.0%) | 0 (0.0%) |
| Bachelor's Degree | 0 (0.0%) | 0 (0.0%) |
| Graduate Degree | 0 (0.0%) | 0 (0.0%) |
| Total | 0 (0.0%) | 0 (0.0%) |
Employment Characteristics in Campbell
Employment by Class of Employer in Campbell
Among the 747 employed individuals in Campbell, private company employees (586 | 78.4%), self-employed (not incorporated) (88 | 11.8%), and not-for-profit organizations (32 | 4.3%) make up the most common classes of employment.
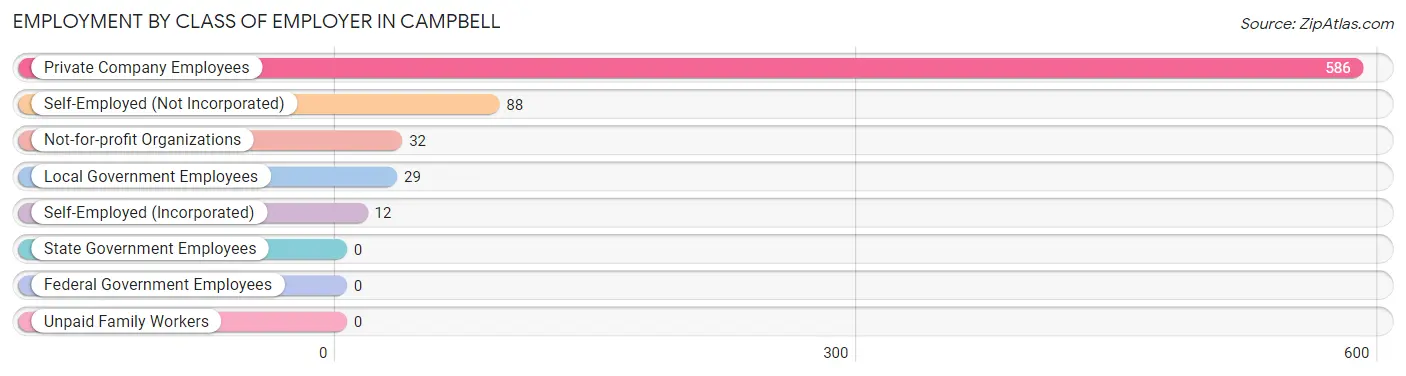
| Employer Class | # Employees | % Employees |
| Private Company Employees | 586 | 78.4% |
| Self-Employed (Incorporated) | 12 | 1.6% |
| Self-Employed (Not Incorporated) | 88 | 11.8% |
| Not-for-profit Organizations | 32 | 4.3% |
| Local Government Employees | 29 | 3.9% |
| State Government Employees | 0 | 0.0% |
| Federal Government Employees | 0 | 0.0% |
| Unpaid Family Workers | 0 | 0.0% |
| Total | 747 | 100.0% |
Employment Status by Age in Campbell
According to the labor force statistics for Campbell, out of the total population over 16 years of age (2,185), 38.7% or 846 individuals are in the labor force, with 11.6% or 98 of them unemployed. The age group with the highest labor force participation rate is 30 to 34 years, with 100.0% or 40 individuals in the labor force. Within the labor force, the 35 to 44 years age range has the highest percentage of unemployed individuals, with 27.3% or 30 of them being unemployed.
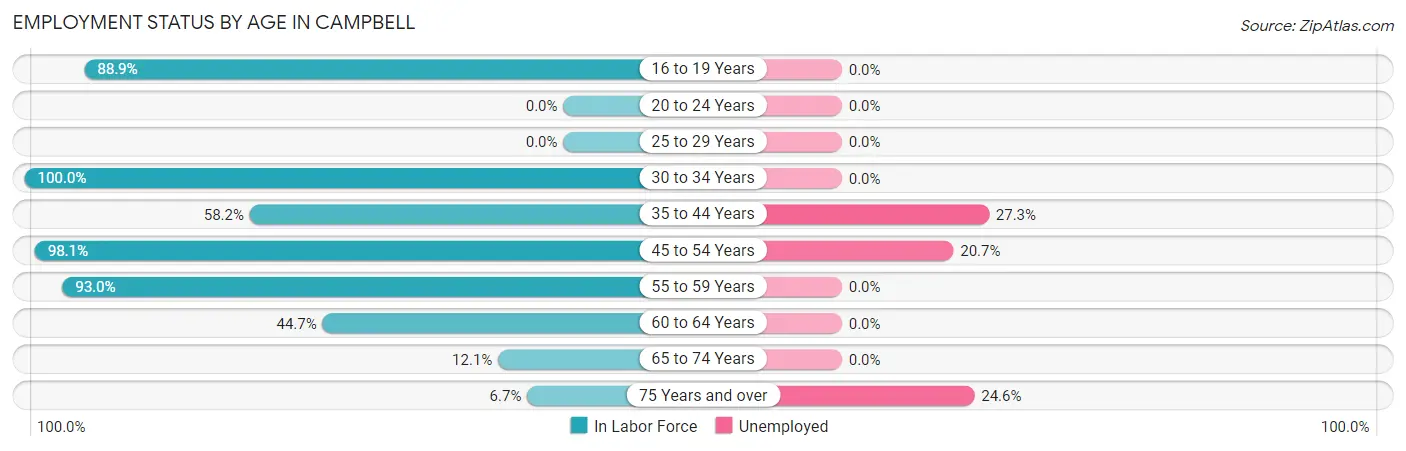
| Age Bracket | In Labor Force | Unemployed |
| 16 to 19 Years | 40 (88.9%) | 0 (0.0%) |
| 20 to 24 Years | 0 (0.0%) | 0 (0.0%) |
| 25 to 29 Years | 0 (0.0%) | 0 (0.0%) |
| 30 to 34 Years | 40 (100.0%) | 0 (0.0%) |
| 35 to 44 Years | 110 (58.2%) | 30 (27.3%) |
| 45 to 54 Years | 261 (98.1%) | 54 (20.7%) |
| 55 to 59 Years | 93 (93.0%) | 0 (0.0%) |
| 60 to 64 Years | 226 (44.7%) | 0 (0.0%) |
| 65 to 74 Years | 18 (12.1%) | 0 (0.0%) |
| 75 Years and over | 57 (6.7%) | 14 (24.6%) |
| Total | 846 (38.7%) | 98 (11.6%) |
Employment Status by Educational Attainment in Campbell
According to labor force statistics for Campbell, 66.3% of individuals (730) out of the total population between 25 and 64 years of age (1,101) are in the labor force, with 11.5% or 84 of them being unemployed. The group with the highest labor force participation rate are those with the educational attainment of high school diploma, with 89.6% or 215 individuals in the labor force. Within the labor force, individuals with less than high school education have the highest percentage of unemployment, with 100.0% or 54 of them being unemployed.
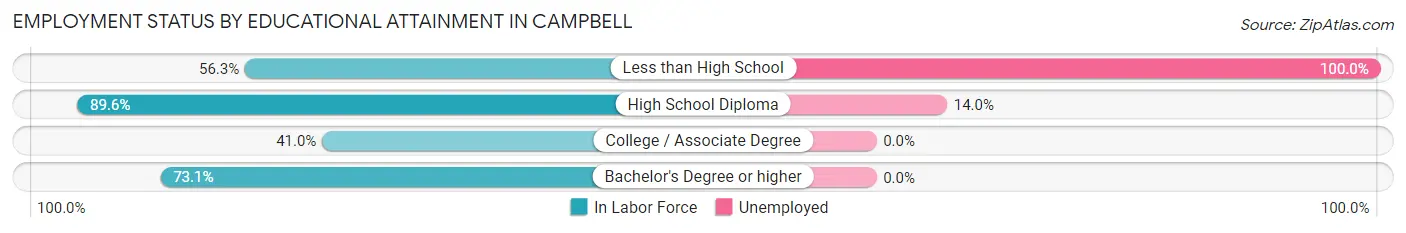
| Educational Attainment | In Labor Force | Unemployed |
| Less than High School | 54 (56.3%) | 96 (100.0%) |
| High School Diploma | 215 (89.6%) | 34 (14.0%) |
| College / Associate Degree | 126 (41.0%) | 0 (0.0%) |
| Bachelor's Degree or higher | 335 (73.1%) | 0 (0.0%) |
| Total | 730 (66.3%) | 127 (11.5%) |
Employment Occupations by Sex in Campbell
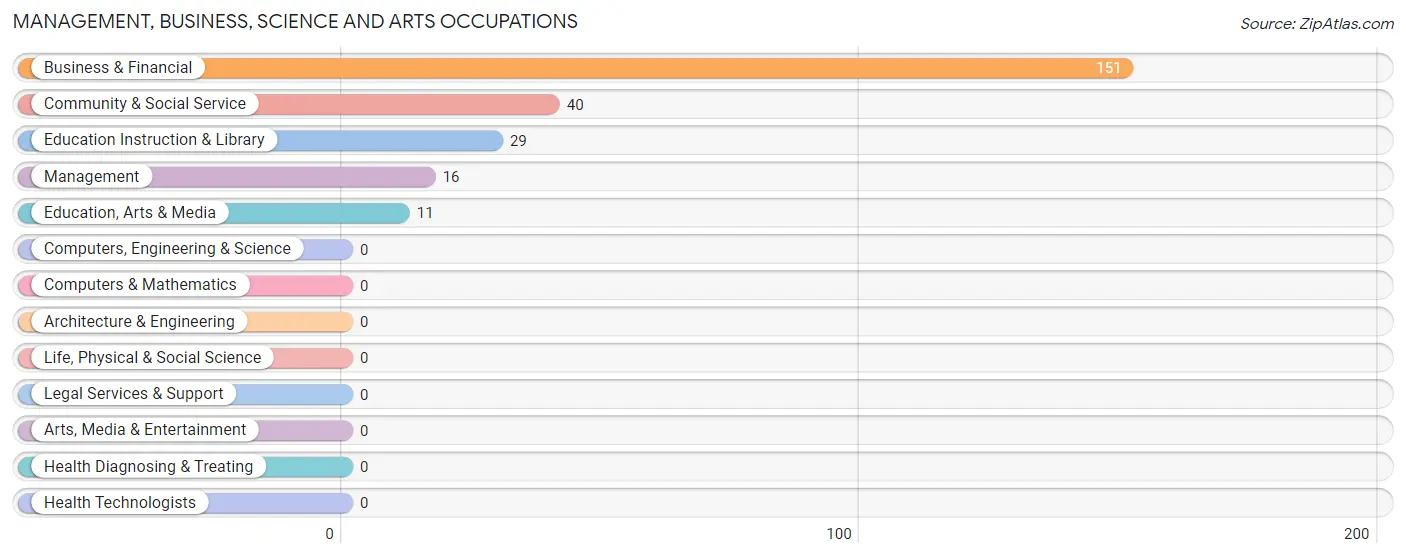
Management, Business, Science and Arts Occupations
The most common Management, Business, Science and Arts occupations in Campbell are Business & Financial (151 | 20.2%), Community & Social Service (40 | 5.3%), Education Instruction & Library (29 | 3.9%), Management (16 | 2.1%), and Education, Arts & Media (11 | 1.5%).
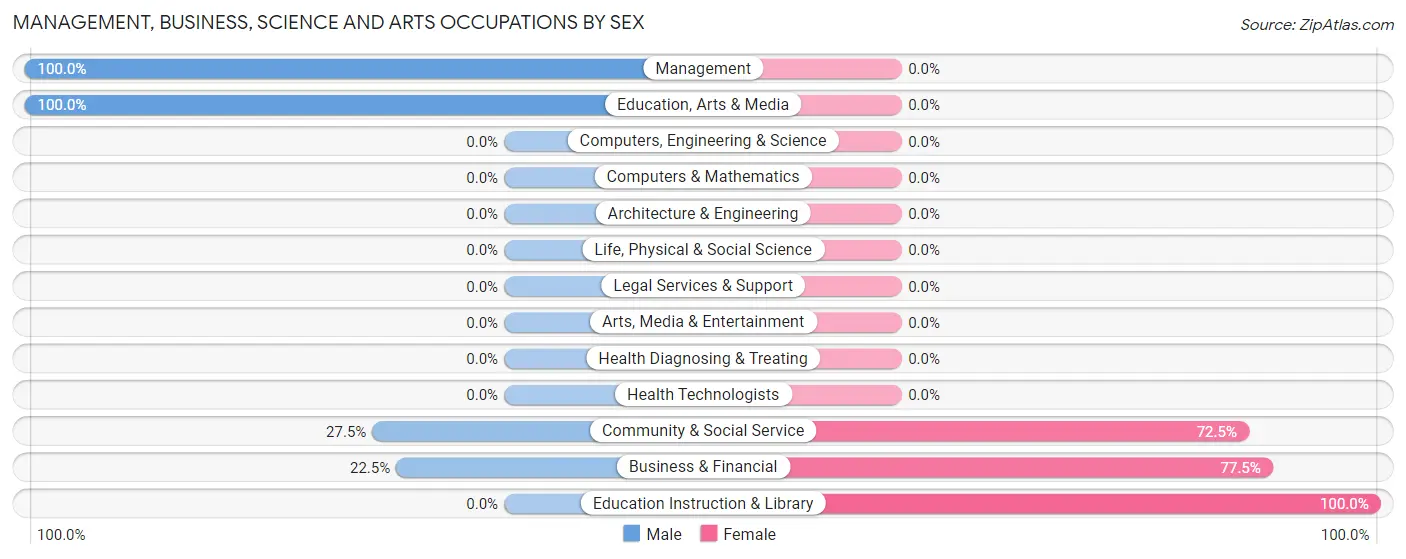
Management, Business, Science and Arts Occupations by Sex
Within the Management, Business, Science and Arts occupations in Campbell, the most male-oriented occupations are Management (100.0%), Education, Arts & Media (100.0%), and Community & Social Service (27.5%), while the most female-oriented occupations are Education Instruction & Library (100.0%), Business & Financial (77.5%), and Community & Social Service (72.5%).
| Occupation | Male | Female |
| Management | 16 (100.0%) | 0 (0.0%) |
| Business & Financial | 34 (22.5%) | 117 (77.5%) |
| Computers, Engineering & Science | 0 (0.0%) | 0 (0.0%) |
| Computers & Mathematics | 0 (0.0%) | 0 (0.0%) |
| Architecture & Engineering | 0 (0.0%) | 0 (0.0%) |
| Life, Physical & Social Science | 0 (0.0%) | 0 (0.0%) |
| Community & Social Service | 11 (27.5%) | 29 (72.5%) |
| Education, Arts & Media | 11 (100.0%) | 0 (0.0%) |
| Legal Services & Support | 0 (0.0%) | 0 (0.0%) |
| Education Instruction & Library | 0 (0.0%) | 29 (100.0%) |
| Arts, Media & Entertainment | 0 (0.0%) | 0 (0.0%) |
| Health Diagnosing & Treating | 0 (0.0%) | 0 (0.0%) |
| Health Technologists | 0 (0.0%) | 0 (0.0%) |
| Total (Category) | 61 (29.5%) | 146 (70.5%) |
| Total (Overall) | 405 (54.2%) | 342 (45.8%) |
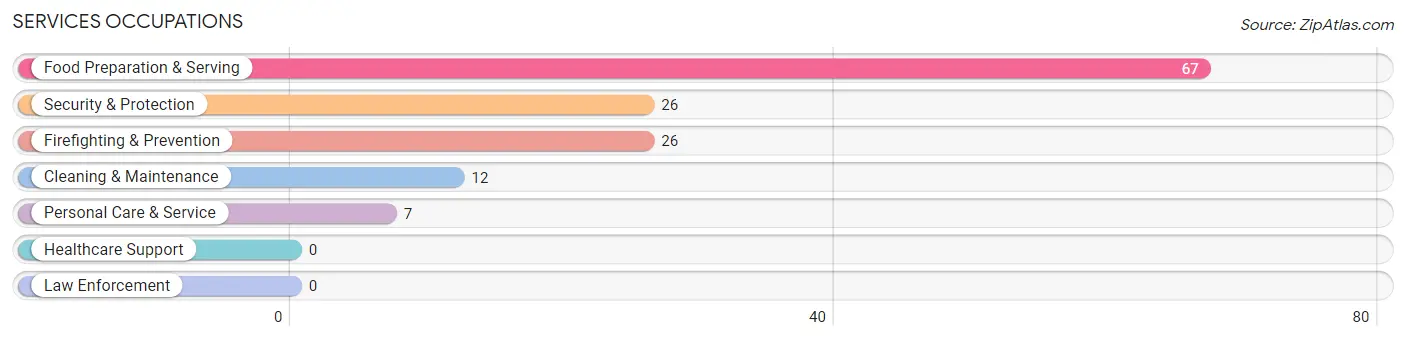
Services Occupations
The most common Services occupations in Campbell are Food Preparation & Serving (67 | 9.0%), Security & Protection (26 | 3.5%), Firefighting & Prevention (26 | 3.5%), Cleaning & Maintenance (12 | 1.6%), and Personal Care & Service (7 | 0.9%).
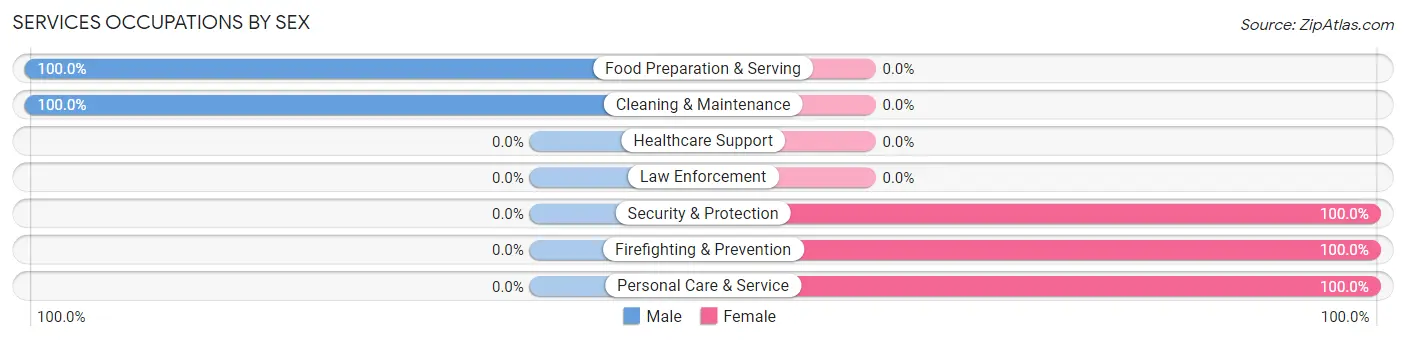
Services Occupations by Sex
Within the Services occupations in Campbell, the most male-oriented occupations are Food Preparation & Serving (100.0%), and Cleaning & Maintenance (100.0%), while the most female-oriented occupations are Security & Protection (100.0%), Firefighting & Prevention (100.0%), and Personal Care & Service (100.0%).
| Occupation | Male | Female |
| Healthcare Support | 0 (0.0%) | 0 (0.0%) |
| Security & Protection | 0 (0.0%) | 26 (100.0%) |
| Firefighting & Prevention | 0 (0.0%) | 26 (100.0%) |
| Law Enforcement | 0 (0.0%) | 0 (0.0%) |
| Food Preparation & Serving | 67 (100.0%) | 0 (0.0%) |
| Cleaning & Maintenance | 12 (100.0%) | 0 (0.0%) |
| Personal Care & Service | 0 (0.0%) | 7 (100.0%) |
| Total (Category) | 79 (70.5%) | 33 (29.5%) |
| Total (Overall) | 405 (54.2%) | 342 (45.8%) |
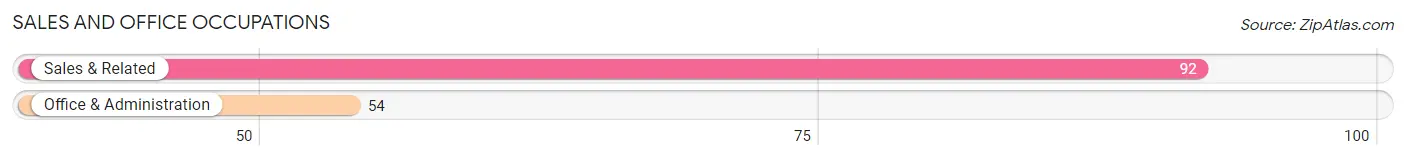
Sales and Office Occupations
The most common Sales and Office occupations in Campbell are Sales & Related (92 | 12.3%), and Office & Administration (54 | 7.2%).
Sales and Office Occupations by Sex
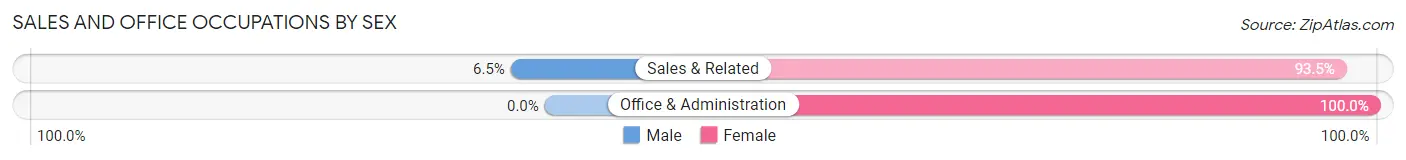
| Occupation | Male | Female |
| Sales & Related | 6 (6.5%) | 86 (93.5%) |
| Office & Administration | 0 (0.0%) | 54 (100.0%) |
| Total (Category) | 6 (4.1%) | 140 (95.9%) |
| Total (Overall) | 405 (54.2%) | 342 (45.8%) |
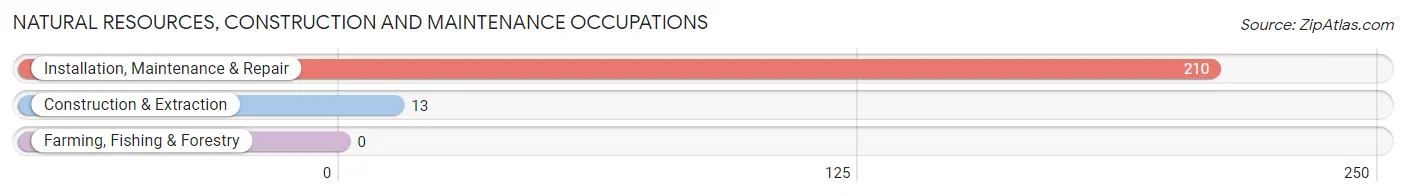
Natural Resources, Construction and Maintenance Occupations
The most common Natural Resources, Construction and Maintenance occupations in Campbell are Installation, Maintenance & Repair (210 | 28.1%), and Construction & Extraction (13 | 1.7%).
Natural Resources, Construction and Maintenance Occupations by Sex
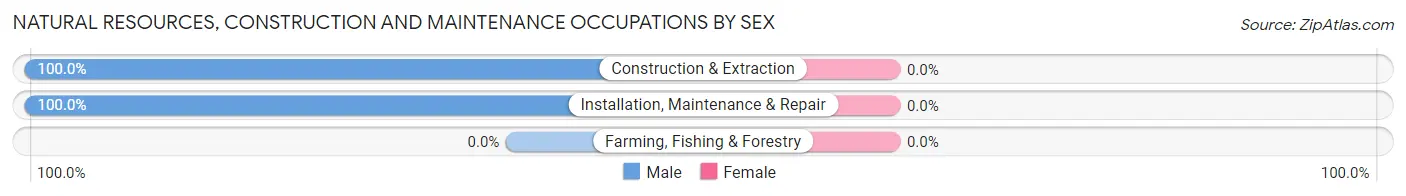
| Occupation | Male | Female |
| Farming, Fishing & Forestry | 0 (0.0%) | 0 (0.0%) |
| Construction & Extraction | 13 (100.0%) | 0 (0.0%) |
| Installation, Maintenance & Repair | 210 (100.0%) | 0 (0.0%) |
| Total (Category) | 223 (100.0%) | 0 (0.0%) |
| Total (Overall) | 405 (54.2%) | 342 (45.8%) |
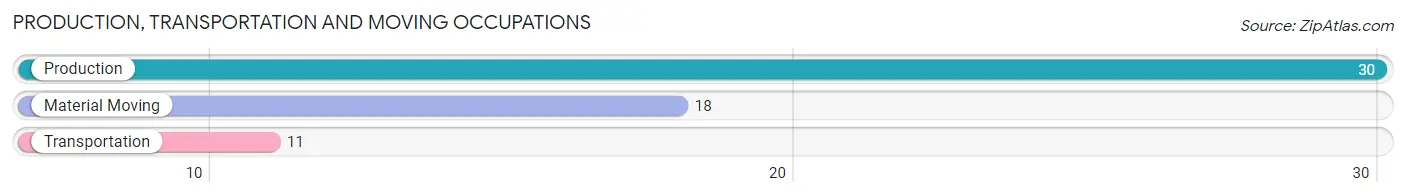
Production, Transportation and Moving Occupations
The most common Production, Transportation and Moving occupations in Campbell are Production (30 | 4.0%), Material Moving (18 | 2.4%), and Transportation (11 | 1.5%).
Production, Transportation and Moving Occupations by Sex
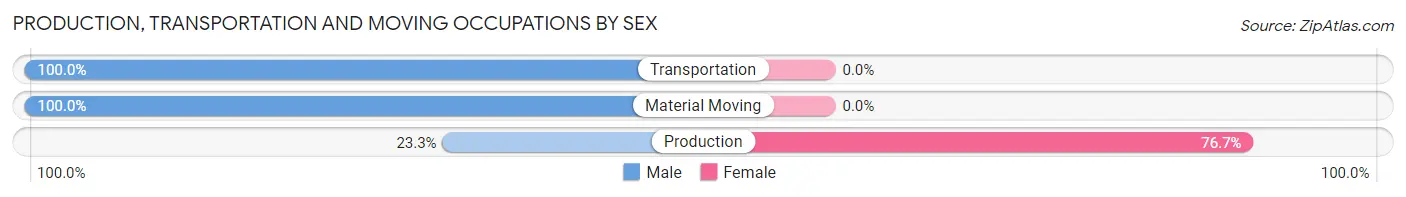
| Occupation | Male | Female |
| Production | 7 (23.3%) | 23 (76.7%) |
| Transportation | 11 (100.0%) | 0 (0.0%) |
| Material Moving | 18 (100.0%) | 0 (0.0%) |
| Total (Category) | 36 (61.0%) | 23 (39.0%) |
| Total (Overall) | 405 (54.2%) | 342 (45.8%) |
Employment Industries by Sex in Campbell
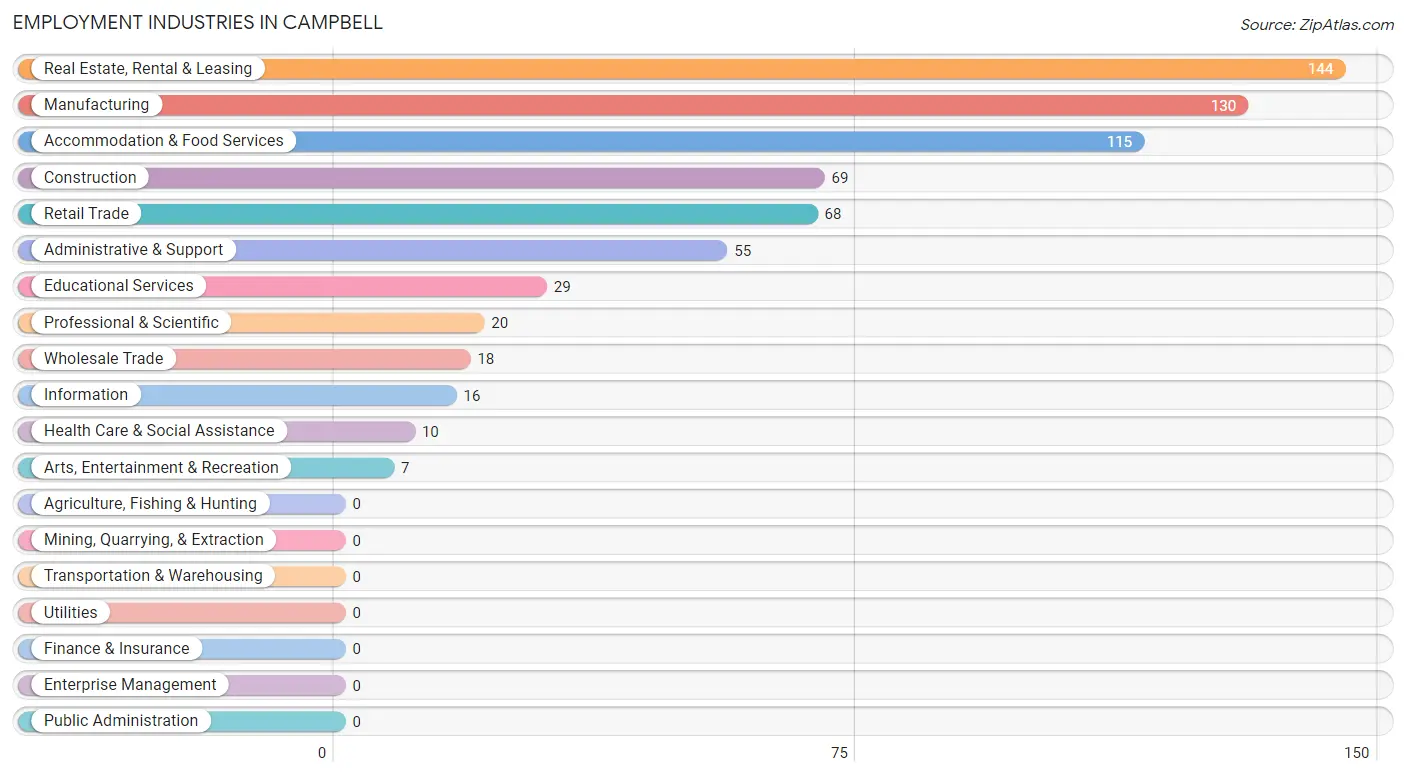
Employment Industries in Campbell
The major employment industries in Campbell include Real Estate, Rental & Leasing (144 | 19.3%), Manufacturing (130 | 17.4%), Accommodation & Food Services (115 | 15.4%), Construction (69 | 9.2%), and Retail Trade (68 | 9.1%).
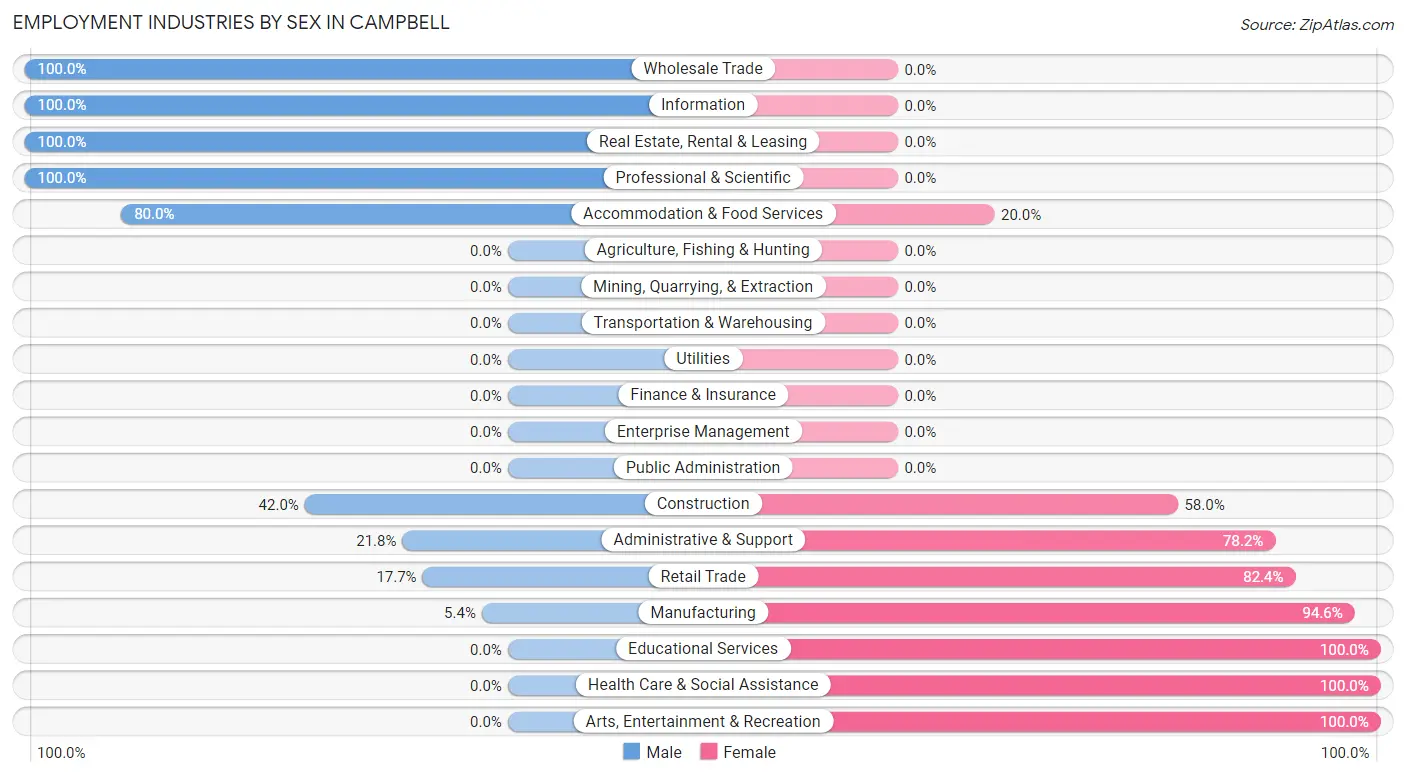
Employment Industries by Sex in Campbell
The Campbell industries that see more men than women are Wholesale Trade (100.0%), Information (100.0%), and Real Estate, Rental & Leasing (100.0%), whereas the industries that tend to have a higher number of women are Educational Services (100.0%), Health Care & Social Assistance (100.0%), and Arts, Entertainment & Recreation (100.0%).
| Industry | Male | Female |
| Agriculture, Fishing & Hunting | 0 (0.0%) | 0 (0.0%) |
| Mining, Quarrying, & Extraction | 0 (0.0%) | 0 (0.0%) |
| Construction | 29 (42.0%) | 40 (58.0%) |
| Manufacturing | 7 (5.4%) | 123 (94.6%) |
| Wholesale Trade | 18 (100.0%) | 0 (0.0%) |
| Retail Trade | 12 (17.6%) | 56 (82.4%) |
| Transportation & Warehousing | 0 (0.0%) | 0 (0.0%) |
| Utilities | 0 (0.0%) | 0 (0.0%) |
| Information | 16 (100.0%) | 0 (0.0%) |
| Finance & Insurance | 0 (0.0%) | 0 (0.0%) |
| Real Estate, Rental & Leasing | 144 (100.0%) | 0 (0.0%) |
| Professional & Scientific | 20 (100.0%) | 0 (0.0%) |
| Enterprise Management | 0 (0.0%) | 0 (0.0%) |
| Administrative & Support | 12 (21.8%) | 43 (78.2%) |
| Educational Services | 0 (0.0%) | 29 (100.0%) |
| Health Care & Social Assistance | 0 (0.0%) | 10 (100.0%) |
| Arts, Entertainment & Recreation | 0 (0.0%) | 7 (100.0%) |
| Accommodation & Food Services | 92 (80.0%) | 23 (20.0%) |
| Public Administration | 0 (0.0%) | 0 (0.0%) |
| Total | 405 (54.2%) | 342 (45.8%) |
Education in Campbell
School Enrollment in Campbell
The most common levels of schooling among the 261 students in Campbell are college / undergraduate (169 | 64.7%), high school (45 | 17.2%), and middle school (42 | 16.1%).
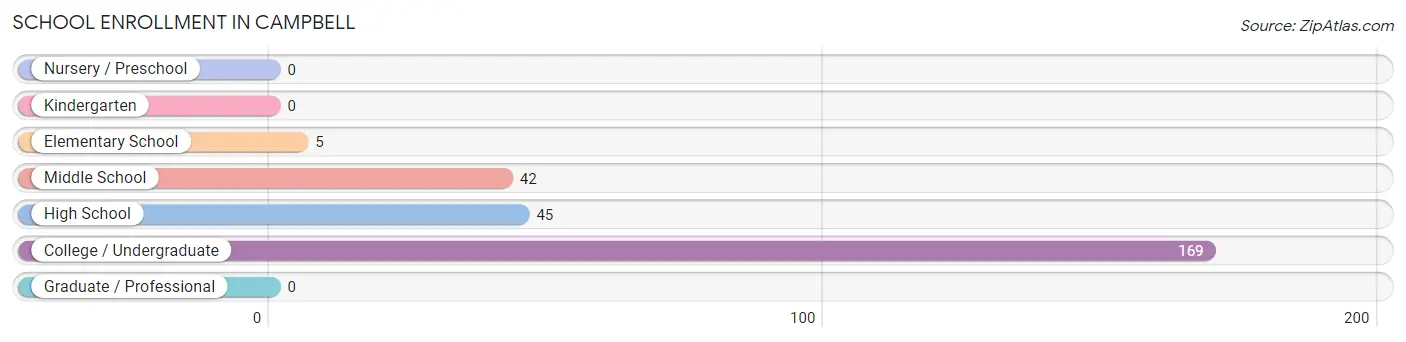
| School Level | # Students | % Students |
| Nursery / Preschool | 0 | 0.0% |
| Kindergarten | 0 | 0.0% |
| Elementary School | 5 | 1.9% |
| Middle School | 42 | 16.1% |
| High School | 45 | 17.2% |
| College / Undergraduate | 169 | 64.7% |
| Graduate / Professional | 0 | 0.0% |
| Total | 261 | 100.0% |
School Enrollment by Age by Funding Source in Campbell
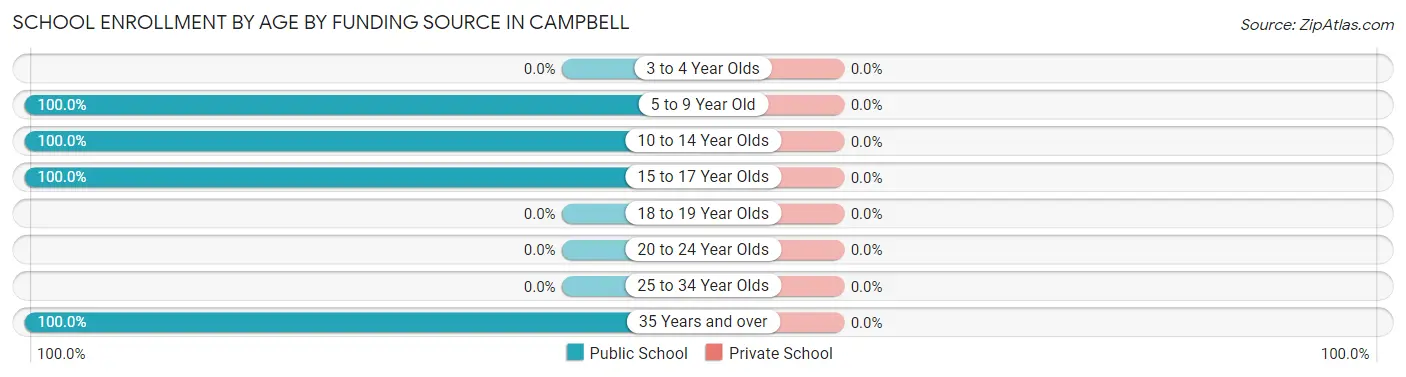
| Age Bracket | Public School | Private School |
| 3 to 4 Year Olds | 0 (0.0%) | 0 (0.0%) |
| 5 to 9 Year Old | 5 (100.0%) | 0 (0.0%) |
| 10 to 14 Year Olds | 42 (100.0%) | 0 (0.0%) |
| 15 to 17 Year Olds | 45 (100.0%) | 0 (0.0%) |
| 18 to 19 Year Olds | 0 (0.0%) | 0 (0.0%) |
| 20 to 24 Year Olds | 0 (0.0%) | 0 (0.0%) |
| 25 to 34 Year Olds | 0 (0.0%) | 0 (0.0%) |
| 35 Years and over | 169 (100.0%) | 0 (0.0%) |
| Total | 261 (100.0%) | 0 (0.0%) |
Educational Attainment by Field of Study in Campbell
Business (219 | 29.5%), education (130 | 17.5%), communications (107 | 14.4%), psychology (90 | 12.1%), and liberal arts & history (51 | 6.9%) are the most common fields of study among 741 individuals in Campbell who have obtained a bachelor's degree or higher.
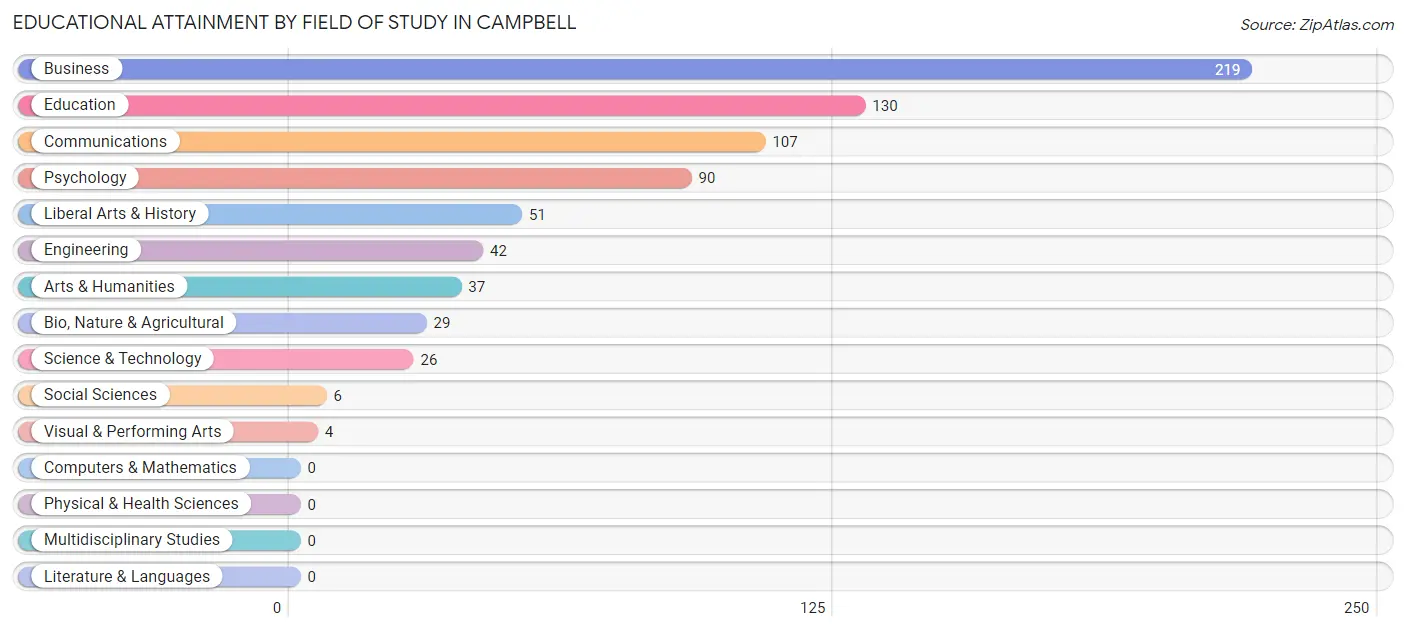
| Field of Study | # Graduates | % Graduates |
| Computers & Mathematics | 0 | 0.0% |
| Bio, Nature & Agricultural | 29 | 3.9% |
| Physical & Health Sciences | 0 | 0.0% |
| Psychology | 90 | 12.1% |
| Social Sciences | 6 | 0.8% |
| Engineering | 42 | 5.7% |
| Multidisciplinary Studies | 0 | 0.0% |
| Science & Technology | 26 | 3.5% |
| Business | 219 | 29.5% |
| Education | 130 | 17.5% |
| Literature & Languages | 0 | 0.0% |
| Liberal Arts & History | 51 | 6.9% |
| Visual & Performing Arts | 4 | 0.5% |
| Communications | 107 | 14.4% |
| Arts & Humanities | 37 | 5.0% |
| Total | 741 | 100.0% |
Transportation & Commute in Campbell
Vehicle Availability by Sex in Campbell
The most prevalent vehicle ownership categories in Campbell are males with 2 vehicles (259, accounting for 63.9%) and females with 2 vehicles (52, making up 75.7%).
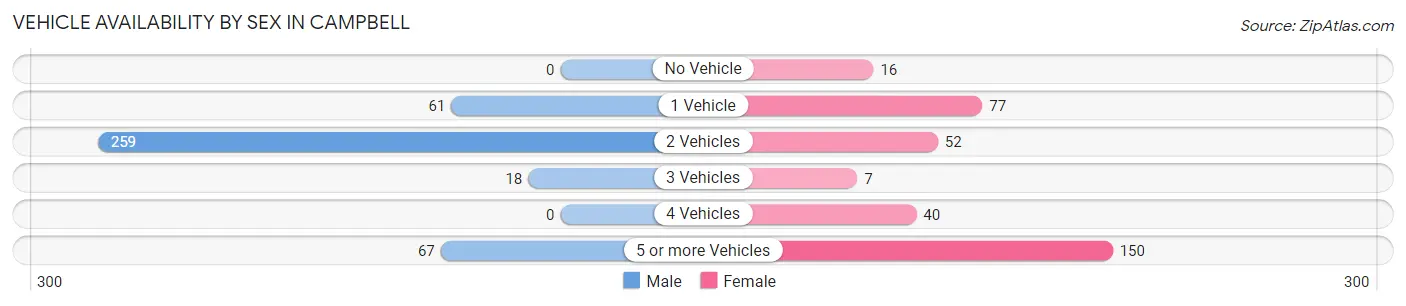
| Vehicles Available | Male | Female |
| No Vehicle | 0 (0.0%) | 16 (4.7%) |
| 1 Vehicle | 61 (15.1%) | 77 (22.5%) |
| 2 Vehicles | 259 (63.9%) | 52 (15.2%) |
| 3 Vehicles | 18 (4.4%) | 7 (2.1%) |
| 4 Vehicles | 0 (0.0%) | 40 (11.7%) |
| 5 or more Vehicles | 67 (16.5%) | 150 (43.9%) |
| Total | 405 (100.0%) | 342 (100.0%) |
Commute Time in Campbell
The most frequently occuring commute durations in Campbell are 30 to 34 minutes (178 commuters, 25.1%), 45 to 59 minutes (147 commuters, 20.8%), and 35 to 39 minutes (107 commuters, 15.1%).
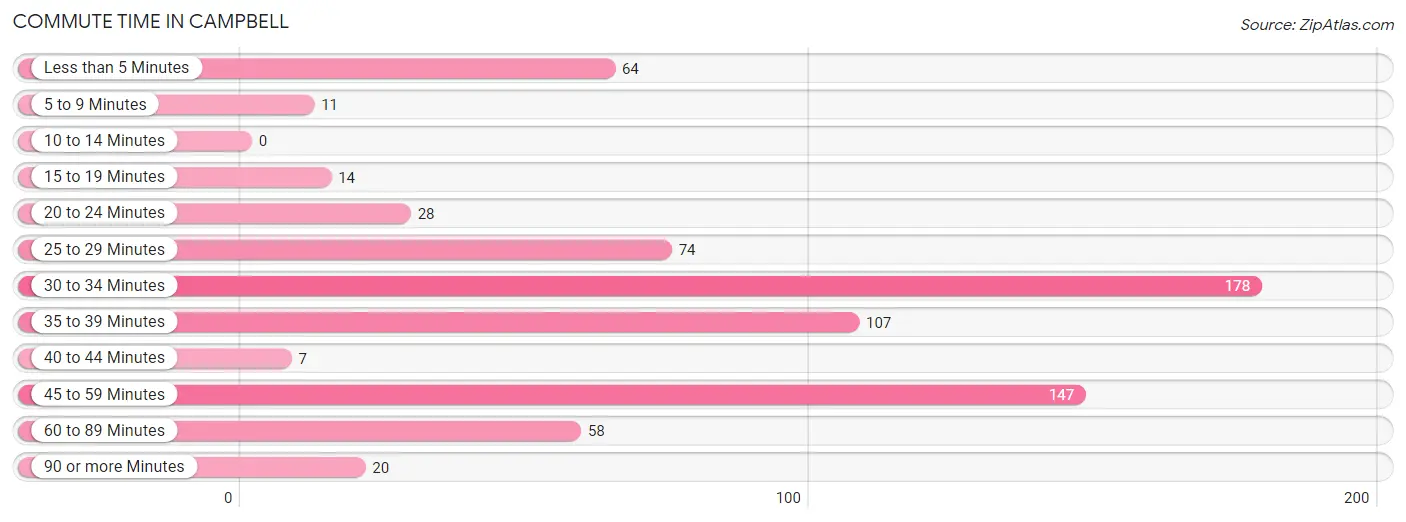
| Commute Time | # Commuters | % Commuters |
| Less than 5 Minutes | 64 | 9.0% |
| 5 to 9 Minutes | 11 | 1.5% |
| 10 to 14 Minutes | 0 | 0.0% |
| 15 to 19 Minutes | 14 | 2.0% |
| 20 to 24 Minutes | 28 | 4.0% |
| 25 to 29 Minutes | 74 | 10.4% |
| 30 to 34 Minutes | 178 | 25.1% |
| 35 to 39 Minutes | 107 | 15.1% |
| 40 to 44 Minutes | 7 | 1.0% |
| 45 to 59 Minutes | 147 | 20.8% |
| 60 to 89 Minutes | 58 | 8.2% |
| 90 or more Minutes | 20 | 2.8% |
Commute Time by Sex in Campbell
The most common commute times in Campbell are 30 to 34 minutes (155 commuters, 42.3%) for males and 35 to 39 minutes (107 commuters, 31.3%) for females.
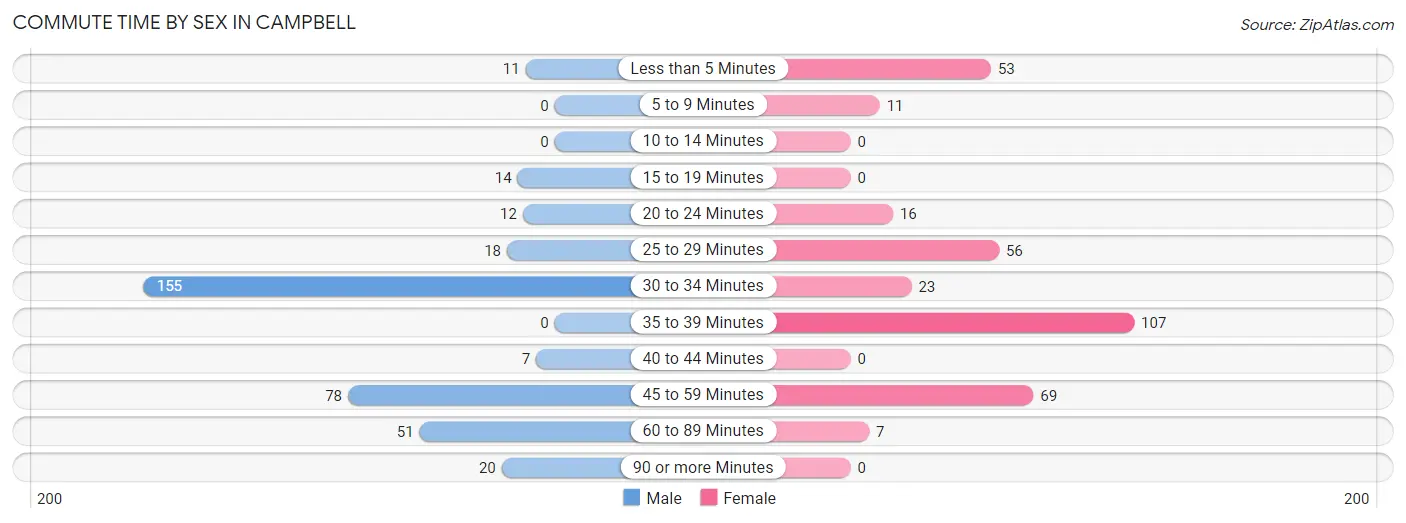
| Commute Time | Male | Female |
| Less than 5 Minutes | 11 (3.0%) | 53 (15.5%) |
| 5 to 9 Minutes | 0 (0.0%) | 11 (3.2%) |
| 10 to 14 Minutes | 0 (0.0%) | 0 (0.0%) |
| 15 to 19 Minutes | 14 (3.8%) | 0 (0.0%) |
| 20 to 24 Minutes | 12 (3.3%) | 16 (4.7%) |
| 25 to 29 Minutes | 18 (4.9%) | 56 (16.4%) |
| 30 to 34 Minutes | 155 (42.3%) | 23 (6.7%) |
| 35 to 39 Minutes | 0 (0.0%) | 107 (31.3%) |
| 40 to 44 Minutes | 7 (1.9%) | 0 (0.0%) |
| 45 to 59 Minutes | 78 (21.3%) | 69 (20.2%) |
| 60 to 89 Minutes | 51 (13.9%) | 7 (2.1%) |
| 90 or more Minutes | 20 (5.5%) | 0 (0.0%) |
Time of Departure to Work by Sex in Campbell
The most frequent times of departure to work in Campbell are 7:00 AM to 7:29 AM (163, 44.5%) for males and 7:00 AM to 7:29 AM (200, 58.5%) for females.
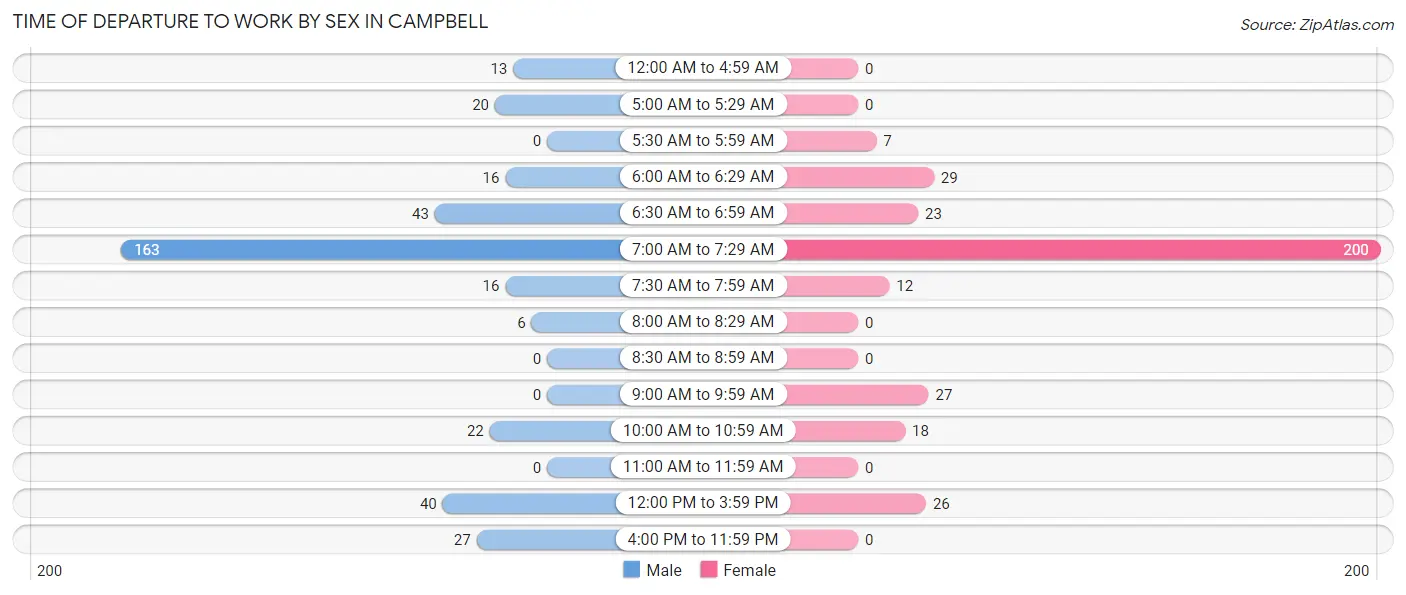
| Time of Departure | Male | Female |
| 12:00 AM to 4:59 AM | 13 (3.5%) | 0 (0.0%) |
| 5:00 AM to 5:29 AM | 20 (5.5%) | 0 (0.0%) |
| 5:30 AM to 5:59 AM | 0 (0.0%) | 7 (2.1%) |
| 6:00 AM to 6:29 AM | 16 (4.4%) | 29 (8.5%) |
| 6:30 AM to 6:59 AM | 43 (11.7%) | 23 (6.7%) |
| 7:00 AM to 7:29 AM | 163 (44.5%) | 200 (58.5%) |
| 7:30 AM to 7:59 AM | 16 (4.4%) | 12 (3.5%) |
| 8:00 AM to 8:29 AM | 6 (1.6%) | 0 (0.0%) |
| 8:30 AM to 8:59 AM | 0 (0.0%) | 0 (0.0%) |
| 9:00 AM to 9:59 AM | 0 (0.0%) | 27 (7.9%) |
| 10:00 AM to 10:59 AM | 22 (6.0%) | 18 (5.3%) |
| 11:00 AM to 11:59 AM | 0 (0.0%) | 0 (0.0%) |
| 12:00 PM to 3:59 PM | 40 (10.9%) | 26 (7.6%) |
| 4:00 PM to 11:59 PM | 27 (7.4%) | 0 (0.0%) |
| Total | 366 (100.0%) | 342 (100.0%) |
Housing Occupancy in Campbell
Occupancy by Ownership in Campbell
Of the total 1,099 dwellings in Campbell, owner-occupied units account for 330 (30.0%), while renter-occupied units make up 769 (70.0%).
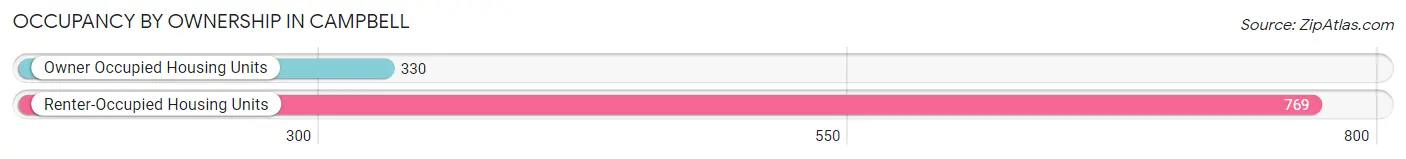
| Occupancy | # Housing Units | % Housing Units |
| Owner Occupied Housing Units | 330 | 30.0% |
| Renter-Occupied Housing Units | 769 | 70.0% |
| Total Occupied Housing Units | 1,099 | 100.0% |
Occupancy by Household Size in Campbell
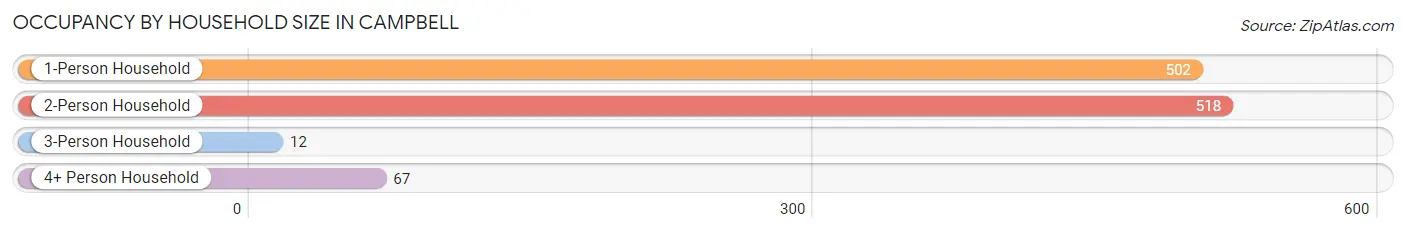
| Household Size | # Housing Units | % Housing Units |
| 1-Person Household | 502 | 45.7% |
| 2-Person Household | 518 | 47.1% |
| 3-Person Household | 12 | 1.1% |
| 4+ Person Household | 67 | 6.1% |
| Total Housing Units | 1,099 | 100.0% |
Occupancy by Ownership by Household Size in Campbell
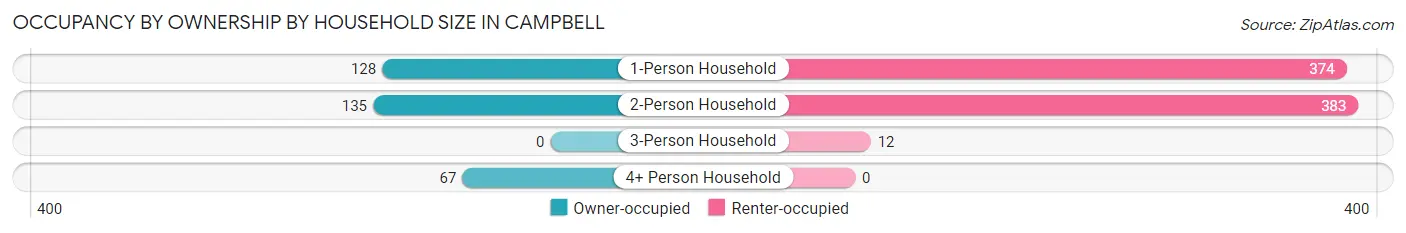
| Household Size | Owner-occupied | Renter-occupied |
| 1-Person Household | 128 (25.5%) | 374 (74.5%) |
| 2-Person Household | 135 (26.1%) | 383 (73.9%) |
| 3-Person Household | 0 (0.0%) | 12 (100.0%) |
| 4+ Person Household | 67 (100.0%) | 0 (0.0%) |
| Total Housing Units | 330 (30.0%) | 769 (70.0%) |
Occupancy by Educational Attainment in Campbell
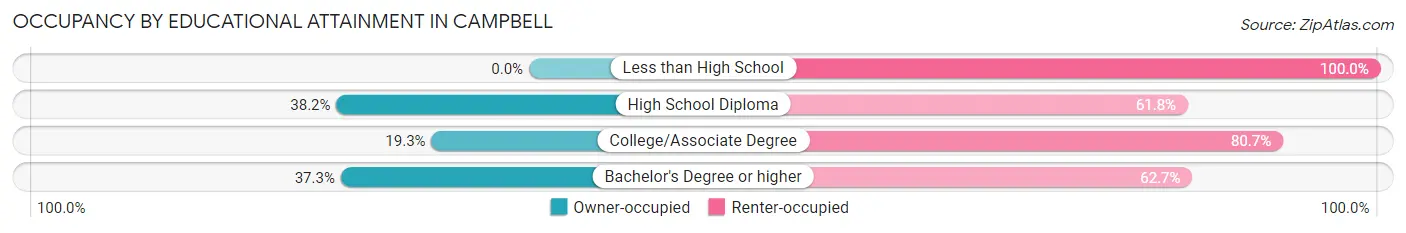
| Household Size | Owner-occupied | Renter-occupied |
| Less than High School | 0 (0.0%) | 30 (100.0%) |
| High School Diploma | 76 (38.2%) | 123 (61.8%) |
| College/Associate Degree | 76 (19.3%) | 317 (80.7%) |
| Bachelor's Degree or higher | 178 (37.3%) | 299 (62.7%) |
Occupancy by Age of Householder in Campbell
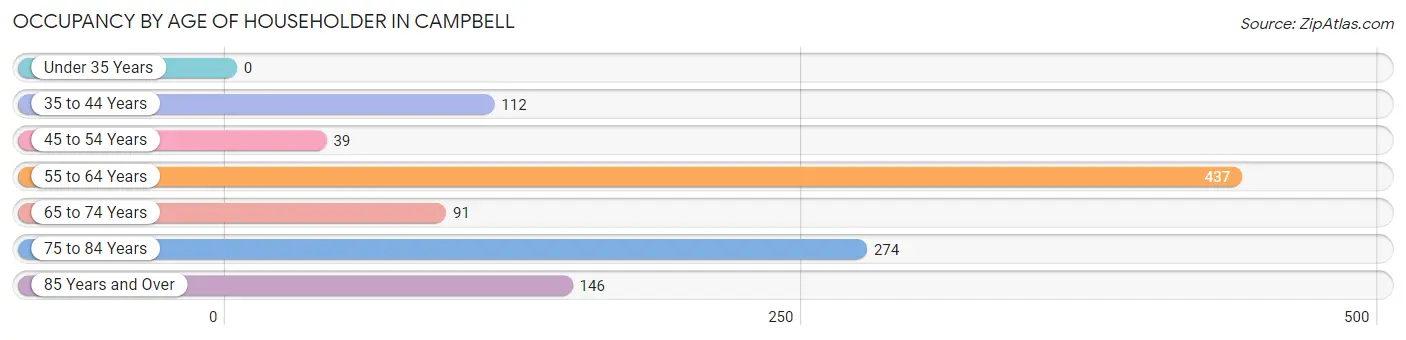
| Age Bracket | # Households | % Households |
| Under 35 Years | 0 | 0.0% |
| 35 to 44 Years | 112 | 10.2% |
| 45 to 54 Years | 39 | 3.5% |
| 55 to 64 Years | 437 | 39.8% |
| 65 to 74 Years | 91 | 8.3% |
| 75 to 84 Years | 274 | 24.9% |
| 85 Years and Over | 146 | 13.3% |
| Total | 1,099 | 100.0% |
Housing Finances in Campbell
Median Income by Occupancy in Campbell
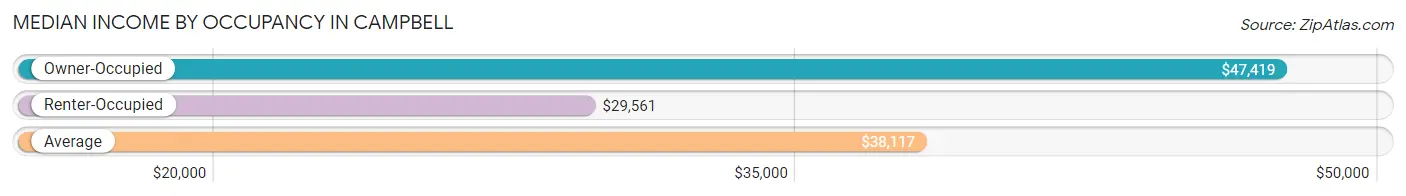
| Occupancy Type | # Households | Median Income |
| Owner-Occupied | 330 (30.0%) | $47,419 |
| Renter-Occupied | 769 (70.0%) | $29,561 |
| Average | 1,099 (100.0%) | $38,117 |
Occupancy by Householder Income Bracket in Campbell
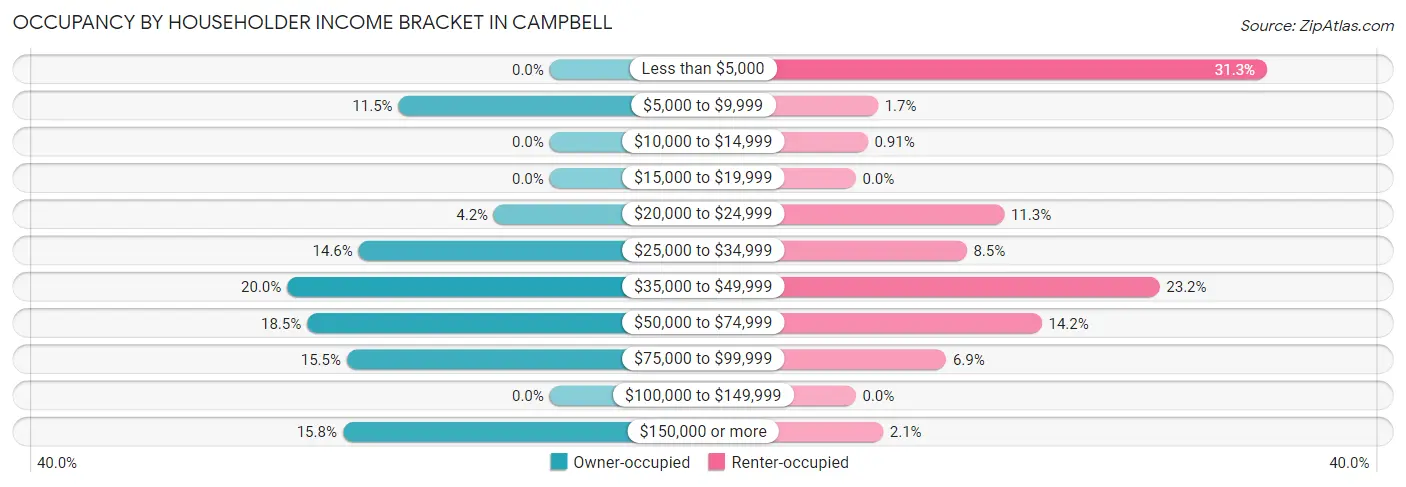
| Income Bracket | Owner-occupied | Renter-occupied |
| Less than $5,000 | 0 (0.0%) | 241 (31.3%) |
| $5,000 to $9,999 | 38 (11.5%) | 13 (1.7%) |
| $10,000 to $14,999 | 0 (0.0%) | 7 (0.9%) |
| $15,000 to $19,999 | 0 (0.0%) | 0 (0.0%) |
| $20,000 to $24,999 | 14 (4.2%) | 87 (11.3%) |
| $25,000 to $34,999 | 48 (14.5%) | 65 (8.5%) |
| $35,000 to $49,999 | 66 (20.0%) | 178 (23.2%) |
| $50,000 to $74,999 | 61 (18.5%) | 109 (14.2%) |
| $75,000 to $99,999 | 51 (15.4%) | 53 (6.9%) |
| $100,000 to $149,999 | 0 (0.0%) | 0 (0.0%) |
| $150,000 or more | 52 (15.8%) | 16 (2.1%) |
| Total | 330 (100.0%) | 769 (100.0%) |
Monthly Housing Cost Tiers in Campbell
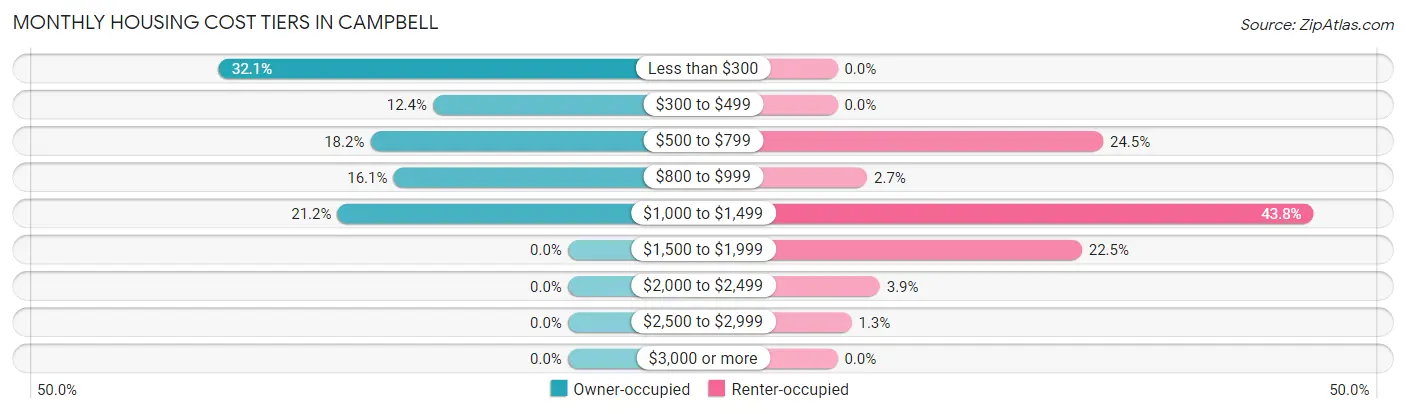
| Monthly Cost | Owner-occupied | Renter-occupied |
| Less than $300 | 106 (32.1%) | 0 (0.0%) |
| $300 to $499 | 41 (12.4%) | 0 (0.0%) |
| $500 to $799 | 60 (18.2%) | 188 (24.4%) |
| $800 to $999 | 53 (16.1%) | 21 (2.7%) |
| $1,000 to $1,499 | 70 (21.2%) | 337 (43.8%) |
| $1,500 to $1,999 | 0 (0.0%) | 173 (22.5%) |
| $2,000 to $2,499 | 0 (0.0%) | 30 (3.9%) |
| $2,500 to $2,999 | 0 (0.0%) | 10 (1.3%) |
| $3,000 or more | 0 (0.0%) | 0 (0.0%) |
| Total | 330 (100.0%) | 769 (100.0%) |
Physical Housing Characteristics in Campbell
Housing Structures in Campbell
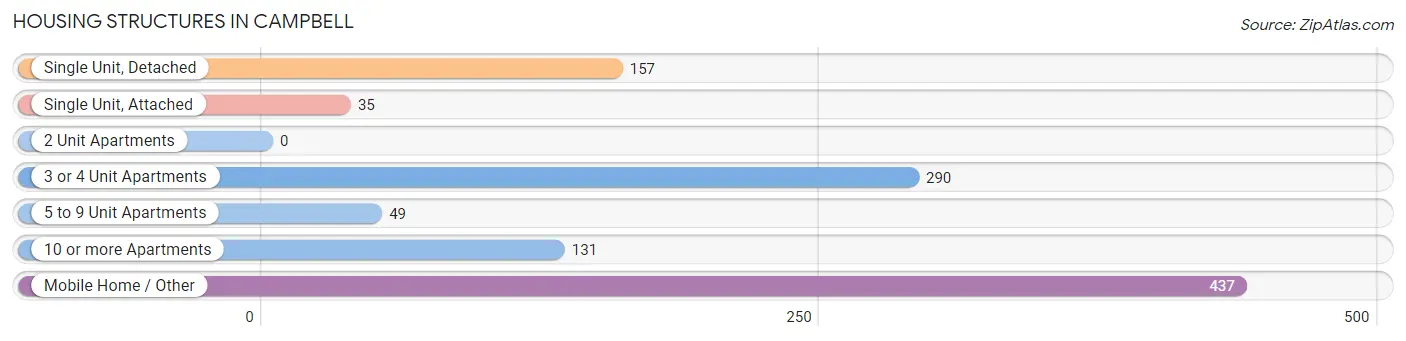
| Structure Type | # Housing Units | % Housing Units |
| Single Unit, Detached | 157 | 14.3% |
| Single Unit, Attached | 35 | 3.2% |
| 2 Unit Apartments | 0 | 0.0% |
| 3 or 4 Unit Apartments | 290 | 26.4% |
| 5 to 9 Unit Apartments | 49 | 4.5% |
| 10 or more Apartments | 131 | 11.9% |
| Mobile Home / Other | 437 | 39.8% |
| Total | 1,099 | 100.0% |
Housing Structures by Occupancy in Campbell
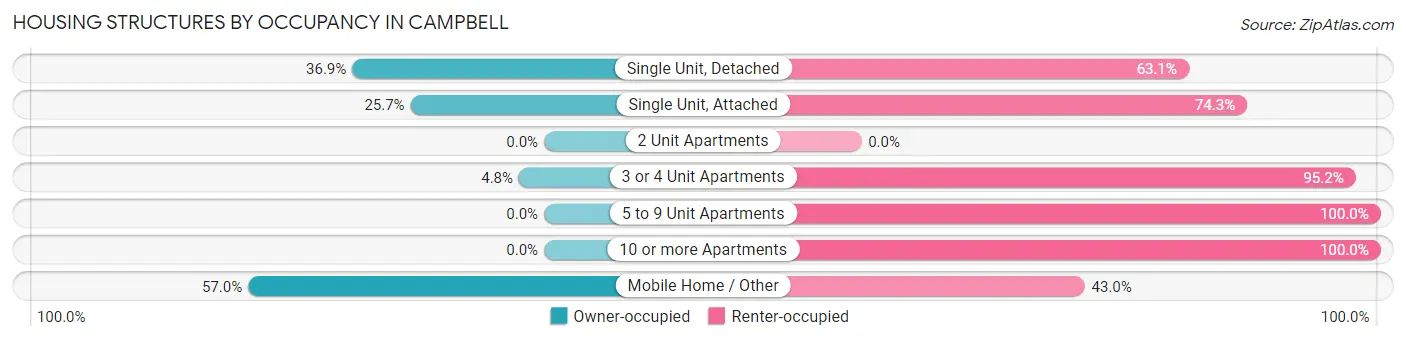
| Structure Type | Owner-occupied | Renter-occupied |
| Single Unit, Detached | 58 (36.9%) | 99 (63.1%) |
| Single Unit, Attached | 9 (25.7%) | 26 (74.3%) |
| 2 Unit Apartments | 0 (0.0%) | 0 (0.0%) |
| 3 or 4 Unit Apartments | 14 (4.8%) | 276 (95.2%) |
| 5 to 9 Unit Apartments | 0 (0.0%) | 49 (100.0%) |
| 10 or more Apartments | 0 (0.0%) | 131 (100.0%) |
| Mobile Home / Other | 249 (57.0%) | 188 (43.0%) |
| Total | 330 (30.0%) | 769 (70.0%) |
Housing Structures by Number of Rooms in Campbell
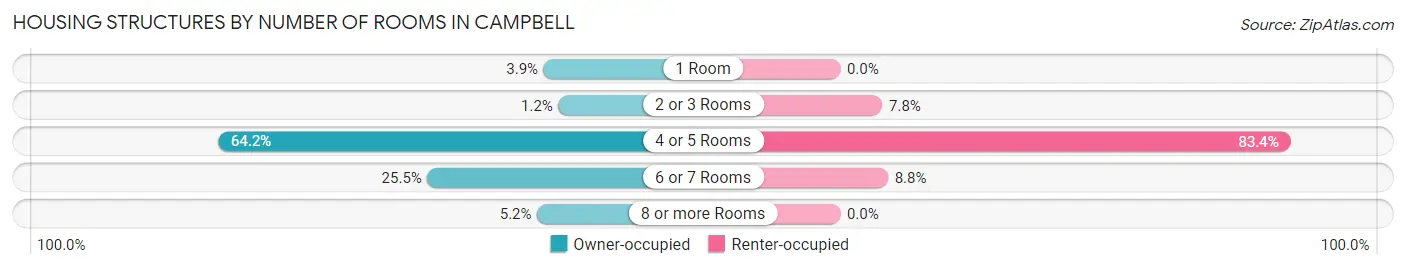
| Number of Rooms | Owner-occupied | Renter-occupied |
| 1 Room | 13 (3.9%) | 0 (0.0%) |
| 2 or 3 Rooms | 4 (1.2%) | 60 (7.8%) |
| 4 or 5 Rooms | 212 (64.2%) | 641 (83.4%) |
| 6 or 7 Rooms | 84 (25.5%) | 68 (8.8%) |
| 8 or more Rooms | 17 (5.1%) | 0 (0.0%) |
| Total | 330 (100.0%) | 769 (100.0%) |
Housing Structure by Heating Type in Campbell
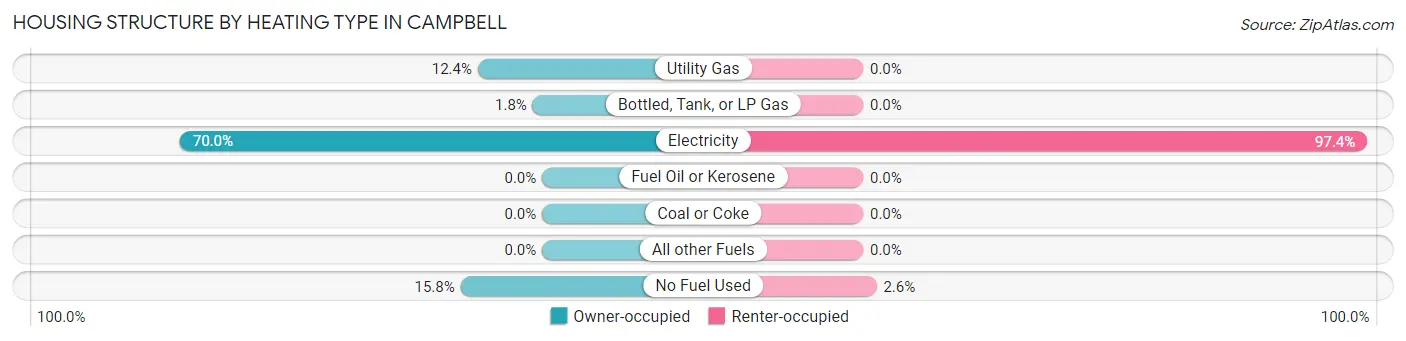
| Heating Type | Owner-occupied | Renter-occupied |
| Utility Gas | 41 (12.4%) | 0 (0.0%) |
| Bottled, Tank, or LP Gas | 6 (1.8%) | 0 (0.0%) |
| Electricity | 231 (70.0%) | 749 (97.4%) |
| Fuel Oil or Kerosene | 0 (0.0%) | 0 (0.0%) |
| Coal or Coke | 0 (0.0%) | 0 (0.0%) |
| All other Fuels | 0 (0.0%) | 0 (0.0%) |
| No Fuel Used | 52 (15.8%) | 20 (2.6%) |
| Total | 330 (100.0%) | 769 (100.0%) |
Household Vehicle Usage in Campbell
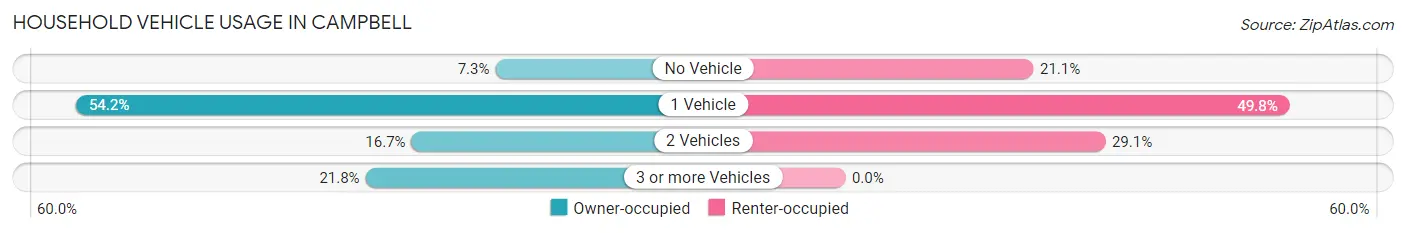
| Vehicles per Household | Owner-occupied | Renter-occupied |
| No Vehicle | 24 (7.3%) | 162 (21.1%) |
| 1 Vehicle | 179 (54.2%) | 383 (49.8%) |
| 2 Vehicles | 55 (16.7%) | 224 (29.1%) |
| 3 or more Vehicles | 72 (21.8%) | 0 (0.0%) |
| Total | 330 (100.0%) | 769 (100.0%) |
Real Estate & Mortgages in Campbell
Real Estate and Mortgage Overview in Campbell
| Characteristic | Without Mortgage | With Mortgage |
| Housing Units | 254 | 76 |
| Median Property Value | $52,900 | $115,000 |
| Median Household Income | $43,947 | $52 |
| Monthly Housing Costs | $451 | $0 |
| Real Estate Taxes | $199 | $0 |
Property Value by Mortgage Status in Campbell
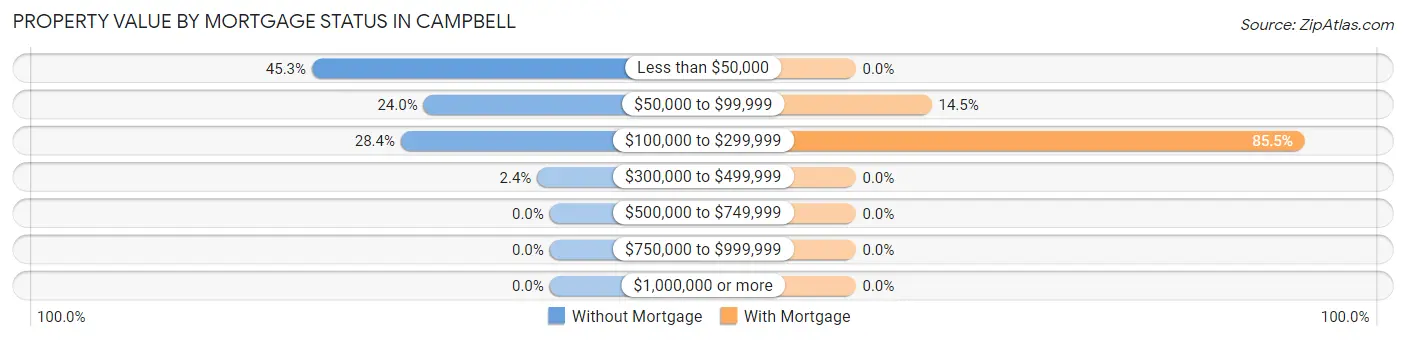
| Property Value | Without Mortgage | With Mortgage |
| Less than $50,000 | 115 (45.3%) | 0 (0.0%) |
| $50,000 to $99,999 | 61 (24.0%) | 11 (14.5%) |
| $100,000 to $299,999 | 72 (28.3%) | 65 (85.5%) |
| $300,000 to $499,999 | 6 (2.4%) | 0 (0.0%) |
| $500,000 to $749,999 | 0 (0.0%) | 0 (0.0%) |
| $750,000 to $999,999 | 0 (0.0%) | 0 (0.0%) |
| $1,000,000 or more | 0 (0.0%) | 0 (0.0%) |
| Total | 254 (100.0%) | 76 (100.0%) |
Household Income by Mortgage Status in Campbell
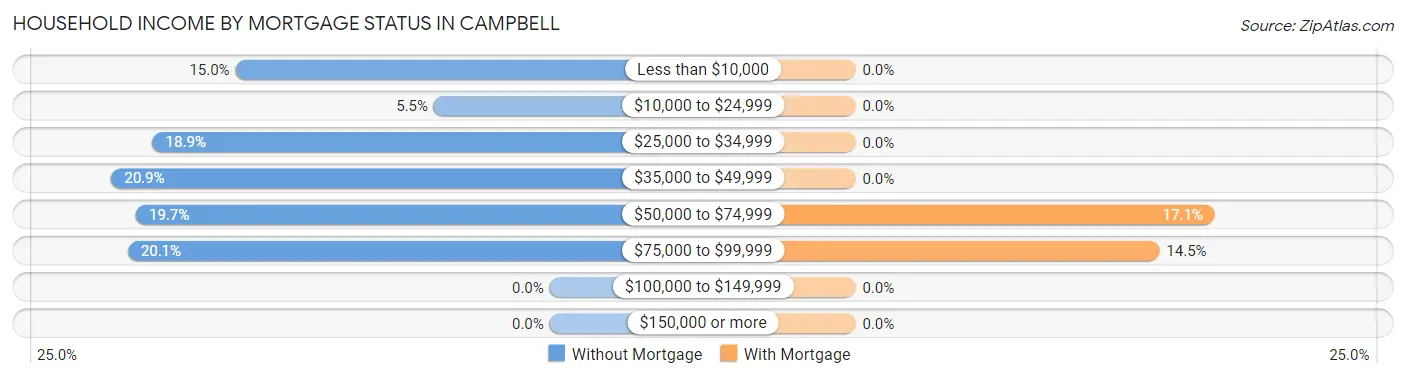
| Household Income | Without Mortgage | With Mortgage |
| Less than $10,000 | 38 (15.0%) | 0 (0.0%) |
| $10,000 to $24,999 | 14 (5.5%) | 0 (0.0%) |
| $25,000 to $34,999 | 48 (18.9%) | 0 (0.0%) |
| $35,000 to $49,999 | 53 (20.9%) | 0 (0.0%) |
| $50,000 to $74,999 | 50 (19.7%) | 13 (17.1%) |
| $75,000 to $99,999 | 51 (20.1%) | 11 (14.5%) |
| $100,000 to $149,999 | 0 (0.0%) | 0 (0.0%) |
| $150,000 or more | 0 (0.0%) | 0 (0.0%) |
| Total | 254 (100.0%) | 76 (100.0%) |
Property Value to Household Income Ratio in Campbell
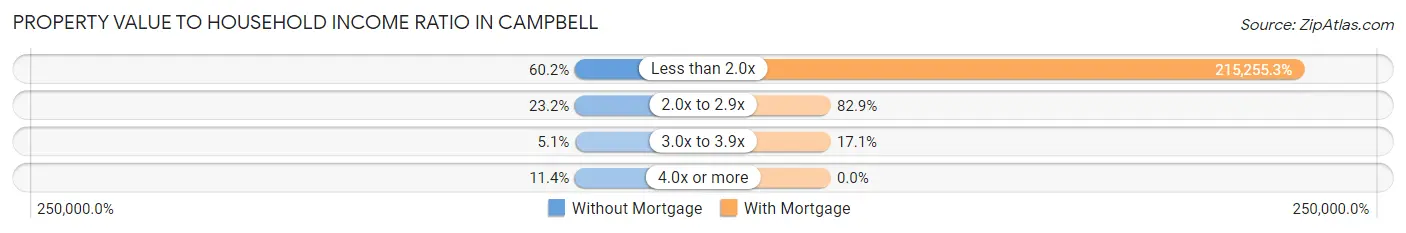
| Value-to-Income Ratio | Without Mortgage | With Mortgage |
| Less than 2.0x | 153 (60.2%) | 163,594 (215,255.3%) |
| 2.0x to 2.9x | 59 (23.2%) | 63 (82.9%) |
| 3.0x to 3.9x | 13 (5.1%) | 13 (17.1%) |
| 4.0x or more | 29 (11.4%) | 0 (0.0%) |
| Total | 254 (100.0%) | 76 (100.0%) |
Real Estate Taxes by Mortgage Status in Campbell
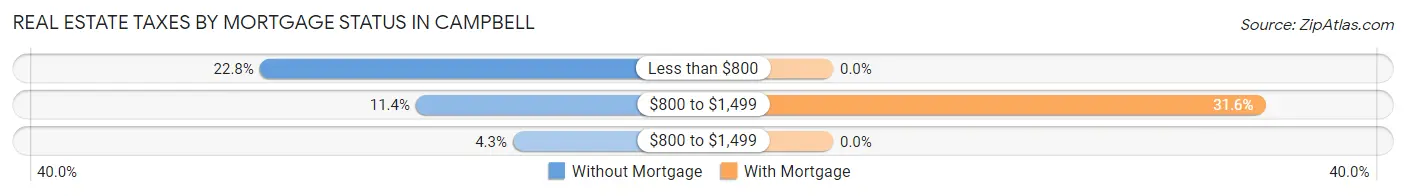
| Property Taxes | Without Mortgage | With Mortgage |
| Less than $800 | 58 (22.8%) | 0 (0.0%) |
| $800 to $1,499 | 29 (11.4%) | 24 (31.6%) |
| $800 to $1,499 | 11 (4.3%) | 0 (0.0%) |
| Total | 254 (100.0%) | 76 (100.0%) |
Health & Disability in Campbell
Health Insurance Coverage by Age in Campbell
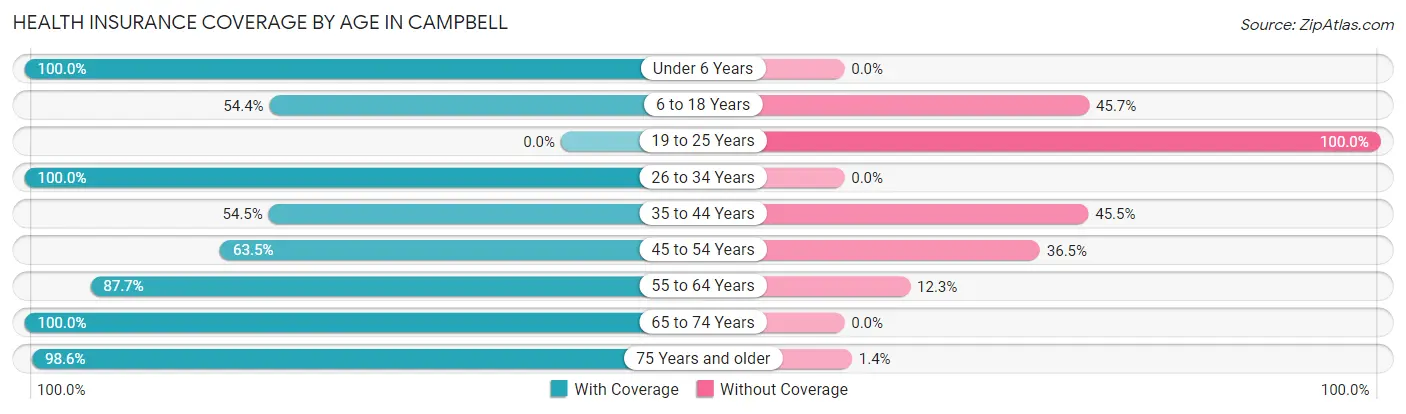
| Age Bracket | With Coverage | Without Coverage |
| Under 6 Years | 30 (100.0%) | 0 (0.0%) |
| 6 to 18 Years | 50 (54.3%) | 42 (45.7%) |
| 19 to 25 Years | 0 (0.0%) | 35 (100.0%) |
| 26 to 34 Years | 40 (100.0%) | 0 (0.0%) |
| 35 to 44 Years | 103 (54.5%) | 86 (45.5%) |
| 45 to 54 Years | 169 (63.5%) | 97 (36.5%) |
| 55 to 64 Years | 515 (87.7%) | 72 (12.3%) |
| 65 to 74 Years | 136 (100.0%) | 0 (0.0%) |
| 75 Years and older | 699 (98.6%) | 10 (1.4%) |
| Total | 1,742 (83.6%) | 342 (16.4%) |
Health Insurance Coverage by Citizenship Status in Campbell
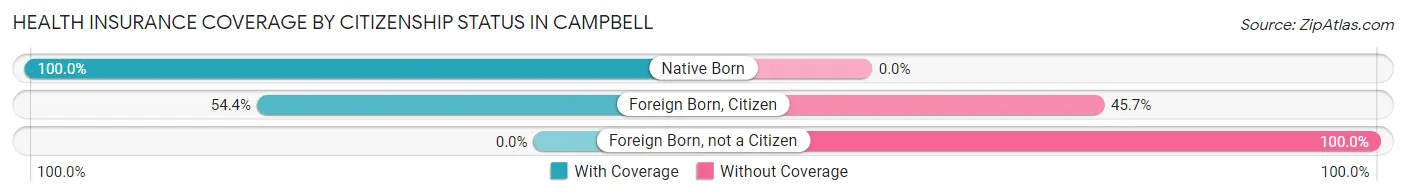
| Citizenship Status | With Coverage | Without Coverage |
| Native Born | 30 (100.0%) | 0 (0.0%) |
| Foreign Born, Citizen | 50 (54.3%) | 42 (45.7%) |
| Foreign Born, not a Citizen | 0 (0.0%) | 35 (100.0%) |
Health Insurance Coverage by Household Income in Campbell
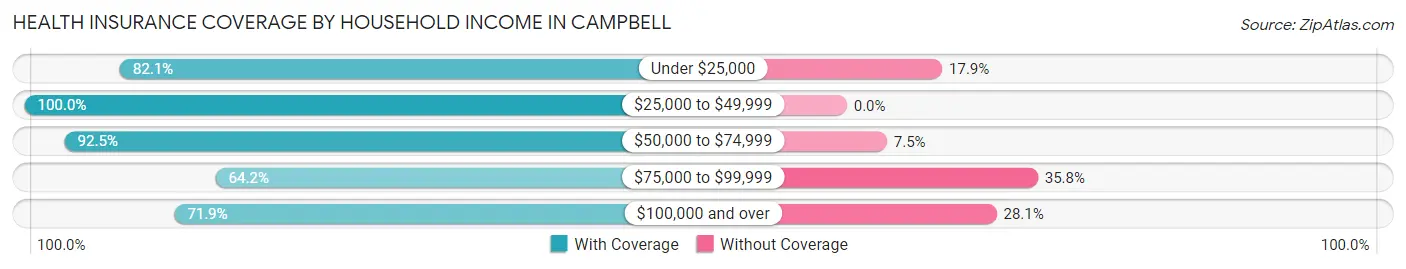
| Household Income | With Coverage | Without Coverage |
| Under $25,000 | 377 (82.1%) | 82 (17.9%) |
| $25,000 to $49,999 | 526 (100.0%) | 0 (0.0%) |
| $50,000 to $74,999 | 345 (92.5%) | 28 (7.5%) |
| $75,000 to $99,999 | 235 (64.2%) | 131 (35.8%) |
| $100,000 and over | 259 (71.9%) | 101 (28.1%) |
Public vs Private Health Insurance Coverage by Age in Campbell
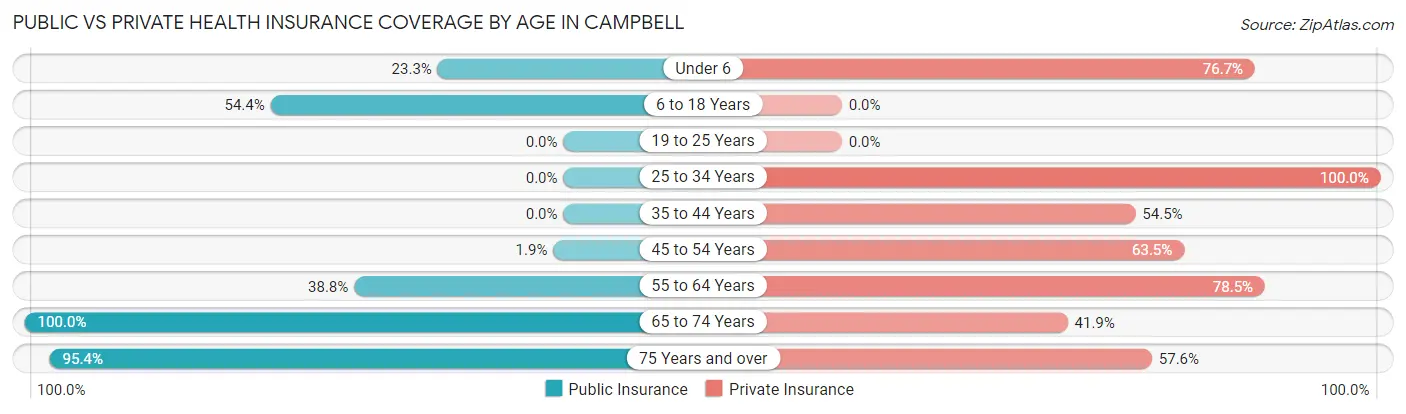
| Age Bracket | Public Insurance | Private Insurance |
| Under 6 | 7 (23.3%) | 23 (76.7%) |
| 6 to 18 Years | 50 (54.3%) | 0 (0.0%) |
| 19 to 25 Years | 0 (0.0%) | 0 (0.0%) |
| 25 to 34 Years | 0 (0.0%) | 40 (100.0%) |
| 35 to 44 Years | 0 (0.0%) | 103 (54.5%) |
| 45 to 54 Years | 5 (1.9%) | 169 (63.5%) |
| 55 to 64 Years | 228 (38.8%) | 461 (78.5%) |
| 65 to 74 Years | 136 (100.0%) | 57 (41.9%) |
| 75 Years and over | 676 (95.4%) | 408 (57.6%) |
| Total | 1,102 (52.9%) | 1,261 (60.5%) |
Disability Status by Sex by Age in Campbell
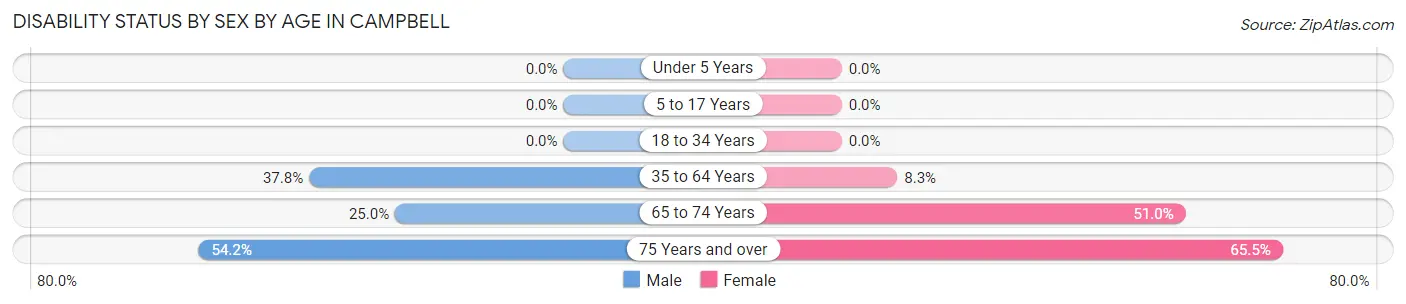
| Age Bracket | Male | Female |
| Under 5 Years | 0 (0.0%) | 0 (0.0%) |
| 5 to 17 Years | 0 (0.0%) | 0 (0.0%) |
| 18 to 34 Years | 0 (0.0%) | 0 (0.0%) |
| 35 to 64 Years | 247 (37.8%) | 32 (8.3%) |
| 65 to 74 Years | 10 (25.0%) | 49 (51.0%) |
| 75 Years and over | 130 (54.2%) | 307 (65.5%) |
Disability Class by Sex by Age in Campbell
Disability Class: Hearing Difficulty
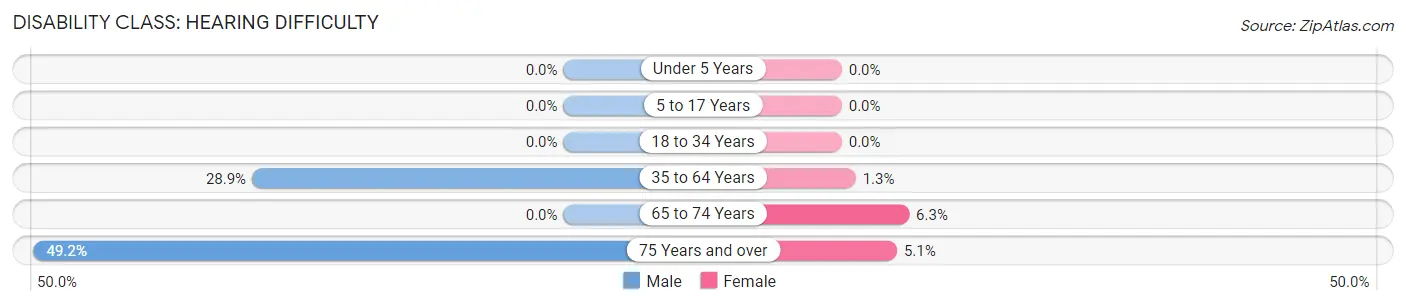
| Age Bracket | Male | Female |
| Under 5 Years | 0 (0.0%) | 0 (0.0%) |
| 5 to 17 Years | 0 (0.0%) | 0 (0.0%) |
| 18 to 34 Years | 0 (0.0%) | 0 (0.0%) |
| 35 to 64 Years | 189 (28.9%) | 5 (1.3%) |
| 65 to 74 Years | 0 (0.0%) | 6 (6.2%) |
| 75 Years and over | 118 (49.2%) | 24 (5.1%) |
Disability Class: Vision Difficulty
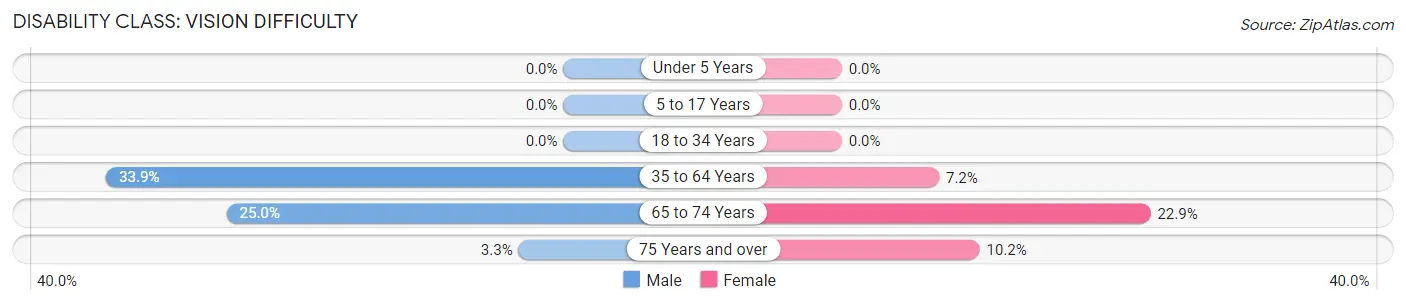
| Age Bracket | Male | Female |
| Under 5 Years | 0 (0.0%) | 0 (0.0%) |
| 5 to 17 Years | 0 (0.0%) | 0 (0.0%) |
| 18 to 34 Years | 0 (0.0%) | 0 (0.0%) |
| 35 to 64 Years | 222 (33.9%) | 28 (7.2%) |
| 65 to 74 Years | 10 (25.0%) | 22 (22.9%) |
| 75 Years and over | 8 (3.3%) | 48 (10.2%) |
Disability Class: Cognitive Difficulty
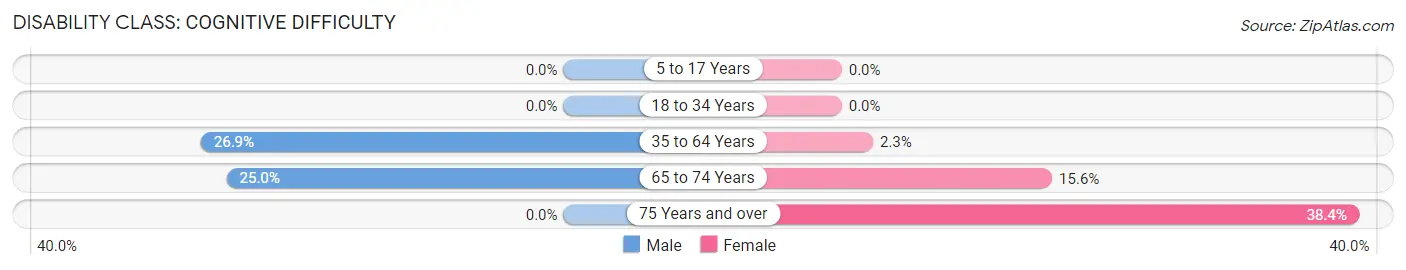
| Age Bracket | Male | Female |
| 5 to 17 Years | 0 (0.0%) | 0 (0.0%) |
| 18 to 34 Years | 0 (0.0%) | 0 (0.0%) |
| 35 to 64 Years | 176 (26.9%) | 9 (2.3%) |
| 65 to 74 Years | 10 (25.0%) | 15 (15.6%) |
| 75 Years and over | 0 (0.0%) | 180 (38.4%) |
Disability Class: Ambulatory Difficulty
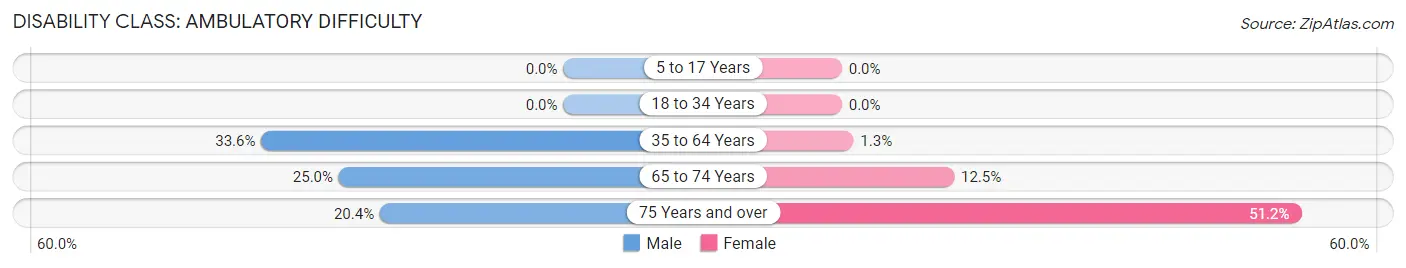
| Age Bracket | Male | Female |
| 5 to 17 Years | 0 (0.0%) | 0 (0.0%) |
| 18 to 34 Years | 0 (0.0%) | 0 (0.0%) |
| 35 to 64 Years | 220 (33.6%) | 5 (1.3%) |
| 65 to 74 Years | 10 (25.0%) | 12 (12.5%) |
| 75 Years and over | 49 (20.4%) | 240 (51.2%) |
Disability Class: Self-Care Difficulty
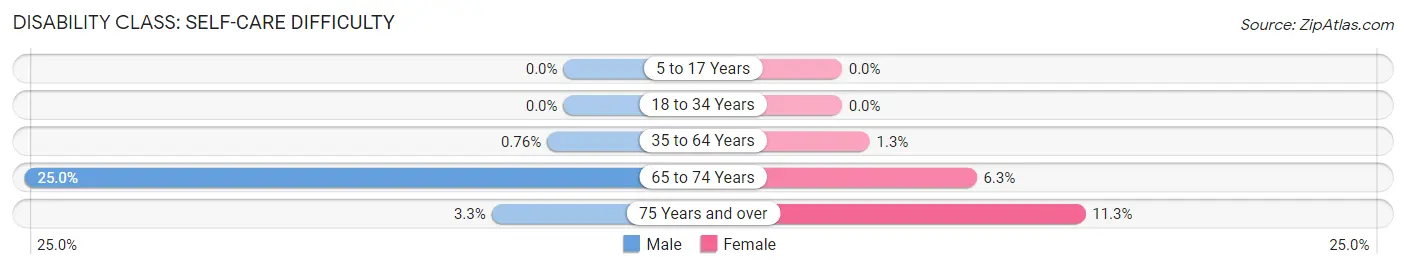
| Age Bracket | Male | Female |
| 5 to 17 Years | 0 (0.0%) | 0 (0.0%) |
| 18 to 34 Years | 0 (0.0%) | 0 (0.0%) |
| 35 to 64 Years | 5 (0.8%) | 5 (1.3%) |
| 65 to 74 Years | 10 (25.0%) | 6 (6.2%) |
| 75 Years and over | 8 (3.3%) | 53 (11.3%) |
Technology Access in Campbell
Computing Device Access in Campbell
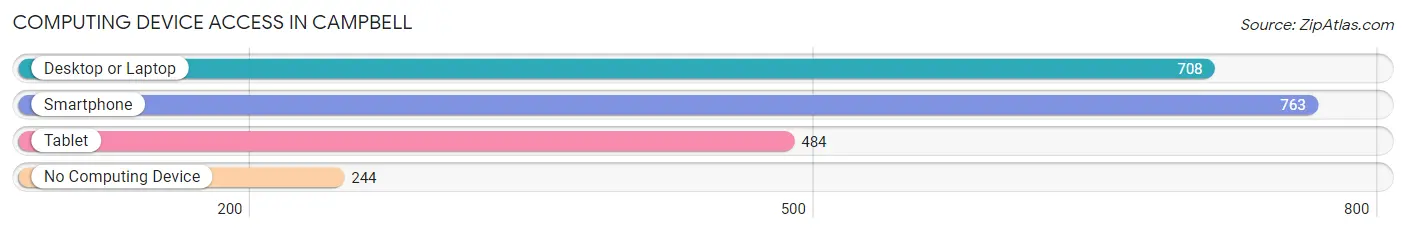
| Device Type | # Households | % Households |
| Desktop or Laptop | 708 | 64.4% |
| Smartphone | 763 | 69.4% |
| Tablet | 484 | 44.0% |
| No Computing Device | 244 | 22.2% |
| Total | 1,099 | 100.0% |
Internet Access in Campbell
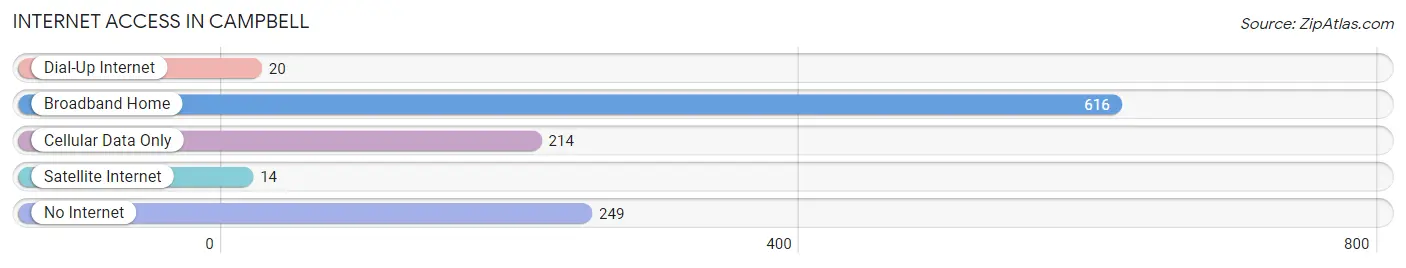
| Internet Type | # Households | % Households |
| Dial-Up Internet | 20 | 1.8% |
| Broadband Home | 616 | 56.0% |
| Cellular Data Only | 214 | 19.5% |
| Satellite Internet | 14 | 1.3% |
| No Internet | 249 | 22.7% |
| Total | 1,099 | 100.0% |
Campbell Summary
Campbell is a small town located in the state of Florida, in the United States. It is situated in the northern part of the state, in the county of Santa Rosa. The town has a population of approximately 1,000 people, and is located about 20 miles east of Pensacola.
History
The area that is now Campbell was first settled in the early 1800s by a group of settlers from Georgia. The town was originally known as “Campbell’s Crossroads”, and was named after the family that owned the land. The town was officially incorporated in 1887, and was named after the family’s patriarch, William Campbell.
In the early 1900s, Campbell was a thriving agricultural community, with cotton, corn, and peanuts being the main crops. The town also had a sawmill, a grist mill, and a cotton gin. In the 1920s, the town began to experience a decline in population, as many of the residents moved away to larger cities.
In the 1950s, the town began to experience a resurgence in population, as many of the residents returned to the area. The town was also home to a number of small businesses, including a grocery store, a hardware store, and a gas station.
Geography
Campbell is located in the northern part of the state of Florida, in the county of Santa Rosa. The town is situated about 20 miles east of Pensacola, and is located on the banks of the Escambia River. The town is surrounded by a number of small towns and villages, including Milton, Pace, and Jay.
The town is located in a rural area, and is surrounded by a number of farms and ranches. The town is also located near a number of state parks, including Blackwater River State Park, Eglin Air Force Base, and the Gulf Islands National Seashore.
Economy
The economy of Campbell is largely based on agriculture, with cotton, corn, and peanuts being the main crops. The town is also home to a number of small businesses, including a grocery store, a hardware store, and a gas station.
The town is also home to a number of manufacturing companies, including a paper mill, a furniture factory, and a plastics factory. The town is also home to a number of service-based businesses, including a number of restaurants, a hotel, and a number of retail stores.
Demographics
As of the 2010 census, the population of Campbell was 1,000 people. The town is predominantly white, with approximately 90% of the population being white. The town is also home to a small Hispanic population, with approximately 5% of the population being Hispanic. The town is also home to a small African American population, with approximately 2% of the population being African American. The town is also home to a small Native American population, with approximately 1% of the population being Native American.
Common Questions
What is Per Capita Income in Campbell?
Per Capita income in Campbell is $27,250.
What is the Median Family Income in Campbell?
Median Family Income in Campbell is $33,250.
What is the Median Household income in Campbell?
Median Household Income in Campbell is $38,117.
What is Income or Wage Gap in Campbell?
Income or Wage Gap in Campbell is 26.5%.
Women in Campbell earn 73.5 cents for every dollar earned by a man.
What is Inequality or Gini Index in Campbell?
Inequality or Gini Index in Campbell is 0.51.
What is the Total Population of Campbell?
Total Population of Campbell is 2,262.
What is the Total Male Population of Campbell?
Total Male Population of Campbell is 1,092.
What is the Total Female Population of Campbell?
Total Female Population of Campbell is 1,170.
What is the Ratio of Males per 100 Females in Campbell?
There are 93.33 Males per 100 Females in Campbell.
What is the Ratio of Females per 100 Males in Campbell?
There are 107.14 Females per 100 Males in Campbell.
What is the Median Population Age in Campbell?
Median Population Age in Campbell is 64.5 Years.
What is the Average Family Size in Campbell
Average Family Size in Campbell is 2.2 People.
What is the Average Household Size in Campbell
Average Household Size in Campbell is 1.9 People.
How Large is the Labor Force in Campbell?
There are 846 People in the Labor Forcein in Campbell.
What is the Percentage of People in the Labor Force in Campbell?
38.7% of People are in the Labor Force in Campbell.
What is the Unemployment Rate in Campbell?
Unemployment Rate in Campbell is 11.6%.