Fort Pierce North, FL Map & Demographics
Fort Pierce North Map
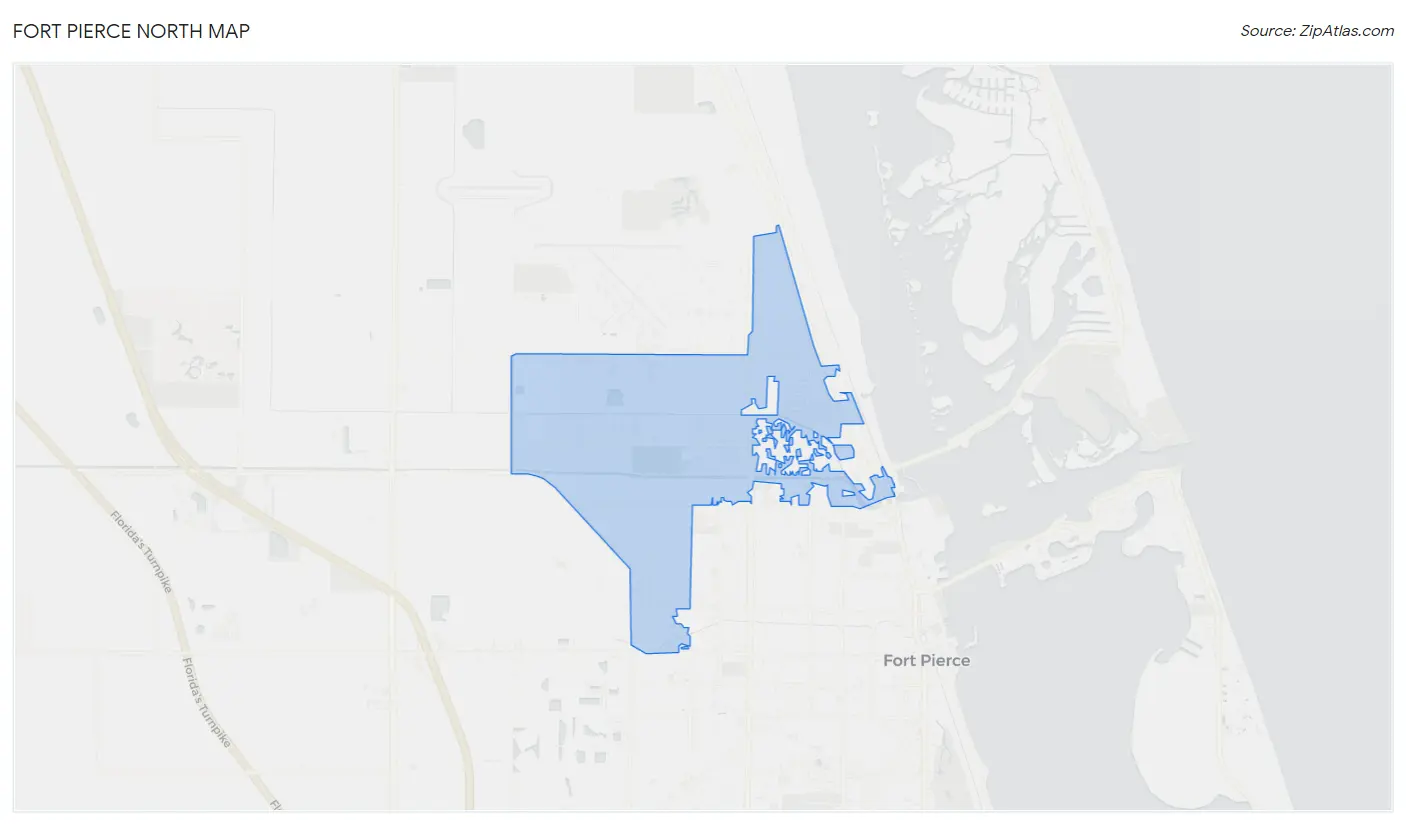
Fort Pierce North Overview
$19,436
PER CAPITA INCOME
$42,402
AVG FAMILY INCOME
$31,458
AVG HOUSEHOLD INCOME
35.7%
WAGE / INCOME GAP [ % ]
64.3¢/ $1
WAGE / INCOME GAP [ $ ]
0.55
INEQUALITY / GINI INDEX
6,519
TOTAL POPULATION
3,543
MALE POPULATION
2,976
FEMALE POPULATION
119.05
MALES / 100 FEMALES
84.00
FEMALES / 100 MALES
40.6
MEDIAN AGE
3.9
AVG FAMILY SIZE
2.6
AVG HOUSEHOLD SIZE
2,681
LABOR FORCE [ PEOPLE ]
47.5%
PERCENT IN LABOR FORCE
5.2%
UNEMPLOYMENT RATE
Income in Fort Pierce North
Income Overview in Fort Pierce North
Per Capita Income in Fort Pierce North is $19,436, while median incomes of families and households are $42,402 and $31,458 respectively.
| Characteristic | Number | Measure |
| Per Capita Income | 6,519 | $19,436 |
| Median Family Income | 1,322 | $42,402 |
| Mean Family Income | 1,322 | $61,923 |
| Median Household Income | 2,489 | $31,458 |
| Mean Household Income | 2,489 | $42,129 |
| Income Deficit | 1,322 | $0 |
| Wage / Income Gap (%) | 6,519 | 35.72% |
| Wage / Income Gap ($) | 6,519 | 64.28¢ per $1 |
| Gini / Inequality Index | 6,519 | 0.55 |
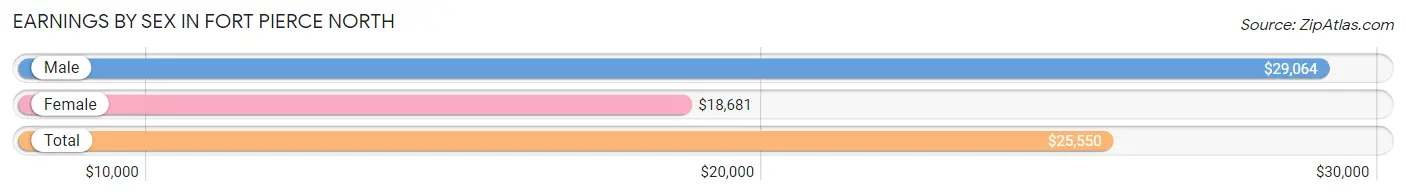
Earnings by Sex in Fort Pierce North
Average Earnings in Fort Pierce North are $25,550, $29,064 for men and $18,681 for women, a difference of 35.7%.
| Sex | Number | Average Earnings |
| Male | 1,303 (48.7%) | $29,064 |
| Female | 1,375 (51.3%) | $18,681 |
| Total | 2,678 (100.0%) | $25,550 |
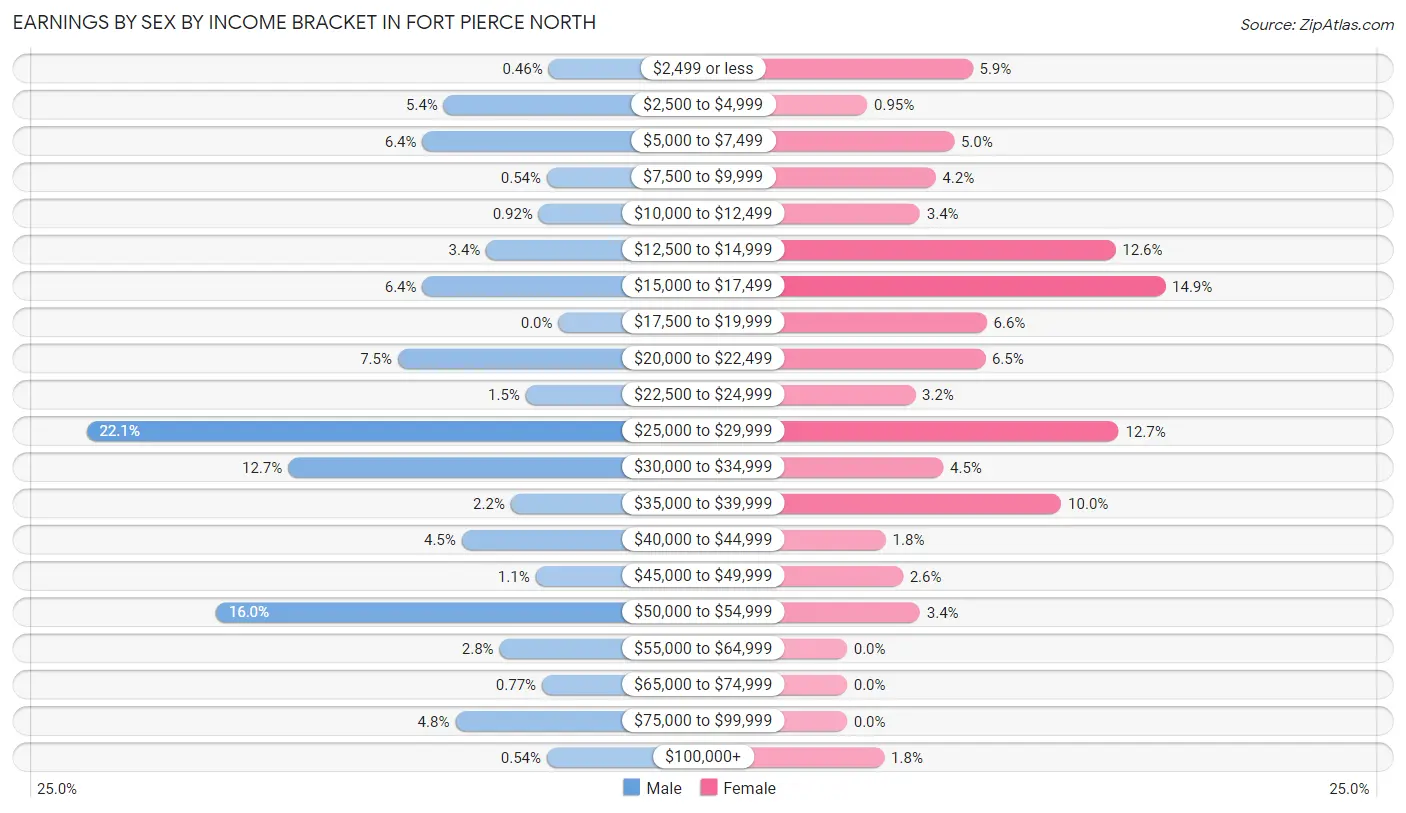
Earnings by Sex by Income Bracket in Fort Pierce North
The most common earnings brackets in Fort Pierce North are $25,000 to $29,999 for men (288 | 22.1%) and $15,000 to $17,499 for women (205 | 14.9%).
| Income | Male | Female |
| $2,499 or less | 6 (0.5%) | 81 (5.9%) |
| $2,500 to $4,999 | 70 (5.4%) | 13 (0.9%) |
| $5,000 to $7,499 | 83 (6.4%) | 69 (5.0%) |
| $7,500 to $9,999 | 7 (0.5%) | 57 (4.2%) |
| $10,000 to $12,499 | 12 (0.9%) | 47 (3.4%) |
| $12,500 to $14,999 | 44 (3.4%) | 173 (12.6%) |
| $15,000 to $17,499 | 83 (6.4%) | 205 (14.9%) |
| $17,500 to $19,999 | 0 (0.0%) | 90 (6.6%) |
| $20,000 to $22,499 | 98 (7.5%) | 89 (6.5%) |
| $22,500 to $24,999 | 20 (1.5%) | 44 (3.2%) |
| $25,000 to $29,999 | 288 (22.1%) | 175 (12.7%) |
| $30,000 to $34,999 | 165 (12.7%) | 62 (4.5%) |
| $35,000 to $39,999 | 29 (2.2%) | 138 (10.0%) |
| $40,000 to $44,999 | 59 (4.5%) | 25 (1.8%) |
| $45,000 to $49,999 | 14 (1.1%) | 36 (2.6%) |
| $50,000 to $54,999 | 209 (16.0%) | 47 (3.4%) |
| $55,000 to $64,999 | 36 (2.8%) | 0 (0.0%) |
| $65,000 to $74,999 | 10 (0.8%) | 0 (0.0%) |
| $75,000 to $99,999 | 63 (4.8%) | 0 (0.0%) |
| $100,000+ | 7 (0.5%) | 24 (1.8%) |
| Total | 1,303 (100.0%) | 1,375 (100.0%) |
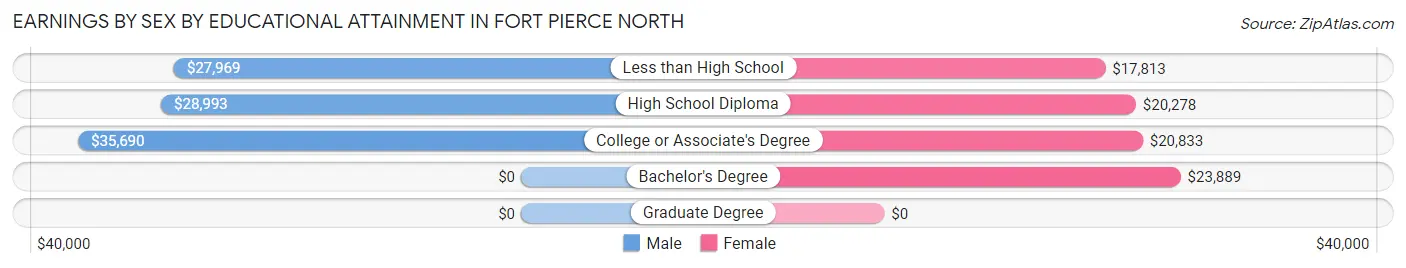
Earnings by Sex by Educational Attainment in Fort Pierce North
Average earnings in Fort Pierce North are $36,853 for men and $19,756 for women, a difference of 46.4%. Men with an educational attainment of college or associate's degree enjoy the highest average annual earnings of $35,690, while those with less than high school education earn the least with $27,969. Women with an educational attainment of bachelor's degree earn the most with the average annual earnings of $23,889, while those with less than high school education have the smallest earnings of $17,813.
| Educational Attainment | Male Income | Female Income |
| Less than High School | $27,969 | $17,813 |
| High School Diploma | $28,993 | $20,278 |
| College or Associate's Degree | $35,690 | $20,833 |
| Bachelor's Degree | - | - |
| Graduate Degree | - | - |
| Total | $36,853 | $19,756 |
Family Income in Fort Pierce North
Family Income Brackets in Fort Pierce North
According to the Fort Pierce North family income data, there are 368 families falling into the $35,000 to $49,999 income range, which is the most common income bracket and makes up 27.8% of all families. Conversely, the $150,000 to $199,999 income bracket is the least frequent group with only 7 families (0.5%) belonging to this category.
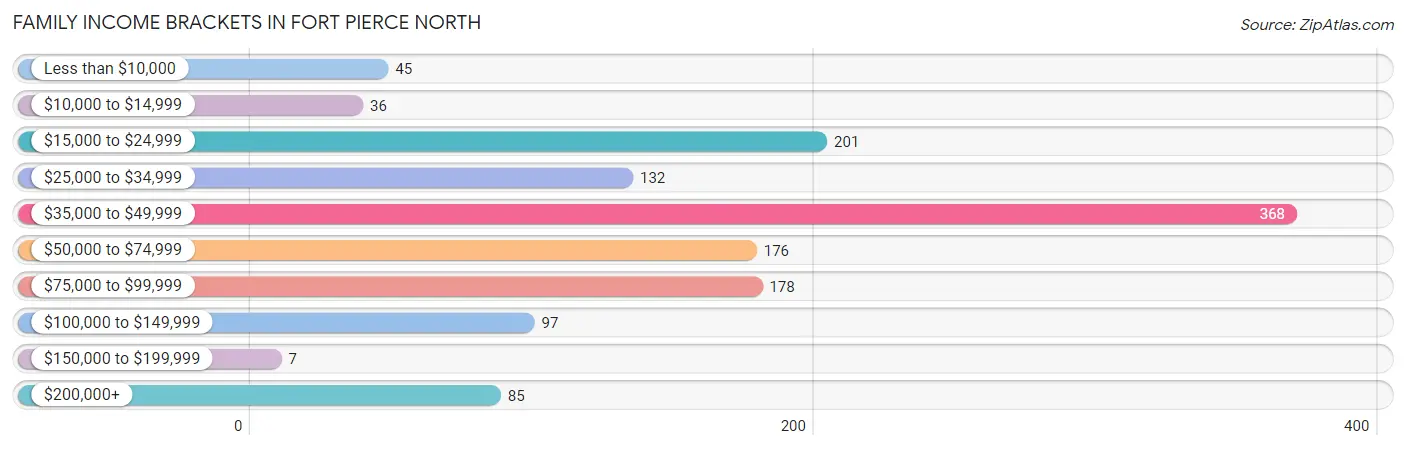
| Income Bracket | # Families | % Families |
| Less than $10,000 | 45 | 3.4% |
| $10,000 to $14,999 | 36 | 2.7% |
| $15,000 to $24,999 | 201 | 15.2% |
| $25,000 to $34,999 | 132 | 10.0% |
| $35,000 to $49,999 | 368 | 27.8% |
| $50,000 to $74,999 | 176 | 13.3% |
| $75,000 to $99,999 | 178 | 13.5% |
| $100,000 to $149,999 | 97 | 7.3% |
| $150,000 to $199,999 | 7 | 0.5% |
| $200,000+ | 85 | 6.4% |
Family Income by Famaliy Size in Fort Pierce North
7+ person families (42 | 3.2%) account for the highest median family income in Fort Pierce North with $116,667 per family, while 2-person families (672 | 50.8%) have the highest median income of $19,734 per family member.
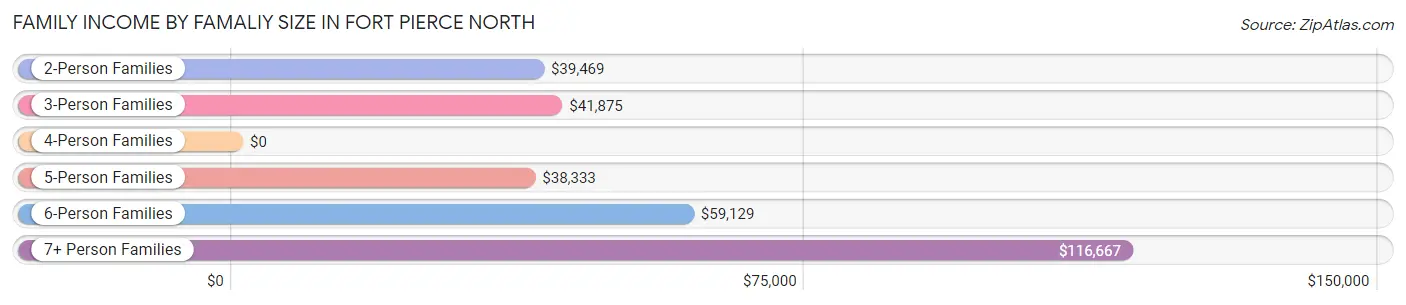
| Income Bracket | # Families | Median Income |
| 2-Person Families | 672 (50.8%) | $39,469 |
| 3-Person Families | 341 (25.8%) | $41,875 |
| 4-Person Families | 100 (7.6%) | $0 |
| 5-Person Families | 94 (7.1%) | $38,333 |
| 6-Person Families | 73 (5.5%) | $59,129 |
| 7+ Person Families | 42 (3.2%) | $116,667 |
| Total | 1,322 (100.0%) | $42,402 |
Family Income by Number of Earners in Fort Pierce North
The median family income in Fort Pierce North is $42,402, with families comprising 3+ earners (159) having the highest median family income of $81,771, while families with 1 earner (452) have the lowest median family income of $33,611, accounting for 12.0% and 34.2% of families, respectively.
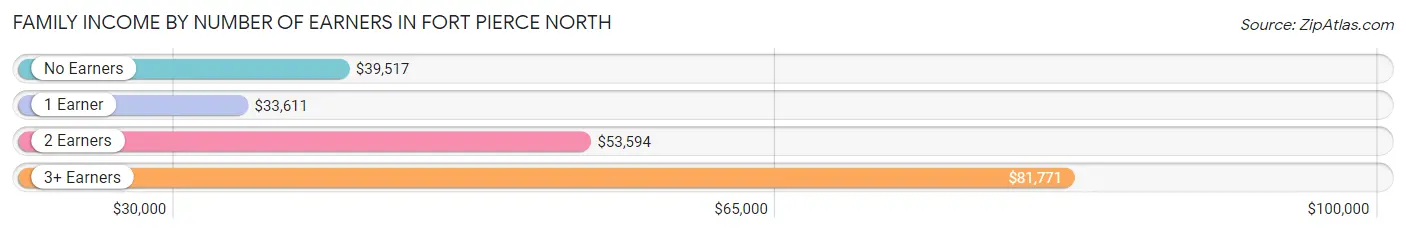
| Number of Earners | # Families | Median Income |
| No Earners | 321 (24.3%) | $39,517 |
| 1 Earner | 452 (34.2%) | $33,611 |
| 2 Earners | 390 (29.5%) | $53,594 |
| 3+ Earners | 159 (12.0%) | $81,771 |
| Total | 1,322 (100.0%) | $42,402 |
Household Income in Fort Pierce North
Household Income Brackets in Fort Pierce North
With 540 households falling in the category, the less than $10,000 income range is the most frequent in Fort Pierce North, accounting for 21.7% of all households. In contrast, only 5 households (0.2%) fall into the $150,000 to $199,999 income bracket, making it the least populous group.
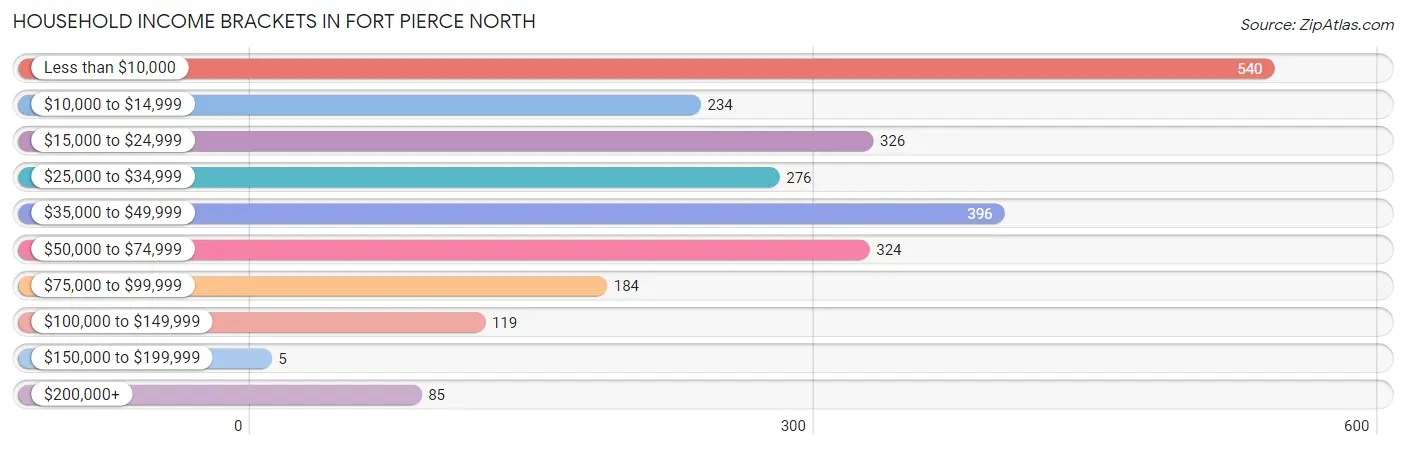
| Income Bracket | # Households | % Households |
| Less than $10,000 | 540 | 21.7% |
| $10,000 to $14,999 | 234 | 9.4% |
| $15,000 to $24,999 | 326 | 13.1% |
| $25,000 to $34,999 | 276 | 11.1% |
| $35,000 to $49,999 | 396 | 15.9% |
| $50,000 to $74,999 | 324 | 13.0% |
| $75,000 to $99,999 | 184 | 7.4% |
| $100,000 to $149,999 | 119 | 4.8% |
| $150,000 to $199,999 | 5 | 0.2% |
| $200,000+ | 85 | 3.4% |
Household Income by Householder Age in Fort Pierce North
The median household income in Fort Pierce North is $31,458, with the highest median household income of $38,243 found in the 65+ years age bracket for the primary householder. A total of 874 households (35.1%) fall into this category. Meanwhile, the 15 to 24 years age bracket for the primary householder has the lowest median household income of $0, with 57 households (2.3%) in this group.
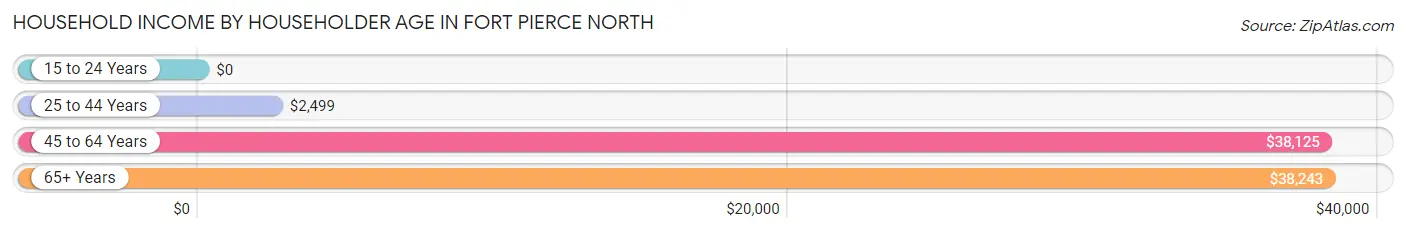
| Income Bracket | # Households | Median Income |
| 15 to 24 Years | 57 (2.3%) | $0 |
| 25 to 44 Years | 843 (33.9%) | $2,499 |
| 45 to 64 Years | 715 (28.7%) | $38,125 |
| 65+ Years | 874 (35.1%) | $38,243 |
| Total | 2,489 (100.0%) | $31,458 |
Poverty in Fort Pierce North
Income Below Poverty by Sex and Age in Fort Pierce North
With 28.0% poverty level for males and 27.2% for females among the residents of Fort Pierce North, 15 year old males and 5 year old females are the most vulnerable to poverty, with 25 males (100.0%) and 33 females (80.5%) in their respective age groups living below the poverty level.
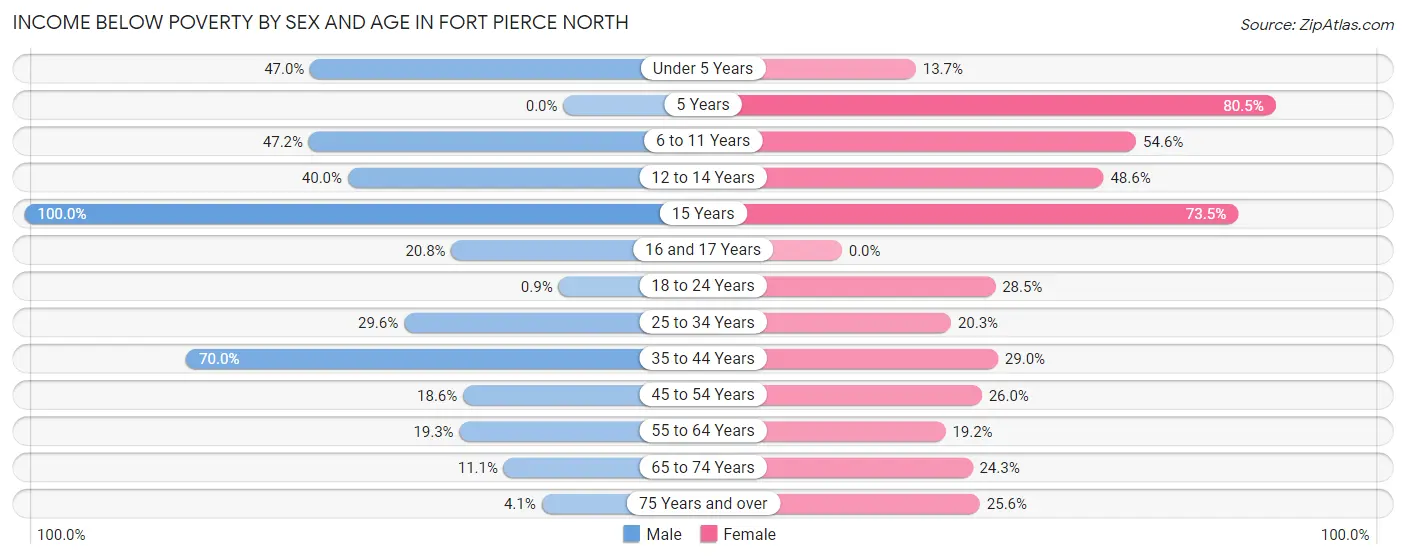
| Age Bracket | Male | Female |
| Under 5 Years | 39 (47.0%) | 14 (13.7%) |
| 5 Years | 0 (0.0%) | 33 (80.5%) |
| 6 to 11 Years | 120 (47.2%) | 53 (54.6%) |
| 12 to 14 Years | 54 (40.0%) | 34 (48.6%) |
| 15 Years | 25 (100.0%) | 50 (73.5%) |
| 16 and 17 Years | 38 (20.8%) | 0 (0.0%) |
| 18 to 24 Years | 6 (0.9%) | 39 (28.5%) |
| 25 to 34 Years | 34 (29.6%) | 62 (20.3%) |
| 35 to 44 Years | 474 (70.0%) | 153 (29.0%) |
| 45 to 54 Years | 67 (18.6%) | 80 (26.0%) |
| 55 to 64 Years | 82 (19.3%) | 112 (19.2%) |
| 65 to 74 Years | 44 (11.1%) | 98 (24.3%) |
| 75 Years and over | 9 (4.1%) | 81 (25.6%) |
| Total | 992 (28.0%) | 809 (27.2%) |
Income Above Poverty by Sex and Age in Fort Pierce North
According to the poverty statistics in Fort Pierce North, males aged 18 to 24 years and females aged 16 and 17 years are the age groups that are most secure financially, with 99.1% of males and 100.0% of females in these age groups living above the poverty line.
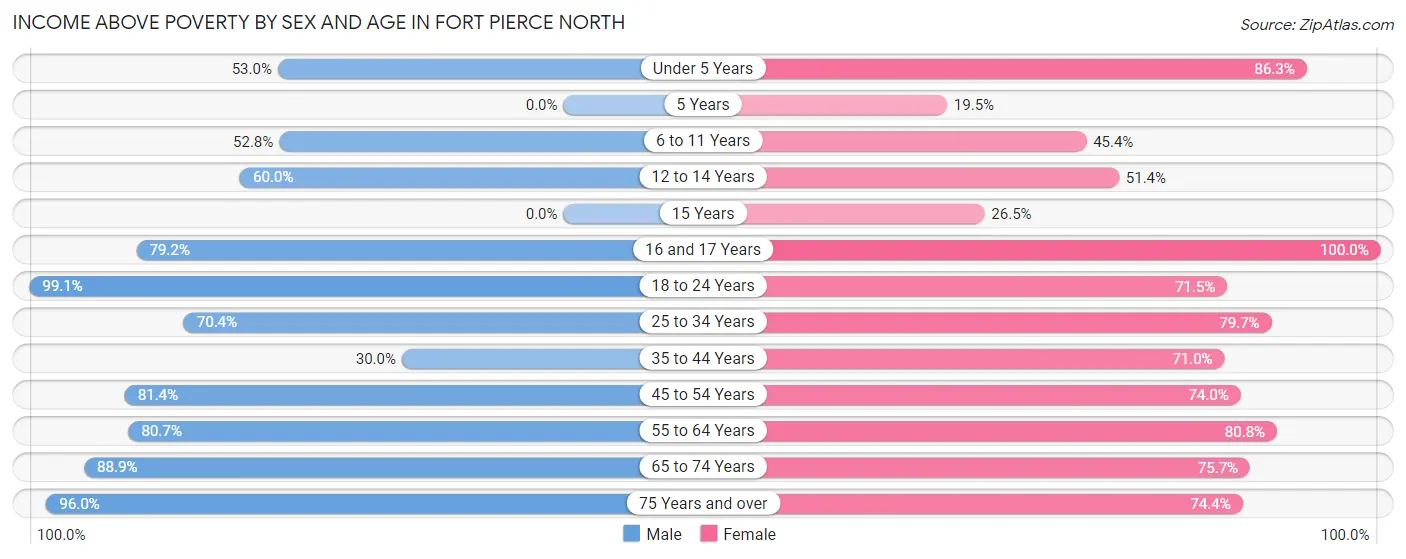
| Age Bracket | Male | Female |
| Under 5 Years | 44 (53.0%) | 88 (86.3%) |
| 5 Years | 0 (0.0%) | 8 (19.5%) |
| 6 to 11 Years | 134 (52.8%) | 44 (45.4%) |
| 12 to 14 Years | 81 (60.0%) | 36 (51.4%) |
| 15 Years | 0 (0.0%) | 18 (26.5%) |
| 16 and 17 Years | 145 (79.2%) | 17 (100.0%) |
| 18 to 24 Years | 660 (99.1%) | 98 (71.5%) |
| 25 to 34 Years | 81 (70.4%) | 244 (79.7%) |
| 35 to 44 Years | 203 (30.0%) | 375 (71.0%) |
| 45 to 54 Years | 293 (81.4%) | 228 (74.0%) |
| 55 to 64 Years | 343 (80.7%) | 470 (80.8%) |
| 65 to 74 Years | 354 (88.9%) | 306 (75.7%) |
| 75 Years and over | 213 (96.0%) | 235 (74.4%) |
| Total | 2,551 (72.0%) | 2,167 (72.8%) |
Income Below Poverty Among Married-Couple Families in Fort Pierce North
The poverty statistics for married-couple families in Fort Pierce North show that 17.3% or 123 of the total 709 families live below the poverty line. Families with 5 or more children have the highest poverty rate of 100.0%, comprising of 11 families. On the other hand, families with no children have the lowest poverty rate of 12.5%, which includes 53 families.
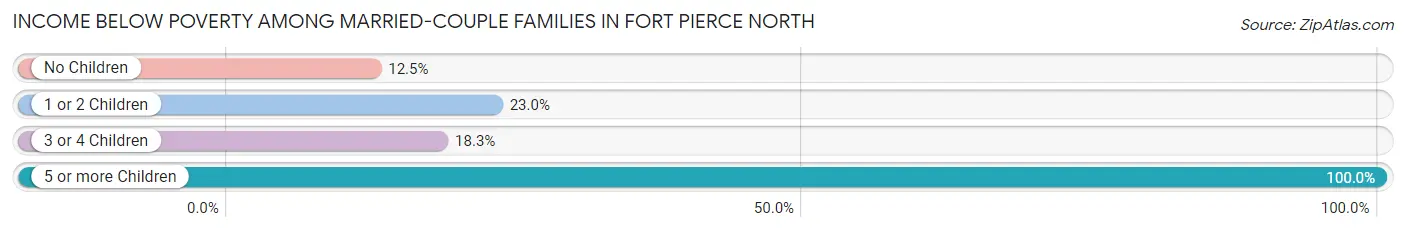
| Children | Above Poverty | Below Poverty |
| No Children | 372 (87.5%) | 53 (12.5%) |
| 1 or 2 Children | 147 (77.0%) | 44 (23.0%) |
| 3 or 4 Children | 67 (81.7%) | 15 (18.3%) |
| 5 or more Children | 0 (0.0%) | 11 (100.0%) |
| Total | 586 (82.7%) | 123 (17.3%) |
Income Below Poverty Among Single-Parent Households in Fort Pierce North
According to the poverty data in Fort Pierce North, 3.4% or 6 single-father households and 31.8% or 138 single-mother households are living below the poverty line. Among single-father households, those with no children have the highest poverty rate, with 6 households (5.4%) experiencing poverty. Likewise, among single-mother households, those with 3 or 4 children have the highest poverty rate, with 39 households (100.0%) falling below the poverty line.
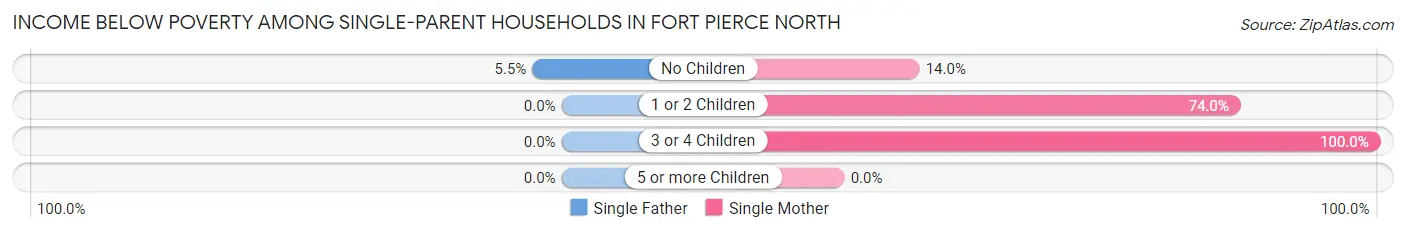
| Children | Single Father | Single Mother |
| No Children | 6 (5.4%) | 45 (14.0%) |
| 1 or 2 Children | 0 (0.0%) | 54 (74.0%) |
| 3 or 4 Children | 0 (0.0%) | 39 (100.0%) |
| 5 or more Children | 0 (0.0%) | 0 (0.0%) |
| Total | 6 (3.4%) | 138 (31.8%) |
Income Below Poverty Among Married-Couple vs Single-Parent Households in Fort Pierce North
The poverty data for Fort Pierce North shows that 123 of the married-couple family households (17.3%) and 144 of the single-parent households (23.5%) are living below the poverty level. Within the married-couple family households, those with 5 or more children have the highest poverty rate, with 11 households (100.0%) falling below the poverty line. Among the single-parent households, those with 3 or 4 children have the highest poverty rate, with 39 household (100.0%) living below poverty.
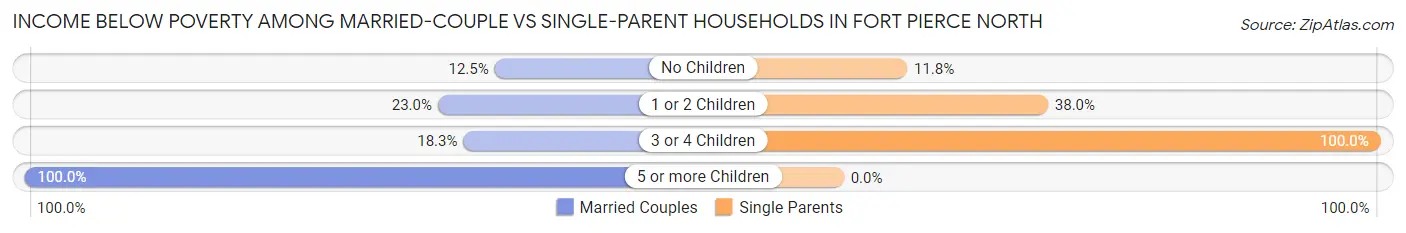
| Children | Married-Couple Families | Single-Parent Households |
| No Children | 53 (12.5%) | 51 (11.8%) |
| 1 or 2 Children | 44 (23.0%) | 54 (38.0%) |
| 3 or 4 Children | 15 (18.3%) | 39 (100.0%) |
| 5 or more Children | 11 (100.0%) | 0 (0.0%) |
| Total | 123 (17.3%) | 144 (23.5%) |
Race in Fort Pierce North
The most populous races in Fort Pierce North are Black / African American (3,817 | 58.6%), Hispanic or Latino (1,744 | 26.8%), and White / Caucasian (1,351 | 20.7%).
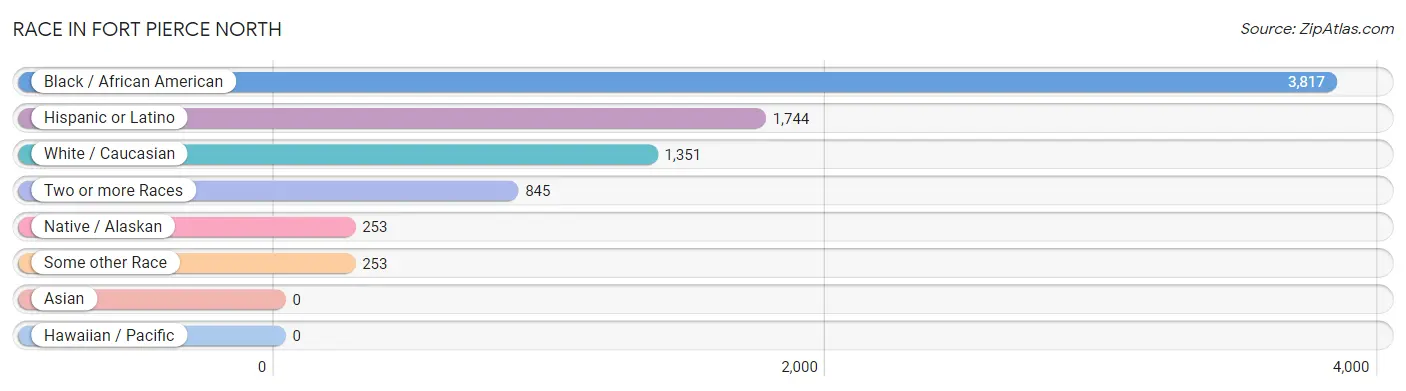
| Race | # Population | % Population |
| Asian | 0 | 0.0% |
| Black / African American | 3,817 | 58.6% |
| Hawaiian / Pacific | 0 | 0.0% |
| Hispanic or Latino | 1,744 | 26.8% |
| Native / Alaskan | 253 | 3.9% |
| White / Caucasian | 1,351 | 20.7% |
| Two or more Races | 845 | 13.0% |
| Some other Race | 253 | 3.9% |
| Total | 6,519 | 100.0% |
Ancestry in Fort Pierce North
The most populous ancestries reported in Fort Pierce North are American (1,235 | 18.9%), Mexican (1,015 | 15.6%), Central American (386 | 5.9%), Honduran (287 | 4.4%), and South American (160 | 2.5%), together accounting for 47.3% of all Fort Pierce North residents.
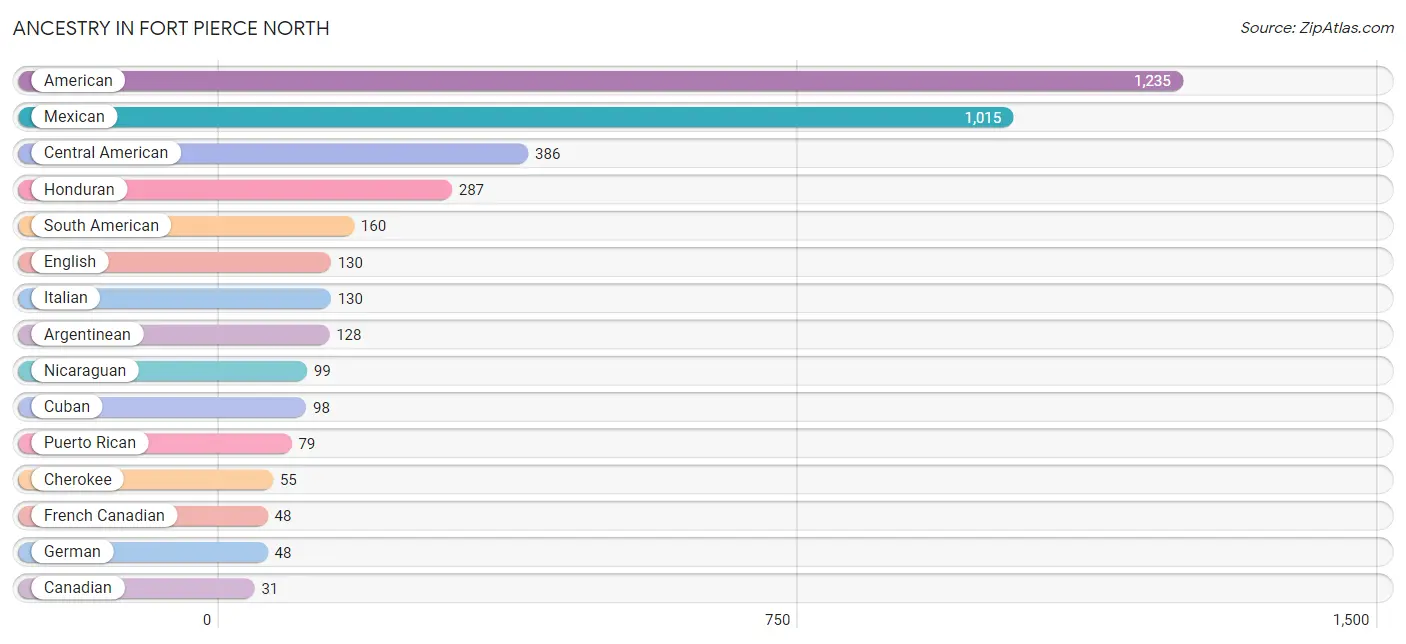
| Ancestry | # Population | % Population |
| African | 15 | 0.2% |
| American | 1,235 | 18.9% |
| Argentinean | 128 | 2.0% |
| Brazilian | 24 | 0.4% |
| Canadian | 31 | 0.5% |
| Central American | 386 | 5.9% |
| Cherokee | 55 | 0.8% |
| Chilean | 24 | 0.4% |
| Colombian | 8 | 0.1% |
| Cuban | 98 | 1.5% |
| Czech | 5 | 0.1% |
| Dutch | 8 | 0.1% |
| English | 130 | 2.0% |
| Finnish | 11 | 0.2% |
| French | 28 | 0.4% |
| French Canadian | 48 | 0.7% |
| German | 48 | 0.7% |
| Greek | 12 | 0.2% |
| Haitian | 13 | 0.2% |
| Honduran | 287 | 4.4% |
| Hungarian | 2 | 0.0% |
| Irish | 20 | 0.3% |
| Iroquois | 9 | 0.1% |
| Italian | 130 | 2.0% |
| Jamaican | 28 | 0.4% |
| Maltese | 6 | 0.1% |
| Mexican | 1,015 | 15.6% |
| Nicaraguan | 99 | 1.5% |
| Polish | 20 | 0.3% |
| Portuguese | 4 | 0.1% |
| Puerto Rican | 79 | 1.2% |
| Romanian | 7 | 0.1% |
| Russian | 18 | 0.3% |
| Scotch-Irish | 13 | 0.2% |
| Scottish | 20 | 0.3% |
| South American | 160 | 2.5% |
| Spanish | 4 | 0.1% |
| Subsaharan African | 15 | 0.2% |
| Swedish | 21 | 0.3% |
| Welsh | 20 | 0.3% | View All 40 Rows |
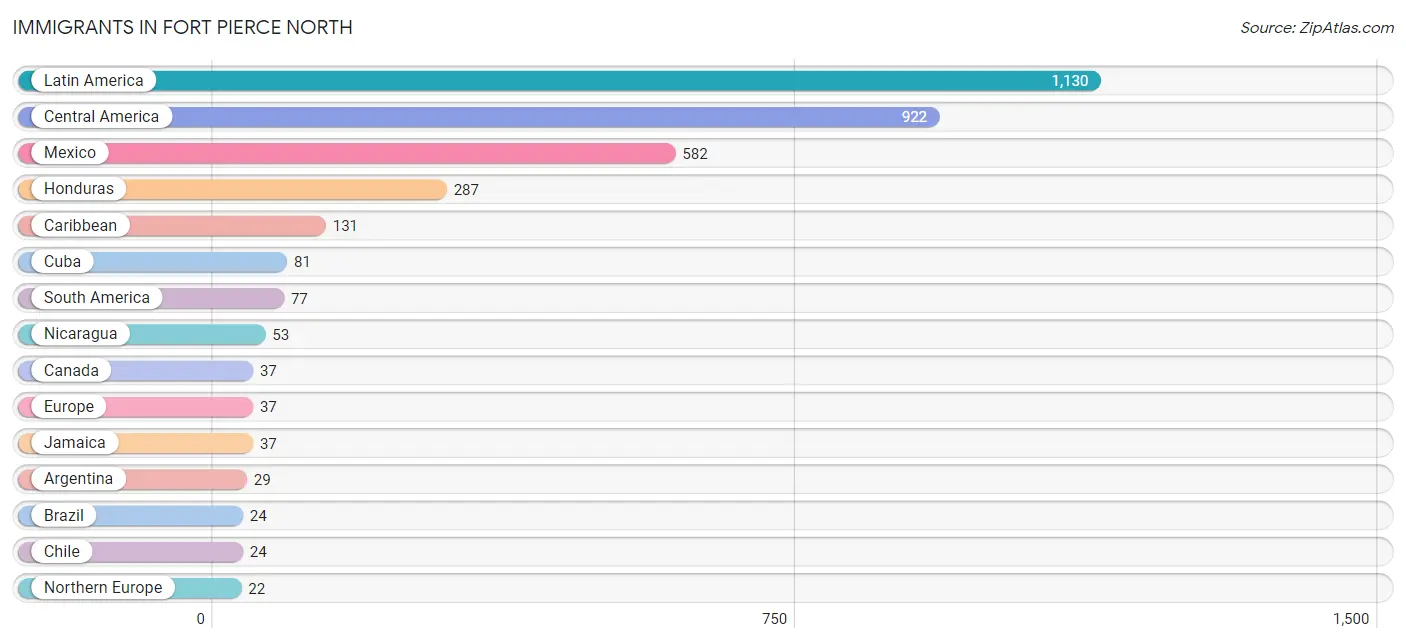
Immigrants in Fort Pierce North
The most numerous immigrant groups reported in Fort Pierce North came from Latin America (1,130 | 17.3%), Central America (922 | 14.1%), Mexico (582 | 8.9%), Honduras (287 | 4.4%), and Caribbean (131 | 2.0%), together accounting for 46.8% of all Fort Pierce North residents.
| Immigration Origin | # Population | % Population |
| Africa | 16 | 0.3% |
| Argentina | 29 | 0.4% |
| Brazil | 24 | 0.4% |
| Canada | 37 | 0.6% |
| Caribbean | 131 | 2.0% |
| Central America | 922 | 14.1% |
| Chile | 24 | 0.4% |
| Cuba | 81 | 1.2% |
| Denmark | 7 | 0.1% |
| England | 6 | 0.1% |
| Europe | 37 | 0.6% |
| Greece | 7 | 0.1% |
| Haiti | 13 | 0.2% |
| Honduras | 287 | 4.4% |
| Jamaica | 37 | 0.6% |
| Latin America | 1,130 | 17.3% |
| Mexico | 582 | 8.9% |
| Netherlands | 8 | 0.1% |
| Nicaragua | 53 | 0.8% |
| Northern Africa | 16 | 0.3% |
| Northern Europe | 22 | 0.3% |
| South America | 77 | 1.2% |
| Southern Europe | 7 | 0.1% |
| Sweden | 9 | 0.1% |
| Western Europe | 8 | 0.1% | View All 25 Rows |
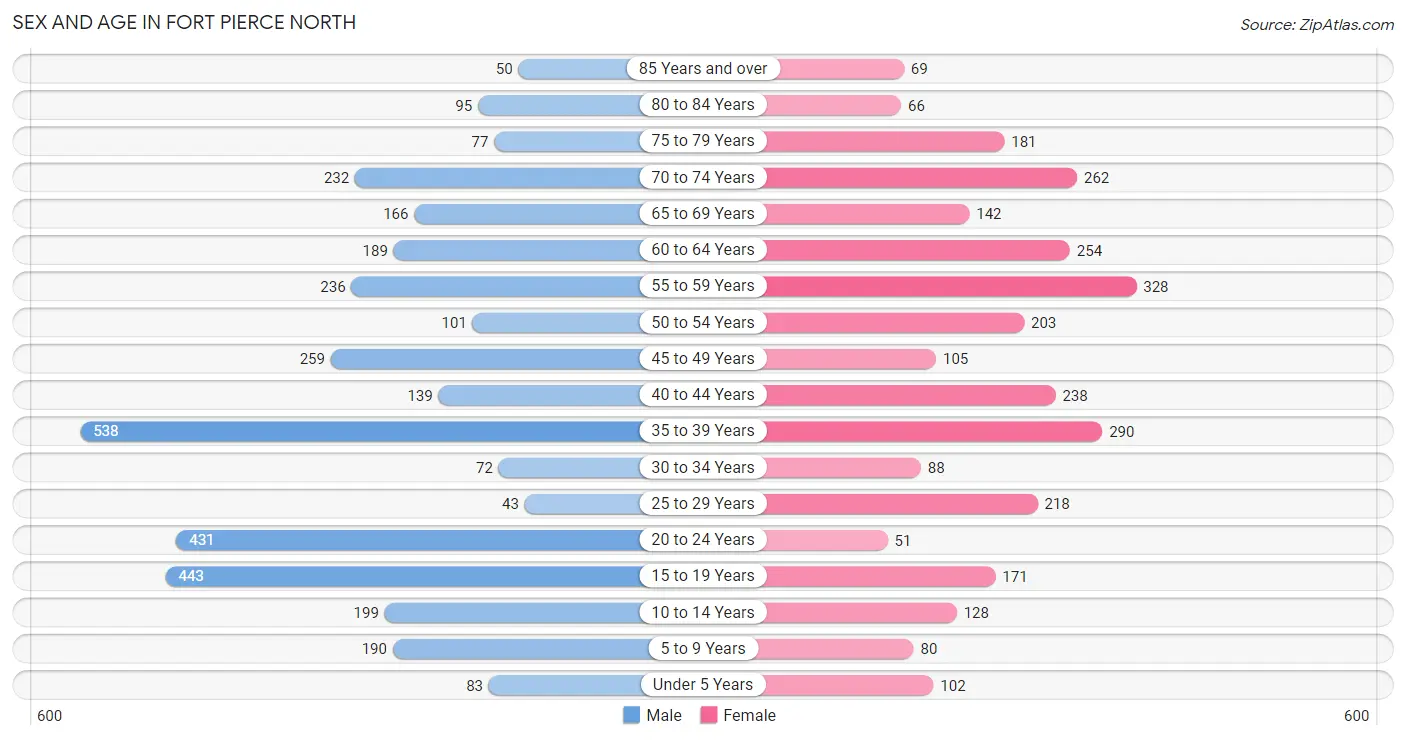
Sex and Age in Fort Pierce North
Sex and Age in Fort Pierce North
The most populous age groups in Fort Pierce North are 35 to 39 Years (538 | 15.2%) for men and 55 to 59 Years (328 | 11.0%) for women.
| Age Bracket | Male | Female |
| Under 5 Years | 83 (2.3%) | 102 (3.4%) |
| 5 to 9 Years | 190 (5.4%) | 80 (2.7%) |
| 10 to 14 Years | 199 (5.6%) | 128 (4.3%) |
| 15 to 19 Years | 443 (12.5%) | 171 (5.8%) |
| 20 to 24 Years | 431 (12.2%) | 51 (1.7%) |
| 25 to 29 Years | 43 (1.2%) | 218 (7.3%) |
| 30 to 34 Years | 72 (2.0%) | 88 (3.0%) |
| 35 to 39 Years | 538 (15.2%) | 290 (9.7%) |
| 40 to 44 Years | 139 (3.9%) | 238 (8.0%) |
| 45 to 49 Years | 259 (7.3%) | 105 (3.5%) |
| 50 to 54 Years | 101 (2.9%) | 203 (6.8%) |
| 55 to 59 Years | 236 (6.7%) | 328 (11.0%) |
| 60 to 64 Years | 189 (5.3%) | 254 (8.5%) |
| 65 to 69 Years | 166 (4.7%) | 142 (4.8%) |
| 70 to 74 Years | 232 (6.6%) | 262 (8.8%) |
| 75 to 79 Years | 77 (2.2%) | 181 (6.1%) |
| 80 to 84 Years | 95 (2.7%) | 66 (2.2%) |
| 85 Years and over | 50 (1.4%) | 69 (2.3%) |
| Total | 3,543 (100.0%) | 2,976 (100.0%) |
Families and Households in Fort Pierce North
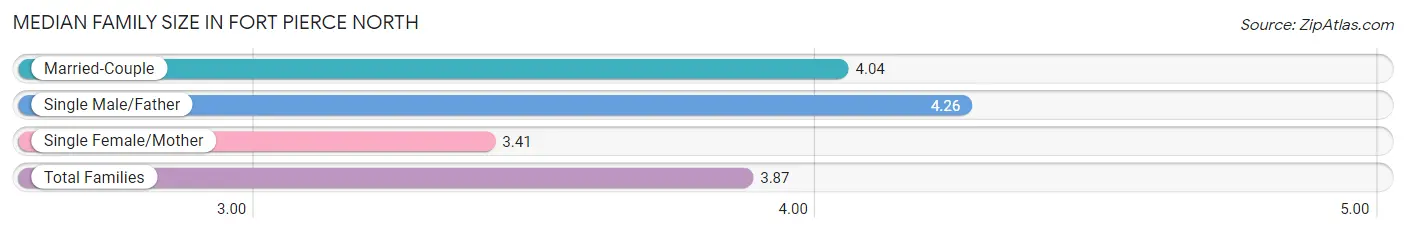
Median Family Size in Fort Pierce North
The median family size in Fort Pierce North is 3.87 persons per family, with single male/father families (179 | 13.5%) accounting for the largest median family size of 4.26 persons per family. On the other hand, single female/mother families (434 | 32.8%) represent the smallest median family size with 3.41 persons per family.
| Family Type | # Families | Family Size |
| Married-Couple | 709 (53.6%) | 4.04 |
| Single Male/Father | 179 (13.5%) | 4.26 |
| Single Female/Mother | 434 (32.8%) | 3.41 |
| Total Families | 1,322 (100.0%) | 3.87 |
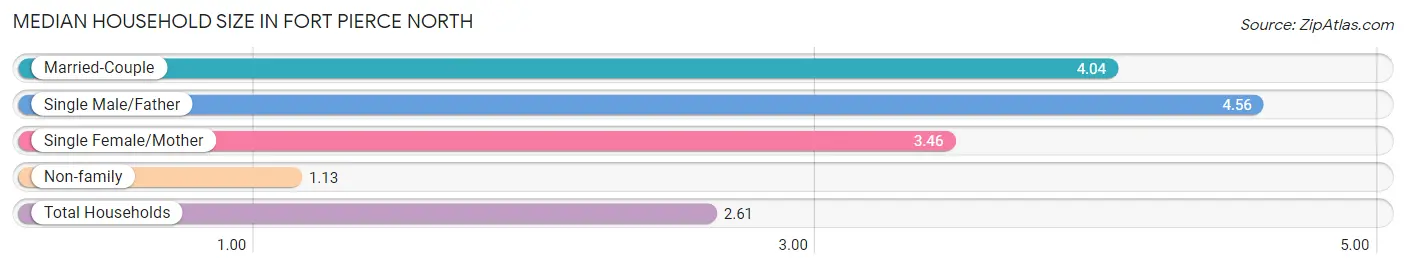
Median Household Size in Fort Pierce North
The median household size in Fort Pierce North is 2.61 persons per household, with single male/father households (179 | 7.2%) accounting for the largest median household size of 4.56 persons per household. non-family households (1,167 | 46.9%) represent the smallest median household size with 1.13 persons per household.
| Household Type | # Households | Household Size |
| Married-Couple | 709 (28.5%) | 4.04 |
| Single Male/Father | 179 (7.2%) | 4.56 |
| Single Female/Mother | 434 (17.4%) | 3.46 |
| Non-family | 1,167 (46.9%) | 1.13 |
| Total Households | 2,489 (100.0%) | 2.61 |
Household Size by Marriage Status in Fort Pierce North
Out of a total of 2,489 households in Fort Pierce North, 1,322 (53.1%) are family households, while 1,167 (46.9%) are nonfamily households. The most numerous type of family households are 2-person households, comprising 631, and the most common type of nonfamily households are 1-person households, comprising 1,028.
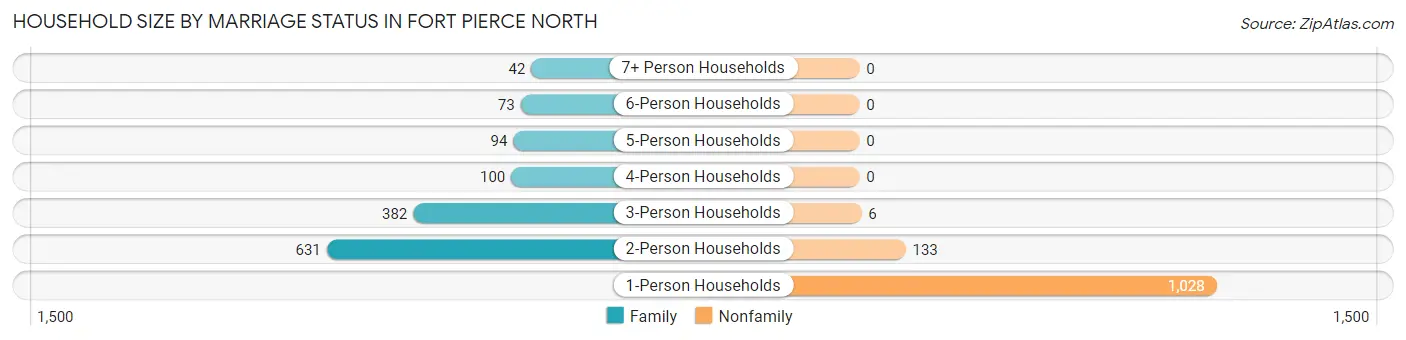
| Household Size | Family Households | Nonfamily Households |
| 1-Person Households | - | 1,028 (41.3%) |
| 2-Person Households | 631 (25.4%) | 133 (5.3%) |
| 3-Person Households | 382 (15.3%) | 6 (0.2%) |
| 4-Person Households | 100 (4.0%) | 0 (0.0%) |
| 5-Person Households | 94 (3.8%) | 0 (0.0%) |
| 6-Person Households | 73 (2.9%) | 0 (0.0%) |
| 7+ Person Households | 42 (1.7%) | 0 (0.0%) |
| Total | 1,322 (53.1%) | 1,167 (46.9%) |
Female Fertility in Fort Pierce North
Fertility by Age in Fort Pierce North
Average fertility rate in Fort Pierce North is 67.0 births per 1,000 women. Women in the age bracket of 20 to 34 years have the highest fertility rate with 162.0 births per 1,000 women. Women in the age bracket of 20 to 34 years acount for 74.4% of all women with births.
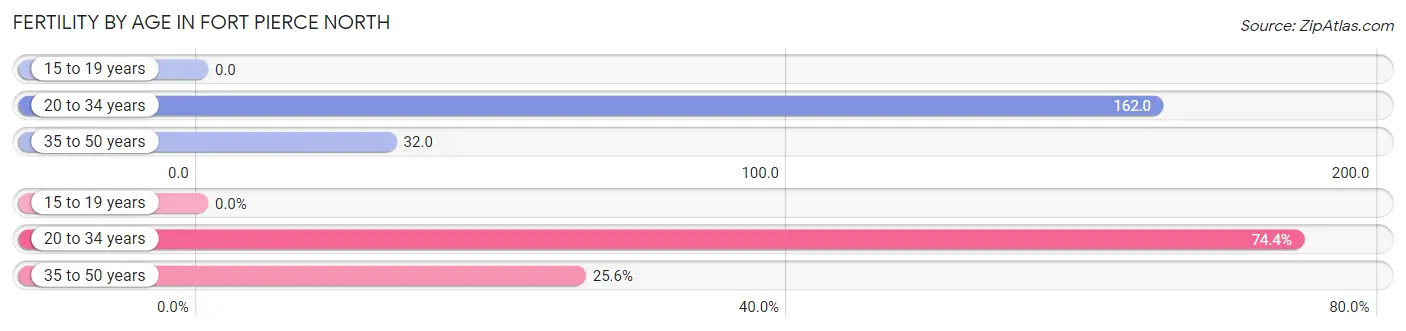
| Age Bracket | Women with Births | Births / 1,000 Women |
| 15 to 19 years | 0 (0.0%) | 0.0 |
| 20 to 34 years | 58 (74.4%) | 162.0 |
| 35 to 50 years | 20 (25.6%) | 32.0 |
| Total | 78 (100.0%) | 67.0 |
Fertility by Age by Marriage Status in Fort Pierce North
60.3% of women with births (78) in Fort Pierce North are married. The highest percentage of unmarried women with births falls into 20 to 34 years age bracket with 53.4% of them unmarried at the time of birth, while the lowest percentage of unmarried women with births belong to 35 to 50 years age bracket with 0.0% of them unmarried.
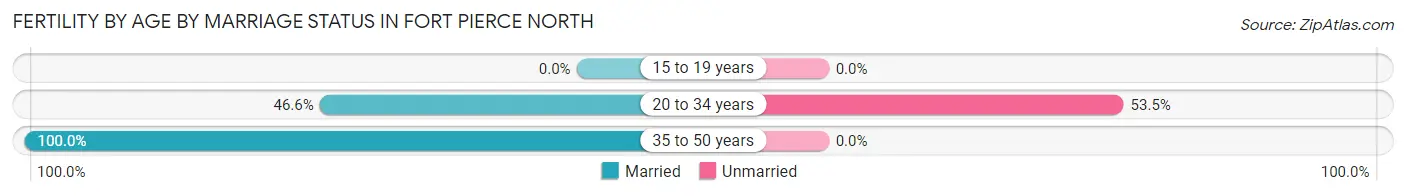
| Age Bracket | Married | Unmarried |
| 15 to 19 years | 0 (0.0%) | 0 (0.0%) |
| 20 to 34 years | 27 (46.6%) | 31 (53.4%) |
| 35 to 50 years | 20 (100.0%) | 0 (0.0%) |
| Total | 47 (60.3%) | 31 (39.7%) |
Fertility by Education in Fort Pierce North
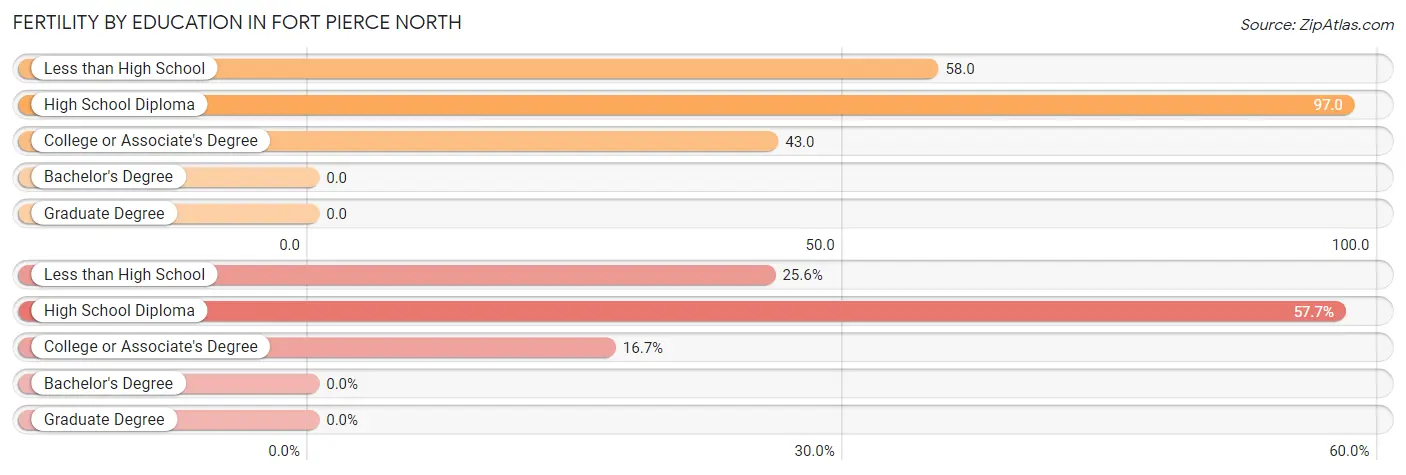
| Educational Attainment | Women with Births | Births / 1,000 Women |
| Less than High School | 20 (25.6%) | 58.0 |
| High School Diploma | 45 (57.7%) | 97.0 |
| College or Associate's Degree | 13 (16.7%) | 43.0 |
| Bachelor's Degree | 0 (0.0%) | 0.0 |
| Graduate Degree | 0 (0.0%) | 0.0 |
| Total | 78 (100.0%) | 67.0 |
Fertility by Education by Marriage Status in Fort Pierce North
39.7% of women with births in Fort Pierce North are unmarried. Women with the educational attainment of less than high school are most likely to be married with 100.0% of them married at childbirth, while women with the educational attainment of high school diploma are least likely to be married with 68.9% of them unmarried at childbirth.
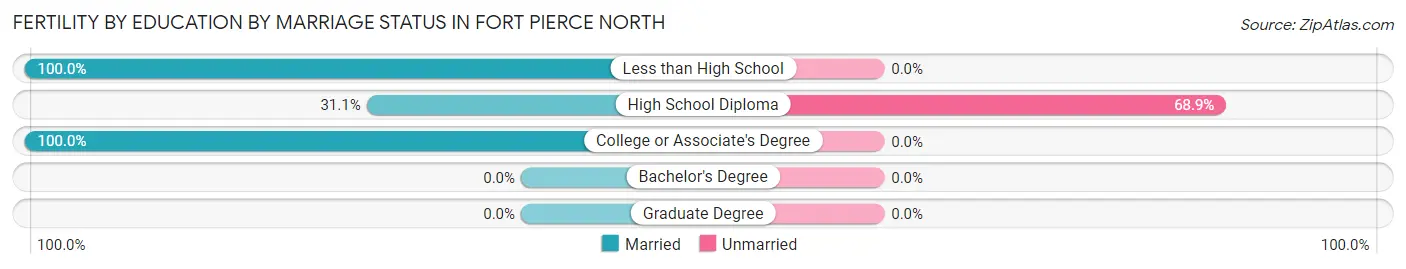
| Educational Attainment | Married | Unmarried |
| Less than High School | 20 (100.0%) | 0 (0.0%) |
| High School Diploma | 14 (31.1%) | 31 (68.9%) |
| College or Associate's Degree | 13 (100.0%) | 0 (0.0%) |
| Bachelor's Degree | 0 (0.0%) | 0 (0.0%) |
| Graduate Degree | 0 (0.0%) | 0 (0.0%) |
| Total | 47 (60.3%) | 31 (39.7%) |
Employment Characteristics in Fort Pierce North
Employment by Class of Employer in Fort Pierce North
Among the 2,541 employed individuals in Fort Pierce North, private company employees (1,821 | 71.7%), local government employees (373 | 14.7%), and self-employed (not incorporated) (131 | 5.2%) make up the most common classes of employment.
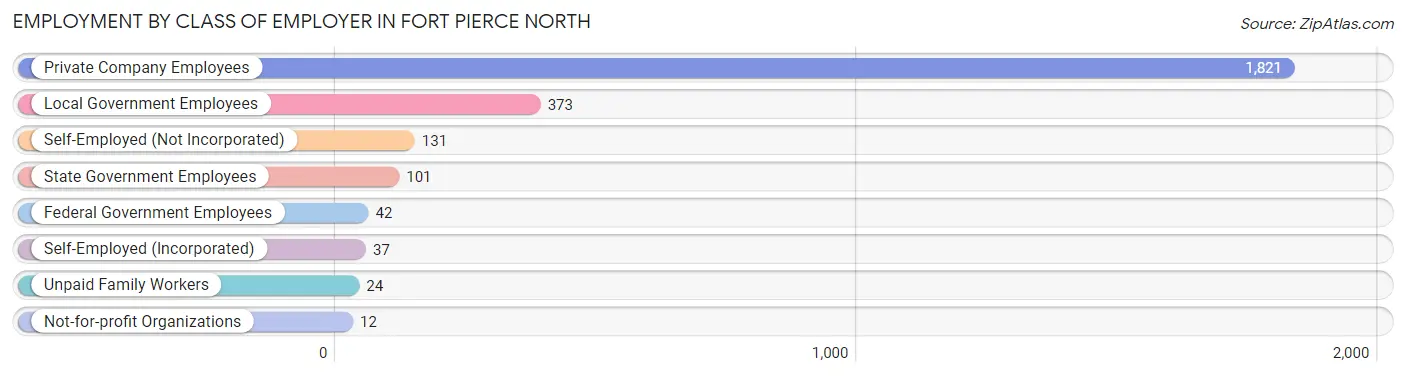
| Employer Class | # Employees | % Employees |
| Private Company Employees | 1,821 | 71.7% |
| Self-Employed (Incorporated) | 37 | 1.5% |
| Self-Employed (Not Incorporated) | 131 | 5.2% |
| Not-for-profit Organizations | 12 | 0.5% |
| Local Government Employees | 373 | 14.7% |
| State Government Employees | 101 | 4.0% |
| Federal Government Employees | 42 | 1.7% |
| Unpaid Family Workers | 24 | 0.9% |
| Total | 2,541 | 100.0% |
Employment Status by Age in Fort Pierce North
According to the labor force statistics for Fort Pierce North, out of the total population over 16 years of age (5,644), 47.5% or 2,681 individuals are in the labor force, with 5.2% or 139 of them unemployed. The age group with the highest labor force participation rate is 20 to 24 years, with 94.4% or 455 individuals in the labor force. Within the labor force, the 30 to 34 years age range has the highest percentage of unemployed individuals, with 16.6% or 24 of them being unemployed.
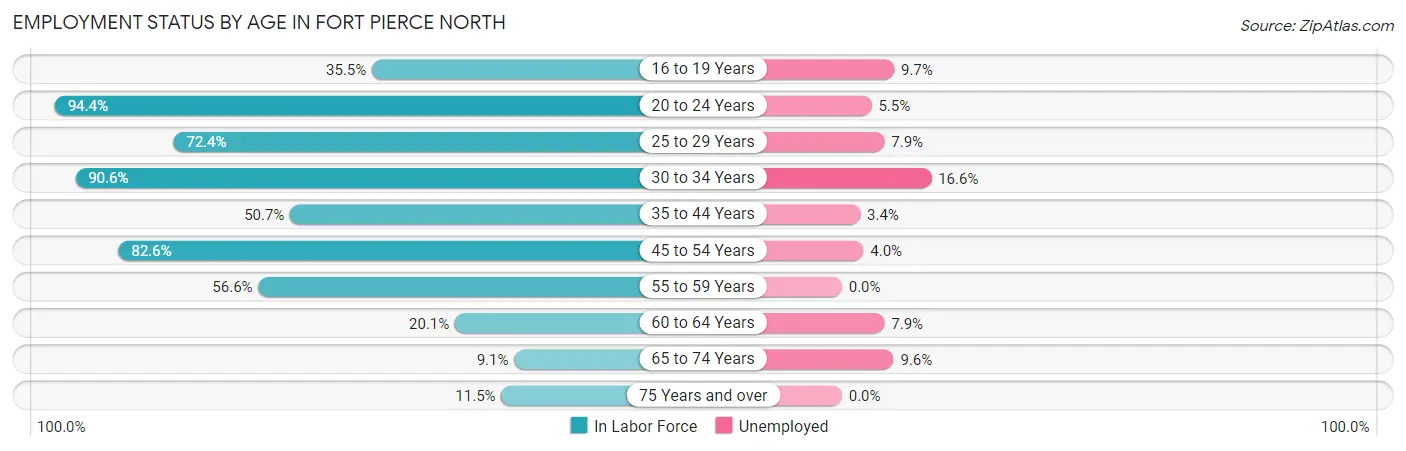
| Age Bracket | In Labor Force | Unemployed |
| 16 to 19 Years | 185 (35.5%) | 18 (9.7%) |
| 20 to 24 Years | 455 (94.4%) | 25 (5.5%) |
| 25 to 29 Years | 189 (72.4%) | 15 (7.9%) |
| 30 to 34 Years | 145 (90.6%) | 24 (16.6%) |
| 35 to 44 Years | 611 (50.7%) | 21 (3.4%) |
| 45 to 54 Years | 552 (82.6%) | 22 (4.0%) |
| 55 to 59 Years | 319 (56.6%) | 0 (0.0%) |
| 60 to 64 Years | 89 (20.1%) | 7 (7.9%) |
| 65 to 74 Years | 73 (9.1%) | 7 (9.6%) |
| 75 Years and over | 62 (11.5%) | 0 (0.0%) |
| Total | 2,681 (47.5%) | 139 (5.2%) |
Employment Status by Educational Attainment in Fort Pierce North
According to labor force statistics for Fort Pierce North, 57.7% of individuals (1,905) out of the total population between 25 and 64 years of age (3,301) are in the labor force, with 4.7% or 90 of them being unemployed. The group with the highest labor force participation rate are those with the educational attainment of bachelor's degree or higher, with 85.2% or 327 individuals in the labor force. Within the labor force, individuals with bachelor's degree or higher education have the highest percentage of unemployment, with 10.4% or 34 of them being unemployed.
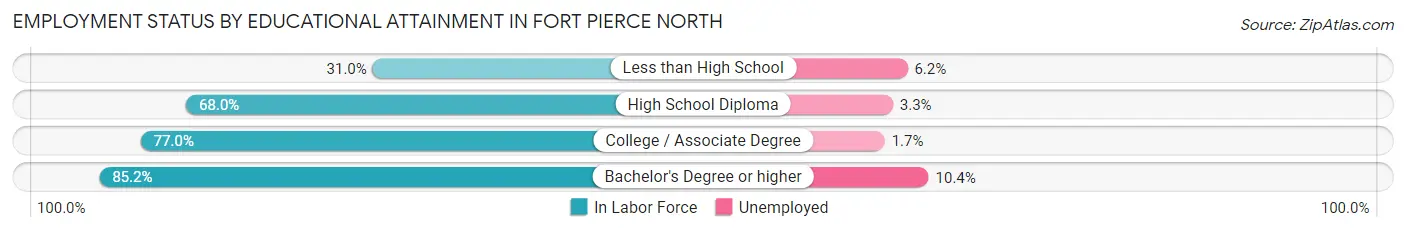
| Educational Attainment | In Labor Force | Unemployed |
| Less than High School | 390 (31.0%) | 78 (6.2%) |
| High School Diploma | 670 (68.0%) | 33 (3.3%) |
| College / Associate Degree | 518 (77.0%) | 11 (1.7%) |
| Bachelor's Degree or higher | 327 (85.2%) | 40 (10.4%) |
| Total | 1,905 (57.7%) | 155 (4.7%) |
Employment Occupations by Sex in Fort Pierce North
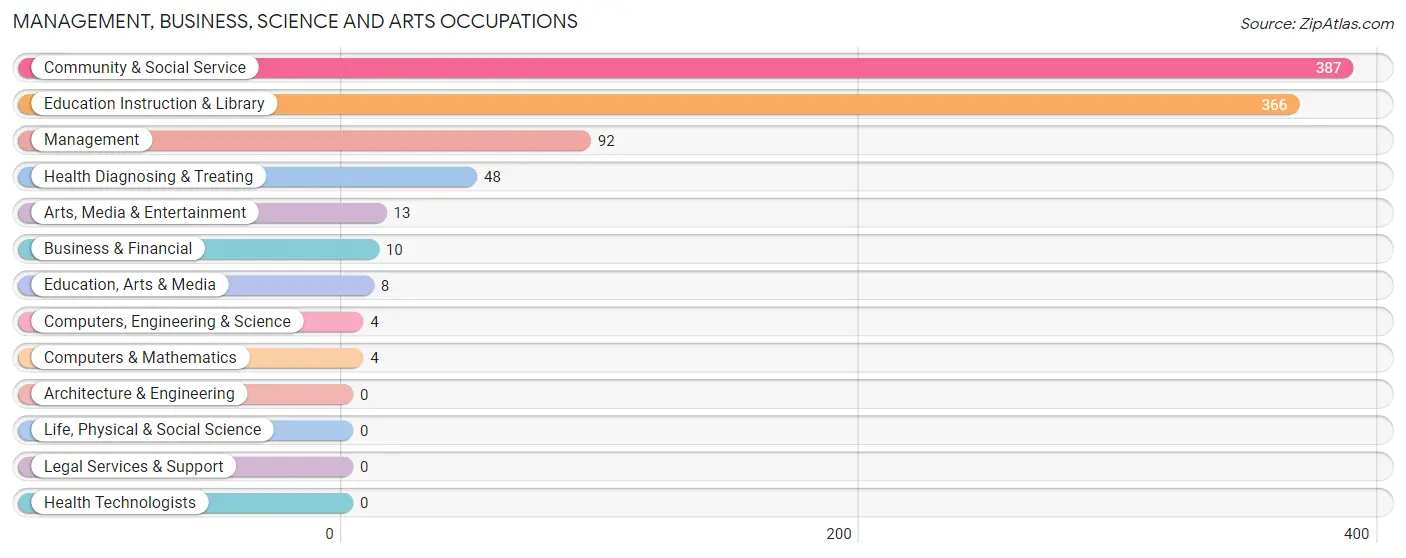
Management, Business, Science and Arts Occupations
The most common Management, Business, Science and Arts occupations in Fort Pierce North are Community & Social Service (387 | 15.2%), Education Instruction & Library (366 | 14.4%), Management (92 | 3.6%), Health Diagnosing & Treating (48 | 1.9%), and Arts, Media & Entertainment (13 | 0.5%).
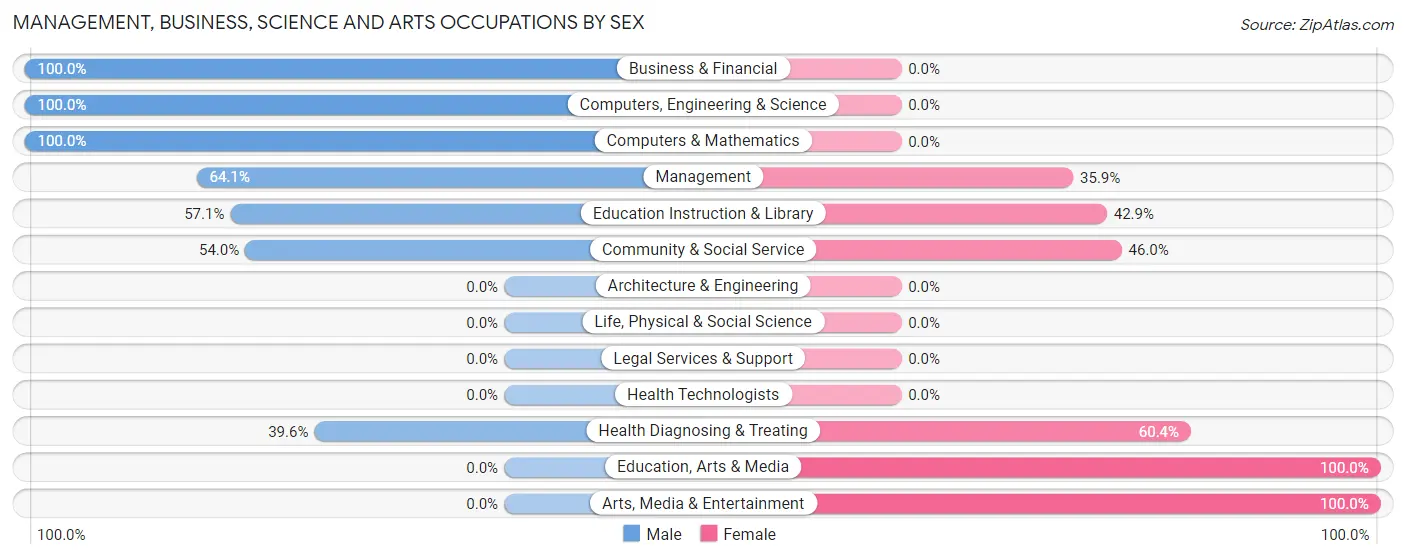
Management, Business, Science and Arts Occupations by Sex
Within the Management, Business, Science and Arts occupations in Fort Pierce North, the most male-oriented occupations are Business & Financial (100.0%), Computers, Engineering & Science (100.0%), and Computers & Mathematics (100.0%), while the most female-oriented occupations are Education, Arts & Media (100.0%), Arts, Media & Entertainment (100.0%), and Health Diagnosing & Treating (60.4%).
| Occupation | Male | Female |
| Management | 59 (64.1%) | 33 (35.9%) |
| Business & Financial | 10 (100.0%) | 0 (0.0%) |
| Computers, Engineering & Science | 4 (100.0%) | 0 (0.0%) |
| Computers & Mathematics | 4 (100.0%) | 0 (0.0%) |
| Architecture & Engineering | 0 (0.0%) | 0 (0.0%) |
| Life, Physical & Social Science | 0 (0.0%) | 0 (0.0%) |
| Community & Social Service | 209 (54.0%) | 178 (46.0%) |
| Education, Arts & Media | 0 (0.0%) | 8 (100.0%) |
| Legal Services & Support | 0 (0.0%) | 0 (0.0%) |
| Education Instruction & Library | 209 (57.1%) | 157 (42.9%) |
| Arts, Media & Entertainment | 0 (0.0%) | 13 (100.0%) |
| Health Diagnosing & Treating | 19 (39.6%) | 29 (60.4%) |
| Health Technologists | 0 (0.0%) | 0 (0.0%) |
| Total (Category) | 301 (55.6%) | 240 (44.4%) |
| Total (Overall) | 1,254 (49.3%) | 1,287 (50.6%) |
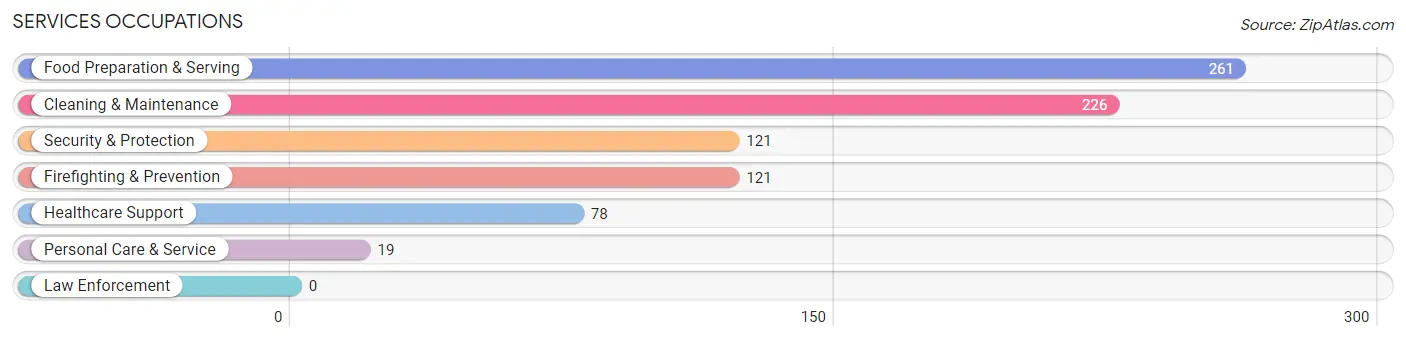
Services Occupations
The most common Services occupations in Fort Pierce North are Food Preparation & Serving (261 | 10.3%), Cleaning & Maintenance (226 | 8.9%), Security & Protection (121 | 4.8%), Firefighting & Prevention (121 | 4.8%), and Healthcare Support (78 | 3.1%).
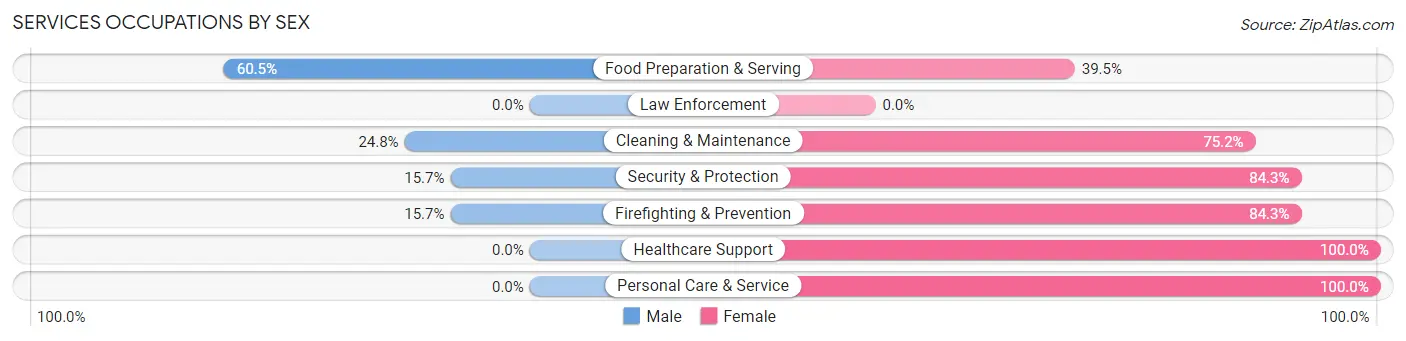
Services Occupations by Sex
Within the Services occupations in Fort Pierce North, the most male-oriented occupations are Food Preparation & Serving (60.5%), Cleaning & Maintenance (24.8%), and Security & Protection (15.7%), while the most female-oriented occupations are Healthcare Support (100.0%), Personal Care & Service (100.0%), and Security & Protection (84.3%).
| Occupation | Male | Female |
| Healthcare Support | 0 (0.0%) | 78 (100.0%) |
| Security & Protection | 19 (15.7%) | 102 (84.3%) |
| Firefighting & Prevention | 19 (15.7%) | 102 (84.3%) |
| Law Enforcement | 0 (0.0%) | 0 (0.0%) |
| Food Preparation & Serving | 158 (60.5%) | 103 (39.5%) |
| Cleaning & Maintenance | 56 (24.8%) | 170 (75.2%) |
| Personal Care & Service | 0 (0.0%) | 19 (100.0%) |
| Total (Category) | 233 (33.1%) | 472 (66.9%) |
| Total (Overall) | 1,254 (49.3%) | 1,287 (50.6%) |
Sales and Office Occupations
The most common Sales and Office occupations in Fort Pierce North are Sales & Related (338 | 13.3%), and Office & Administration (274 | 10.8%).
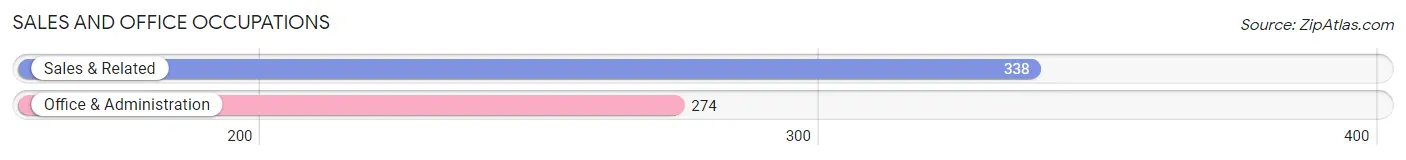
Sales and Office Occupations by Sex

| Occupation | Male | Female |
| Sales & Related | 174 (51.5%) | 164 (48.5%) |
| Office & Administration | 20 (7.3%) | 254 (92.7%) |
| Total (Category) | 194 (31.7%) | 418 (68.3%) |
| Total (Overall) | 1,254 (49.3%) | 1,287 (50.6%) |
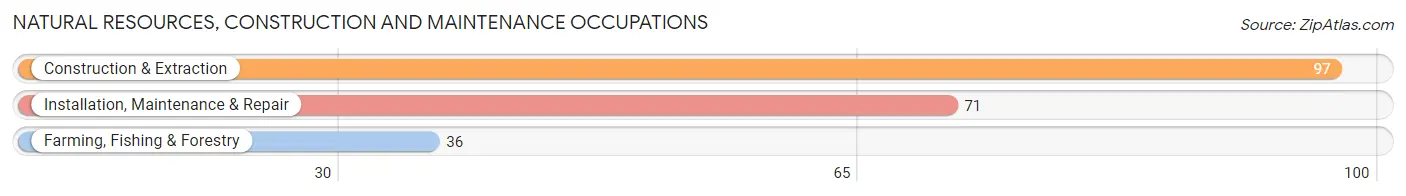
Natural Resources, Construction and Maintenance Occupations
The most common Natural Resources, Construction and Maintenance occupations in Fort Pierce North are Construction & Extraction (97 | 3.8%), Installation, Maintenance & Repair (71 | 2.8%), and Farming, Fishing & Forestry (36 | 1.4%).
Natural Resources, Construction and Maintenance Occupations by Sex
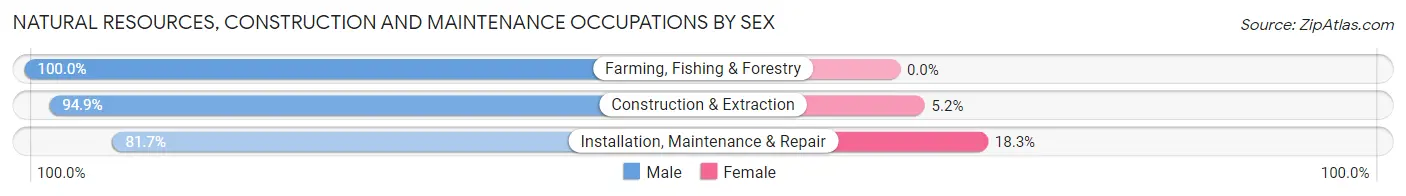
| Occupation | Male | Female |
| Farming, Fishing & Forestry | 36 (100.0%) | 0 (0.0%) |
| Construction & Extraction | 92 (94.9%) | 5 (5.1%) |
| Installation, Maintenance & Repair | 58 (81.7%) | 13 (18.3%) |
| Total (Category) | 186 (91.2%) | 18 (8.8%) |
| Total (Overall) | 1,254 (49.3%) | 1,287 (50.6%) |
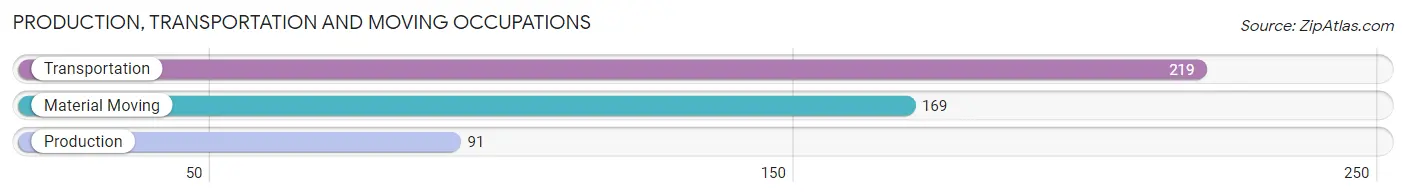
Production, Transportation and Moving Occupations
The most common Production, Transportation and Moving occupations in Fort Pierce North are Transportation (219 | 8.6%), Material Moving (169 | 6.7%), and Production (91 | 3.6%).
Production, Transportation and Moving Occupations by Sex
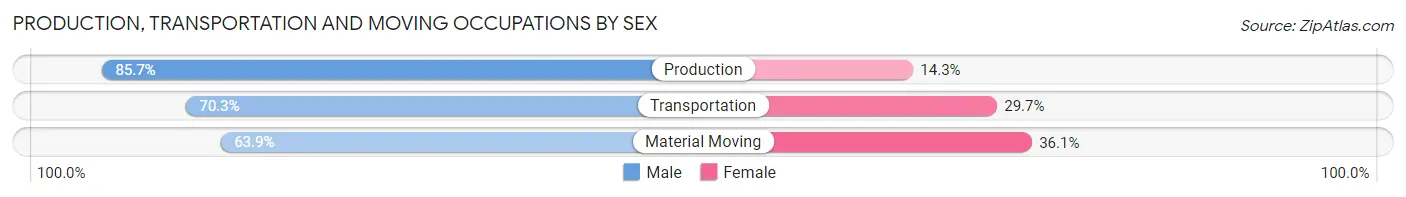
| Occupation | Male | Female |
| Production | 78 (85.7%) | 13 (14.3%) |
| Transportation | 154 (70.3%) | 65 (29.7%) |
| Material Moving | 108 (63.9%) | 61 (36.1%) |
| Total (Category) | 340 (71.0%) | 139 (29.0%) |
| Total (Overall) | 1,254 (49.3%) | 1,287 (50.6%) |
Employment Industries by Sex in Fort Pierce North
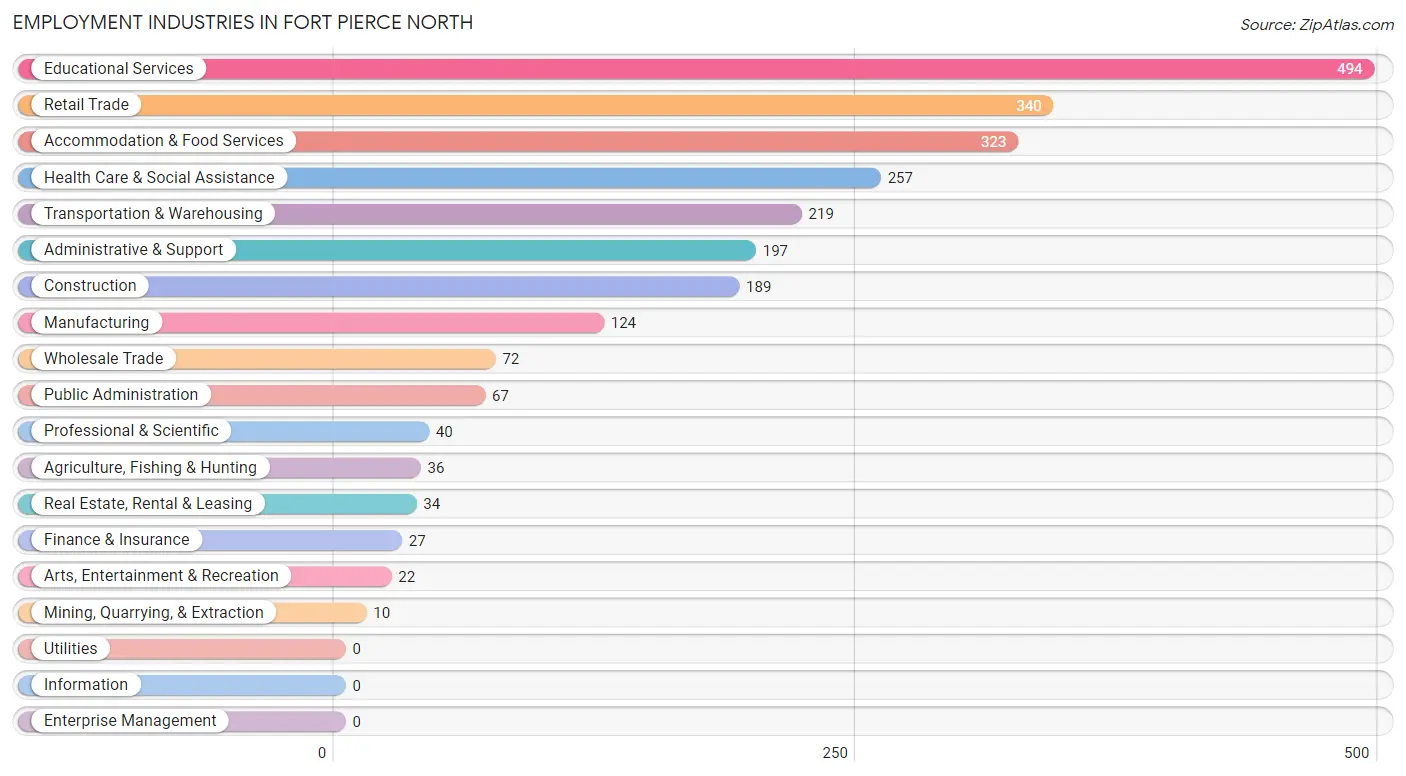
Employment Industries in Fort Pierce North
The major employment industries in Fort Pierce North include Educational Services (494 | 19.4%), Retail Trade (340 | 13.4%), Accommodation & Food Services (323 | 12.7%), Health Care & Social Assistance (257 | 10.1%), and Transportation & Warehousing (219 | 8.6%).
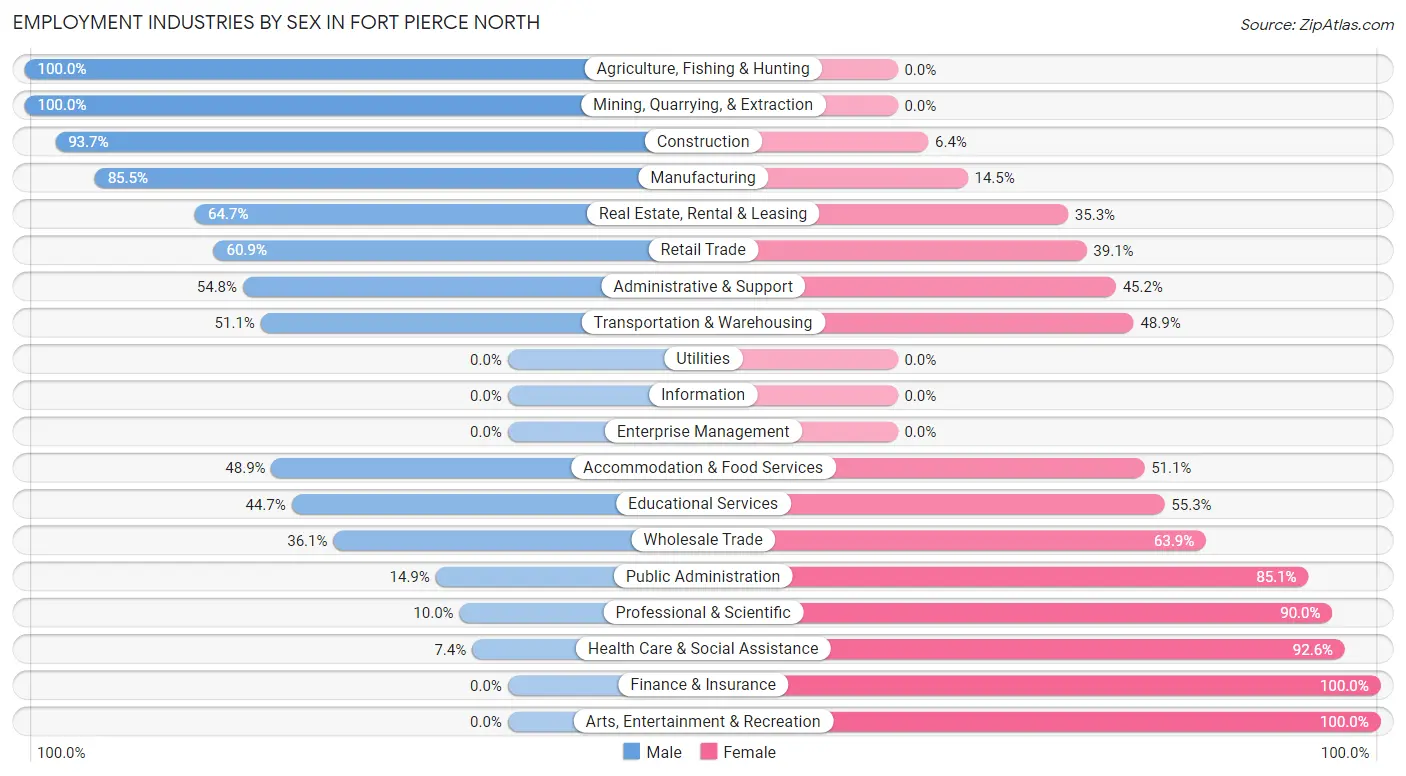
Employment Industries by Sex in Fort Pierce North
The Fort Pierce North industries that see more men than women are Agriculture, Fishing & Hunting (100.0%), Mining, Quarrying, & Extraction (100.0%), and Construction (93.6%), whereas the industries that tend to have a higher number of women are Finance & Insurance (100.0%), Arts, Entertainment & Recreation (100.0%), and Health Care & Social Assistance (92.6%).
| Industry | Male | Female |
| Agriculture, Fishing & Hunting | 36 (100.0%) | 0 (0.0%) |
| Mining, Quarrying, & Extraction | 10 (100.0%) | 0 (0.0%) |
| Construction | 177 (93.6%) | 12 (6.4%) |
| Manufacturing | 106 (85.5%) | 18 (14.5%) |
| Wholesale Trade | 26 (36.1%) | 46 (63.9%) |
| Retail Trade | 207 (60.9%) | 133 (39.1%) |
| Transportation & Warehousing | 112 (51.1%) | 107 (48.9%) |
| Utilities | 0 (0.0%) | 0 (0.0%) |
| Information | 0 (0.0%) | 0 (0.0%) |
| Finance & Insurance | 0 (0.0%) | 27 (100.0%) |
| Real Estate, Rental & Leasing | 22 (64.7%) | 12 (35.3%) |
| Professional & Scientific | 4 (10.0%) | 36 (90.0%) |
| Enterprise Management | 0 (0.0%) | 0 (0.0%) |
| Administrative & Support | 108 (54.8%) | 89 (45.2%) |
| Educational Services | 221 (44.7%) | 273 (55.3%) |
| Health Care & Social Assistance | 19 (7.4%) | 238 (92.6%) |
| Arts, Entertainment & Recreation | 0 (0.0%) | 22 (100.0%) |
| Accommodation & Food Services | 158 (48.9%) | 165 (51.1%) |
| Public Administration | 10 (14.9%) | 57 (85.1%) |
| Total | 1,254 (49.3%) | 1,287 (50.6%) |
Education in Fort Pierce North
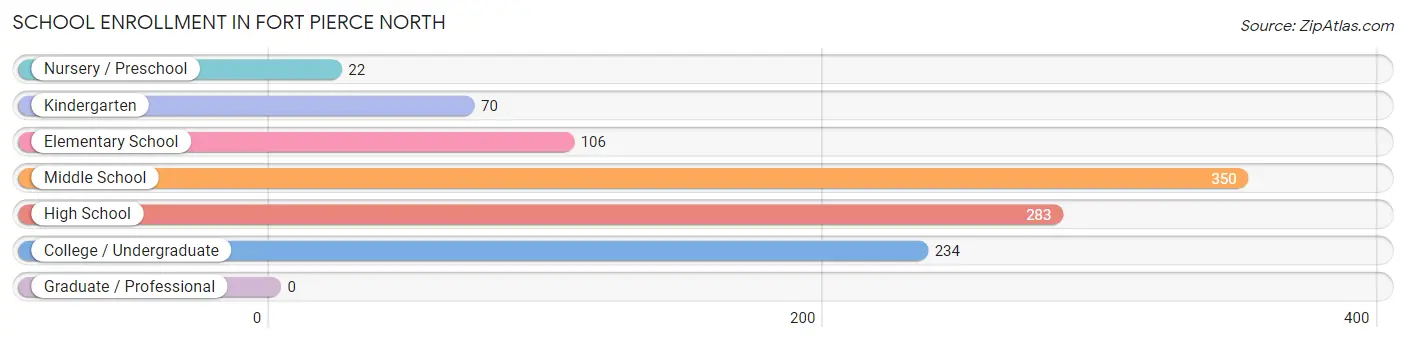
School Enrollment in Fort Pierce North
The most common levels of schooling among the 1,065 students in Fort Pierce North are middle school (350 | 32.9%), high school (283 | 26.6%), and college / undergraduate (234 | 22.0%).
| School Level | # Students | % Students |
| Nursery / Preschool | 22 | 2.1% |
| Kindergarten | 70 | 6.6% |
| Elementary School | 106 | 10.0% |
| Middle School | 350 | 32.9% |
| High School | 283 | 26.6% |
| College / Undergraduate | 234 | 22.0% |
| Graduate / Professional | 0 | 0.0% |
| Total | 1,065 | 100.0% |
School Enrollment by Age by Funding Source in Fort Pierce North
Out of a total of 1,065 students who are enrolled in schools in Fort Pierce North, 45 (4.2%) attend a private institution, while the remaining 1,020 (95.8%) are enrolled in public schools. The age group of 18 to 19 year olds has the highest likelihood of being enrolled in private schools, with 8 (100.0% in the age bracket) enrolled. Conversely, the age group of 3 to 4 year olds has the lowest likelihood of being enrolled in a private school, with 14 (100.0% in the age bracket) attending a public institution.
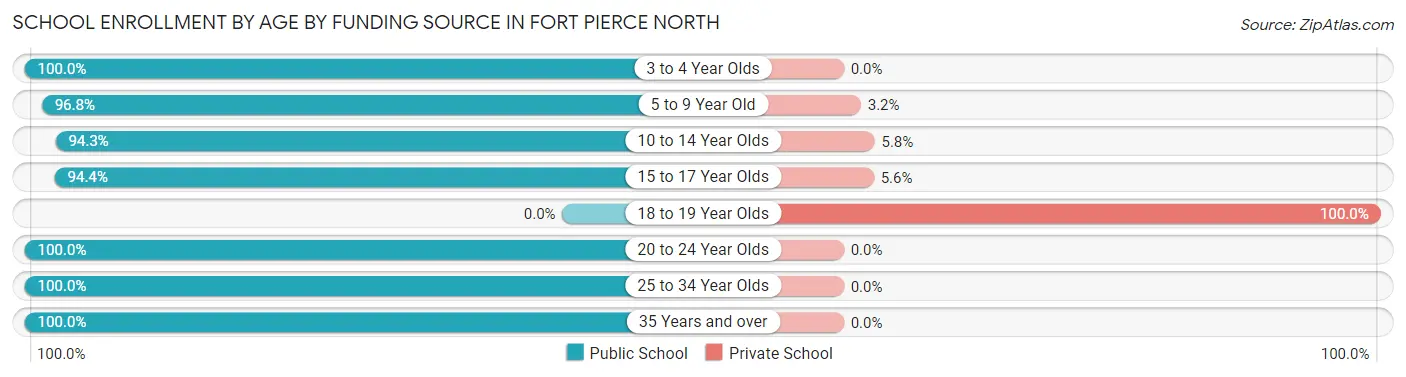
| Age Bracket | Public School | Private School |
| 3 to 4 Year Olds | 14 (100.0%) | 0 (0.0%) |
| 5 to 9 Year Old | 243 (96.8%) | 8 (3.2%) |
| 10 to 14 Year Olds | 246 (94.3%) | 15 (5.8%) |
| 15 to 17 Year Olds | 236 (94.4%) | 14 (5.6%) |
| 18 to 19 Year Olds | 0 (0.0%) | 8 (100.0%) |
| 20 to 24 Year Olds | 80 (100.0%) | 0 (0.0%) |
| 25 to 34 Year Olds | 40 (100.0%) | 0 (0.0%) |
| 35 Years and over | 161 (100.0%) | 0 (0.0%) |
| Total | 1,020 (95.8%) | 45 (4.2%) |
Educational Attainment by Field of Study in Fort Pierce North
Science & technology (262 | 43.8%), education (203 | 34.0%), arts & humanities (33 | 5.5%), business (29 | 4.9%), and engineering (24 | 4.0%) are the most common fields of study among 598 individuals in Fort Pierce North who have obtained a bachelor's degree or higher.
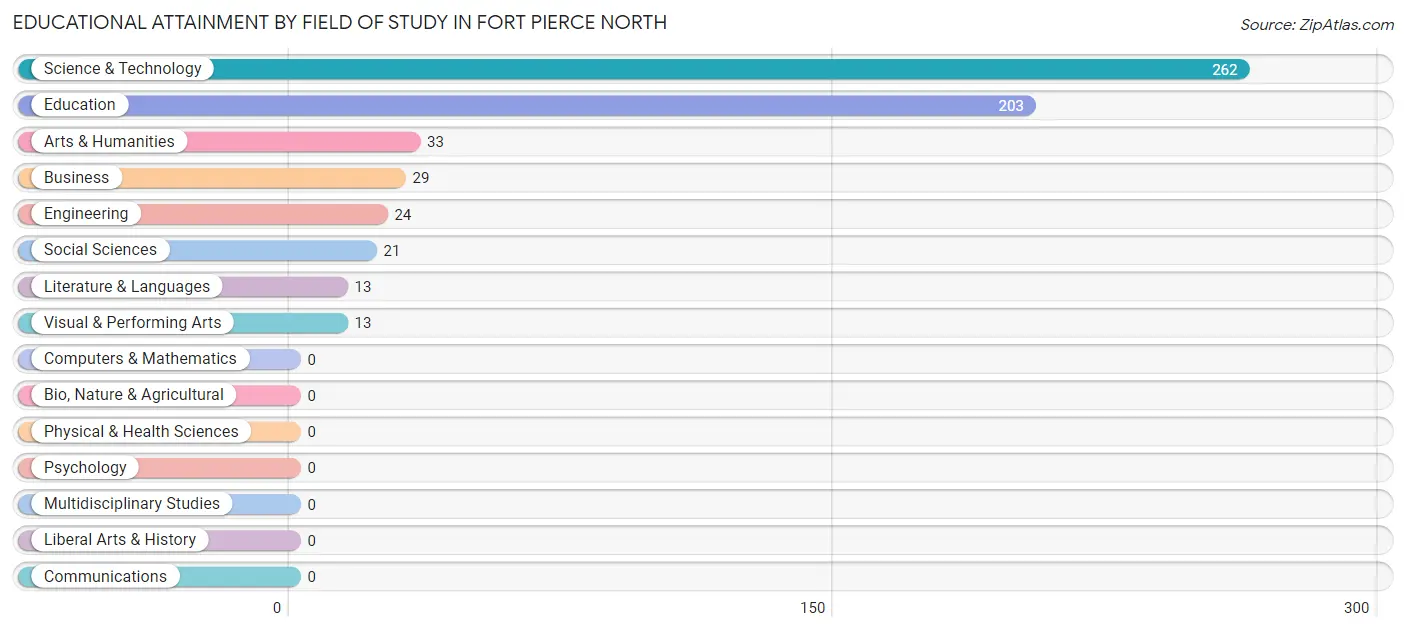
| Field of Study | # Graduates | % Graduates |
| Computers & Mathematics | 0 | 0.0% |
| Bio, Nature & Agricultural | 0 | 0.0% |
| Physical & Health Sciences | 0 | 0.0% |
| Psychology | 0 | 0.0% |
| Social Sciences | 21 | 3.5% |
| Engineering | 24 | 4.0% |
| Multidisciplinary Studies | 0 | 0.0% |
| Science & Technology | 262 | 43.8% |
| Business | 29 | 4.9% |
| Education | 203 | 34.0% |
| Literature & Languages | 13 | 2.2% |
| Liberal Arts & History | 0 | 0.0% |
| Visual & Performing Arts | 13 | 2.2% |
| Communications | 0 | 0.0% |
| Arts & Humanities | 33 | 5.5% |
| Total | 598 | 100.0% |
Transportation & Commute in Fort Pierce North
Vehicle Availability by Sex in Fort Pierce North
The most prevalent vehicle ownership categories in Fort Pierce North are males with 2 vehicles (494, accounting for 39.5%) and females with 2 vehicles (457, making up 38.4%).
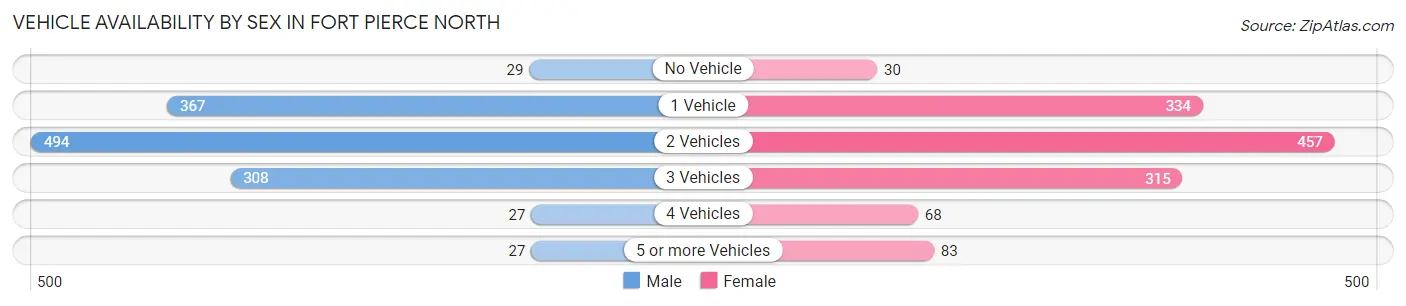
| Vehicles Available | Male | Female |
| No Vehicle | 29 (2.3%) | 30 (2.3%) |
| 1 Vehicle | 367 (29.3%) | 334 (26.0%) |
| 2 Vehicles | 494 (39.5%) | 457 (35.5%) |
| 3 Vehicles | 308 (24.6%) | 315 (24.5%) |
| 4 Vehicles | 27 (2.2%) | 68 (5.3%) |
| 5 or more Vehicles | 27 (2.2%) | 83 (6.5%) |
| Total | 1,252 (100.0%) | 1,287 (100.0%) |
Commute Time in Fort Pierce North
The most frequently occuring commute durations in Fort Pierce North are 10 to 14 minutes (876 commuters, 34.8%), 15 to 19 minutes (435 commuters, 17.3%), and 30 to 34 minutes (396 commuters, 15.7%).
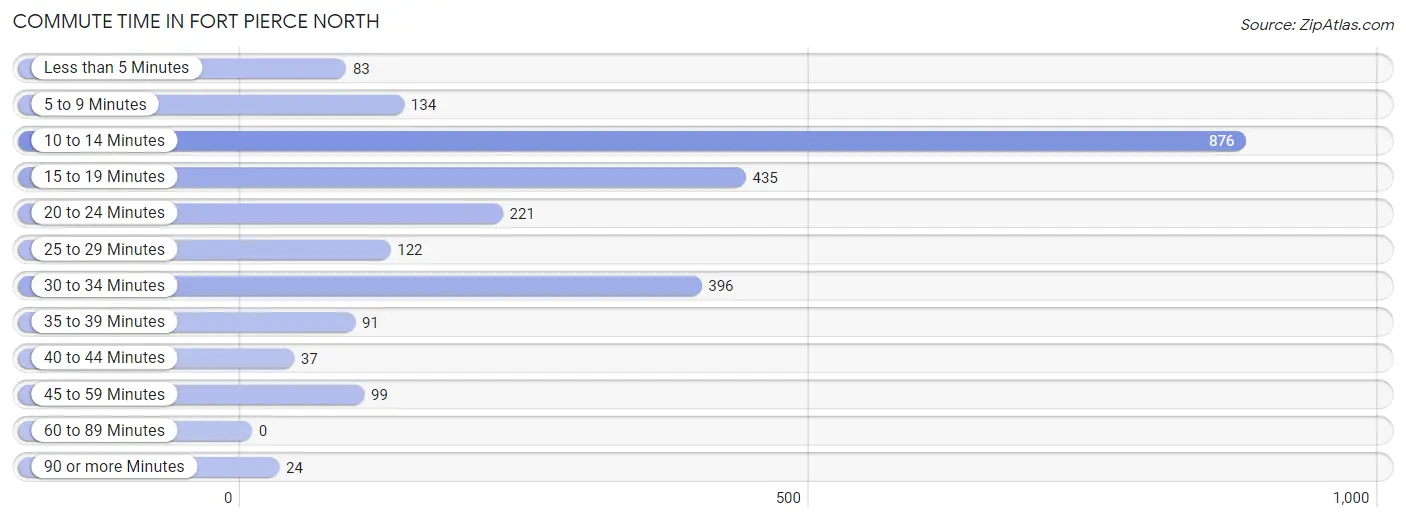
| Commute Time | # Commuters | % Commuters |
| Less than 5 Minutes | 83 | 3.3% |
| 5 to 9 Minutes | 134 | 5.3% |
| 10 to 14 Minutes | 876 | 34.8% |
| 15 to 19 Minutes | 435 | 17.3% |
| 20 to 24 Minutes | 221 | 8.8% |
| 25 to 29 Minutes | 122 | 4.9% |
| 30 to 34 Minutes | 396 | 15.7% |
| 35 to 39 Minutes | 91 | 3.6% |
| 40 to 44 Minutes | 37 | 1.5% |
| 45 to 59 Minutes | 99 | 3.9% |
| 60 to 89 Minutes | 0 | 0.0% |
| 90 or more Minutes | 24 | 0.9% |
Commute Time by Sex in Fort Pierce North
The most common commute times in Fort Pierce North are 10 to 14 minutes (543 commuters, 43.4%) for males and 10 to 14 minutes (333 commuters, 26.3%) for females.
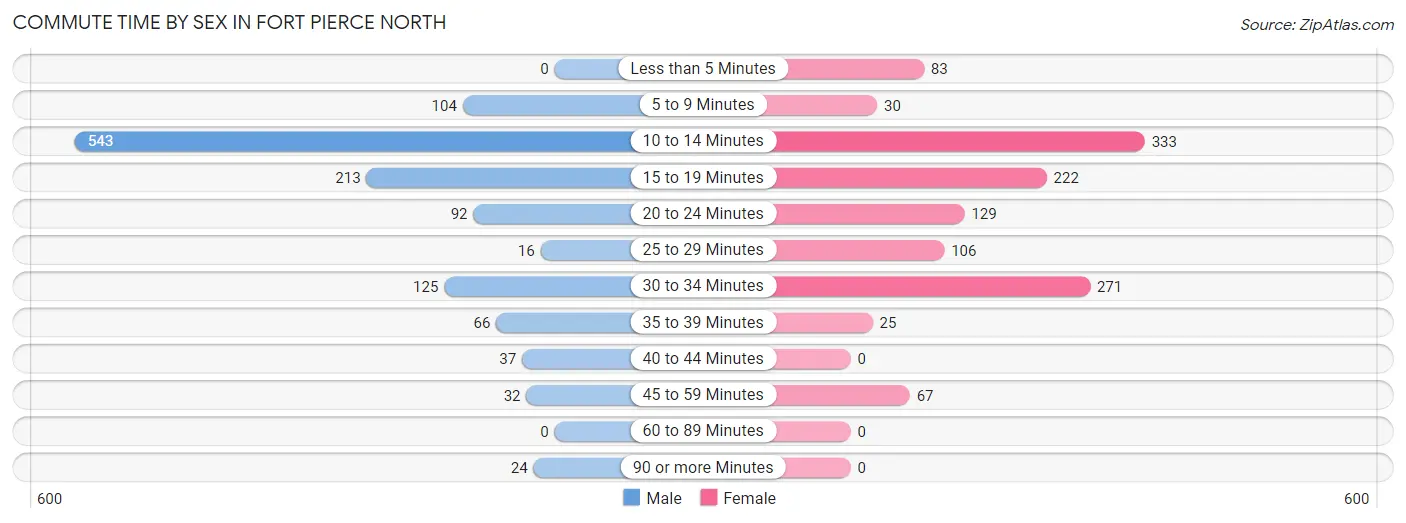
| Commute Time | Male | Female |
| Less than 5 Minutes | 0 (0.0%) | 83 (6.6%) |
| 5 to 9 Minutes | 104 (8.3%) | 30 (2.4%) |
| 10 to 14 Minutes | 543 (43.4%) | 333 (26.3%) |
| 15 to 19 Minutes | 213 (17.0%) | 222 (17.5%) |
| 20 to 24 Minutes | 92 (7.3%) | 129 (10.2%) |
| 25 to 29 Minutes | 16 (1.3%) | 106 (8.4%) |
| 30 to 34 Minutes | 125 (10.0%) | 271 (21.4%) |
| 35 to 39 Minutes | 66 (5.3%) | 25 (2.0%) |
| 40 to 44 Minutes | 37 (3.0%) | 0 (0.0%) |
| 45 to 59 Minutes | 32 (2.6%) | 67 (5.3%) |
| 60 to 89 Minutes | 0 (0.0%) | 0 (0.0%) |
| 90 or more Minutes | 24 (1.9%) | 0 (0.0%) |
Time of Departure to Work by Sex in Fort Pierce North
The most frequent times of departure to work in Fort Pierce North are 7:00 AM to 7:29 AM (404, 32.3%) for males and 7:30 AM to 7:59 AM (354, 28.0%) for females.
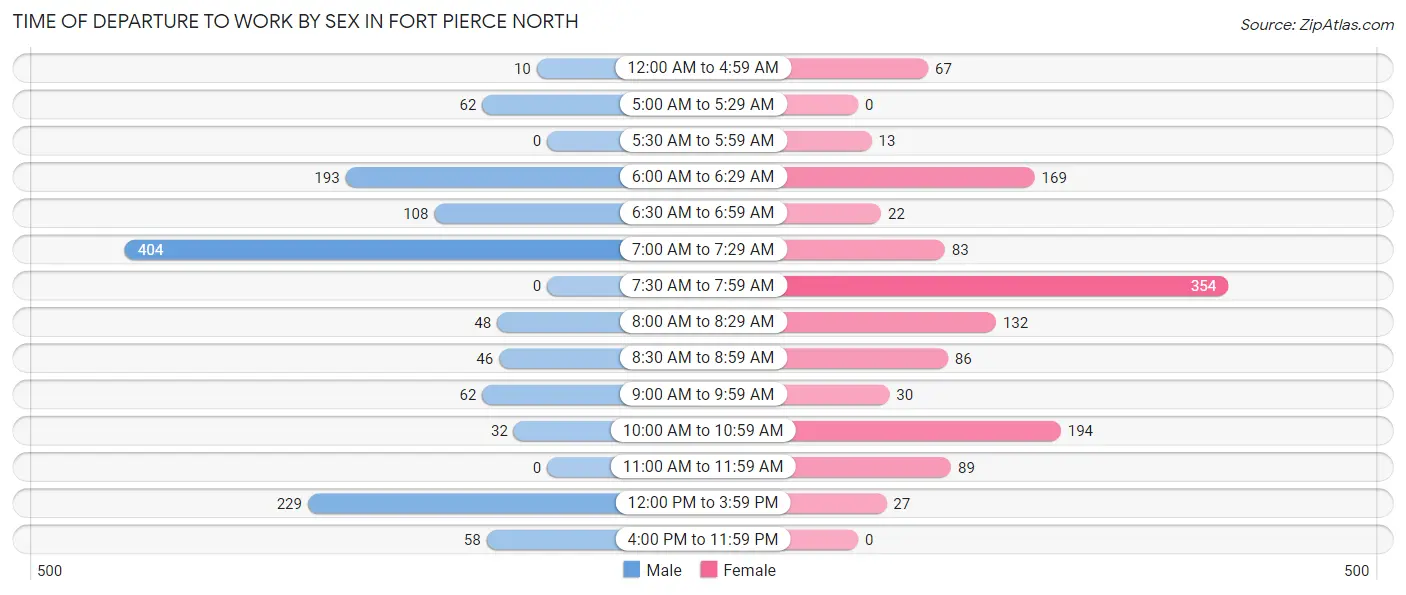
| Time of Departure | Male | Female |
| 12:00 AM to 4:59 AM | 10 (0.8%) | 67 (5.3%) |
| 5:00 AM to 5:29 AM | 62 (5.0%) | 0 (0.0%) |
| 5:30 AM to 5:59 AM | 0 (0.0%) | 13 (1.0%) |
| 6:00 AM to 6:29 AM | 193 (15.4%) | 169 (13.4%) |
| 6:30 AM to 6:59 AM | 108 (8.6%) | 22 (1.7%) |
| 7:00 AM to 7:29 AM | 404 (32.3%) | 83 (6.6%) |
| 7:30 AM to 7:59 AM | 0 (0.0%) | 354 (28.0%) |
| 8:00 AM to 8:29 AM | 48 (3.8%) | 132 (10.4%) |
| 8:30 AM to 8:59 AM | 46 (3.7%) | 86 (6.8%) |
| 9:00 AM to 9:59 AM | 62 (5.0%) | 30 (2.4%) |
| 10:00 AM to 10:59 AM | 32 (2.6%) | 194 (15.3%) |
| 11:00 AM to 11:59 AM | 0 (0.0%) | 89 (7.0%) |
| 12:00 PM to 3:59 PM | 229 (18.3%) | 27 (2.1%) |
| 4:00 PM to 11:59 PM | 58 (4.6%) | 0 (0.0%) |
| Total | 1,252 (100.0%) | 1,266 (100.0%) |
Housing Occupancy in Fort Pierce North
Occupancy by Ownership in Fort Pierce North
Of the total 2,489 dwellings in Fort Pierce North, owner-occupied units account for 1,416 (56.9%), while renter-occupied units make up 1,073 (43.1%).
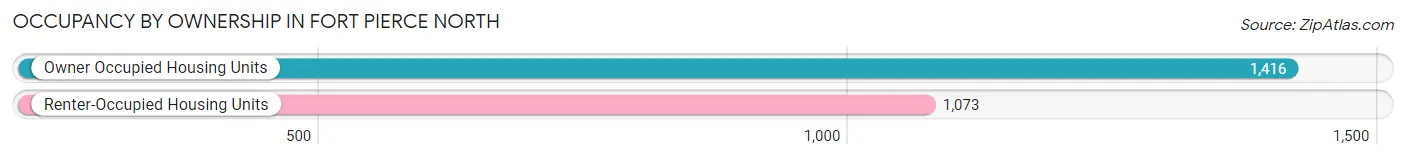
| Occupancy | # Housing Units | % Housing Units |
| Owner Occupied Housing Units | 1,416 | 56.9% |
| Renter-Occupied Housing Units | 1,073 | 43.1% |
| Total Occupied Housing Units | 2,489 | 100.0% |
Occupancy by Household Size in Fort Pierce North
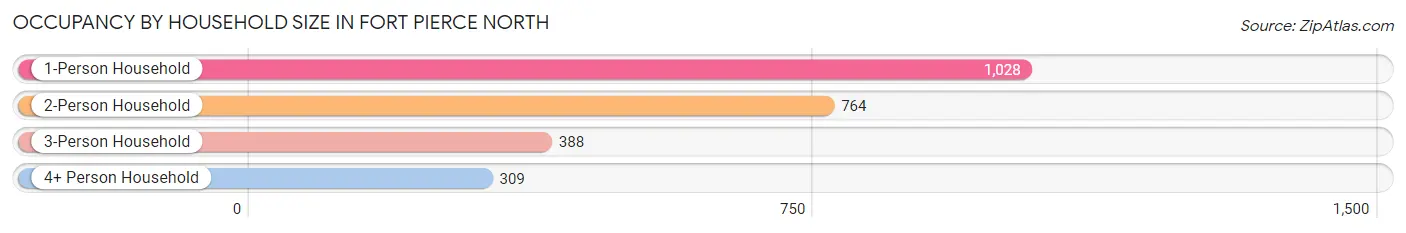
| Household Size | # Housing Units | % Housing Units |
| 1-Person Household | 1,028 | 41.3% |
| 2-Person Household | 764 | 30.7% |
| 3-Person Household | 388 | 15.6% |
| 4+ Person Household | 309 | 12.4% |
| Total Housing Units | 2,489 | 100.0% |
Occupancy by Ownership by Household Size in Fort Pierce North
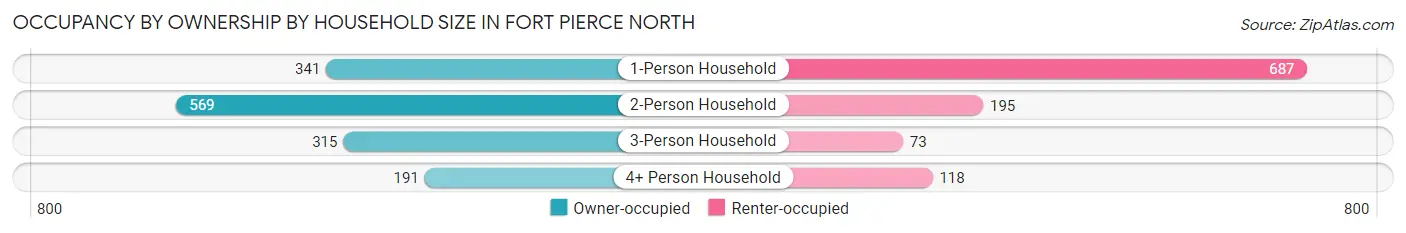
| Household Size | Owner-occupied | Renter-occupied |
| 1-Person Household | 341 (33.2%) | 687 (66.8%) |
| 2-Person Household | 569 (74.5%) | 195 (25.5%) |
| 3-Person Household | 315 (81.2%) | 73 (18.8%) |
| 4+ Person Household | 191 (61.8%) | 118 (38.2%) |
| Total Housing Units | 1,416 (56.9%) | 1,073 (43.1%) |
Occupancy by Educational Attainment in Fort Pierce North
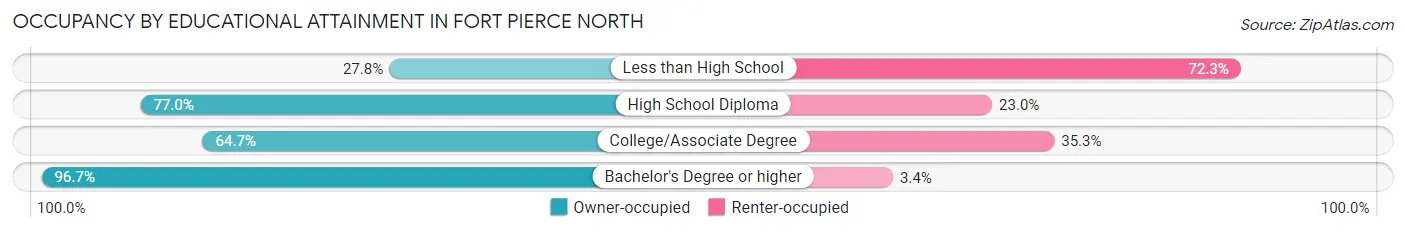
| Household Size | Owner-occupied | Renter-occupied |
| Less than High School | 270 (27.8%) | 703 (72.3%) |
| High School Diploma | 616 (77.0%) | 184 (23.0%) |
| College/Associate Degree | 328 (64.7%) | 179 (35.3%) |
| Bachelor's Degree or higher | 202 (96.7%) | 7 (3.4%) |
Occupancy by Age of Householder in Fort Pierce North
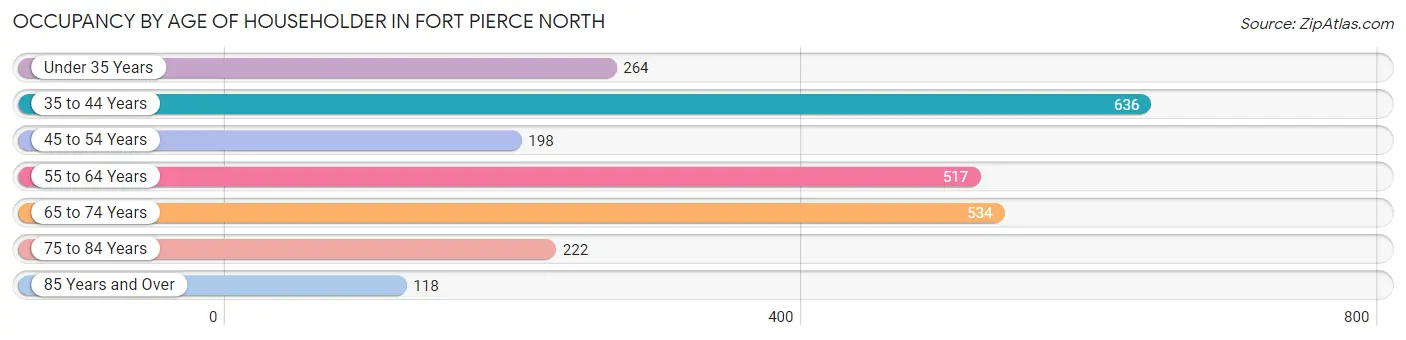
| Age Bracket | # Households | % Households |
| Under 35 Years | 264 | 10.6% |
| 35 to 44 Years | 636 | 25.6% |
| 45 to 54 Years | 198 | 8.0% |
| 55 to 64 Years | 517 | 20.8% |
| 65 to 74 Years | 534 | 21.4% |
| 75 to 84 Years | 222 | 8.9% |
| 85 Years and Over | 118 | 4.7% |
| Total | 2,489 | 100.0% |
Housing Finances in Fort Pierce North
Median Income by Occupancy in Fort Pierce North
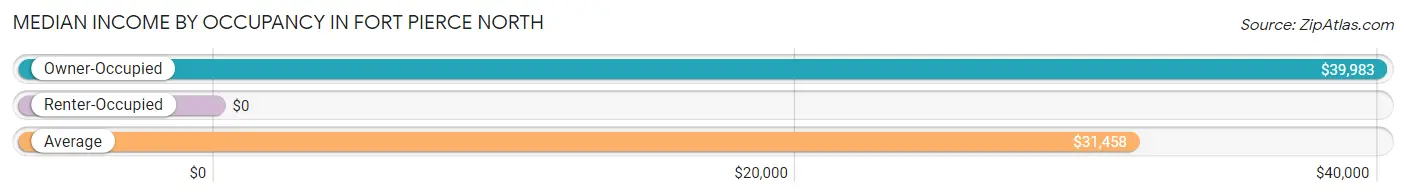
| Occupancy Type | # Households | Median Income |
| Owner-Occupied | 1,416 (56.9%) | $39,983 |
| Renter-Occupied | 1,073 (43.1%) | $0 |
| Average | 2,489 (100.0%) | $31,458 |
Occupancy by Householder Income Bracket in Fort Pierce North
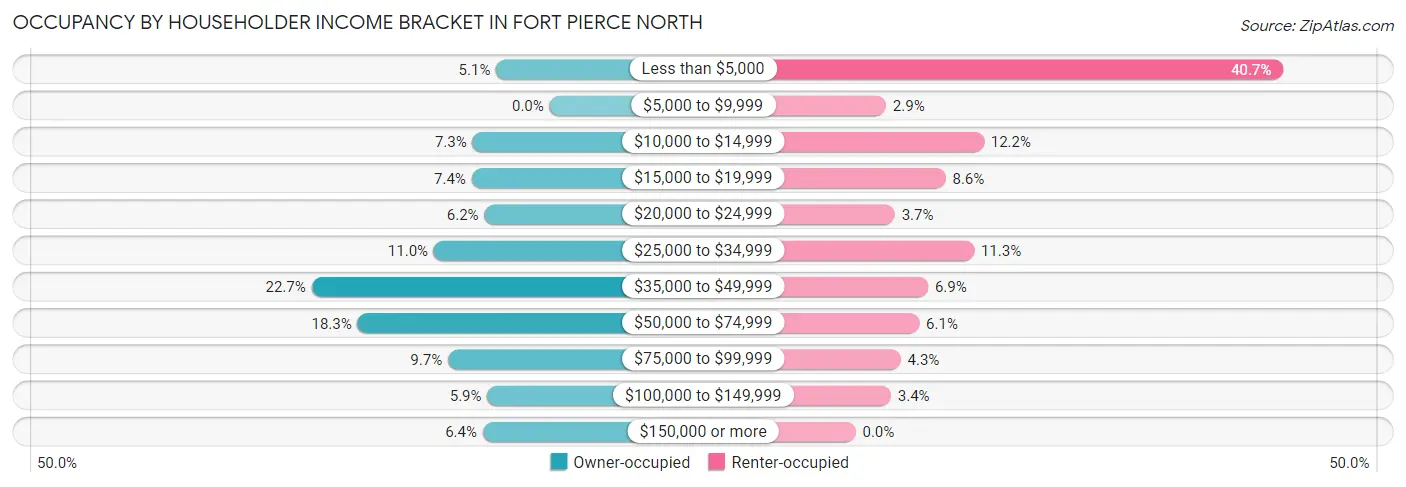
| Income Bracket | Owner-occupied | Renter-occupied |
| Less than $5,000 | 72 (5.1%) | 437 (40.7%) |
| $5,000 to $9,999 | 0 (0.0%) | 31 (2.9%) |
| $10,000 to $14,999 | 104 (7.3%) | 131 (12.2%) |
| $15,000 to $19,999 | 105 (7.4%) | 92 (8.6%) |
| $20,000 to $24,999 | 88 (6.2%) | 40 (3.7%) |
| $25,000 to $34,999 | 156 (11.0%) | 121 (11.3%) |
| $35,000 to $49,999 | 321 (22.7%) | 74 (6.9%) |
| $50,000 to $74,999 | 259 (18.3%) | 65 (6.1%) |
| $75,000 to $99,999 | 137 (9.7%) | 46 (4.3%) |
| $100,000 to $149,999 | 84 (5.9%) | 36 (3.4%) |
| $150,000 or more | 90 (6.4%) | 0 (0.0%) |
| Total | 1,416 (100.0%) | 1,073 (100.0%) |
Monthly Housing Cost Tiers in Fort Pierce North
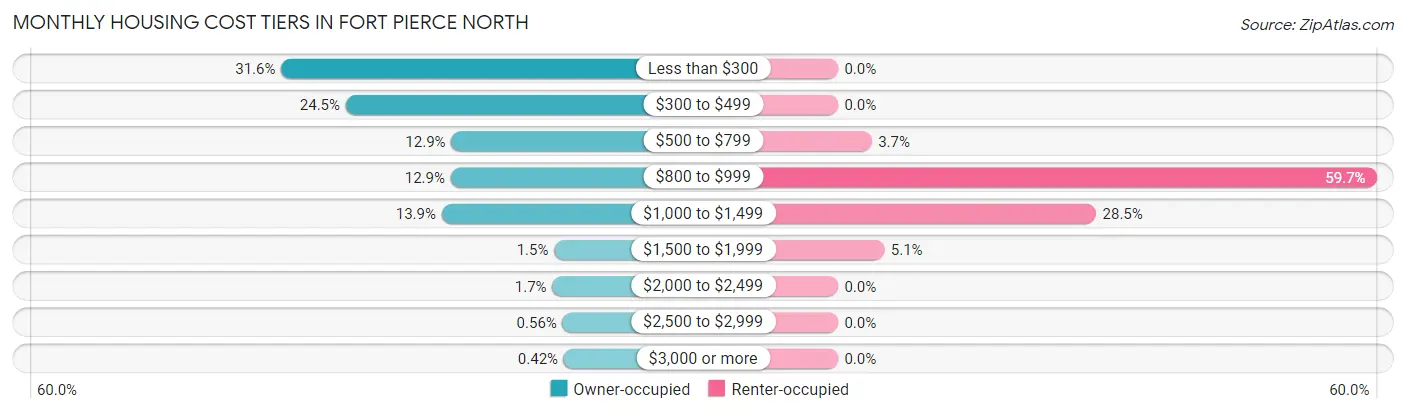
| Monthly Cost | Owner-occupied | Renter-occupied |
| Less than $300 | 448 (31.6%) | 0 (0.0%) |
| $300 to $499 | 347 (24.5%) | 0 (0.0%) |
| $500 to $799 | 182 (12.9%) | 40 (3.7%) |
| $800 to $999 | 183 (12.9%) | 640 (59.7%) |
| $1,000 to $1,499 | 197 (13.9%) | 306 (28.5%) |
| $1,500 to $1,999 | 21 (1.5%) | 55 (5.1%) |
| $2,000 to $2,499 | 24 (1.7%) | 0 (0.0%) |
| $2,500 to $2,999 | 8 (0.6%) | 0 (0.0%) |
| $3,000 or more | 6 (0.4%) | 0 (0.0%) |
| Total | 1,416 (100.0%) | 1,073 (100.0%) |
Physical Housing Characteristics in Fort Pierce North
Housing Structures in Fort Pierce North
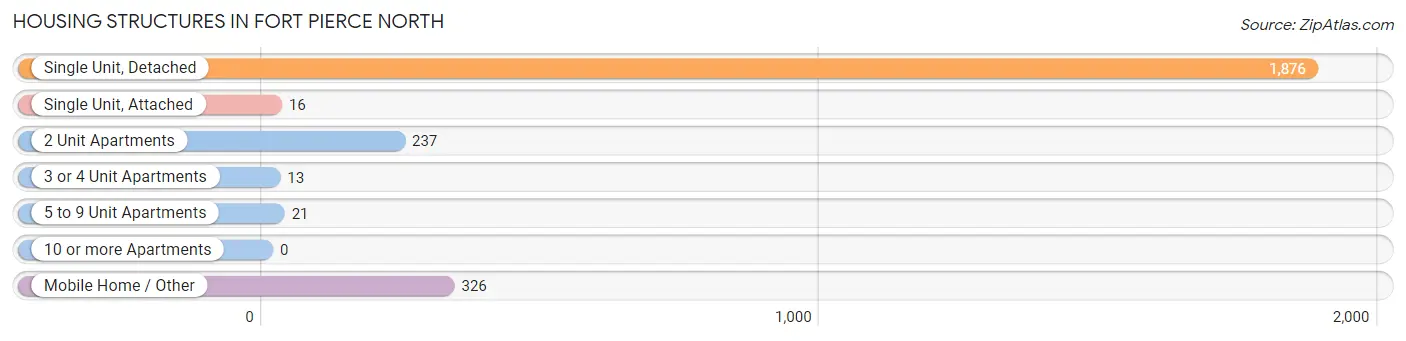
| Structure Type | # Housing Units | % Housing Units |
| Single Unit, Detached | 1,876 | 75.4% |
| Single Unit, Attached | 16 | 0.6% |
| 2 Unit Apartments | 237 | 9.5% |
| 3 or 4 Unit Apartments | 13 | 0.5% |
| 5 to 9 Unit Apartments | 21 | 0.8% |
| 10 or more Apartments | 0 | 0.0% |
| Mobile Home / Other | 326 | 13.1% |
| Total | 2,489 | 100.0% |
Housing Structures by Occupancy in Fort Pierce North
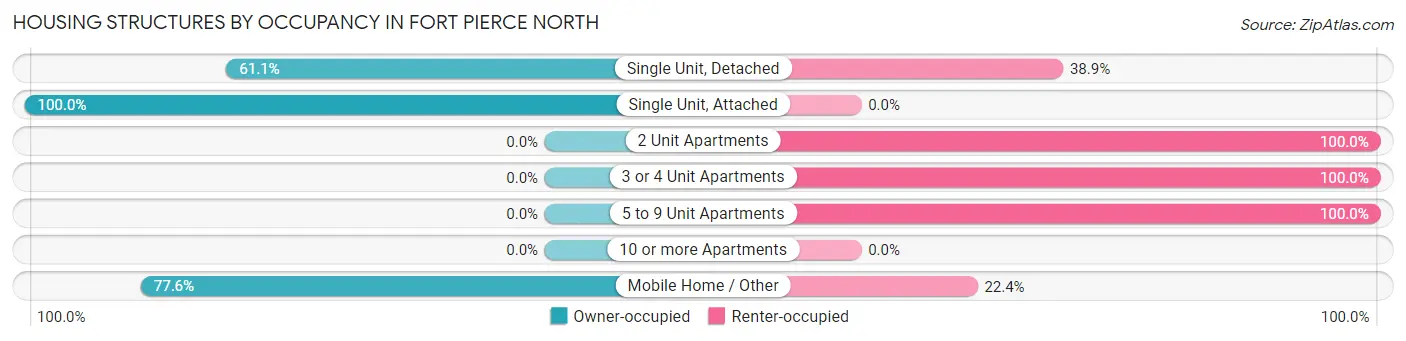
| Structure Type | Owner-occupied | Renter-occupied |
| Single Unit, Detached | 1,147 (61.1%) | 729 (38.9%) |
| Single Unit, Attached | 16 (100.0%) | 0 (0.0%) |
| 2 Unit Apartments | 0 (0.0%) | 237 (100.0%) |
| 3 or 4 Unit Apartments | 0 (0.0%) | 13 (100.0%) |
| 5 to 9 Unit Apartments | 0 (0.0%) | 21 (100.0%) |
| 10 or more Apartments | 0 (0.0%) | 0 (0.0%) |
| Mobile Home / Other | 253 (77.6%) | 73 (22.4%) |
| Total | 1,416 (56.9%) | 1,073 (43.1%) |
Housing Structures by Number of Rooms in Fort Pierce North
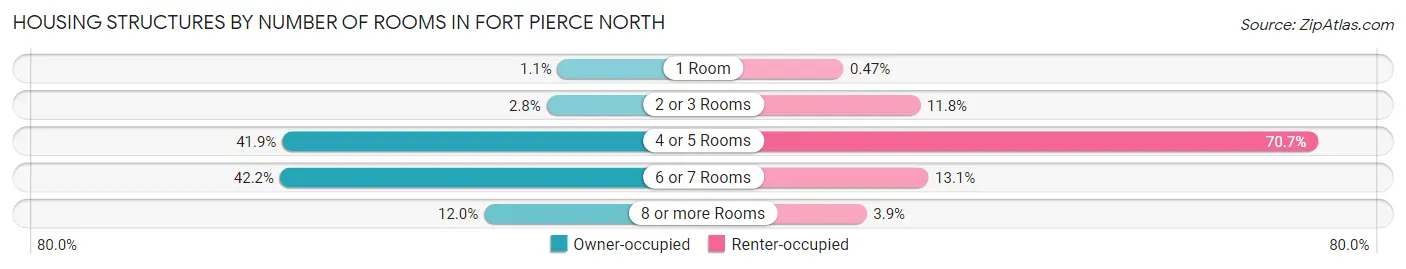
| Number of Rooms | Owner-occupied | Renter-occupied |
| 1 Room | 16 (1.1%) | 5 (0.5%) |
| 2 or 3 Rooms | 39 (2.8%) | 127 (11.8%) |
| 4 or 5 Rooms | 593 (41.9%) | 759 (70.7%) |
| 6 or 7 Rooms | 598 (42.2%) | 140 (13.1%) |
| 8 or more Rooms | 170 (12.0%) | 42 (3.9%) |
| Total | 1,416 (100.0%) | 1,073 (100.0%) |
Housing Structure by Heating Type in Fort Pierce North
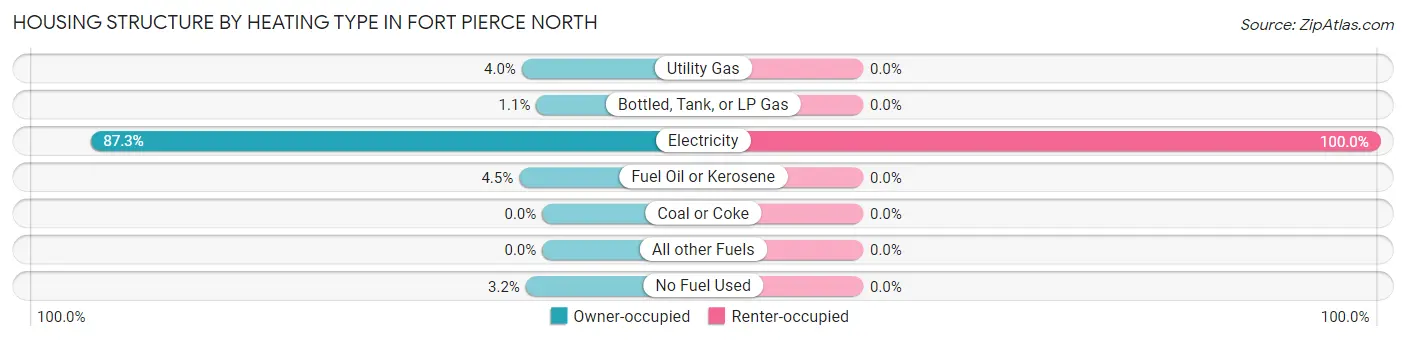
| Heating Type | Owner-occupied | Renter-occupied |
| Utility Gas | 56 (4.0%) | 0 (0.0%) |
| Bottled, Tank, or LP Gas | 16 (1.1%) | 0 (0.0%) |
| Electricity | 1,236 (87.3%) | 1,073 (100.0%) |
| Fuel Oil or Kerosene | 63 (4.4%) | 0 (0.0%) |
| Coal or Coke | 0 (0.0%) | 0 (0.0%) |
| All other Fuels | 0 (0.0%) | 0 (0.0%) |
| No Fuel Used | 45 (3.2%) | 0 (0.0%) |
| Total | 1,416 (100.0%) | 1,073 (100.0%) |
Household Vehicle Usage in Fort Pierce North
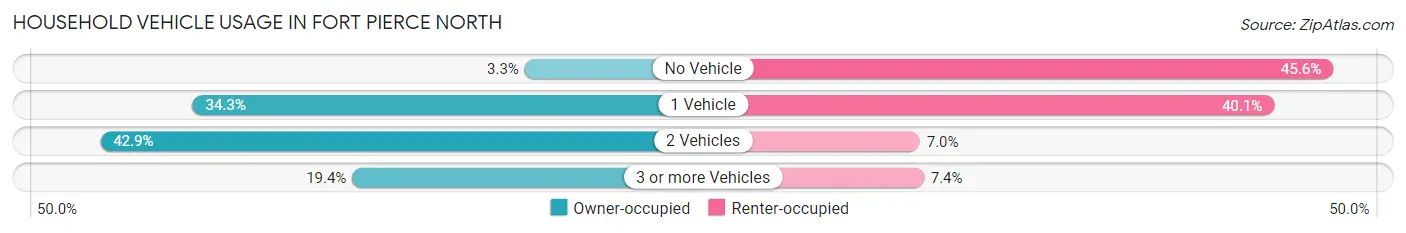
| Vehicles per Household | Owner-occupied | Renter-occupied |
| No Vehicle | 47 (3.3%) | 489 (45.6%) |
| 1 Vehicle | 486 (34.3%) | 430 (40.1%) |
| 2 Vehicles | 608 (42.9%) | 75 (7.0%) |
| 3 or more Vehicles | 275 (19.4%) | 79 (7.4%) |
| Total | 1,416 (100.0%) | 1,073 (100.0%) |
Real Estate & Mortgages in Fort Pierce North
Real Estate and Mortgage Overview in Fort Pierce North
| Characteristic | Without Mortgage | With Mortgage |
| Housing Units | 901 | 515 |
| Median Property Value | $112,700 | $124,000 |
| Median Household Income | $38,674 | $39 |
| Monthly Housing Costs | $307 | $6 |
| Real Estate Taxes | $1,045 | $39 |
Property Value by Mortgage Status in Fort Pierce North
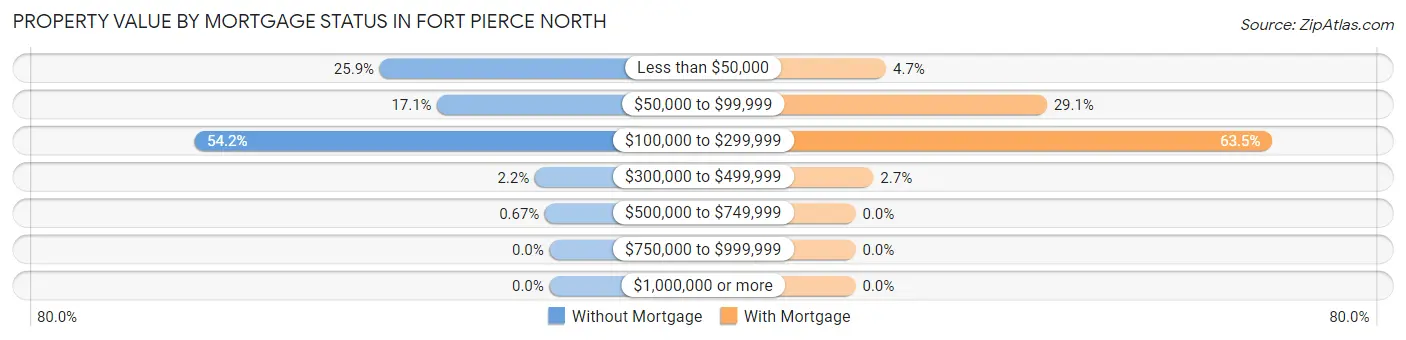
| Property Value | Without Mortgage | With Mortgage |
| Less than $50,000 | 233 (25.9%) | 24 (4.7%) |
| $50,000 to $99,999 | 154 (17.1%) | 150 (29.1%) |
| $100,000 to $299,999 | 488 (54.2%) | 327 (63.5%) |
| $300,000 to $499,999 | 20 (2.2%) | 14 (2.7%) |
| $500,000 to $749,999 | 6 (0.7%) | 0 (0.0%) |
| $750,000 to $999,999 | 0 (0.0%) | 0 (0.0%) |
| $1,000,000 or more | 0 (0.0%) | 0 (0.0%) |
| Total | 901 (100.0%) | 515 (100.0%) |
Household Income by Mortgage Status in Fort Pierce North
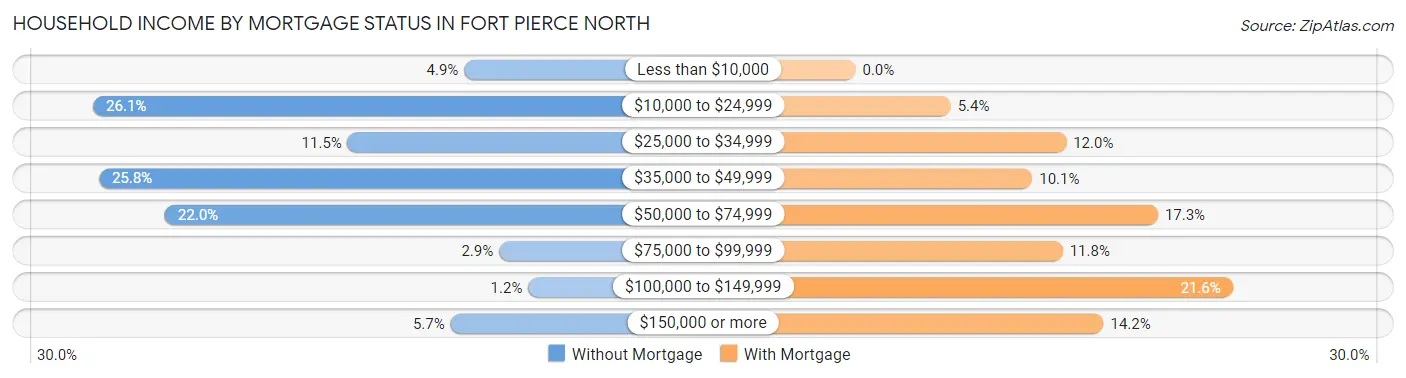
| Household Income | Without Mortgage | With Mortgage |
| Less than $10,000 | 44 (4.9%) | 0 (0.0%) |
| $10,000 to $24,999 | 235 (26.1%) | 28 (5.4%) |
| $25,000 to $34,999 | 104 (11.5%) | 62 (12.0%) |
| $35,000 to $49,999 | 232 (25.8%) | 52 (10.1%) |
| $50,000 to $74,999 | 198 (22.0%) | 89 (17.3%) |
| $75,000 to $99,999 | 26 (2.9%) | 61 (11.8%) |
| $100,000 to $149,999 | 11 (1.2%) | 111 (21.5%) |
| $150,000 or more | 51 (5.7%) | 73 (14.2%) |
| Total | 901 (100.0%) | 515 (100.0%) |
Property Value to Household Income Ratio in Fort Pierce North
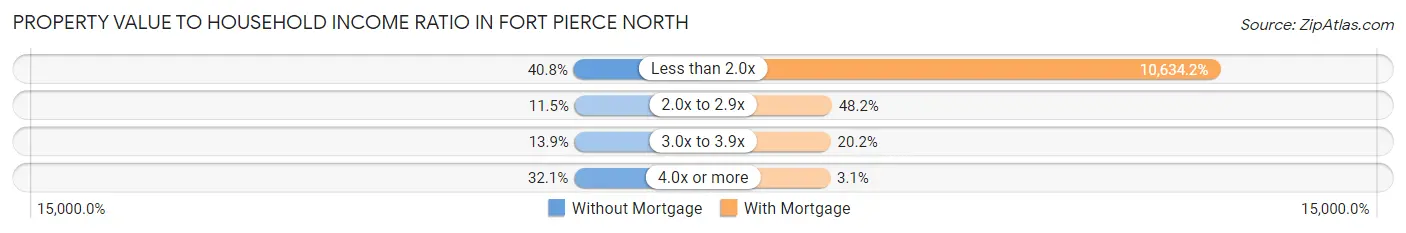
| Value-to-Income Ratio | Without Mortgage | With Mortgage |
| Less than 2.0x | 368 (40.8%) | 54,766 (10,634.2%) |
| 2.0x to 2.9x | 104 (11.5%) | 248 (48.2%) |
| 3.0x to 3.9x | 125 (13.9%) | 104 (20.2%) |
| 4.0x or more | 289 (32.1%) | 16 (3.1%) |
| Total | 901 (100.0%) | 515 (100.0%) |
Real Estate Taxes by Mortgage Status in Fort Pierce North
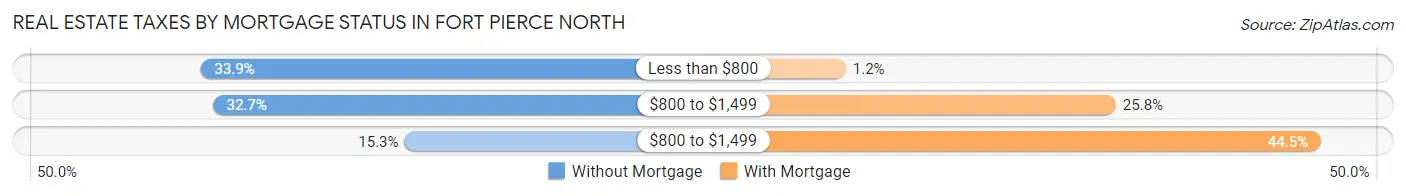
| Property Taxes | Without Mortgage | With Mortgage |
| Less than $800 | 305 (33.9%) | 6 (1.2%) |
| $800 to $1,499 | 295 (32.7%) | 133 (25.8%) |
| $800 to $1,499 | 138 (15.3%) | 229 (44.5%) |
| Total | 901 (100.0%) | 515 (100.0%) |
Health & Disability in Fort Pierce North
Health Insurance Coverage by Age in Fort Pierce North
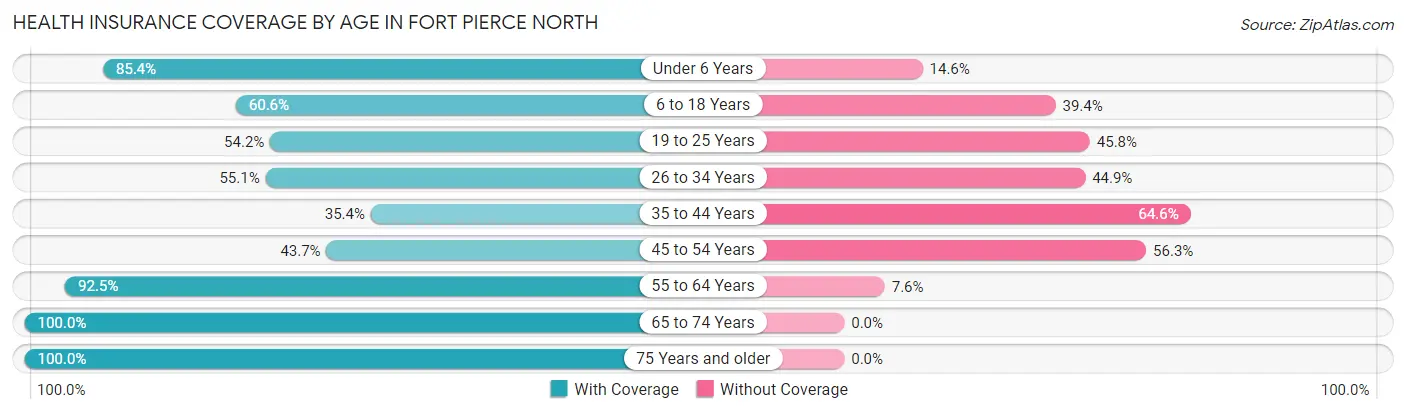
| Age Bracket | With Coverage | Without Coverage |
| Under 6 Years | 193 (85.4%) | 33 (14.6%) |
| 6 to 18 Years | 643 (60.6%) | 418 (39.4%) |
| 19 to 25 Years | 335 (54.2%) | 283 (45.8%) |
| 26 to 34 Years | 217 (55.1%) | 177 (44.9%) |
| 35 to 44 Years | 427 (35.4%) | 778 (64.6%) |
| 45 to 54 Years | 292 (43.7%) | 376 (56.3%) |
| 55 to 64 Years | 931 (92.4%) | 76 (7.5%) |
| 65 to 74 Years | 802 (100.0%) | 0 (0.0%) |
| 75 Years and older | 538 (100.0%) | 0 (0.0%) |
| Total | 4,378 (67.2%) | 2,141 (32.8%) |
Health Insurance Coverage by Citizenship Status in Fort Pierce North
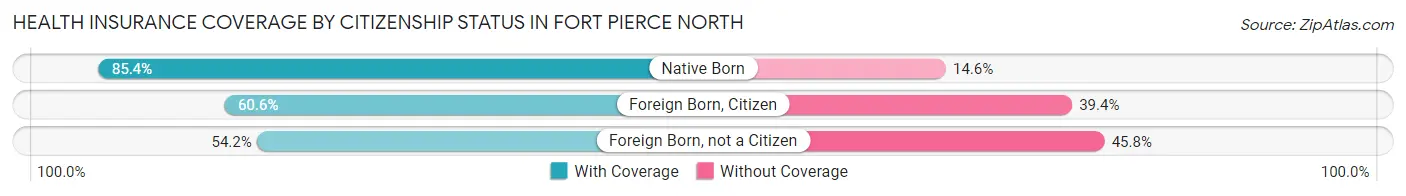
| Citizenship Status | With Coverage | Without Coverage |
| Native Born | 193 (85.4%) | 33 (14.6%) |
| Foreign Born, Citizen | 643 (60.6%) | 418 (39.4%) |
| Foreign Born, not a Citizen | 335 (54.2%) | 283 (45.8%) |
Health Insurance Coverage by Household Income in Fort Pierce North
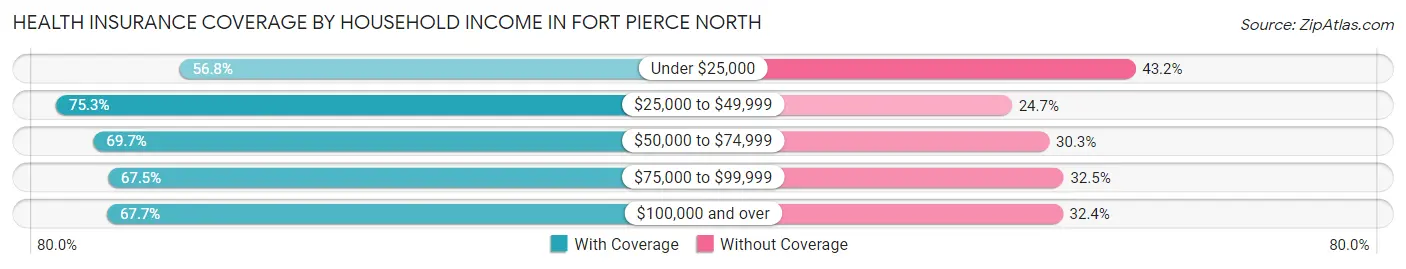
| Household Income | With Coverage | Without Coverage |
| Under $25,000 | 1,016 (56.8%) | 774 (43.2%) |
| $25,000 to $49,999 | 1,395 (75.3%) | 458 (24.7%) |
| $50,000 to $74,999 | 678 (69.7%) | 295 (30.3%) |
| $75,000 to $99,999 | 501 (67.5%) | 241 (32.5%) |
| $100,000 and over | 776 (67.6%) | 371 (32.4%) |
Public vs Private Health Insurance Coverage by Age in Fort Pierce North
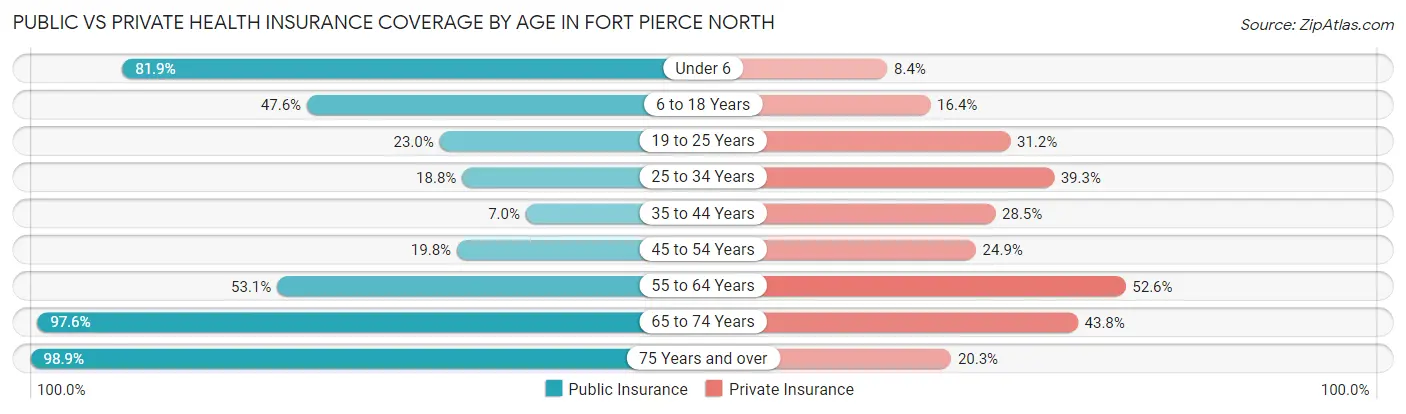
| Age Bracket | Public Insurance | Private Insurance |
| Under 6 | 185 (81.9%) | 19 (8.4%) |
| 6 to 18 Years | 505 (47.6%) | 174 (16.4%) |
| 19 to 25 Years | 142 (23.0%) | 193 (31.2%) |
| 25 to 34 Years | 74 (18.8%) | 155 (39.3%) |
| 35 to 44 Years | 84 (7.0%) | 343 (28.5%) |
| 45 to 54 Years | 132 (19.8%) | 166 (24.8%) |
| 55 to 64 Years | 535 (53.1%) | 530 (52.6%) |
| 65 to 74 Years | 783 (97.6%) | 351 (43.8%) |
| 75 Years and over | 532 (98.9%) | 109 (20.3%) |
| Total | 2,972 (45.6%) | 2,040 (31.3%) |
Disability Status by Sex by Age in Fort Pierce North
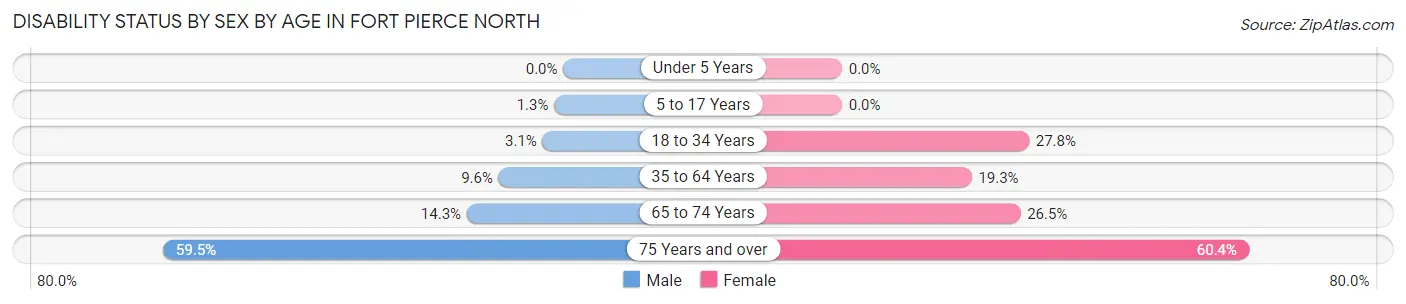
| Age Bracket | Male | Female |
| Under 5 Years | 0 (0.0%) | 0 (0.0%) |
| 5 to 17 Years | 8 (1.3%) | 0 (0.0%) |
| 18 to 34 Years | 24 (3.1%) | 123 (27.8%) |
| 35 to 64 Years | 140 (9.6%) | 273 (19.3%) |
| 65 to 74 Years | 57 (14.3%) | 107 (26.5%) |
| 75 Years and over | 132 (59.5%) | 191 (60.4%) |
Disability Class by Sex by Age in Fort Pierce North
Disability Class: Hearing Difficulty
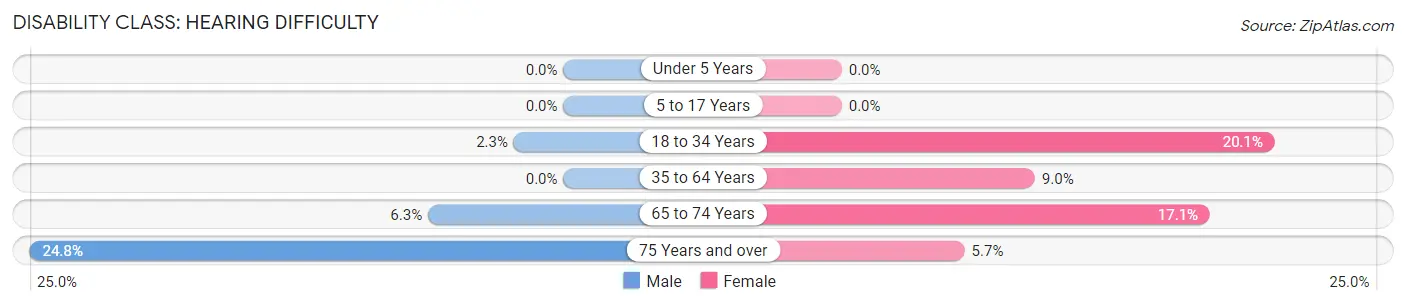
| Age Bracket | Male | Female |
| Under 5 Years | 0 (0.0%) | 0 (0.0%) |
| 5 to 17 Years | 0 (0.0%) | 0 (0.0%) |
| 18 to 34 Years | 18 (2.3%) | 89 (20.1%) |
| 35 to 64 Years | 0 (0.0%) | 127 (9.0%) |
| 65 to 74 Years | 25 (6.3%) | 69 (17.1%) |
| 75 Years and over | 55 (24.8%) | 18 (5.7%) |
Disability Class: Vision Difficulty
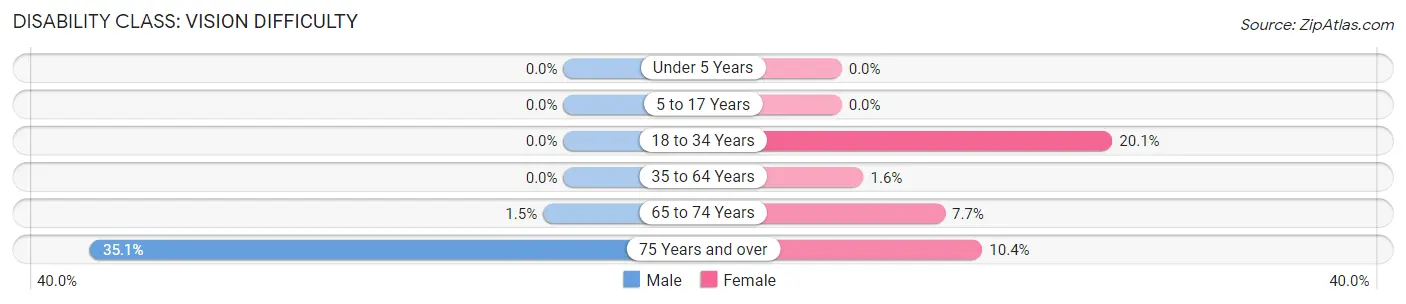
| Age Bracket | Male | Female |
| Under 5 Years | 0 (0.0%) | 0 (0.0%) |
| 5 to 17 Years | 0 (0.0%) | 0 (0.0%) |
| 18 to 34 Years | 0 (0.0%) | 89 (20.1%) |
| 35 to 64 Years | 0 (0.0%) | 23 (1.6%) |
| 65 to 74 Years | 6 (1.5%) | 31 (7.7%) |
| 75 Years and over | 78 (35.1%) | 33 (10.4%) |
Disability Class: Cognitive Difficulty
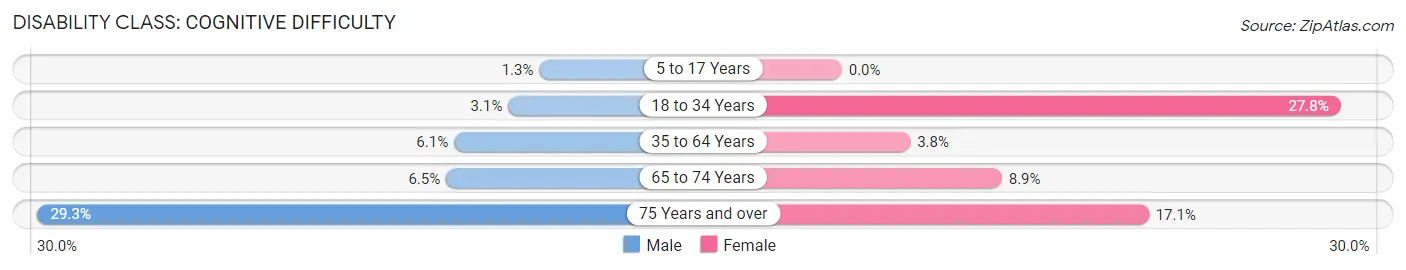
| Age Bracket | Male | Female |
| 5 to 17 Years | 8 (1.3%) | 0 (0.0%) |
| 18 to 34 Years | 24 (3.1%) | 123 (27.8%) |
| 35 to 64 Years | 89 (6.1%) | 54 (3.8%) |
| 65 to 74 Years | 26 (6.5%) | 36 (8.9%) |
| 75 Years and over | 65 (29.3%) | 54 (17.1%) |
Disability Class: Ambulatory Difficulty
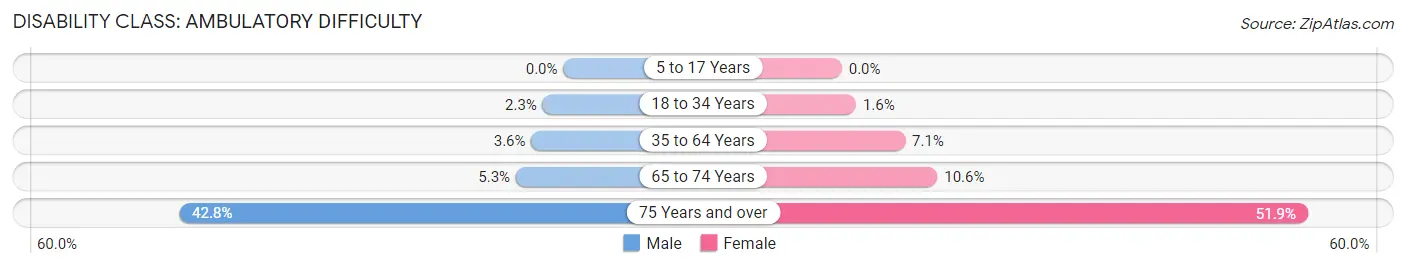
| Age Bracket | Male | Female |
| 5 to 17 Years | 0 (0.0%) | 0 (0.0%) |
| 18 to 34 Years | 18 (2.3%) | 7 (1.6%) |
| 35 to 64 Years | 52 (3.6%) | 100 (7.0%) |
| 65 to 74 Years | 21 (5.3%) | 43 (10.6%) |
| 75 Years and over | 95 (42.8%) | 164 (51.9%) |
Disability Class: Self-Care Difficulty
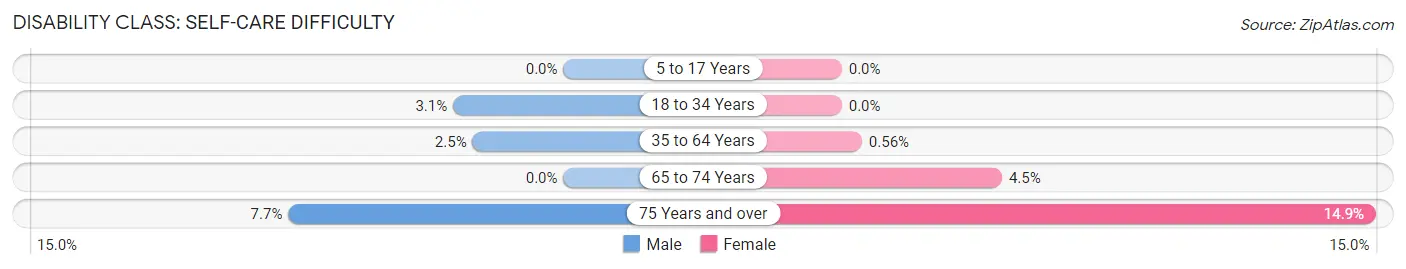
| Age Bracket | Male | Female |
| 5 to 17 Years | 0 (0.0%) | 0 (0.0%) |
| 18 to 34 Years | 24 (3.1%) | 0 (0.0%) |
| 35 to 64 Years | 37 (2.5%) | 8 (0.6%) |
| 65 to 74 Years | 0 (0.0%) | 18 (4.5%) |
| 75 Years and over | 17 (7.7%) | 47 (14.9%) |
Technology Access in Fort Pierce North
Computing Device Access in Fort Pierce North
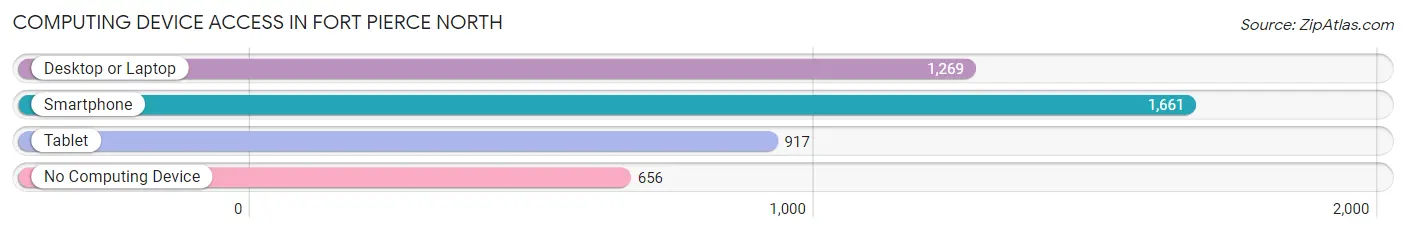
| Device Type | # Households | % Households |
| Desktop or Laptop | 1,269 | 51.0% |
| Smartphone | 1,661 | 66.7% |
| Tablet | 917 | 36.8% |
| No Computing Device | 656 | 26.4% |
| Total | 2,489 | 100.0% |
Internet Access in Fort Pierce North
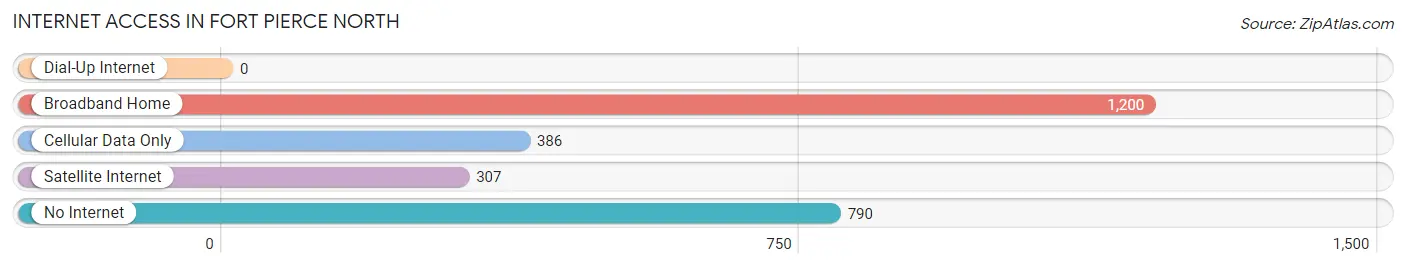
| Internet Type | # Households | % Households |
| Dial-Up Internet | 0 | 0.0% |
| Broadband Home | 1,200 | 48.2% |
| Cellular Data Only | 386 | 15.5% |
| Satellite Internet | 307 | 12.3% |
| No Internet | 790 | 31.7% |
| Total | 2,489 | 100.0% |
Fort Pierce North Summary
Pierce North, Florida is a city located in St. Lucie County, Florida. It is part of the Port St. Lucie Metropolitan Statistical Area. The population of Fort Pierce North was estimated to be 8,845 in 2019.
History
Fort Pierce North was originally part of the Seminole Indian Reservation. In 1838, the U.S. government purchased the land from the Seminoles and established the Fort Pierce Military Reservation. The fort was used as a base for the U.S. Army during the Second Seminole War. In 1845, the fort was abandoned and the land was sold to settlers.
In the late 19th century, the area was known as "North Fort Pierce" and was home to a small farming community. In the early 20th century, the area began to grow as more people moved to the area. In the 1950s, the area was annexed by the City of Fort Pierce and became known as Fort Pierce North.
Geography
Fort Pierce North is located in St. Lucie County, Florida. It is situated on the Indian River Lagoon, which is part of the Intracoastal Waterway. The city is bordered by the cities of Fort Pierce and Port St. Lucie.
The city has a total area of 4.3 square miles, of which 4.2 square miles is land and 0.1 square miles is water. The city is located at an elevation of 10 feet above sea level.
Economy
The economy of Fort Pierce North is largely based on tourism and agriculture. The city is home to several tourist attractions, including the St. Lucie County Aquarium, the Fort Pierce Inlet State Park, and the National Navy UDT-SEAL Museum.
Agriculture is also an important part of the local economy. The city is home to several farms, including citrus, vegetable, and dairy farms.
Demographics
As of the 2019 census, the population of Fort Pierce North was 8,845. The racial makeup of the city was 79.3% White, 11.2% African American, 0.3% Native American, 1.2% Asian, 0.1% Pacific Islander, 5.2% from other races, and 2.9% from two or more races. Hispanic or Latino of any race were 15.2% of the population.
The median household income in Fort Pierce North was $37,945 in 2019. The per capita income was $20,945. About 17.2% of the population was below the poverty line.
The city is served by the St. Lucie County School District. The city is home to several schools, including Fort Pierce North Elementary School, Fort Pierce North Middle School, and Fort Pierce North High School.
Common Questions
What is Per Capita Income in Fort Pierce North?
Per Capita income in Fort Pierce North is $19,436.
What is the Median Family Income in Fort Pierce North?
Median Family Income in Fort Pierce North is $42,402.
What is the Median Household income in Fort Pierce North?
Median Household Income in Fort Pierce North is $31,458.
What is Income or Wage Gap in Fort Pierce North?
Income or Wage Gap in Fort Pierce North is 35.7%.
Women in Fort Pierce North earn 64.3 cents for every dollar earned by a man.
What is Inequality or Gini Index in Fort Pierce North?
Inequality or Gini Index in Fort Pierce North is 0.55.
What is the Total Population of Fort Pierce North?
Total Population of Fort Pierce North is 6,519.
What is the Total Male Population of Fort Pierce North?
Total Male Population of Fort Pierce North is 3,543.
What is the Total Female Population of Fort Pierce North?
Total Female Population of Fort Pierce North is 2,976.
What is the Ratio of Males per 100 Females in Fort Pierce North?
There are 119.05 Males per 100 Females in Fort Pierce North.
What is the Ratio of Females per 100 Males in Fort Pierce North?
There are 84.00 Females per 100 Males in Fort Pierce North.
What is the Median Population Age in Fort Pierce North?
Median Population Age in Fort Pierce North is 40.6 Years.
What is the Average Family Size in Fort Pierce North
Average Family Size in Fort Pierce North is 3.9 People.
What is the Average Household Size in Fort Pierce North
Average Household Size in Fort Pierce North is 2.6 People.
How Large is the Labor Force in Fort Pierce North?
There are 2,681 People in the Labor Forcein in Fort Pierce North.
What is the Percentage of People in the Labor Force in Fort Pierce North?
47.5% of People are in the Labor Force in Fort Pierce North.
What is the Unemployment Rate in Fort Pierce North?
Unemployment Rate in Fort Pierce North is 5.2%.