Masaryktown, FL Map & Demographics
Masaryktown Map
Masaryktown Overview
$24,062
PER CAPITA INCOME
$40,000
AVG FAMILY INCOME
$45,616
AVG HOUSEHOLD INCOME
0.43
INEQUALITY / GINI INDEX
993
TOTAL POPULATION
507
MALE POPULATION
486
FEMALE POPULATION
104.32
MALES / 100 FEMALES
95.86
FEMALES / 100 MALES
48.6
MEDIAN AGE
3.0
AVG FAMILY SIZE
2.3
AVG HOUSEHOLD SIZE
403
LABOR FORCE [ PEOPLE ]
53.6%
PERCENT IN LABOR FORCE
Income in Masaryktown
Income Overview in Masaryktown
Per Capita Income in Masaryktown is $24,062, while median incomes of families and households are $40,000 and $45,616 respectively.
| Characteristic | Number | Measure |
| Per Capita Income | 993 | $24,062 |
| Median Family Income | 238 | $40,000 |
| Mean Family Income | 238 | $52,824 |
| Median Household Income | 440 | $45,616 |
| Mean Household Income | 440 | $53,098 |
| Income Deficit | 238 | $0 |
| Wage / Income Gap (%) | 993 | 0.00% |
| Wage / Income Gap ($) | 993 | 100.00¢ per $1 |
| Gini / Inequality Index | 993 | 0.43 |
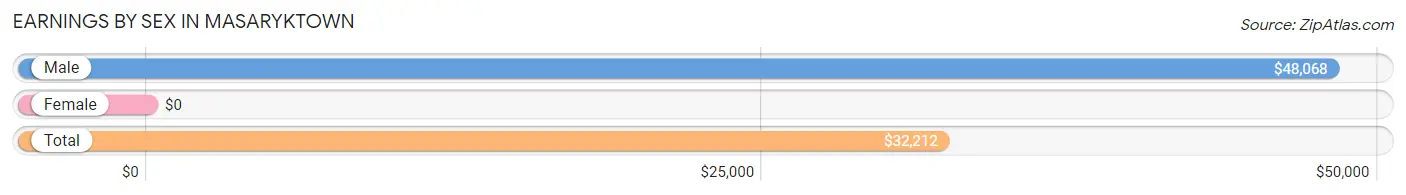
Earnings by Sex in Masaryktown
| Sex | Number | Average Earnings |
| Male | 183 (44.1%) | $48,068 |
| Female | 232 (55.9%) | $0 |
| Total | 415 (100.0%) | $32,212 |
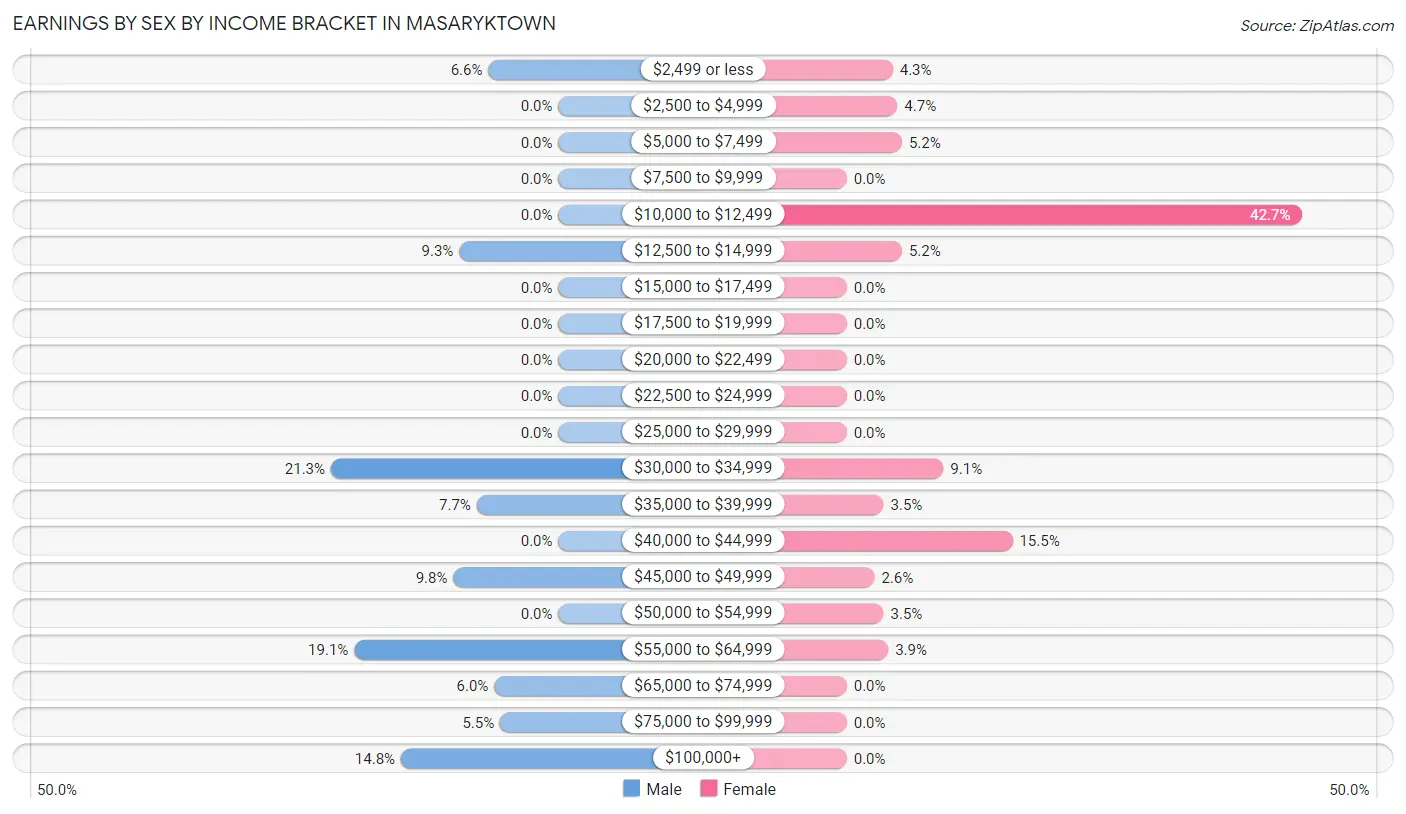
Earnings by Sex by Income Bracket in Masaryktown
The most common earnings brackets in Masaryktown are $30,000 to $34,999 for men (39 | 21.3%) and $10,000 to $12,499 for women (99 | 42.7%).
| Income | Male | Female |
| $2,499 or less | 12 (6.6%) | 10 (4.3%) |
| $2,500 to $4,999 | 0 (0.0%) | 11 (4.7%) |
| $5,000 to $7,499 | 0 (0.0%) | 12 (5.2%) |
| $7,500 to $9,999 | 0 (0.0%) | 0 (0.0%) |
| $10,000 to $12,499 | 0 (0.0%) | 99 (42.7%) |
| $12,500 to $14,999 | 17 (9.3%) | 12 (5.2%) |
| $15,000 to $17,499 | 0 (0.0%) | 0 (0.0%) |
| $17,500 to $19,999 | 0 (0.0%) | 0 (0.0%) |
| $20,000 to $22,499 | 0 (0.0%) | 0 (0.0%) |
| $22,500 to $24,999 | 0 (0.0%) | 0 (0.0%) |
| $25,000 to $29,999 | 0 (0.0%) | 0 (0.0%) |
| $30,000 to $34,999 | 39 (21.3%) | 21 (9.0%) |
| $35,000 to $39,999 | 14 (7.6%) | 8 (3.5%) |
| $40,000 to $44,999 | 0 (0.0%) | 36 (15.5%) |
| $45,000 to $49,999 | 18 (9.8%) | 6 (2.6%) |
| $50,000 to $54,999 | 0 (0.0%) | 8 (3.5%) |
| $55,000 to $64,999 | 35 (19.1%) | 9 (3.9%) |
| $65,000 to $74,999 | 11 (6.0%) | 0 (0.0%) |
| $75,000 to $99,999 | 10 (5.5%) | 0 (0.0%) |
| $100,000+ | 27 (14.7%) | 0 (0.0%) |
| Total | 183 (100.0%) | 232 (100.0%) |
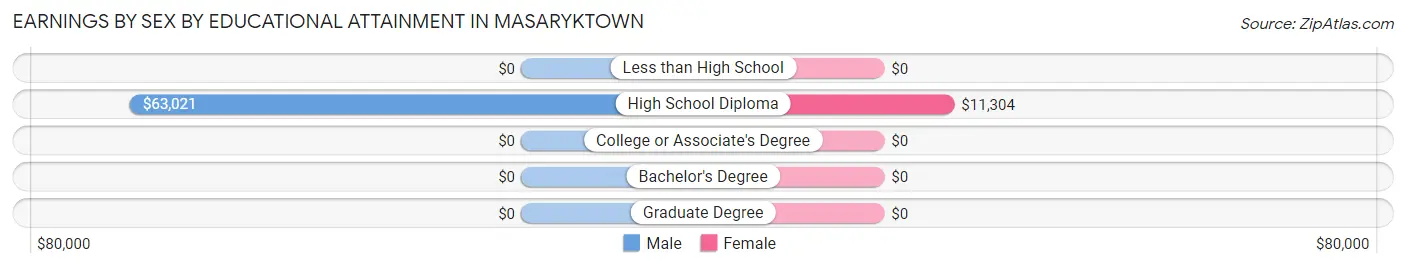
Earnings by Sex by Educational Attainment in Masaryktown
| Educational Attainment | Male Income | Female Income |
| Less than High School | - | - |
| High School Diploma | $63,021 | $11,304 |
| College or Associate's Degree | - | - |
| Bachelor's Degree | - | - |
| Graduate Degree | - | - |
| Total | $49,432 | $0 |
Family Income in Masaryktown
Family Income Brackets in Masaryktown
According to the Masaryktown family income data, there are 55 families falling into the $25,000 to $34,999 income range, which is the most common income bracket and makes up 23.1% of all families.
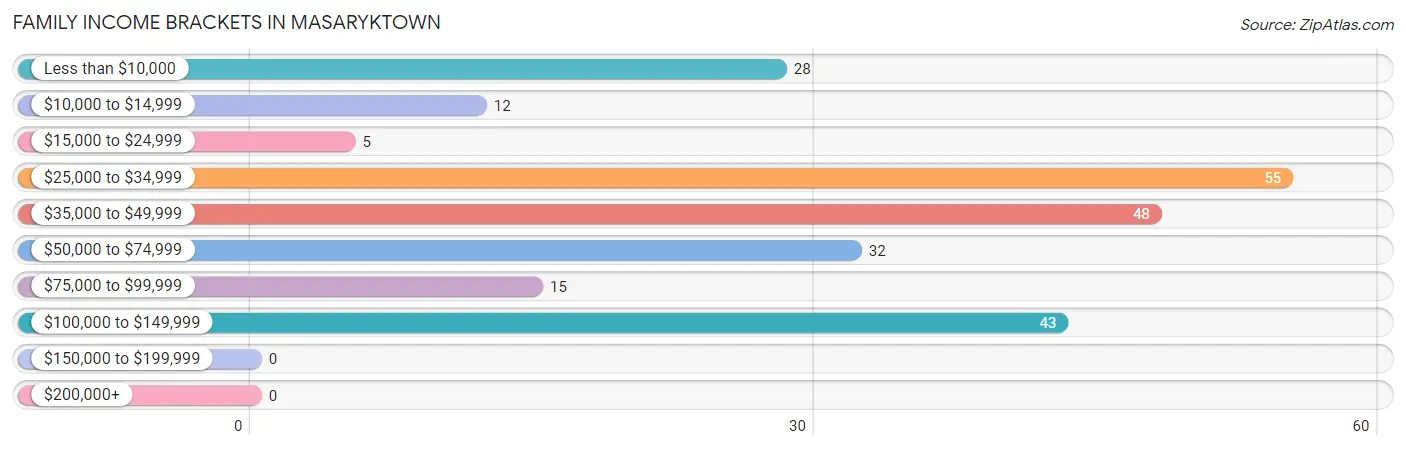
| Income Bracket | # Families | % Families |
| Less than $10,000 | 28 | 11.8% |
| $10,000 to $14,999 | 12 | 5.0% |
| $15,000 to $24,999 | 5 | 2.1% |
| $25,000 to $34,999 | 55 | 23.1% |
| $35,000 to $49,999 | 48 | 20.2% |
| $50,000 to $74,999 | 32 | 13.4% |
| $75,000 to $99,999 | 15 | 6.3% |
| $100,000 to $149,999 | 43 | 18.1% |
| $150,000 to $199,999 | 0 | 0.0% |
| $200,000+ | 0 | 0.0% |
Family Income by Famaliy Size in Masaryktown
3-person families (19 | 8.0%) account for the highest median family income in Masaryktown with $91,875 per family, while 3-person families (19 | 8.0%) have the highest median income of $30,625 per family member.
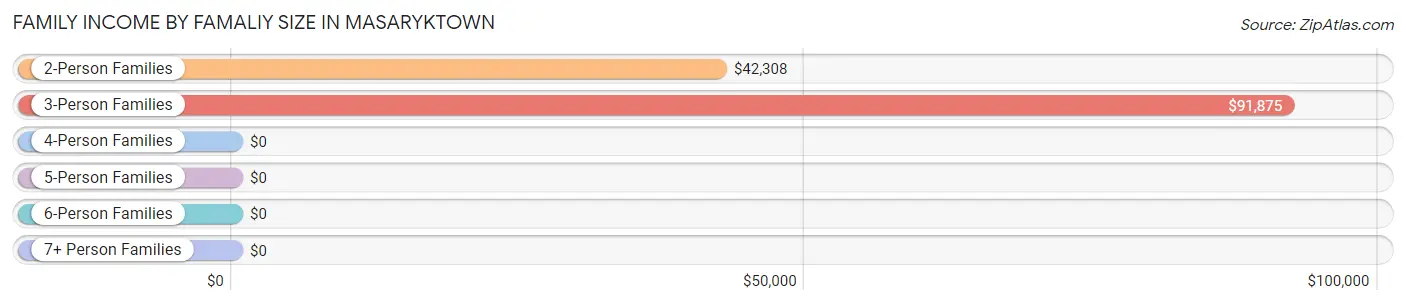
| Income Bracket | # Families | Median Income |
| 2-Person Families | 152 (63.9%) | $42,308 |
| 3-Person Families | 19 (8.0%) | $91,875 |
| 4-Person Families | 42 (17.6%) | $0 |
| 5-Person Families | 13 (5.5%) | $0 |
| 6-Person Families | 0 (0.0%) | $0 |
| 7+ Person Families | 12 (5.0%) | $0 |
| Total | 238 (100.0%) | $40,000 |
Family Income by Number of Earners in Masaryktown
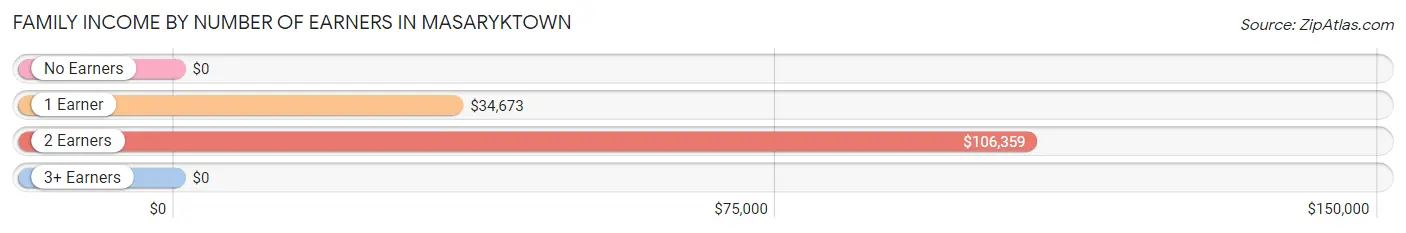
| Number of Earners | # Families | Median Income |
| No Earners | 82 (34.4%) | $0 |
| 1 Earner | 107 (45.0%) | $34,673 |
| 2 Earners | 37 (15.5%) | $106,359 |
| 3+ Earners | 12 (5.0%) | $0 |
| Total | 238 (100.0%) | $40,000 |
Household Income in Masaryktown
Household Income Brackets in Masaryktown
With 117 households falling in the category, the $35,000 to $49,999 income range is the most frequent in Masaryktown, accounting for 26.6% of all households.
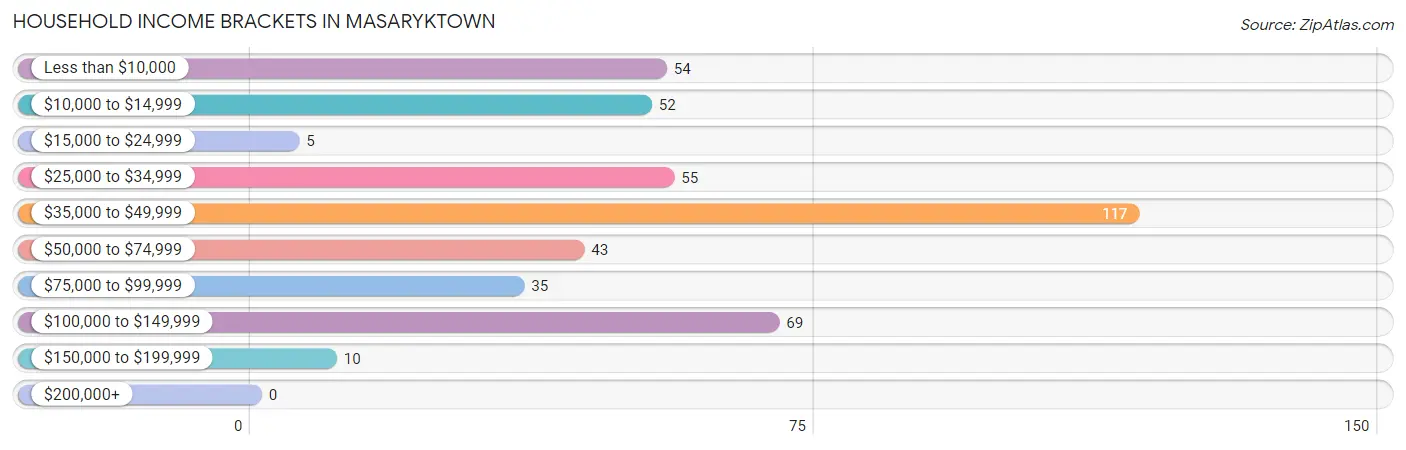
| Income Bracket | # Households | % Households |
| Less than $10,000 | 54 | 12.3% |
| $10,000 to $14,999 | 52 | 11.8% |
| $15,000 to $24,999 | 5 | 1.1% |
| $25,000 to $34,999 | 55 | 12.5% |
| $35,000 to $49,999 | 117 | 26.6% |
| $50,000 to $74,999 | 43 | 9.8% |
| $75,000 to $99,999 | 35 | 8.0% |
| $100,000 to $149,999 | 69 | 15.7% |
| $150,000 to $199,999 | 10 | 2.3% |
| $200,000+ | 0 | 0.0% |
Household Income by Householder Age in Masaryktown
The median household income in Masaryktown is $45,616, with the highest median household income of $92,083 found in the 25 to 44 years age bracket for the primary householder. A total of 100 households (22.7%) fall into this category.
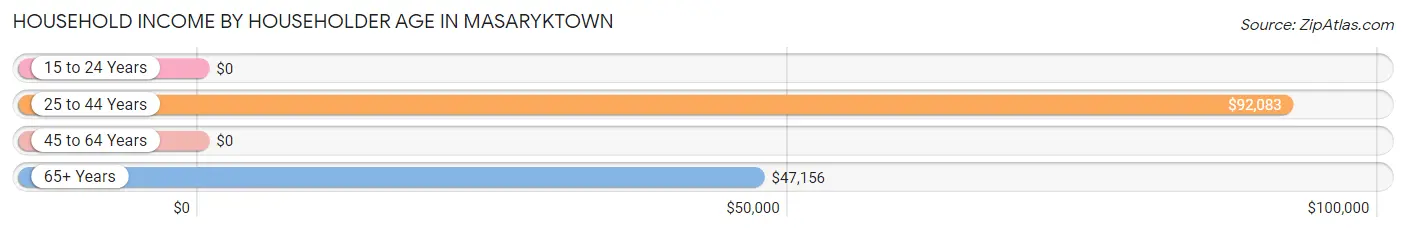
| Income Bracket | # Households | Median Income |
| 15 to 24 Years | 0 (0.0%) | $0 |
| 25 to 44 Years | 100 (22.7%) | $92,083 |
| 45 to 64 Years | 195 (44.3%) | $0 |
| 65+ Years | 145 (33.0%) | $47,156 |
| Total | 440 (100.0%) | $45,616 |
Poverty in Masaryktown
Income Below Poverty by Sex and Age in Masaryktown
With 29.2% poverty level for males and 25.5% for females among the residents of Masaryktown, 15 year old males and under 5 year old females are the most vulnerable to poverty, with 12 males (100.0%) and 12 females (54.5%) in their respective age groups living below the poverty level.
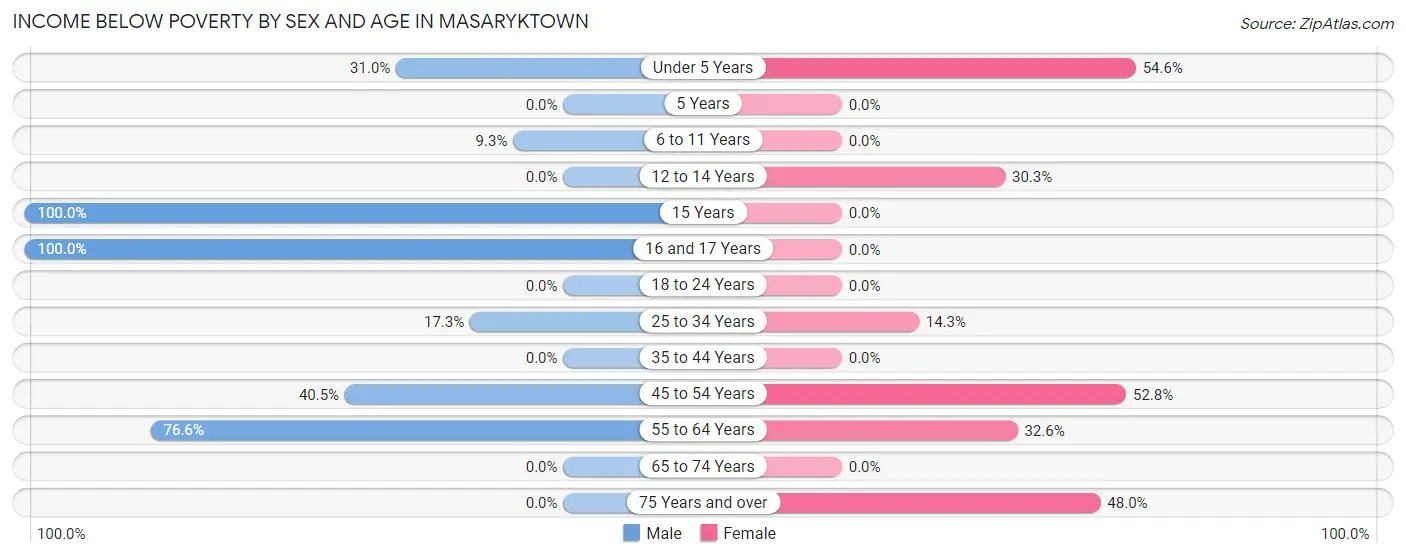
| Age Bracket | Male | Female |
| Under 5 Years | 9 (31.0%) | 12 (54.5%) |
| 5 Years | 0 (0.0%) | 0 (0.0%) |
| 6 to 11 Years | 8 (9.3%) | 0 (0.0%) |
| 12 to 14 Years | 0 (0.0%) | 10 (30.3%) |
| 15 Years | 12 (100.0%) | 0 (0.0%) |
| 16 and 17 Years | 23 (100.0%) | 0 (0.0%) |
| 18 to 24 Years | 0 (0.0%) | 0 (0.0%) |
| 25 to 34 Years | 9 (17.3%) | 8 (14.3%) |
| 35 to 44 Years | 0 (0.0%) | 0 (0.0%) |
| 45 to 54 Years | 45 (40.5%) | 67 (52.8%) |
| 55 to 64 Years | 36 (76.6%) | 15 (32.6%) |
| 65 to 74 Years | 0 (0.0%) | 0 (0.0%) |
| 75 Years and over | 0 (0.0%) | 12 (48.0%) |
| Total | 142 (29.2%) | 124 (25.5%) |
Income Above Poverty by Sex and Age in Masaryktown
According to the poverty statistics in Masaryktown, males aged 35 to 44 years and females aged 5 years are the age groups that are most secure financially, with 100.0% of males and 100.0% of females in these age groups living above the poverty line.
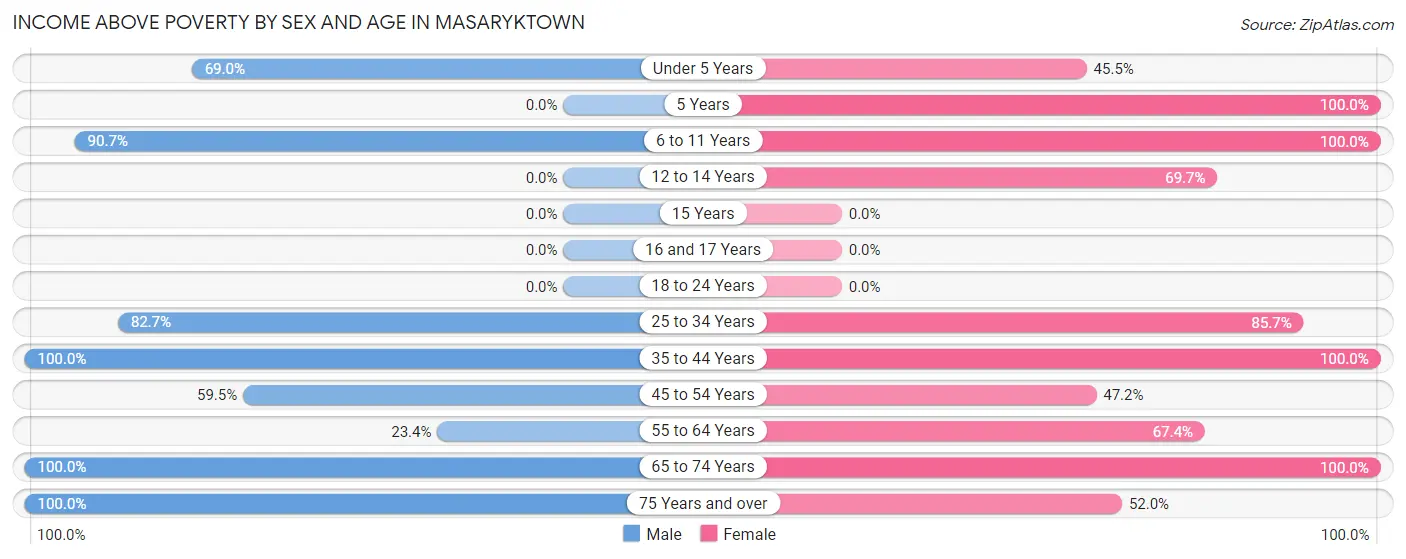
| Age Bracket | Male | Female |
| Under 5 Years | 20 (69.0%) | 10 (45.5%) |
| 5 Years | 0 (0.0%) | 6 (100.0%) |
| 6 to 11 Years | 78 (90.7%) | 33 (100.0%) |
| 12 to 14 Years | 0 (0.0%) | 23 (69.7%) |
| 15 Years | 0 (0.0%) | 0 (0.0%) |
| 16 and 17 Years | 0 (0.0%) | 0 (0.0%) |
| 18 to 24 Years | 0 (0.0%) | 0 (0.0%) |
| 25 to 34 Years | 43 (82.7%) | 48 (85.7%) |
| 35 to 44 Years | 39 (100.0%) | 28 (100.0%) |
| 45 to 54 Years | 66 (59.5%) | 60 (47.2%) |
| 55 to 64 Years | 11 (23.4%) | 31 (67.4%) |
| 65 to 74 Years | 75 (100.0%) | 110 (100.0%) |
| 75 Years and over | 13 (100.0%) | 13 (52.0%) |
| Total | 345 (70.8%) | 362 (74.5%) |
Income Below Poverty Among Married-Couple Families in Masaryktown
The poverty statistics for married-couple families in Masaryktown show that 18.0% or 36 of the total 200 families live below the poverty line. Families with 3 or 4 children have the highest poverty rate of 32.0%, comprising of 8 families. On the other hand, families with 1 or 2 children have the lowest poverty rate of 0.0%, which includes 0 families.
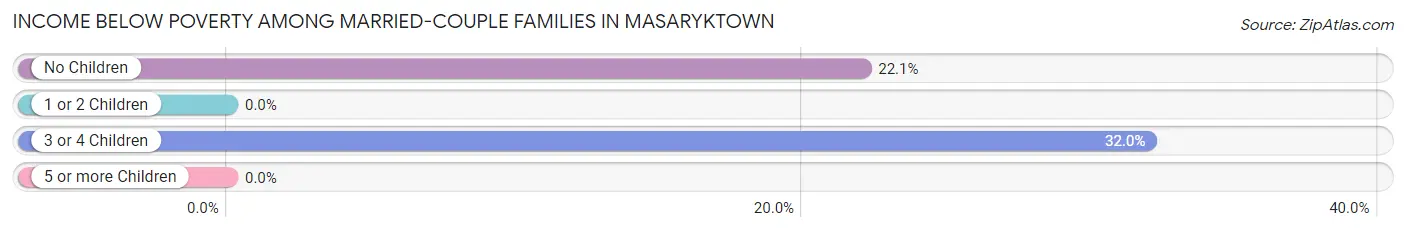
| Children | Above Poverty | Below Poverty |
| No Children | 99 (77.9%) | 28 (22.1%) |
| 1 or 2 Children | 48 (100.0%) | 0 (0.0%) |
| 3 or 4 Children | 17 (68.0%) | 8 (32.0%) |
| 5 or more Children | 0 (0.0%) | 0 (0.0%) |
| Total | 164 (82.0%) | 36 (18.0%) |
Income Below Poverty Among Single-Parent Households in Masaryktown
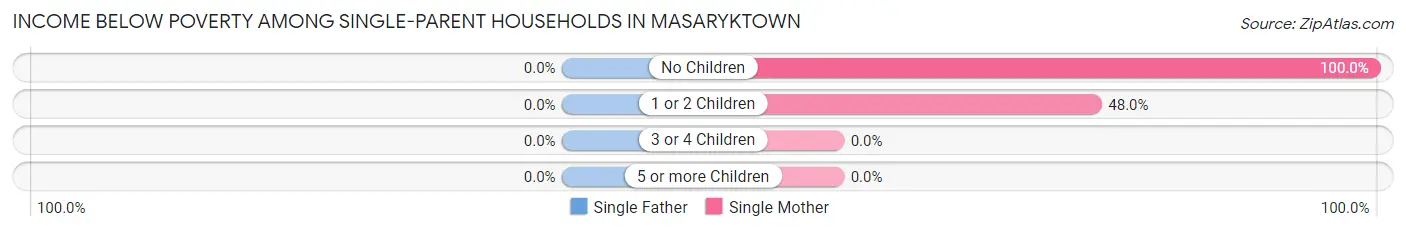
| Children | Single Father | Single Mother |
| No Children | 0 (0.0%) | 5 (100.0%) |
| 1 or 2 Children | 0 (0.0%) | 12 (48.0%) |
| 3 or 4 Children | 0 (0.0%) | 0 (0.0%) |
| 5 or more Children | 0 (0.0%) | 0 (0.0%) |
| Total | 0 (0.0%) | 17 (44.7%) |
Income Below Poverty Among Married-Couple vs Single-Parent Households in Masaryktown
The poverty data for Masaryktown shows that 36 of the married-couple family households (18.0%) and 17 of the single-parent households (44.7%) are living below the poverty level. Within the married-couple family households, those with 3 or 4 children have the highest poverty rate, with 8 households (32.0%) falling below the poverty line. Among the single-parent households, those with no children have the highest poverty rate, with 5 household (100.0%) living below poverty.
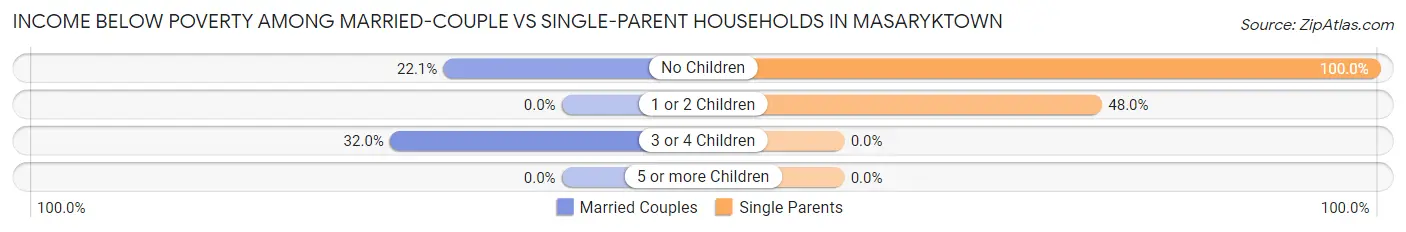
| Children | Married-Couple Families | Single-Parent Households |
| No Children | 28 (22.1%) | 5 (100.0%) |
| 1 or 2 Children | 0 (0.0%) | 12 (48.0%) |
| 3 or 4 Children | 8 (32.0%) | 0 (0.0%) |
| 5 or more Children | 0 (0.0%) | 0 (0.0%) |
| Total | 36 (18.0%) | 17 (44.7%) |
Race in Masaryktown
The most populous races in Masaryktown are White / Caucasian (897 | 90.3%), Hispanic or Latino (54 | 5.4%), and Black / African American (46 | 4.6%).
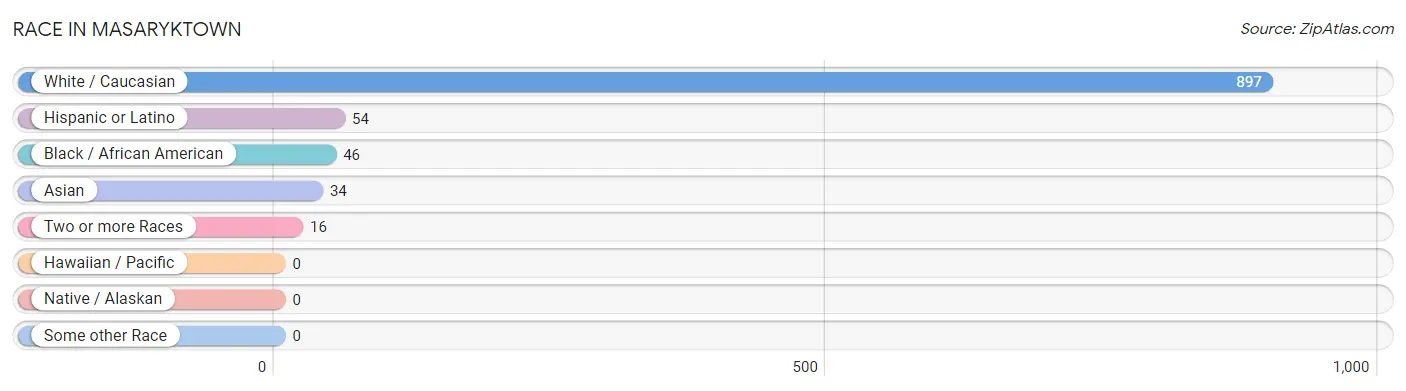
| Race | # Population | % Population |
| Asian | 34 | 3.4% |
| Black / African American | 46 | 4.6% |
| Hawaiian / Pacific | 0 | 0.0% |
| Hispanic or Latino | 54 | 5.4% |
| Native / Alaskan | 0 | 0.0% |
| White / Caucasian | 897 | 90.3% |
| Two or more Races | 16 | 1.6% |
| Some other Race | 0 | 0.0% |
| Total | 993 | 100.0% |
Ancestry in Masaryktown
The most populous ancestries reported in Masaryktown are Irish (200 | 20.1%), English (173 | 17.4%), American (130 | 13.1%), German (62 | 6.2%), and Italian (47 | 4.7%), together accounting for 61.6% of all Masaryktown residents.
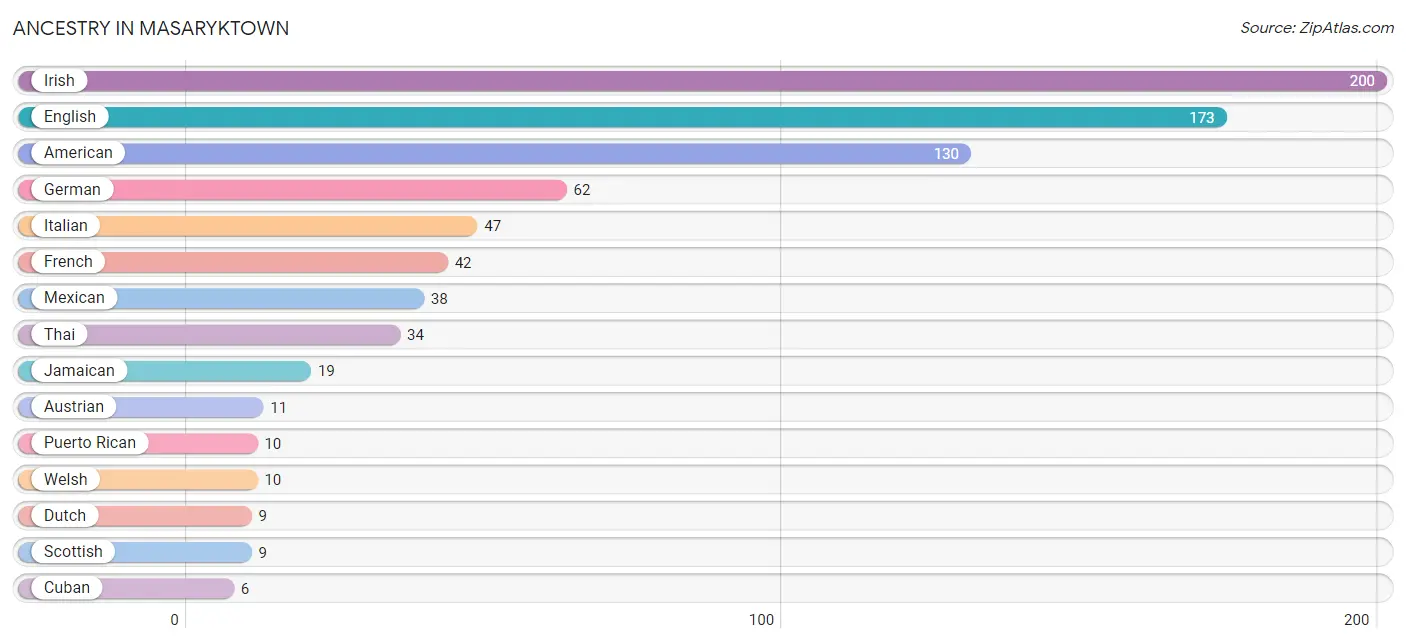
| Ancestry | # Population | % Population |
| American | 130 | 13.1% |
| Austrian | 11 | 1.1% |
| Cuban | 6 | 0.6% |
| Dutch | 9 | 0.9% |
| English | 173 | 17.4% |
| French | 42 | 4.2% |
| German | 62 | 6.2% |
| Irish | 200 | 20.1% |
| Italian | 47 | 4.7% |
| Jamaican | 19 | 1.9% |
| Mexican | 38 | 3.8% |
| Puerto Rican | 10 | 1.0% |
| Scottish | 9 | 0.9% |
| Thai | 34 | 3.4% |
| Welsh | 10 | 1.0% | View All 15 Rows |
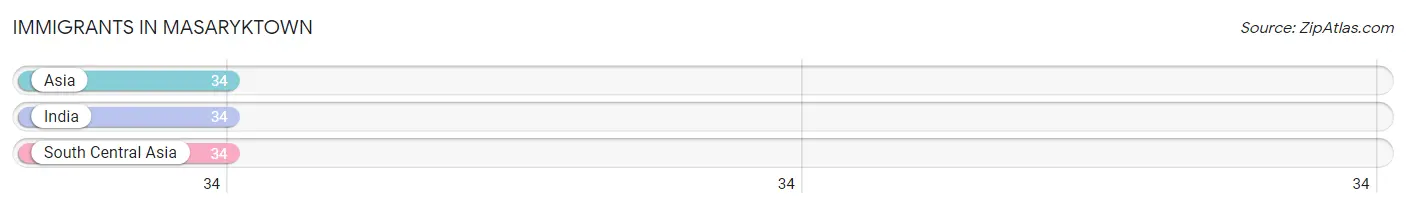
Immigrants in Masaryktown
The most numerous immigrant groups reported in Masaryktown came from Asia (34 | 3.4%), India (34 | 3.4%), and South Central Asia (34 | 3.4%), together accounting for 10.3% of all Masaryktown residents.
| Immigration Origin | # Population | % Population |
| Asia | 34 | 3.4% |
| India | 34 | 3.4% |
| South Central Asia | 34 | 3.4% | View All 3 Rows |
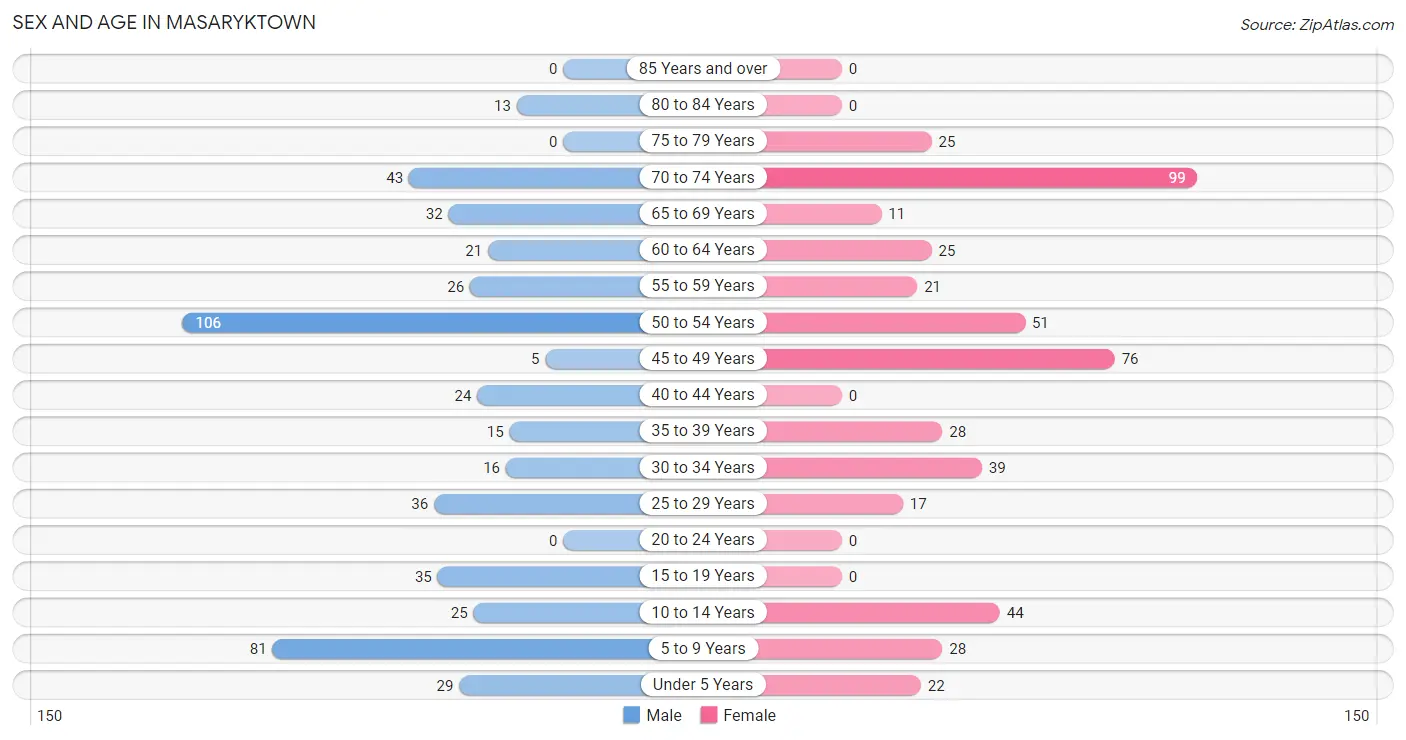
Sex and Age in Masaryktown
Sex and Age in Masaryktown
The most populous age groups in Masaryktown are 50 to 54 Years (106 | 20.9%) for men and 70 to 74 Years (99 | 20.4%) for women.
| Age Bracket | Male | Female |
| Under 5 Years | 29 (5.7%) | 22 (4.5%) |
| 5 to 9 Years | 81 (16.0%) | 28 (5.8%) |
| 10 to 14 Years | 25 (4.9%) | 44 (9.0%) |
| 15 to 19 Years | 35 (6.9%) | 0 (0.0%) |
| 20 to 24 Years | 0 (0.0%) | 0 (0.0%) |
| 25 to 29 Years | 36 (7.1%) | 17 (3.5%) |
| 30 to 34 Years | 16 (3.2%) | 39 (8.0%) |
| 35 to 39 Years | 15 (3.0%) | 28 (5.8%) |
| 40 to 44 Years | 24 (4.7%) | 0 (0.0%) |
| 45 to 49 Years | 5 (1.0%) | 76 (15.6%) |
| 50 to 54 Years | 106 (20.9%) | 51 (10.5%) |
| 55 to 59 Years | 26 (5.1%) | 21 (4.3%) |
| 60 to 64 Years | 21 (4.1%) | 25 (5.1%) |
| 65 to 69 Years | 32 (6.3%) | 11 (2.3%) |
| 70 to 74 Years | 43 (8.5%) | 99 (20.4%) |
| 75 to 79 Years | 0 (0.0%) | 25 (5.1%) |
| 80 to 84 Years | 13 (2.6%) | 0 (0.0%) |
| 85 Years and over | 0 (0.0%) | 0 (0.0%) |
| Total | 507 (100.0%) | 486 (100.0%) |
Families and Households in Masaryktown
Median Family Size in Masaryktown
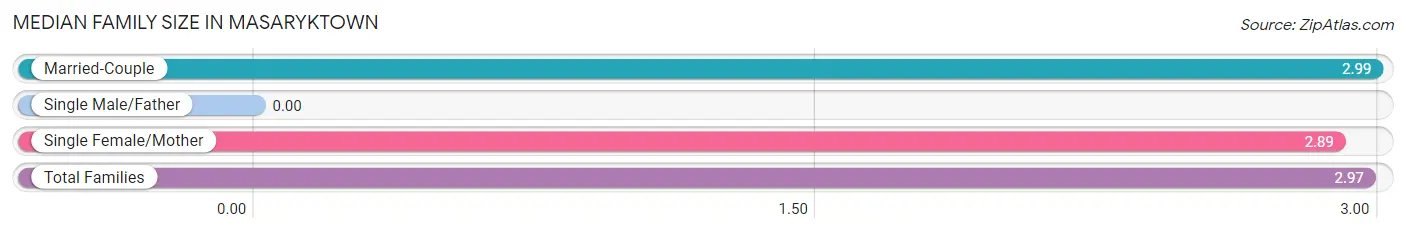
| Family Type | # Families | Family Size |
| Married-Couple | 200 (84.0%) | 2.99 |
| Single Male/Father | 0 (0.0%) | - |
| Single Female/Mother | 38 (16.0%) | 2.89 |
| Total Families | 238 (100.0%) | 2.97 |
Median Household Size in Masaryktown
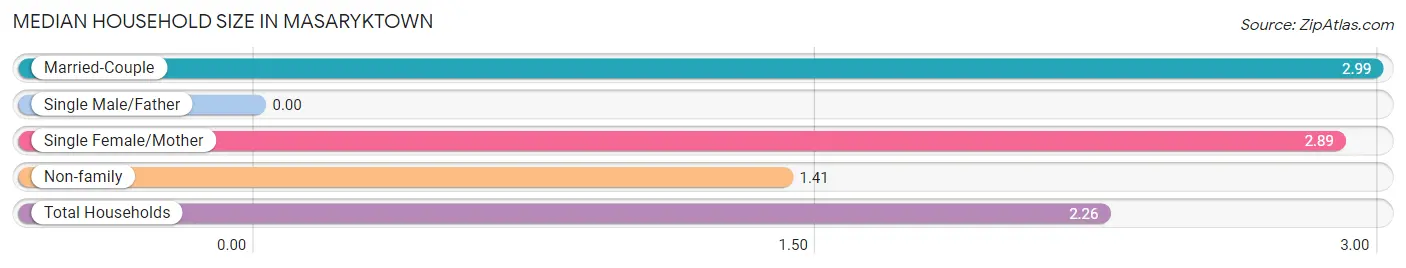
| Household Type | # Households | Household Size |
| Married-Couple | 200 (45.5%) | 2.99 |
| Single Male/Father | 0 (0.0%) | - |
| Single Female/Mother | 38 (8.6%) | 2.89 |
| Non-family | 202 (45.9%) | 1.41 |
| Total Households | 440 (100.0%) | 2.26 |
Household Size by Marriage Status in Masaryktown
Out of a total of 440 households in Masaryktown, 238 (54.1%) are family households, while 202 (45.9%) are nonfamily households. The most numerous type of family households are 2-person households, comprising 152, and the most common type of nonfamily households are 1-person households, comprising 156.
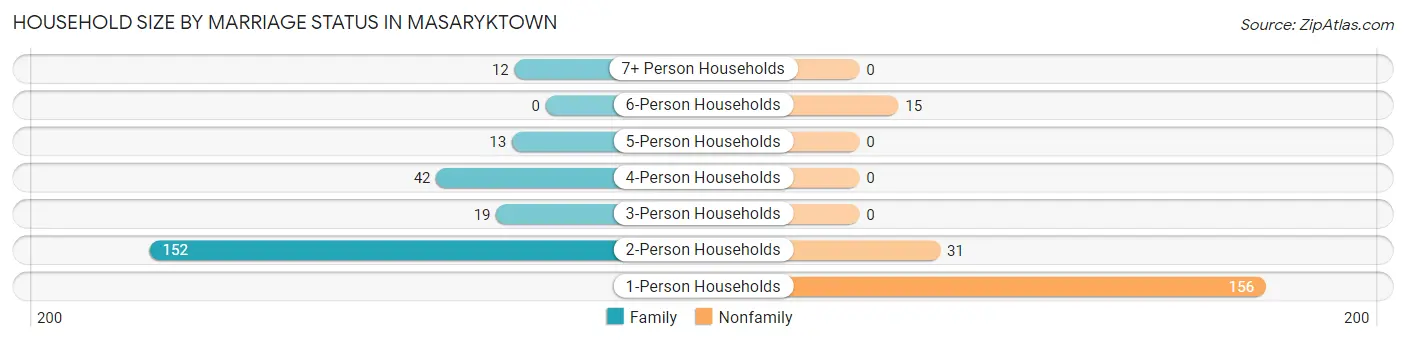
| Household Size | Family Households | Nonfamily Households |
| 1-Person Households | - | 156 (35.4%) |
| 2-Person Households | 152 (34.5%) | 31 (7.0%) |
| 3-Person Households | 19 (4.3%) | 0 (0.0%) |
| 4-Person Households | 42 (9.6%) | 0 (0.0%) |
| 5-Person Households | 13 (2.9%) | 0 (0.0%) |
| 6-Person Households | 0 (0.0%) | 15 (3.4%) |
| 7+ Person Households | 12 (2.7%) | 0 (0.0%) |
| Total | 238 (54.1%) | 202 (45.9%) |
Female Fertility in Masaryktown
Fertility by Age in Masaryktown
| Age Bracket | Women with Births | Births / 1,000 Women |
| 15 to 19 years | 0 (0.0%) | 0.0 |
| 20 to 34 years | 0 (0.0%) | 0.0 |
| 35 to 50 years | 0 (0.0%) | 0.0 |
| Total | 0 (0.0%) | 0.0 |
Fertility by Age by Marriage Status in Masaryktown
| Age Bracket | Married | Unmarried |
| 15 to 19 years | 0 (0.0%) | 0 (0.0%) |
| 20 to 34 years | 0 (0.0%) | 0 (0.0%) |
| 35 to 50 years | 0 (0.0%) | 0 (0.0%) |
| Total | 0 (0.0%) | 0 (0.0%) |
Fertility by Education in Masaryktown
| Educational Attainment | Women with Births | Births / 1,000 Women |
| Less than High School | 0 (0.0%) | 0.0 |
| High School Diploma | 0 (0.0%) | 0.0 |
| College or Associate's Degree | 0 (0.0%) | 0.0 |
| Bachelor's Degree | 0 (0.0%) | 0.0 |
| Graduate Degree | 0 (0.0%) | 0.0 |
| Total | 0 (0.0%) | 0.0 |
Fertility by Education by Marriage Status in Masaryktown
| Educational Attainment | Married | Unmarried |
| Less than High School | 0 (0.0%) | 0 (0.0%) |
| High School Diploma | 0 (0.0%) | 0 (0.0%) |
| College or Associate's Degree | 0 (0.0%) | 0 (0.0%) |
| Bachelor's Degree | 0 (0.0%) | 0 (0.0%) |
| Graduate Degree | 0 (0.0%) | 0 (0.0%) |
| Total | 0 (0.0%) | 0 (0.0%) |
Employment Characteristics in Masaryktown
Employment by Class of Employer in Masaryktown
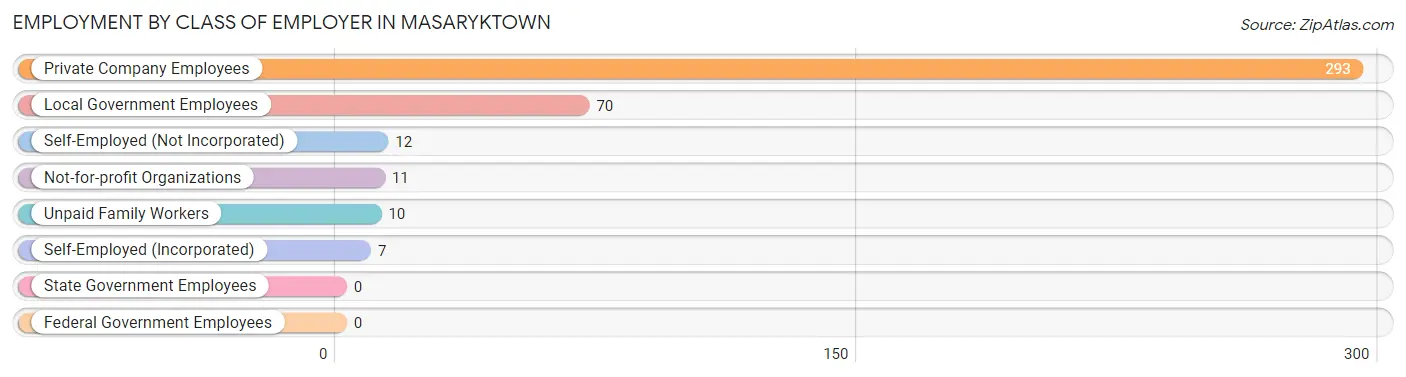
Among the 403 employed individuals in Masaryktown, private company employees (293 | 72.7%), local government employees (70 | 17.4%), and self-employed (not incorporated) (12 | 3.0%) make up the most common classes of employment.
| Employer Class | # Employees | % Employees |
| Private Company Employees | 293 | 72.7% |
| Self-Employed (Incorporated) | 7 | 1.7% |
| Self-Employed (Not Incorporated) | 12 | 3.0% |
| Not-for-profit Organizations | 11 | 2.7% |
| Local Government Employees | 70 | 17.4% |
| State Government Employees | 0 | 0.0% |
| Federal Government Employees | 0 | 0.0% |
| Unpaid Family Workers | 10 | 2.5% |
| Total | 403 | 100.0% |
Employment Status by Age in Masaryktown
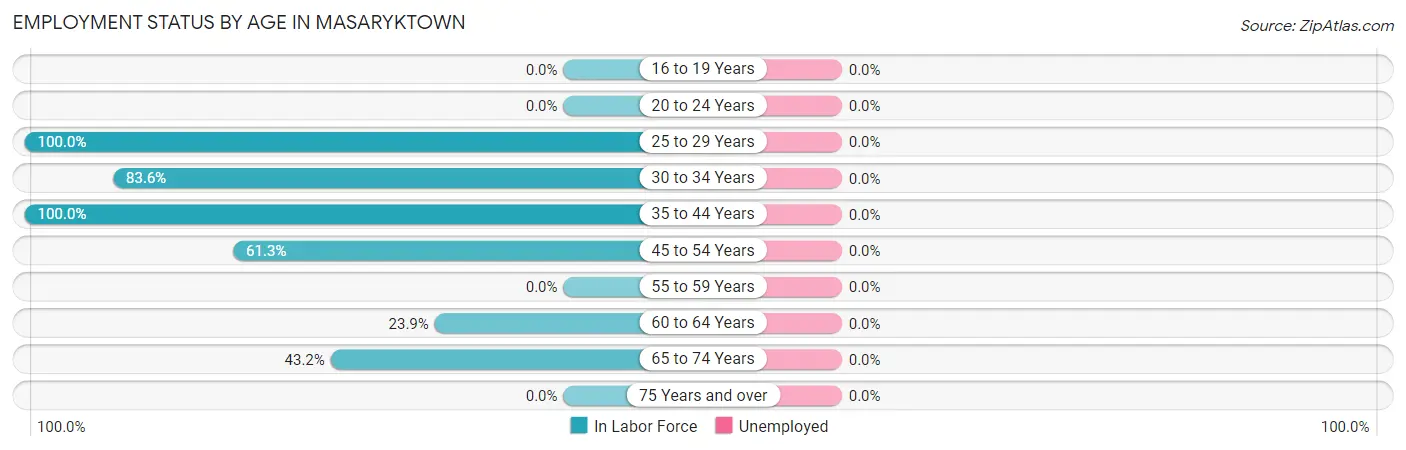
| Age Bracket | In Labor Force | Unemployed |
| 16 to 19 Years | 0 (0.0%) | 0 (0.0%) |
| 20 to 24 Years | 0 (0.0%) | 0 (0.0%) |
| 25 to 29 Years | 53 (100.0%) | 0 (0.0%) |
| 30 to 34 Years | 46 (83.6%) | 0 (0.0%) |
| 35 to 44 Years | 67 (100.0%) | 0 (0.0%) |
| 45 to 54 Years | 146 (61.3%) | 0 (0.0%) |
| 55 to 59 Years | 0 (0.0%) | 0 (0.0%) |
| 60 to 64 Years | 11 (23.9%) | 0 (0.0%) |
| 65 to 74 Years | 80 (43.2%) | 0 (0.0%) |
| 75 Years and over | 0 (0.0%) | 0 (0.0%) |
| Total | 403 (53.6%) | 0 (0.0%) |
Employment Status by Educational Attainment in Masaryktown
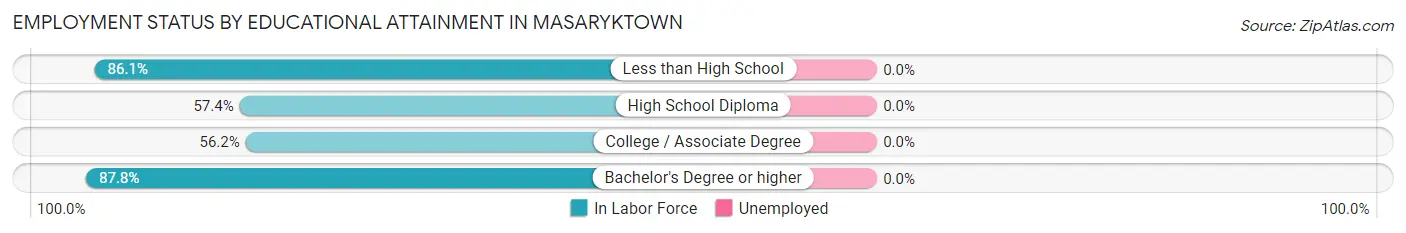
| Educational Attainment | In Labor Force | Unemployed |
| Less than High School | 68 (86.1%) | 0 (0.0%) |
| High School Diploma | 105 (57.4%) | 0 (0.0%) |
| College / Associate Degree | 114 (56.2%) | 0 (0.0%) |
| Bachelor's Degree or higher | 36 (87.8%) | 0 (0.0%) |
| Total | 323 (63.8%) | 0 (0.0%) |
Employment Occupations by Sex in Masaryktown
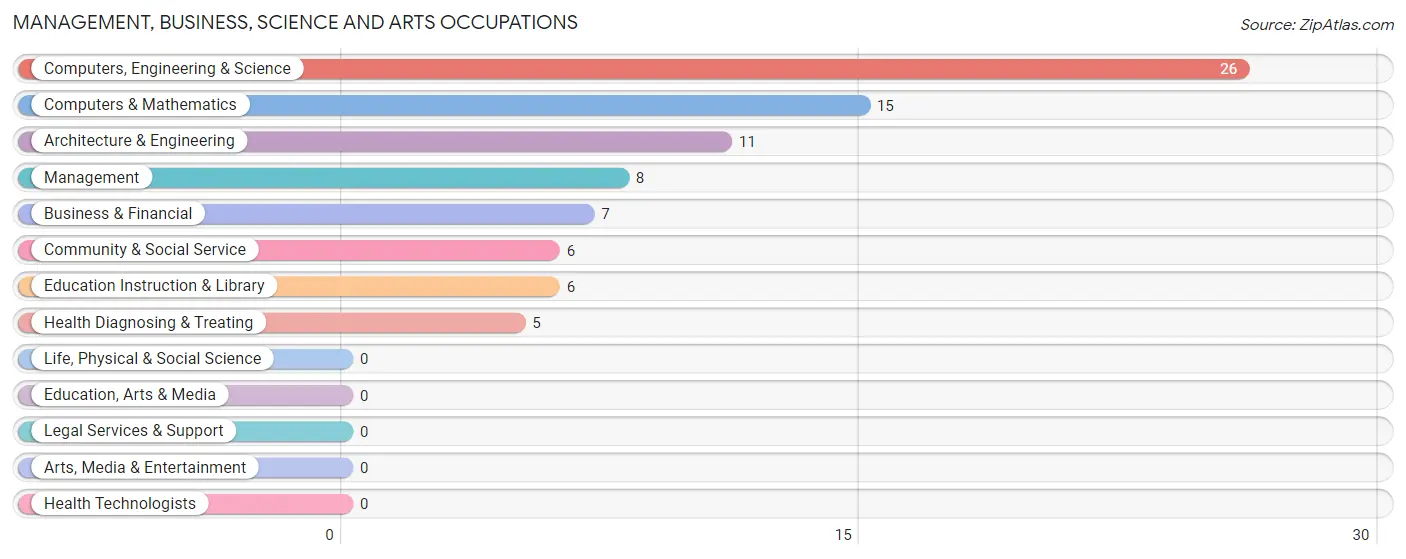
Management, Business, Science and Arts Occupations
The most common Management, Business, Science and Arts occupations in Masaryktown are Computers, Engineering & Science (26 | 6.5%), Computers & Mathematics (15 | 3.7%), Architecture & Engineering (11 | 2.7%), Management (8 | 2.0%), and Business & Financial (7 | 1.7%).
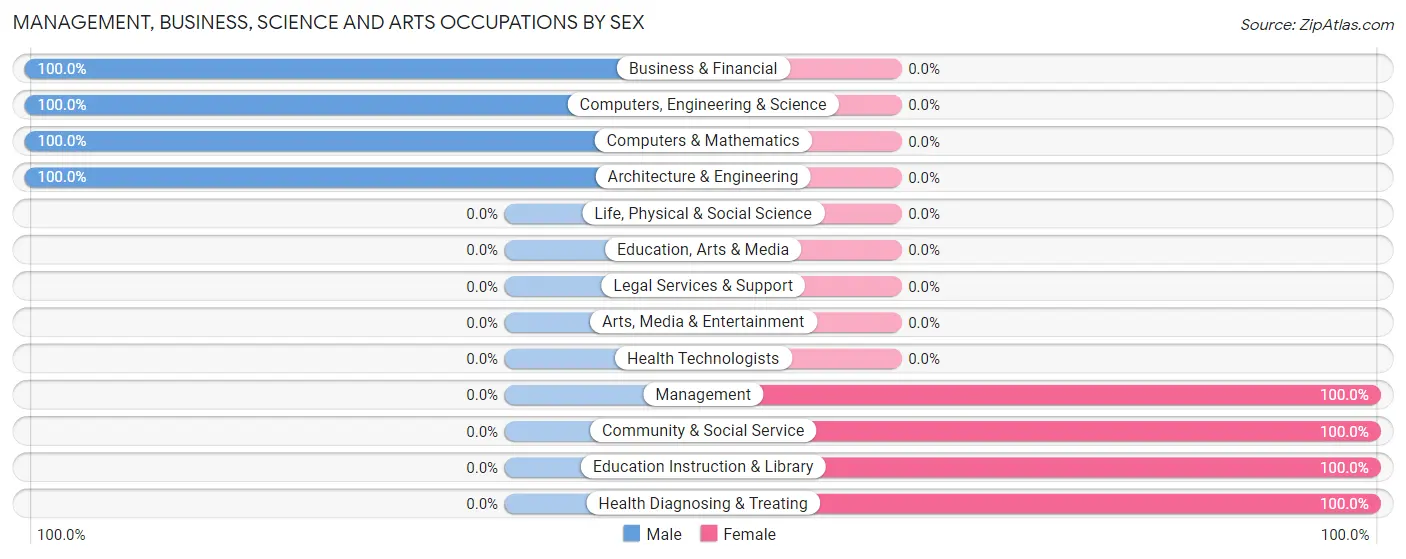
Management, Business, Science and Arts Occupations by Sex
Within the Management, Business, Science and Arts occupations in Masaryktown, the most male-oriented occupations are Business & Financial (100.0%), Computers, Engineering & Science (100.0%), and Computers & Mathematics (100.0%), while the most female-oriented occupations are Management (100.0%), Community & Social Service (100.0%), and Education Instruction & Library (100.0%).
| Occupation | Male | Female |
| Management | 0 (0.0%) | 8 (100.0%) |
| Business & Financial | 7 (100.0%) | 0 (0.0%) |
| Computers, Engineering & Science | 26 (100.0%) | 0 (0.0%) |
| Computers & Mathematics | 15 (100.0%) | 0 (0.0%) |
| Architecture & Engineering | 11 (100.0%) | 0 (0.0%) |
| Life, Physical & Social Science | 0 (0.0%) | 0 (0.0%) |
| Community & Social Service | 0 (0.0%) | 6 (100.0%) |
| Education, Arts & Media | 0 (0.0%) | 0 (0.0%) |
| Legal Services & Support | 0 (0.0%) | 0 (0.0%) |
| Education Instruction & Library | 0 (0.0%) | 6 (100.0%) |
| Arts, Media & Entertainment | 0 (0.0%) | 0 (0.0%) |
| Health Diagnosing & Treating | 0 (0.0%) | 5 (100.0%) |
| Health Technologists | 0 (0.0%) | 0 (0.0%) |
| Total (Category) | 33 (63.5%) | 19 (36.5%) |
| Total (Overall) | 171 (42.4%) | 232 (57.6%) |
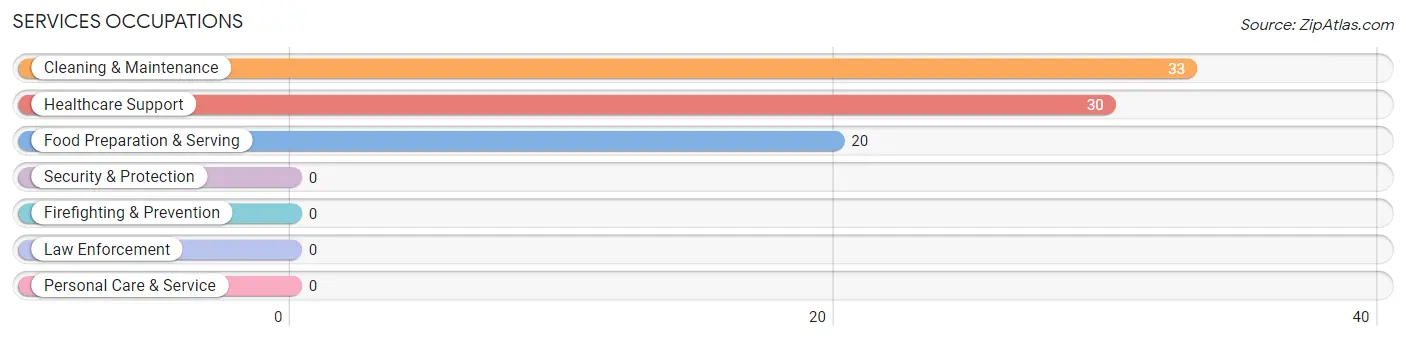
Services Occupations
The most common Services occupations in Masaryktown are Cleaning & Maintenance (33 | 8.2%), Healthcare Support (30 | 7.4%), and Food Preparation & Serving (20 | 5.0%).
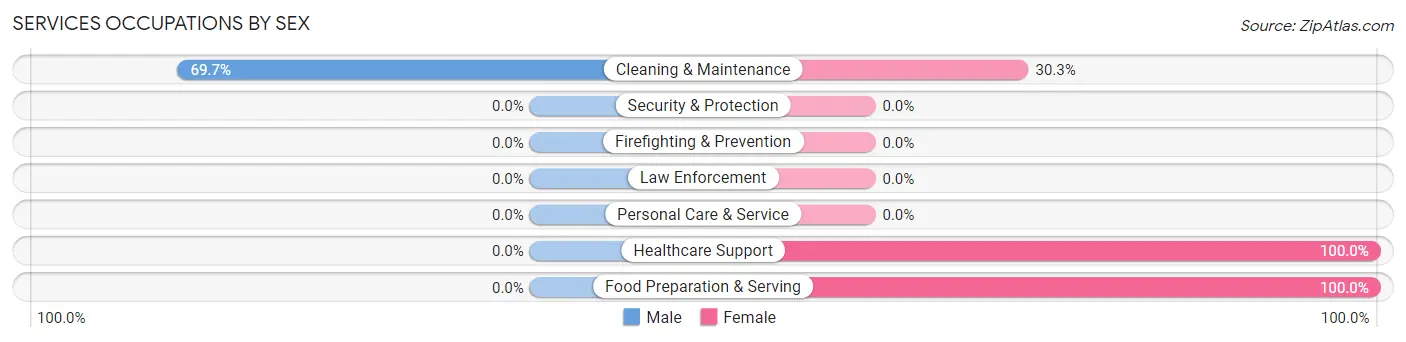
Services Occupations by Sex
| Occupation | Male | Female |
| Healthcare Support | 0 (0.0%) | 30 (100.0%) |
| Security & Protection | 0 (0.0%) | 0 (0.0%) |
| Firefighting & Prevention | 0 (0.0%) | 0 (0.0%) |
| Law Enforcement | 0 (0.0%) | 0 (0.0%) |
| Food Preparation & Serving | 0 (0.0%) | 20 (100.0%) |
| Cleaning & Maintenance | 23 (69.7%) | 10 (30.3%) |
| Personal Care & Service | 0 (0.0%) | 0 (0.0%) |
| Total (Category) | 23 (27.7%) | 60 (72.3%) |
| Total (Overall) | 171 (42.4%) | 232 (57.6%) |
Sales and Office Occupations
The most common Sales and Office occupations in Masaryktown are Office & Administration (84 | 20.8%), and Sales & Related (31 | 7.7%).
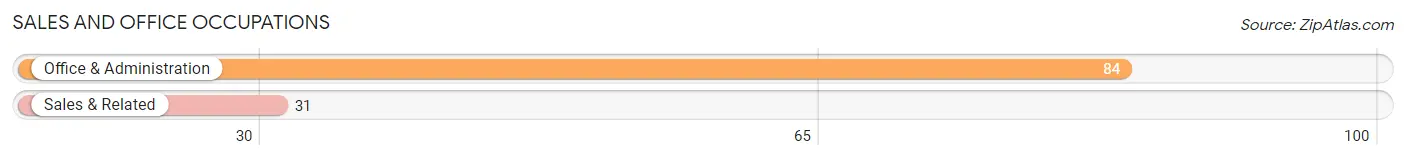
Sales and Office Occupations by Sex

| Occupation | Male | Female |
| Sales & Related | 31 (100.0%) | 0 (0.0%) |
| Office & Administration | 0 (0.0%) | 84 (100.0%) |
| Total (Category) | 31 (27.0%) | 84 (73.0%) |
| Total (Overall) | 171 (42.4%) | 232 (57.6%) |
Natural Resources, Construction and Maintenance Occupations
The most common Natural Resources, Construction and Maintenance occupations in Masaryktown are Construction & Extraction (50 | 12.4%), and Installation, Maintenance & Repair (34 | 8.4%).
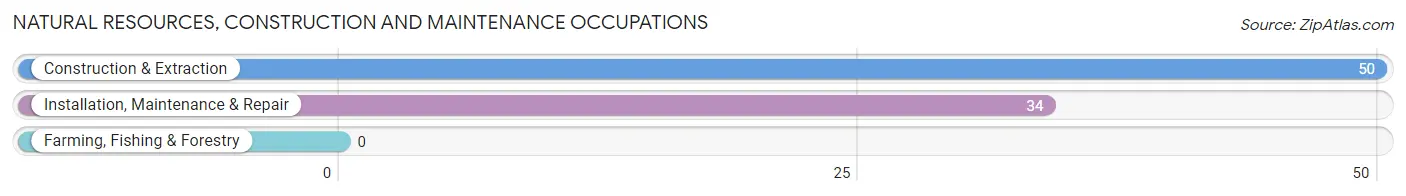
Natural Resources, Construction and Maintenance Occupations by Sex
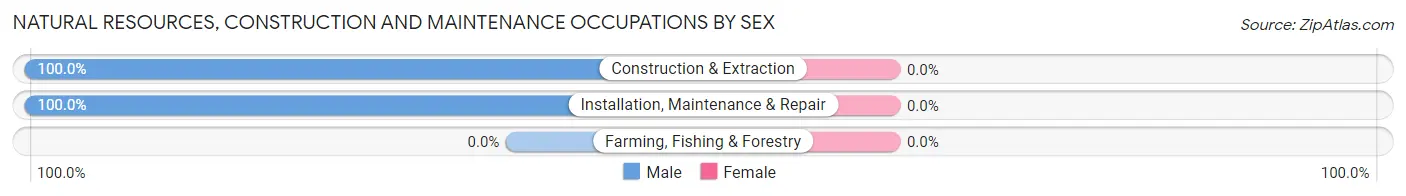
| Occupation | Male | Female |
| Farming, Fishing & Forestry | 0 (0.0%) | 0 (0.0%) |
| Construction & Extraction | 50 (100.0%) | 0 (0.0%) |
| Installation, Maintenance & Repair | 34 (100.0%) | 0 (0.0%) |
| Total (Category) | 84 (100.0%) | 0 (0.0%) |
| Total (Overall) | 171 (42.4%) | 232 (57.6%) |
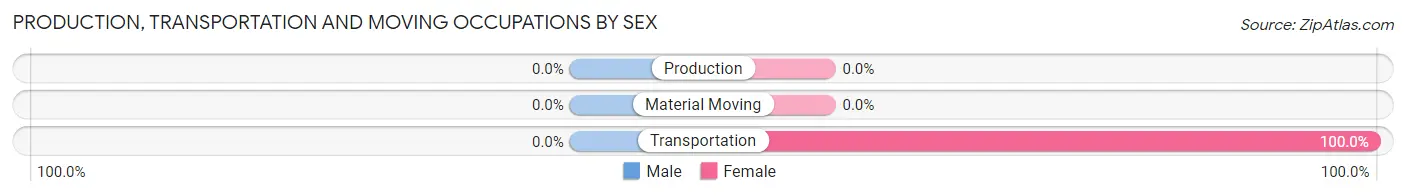
Production, Transportation and Moving Occupations
The most common Production, Transportation and Moving occupations in Masaryktown are , and Transportation (69 | 17.1%).
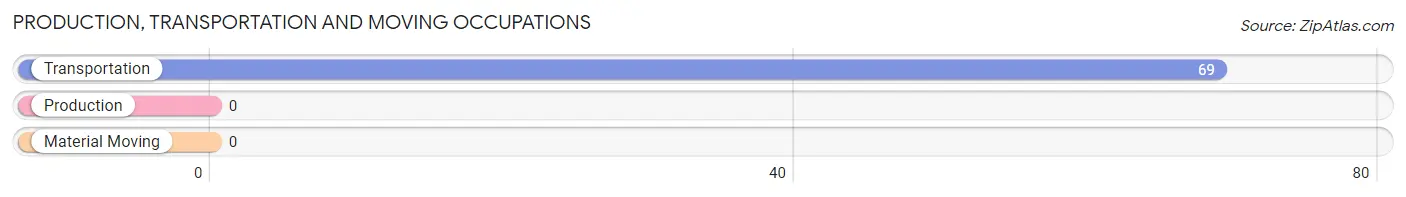
Production, Transportation and Moving Occupations by Sex
| Occupation | Male | Female |
| Production | 0 (0.0%) | 0 (0.0%) |
| Transportation | 0 (0.0%) | 69 (100.0%) |
| Material Moving | 0 (0.0%) | 0 (0.0%) |
| Total (Category) | 0 (0.0%) | 69 (100.0%) |
| Total (Overall) | 171 (42.4%) | 232 (57.6%) |
Employment Industries by Sex in Masaryktown
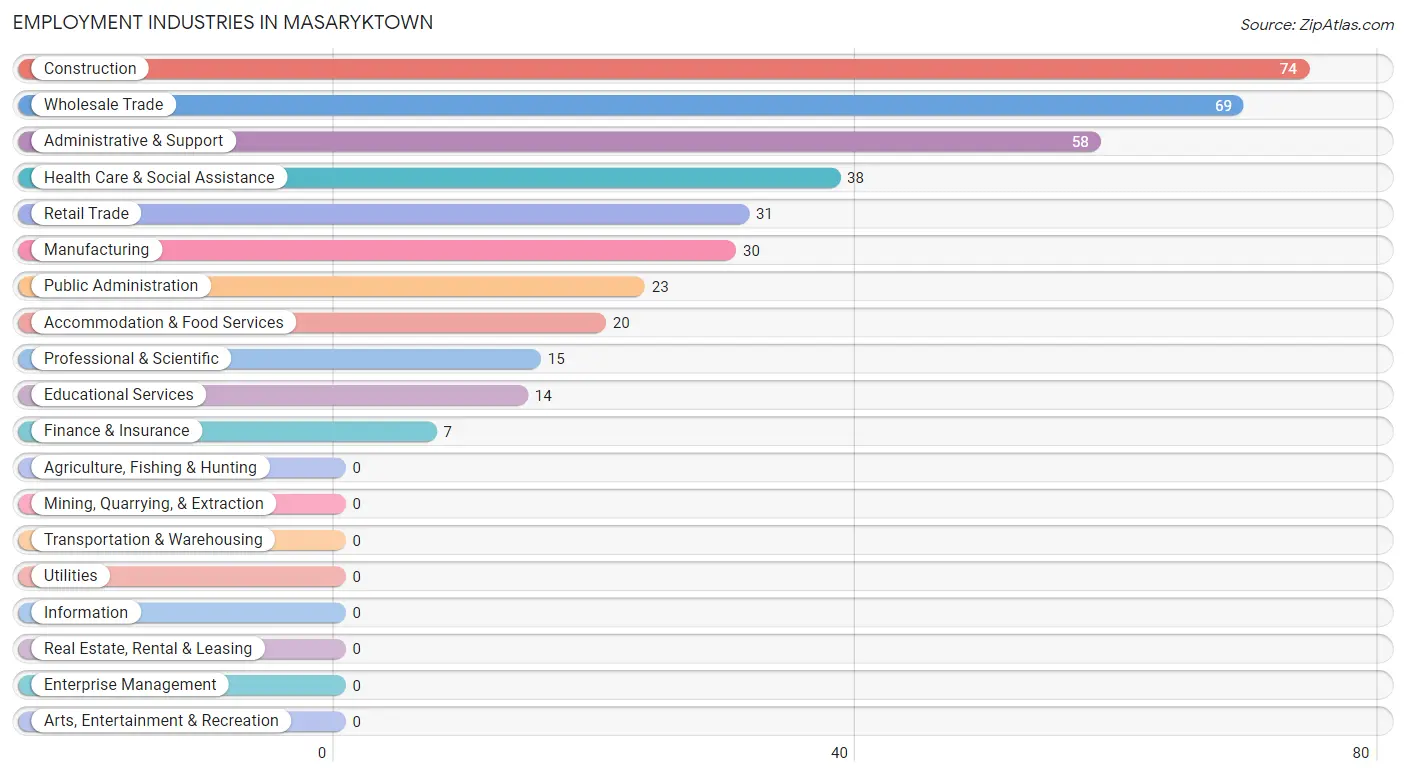
Employment Industries in Masaryktown
The major employment industries in Masaryktown include Construction (74 | 18.4%), Wholesale Trade (69 | 17.1%), Administrative & Support (58 | 14.4%), Health Care & Social Assistance (38 | 9.4%), and Retail Trade (31 | 7.7%).
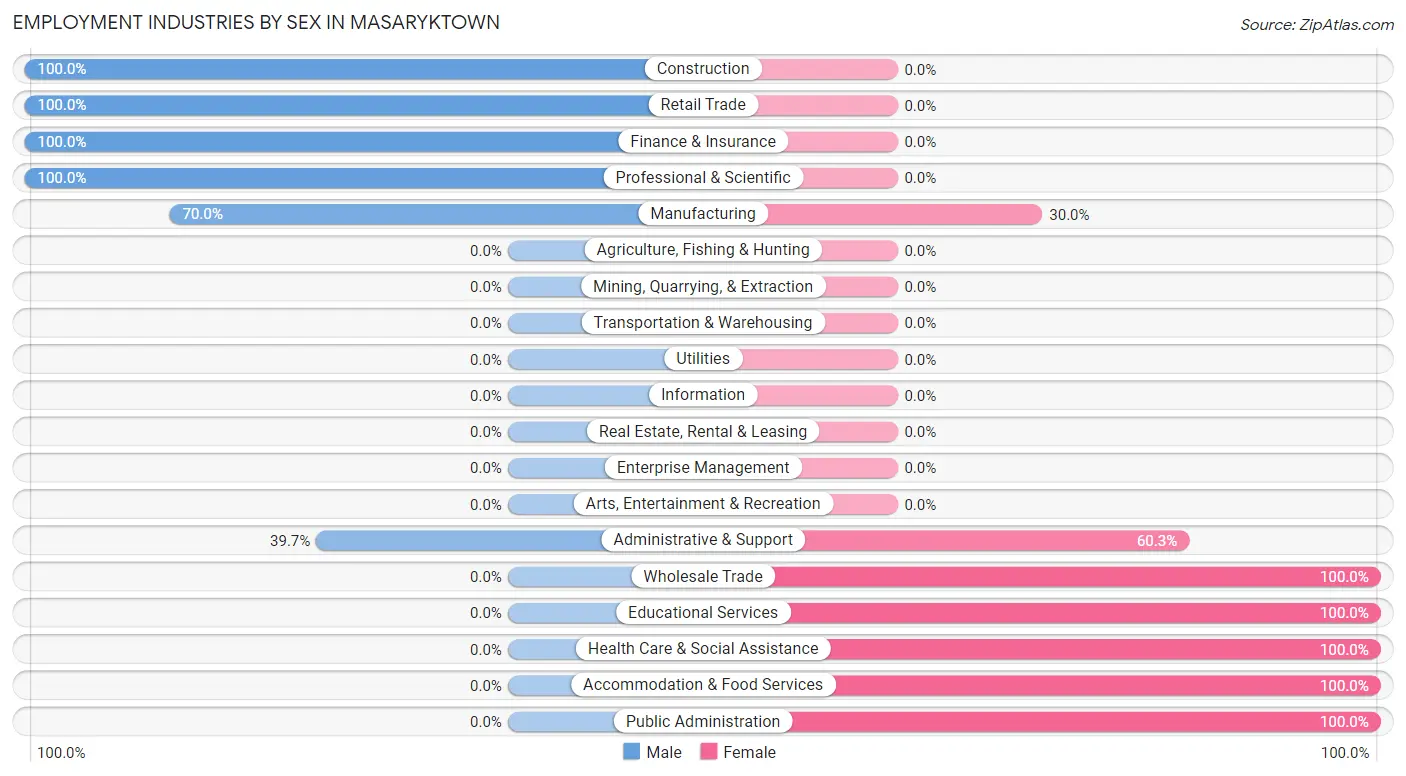
Employment Industries by Sex in Masaryktown
The Masaryktown industries that see more men than women are Construction (100.0%), Retail Trade (100.0%), and Finance & Insurance (100.0%), whereas the industries that tend to have a higher number of women are Wholesale Trade (100.0%), Educational Services (100.0%), and Health Care & Social Assistance (100.0%).
| Industry | Male | Female |
| Agriculture, Fishing & Hunting | 0 (0.0%) | 0 (0.0%) |
| Mining, Quarrying, & Extraction | 0 (0.0%) | 0 (0.0%) |
| Construction | 74 (100.0%) | 0 (0.0%) |
| Manufacturing | 21 (70.0%) | 9 (30.0%) |
| Wholesale Trade | 0 (0.0%) | 69 (100.0%) |
| Retail Trade | 31 (100.0%) | 0 (0.0%) |
| Transportation & Warehousing | 0 (0.0%) | 0 (0.0%) |
| Utilities | 0 (0.0%) | 0 (0.0%) |
| Information | 0 (0.0%) | 0 (0.0%) |
| Finance & Insurance | 7 (100.0%) | 0 (0.0%) |
| Real Estate, Rental & Leasing | 0 (0.0%) | 0 (0.0%) |
| Professional & Scientific | 15 (100.0%) | 0 (0.0%) |
| Enterprise Management | 0 (0.0%) | 0 (0.0%) |
| Administrative & Support | 23 (39.7%) | 35 (60.3%) |
| Educational Services | 0 (0.0%) | 14 (100.0%) |
| Health Care & Social Assistance | 0 (0.0%) | 38 (100.0%) |
| Arts, Entertainment & Recreation | 0 (0.0%) | 0 (0.0%) |
| Accommodation & Food Services | 0 (0.0%) | 20 (100.0%) |
| Public Administration | 0 (0.0%) | 23 (100.0%) |
| Total | 171 (42.4%) | 232 (57.6%) |
Education in Masaryktown
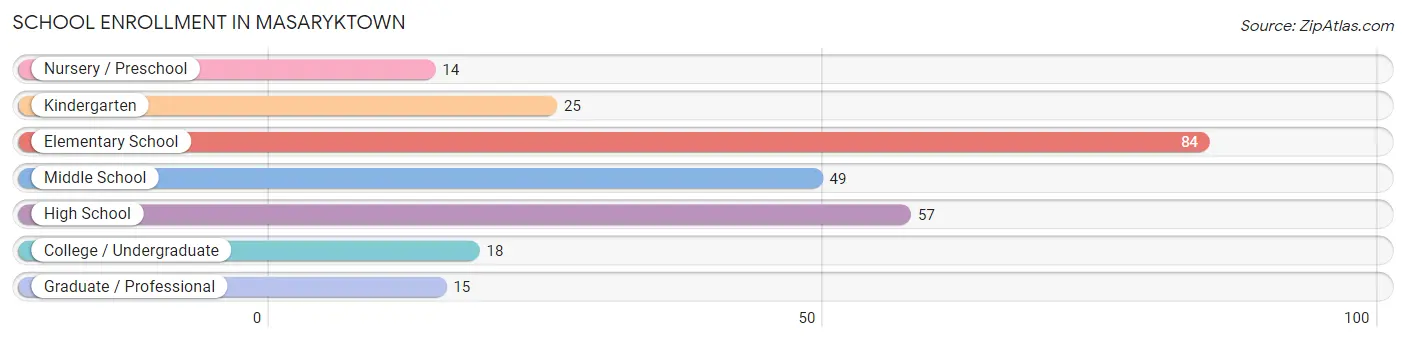
School Enrollment in Masaryktown
The most common levels of schooling among the 262 students in Masaryktown are elementary school (84 | 32.1%), high school (57 | 21.8%), and middle school (49 | 18.7%).
| School Level | # Students | % Students |
| Nursery / Preschool | 14 | 5.3% |
| Kindergarten | 25 | 9.5% |
| Elementary School | 84 | 32.1% |
| Middle School | 49 | 18.7% |
| High School | 57 | 21.8% |
| College / Undergraduate | 18 | 6.9% |
| Graduate / Professional | 15 | 5.7% |
| Total | 262 | 100.0% |
School Enrollment by Age by Funding Source in Masaryktown
Out of a total of 262 students who are enrolled in schools in Masaryktown, 20 (7.6%) attend a private institution, while the remaining 242 (92.4%) are enrolled in public schools. The age group of 35 years and over has the highest likelihood of being enrolled in private schools, with 15 (100.0% in the age bracket) enrolled. Conversely, the age group of 3 to 4 year olds has the lowest likelihood of being enrolled in a private school, with 14 (100.0% in the age bracket) attending a public institution.
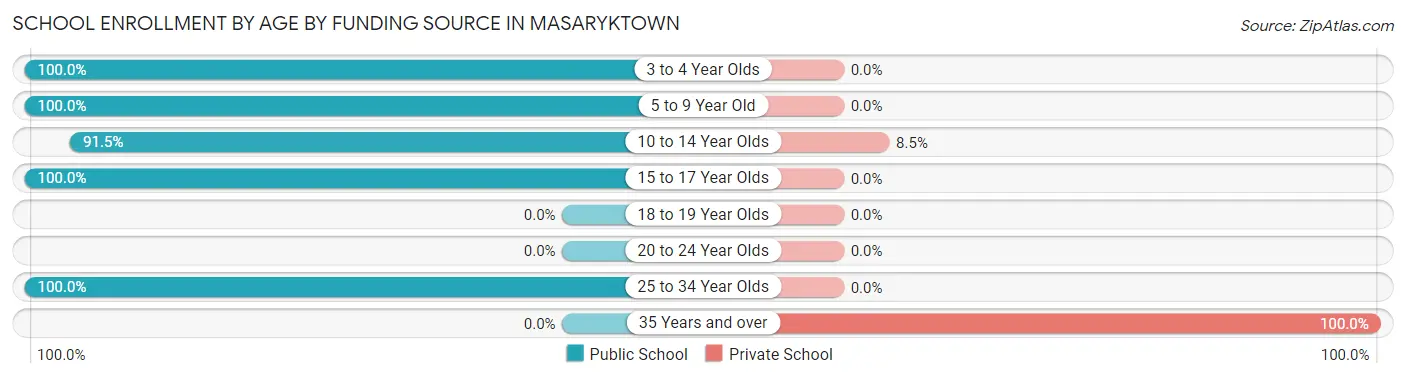
| Age Bracket | Public School | Private School |
| 3 to 4 Year Olds | 14 (100.0%) | 0 (0.0%) |
| 5 to 9 Year Old | 109 (100.0%) | 0 (0.0%) |
| 10 to 14 Year Olds | 54 (91.5%) | 5 (8.5%) |
| 15 to 17 Year Olds | 35 (100.0%) | 0 (0.0%) |
| 18 to 19 Year Olds | 0 (0.0%) | 0 (0.0%) |
| 20 to 24 Year Olds | 0 (0.0%) | 0 (0.0%) |
| 25 to 34 Year Olds | 30 (100.0%) | 0 (0.0%) |
| 35 Years and over | 0 (0.0%) | 15 (100.0%) |
| Total | 242 (92.4%) | 20 (7.6%) |
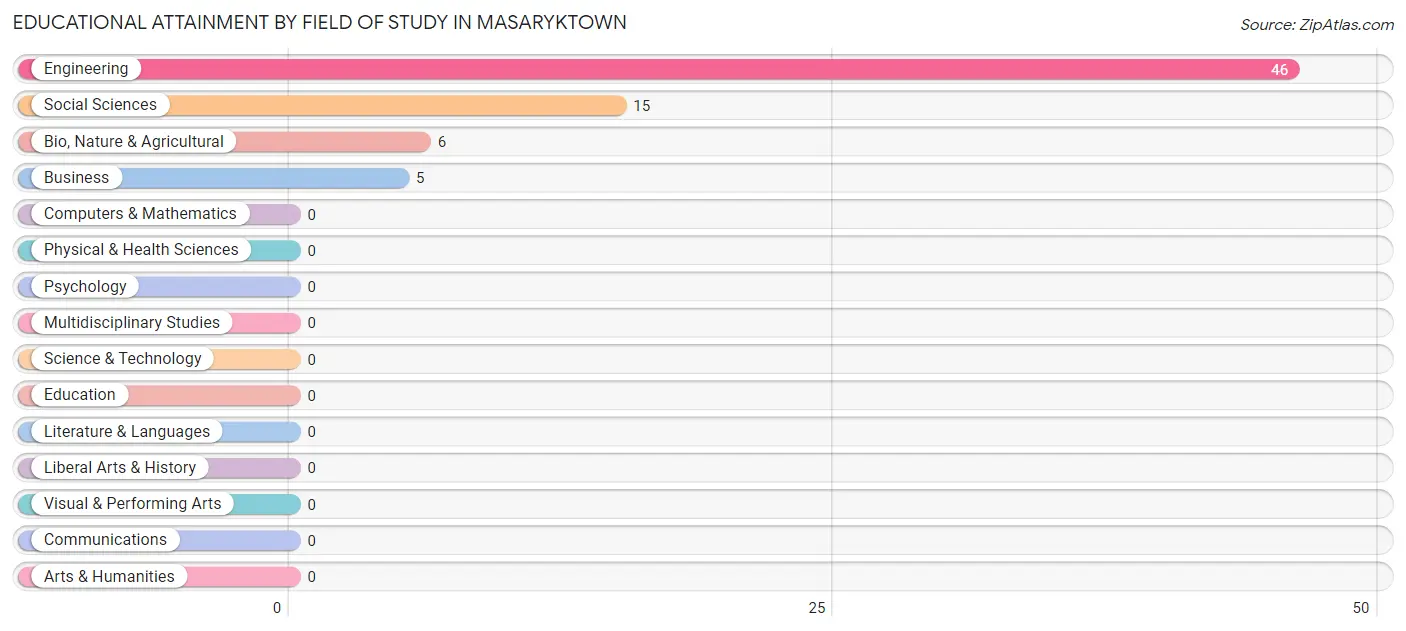
Educational Attainment by Field of Study in Masaryktown
Engineering (46 | 63.9%), social sciences (15 | 20.8%), bio, nature & agricultural (6 | 8.3%), and business (5 | 6.9%) are the most common fields of study among 72 individuals in Masaryktown who have obtained a bachelor's degree or higher.
| Field of Study | # Graduates | % Graduates |
| Computers & Mathematics | 0 | 0.0% |
| Bio, Nature & Agricultural | 6 | 8.3% |
| Physical & Health Sciences | 0 | 0.0% |
| Psychology | 0 | 0.0% |
| Social Sciences | 15 | 20.8% |
| Engineering | 46 | 63.9% |
| Multidisciplinary Studies | 0 | 0.0% |
| Science & Technology | 0 | 0.0% |
| Business | 5 | 6.9% |
| Education | 0 | 0.0% |
| Literature & Languages | 0 | 0.0% |
| Liberal Arts & History | 0 | 0.0% |
| Visual & Performing Arts | 0 | 0.0% |
| Communications | 0 | 0.0% |
| Arts & Humanities | 0 | 0.0% |
| Total | 72 | 100.0% |
Transportation & Commute in Masaryktown
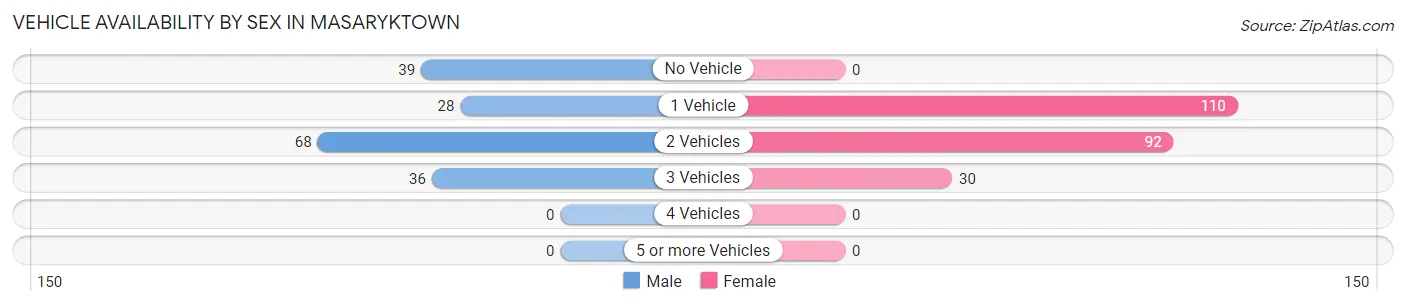
Vehicle Availability by Sex in Masaryktown
The most prevalent vehicle ownership categories in Masaryktown are males with 2 vehicles (68, accounting for 39.8%) and females with 2 vehicles (92, making up 29.3%).
| Vehicles Available | Male | Female |
| No Vehicle | 39 (22.8%) | 0 (0.0%) |
| 1 Vehicle | 28 (16.4%) | 110 (47.4%) |
| 2 Vehicles | 68 (39.8%) | 92 (39.7%) |
| 3 Vehicles | 36 (21.0%) | 30 (12.9%) |
| 4 Vehicles | 0 (0.0%) | 0 (0.0%) |
| 5 or more Vehicles | 0 (0.0%) | 0 (0.0%) |
| Total | 171 (100.0%) | 232 (100.0%) |
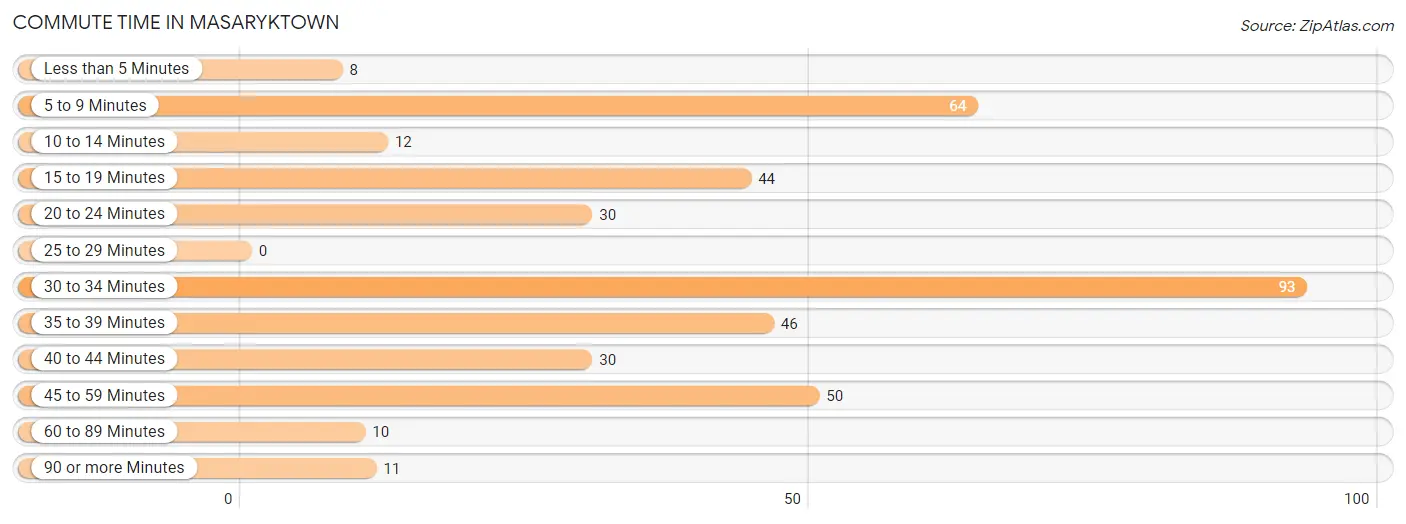
Commute Time in Masaryktown
The most frequently occuring commute durations in Masaryktown are 30 to 34 minutes (93 commuters, 23.4%), 5 to 9 minutes (64 commuters, 16.1%), and 45 to 59 minutes (50 commuters, 12.6%).
| Commute Time | # Commuters | % Commuters |
| Less than 5 Minutes | 8 | 2.0% |
| 5 to 9 Minutes | 64 | 16.1% |
| 10 to 14 Minutes | 12 | 3.0% |
| 15 to 19 Minutes | 44 | 11.1% |
| 20 to 24 Minutes | 30 | 7.5% |
| 25 to 29 Minutes | 0 | 0.0% |
| 30 to 34 Minutes | 93 | 23.4% |
| 35 to 39 Minutes | 46 | 11.6% |
| 40 to 44 Minutes | 30 | 7.5% |
| 45 to 59 Minutes | 50 | 12.6% |
| 60 to 89 Minutes | 10 | 2.5% |
| 90 or more Minutes | 11 | 2.8% |
Commute Time by Sex in Masaryktown
The most common commute times in Masaryktown are 45 to 59 minutes (50 commuters, 29.2%) for males and 30 to 34 minutes (86 commuters, 37.9%) for females.
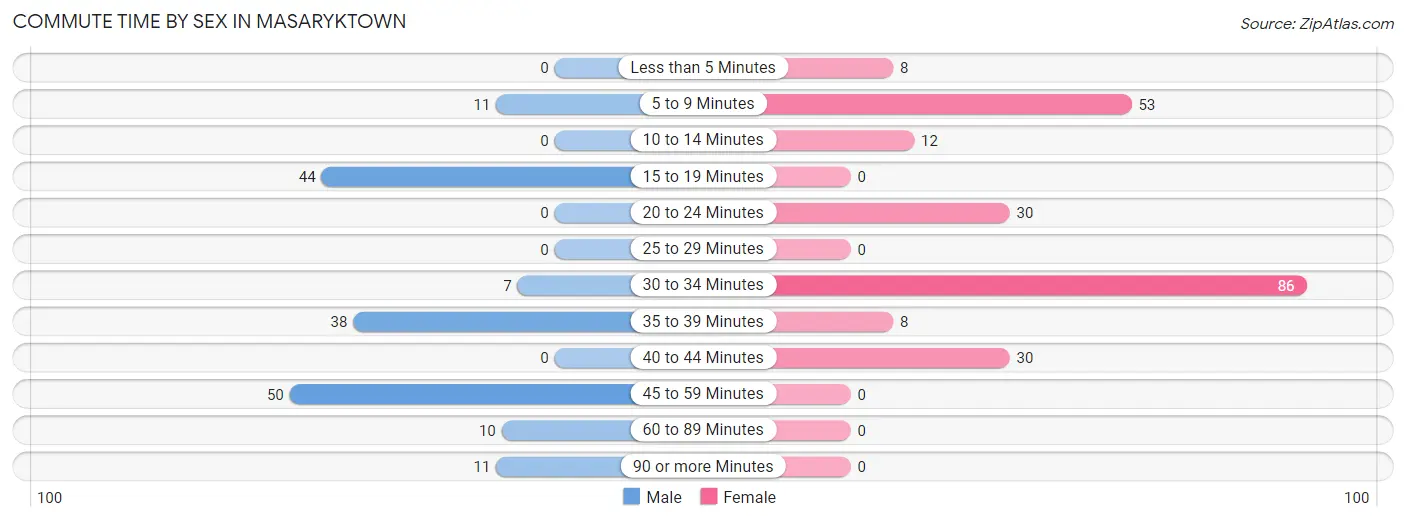
| Commute Time | Male | Female |
| Less than 5 Minutes | 0 (0.0%) | 8 (3.5%) |
| 5 to 9 Minutes | 11 (6.4%) | 53 (23.4%) |
| 10 to 14 Minutes | 0 (0.0%) | 12 (5.3%) |
| 15 to 19 Minutes | 44 (25.7%) | 0 (0.0%) |
| 20 to 24 Minutes | 0 (0.0%) | 30 (13.2%) |
| 25 to 29 Minutes | 0 (0.0%) | 0 (0.0%) |
| 30 to 34 Minutes | 7 (4.1%) | 86 (37.9%) |
| 35 to 39 Minutes | 38 (22.2%) | 8 (3.5%) |
| 40 to 44 Minutes | 0 (0.0%) | 30 (13.2%) |
| 45 to 59 Minutes | 50 (29.2%) | 0 (0.0%) |
| 60 to 89 Minutes | 10 (5.9%) | 0 (0.0%) |
| 90 or more Minutes | 11 (6.4%) | 0 (0.0%) |
Time of Departure to Work by Sex in Masaryktown
The most frequent times of departure to work in Masaryktown are 6:00 AM to 6:29 AM (51, 29.8%) for males and 11:00 AM to 11:59 AM (99, 43.6%) for females.
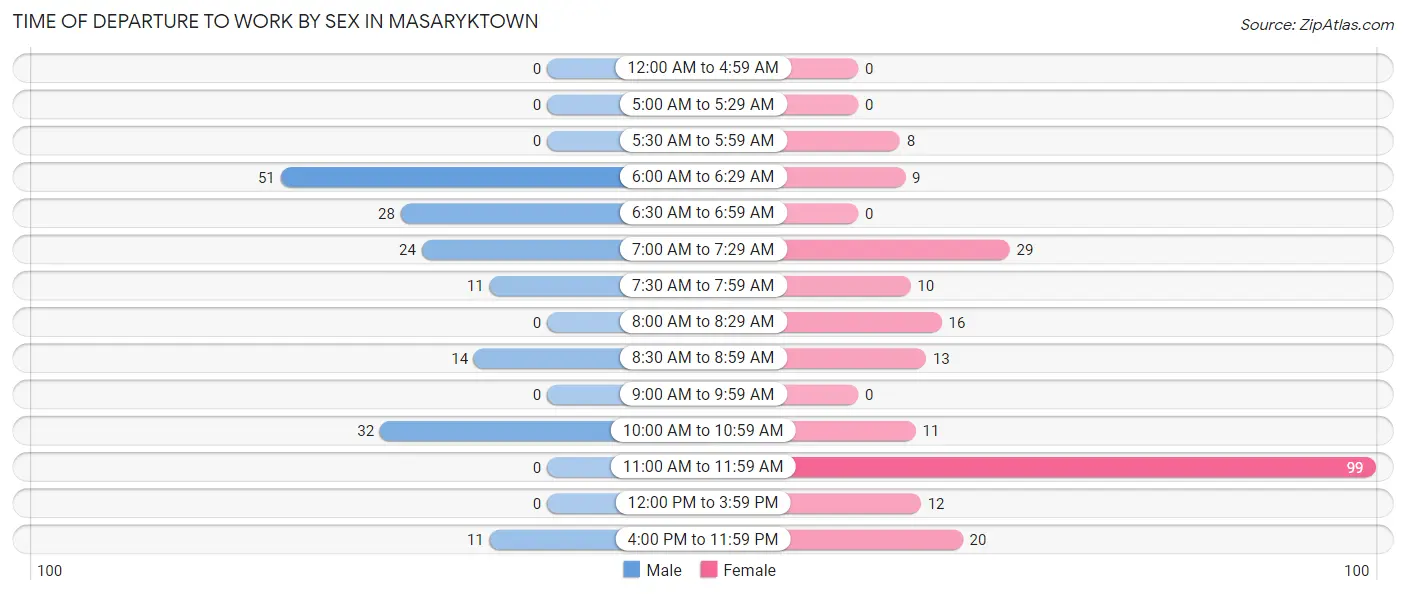
| Time of Departure | Male | Female |
| 12:00 AM to 4:59 AM | 0 (0.0%) | 0 (0.0%) |
| 5:00 AM to 5:29 AM | 0 (0.0%) | 0 (0.0%) |
| 5:30 AM to 5:59 AM | 0 (0.0%) | 8 (3.5%) |
| 6:00 AM to 6:29 AM | 51 (29.8%) | 9 (4.0%) |
| 6:30 AM to 6:59 AM | 28 (16.4%) | 0 (0.0%) |
| 7:00 AM to 7:29 AM | 24 (14.0%) | 29 (12.8%) |
| 7:30 AM to 7:59 AM | 11 (6.4%) | 10 (4.4%) |
| 8:00 AM to 8:29 AM | 0 (0.0%) | 16 (7.0%) |
| 8:30 AM to 8:59 AM | 14 (8.2%) | 13 (5.7%) |
| 9:00 AM to 9:59 AM | 0 (0.0%) | 0 (0.0%) |
| 10:00 AM to 10:59 AM | 32 (18.7%) | 11 (4.9%) |
| 11:00 AM to 11:59 AM | 0 (0.0%) | 99 (43.6%) |
| 12:00 PM to 3:59 PM | 0 (0.0%) | 12 (5.3%) |
| 4:00 PM to 11:59 PM | 11 (6.4%) | 20 (8.8%) |
| Total | 171 (100.0%) | 227 (100.0%) |
Housing Occupancy in Masaryktown
Occupancy by Ownership in Masaryktown
Of the total 440 dwellings in Masaryktown, owner-occupied units account for 386 (87.7%), while renter-occupied units make up 54 (12.3%).
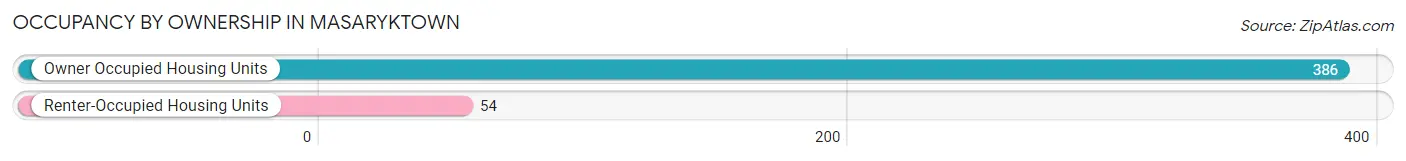
| Occupancy | # Housing Units | % Housing Units |
| Owner Occupied Housing Units | 386 | 87.7% |
| Renter-Occupied Housing Units | 54 | 12.3% |
| Total Occupied Housing Units | 440 | 100.0% |
Occupancy by Household Size in Masaryktown
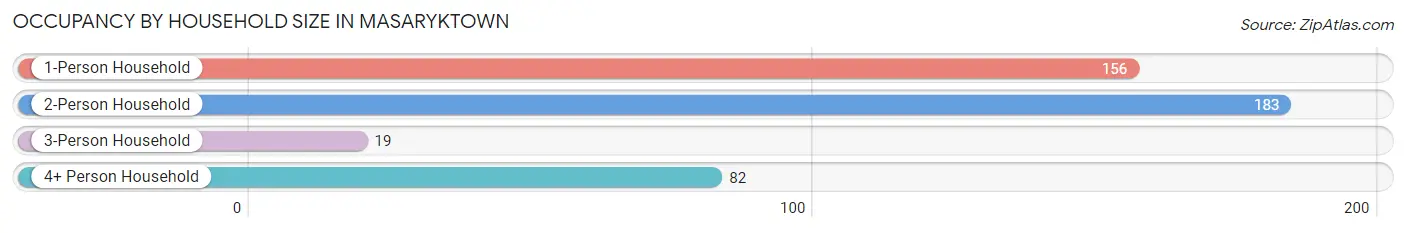
| Household Size | # Housing Units | % Housing Units |
| 1-Person Household | 156 | 35.4% |
| 2-Person Household | 183 | 41.6% |
| 3-Person Household | 19 | 4.3% |
| 4+ Person Household | 82 | 18.6% |
| Total Housing Units | 440 | 100.0% |
Occupancy by Ownership by Household Size in Masaryktown
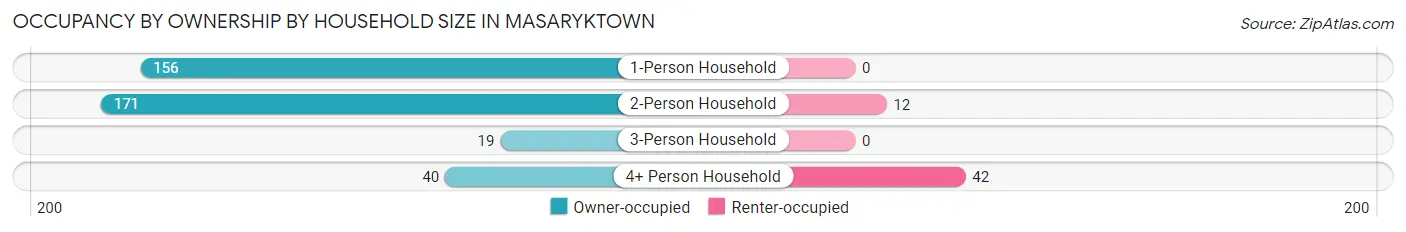
| Household Size | Owner-occupied | Renter-occupied |
| 1-Person Household | 156 (100.0%) | 0 (0.0%) |
| 2-Person Household | 171 (93.4%) | 12 (6.6%) |
| 3-Person Household | 19 (100.0%) | 0 (0.0%) |
| 4+ Person Household | 40 (48.8%) | 42 (51.2%) |
| Total Housing Units | 386 (87.7%) | 54 (12.3%) |
Occupancy by Educational Attainment in Masaryktown
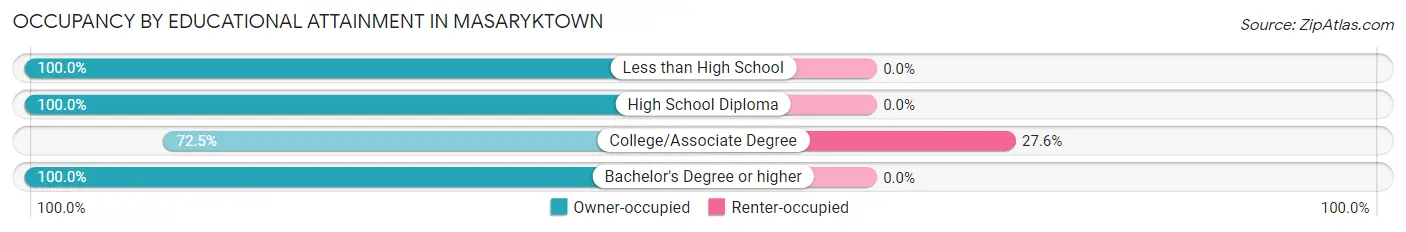
| Household Size | Owner-occupied | Renter-occupied |
| Less than High School | 13 (100.0%) | 0 (0.0%) |
| High School Diploma | 166 (100.0%) | 0 (0.0%) |
| College/Associate Degree | 142 (72.5%) | 54 (27.6%) |
| Bachelor's Degree or higher | 65 (100.0%) | 0 (0.0%) |
Occupancy by Age of Householder in Masaryktown
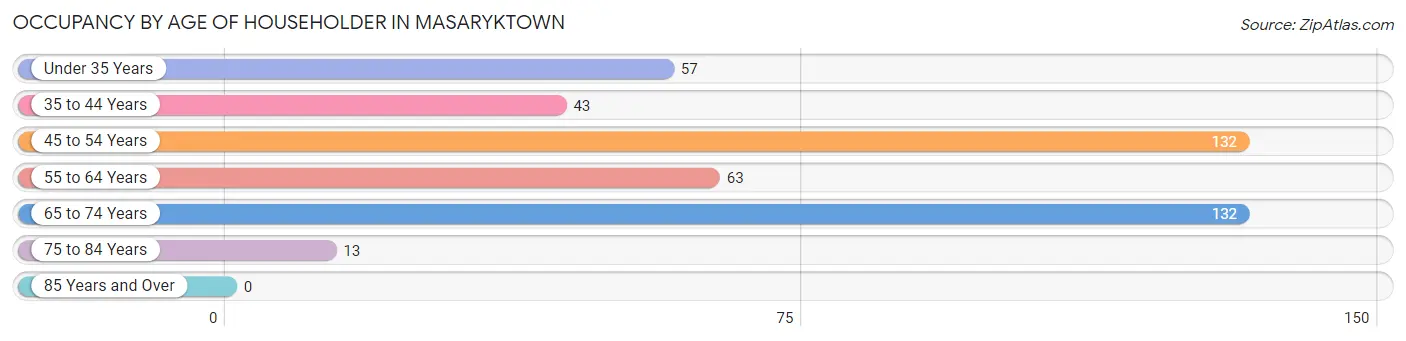
| Age Bracket | # Households | % Households |
| Under 35 Years | 57 | 13.0% |
| 35 to 44 Years | 43 | 9.8% |
| 45 to 54 Years | 132 | 30.0% |
| 55 to 64 Years | 63 | 14.3% |
| 65 to 74 Years | 132 | 30.0% |
| 75 to 84 Years | 13 | 2.9% |
| 85 Years and Over | 0 | 0.0% |
| Total | 440 | 100.0% |
Housing Finances in Masaryktown
Median Income by Occupancy in Masaryktown
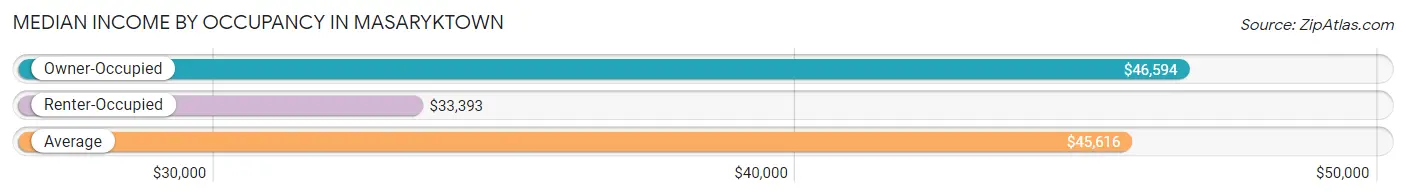
| Occupancy Type | # Households | Median Income |
| Owner-Occupied | 386 (87.7%) | $46,594 |
| Renter-Occupied | 54 (12.3%) | $33,393 |
| Average | 440 (100.0%) | $45,616 |
Occupancy by Householder Income Bracket in Masaryktown
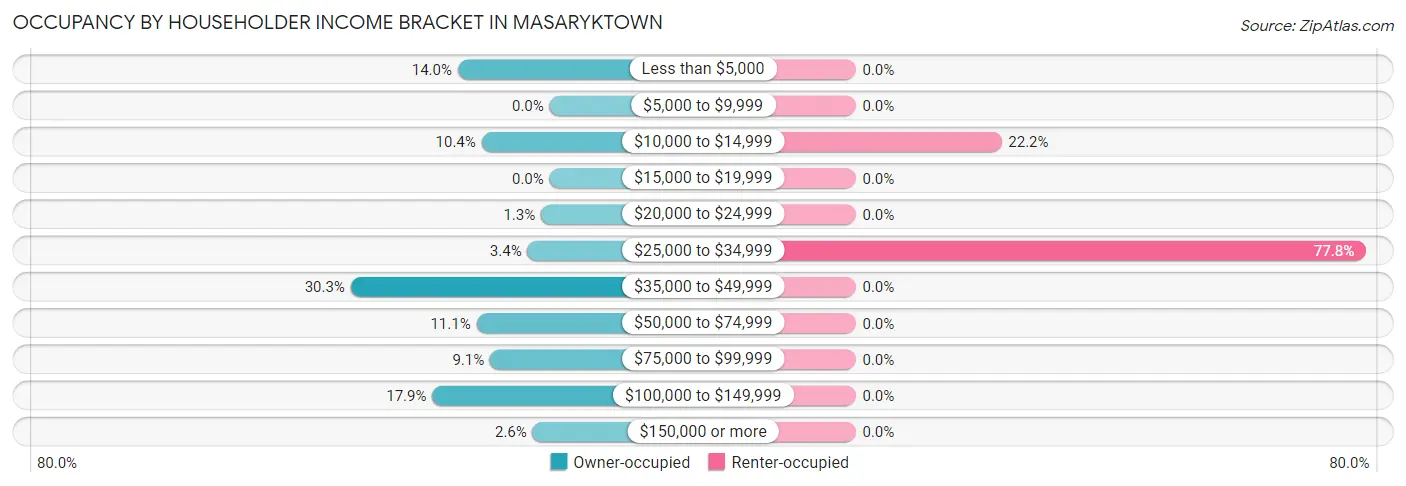
| Income Bracket | Owner-occupied | Renter-occupied |
| Less than $5,000 | 54 (14.0%) | 0 (0.0%) |
| $5,000 to $9,999 | 0 (0.0%) | 0 (0.0%) |
| $10,000 to $14,999 | 40 (10.4%) | 12 (22.2%) |
| $15,000 to $19,999 | 0 (0.0%) | 0 (0.0%) |
| $20,000 to $24,999 | 5 (1.3%) | 0 (0.0%) |
| $25,000 to $34,999 | 13 (3.4%) | 42 (77.8%) |
| $35,000 to $49,999 | 117 (30.3%) | 0 (0.0%) |
| $50,000 to $74,999 | 43 (11.1%) | 0 (0.0%) |
| $75,000 to $99,999 | 35 (9.1%) | 0 (0.0%) |
| $100,000 to $149,999 | 69 (17.9%) | 0 (0.0%) |
| $150,000 or more | 10 (2.6%) | 0 (0.0%) |
| Total | 386 (100.0%) | 54 (100.0%) |
Monthly Housing Cost Tiers in Masaryktown
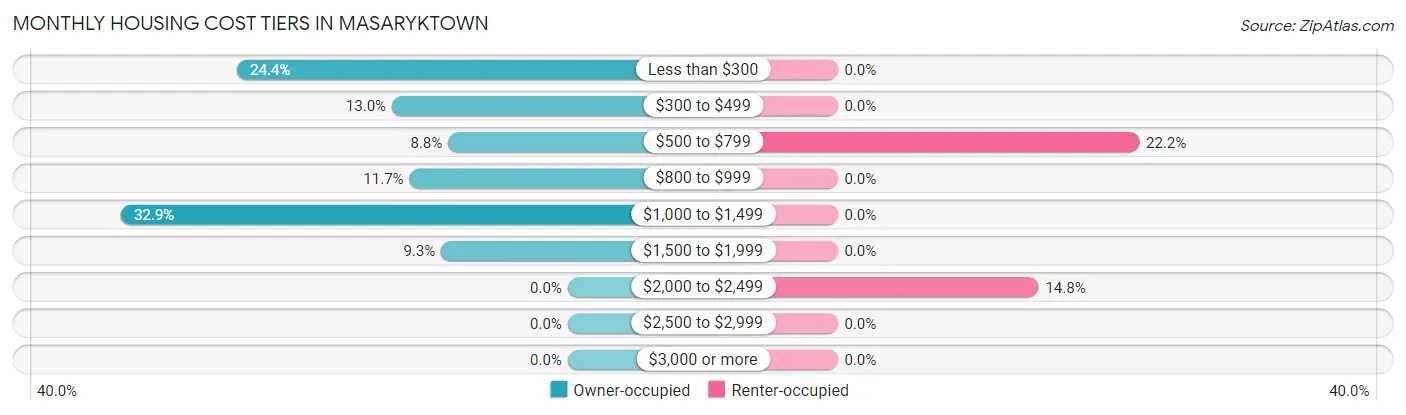
| Monthly Cost | Owner-occupied | Renter-occupied |
| Less than $300 | 94 (24.3%) | 0 (0.0%) |
| $300 to $499 | 50 (13.0%) | 0 (0.0%) |
| $500 to $799 | 34 (8.8%) | 12 (22.2%) |
| $800 to $999 | 45 (11.7%) | 0 (0.0%) |
| $1,000 to $1,499 | 127 (32.9%) | 0 (0.0%) |
| $1,500 to $1,999 | 36 (9.3%) | 0 (0.0%) |
| $2,000 to $2,499 | 0 (0.0%) | 8 (14.8%) |
| $2,500 to $2,999 | 0 (0.0%) | 0 (0.0%) |
| $3,000 or more | 0 (0.0%) | 0 (0.0%) |
| Total | 386 (100.0%) | 54 (100.0%) |
Physical Housing Characteristics in Masaryktown
Housing Structures in Masaryktown
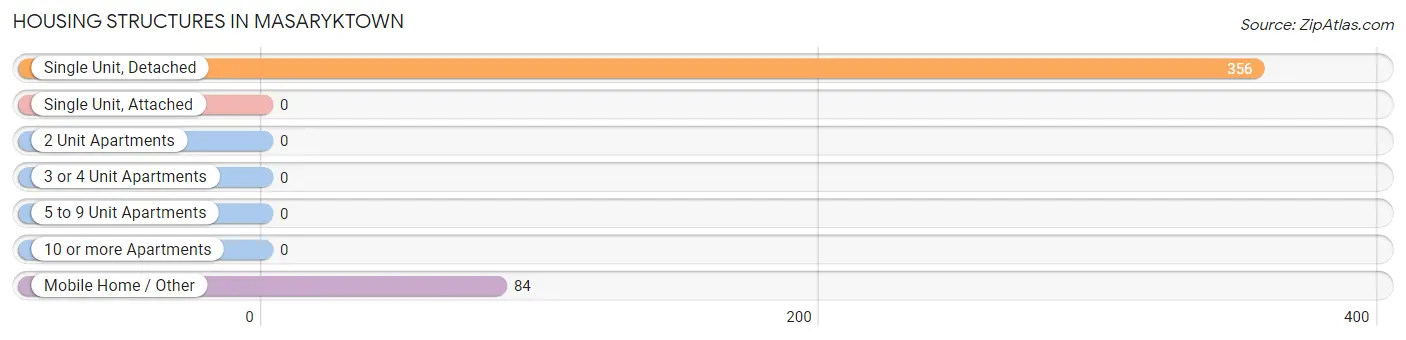
| Structure Type | # Housing Units | % Housing Units |
| Single Unit, Detached | 356 | 80.9% |
| Single Unit, Attached | 0 | 0.0% |
| 2 Unit Apartments | 0 | 0.0% |
| 3 or 4 Unit Apartments | 0 | 0.0% |
| 5 to 9 Unit Apartments | 0 | 0.0% |
| 10 or more Apartments | 0 | 0.0% |
| Mobile Home / Other | 84 | 19.1% |
| Total | 440 | 100.0% |
Housing Structures by Occupancy in Masaryktown
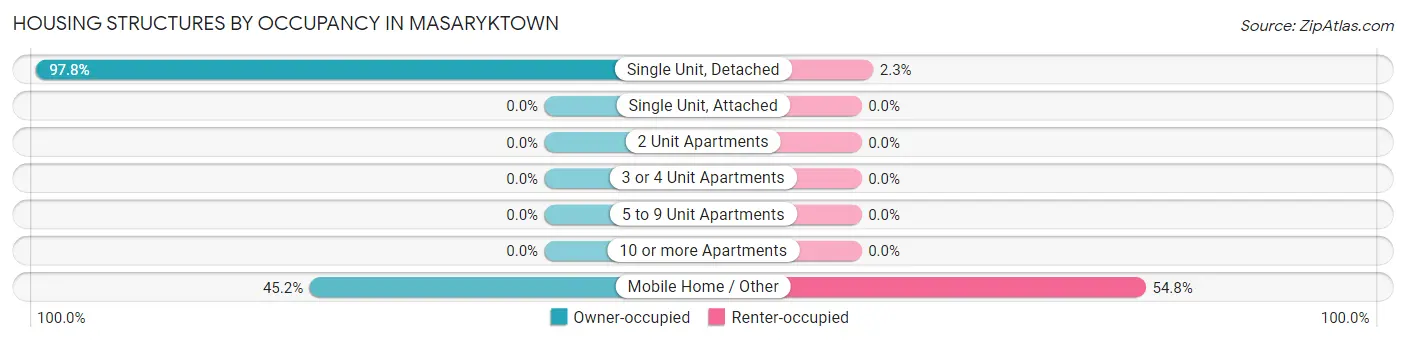
| Structure Type | Owner-occupied | Renter-occupied |
| Single Unit, Detached | 348 (97.8%) | 8 (2.2%) |
| Single Unit, Attached | 0 (0.0%) | 0 (0.0%) |
| 2 Unit Apartments | 0 (0.0%) | 0 (0.0%) |
| 3 or 4 Unit Apartments | 0 (0.0%) | 0 (0.0%) |
| 5 to 9 Unit Apartments | 0 (0.0%) | 0 (0.0%) |
| 10 or more Apartments | 0 (0.0%) | 0 (0.0%) |
| Mobile Home / Other | 38 (45.2%) | 46 (54.8%) |
| Total | 386 (87.7%) | 54 (12.3%) |
Housing Structures by Number of Rooms in Masaryktown
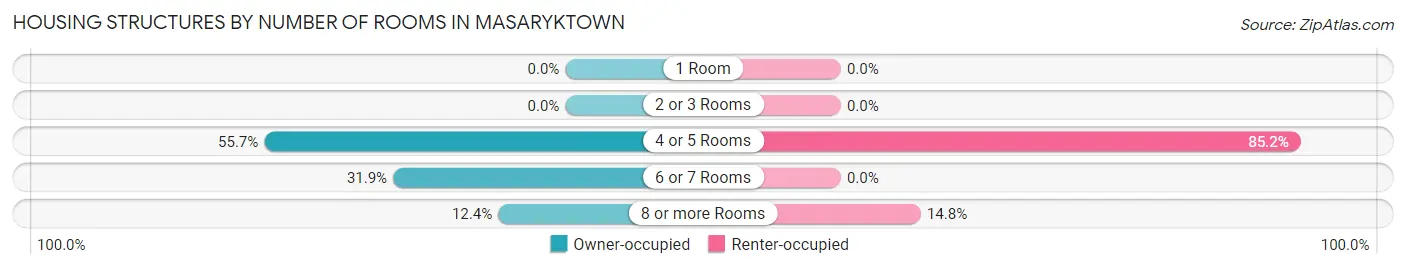
| Number of Rooms | Owner-occupied | Renter-occupied |
| 1 Room | 0 (0.0%) | 0 (0.0%) |
| 2 or 3 Rooms | 0 (0.0%) | 0 (0.0%) |
| 4 or 5 Rooms | 215 (55.7%) | 46 (85.2%) |
| 6 or 7 Rooms | 123 (31.9%) | 0 (0.0%) |
| 8 or more Rooms | 48 (12.4%) | 8 (14.8%) |
| Total | 386 (100.0%) | 54 (100.0%) |
Housing Structure by Heating Type in Masaryktown
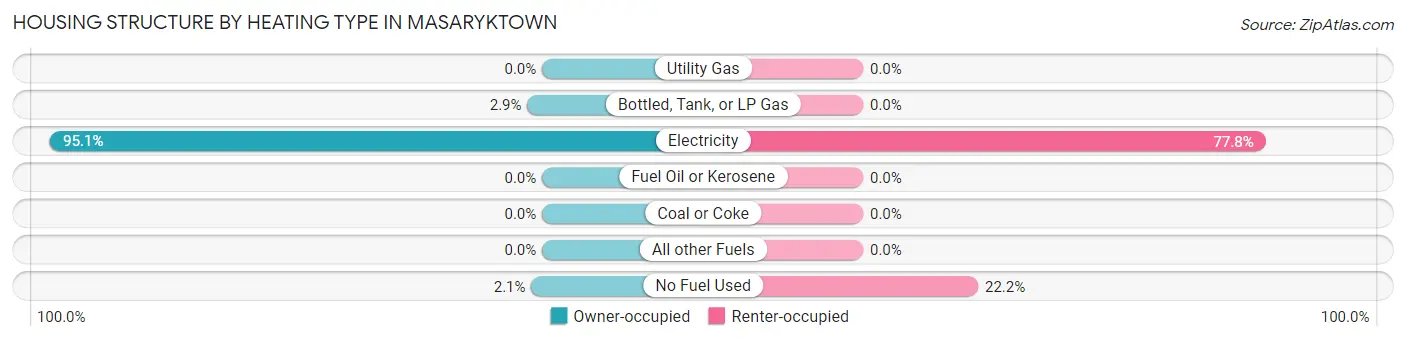
| Heating Type | Owner-occupied | Renter-occupied |
| Utility Gas | 0 (0.0%) | 0 (0.0%) |
| Bottled, Tank, or LP Gas | 11 (2.9%) | 0 (0.0%) |
| Electricity | 367 (95.1%) | 42 (77.8%) |
| Fuel Oil or Kerosene | 0 (0.0%) | 0 (0.0%) |
| Coal or Coke | 0 (0.0%) | 0 (0.0%) |
| All other Fuels | 0 (0.0%) | 0 (0.0%) |
| No Fuel Used | 8 (2.1%) | 12 (22.2%) |
| Total | 386 (100.0%) | 54 (100.0%) |
Household Vehicle Usage in Masaryktown
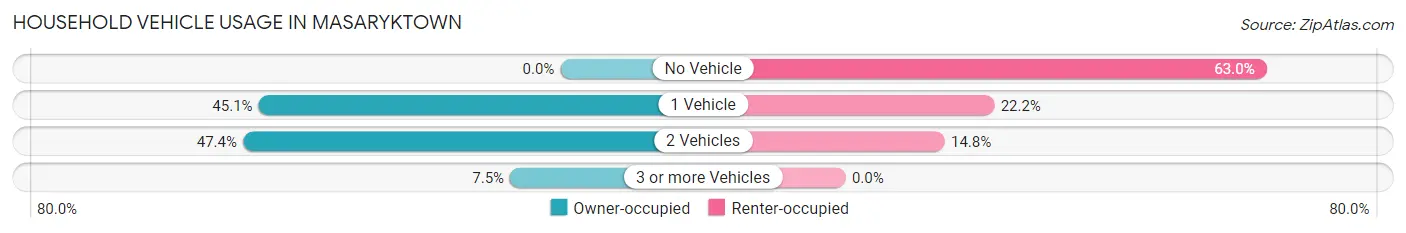
| Vehicles per Household | Owner-occupied | Renter-occupied |
| No Vehicle | 0 (0.0%) | 34 (63.0%) |
| 1 Vehicle | 174 (45.1%) | 12 (22.2%) |
| 2 Vehicles | 183 (47.4%) | 8 (14.8%) |
| 3 or more Vehicles | 29 (7.5%) | 0 (0.0%) |
| Total | 386 (100.0%) | 54 (100.0%) |
Real Estate & Mortgages in Masaryktown
Real Estate and Mortgage Overview in Masaryktown
| Characteristic | Without Mortgage | With Mortgage |
| Housing Units | 168 | 218 |
| Median Property Value | - | - |
| Median Household Income | - | - |
| Monthly Housing Costs | $263 | $0 |
| Real Estate Taxes | $1,094 | $0 |
Property Value by Mortgage Status in Masaryktown
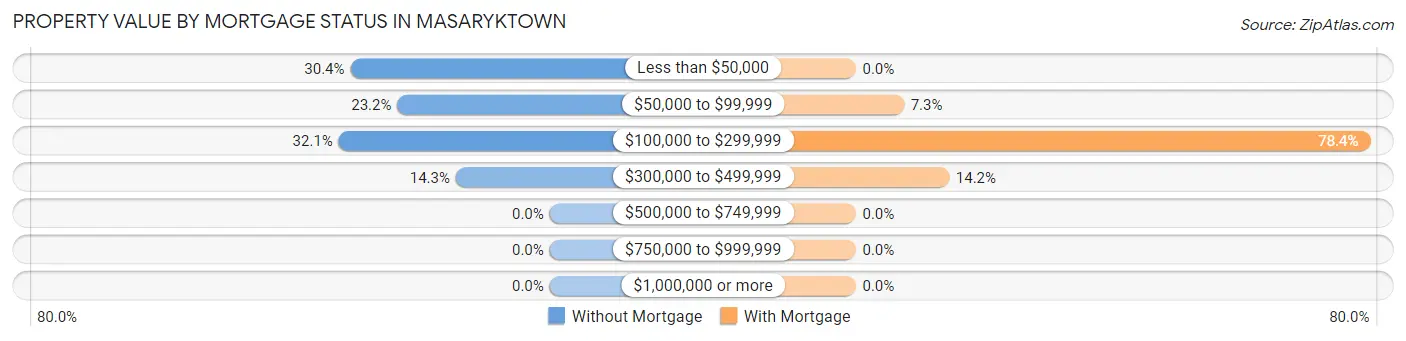
| Property Value | Without Mortgage | With Mortgage |
| Less than $50,000 | 51 (30.4%) | 0 (0.0%) |
| $50,000 to $99,999 | 39 (23.2%) | 16 (7.3%) |
| $100,000 to $299,999 | 54 (32.1%) | 171 (78.4%) |
| $300,000 to $499,999 | 24 (14.3%) | 31 (14.2%) |
| $500,000 to $749,999 | 0 (0.0%) | 0 (0.0%) |
| $750,000 to $999,999 | 0 (0.0%) | 0 (0.0%) |
| $1,000,000 or more | 0 (0.0%) | 0 (0.0%) |
| Total | 168 (100.0%) | 218 (100.0%) |
Household Income by Mortgage Status in Masaryktown
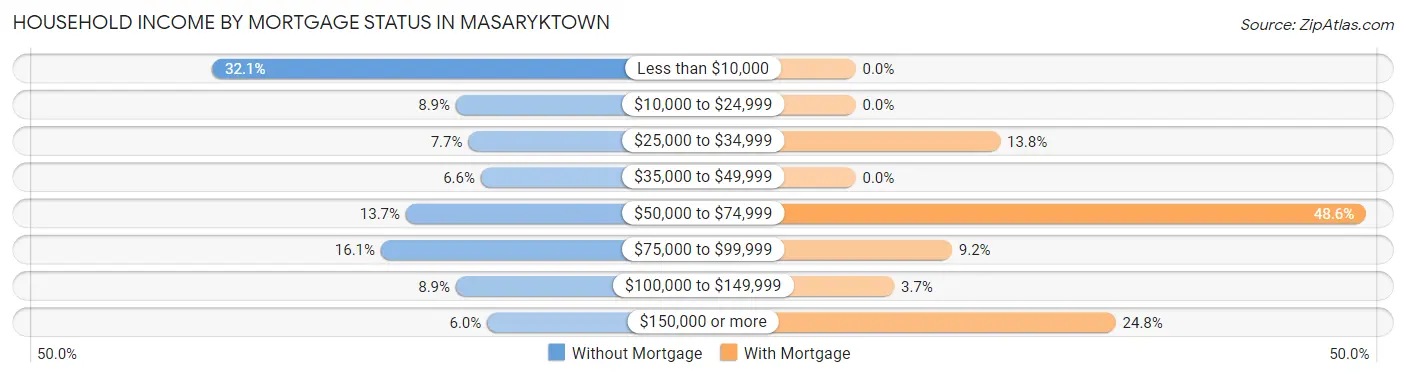
| Household Income | Without Mortgage | With Mortgage |
| Less than $10,000 | 54 (32.1%) | 0 (0.0%) |
| $10,000 to $24,999 | 15 (8.9%) | 0 (0.0%) |
| $25,000 to $34,999 | 13 (7.7%) | 30 (13.8%) |
| $35,000 to $49,999 | 11 (6.6%) | 0 (0.0%) |
| $50,000 to $74,999 | 23 (13.7%) | 106 (48.6%) |
| $75,000 to $99,999 | 27 (16.1%) | 20 (9.2%) |
| $100,000 to $149,999 | 15 (8.9%) | 8 (3.7%) |
| $150,000 or more | 10 (5.9%) | 54 (24.8%) |
| Total | 168 (100.0%) | 218 (100.0%) |
Property Value to Household Income Ratio in Masaryktown
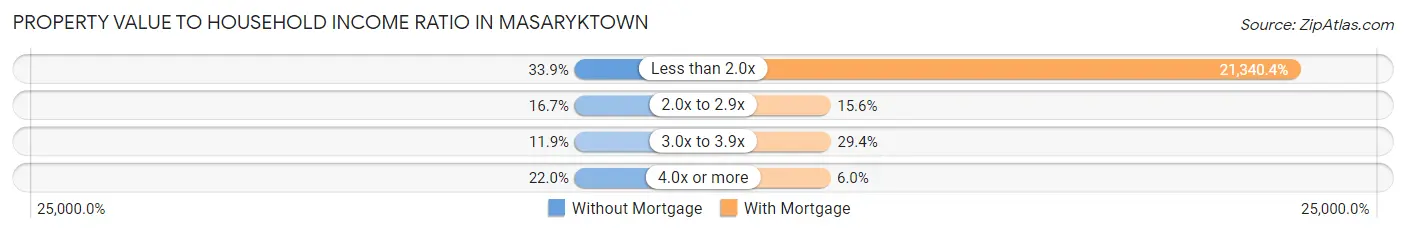
| Value-to-Income Ratio | Without Mortgage | With Mortgage |
| Less than 2.0x | 57 (33.9%) | 46,522 (21,340.4%) |
| 2.0x to 2.9x | 28 (16.7%) | 34 (15.6%) |
| 3.0x to 3.9x | 20 (11.9%) | 64 (29.4%) |
| 4.0x or more | 37 (22.0%) | 13 (6.0%) |
| Total | 168 (100.0%) | 218 (100.0%) |
Real Estate Taxes by Mortgage Status in Masaryktown
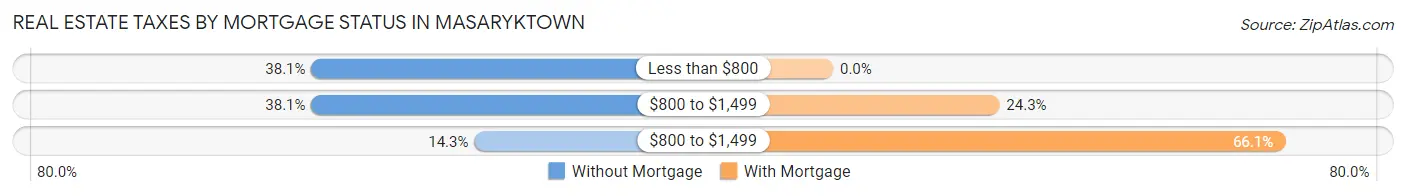
| Property Taxes | Without Mortgage | With Mortgage |
| Less than $800 | 64 (38.1%) | 0 (0.0%) |
| $800 to $1,499 | 64 (38.1%) | 53 (24.3%) |
| $800 to $1,499 | 24 (14.3%) | 144 (66.1%) |
| Total | 168 (100.0%) | 218 (100.0%) |
Health & Disability in Masaryktown
Health Insurance Coverage by Age in Masaryktown
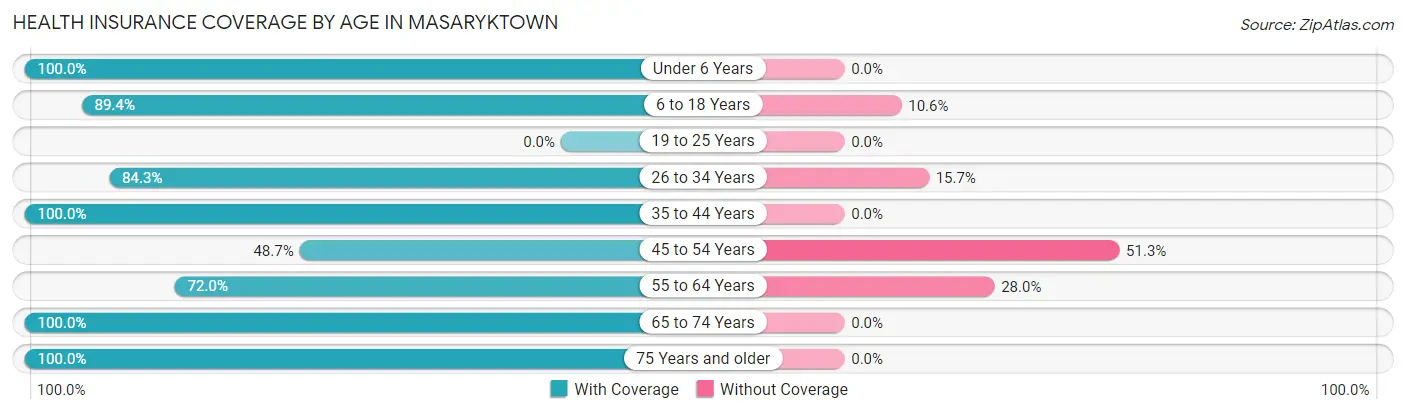
| Age Bracket | With Coverage | Without Coverage |
| Under 6 Years | 57 (100.0%) | 0 (0.0%) |
| 6 to 18 Years | 185 (89.4%) | 22 (10.6%) |
| 19 to 25 Years | 0 (0.0%) | 0 (0.0%) |
| 26 to 34 Years | 91 (84.3%) | 17 (15.7%) |
| 35 to 44 Years | 67 (100.0%) | 0 (0.0%) |
| 45 to 54 Years | 116 (48.7%) | 122 (51.3%) |
| 55 to 64 Years | 67 (72.0%) | 26 (28.0%) |
| 65 to 74 Years | 185 (100.0%) | 0 (0.0%) |
| 75 Years and older | 38 (100.0%) | 0 (0.0%) |
| Total | 806 (81.2%) | 187 (18.8%) |
Health Insurance Coverage by Citizenship Status in Masaryktown
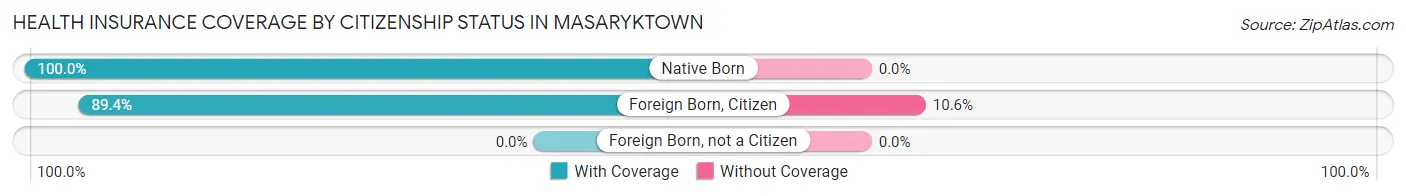
| Citizenship Status | With Coverage | Without Coverage |
| Native Born | 57 (100.0%) | 0 (0.0%) |
| Foreign Born, Citizen | 185 (89.4%) | 22 (10.6%) |
| Foreign Born, not a Citizen | 0 (0.0%) | 0 (0.0%) |
Health Insurance Coverage by Household Income in Masaryktown
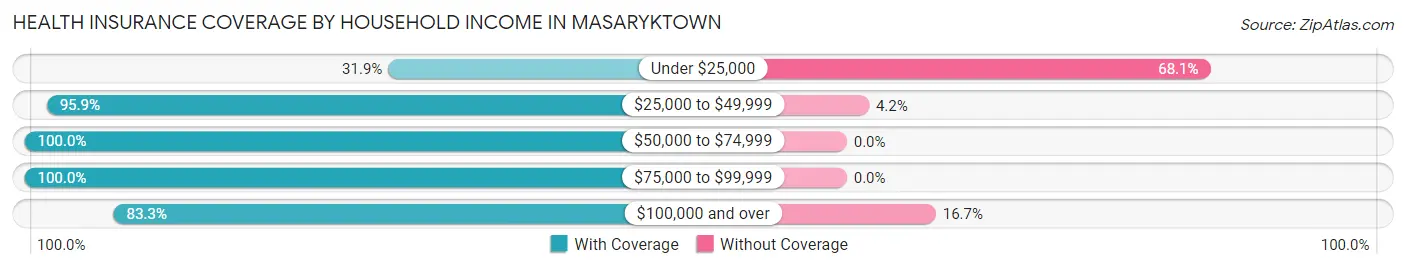
| Household Income | With Coverage | Without Coverage |
| Under $25,000 | 59 (31.9%) | 126 (68.1%) |
| $25,000 to $49,999 | 393 (95.9%) | 17 (4.2%) |
| $50,000 to $74,999 | 76 (100.0%) | 0 (0.0%) |
| $75,000 to $99,999 | 58 (100.0%) | 0 (0.0%) |
| $100,000 and over | 220 (83.3%) | 44 (16.7%) |
Public vs Private Health Insurance Coverage by Age in Masaryktown
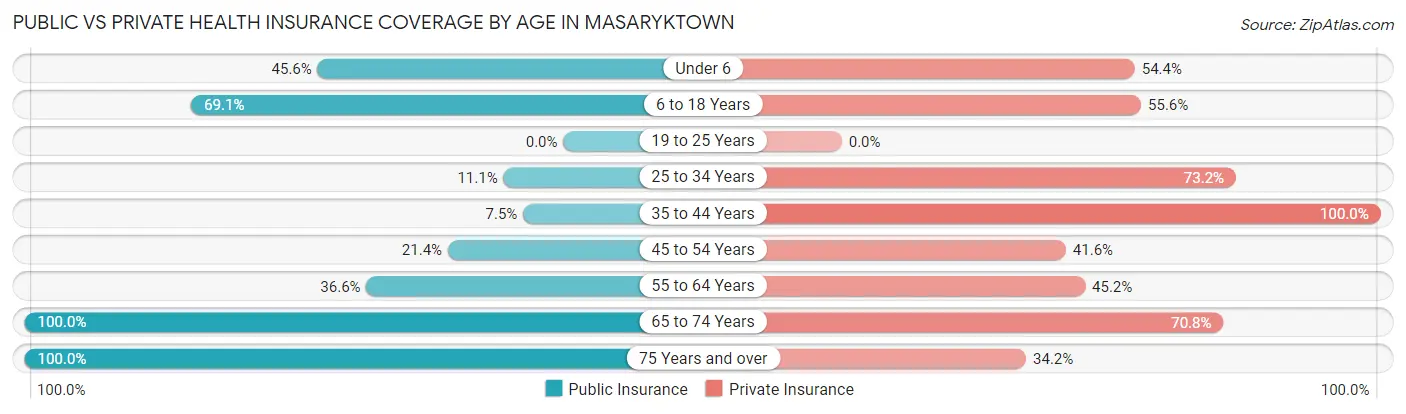
| Age Bracket | Public Insurance | Private Insurance |
| Under 6 | 26 (45.6%) | 31 (54.4%) |
| 6 to 18 Years | 143 (69.1%) | 115 (55.6%) |
| 19 to 25 Years | 0 (0.0%) | 0 (0.0%) |
| 25 to 34 Years | 12 (11.1%) | 79 (73.2%) |
| 35 to 44 Years | 5 (7.5%) | 67 (100.0%) |
| 45 to 54 Years | 51 (21.4%) | 99 (41.6%) |
| 55 to 64 Years | 34 (36.6%) | 42 (45.2%) |
| 65 to 74 Years | 185 (100.0%) | 131 (70.8%) |
| 75 Years and over | 38 (100.0%) | 13 (34.2%) |
| Total | 494 (49.7%) | 577 (58.1%) |
Disability Status by Sex by Age in Masaryktown
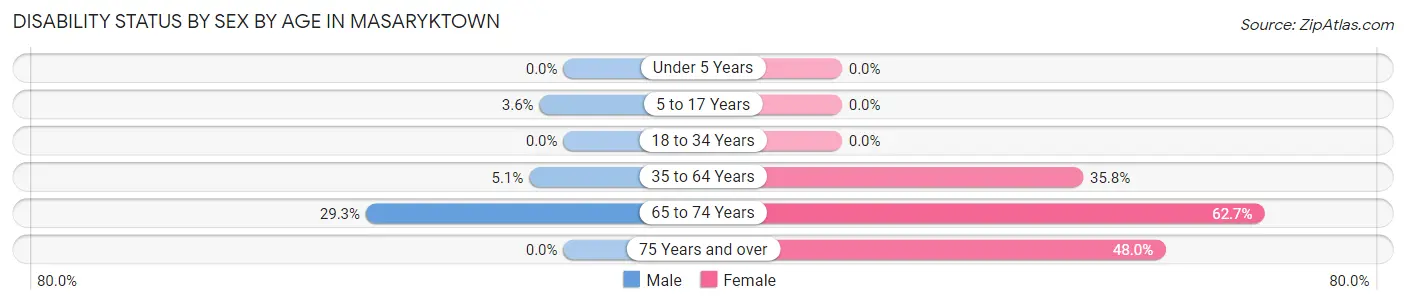
| Age Bracket | Male | Female |
| Under 5 Years | 0 (0.0%) | 0 (0.0%) |
| 5 to 17 Years | 5 (3.5%) | 0 (0.0%) |
| 18 to 34 Years | 0 (0.0%) | 0 (0.0%) |
| 35 to 64 Years | 10 (5.1%) | 72 (35.8%) |
| 65 to 74 Years | 22 (29.3%) | 69 (62.7%) |
| 75 Years and over | 0 (0.0%) | 12 (48.0%) |
Disability Class by Sex by Age in Masaryktown
Disability Class: Hearing Difficulty
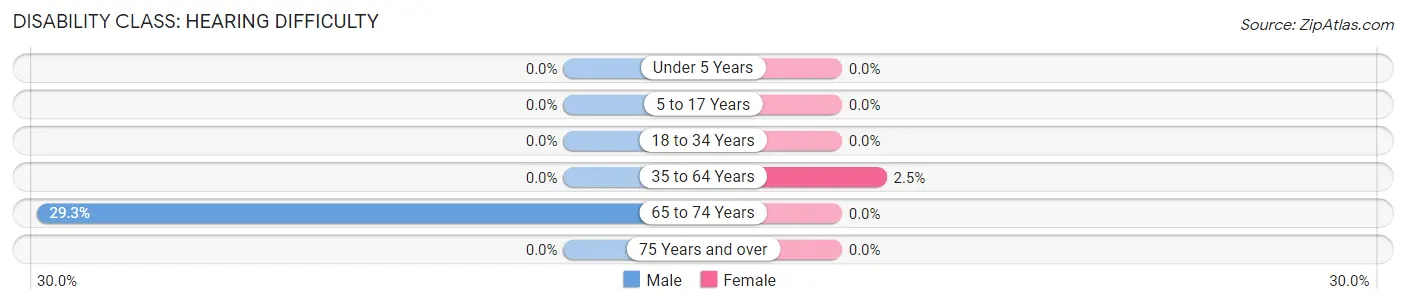
| Age Bracket | Male | Female |
| Under 5 Years | 0 (0.0%) | 0 (0.0%) |
| 5 to 17 Years | 0 (0.0%) | 0 (0.0%) |
| 18 to 34 Years | 0 (0.0%) | 0 (0.0%) |
| 35 to 64 Years | 0 (0.0%) | 5 (2.5%) |
| 65 to 74 Years | 22 (29.3%) | 0 (0.0%) |
| 75 Years and over | 0 (0.0%) | 0 (0.0%) |
Disability Class: Vision Difficulty
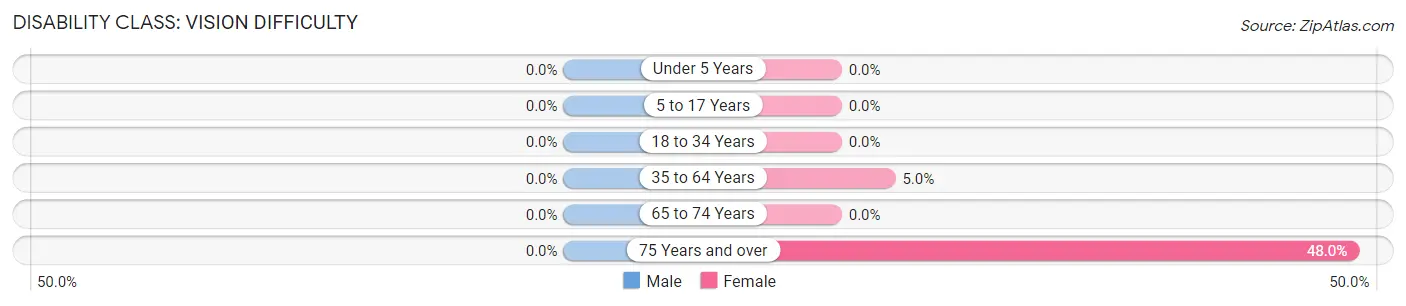
| Age Bracket | Male | Female |
| Under 5 Years | 0 (0.0%) | 0 (0.0%) |
| 5 to 17 Years | 0 (0.0%) | 0 (0.0%) |
| 18 to 34 Years | 0 (0.0%) | 0 (0.0%) |
| 35 to 64 Years | 0 (0.0%) | 10 (5.0%) |
| 65 to 74 Years | 0 (0.0%) | 0 (0.0%) |
| 75 Years and over | 0 (0.0%) | 12 (48.0%) |
Disability Class: Cognitive Difficulty
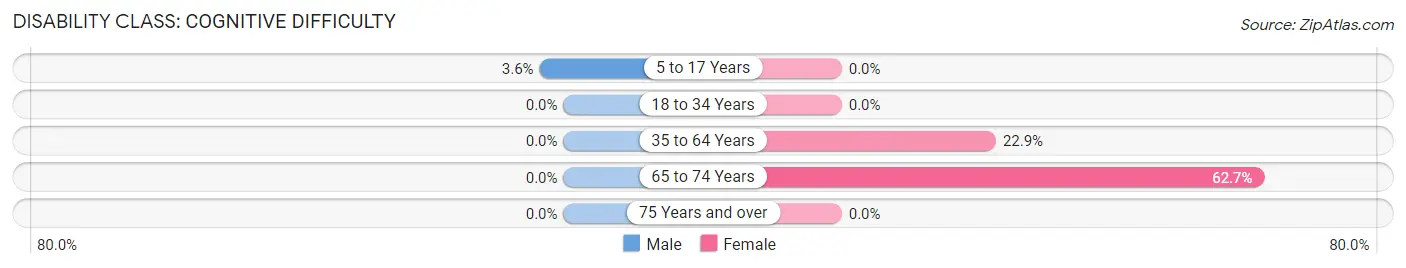
| Age Bracket | Male | Female |
| 5 to 17 Years | 5 (3.5%) | 0 (0.0%) |
| 18 to 34 Years | 0 (0.0%) | 0 (0.0%) |
| 35 to 64 Years | 0 (0.0%) | 46 (22.9%) |
| 65 to 74 Years | 0 (0.0%) | 69 (62.7%) |
| 75 Years and over | 0 (0.0%) | 0 (0.0%) |
Disability Class: Ambulatory Difficulty
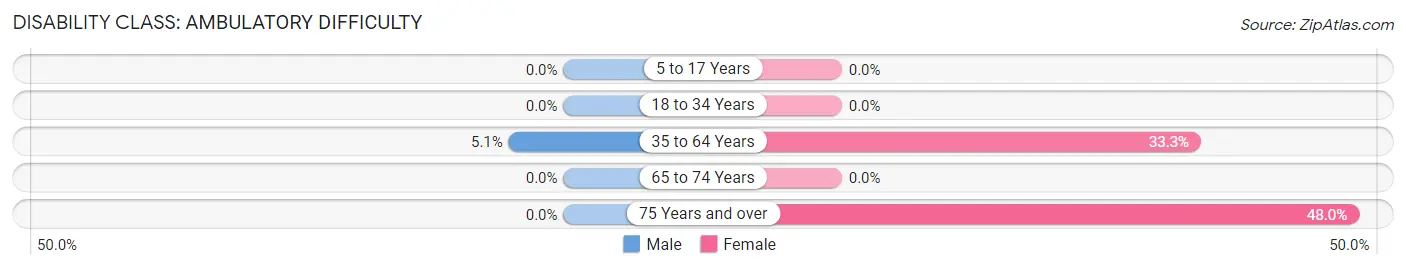
| Age Bracket | Male | Female |
| 5 to 17 Years | 0 (0.0%) | 0 (0.0%) |
| 18 to 34 Years | 0 (0.0%) | 0 (0.0%) |
| 35 to 64 Years | 10 (5.1%) | 67 (33.3%) |
| 65 to 74 Years | 0 (0.0%) | 0 (0.0%) |
| 75 Years and over | 0 (0.0%) | 12 (48.0%) |
Disability Class: Self-Care Difficulty
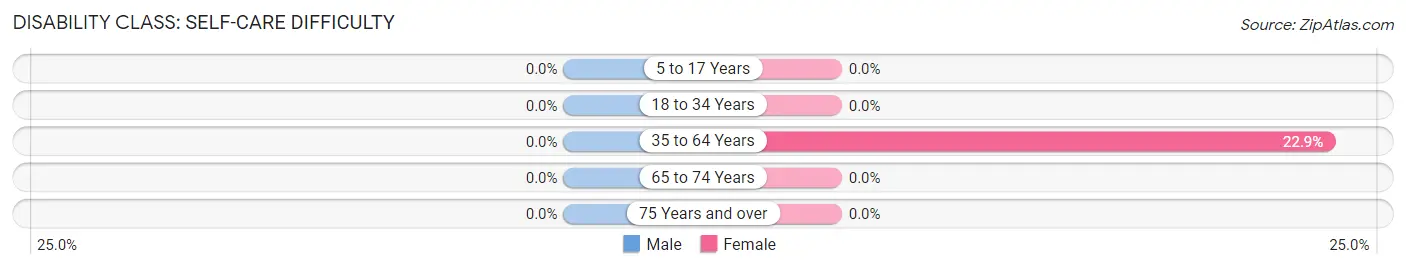
| Age Bracket | Male | Female |
| 5 to 17 Years | 0 (0.0%) | 0 (0.0%) |
| 18 to 34 Years | 0 (0.0%) | 0 (0.0%) |
| 35 to 64 Years | 0 (0.0%) | 46 (22.9%) |
| 65 to 74 Years | 0 (0.0%) | 0 (0.0%) |
| 75 Years and over | 0 (0.0%) | 0 (0.0%) |
Technology Access in Masaryktown
Computing Device Access in Masaryktown
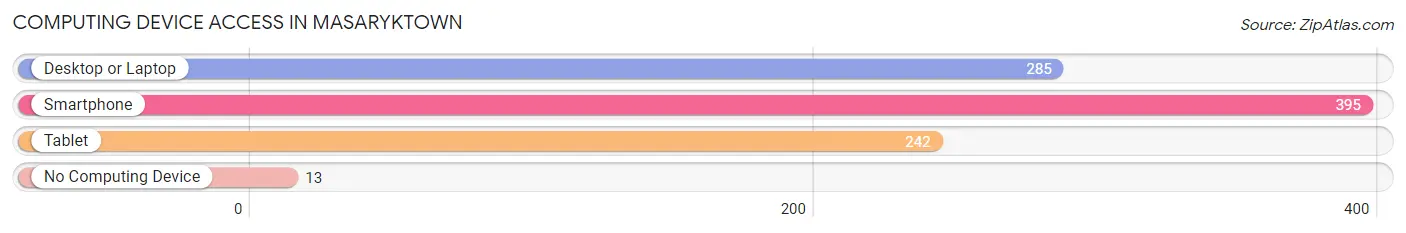
| Device Type | # Households | % Households |
| Desktop or Laptop | 285 | 64.8% |
| Smartphone | 395 | 89.8% |
| Tablet | 242 | 55.0% |
| No Computing Device | 13 | 2.9% |
| Total | 440 | 100.0% |
Internet Access in Masaryktown
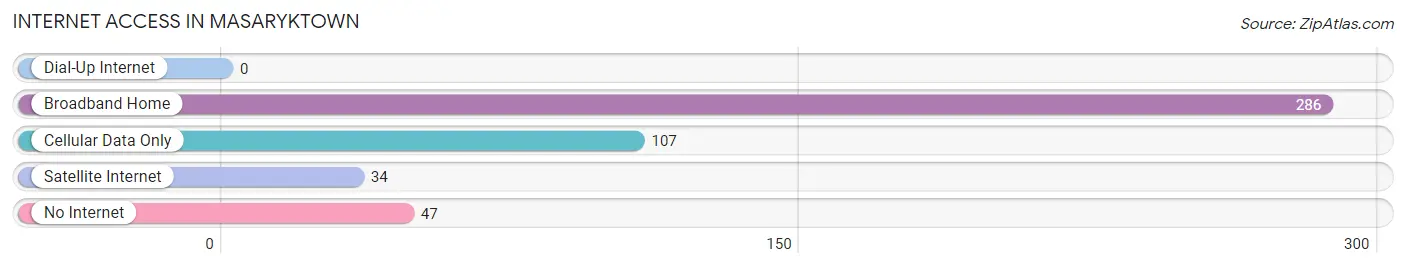
| Internet Type | # Households | % Households |
| Dial-Up Internet | 0 | 0.0% |
| Broadband Home | 286 | 65.0% |
| Cellular Data Only | 107 | 24.3% |
| Satellite Internet | 34 | 7.7% |
| No Internet | 47 | 10.7% |
| Total | 440 | 100.0% |
Masaryktown Summary
Masaryktown is a small unincorporated community located in Hernando County, Florida, United States. It is located on the western side of the county, just south of the city of Brooksville. The community is named after the first president of Czechoslovakia, Tomáš Garrigue Masaryk.
History
Masaryktown was founded in the early 1920s by a group of Czech immigrants who had come to the United States in search of a better life. The immigrants were led by a man named Joseph Masaryk, who was the son of Tomáš Garrigue Masaryk, the first president of Czechoslovakia. The immigrants purchased land in the area and began to build homes and businesses. The community quickly grew and by the 1930s, it had become a thriving community with a population of over 500 people.
The community was largely self-sufficient, with its own stores, churches, schools, and other businesses. The community also had its own newspaper, the Masaryktown News, which was published from 1932 to 1940.
The community was largely isolated from the rest of the county until the 1950s, when the construction of the Suncoast Parkway opened up the area to the rest of the county. This allowed the community to become more connected to the rest of the county and to grow in population.
Geography
Masaryktown is located in western Hernando County, just south of the city of Brooksville. The community is situated on the western side of the county, just off of the Suncoast Parkway. The community is bordered by the Withlacoochee State Forest to the north and the Chassahowitzka National Wildlife Refuge to the south.
The community is located at an elevation of approximately 100 feet above sea level. The climate in the area is subtropical, with hot, humid summers and mild winters.
Economy
The economy of Masaryktown is largely based on agriculture and tourism. The area is home to several farms, which produce a variety of crops, including citrus fruits, vegetables, and hay. The area is also home to several tourist attractions, including the Withlacoochee State Forest and the Chassahowitzka National Wildlife Refuge.
The community is also home to several small businesses, including restaurants, convenience stores, and gas stations.
Demographics
As of the 2010 census, the population of Masaryktown was 1,845. The racial makeup of the community was 94.3% White, 1.2% African American, 0.3% Native American, 0.7% Asian, 0.1% Pacific Islander, and 3.4% from other races. Hispanic or Latino of any race were 6.2% of the population.
The median household income in Masaryktown was $37,917, and the median family income was $41,917. The per capita income was $17,917. About 11.3% of families and 13.2% of the population were below the poverty line, including 17.2% of those under age 18 and 8.2% of those age 65 or over.
Common Questions
What is Per Capita Income in Masaryktown?
Per Capita income in Masaryktown is $24,062.
What is the Median Family Income in Masaryktown?
Median Family Income in Masaryktown is $40,000.
What is the Median Household income in Masaryktown?
Median Household Income in Masaryktown is $45,616.
What is Inequality or Gini Index in Masaryktown?
Inequality or Gini Index in Masaryktown is 0.43.
What is the Total Population of Masaryktown?
Total Population of Masaryktown is 993.
What is the Total Male Population of Masaryktown?
Total Male Population of Masaryktown is 507.
What is the Total Female Population of Masaryktown?
Total Female Population of Masaryktown is 486.
What is the Ratio of Males per 100 Females in Masaryktown?
There are 104.32 Males per 100 Females in Masaryktown.
What is the Ratio of Females per 100 Males in Masaryktown?
There are 95.86 Females per 100 Males in Masaryktown.
What is the Median Population Age in Masaryktown?
Median Population Age in Masaryktown is 48.6 Years.
What is the Average Family Size in Masaryktown
Average Family Size in Masaryktown is 3.0 People.
What is the Average Household Size in Masaryktown
Average Household Size in Masaryktown is 2.3 People.
How Large is the Labor Force in Masaryktown?
There are 403 People in the Labor Forcein in Masaryktown.
What is the Percentage of People in the Labor Force in Masaryktown?
53.6% of People are in the Labor Force in Masaryktown.