Lake Panasoffkee, FL Map & Demographics
Lake Panasoffkee Map
Lake Panasoffkee Overview
$27,390
PER CAPITA INCOME
$51,458
AVG FAMILY INCOME
$45,222
AVG HOUSEHOLD INCOME
44.2%
WAGE / INCOME GAP [ % ]
55.8¢/ $1
WAGE / INCOME GAP [ $ ]
0.45
INEQUALITY / GINI INDEX
4,173
TOTAL POPULATION
1,962
MALE POPULATION
2,211
FEMALE POPULATION
88.74
MALES / 100 FEMALES
112.69
FEMALES / 100 MALES
49.4
MEDIAN AGE
2.7
AVG FAMILY SIZE
2.2
AVG HOUSEHOLD SIZE
1,825
LABOR FORCE [ PEOPLE ]
52.3%
PERCENT IN LABOR FORCE
4.2%
UNEMPLOYMENT RATE
Lake Panasoffkee Zip Codes
Lake Panasoffkee Area Codes
Income in Lake Panasoffkee
Income Overview in Lake Panasoffkee
Per Capita Income in Lake Panasoffkee is $27,390, while median incomes of families and households are $51,458 and $45,222 respectively.
| Characteristic | Number | Measure |
| Per Capita Income | 4,173 | $27,390 |
| Median Family Income | 1,171 | $51,458 |
| Mean Family Income | 1,171 | $65,022 |
| Median Household Income | 1,921 | $45,222 |
| Mean Household Income | 1,921 | $57,821 |
| Income Deficit | 1,171 | $0 |
| Wage / Income Gap (%) | 4,173 | 44.23% |
| Wage / Income Gap ($) | 4,173 | 55.77¢ per $1 |
| Gini / Inequality Index | 4,173 | 0.45 |
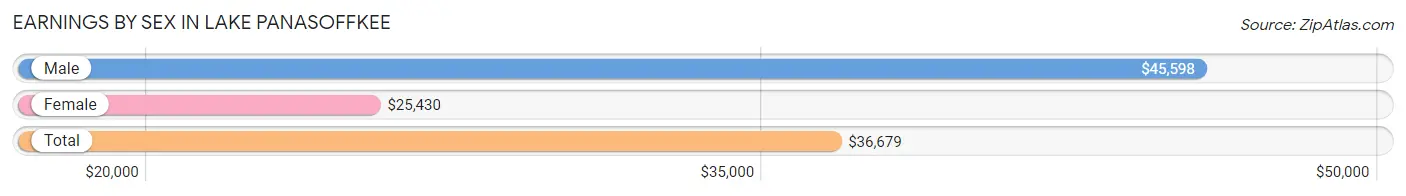
Earnings by Sex in Lake Panasoffkee
Average Earnings in Lake Panasoffkee are $36,679, $45,598 for men and $25,430 for women, a difference of 44.2%.
| Sex | Number | Average Earnings |
| Male | 1,051 (56.6%) | $45,598 |
| Female | 805 (43.4%) | $25,430 |
| Total | 1,856 (100.0%) | $36,679 |
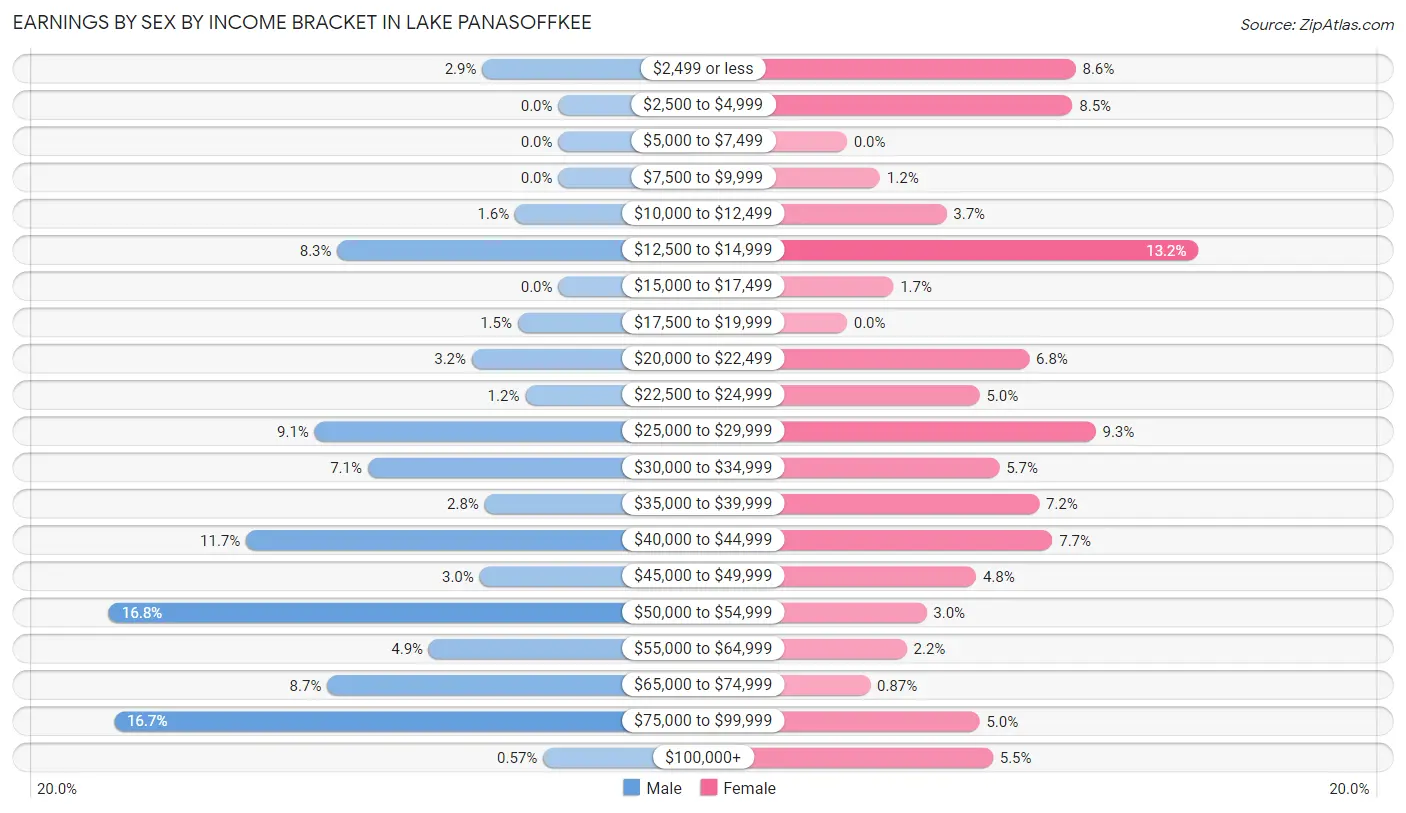
Earnings by Sex by Income Bracket in Lake Panasoffkee
The most common earnings brackets in Lake Panasoffkee are $50,000 to $54,999 for men (177 | 16.8%) and $12,500 to $14,999 for women (106 | 13.2%).
| Income | Male | Female |
| $2,499 or less | 30 (2.9%) | 69 (8.6%) |
| $2,500 to $4,999 | 0 (0.0%) | 68 (8.5%) |
| $5,000 to $7,499 | 0 (0.0%) | 0 (0.0%) |
| $7,500 to $9,999 | 0 (0.0%) | 10 (1.2%) |
| $10,000 to $12,499 | 17 (1.6%) | 30 (3.7%) |
| $12,500 to $14,999 | 87 (8.3%) | 106 (13.2%) |
| $15,000 to $17,499 | 0 (0.0%) | 14 (1.7%) |
| $17,500 to $19,999 | 16 (1.5%) | 0 (0.0%) |
| $20,000 to $22,499 | 34 (3.2%) | 55 (6.8%) |
| $22,500 to $24,999 | 13 (1.2%) | 40 (5.0%) |
| $25,000 to $29,999 | 96 (9.1%) | 75 (9.3%) |
| $30,000 to $34,999 | 75 (7.1%) | 46 (5.7%) |
| $35,000 to $39,999 | 29 (2.8%) | 58 (7.2%) |
| $40,000 to $44,999 | 123 (11.7%) | 62 (7.7%) |
| $45,000 to $49,999 | 31 (2.9%) | 39 (4.8%) |
| $50,000 to $54,999 | 177 (16.8%) | 24 (3.0%) |
| $55,000 to $64,999 | 51 (4.9%) | 18 (2.2%) |
| $65,000 to $74,999 | 91 (8.7%) | 7 (0.9%) |
| $75,000 to $99,999 | 175 (16.7%) | 40 (5.0%) |
| $100,000+ | 6 (0.6%) | 44 (5.5%) |
| Total | 1,051 (100.0%) | 805 (100.0%) |
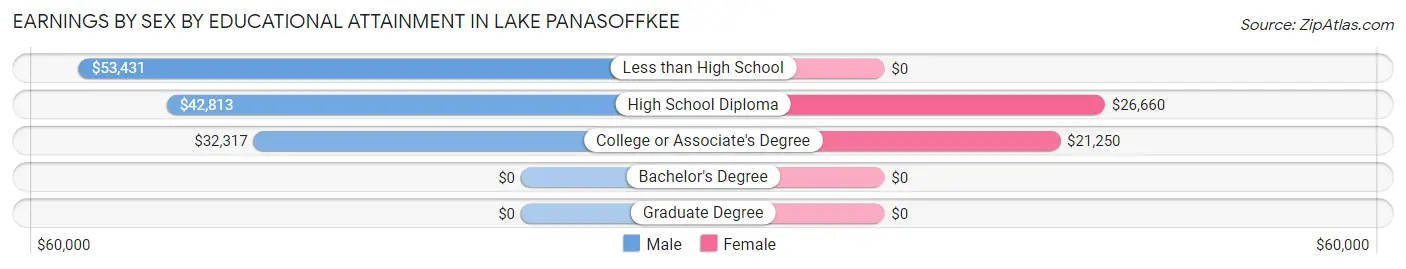
Earnings by Sex by Educational Attainment in Lake Panasoffkee
Average earnings in Lake Panasoffkee are $46,304 for men and $26,557 for women, a difference of 42.6%. Men with an educational attainment of less than high school enjoy the highest average annual earnings of $53,431, while those with college or associate's degree education earn the least with $32,317. Women with an educational attainment of high school diploma earn the most with the average annual earnings of $26,660, while those with college or associate's degree education have the smallest earnings of $21,250.
| Educational Attainment | Male Income | Female Income |
| Less than High School | $53,431 | $0 |
| High School Diploma | $42,813 | $26,660 |
| College or Associate's Degree | $32,317 | $21,250 |
| Bachelor's Degree | - | - |
| Graduate Degree | - | - |
| Total | $46,304 | $26,557 |
Family Income in Lake Panasoffkee
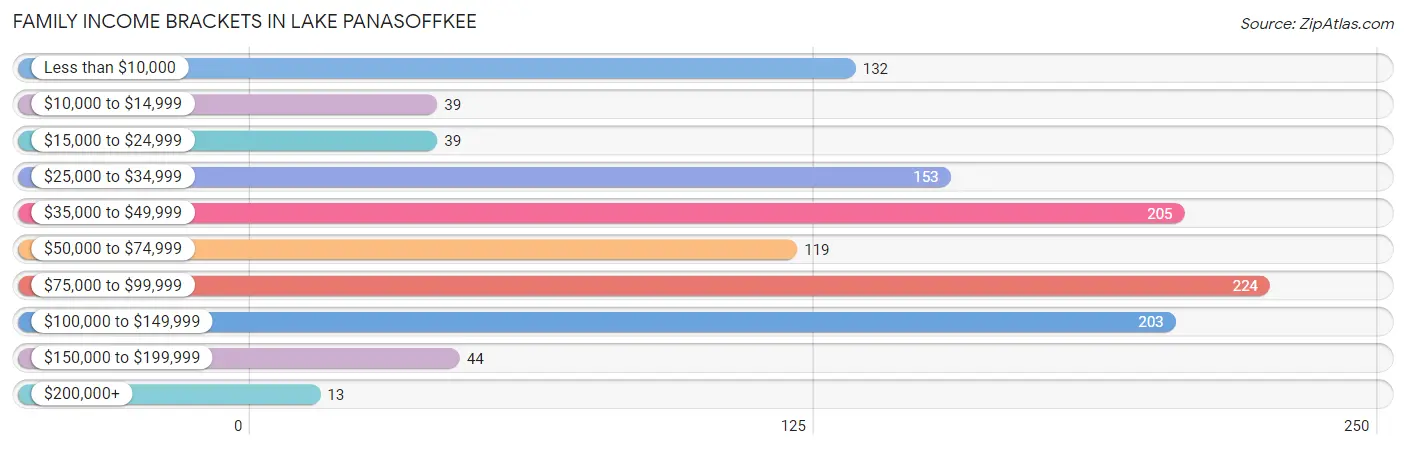
Family Income Brackets in Lake Panasoffkee
According to the Lake Panasoffkee family income data, there are 224 families falling into the $75,000 to $99,999 income range, which is the most common income bracket and makes up 19.1% of all families. Conversely, the $200,000+ income bracket is the least frequent group with only 13 families (1.1%) belonging to this category.
| Income Bracket | # Families | % Families |
| Less than $10,000 | 132 | 11.3% |
| $10,000 to $14,999 | 39 | 3.3% |
| $15,000 to $24,999 | 39 | 3.3% |
| $25,000 to $34,999 | 153 | 13.1% |
| $35,000 to $49,999 | 205 | 17.5% |
| $50,000 to $74,999 | 119 | 10.2% |
| $75,000 to $99,999 | 224 | 19.1% |
| $100,000 to $149,999 | 203 | 17.3% |
| $150,000 to $199,999 | 44 | 3.8% |
| $200,000+ | 13 | 1.1% |
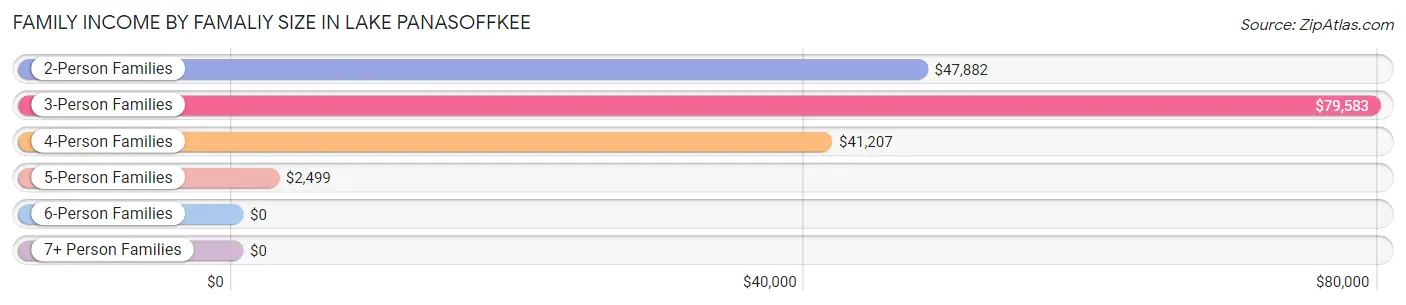
Family Income by Famaliy Size in Lake Panasoffkee
3-person families (306 | 26.1%) account for the highest median family income in Lake Panasoffkee with $79,583 per family, while 3-person families (306 | 26.1%) have the highest median income of $26,528 per family member.
| Income Bracket | # Families | Median Income |
| 2-Person Families | 627 (53.5%) | $47,882 |
| 3-Person Families | 306 (26.1%) | $79,583 |
| 4-Person Families | 88 (7.5%) | $41,207 |
| 5-Person Families | 59 (5.0%) | $2,499 |
| 6-Person Families | 91 (7.8%) | $0 |
| 7+ Person Families | 0 (0.0%) | $0 |
| Total | 1,171 (100.0%) | $51,458 |
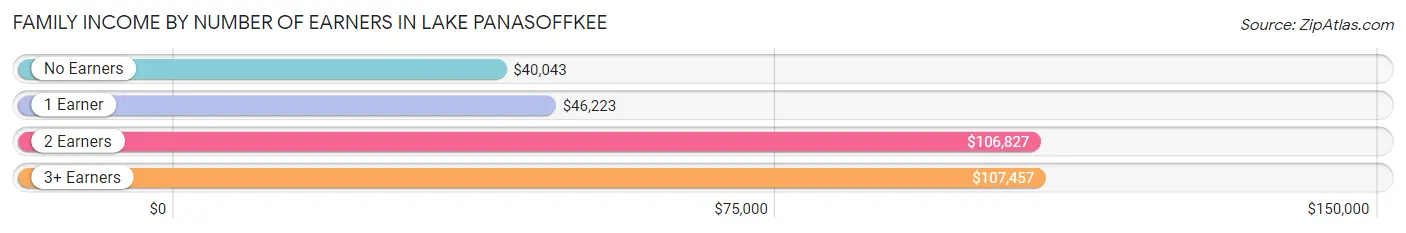
Family Income by Number of Earners in Lake Panasoffkee
The median family income in Lake Panasoffkee is $51,458, with families comprising 3+ earners (113) having the highest median family income of $107,457, while families with no earners (327) have the lowest median family income of $40,043, accounting for 9.7% and 27.9% of families, respectively.
| Number of Earners | # Families | Median Income |
| No Earners | 327 (27.9%) | $40,043 |
| 1 Earner | 502 (42.9%) | $46,223 |
| 2 Earners | 229 (19.6%) | $106,827 |
| 3+ Earners | 113 (9.7%) | $107,457 |
| Total | 1,171 (100.0%) | $51,458 |
Household Income in Lake Panasoffkee
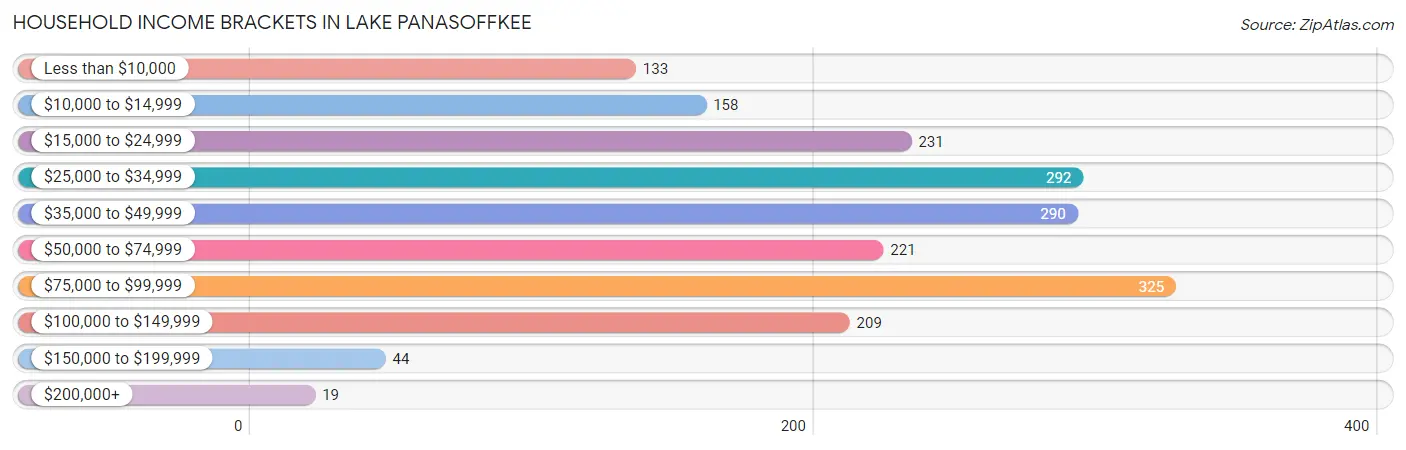
Household Income Brackets in Lake Panasoffkee
With 325 households falling in the category, the $75,000 to $99,999 income range is the most frequent in Lake Panasoffkee, accounting for 16.9% of all households. In contrast, only 19 households (1.0%) fall into the $200,000+ income bracket, making it the least populous group.
| Income Bracket | # Households | % Households |
| Less than $10,000 | 133 | 6.9% |
| $10,000 to $14,999 | 158 | 8.2% |
| $15,000 to $24,999 | 231 | 12.0% |
| $25,000 to $34,999 | 292 | 15.2% |
| $35,000 to $49,999 | 290 | 15.1% |
| $50,000 to $74,999 | 221 | 11.5% |
| $75,000 to $99,999 | 325 | 16.9% |
| $100,000 to $149,999 | 209 | 10.9% |
| $150,000 to $199,999 | 44 | 2.3% |
| $200,000+ | 19 | 1.0% |
Household Income by Householder Age in Lake Panasoffkee
The median household income in Lake Panasoffkee is $45,222, with the highest median household income of $54,355 found in the 25 to 44 years age bracket for the primary householder. A total of 490 households (25.5%) fall into this category.
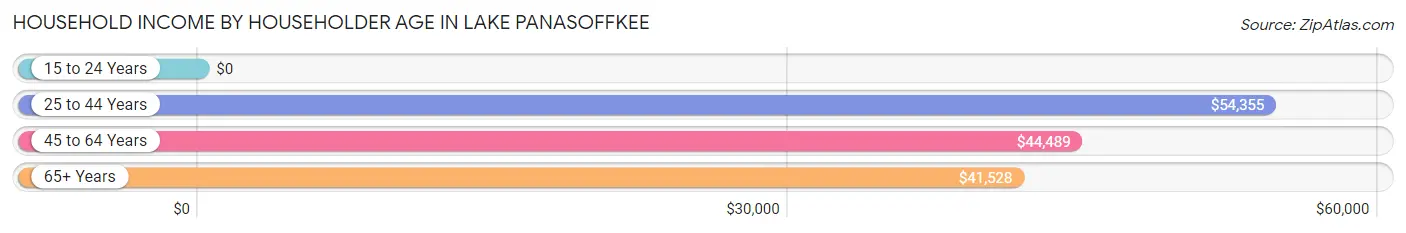
| Income Bracket | # Households | Median Income |
| 15 to 24 Years | 0 (0.0%) | $0 |
| 25 to 44 Years | 490 (25.5%) | $54,355 |
| 45 to 64 Years | 766 (39.9%) | $44,489 |
| 65+ Years | 665 (34.6%) | $41,528 |
| Total | 1,921 (100.0%) | $45,222 |
Poverty in Lake Panasoffkee
Income Below Poverty by Sex and Age in Lake Panasoffkee
With 24.2% poverty level for males and 35.1% for females among the residents of Lake Panasoffkee, 5 year old males and 6 to 11 year old females are the most vulnerable to poverty, with 35 males (100.0%) and 247 females (82.1%) in their respective age groups living below the poverty level.
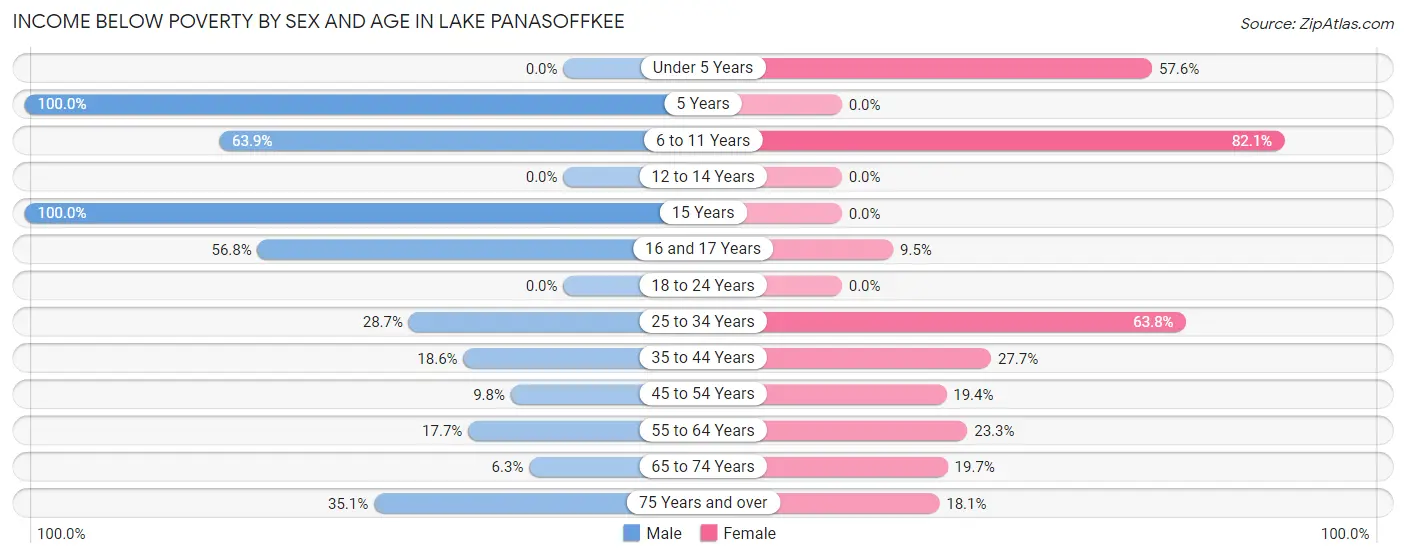
| Age Bracket | Male | Female |
| Under 5 Years | 0 (0.0%) | 91 (57.6%) |
| 5 Years | 35 (100.0%) | 0 (0.0%) |
| 6 to 11 Years | 69 (63.9%) | 247 (82.1%) |
| 12 to 14 Years | 0 (0.0%) | 0 (0.0%) |
| 15 Years | 23 (100.0%) | 0 (0.0%) |
| 16 and 17 Years | 42 (56.8%) | 6 (9.5%) |
| 18 to 24 Years | 0 (0.0%) | 0 (0.0%) |
| 25 to 34 Years | 105 (28.7%) | 132 (63.8%) |
| 35 to 44 Years | 41 (18.5%) | 59 (27.7%) |
| 45 to 54 Years | 33 (9.8%) | 64 (19.4%) |
| 55 to 64 Years | 56 (17.7%) | 82 (23.3%) |
| 65 to 74 Years | 19 (6.3%) | 45 (19.7%) |
| 75 Years and over | 52 (35.1%) | 40 (18.1%) |
| Total | 475 (24.2%) | 766 (35.1%) |
Income Above Poverty by Sex and Age in Lake Panasoffkee
According to the poverty statistics in Lake Panasoffkee, males aged under 5 years and females aged 12 to 14 years are the age groups that are most secure financially, with 100.0% of males and 100.0% of females in these age groups living above the poverty line.
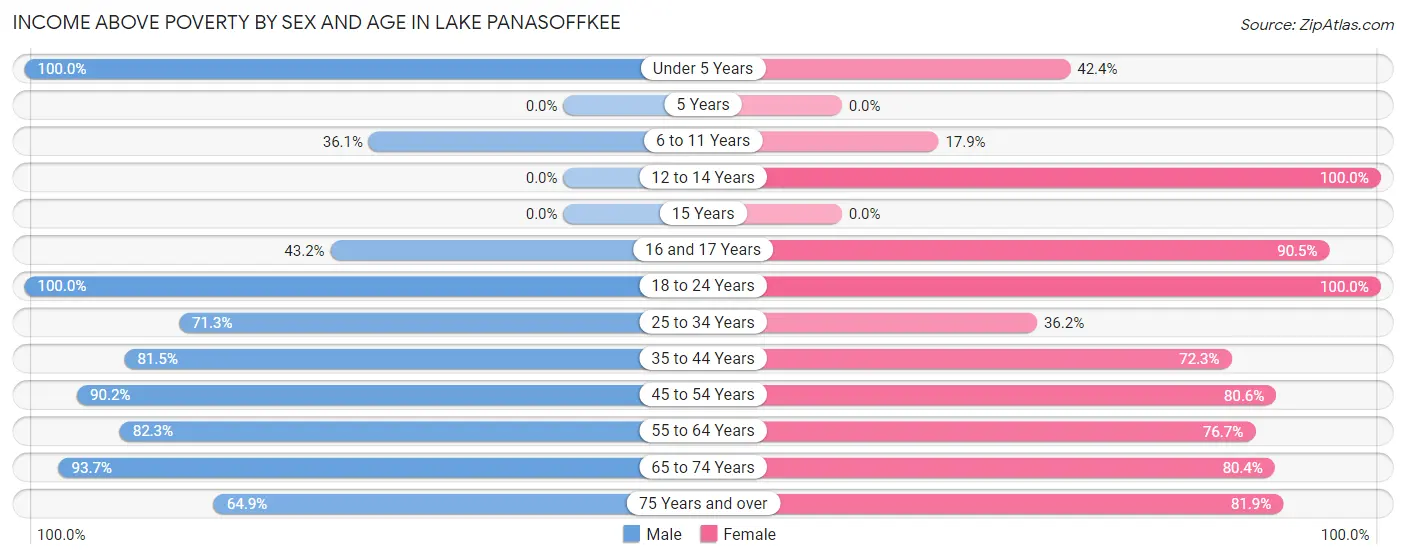
| Age Bracket | Male | Female |
| Under 5 Years | 19 (100.0%) | 67 (42.4%) |
| 5 Years | 0 (0.0%) | 0 (0.0%) |
| 6 to 11 Years | 39 (36.1%) | 54 (17.9%) |
| 12 to 14 Years | 0 (0.0%) | 10 (100.0%) |
| 15 Years | 0 (0.0%) | 0 (0.0%) |
| 16 and 17 Years | 32 (43.2%) | 57 (90.5%) |
| 18 to 24 Years | 13 (100.0%) | 97 (100.0%) |
| 25 to 34 Years | 261 (71.3%) | 75 (36.2%) |
| 35 to 44 Years | 180 (81.5%) | 154 (72.3%) |
| 45 to 54 Years | 305 (90.2%) | 266 (80.6%) |
| 55 to 64 Years | 261 (82.3%) | 270 (76.7%) |
| 65 to 74 Years | 281 (93.7%) | 184 (80.3%) |
| 75 Years and over | 96 (64.9%) | 181 (81.9%) |
| Total | 1,487 (75.8%) | 1,415 (64.9%) |
Income Below Poverty Among Married-Couple Families in Lake Panasoffkee
The poverty statistics for married-couple families in Lake Panasoffkee show that 16.7% or 139 of the total 831 families live below the poverty line. Families with 3 or 4 children have the highest poverty rate of 89.2%, comprising of 91 families. On the other hand, families with 1 or 2 children have the lowest poverty rate of 0.0%, which includes 0 families.
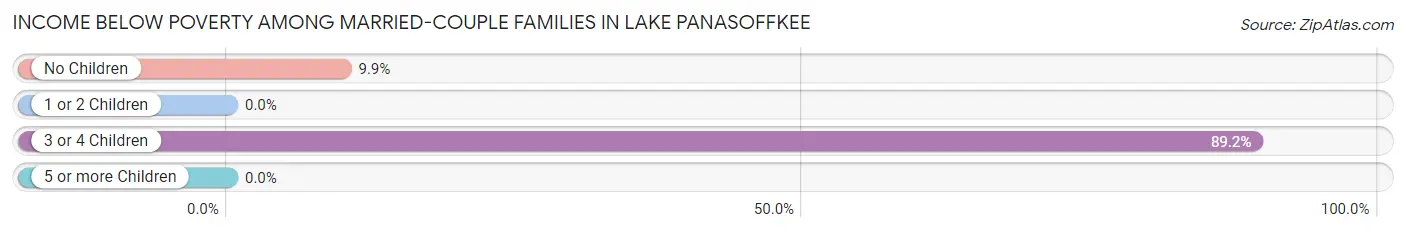
| Children | Above Poverty | Below Poverty |
| No Children | 438 (90.1%) | 48 (9.9%) |
| 1 or 2 Children | 243 (100.0%) | 0 (0.0%) |
| 3 or 4 Children | 11 (10.8%) | 91 (89.2%) |
| 5 or more Children | 0 (0.0%) | 0 (0.0%) |
| Total | 692 (83.3%) | 139 (16.7%) |
Income Below Poverty Among Single-Parent Households in Lake Panasoffkee
According to the poverty data in Lake Panasoffkee, 23.0% or 23 single-father households and 55.0% or 132 single-mother households are living below the poverty line. Among single-father households, those with 1 or 2 children have the highest poverty rate, with 23 households (46.0%) experiencing poverty. Likewise, among single-mother households, those with 3 or 4 children have the highest poverty rate, with 61 households (100.0%) falling below the poverty line.
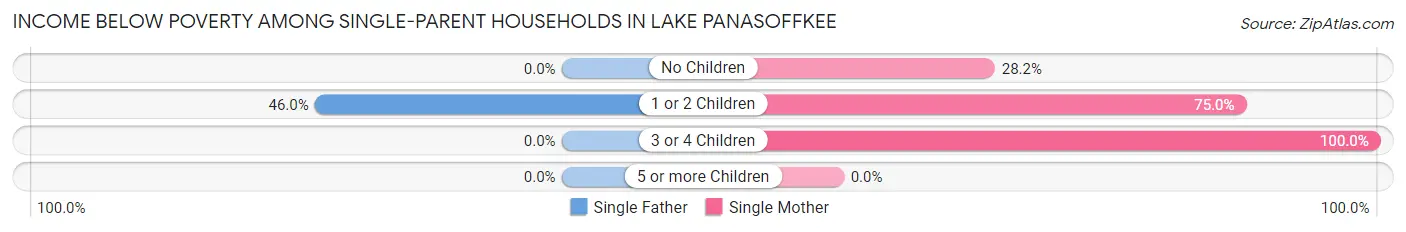
| Children | Single Father | Single Mother |
| No Children | 0 (0.0%) | 38 (28.1%) |
| 1 or 2 Children | 23 (46.0%) | 33 (75.0%) |
| 3 or 4 Children | 0 (0.0%) | 61 (100.0%) |
| 5 or more Children | 0 (0.0%) | 0 (0.0%) |
| Total | 23 (23.0%) | 132 (55.0%) |
Income Below Poverty Among Married-Couple vs Single-Parent Households in Lake Panasoffkee
The poverty data for Lake Panasoffkee shows that 139 of the married-couple family households (16.7%) and 155 of the single-parent households (45.6%) are living below the poverty level. Within the married-couple family households, those with 3 or 4 children have the highest poverty rate, with 91 households (89.2%) falling below the poverty line. Among the single-parent households, those with 3 or 4 children have the highest poverty rate, with 61 household (100.0%) living below poverty.
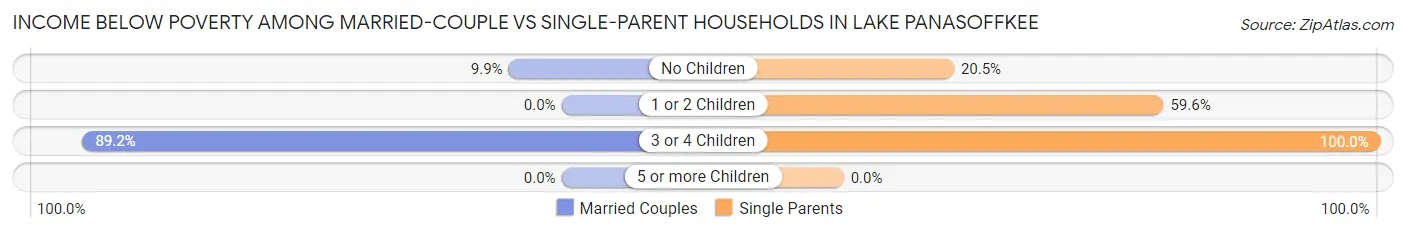
| Children | Married-Couple Families | Single-Parent Households |
| No Children | 48 (9.9%) | 38 (20.5%) |
| 1 or 2 Children | 0 (0.0%) | 56 (59.6%) |
| 3 or 4 Children | 91 (89.2%) | 61 (100.0%) |
| 5 or more Children | 0 (0.0%) | 0 (0.0%) |
| Total | 139 (16.7%) | 155 (45.6%) |
Race in Lake Panasoffkee
The most populous races in Lake Panasoffkee are White / Caucasian (3,604 | 86.4%), Hispanic or Latino (314 | 7.5%), and Black / African American (306 | 7.3%).
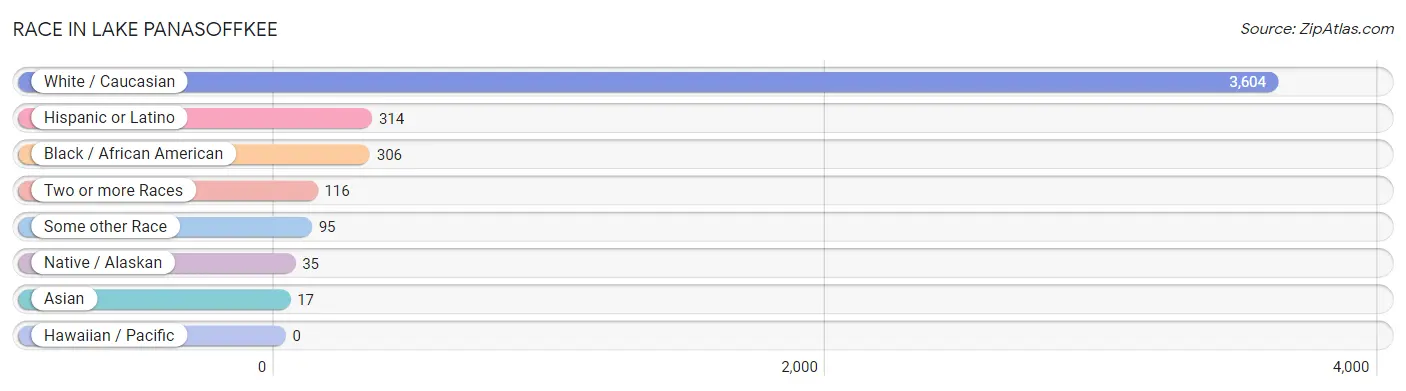
| Race | # Population | % Population |
| Asian | 17 | 0.4% |
| Black / African American | 306 | 7.3% |
| Hawaiian / Pacific | 0 | 0.0% |
| Hispanic or Latino | 314 | 7.5% |
| Native / Alaskan | 35 | 0.8% |
| White / Caucasian | 3,604 | 86.4% |
| Two or more Races | 116 | 2.8% |
| Some other Race | 95 | 2.3% |
| Total | 4,173 | 100.0% |
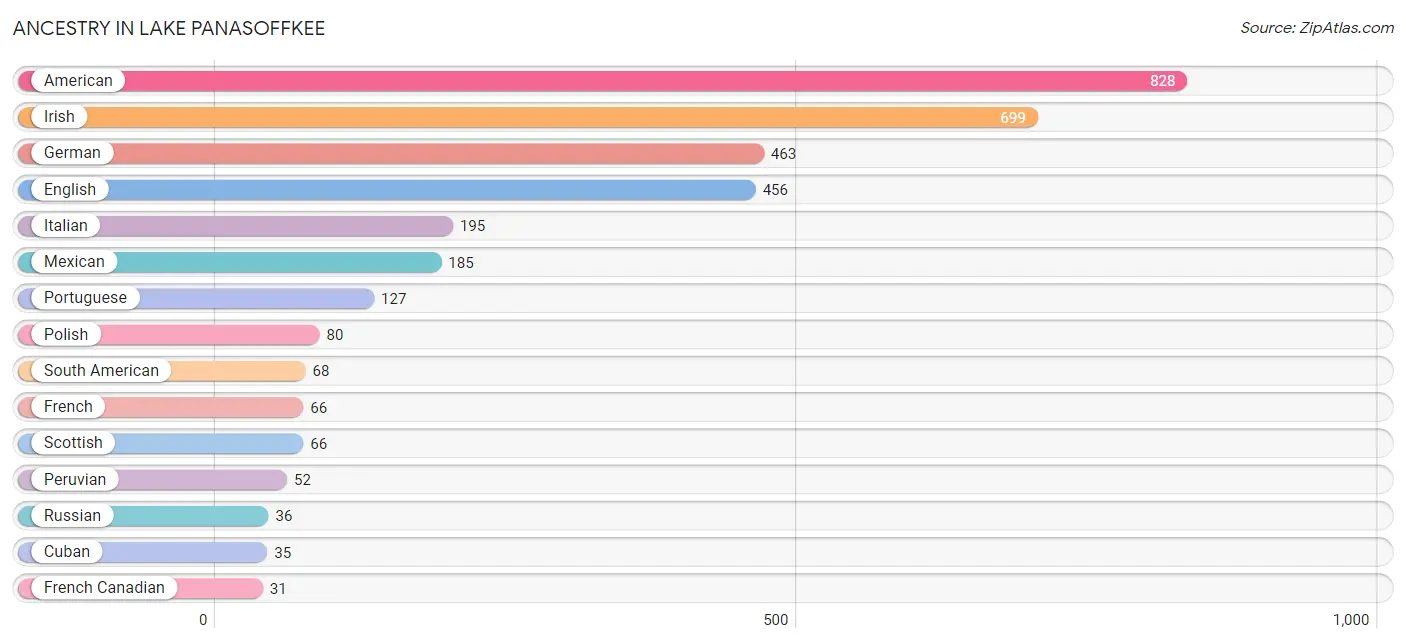
Ancestry in Lake Panasoffkee
The most populous ancestries reported in Lake Panasoffkee are American (828 | 19.8%), Irish (699 | 16.8%), German (463 | 11.1%), English (456 | 10.9%), and Italian (195 | 4.7%), together accounting for 63.3% of all Lake Panasoffkee residents.
| Ancestry | # Population | % Population |
| African | 9 | 0.2% |
| American | 828 | 19.8% |
| Blackfeet | 7 | 0.2% |
| Burmese | 17 | 0.4% |
| Canadian | 18 | 0.4% |
| Colombian | 16 | 0.4% |
| Cuban | 35 | 0.8% |
| Czechoslovakian | 10 | 0.2% |
| Dutch | 11 | 0.3% |
| Eastern European | 30 | 0.7% |
| English | 456 | 10.9% |
| European | 16 | 0.4% |
| Finnish | 10 | 0.2% |
| French | 66 | 1.6% |
| French Canadian | 31 | 0.7% |
| German | 463 | 11.1% |
| Irish | 699 | 16.8% |
| Iroquois | 6 | 0.1% |
| Italian | 195 | 4.7% |
| Lumbee | 3 | 0.1% |
| Mexican | 185 | 4.4% |
| Peruvian | 52 | 1.3% |
| Polish | 80 | 1.9% |
| Portuguese | 127 | 3.0% |
| Puerto Rican | 12 | 0.3% |
| Russian | 36 | 0.9% |
| Scottish | 66 | 1.6% |
| Slovak | 12 | 0.3% |
| South American | 68 | 1.6% |
| Spaniard | 14 | 0.3% |
| Subsaharan African | 9 | 0.2% |
| Swedish | 11 | 0.3% |
| Ukrainian | 10 | 0.2% |
| Welsh | 11 | 0.3% | View All 34 Rows |
Immigrants in Lake Panasoffkee
The most numerous immigrant groups reported in Lake Panasoffkee came from Europe (59 | 1.4%), Eastern Europe (30 | 0.7%), Russia (30 | 0.7%), Portugal (29 | 0.7%), and Southern Europe (29 | 0.7%), together accounting for 4.2% of all Lake Panasoffkee residents.
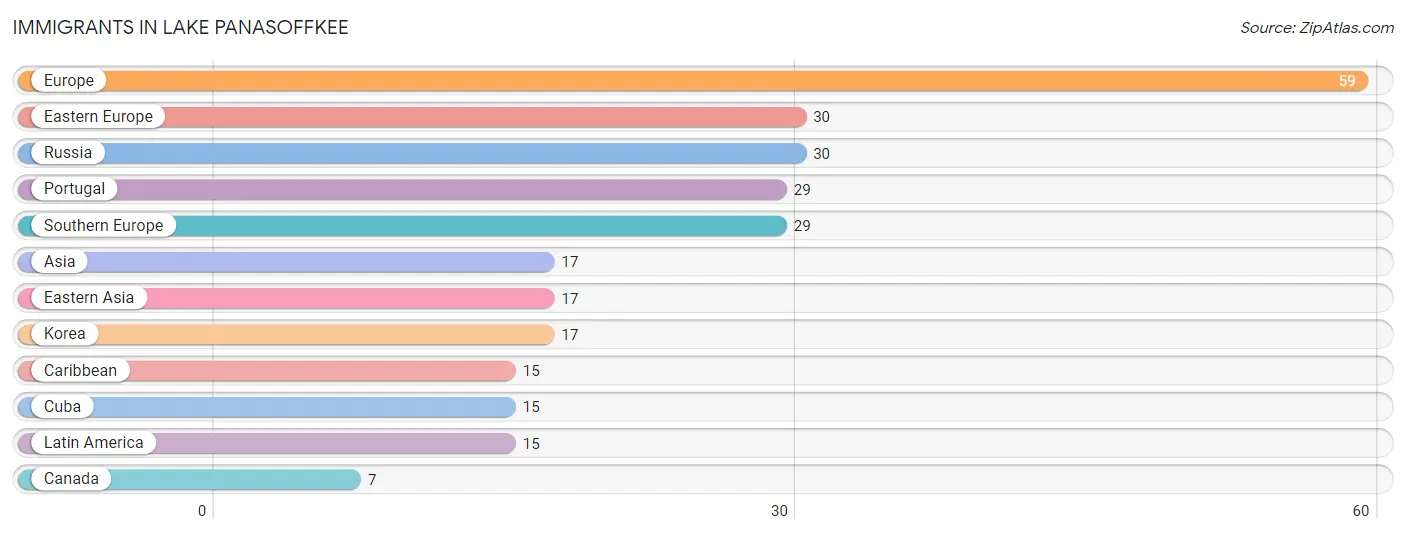
| Immigration Origin | # Population | % Population |
| Asia | 17 | 0.4% |
| Canada | 7 | 0.2% |
| Caribbean | 15 | 0.4% |
| Cuba | 15 | 0.4% |
| Eastern Asia | 17 | 0.4% |
| Eastern Europe | 30 | 0.7% |
| Europe | 59 | 1.4% |
| Korea | 17 | 0.4% |
| Latin America | 15 | 0.4% |
| Portugal | 29 | 0.7% |
| Russia | 30 | 0.7% |
| Southern Europe | 29 | 0.7% | View All 12 Rows |
Sex and Age in Lake Panasoffkee
Sex and Age in Lake Panasoffkee
The most populous age groups in Lake Panasoffkee are 50 to 54 Years (254 | 13.0%) for men and 5 to 9 Years (222 | 10.0%) for women.
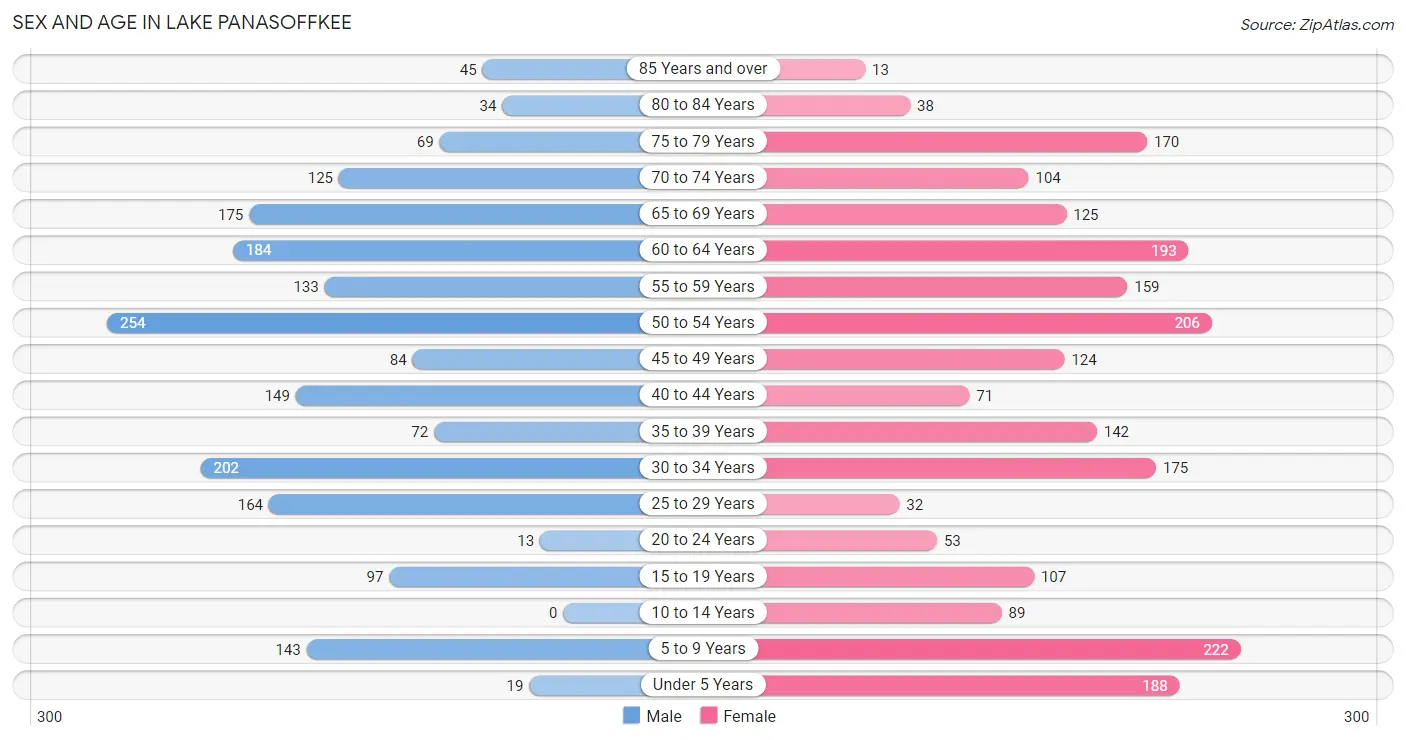
| Age Bracket | Male | Female |
| Under 5 Years | 19 (1.0%) | 188 (8.5%) |
| 5 to 9 Years | 143 (7.3%) | 222 (10.0%) |
| 10 to 14 Years | 0 (0.0%) | 89 (4.0%) |
| 15 to 19 Years | 97 (4.9%) | 107 (4.8%) |
| 20 to 24 Years | 13 (0.7%) | 53 (2.4%) |
| 25 to 29 Years | 164 (8.4%) | 32 (1.5%) |
| 30 to 34 Years | 202 (10.3%) | 175 (7.9%) |
| 35 to 39 Years | 72 (3.7%) | 142 (6.4%) |
| 40 to 44 Years | 149 (7.6%) | 71 (3.2%) |
| 45 to 49 Years | 84 (4.3%) | 124 (5.6%) |
| 50 to 54 Years | 254 (13.0%) | 206 (9.3%) |
| 55 to 59 Years | 133 (6.8%) | 159 (7.2%) |
| 60 to 64 Years | 184 (9.4%) | 193 (8.7%) |
| 65 to 69 Years | 175 (8.9%) | 125 (5.7%) |
| 70 to 74 Years | 125 (6.4%) | 104 (4.7%) |
| 75 to 79 Years | 69 (3.5%) | 170 (7.7%) |
| 80 to 84 Years | 34 (1.7%) | 38 (1.7%) |
| 85 Years and over | 45 (2.3%) | 13 (0.6%) |
| Total | 1,962 (100.0%) | 2,211 (100.0%) |
Families and Households in Lake Panasoffkee
Median Family Size in Lake Panasoffkee
The median family size in Lake Panasoffkee is 2.70 persons per family, with single female/mother families (240 | 20.5%) accounting for the largest median family size of 2.83 persons per family. On the other hand, single male/father families (100 | 8.5%) represent the smallest median family size with 2.03 persons per family.
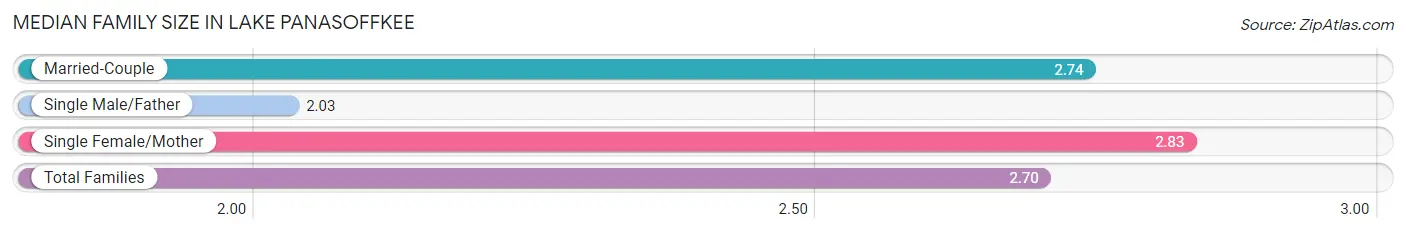
| Family Type | # Families | Family Size |
| Married-Couple | 831 (71.0%) | 2.74 |
| Single Male/Father | 100 (8.5%) | 2.03 |
| Single Female/Mother | 240 (20.5%) | 2.83 |
| Total Families | 1,171 (100.0%) | 2.70 |
Median Household Size in Lake Panasoffkee
The median household size in Lake Panasoffkee is 2.17 persons per household, with single female/mother households (240 | 12.5%) accounting for the largest median household size of 3.1 persons per household. non-family households (750 | 39.0%) represent the smallest median household size with 1.22 persons per household.
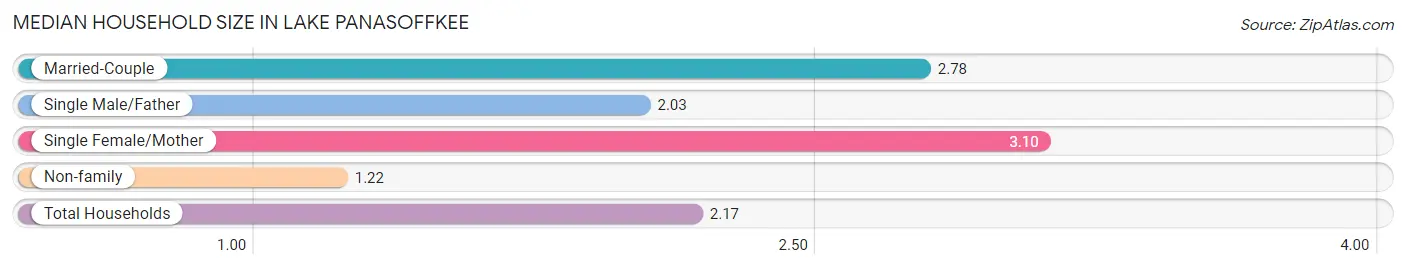
| Household Type | # Households | Household Size |
| Married-Couple | 831 (43.3%) | 2.78 |
| Single Male/Father | 100 (5.2%) | 2.03 |
| Single Female/Mother | 240 (12.5%) | 3.10 |
| Non-family | 750 (39.0%) | 1.22 |
| Total Households | 1,921 (100.0%) | 2.17 |
Household Size by Marriage Status in Lake Panasoffkee
Out of a total of 1,921 households in Lake Panasoffkee, 1,171 (61.0%) are family households, while 750 (39.0%) are nonfamily households. The most numerous type of family households are 2-person households, comprising 608, and the most common type of nonfamily households are 1-person households, comprising 596.
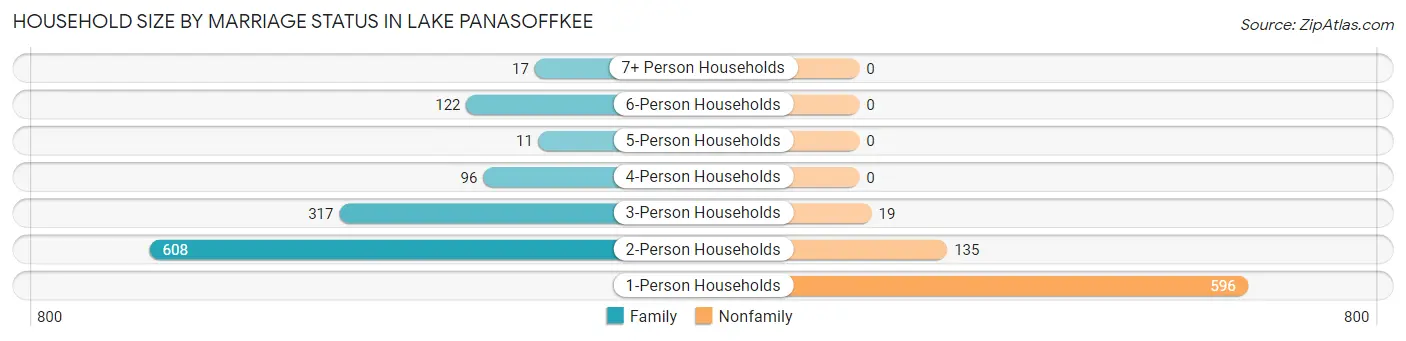
| Household Size | Family Households | Nonfamily Households |
| 1-Person Households | - | 596 (31.0%) |
| 2-Person Households | 608 (31.7%) | 135 (7.0%) |
| 3-Person Households | 317 (16.5%) | 19 (1.0%) |
| 4-Person Households | 96 (5.0%) | 0 (0.0%) |
| 5-Person Households | 11 (0.6%) | 0 (0.0%) |
| 6-Person Households | 122 (6.4%) | 0 (0.0%) |
| 7+ Person Households | 17 (0.9%) | 0 (0.0%) |
| Total | 1,171 (61.0%) | 750 (39.0%) |
Female Fertility in Lake Panasoffkee
Fertility by Age in Lake Panasoffkee
Average fertility rate in Lake Panasoffkee is 81.0 births per 1,000 women. Women in the age bracket of 35 to 50 years have the highest fertility rate with 97.0 births per 1,000 women. Women in the age bracket of 35 to 50 years acount for 64.6% of all women with births.
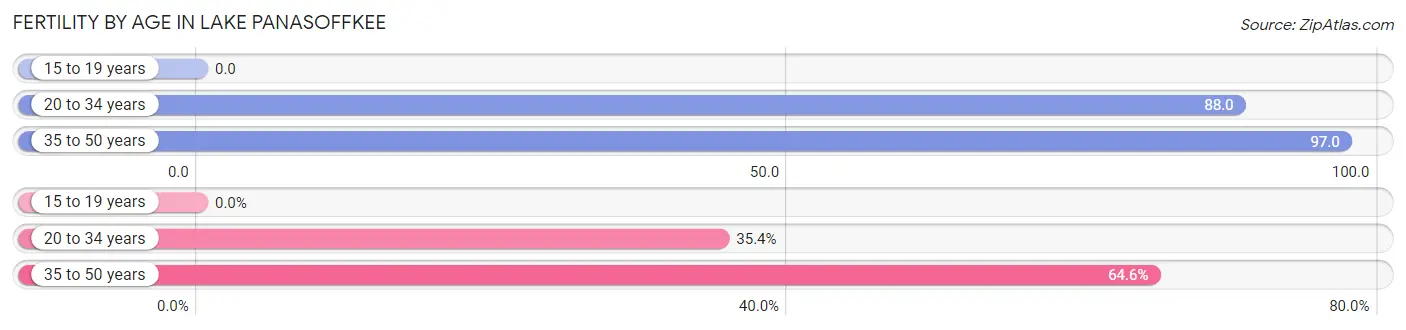
| Age Bracket | Women with Births | Births / 1,000 Women |
| 15 to 19 years | 0 (0.0%) | 0.0 |
| 20 to 34 years | 23 (35.4%) | 88.0 |
| 35 to 50 years | 42 (64.6%) | 97.0 |
| Total | 65 (100.0%) | 81.0 |
Fertility by Age by Marriage Status in Lake Panasoffkee
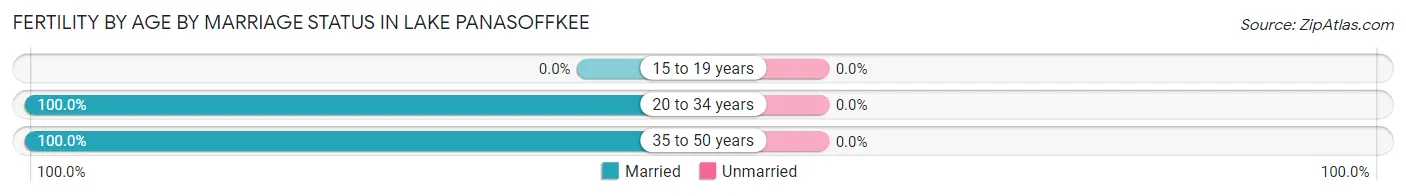
| Age Bracket | Married | Unmarried |
| 15 to 19 years | 0 (0.0%) | 0 (0.0%) |
| 20 to 34 years | 23 (100.0%) | 0 (0.0%) |
| 35 to 50 years | 42 (100.0%) | 0 (0.0%) |
| Total | 65 (100.0%) | 0 (0.0%) |
Fertility by Education in Lake Panasoffkee
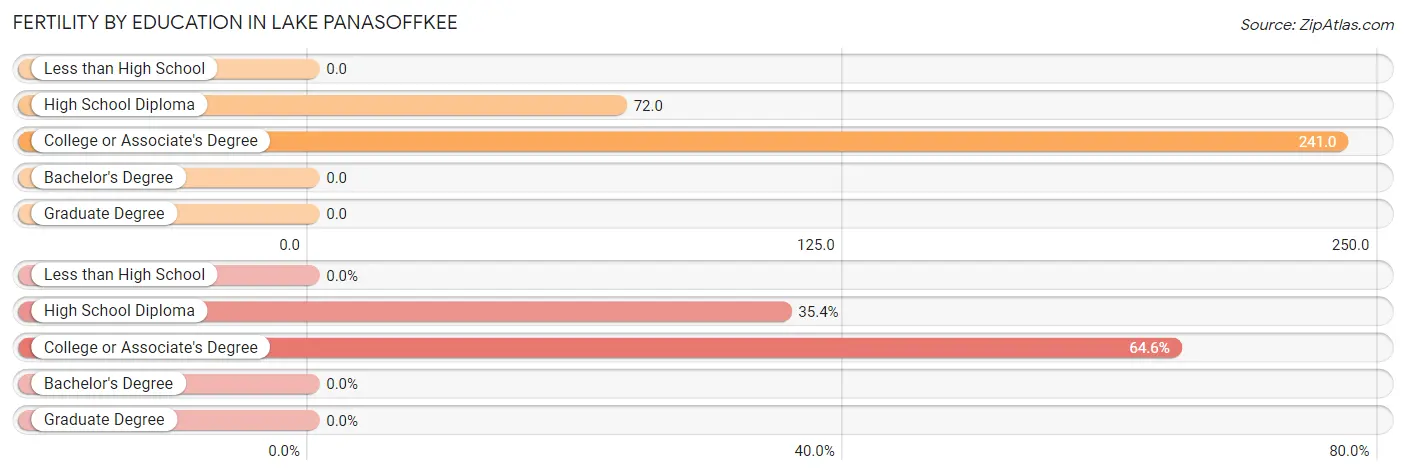
| Educational Attainment | Women with Births | Births / 1,000 Women |
| Less than High School | 0 (0.0%) | 0.0 |
| High School Diploma | 23 (35.4%) | 72.0 |
| College or Associate's Degree | 42 (64.6%) | 241.0 |
| Bachelor's Degree | 0 (0.0%) | 0.0 |
| Graduate Degree | 0 (0.0%) | 0.0 |
| Total | 65 (100.0%) | 81.0 |
Fertility by Education by Marriage Status in Lake Panasoffkee
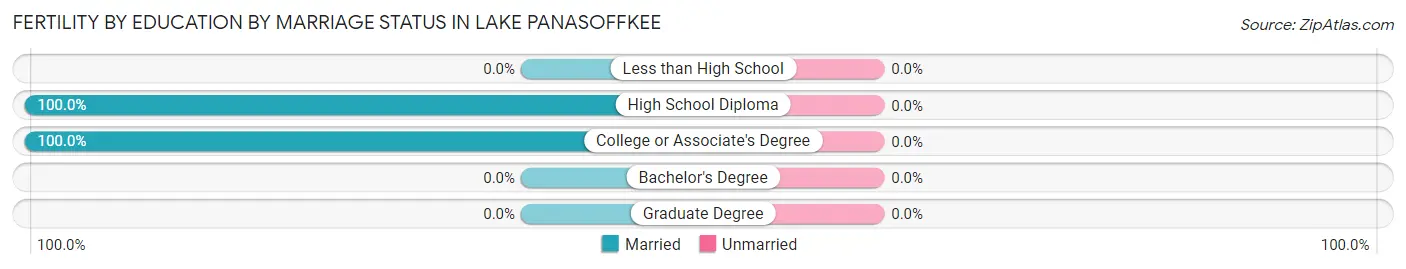
| Educational Attainment | Married | Unmarried |
| Less than High School | 0 (0.0%) | 0 (0.0%) |
| High School Diploma | 23 (100.0%) | 0 (0.0%) |
| College or Associate's Degree | 42 (100.0%) | 0 (0.0%) |
| Bachelor's Degree | 0 (0.0%) | 0 (0.0%) |
| Graduate Degree | 0 (0.0%) | 0 (0.0%) |
| Total | 65 (100.0%) | 0 (0.0%) |
Employment Characteristics in Lake Panasoffkee
Employment by Class of Employer in Lake Panasoffkee
Among the 1,722 employed individuals in Lake Panasoffkee, private company employees (1,235 | 71.7%), local government employees (142 | 8.3%), and self-employed (incorporated) (140 | 8.1%) make up the most common classes of employment.
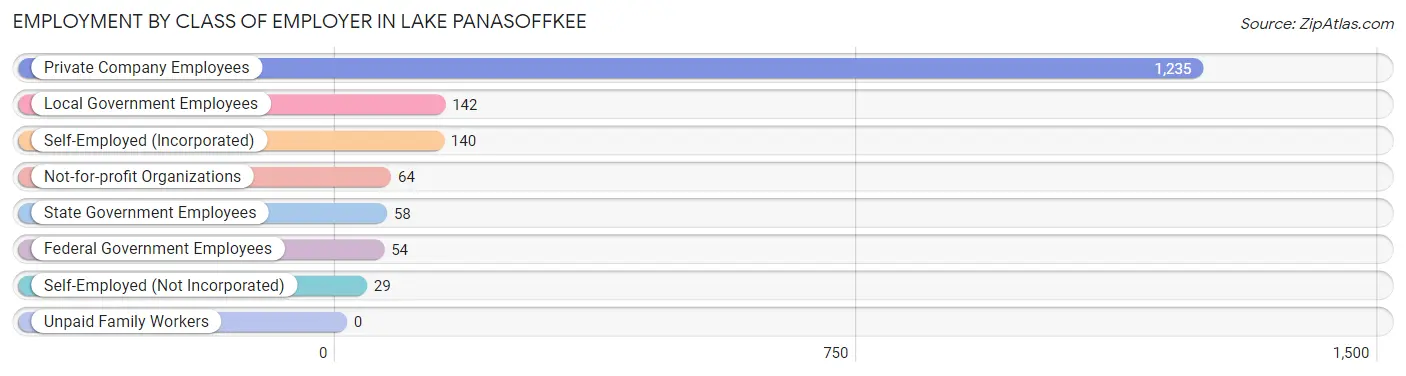
| Employer Class | # Employees | % Employees |
| Private Company Employees | 1,235 | 71.7% |
| Self-Employed (Incorporated) | 140 | 8.1% |
| Self-Employed (Not Incorporated) | 29 | 1.7% |
| Not-for-profit Organizations | 64 | 3.7% |
| Local Government Employees | 142 | 8.3% |
| State Government Employees | 58 | 3.4% |
| Federal Government Employees | 54 | 3.1% |
| Unpaid Family Workers | 0 | 0.0% |
| Total | 1,722 | 100.0% |
Employment Status by Age in Lake Panasoffkee
According to the labor force statistics for Lake Panasoffkee, out of the total population over 16 years of age (3,489), 52.3% or 1,825 individuals are in the labor force, with 4.2% or 77 of them unemployed. The age group with the highest labor force participation rate is 20 to 24 years, with 89.4% or 59 individuals in the labor force. Within the labor force, the 35 to 44 years age range has the highest percentage of unemployed individuals, with 9.9% or 30 of them being unemployed.
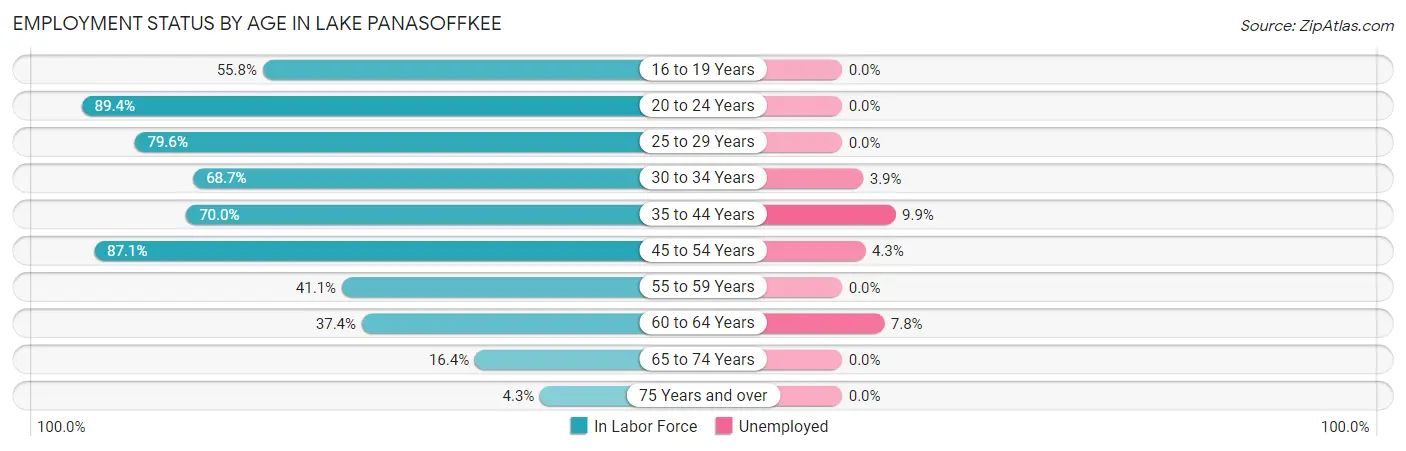
| Age Bracket | In Labor Force | Unemployed |
| 16 to 19 Years | 101 (55.8%) | 0 (0.0%) |
| 20 to 24 Years | 59 (89.4%) | 0 (0.0%) |
| 25 to 29 Years | 156 (79.6%) | 0 (0.0%) |
| 30 to 34 Years | 259 (68.7%) | 10 (3.9%) |
| 35 to 44 Years | 304 (70.0%) | 30 (9.9%) |
| 45 to 54 Years | 582 (87.1%) | 25 (4.3%) |
| 55 to 59 Years | 120 (41.1%) | 0 (0.0%) |
| 60 to 64 Years | 141 (37.4%) | 11 (7.8%) |
| 65 to 74 Years | 87 (16.4%) | 0 (0.0%) |
| 75 Years and over | 16 (4.3%) | 0 (0.0%) |
| Total | 1,825 (52.3%) | 77 (4.2%) |
Employment Status by Educational Attainment in Lake Panasoffkee
According to labor force statistics for Lake Panasoffkee, 66.6% of individuals (1,561) out of the total population between 25 and 64 years of age (2,344) are in the labor force, with 4.9% or 76 of them being unemployed. The group with the highest labor force participation rate are those with the educational attainment of less than high school, with 74.3% or 390 individuals in the labor force. Within the labor force, individuals with high school diploma education have the highest percentage of unemployment, with 12.1% or 66 of them being unemployed.
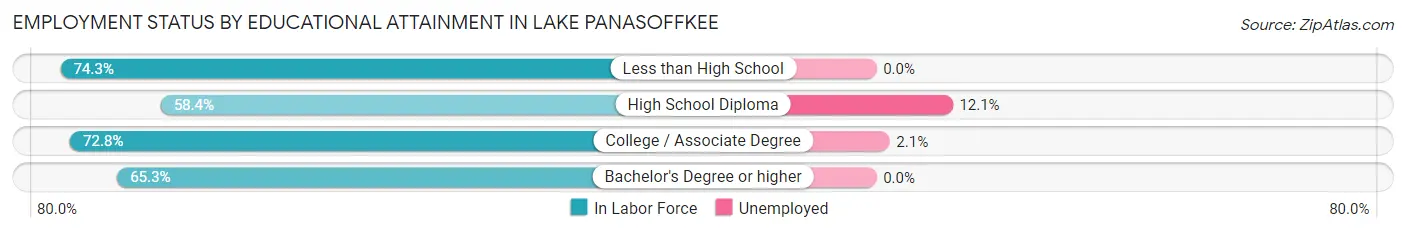
| Educational Attainment | In Labor Force | Unemployed |
| Less than High School | 390 (74.3%) | 0 (0.0%) |
| High School Diploma | 544 (58.4%) | 113 (12.1%) |
| College / Associate Degree | 472 (72.8%) | 14 (2.1%) |
| Bachelor's Degree or higher | 156 (65.3%) | 0 (0.0%) |
| Total | 1,561 (66.6%) | 115 (4.9%) |
Employment Occupations by Sex in Lake Panasoffkee
Management, Business, Science and Arts Occupations
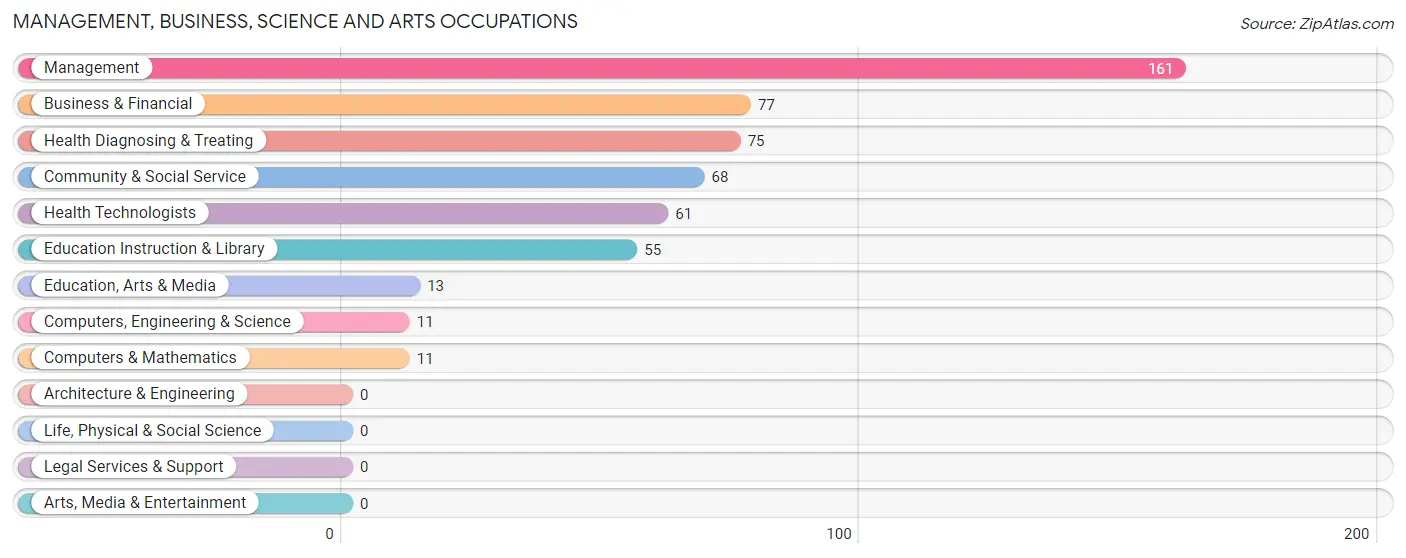
The most common Management, Business, Science and Arts occupations in Lake Panasoffkee are Management (161 | 9.2%), Business & Financial (77 | 4.4%), Health Diagnosing & Treating (75 | 4.3%), Community & Social Service (68 | 3.9%), and Health Technologists (61 | 3.5%).
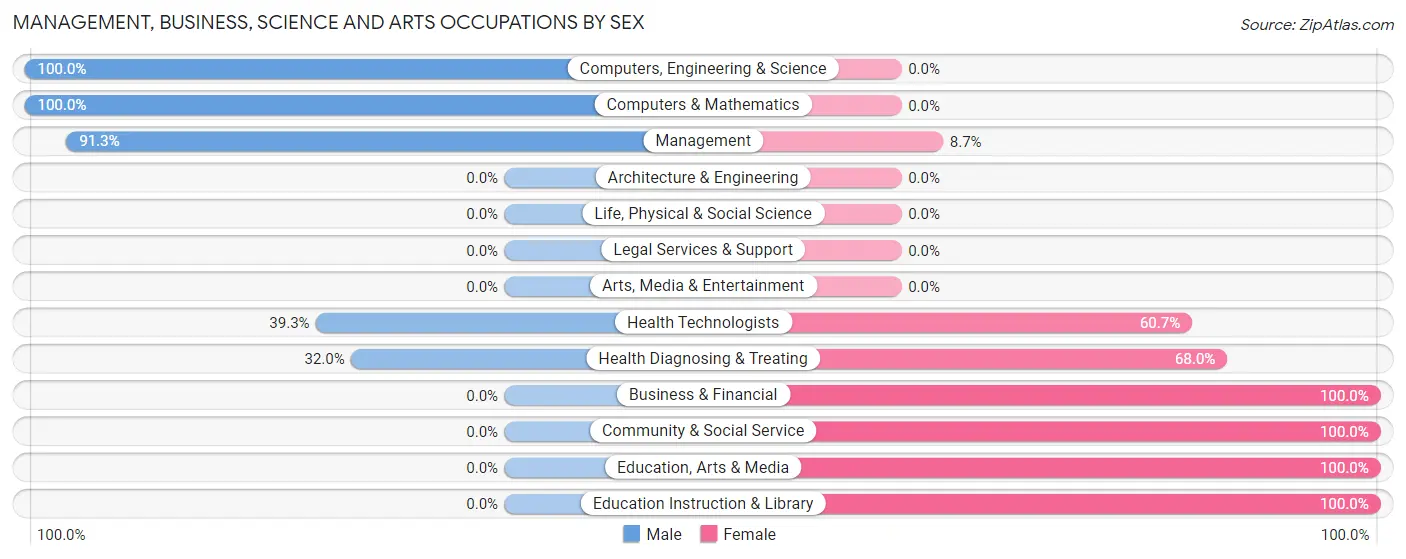
Management, Business, Science and Arts Occupations by Sex
Within the Management, Business, Science and Arts occupations in Lake Panasoffkee, the most male-oriented occupations are Computers, Engineering & Science (100.0%), Computers & Mathematics (100.0%), and Management (91.3%), while the most female-oriented occupations are Business & Financial (100.0%), Community & Social Service (100.0%), and Education, Arts & Media (100.0%).
| Occupation | Male | Female |
| Management | 147 (91.3%) | 14 (8.7%) |
| Business & Financial | 0 (0.0%) | 77 (100.0%) |
| Computers, Engineering & Science | 11 (100.0%) | 0 (0.0%) |
| Computers & Mathematics | 11 (100.0%) | 0 (0.0%) |
| Architecture & Engineering | 0 (0.0%) | 0 (0.0%) |
| Life, Physical & Social Science | 0 (0.0%) | 0 (0.0%) |
| Community & Social Service | 0 (0.0%) | 68 (100.0%) |
| Education, Arts & Media | 0 (0.0%) | 13 (100.0%) |
| Legal Services & Support | 0 (0.0%) | 0 (0.0%) |
| Education Instruction & Library | 0 (0.0%) | 55 (100.0%) |
| Arts, Media & Entertainment | 0 (0.0%) | 0 (0.0%) |
| Health Diagnosing & Treating | 24 (32.0%) | 51 (68.0%) |
| Health Technologists | 24 (39.3%) | 37 (60.7%) |
| Total (Category) | 182 (46.4%) | 210 (53.6%) |
| Total (Overall) | 1,020 (58.3%) | 729 (41.7%) |
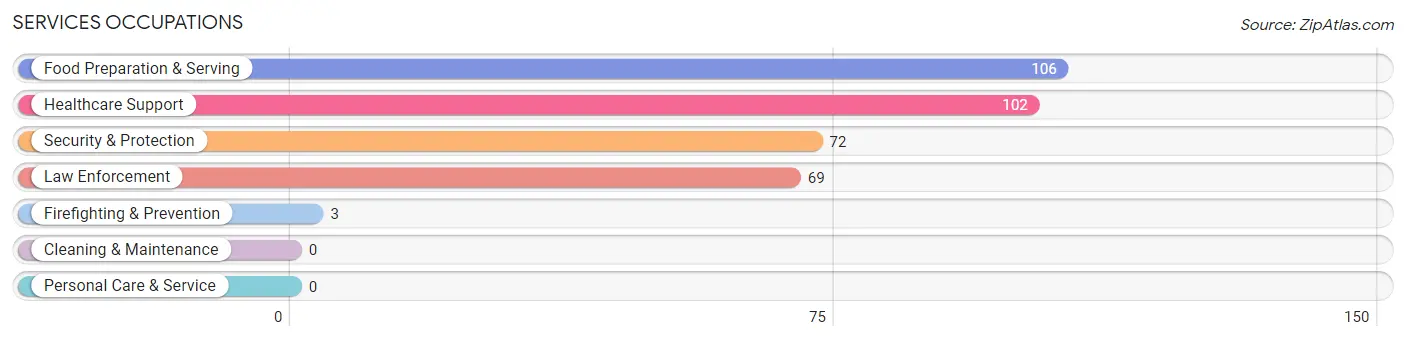
Services Occupations
The most common Services occupations in Lake Panasoffkee are Food Preparation & Serving (106 | 6.1%), Healthcare Support (102 | 5.8%), Security & Protection (72 | 4.1%), Law Enforcement (69 | 4.0%), and Firefighting & Prevention (3 | 0.2%).
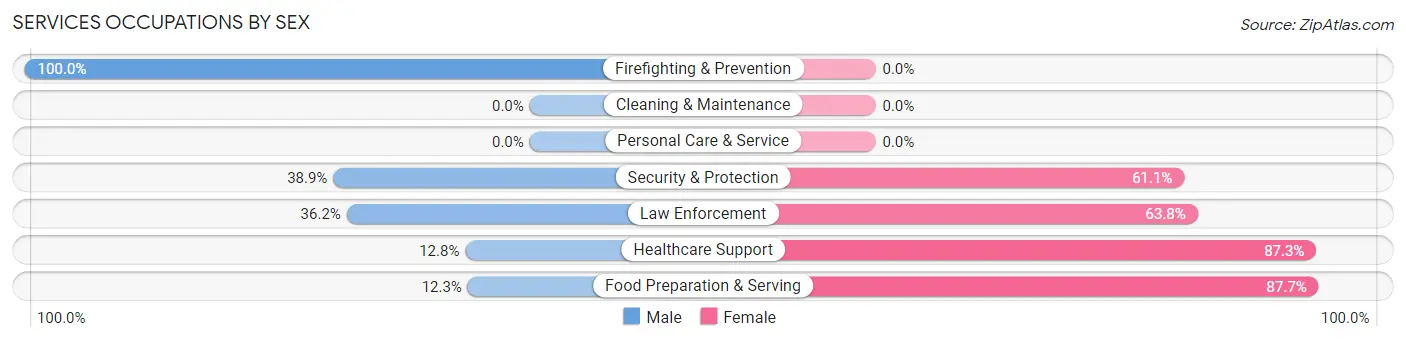
Services Occupations by Sex
Within the Services occupations in Lake Panasoffkee, the most male-oriented occupations are Firefighting & Prevention (100.0%), Security & Protection (38.9%), and Law Enforcement (36.2%), while the most female-oriented occupations are Food Preparation & Serving (87.7%), Healthcare Support (87.3%), and Law Enforcement (63.8%).
| Occupation | Male | Female |
| Healthcare Support | 13 (12.8%) | 89 (87.3%) |
| Security & Protection | 28 (38.9%) | 44 (61.1%) |
| Firefighting & Prevention | 3 (100.0%) | 0 (0.0%) |
| Law Enforcement | 25 (36.2%) | 44 (63.8%) |
| Food Preparation & Serving | 13 (12.3%) | 93 (87.7%) |
| Cleaning & Maintenance | 0 (0.0%) | 0 (0.0%) |
| Personal Care & Service | 0 (0.0%) | 0 (0.0%) |
| Total (Category) | 54 (19.3%) | 226 (80.7%) |
| Total (Overall) | 1,020 (58.3%) | 729 (41.7%) |
Sales and Office Occupations
The most common Sales and Office occupations in Lake Panasoffkee are Sales & Related (216 | 12.3%), and Office & Administration (155 | 8.9%).
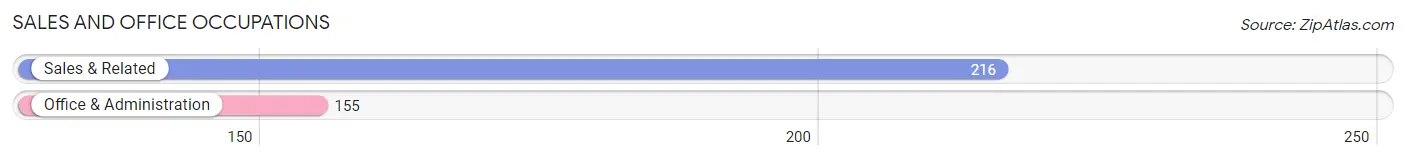
Sales and Office Occupations by Sex
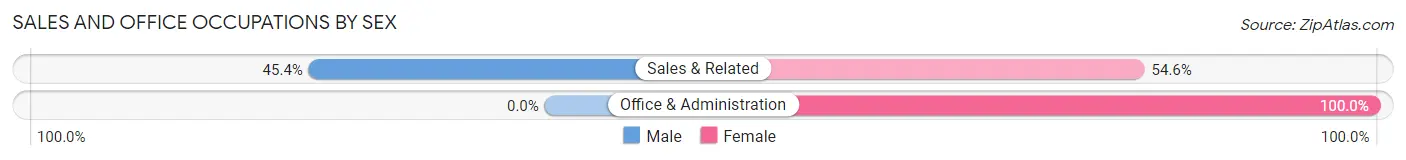
| Occupation | Male | Female |
| Sales & Related | 98 (45.4%) | 118 (54.6%) |
| Office & Administration | 0 (0.0%) | 155 (100.0%) |
| Total (Category) | 98 (26.4%) | 273 (73.6%) |
| Total (Overall) | 1,020 (58.3%) | 729 (41.7%) |
Natural Resources, Construction and Maintenance Occupations
The most common Natural Resources, Construction and Maintenance occupations in Lake Panasoffkee are Construction & Extraction (283 | 16.2%), and Installation, Maintenance & Repair (64 | 3.7%).
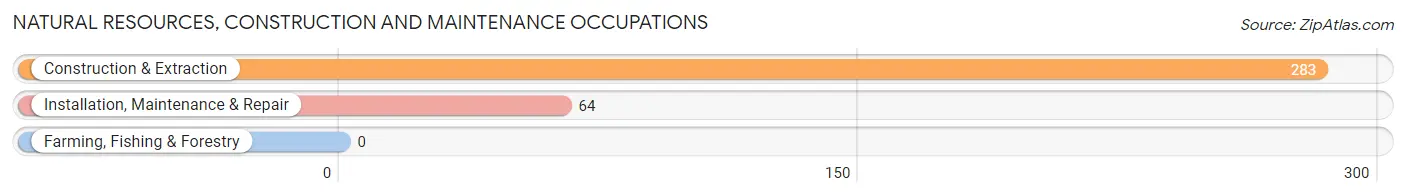
Natural Resources, Construction and Maintenance Occupations by Sex
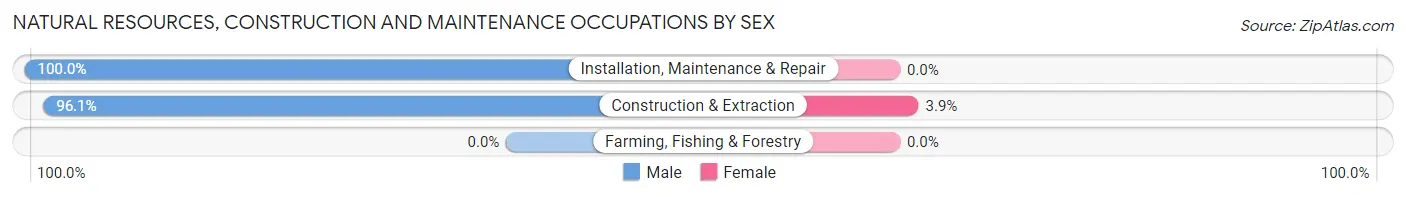
| Occupation | Male | Female |
| Farming, Fishing & Forestry | 0 (0.0%) | 0 (0.0%) |
| Construction & Extraction | 272 (96.1%) | 11 (3.9%) |
| Installation, Maintenance & Repair | 64 (100.0%) | 0 (0.0%) |
| Total (Category) | 336 (96.8%) | 11 (3.2%) |
| Total (Overall) | 1,020 (58.3%) | 729 (41.7%) |
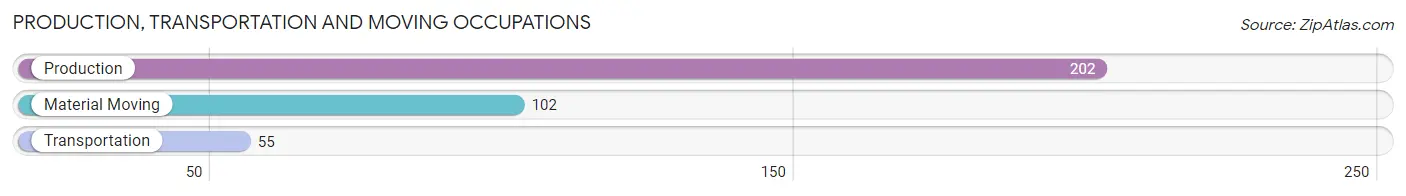
Production, Transportation and Moving Occupations
The most common Production, Transportation and Moving occupations in Lake Panasoffkee are Production (202 | 11.6%), Material Moving (102 | 5.8%), and Transportation (55 | 3.1%).
Production, Transportation and Moving Occupations by Sex
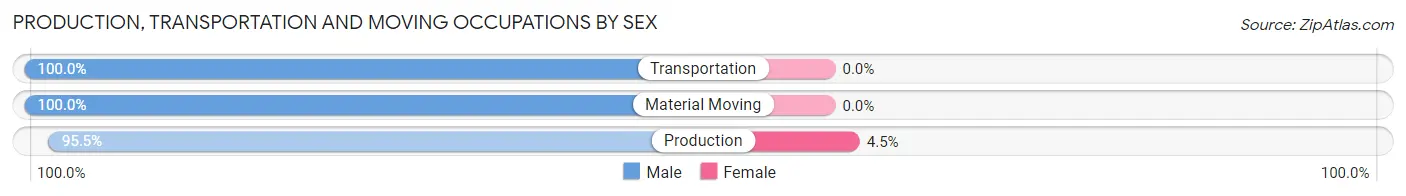
| Occupation | Male | Female |
| Production | 193 (95.5%) | 9 (4.5%) |
| Transportation | 55 (100.0%) | 0 (0.0%) |
| Material Moving | 102 (100.0%) | 0 (0.0%) |
| Total (Category) | 350 (97.5%) | 9 (2.5%) |
| Total (Overall) | 1,020 (58.3%) | 729 (41.7%) |
Employment Industries by Sex in Lake Panasoffkee
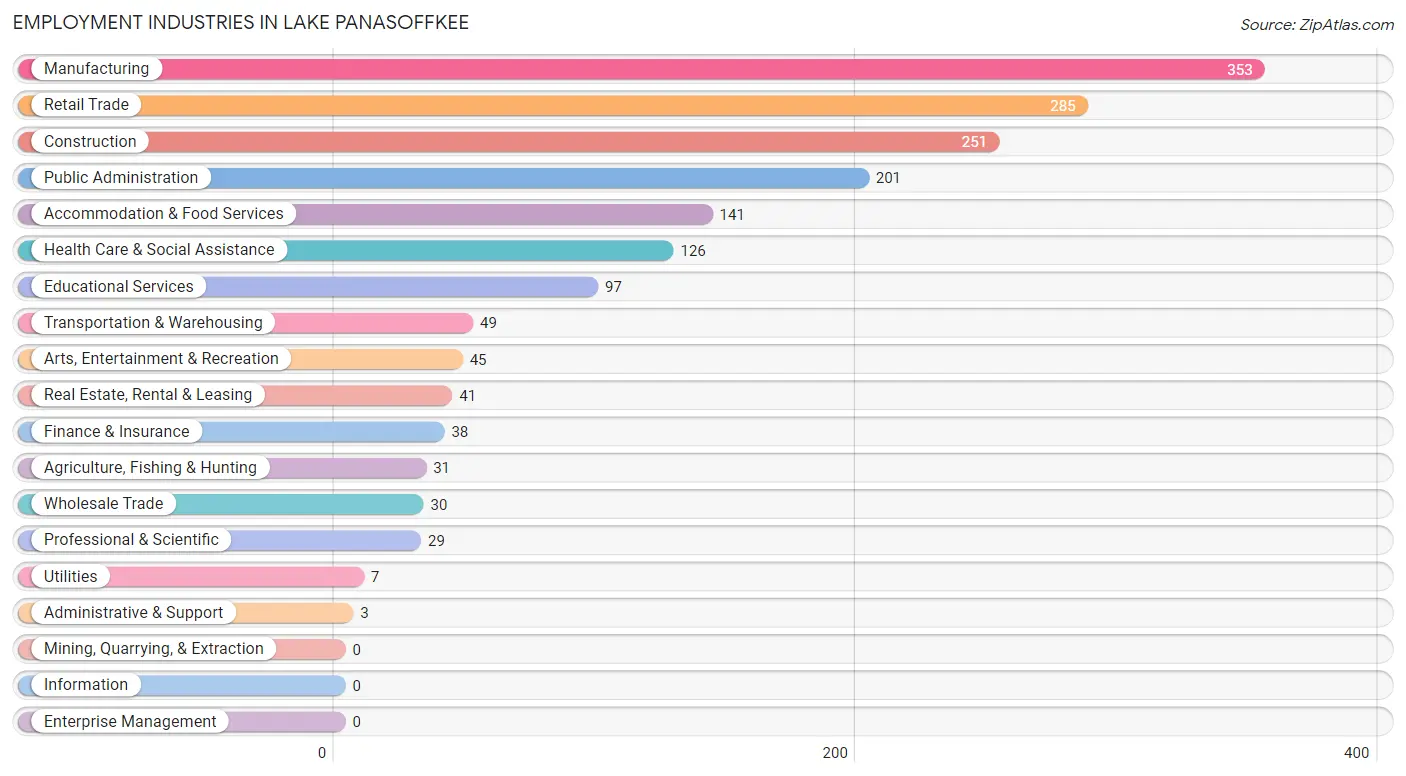
Employment Industries in Lake Panasoffkee
The major employment industries in Lake Panasoffkee include Manufacturing (353 | 20.2%), Retail Trade (285 | 16.3%), Construction (251 | 14.3%), Public Administration (201 | 11.5%), and Accommodation & Food Services (141 | 8.1%).
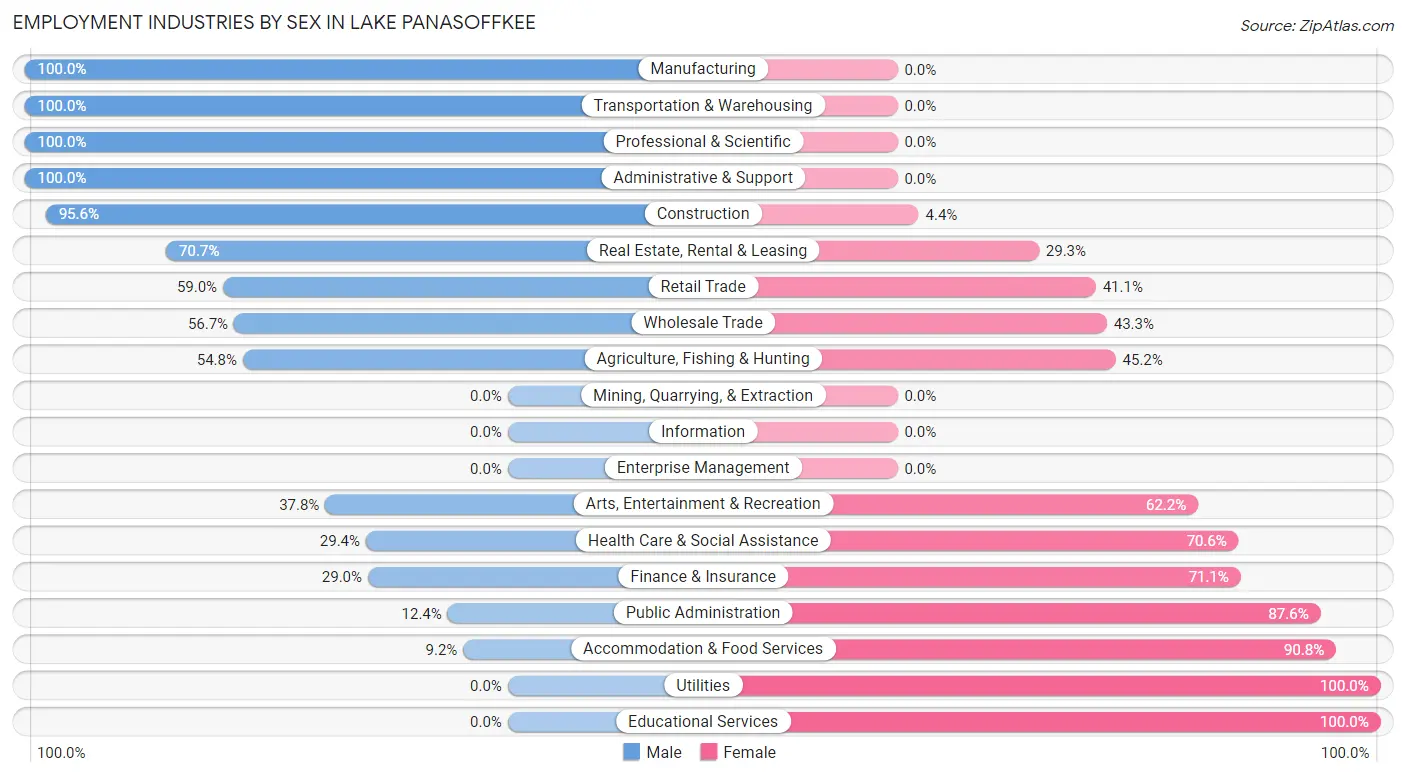
Employment Industries by Sex in Lake Panasoffkee
The Lake Panasoffkee industries that see more men than women are Manufacturing (100.0%), Transportation & Warehousing (100.0%), and Professional & Scientific (100.0%), whereas the industries that tend to have a higher number of women are Utilities (100.0%), Educational Services (100.0%), and Accommodation & Food Services (90.8%).
| Industry | Male | Female |
| Agriculture, Fishing & Hunting | 17 (54.8%) | 14 (45.2%) |
| Mining, Quarrying, & Extraction | 0 (0.0%) | 0 (0.0%) |
| Construction | 240 (95.6%) | 11 (4.4%) |
| Manufacturing | 353 (100.0%) | 0 (0.0%) |
| Wholesale Trade | 17 (56.7%) | 13 (43.3%) |
| Retail Trade | 168 (59.0%) | 117 (41.0%) |
| Transportation & Warehousing | 49 (100.0%) | 0 (0.0%) |
| Utilities | 0 (0.0%) | 7 (100.0%) |
| Information | 0 (0.0%) | 0 (0.0%) |
| Finance & Insurance | 11 (28.9%) | 27 (71.1%) |
| Real Estate, Rental & Leasing | 29 (70.7%) | 12 (29.3%) |
| Professional & Scientific | 29 (100.0%) | 0 (0.0%) |
| Enterprise Management | 0 (0.0%) | 0 (0.0%) |
| Administrative & Support | 3 (100.0%) | 0 (0.0%) |
| Educational Services | 0 (0.0%) | 97 (100.0%) |
| Health Care & Social Assistance | 37 (29.4%) | 89 (70.6%) |
| Arts, Entertainment & Recreation | 17 (37.8%) | 28 (62.2%) |
| Accommodation & Food Services | 13 (9.2%) | 128 (90.8%) |
| Public Administration | 25 (12.4%) | 176 (87.6%) |
| Total | 1,020 (58.3%) | 729 (41.7%) |
Education in Lake Panasoffkee
School Enrollment in Lake Panasoffkee
The most common levels of schooling among the 654 students in Lake Panasoffkee are elementary school (243 | 37.2%), high school (165 | 25.2%), and kindergarten (121 | 18.5%).
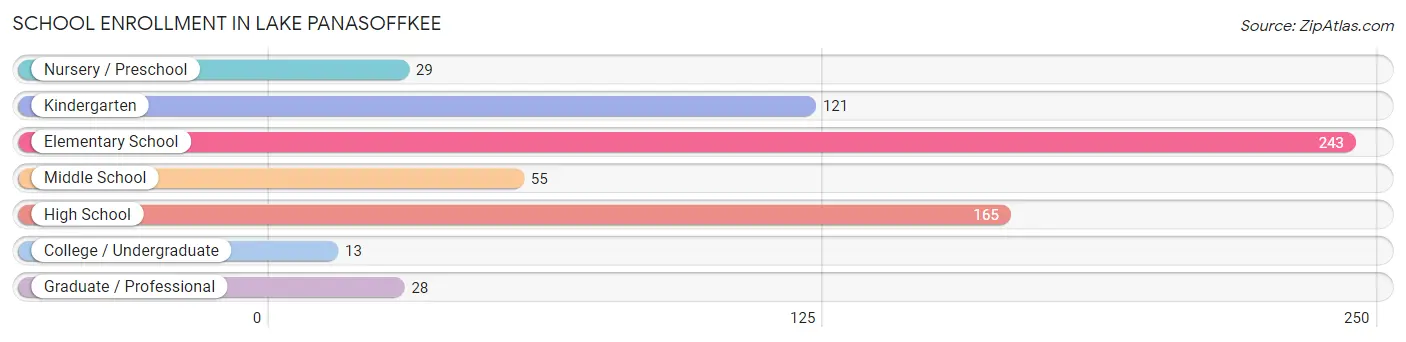
| School Level | # Students | % Students |
| Nursery / Preschool | 29 | 4.4% |
| Kindergarten | 121 | 18.5% |
| Elementary School | 243 | 37.2% |
| Middle School | 55 | 8.4% |
| High School | 165 | 25.2% |
| College / Undergraduate | 13 | 2.0% |
| Graduate / Professional | 28 | 4.3% |
| Total | 654 | 100.0% |
School Enrollment by Age by Funding Source in Lake Panasoffkee
Out of a total of 654 students who are enrolled in schools in Lake Panasoffkee, 28 (4.3%) attend a private institution, while the remaining 626 (95.7%) are enrolled in public schools. The age group of 3 to 4 year olds has the highest likelihood of being enrolled in private schools, with 19 (65.5% in the age bracket) enrolled. Conversely, the age group of 10 to 14 year olds has the lowest likelihood of being enrolled in a private school, with 89 (100.0% in the age bracket) attending a public institution.
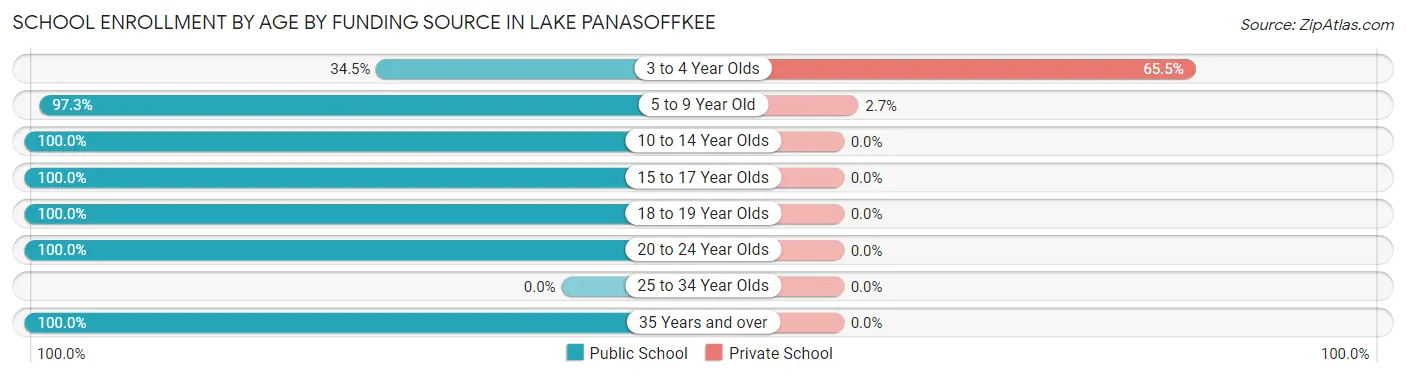
| Age Bracket | Public School | Private School |
| 3 to 4 Year Olds | 10 (34.5%) | 19 (65.5%) |
| 5 to 9 Year Old | 321 (97.3%) | 9 (2.7%) |
| 10 to 14 Year Olds | 89 (100.0%) | 0 (0.0%) |
| 15 to 17 Year Olds | 160 (100.0%) | 0 (0.0%) |
| 18 to 19 Year Olds | 5 (100.0%) | 0 (0.0%) |
| 20 to 24 Year Olds | 13 (100.0%) | 0 (0.0%) |
| 25 to 34 Year Olds | 0 (0.0%) | 0 (0.0%) |
| 35 Years and over | 28 (100.0%) | 0 (0.0%) |
| Total | 626 (95.7%) | 28 (4.3%) |
Educational Attainment by Field of Study in Lake Panasoffkee
Arts & humanities (89 | 27.2%), business (67 | 20.5%), bio, nature & agricultural (44 | 13.5%), education (36 | 11.0%), and science & technology (30 | 9.2%) are the most common fields of study among 327 individuals in Lake Panasoffkee who have obtained a bachelor's degree or higher.
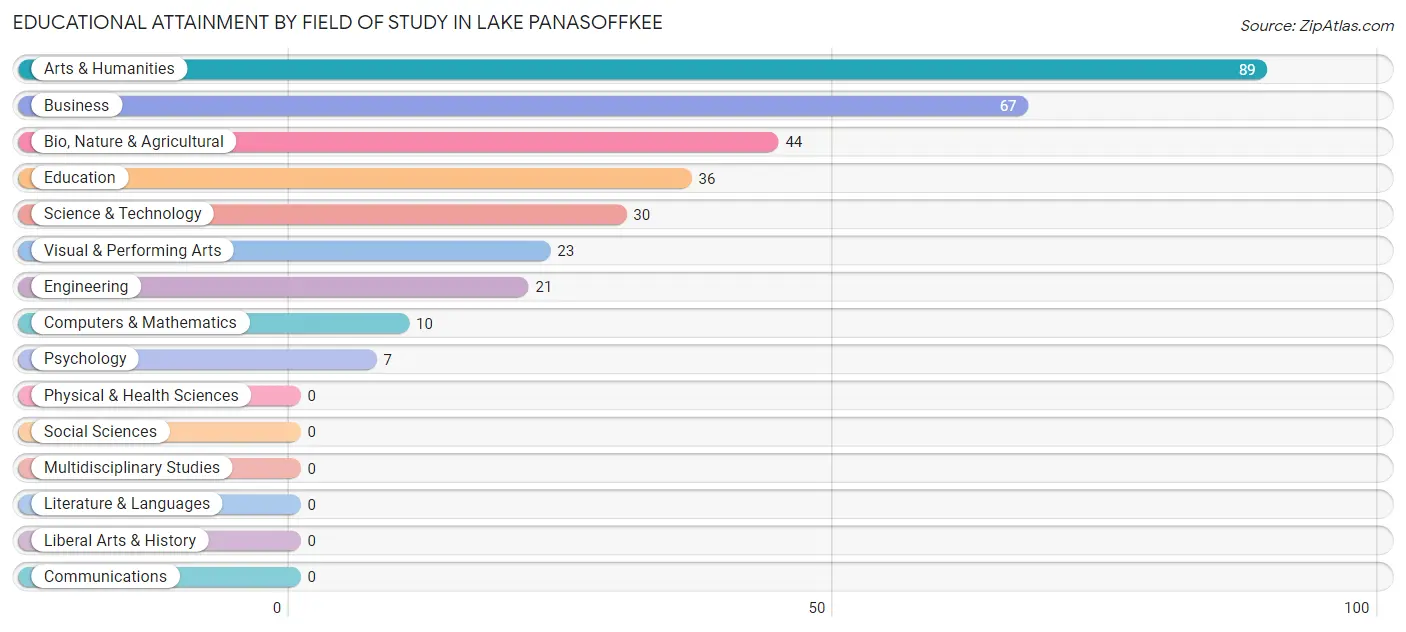
| Field of Study | # Graduates | % Graduates |
| Computers & Mathematics | 10 | 3.1% |
| Bio, Nature & Agricultural | 44 | 13.5% |
| Physical & Health Sciences | 0 | 0.0% |
| Psychology | 7 | 2.1% |
| Social Sciences | 0 | 0.0% |
| Engineering | 21 | 6.4% |
| Multidisciplinary Studies | 0 | 0.0% |
| Science & Technology | 30 | 9.2% |
| Business | 67 | 20.5% |
| Education | 36 | 11.0% |
| Literature & Languages | 0 | 0.0% |
| Liberal Arts & History | 0 | 0.0% |
| Visual & Performing Arts | 23 | 7.0% |
| Communications | 0 | 0.0% |
| Arts & Humanities | 89 | 27.2% |
| Total | 327 | 100.0% |
Transportation & Commute in Lake Panasoffkee
Vehicle Availability by Sex in Lake Panasoffkee
The most prevalent vehicle ownership categories in Lake Panasoffkee are males with 1 vehicle (296, accounting for 29.4%) and females with 1 vehicle (114, making up 41.3%).
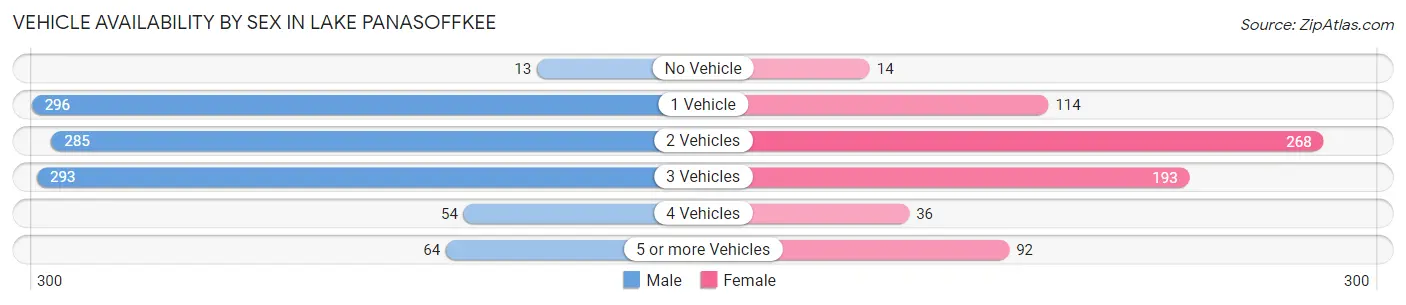
| Vehicles Available | Male | Female |
| No Vehicle | 13 (1.3%) | 14 (1.9%) |
| 1 Vehicle | 296 (29.4%) | 114 (15.9%) |
| 2 Vehicles | 285 (28.4%) | 268 (37.4%) |
| 3 Vehicles | 293 (29.1%) | 193 (26.9%) |
| 4 Vehicles | 54 (5.4%) | 36 (5.0%) |
| 5 or more Vehicles | 64 (6.4%) | 92 (12.8%) |
| Total | 1,005 (100.0%) | 717 (100.0%) |
Commute Time in Lake Panasoffkee
The most frequently occuring commute durations in Lake Panasoffkee are 15 to 19 minutes (398 commuters, 24.6%), 20 to 24 minutes (235 commuters, 14.5%), and 60 to 89 minutes (174 commuters, 10.7%).
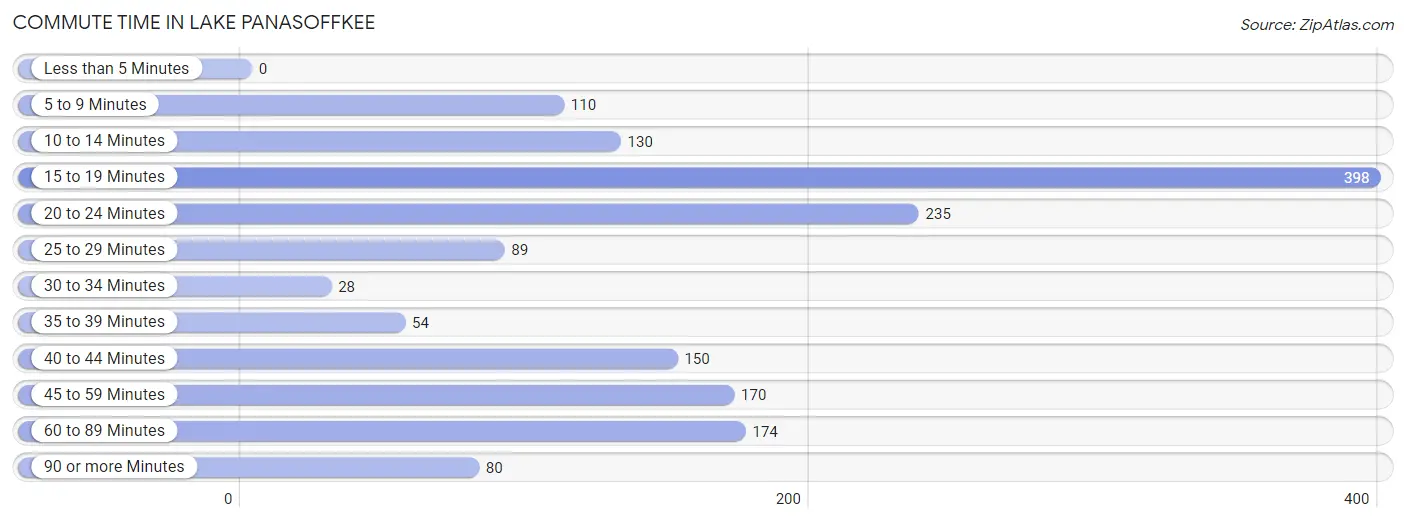
| Commute Time | # Commuters | % Commuters |
| Less than 5 Minutes | 0 | 0.0% |
| 5 to 9 Minutes | 110 | 6.8% |
| 10 to 14 Minutes | 130 | 8.0% |
| 15 to 19 Minutes | 398 | 24.6% |
| 20 to 24 Minutes | 235 | 14.5% |
| 25 to 29 Minutes | 89 | 5.5% |
| 30 to 34 Minutes | 28 | 1.7% |
| 35 to 39 Minutes | 54 | 3.3% |
| 40 to 44 Minutes | 150 | 9.3% |
| 45 to 59 Minutes | 170 | 10.5% |
| 60 to 89 Minutes | 174 | 10.7% |
| 90 or more Minutes | 80 | 4.9% |
Commute Time by Sex in Lake Panasoffkee
The most common commute times in Lake Panasoffkee are 15 to 19 minutes (224 commuters, 22.7%) for males and 15 to 19 minutes (174 commuters, 27.6%) for females.
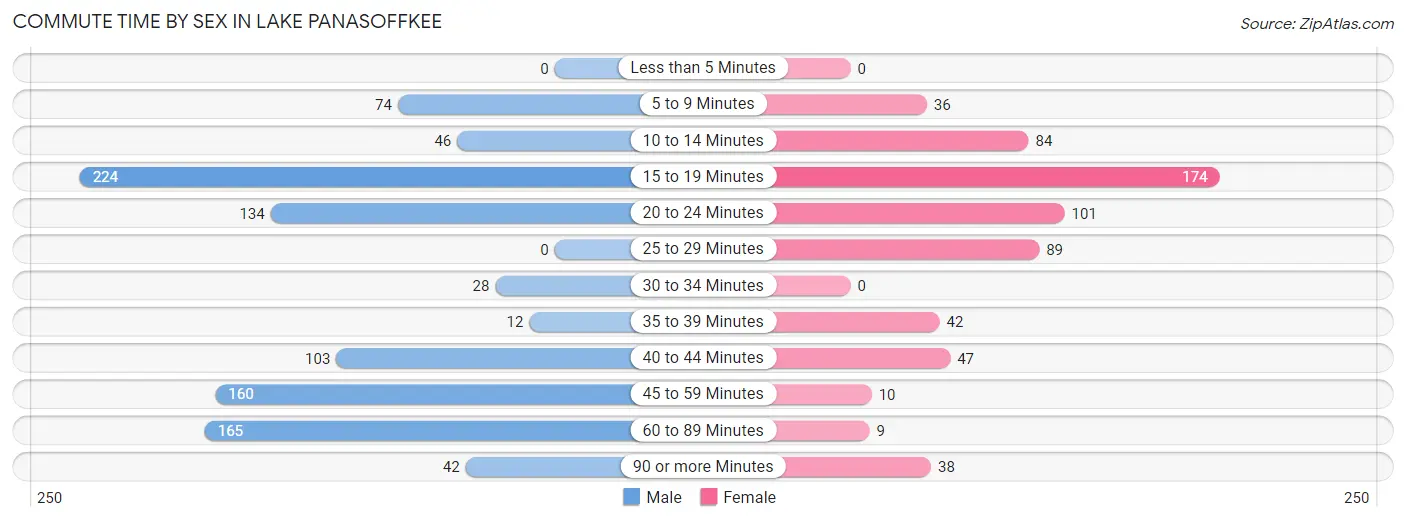
| Commute Time | Male | Female |
| Less than 5 Minutes | 0 (0.0%) | 0 (0.0%) |
| 5 to 9 Minutes | 74 (7.5%) | 36 (5.7%) |
| 10 to 14 Minutes | 46 (4.7%) | 84 (13.3%) |
| 15 to 19 Minutes | 224 (22.7%) | 174 (27.6%) |
| 20 to 24 Minutes | 134 (13.6%) | 101 (16.0%) |
| 25 to 29 Minutes | 0 (0.0%) | 89 (14.1%) |
| 30 to 34 Minutes | 28 (2.8%) | 0 (0.0%) |
| 35 to 39 Minutes | 12 (1.2%) | 42 (6.7%) |
| 40 to 44 Minutes | 103 (10.4%) | 47 (7.5%) |
| 45 to 59 Minutes | 160 (16.2%) | 10 (1.6%) |
| 60 to 89 Minutes | 165 (16.7%) | 9 (1.4%) |
| 90 or more Minutes | 42 (4.3%) | 38 (6.0%) |
Time of Departure to Work by Sex in Lake Panasoffkee
The most frequent times of departure to work in Lake Panasoffkee are 12:00 AM to 4:59 AM (212, 21.5%) for males and 4:00 PM to 11:59 PM (112, 17.8%) for females.
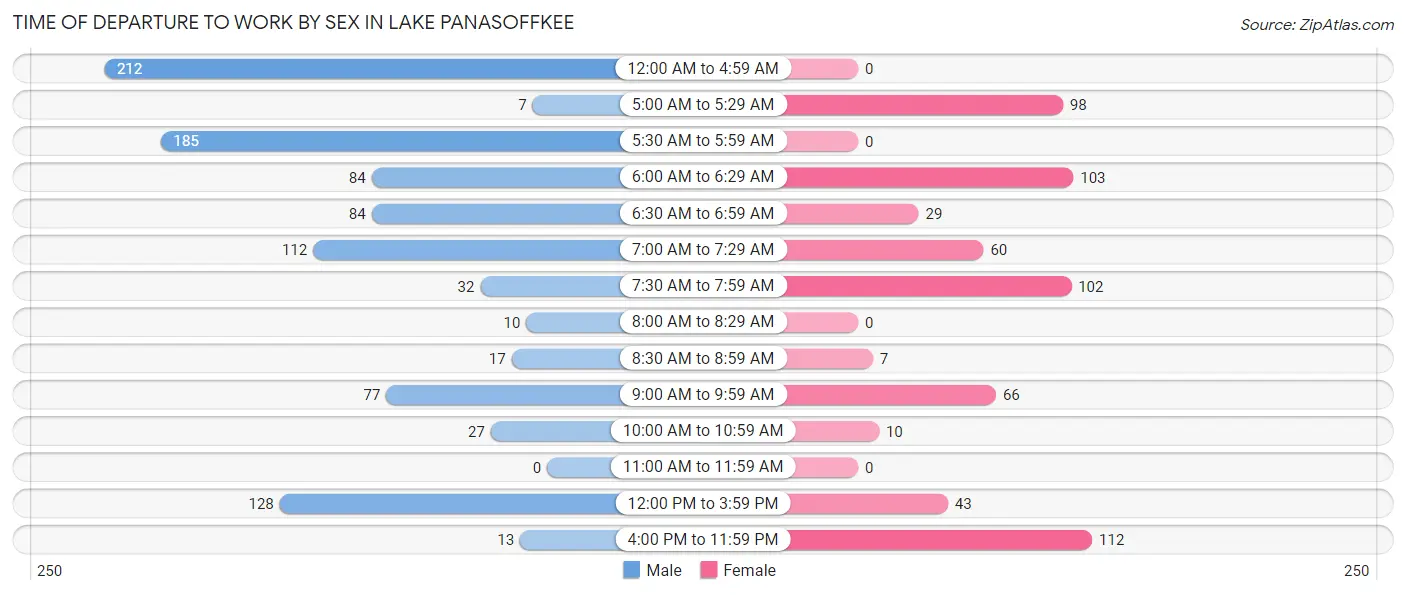
| Time of Departure | Male | Female |
| 12:00 AM to 4:59 AM | 212 (21.5%) | 0 (0.0%) |
| 5:00 AM to 5:29 AM | 7 (0.7%) | 98 (15.6%) |
| 5:30 AM to 5:59 AM | 185 (18.7%) | 0 (0.0%) |
| 6:00 AM to 6:29 AM | 84 (8.5%) | 103 (16.4%) |
| 6:30 AM to 6:59 AM | 84 (8.5%) | 29 (4.6%) |
| 7:00 AM to 7:29 AM | 112 (11.3%) | 60 (9.5%) |
| 7:30 AM to 7:59 AM | 32 (3.2%) | 102 (16.2%) |
| 8:00 AM to 8:29 AM | 10 (1.0%) | 0 (0.0%) |
| 8:30 AM to 8:59 AM | 17 (1.7%) | 7 (1.1%) |
| 9:00 AM to 9:59 AM | 77 (7.8%) | 66 (10.5%) |
| 10:00 AM to 10:59 AM | 27 (2.7%) | 10 (1.6%) |
| 11:00 AM to 11:59 AM | 0 (0.0%) | 0 (0.0%) |
| 12:00 PM to 3:59 PM | 128 (13.0%) | 43 (6.8%) |
| 4:00 PM to 11:59 PM | 13 (1.3%) | 112 (17.8%) |
| Total | 988 (100.0%) | 630 (100.0%) |
Housing Occupancy in Lake Panasoffkee
Occupancy by Ownership in Lake Panasoffkee
Of the total 1,921 dwellings in Lake Panasoffkee, owner-occupied units account for 1,409 (73.4%), while renter-occupied units make up 512 (26.7%).
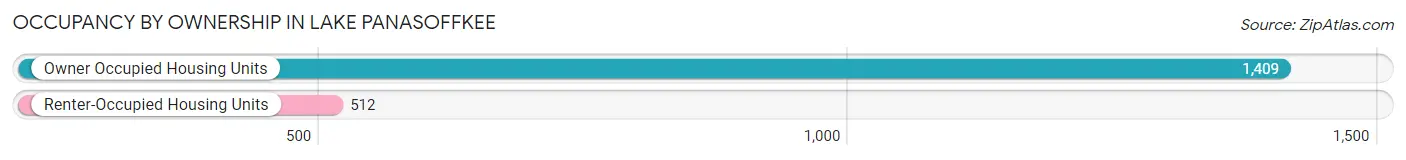
| Occupancy | # Housing Units | % Housing Units |
| Owner Occupied Housing Units | 1,409 | 73.4% |
| Renter-Occupied Housing Units | 512 | 26.7% |
| Total Occupied Housing Units | 1,921 | 100.0% |
Occupancy by Household Size in Lake Panasoffkee
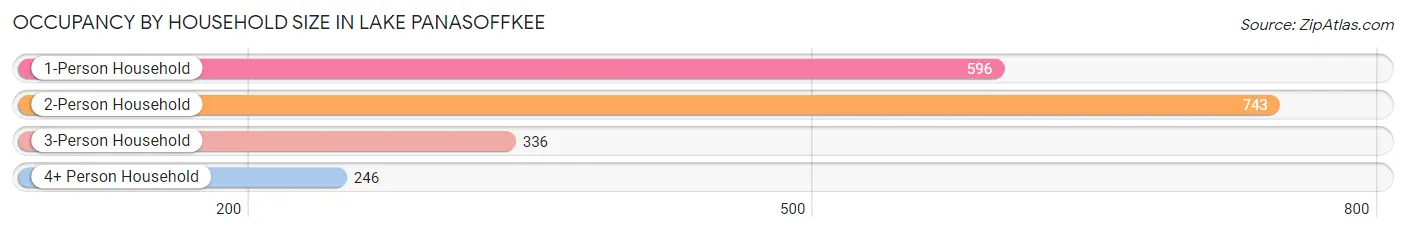
| Household Size | # Housing Units | % Housing Units |
| 1-Person Household | 596 | 31.0% |
| 2-Person Household | 743 | 38.7% |
| 3-Person Household | 336 | 17.5% |
| 4+ Person Household | 246 | 12.8% |
| Total Housing Units | 1,921 | 100.0% |
Occupancy by Ownership by Household Size in Lake Panasoffkee
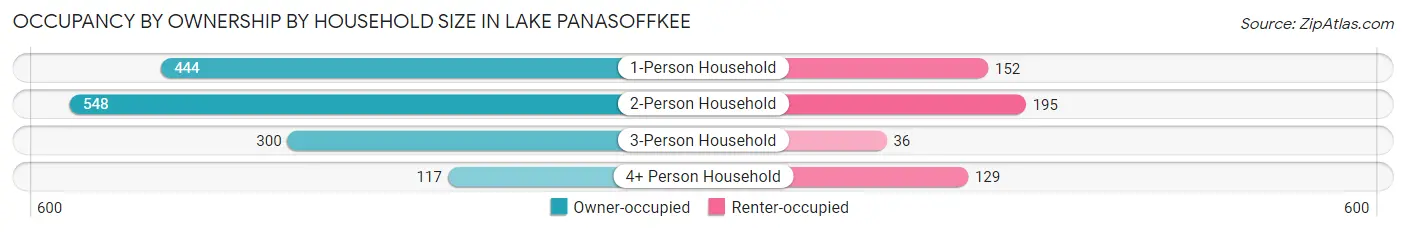
| Household Size | Owner-occupied | Renter-occupied |
| 1-Person Household | 444 (74.5%) | 152 (25.5%) |
| 2-Person Household | 548 (73.8%) | 195 (26.2%) |
| 3-Person Household | 300 (89.3%) | 36 (10.7%) |
| 4+ Person Household | 117 (47.6%) | 129 (52.4%) |
| Total Housing Units | 1,409 (73.4%) | 512 (26.7%) |
Occupancy by Educational Attainment in Lake Panasoffkee
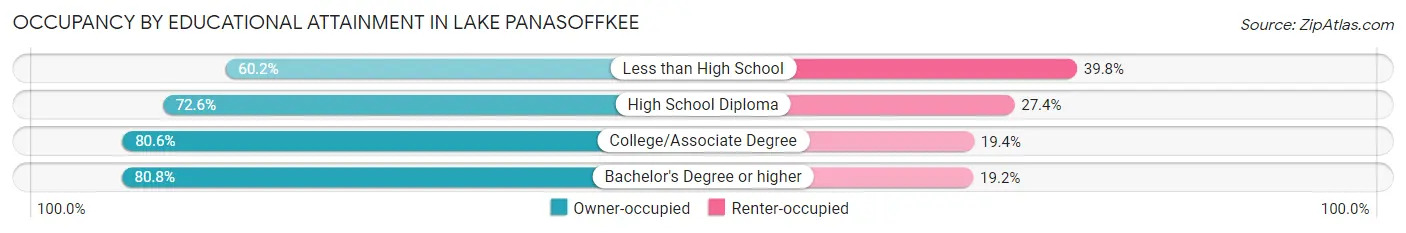
| Household Size | Owner-occupied | Renter-occupied |
| Less than High School | 233 (60.2%) | 154 (39.8%) |
| High School Diploma | 554 (72.6%) | 209 (27.4%) |
| College/Associate Degree | 454 (80.6%) | 109 (19.4%) |
| Bachelor's Degree or higher | 168 (80.8%) | 40 (19.2%) |
Occupancy by Age of Householder in Lake Panasoffkee
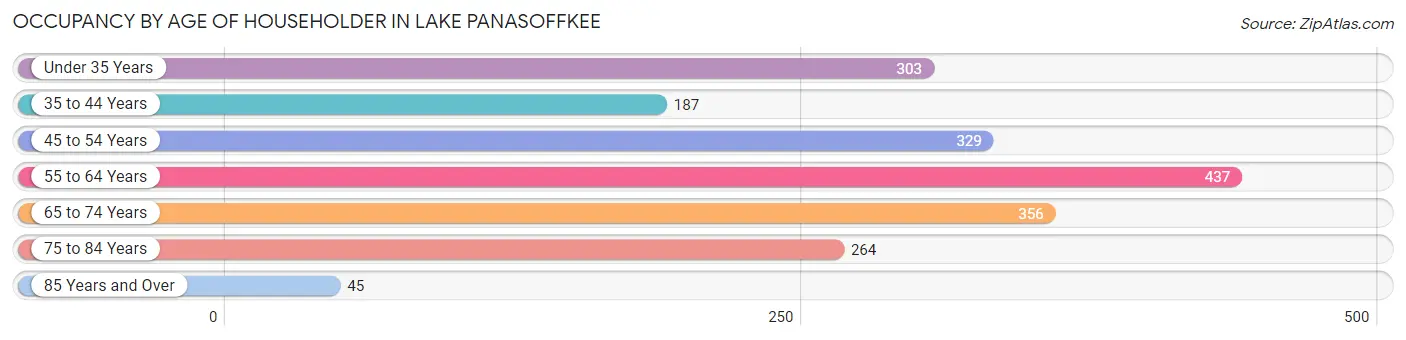
| Age Bracket | # Households | % Households |
| Under 35 Years | 303 | 15.8% |
| 35 to 44 Years | 187 | 9.7% |
| 45 to 54 Years | 329 | 17.1% |
| 55 to 64 Years | 437 | 22.8% |
| 65 to 74 Years | 356 | 18.5% |
| 75 to 84 Years | 264 | 13.7% |
| 85 Years and Over | 45 | 2.3% |
| Total | 1,921 | 100.0% |
Housing Finances in Lake Panasoffkee
Median Income by Occupancy in Lake Panasoffkee
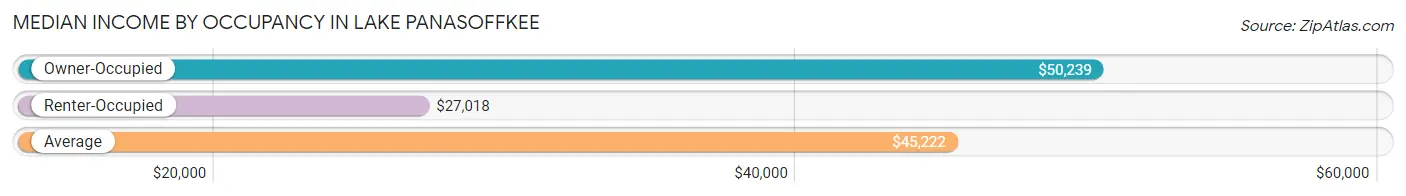
| Occupancy Type | # Households | Median Income |
| Owner-Occupied | 1,409 (73.4%) | $50,239 |
| Renter-Occupied | 512 (26.7%) | $27,018 |
| Average | 1,921 (100.0%) | $45,222 |
Occupancy by Householder Income Bracket in Lake Panasoffkee
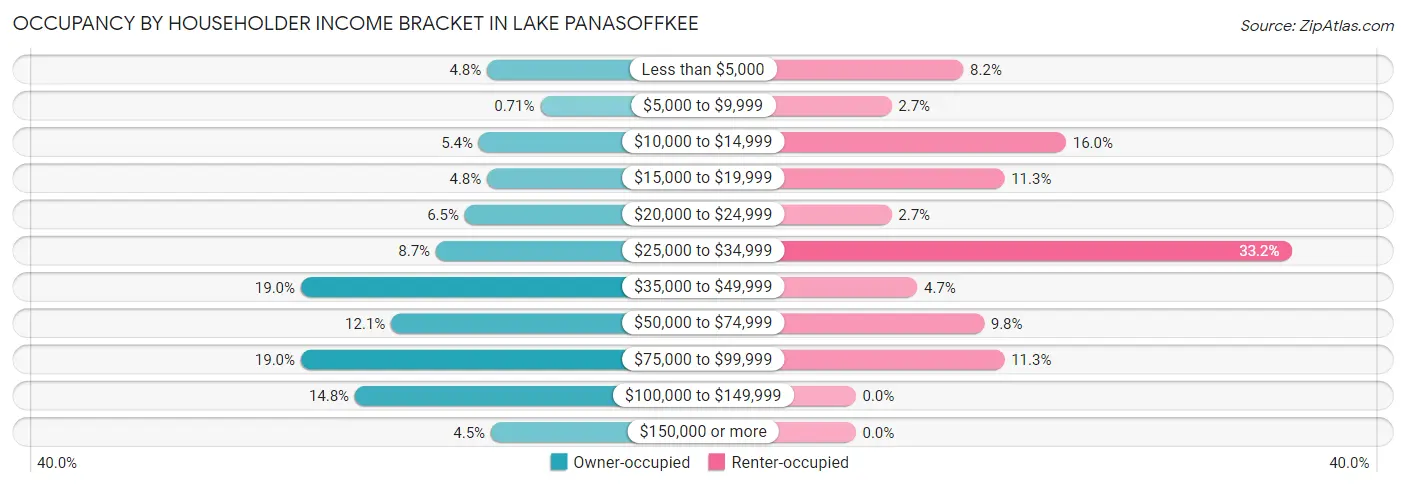
| Income Bracket | Owner-occupied | Renter-occupied |
| Less than $5,000 | 67 (4.8%) | 42 (8.2%) |
| $5,000 to $9,999 | 10 (0.7%) | 14 (2.7%) |
| $10,000 to $14,999 | 76 (5.4%) | 82 (16.0%) |
| $15,000 to $19,999 | 67 (4.8%) | 58 (11.3%) |
| $20,000 to $24,999 | 91 (6.5%) | 14 (2.7%) |
| $25,000 to $34,999 | 122 (8.7%) | 170 (33.2%) |
| $35,000 to $49,999 | 267 (19.0%) | 24 (4.7%) |
| $50,000 to $74,999 | 170 (12.1%) | 50 (9.8%) |
| $75,000 to $99,999 | 267 (19.0%) | 58 (11.3%) |
| $100,000 to $149,999 | 209 (14.8%) | 0 (0.0%) |
| $150,000 or more | 63 (4.5%) | 0 (0.0%) |
| Total | 1,409 (100.0%) | 512 (100.0%) |
Monthly Housing Cost Tiers in Lake Panasoffkee
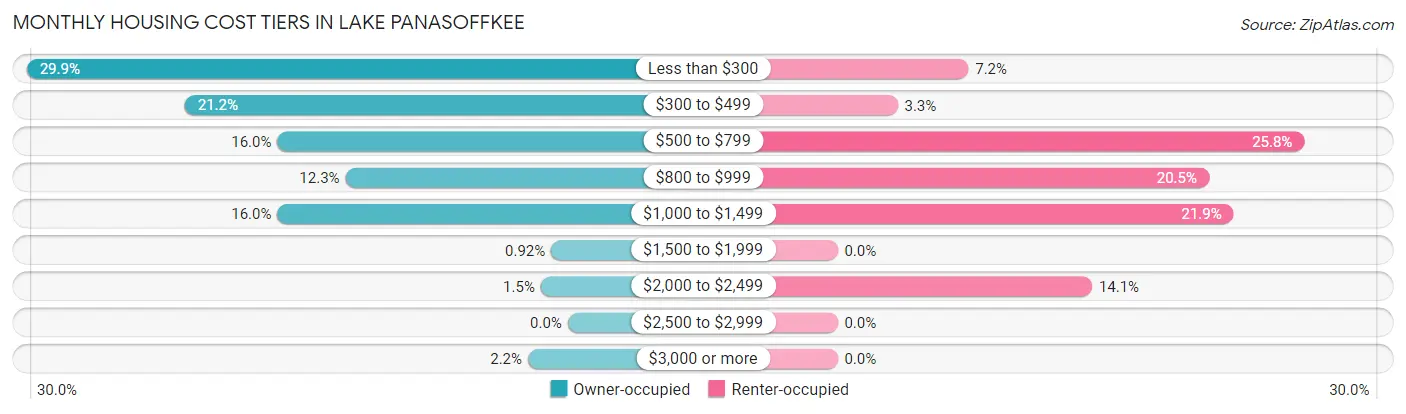
| Monthly Cost | Owner-occupied | Renter-occupied |
| Less than $300 | 421 (29.9%) | 37 (7.2%) |
| $300 to $499 | 298 (21.1%) | 17 (3.3%) |
| $500 to $799 | 226 (16.0%) | 132 (25.8%) |
| $800 to $999 | 173 (12.3%) | 105 (20.5%) |
| $1,000 to $1,499 | 226 (16.0%) | 112 (21.9%) |
| $1,500 to $1,999 | 13 (0.9%) | 0 (0.0%) |
| $2,000 to $2,499 | 21 (1.5%) | 72 (14.1%) |
| $2,500 to $2,999 | 0 (0.0%) | 0 (0.0%) |
| $3,000 or more | 31 (2.2%) | 0 (0.0%) |
| Total | 1,409 (100.0%) | 512 (100.0%) |
Physical Housing Characteristics in Lake Panasoffkee
Housing Structures in Lake Panasoffkee
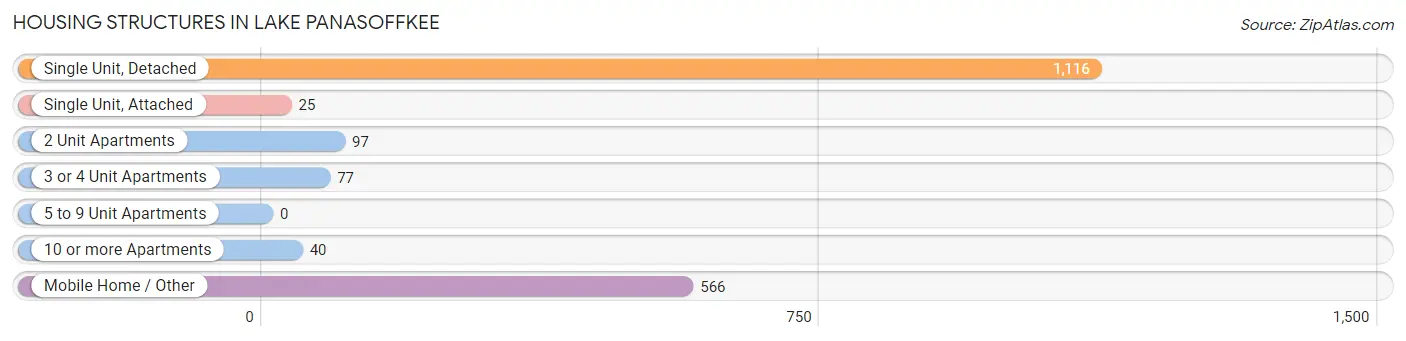
| Structure Type | # Housing Units | % Housing Units |
| Single Unit, Detached | 1,116 | 58.1% |
| Single Unit, Attached | 25 | 1.3% |
| 2 Unit Apartments | 97 | 5.1% |
| 3 or 4 Unit Apartments | 77 | 4.0% |
| 5 to 9 Unit Apartments | 0 | 0.0% |
| 10 or more Apartments | 40 | 2.1% |
| Mobile Home / Other | 566 | 29.5% |
| Total | 1,921 | 100.0% |
Housing Structures by Occupancy in Lake Panasoffkee
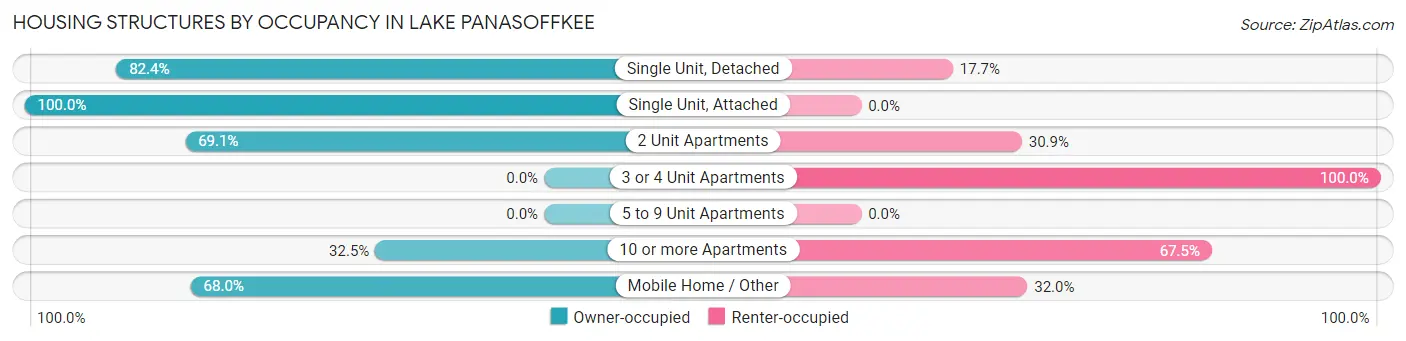
| Structure Type | Owner-occupied | Renter-occupied |
| Single Unit, Detached | 919 (82.4%) | 197 (17.6%) |
| Single Unit, Attached | 25 (100.0%) | 0 (0.0%) |
| 2 Unit Apartments | 67 (69.1%) | 30 (30.9%) |
| 3 or 4 Unit Apartments | 0 (0.0%) | 77 (100.0%) |
| 5 to 9 Unit Apartments | 0 (0.0%) | 0 (0.0%) |
| 10 or more Apartments | 13 (32.5%) | 27 (67.5%) |
| Mobile Home / Other | 385 (68.0%) | 181 (32.0%) |
| Total | 1,409 (73.4%) | 512 (26.7%) |
Housing Structures by Number of Rooms in Lake Panasoffkee
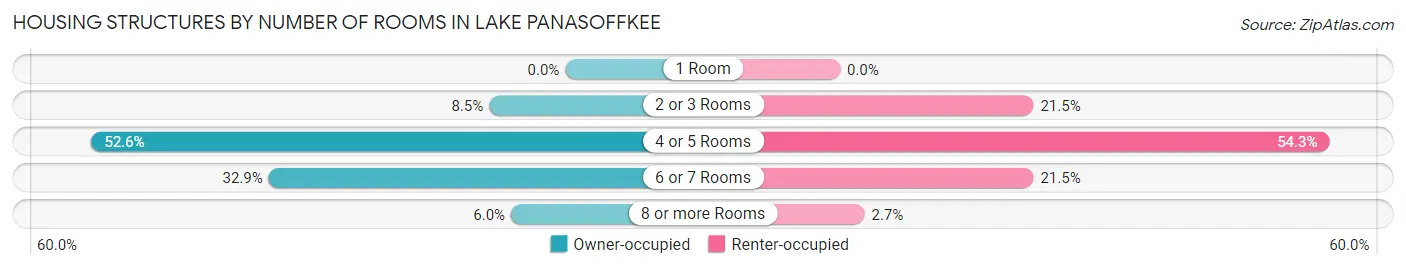
| Number of Rooms | Owner-occupied | Renter-occupied |
| 1 Room | 0 (0.0%) | 0 (0.0%) |
| 2 or 3 Rooms | 119 (8.5%) | 110 (21.5%) |
| 4 or 5 Rooms | 741 (52.6%) | 278 (54.3%) |
| 6 or 7 Rooms | 464 (32.9%) | 110 (21.5%) |
| 8 or more Rooms | 85 (6.0%) | 14 (2.7%) |
| Total | 1,409 (100.0%) | 512 (100.0%) |
Housing Structure by Heating Type in Lake Panasoffkee
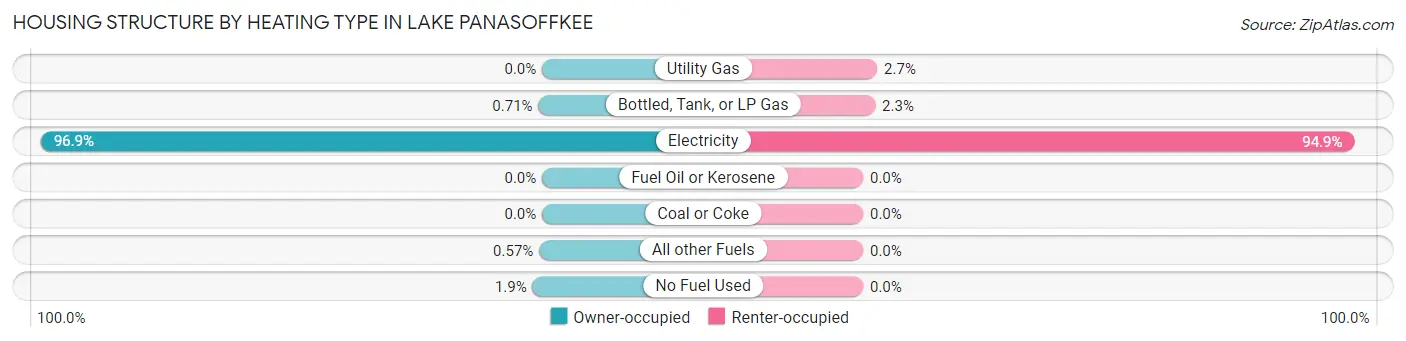
| Heating Type | Owner-occupied | Renter-occupied |
| Utility Gas | 0 (0.0%) | 14 (2.7%) |
| Bottled, Tank, or LP Gas | 10 (0.7%) | 12 (2.3%) |
| Electricity | 1,365 (96.9%) | 486 (94.9%) |
| Fuel Oil or Kerosene | 0 (0.0%) | 0 (0.0%) |
| Coal or Coke | 0 (0.0%) | 0 (0.0%) |
| All other Fuels | 8 (0.6%) | 0 (0.0%) |
| No Fuel Used | 26 (1.8%) | 0 (0.0%) |
| Total | 1,409 (100.0%) | 512 (100.0%) |
Household Vehicle Usage in Lake Panasoffkee
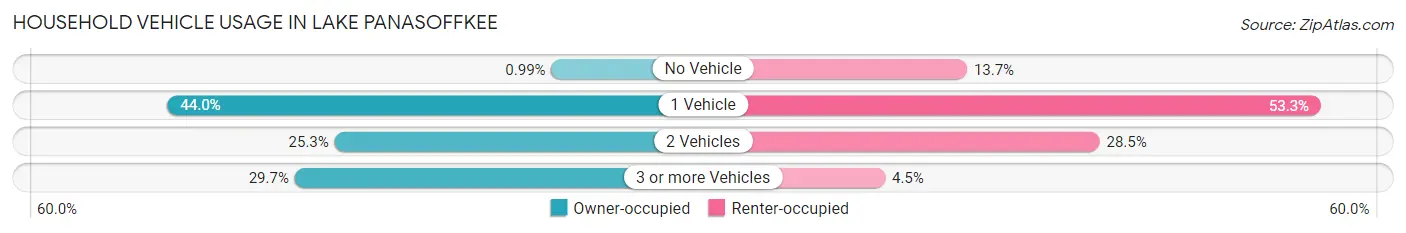
| Vehicles per Household | Owner-occupied | Renter-occupied |
| No Vehicle | 14 (1.0%) | 70 (13.7%) |
| 1 Vehicle | 620 (44.0%) | 273 (53.3%) |
| 2 Vehicles | 356 (25.3%) | 146 (28.5%) |
| 3 or more Vehicles | 419 (29.7%) | 23 (4.5%) |
| Total | 1,409 (100.0%) | 512 (100.0%) |
Real Estate & Mortgages in Lake Panasoffkee
Real Estate and Mortgage Overview in Lake Panasoffkee
| Characteristic | Without Mortgage | With Mortgage |
| Housing Units | 833 | 576 |
| Median Property Value | $96,400 | $159,600 |
| Median Household Income | $46,660 | $49 |
| Monthly Housing Costs | $298 | $31 |
| Real Estate Taxes | $555 | $32 |
Property Value by Mortgage Status in Lake Panasoffkee
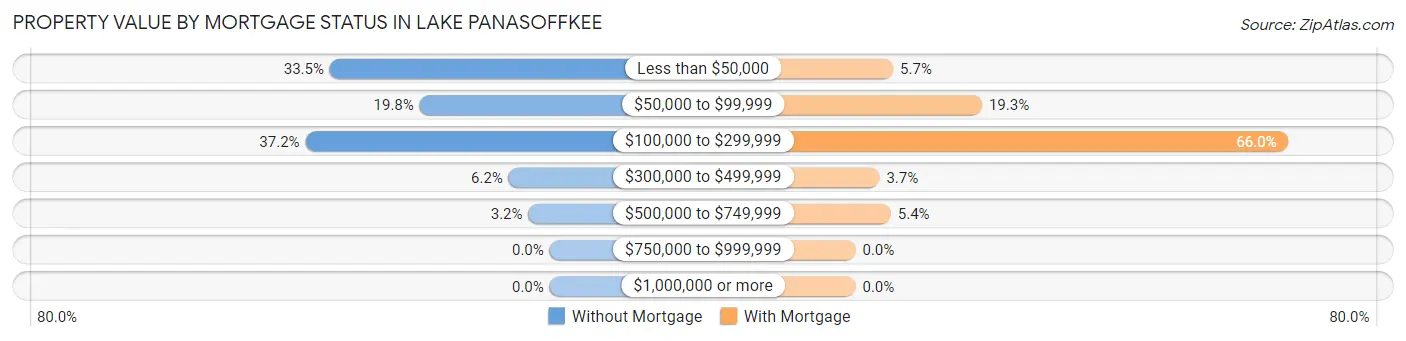
| Property Value | Without Mortgage | With Mortgage |
| Less than $50,000 | 279 (33.5%) | 33 (5.7%) |
| $50,000 to $99,999 | 165 (19.8%) | 111 (19.3%) |
| $100,000 to $299,999 | 310 (37.2%) | 380 (66.0%) |
| $300,000 to $499,999 | 52 (6.2%) | 21 (3.6%) |
| $500,000 to $749,999 | 27 (3.2%) | 31 (5.4%) |
| $750,000 to $999,999 | 0 (0.0%) | 0 (0.0%) |
| $1,000,000 or more | 0 (0.0%) | 0 (0.0%) |
| Total | 833 (100.0%) | 576 (100.0%) |
Household Income by Mortgage Status in Lake Panasoffkee
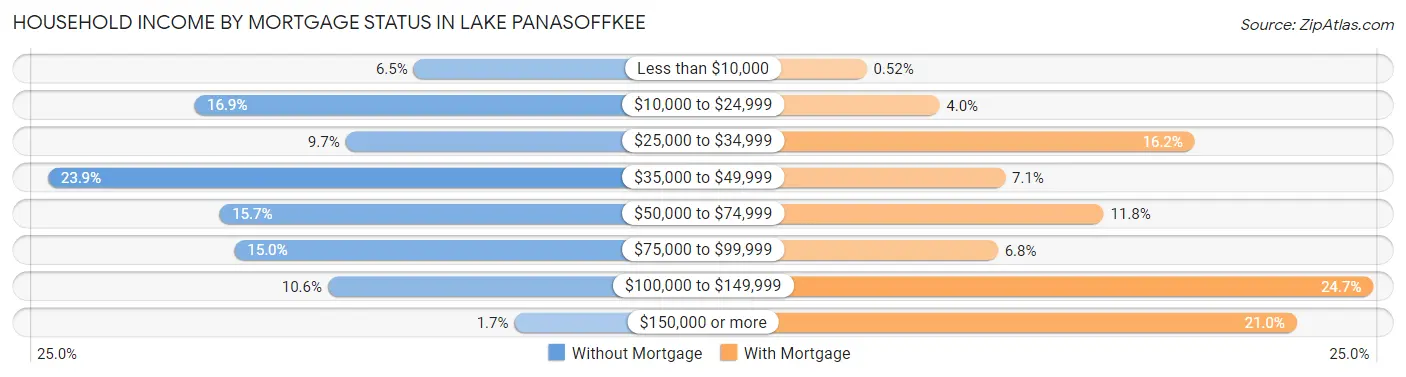
| Household Income | Without Mortgage | With Mortgage |
| Less than $10,000 | 54 (6.5%) | 3 (0.5%) |
| $10,000 to $24,999 | 141 (16.9%) | 23 (4.0%) |
| $25,000 to $34,999 | 81 (9.7%) | 93 (16.2%) |
| $35,000 to $49,999 | 199 (23.9%) | 41 (7.1%) |
| $50,000 to $74,999 | 131 (15.7%) | 68 (11.8%) |
| $75,000 to $99,999 | 125 (15.0%) | 39 (6.8%) |
| $100,000 to $149,999 | 88 (10.6%) | 142 (24.6%) |
| $150,000 or more | 14 (1.7%) | 121 (21.0%) |
| Total | 833 (100.0%) | 576 (100.0%) |
Property Value to Household Income Ratio in Lake Panasoffkee
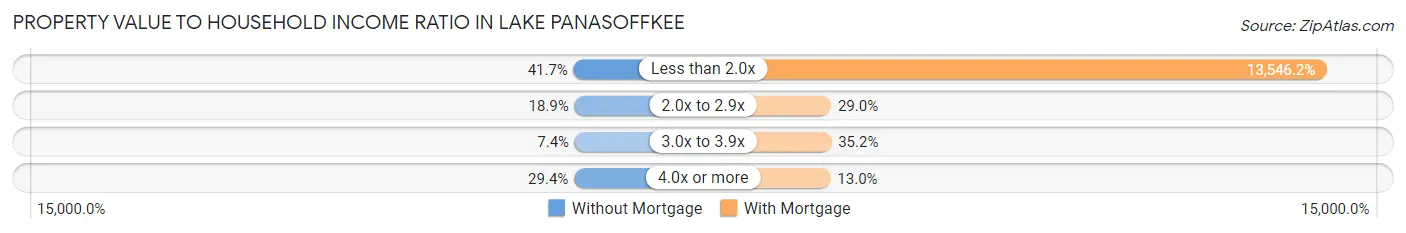
| Value-to-Income Ratio | Without Mortgage | With Mortgage |
| Less than 2.0x | 347 (41.7%) | 78,026 (13,546.2%) |
| 2.0x to 2.9x | 157 (18.9%) | 167 (29.0%) |
| 3.0x to 3.9x | 62 (7.4%) | 203 (35.2%) |
| 4.0x or more | 245 (29.4%) | 75 (13.0%) |
| Total | 833 (100.0%) | 576 (100.0%) |
Real Estate Taxes by Mortgage Status in Lake Panasoffkee
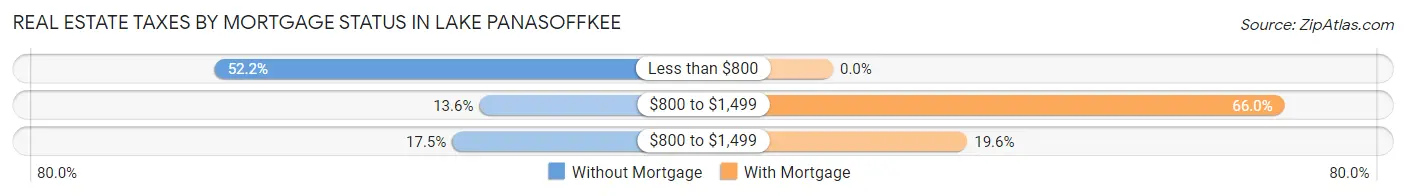
| Property Taxes | Without Mortgage | With Mortgage |
| Less than $800 | 435 (52.2%) | 0 (0.0%) |
| $800 to $1,499 | 113 (13.6%) | 380 (66.0%) |
| $800 to $1,499 | 146 (17.5%) | 113 (19.6%) |
| Total | 833 (100.0%) | 576 (100.0%) |
Health & Disability in Lake Panasoffkee
Health Insurance Coverage by Age in Lake Panasoffkee
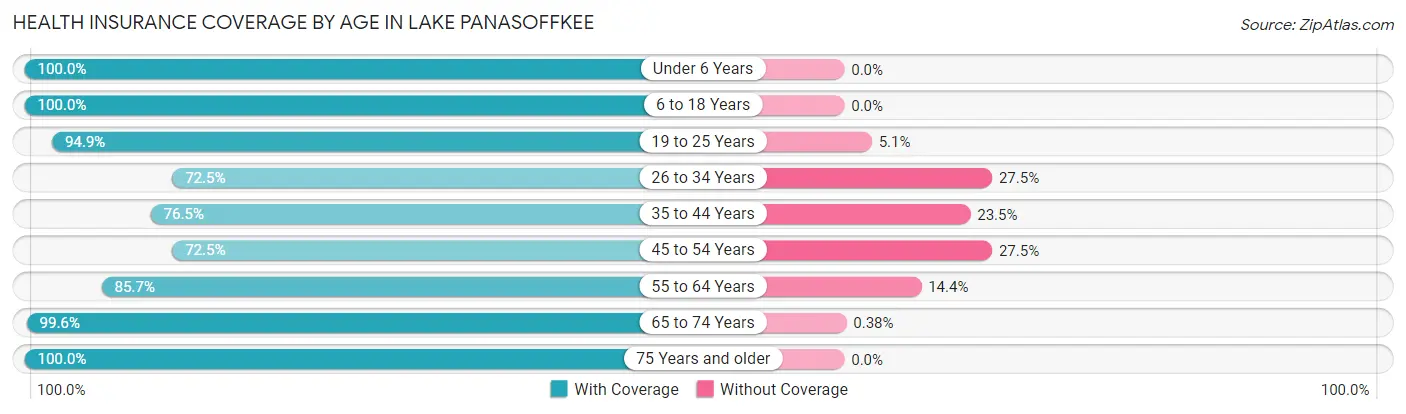
| Age Bracket | With Coverage | Without Coverage |
| Under 6 Years | 242 (100.0%) | 0 (0.0%) |
| 6 to 18 Years | 584 (100.0%) | 0 (0.0%) |
| 19 to 25 Years | 130 (94.9%) | 7 (5.1%) |
| 26 to 34 Years | 392 (72.5%) | 149 (27.5%) |
| 35 to 44 Years | 332 (76.5%) | 102 (23.5%) |
| 45 to 54 Years | 484 (72.5%) | 184 (27.5%) |
| 55 to 64 Years | 573 (85.7%) | 96 (14.3%) |
| 65 to 74 Years | 527 (99.6%) | 2 (0.4%) |
| 75 Years and older | 369 (100.0%) | 0 (0.0%) |
| Total | 3,633 (87.1%) | 540 (12.9%) |
Health Insurance Coverage by Citizenship Status in Lake Panasoffkee
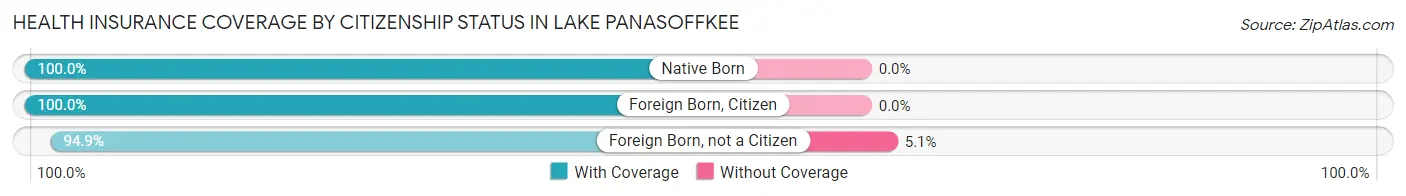
| Citizenship Status | With Coverage | Without Coverage |
| Native Born | 242 (100.0%) | 0 (0.0%) |
| Foreign Born, Citizen | 584 (100.0%) | 0 (0.0%) |
| Foreign Born, not a Citizen | 130 (94.9%) | 7 (5.1%) |
Health Insurance Coverage by Household Income in Lake Panasoffkee
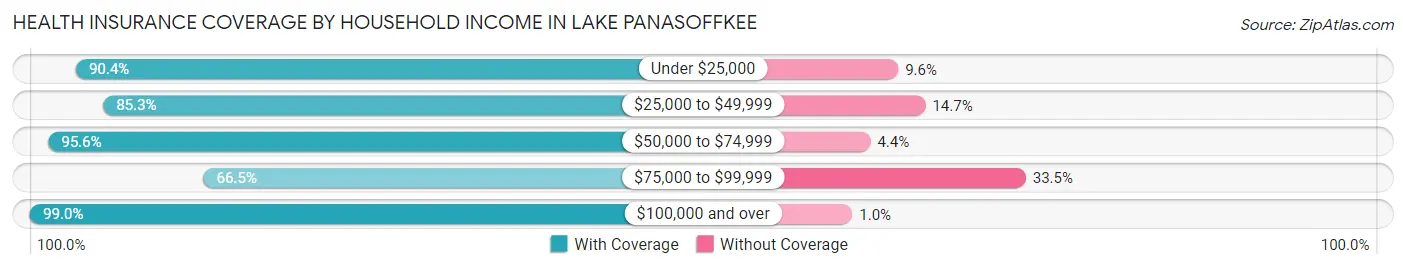
| Household Income | With Coverage | Without Coverage |
| Under $25,000 | 704 (90.4%) | 75 (9.6%) |
| $25,000 to $49,999 | 1,145 (85.3%) | 198 (14.7%) |
| $50,000 to $74,999 | 559 (95.6%) | 26 (4.4%) |
| $75,000 to $99,999 | 462 (66.5%) | 233 (33.5%) |
| $100,000 and over | 763 (99.0%) | 8 (1.0%) |
Public vs Private Health Insurance Coverage by Age in Lake Panasoffkee
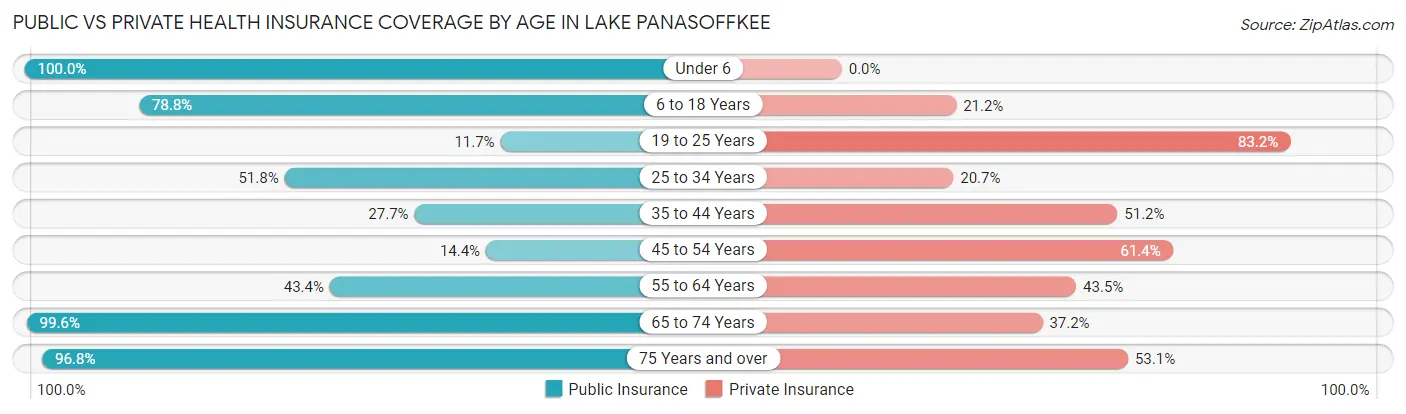
| Age Bracket | Public Insurance | Private Insurance |
| Under 6 | 242 (100.0%) | 0 (0.0%) |
| 6 to 18 Years | 460 (78.8%) | 124 (21.2%) |
| 19 to 25 Years | 16 (11.7%) | 114 (83.2%) |
| 25 to 34 Years | 280 (51.8%) | 112 (20.7%) |
| 35 to 44 Years | 120 (27.7%) | 222 (51.1%) |
| 45 to 54 Years | 96 (14.4%) | 410 (61.4%) |
| 55 to 64 Years | 290 (43.3%) | 291 (43.5%) |
| 65 to 74 Years | 527 (99.6%) | 197 (37.2%) |
| 75 Years and over | 357 (96.8%) | 196 (53.1%) |
| Total | 2,388 (57.2%) | 1,666 (39.9%) |
Disability Status by Sex by Age in Lake Panasoffkee
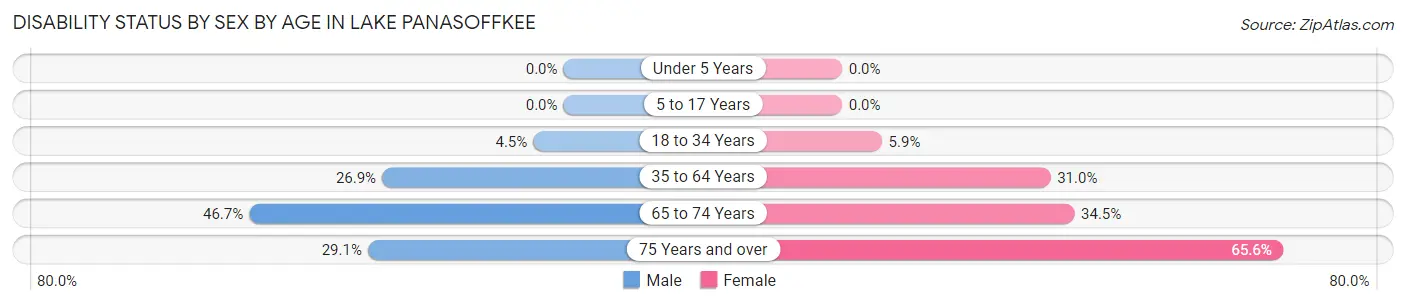
| Age Bracket | Male | Female |
| Under 5 Years | 0 (0.0%) | 0 (0.0%) |
| 5 to 17 Years | 0 (0.0%) | 0 (0.0%) |
| 18 to 34 Years | 17 (4.5%) | 18 (5.9%) |
| 35 to 64 Years | 236 (26.9%) | 277 (30.9%) |
| 65 to 74 Years | 140 (46.7%) | 79 (34.5%) |
| 75 Years and over | 43 (29.0%) | 145 (65.6%) |
Disability Class by Sex by Age in Lake Panasoffkee
Disability Class: Hearing Difficulty
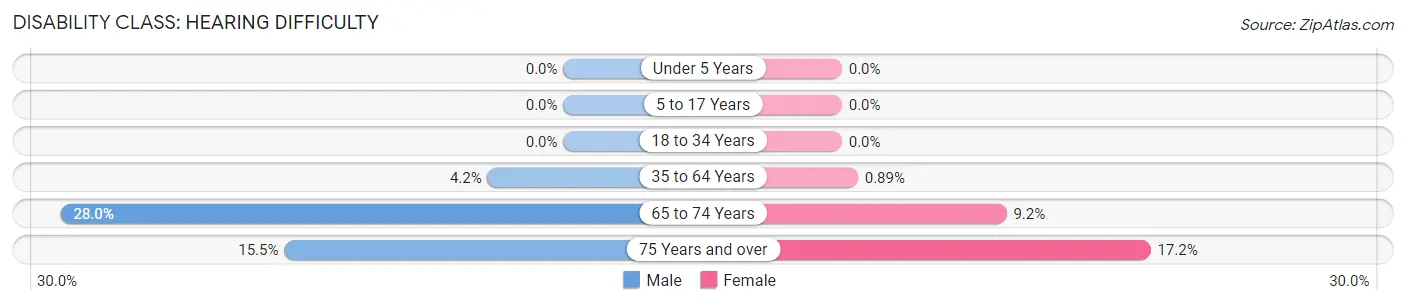
| Age Bracket | Male | Female |
| Under 5 Years | 0 (0.0%) | 0 (0.0%) |
| 5 to 17 Years | 0 (0.0%) | 0 (0.0%) |
| 18 to 34 Years | 0 (0.0%) | 0 (0.0%) |
| 35 to 64 Years | 37 (4.2%) | 8 (0.9%) |
| 65 to 74 Years | 84 (28.0%) | 21 (9.2%) |
| 75 Years and over | 23 (15.5%) | 38 (17.2%) |
Disability Class: Vision Difficulty
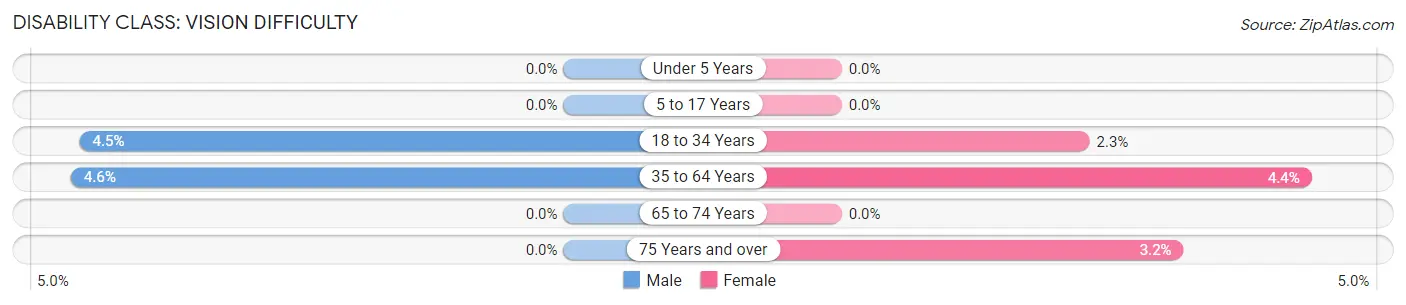
| Age Bracket | Male | Female |
| Under 5 Years | 0 (0.0%) | 0 (0.0%) |
| 5 to 17 Years | 0 (0.0%) | 0 (0.0%) |
| 18 to 34 Years | 17 (4.5%) | 7 (2.3%) |
| 35 to 64 Years | 40 (4.6%) | 39 (4.4%) |
| 65 to 74 Years | 0 (0.0%) | 0 (0.0%) |
| 75 Years and over | 0 (0.0%) | 7 (3.2%) |
Disability Class: Cognitive Difficulty
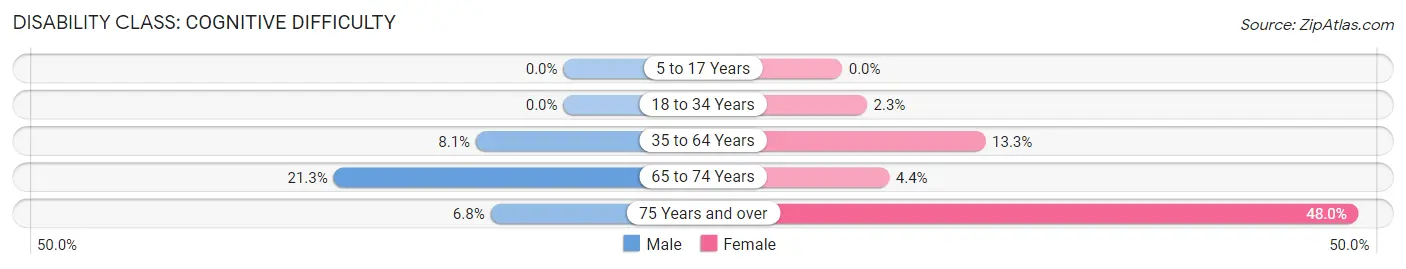
| Age Bracket | Male | Female |
| 5 to 17 Years | 0 (0.0%) | 0 (0.0%) |
| 18 to 34 Years | 0 (0.0%) | 7 (2.3%) |
| 35 to 64 Years | 71 (8.1%) | 119 (13.3%) |
| 65 to 74 Years | 64 (21.3%) | 10 (4.4%) |
| 75 Years and over | 10 (6.8%) | 106 (48.0%) |
Disability Class: Ambulatory Difficulty
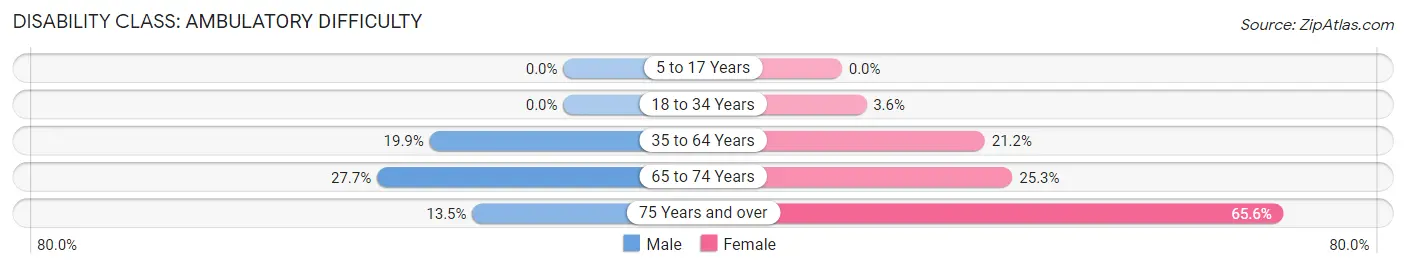
| Age Bracket | Male | Female |
| 5 to 17 Years | 0 (0.0%) | 0 (0.0%) |
| 18 to 34 Years | 0 (0.0%) | 11 (3.6%) |
| 35 to 64 Years | 174 (19.9%) | 190 (21.2%) |
| 65 to 74 Years | 83 (27.7%) | 58 (25.3%) |
| 75 Years and over | 20 (13.5%) | 145 (65.6%) |
Disability Class: Self-Care Difficulty
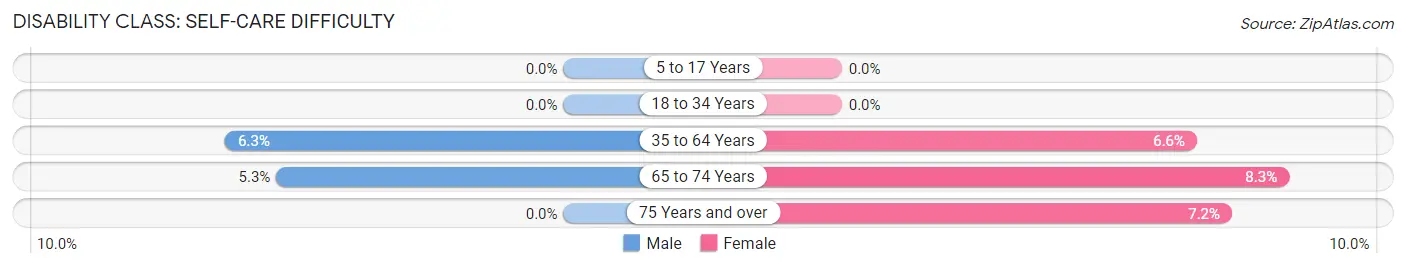
| Age Bracket | Male | Female |
| 5 to 17 Years | 0 (0.0%) | 0 (0.0%) |
| 18 to 34 Years | 0 (0.0%) | 0 (0.0%) |
| 35 to 64 Years | 55 (6.3%) | 59 (6.6%) |
| 65 to 74 Years | 16 (5.3%) | 19 (8.3%) |
| 75 Years and over | 0 (0.0%) | 16 (7.2%) |
Technology Access in Lake Panasoffkee
Computing Device Access in Lake Panasoffkee
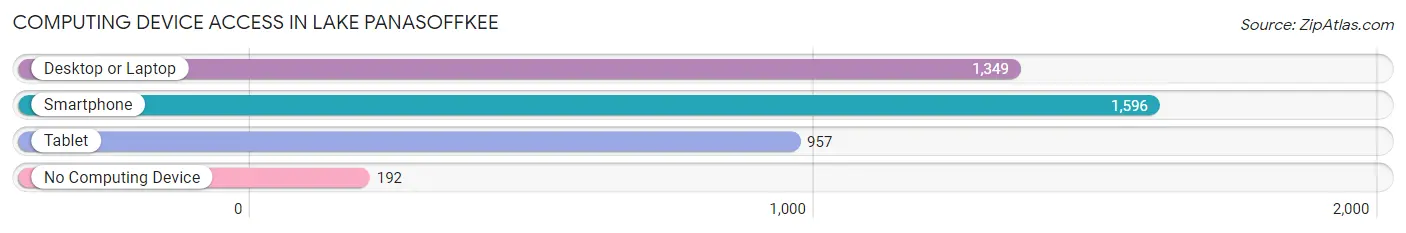
| Device Type | # Households | % Households |
| Desktop or Laptop | 1,349 | 70.2% |
| Smartphone | 1,596 | 83.1% |
| Tablet | 957 | 49.8% |
| No Computing Device | 192 | 10.0% |
| Total | 1,921 | 100.0% |
Internet Access in Lake Panasoffkee
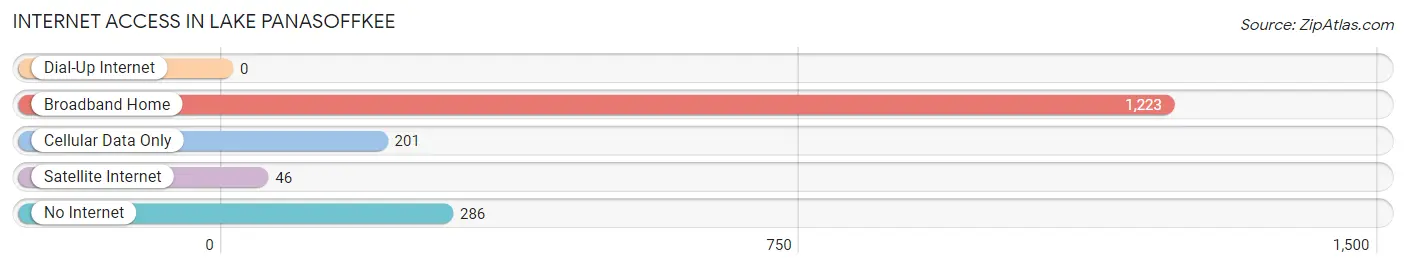
| Internet Type | # Households | % Households |
| Dial-Up Internet | 0 | 0.0% |
| Broadband Home | 1,223 | 63.7% |
| Cellular Data Only | 201 | 10.5% |
| Satellite Internet | 46 | 2.4% |
| No Internet | 286 | 14.9% |
| Total | 1,921 | 100.0% |
Lake Panasoffkee Summary
History
Lake Panasoffkee is a small unincorporated community located in Sumter County, Florida. It is situated on the western shore of Lake Panasoffkee, a large freshwater lake in the central part of the state. The area was first settled in the early 1800s by the Seminole Indians, who used the lake for fishing and hunting. The first white settlers arrived in the area in the late 1800s, and the town was officially established in 1887.
The town was named after the lake, which was named after a Seminole chief named Panasoffkee. The town grew slowly over the years, and by the early 1900s it had become a popular tourist destination. The town was home to several hotels, restaurants, and other businesses catering to tourists.
In the 1950s, the town began to decline as tourists began to flock to other parts of Florida. The town was further impacted by the construction of the Cross Florida Barge Canal, which diverted water away from the lake. By the 1970s, the town had become a virtual ghost town.
In the 1980s, the town began to experience a resurgence as people began to move back to the area. The town was revitalized with the construction of a new marina and the opening of a state park on the lake. Today, Lake Panasoffkee is a popular destination for fishing, boating, and other outdoor activities.
Geography
Lake Panasoffkee is located in Sumter County, Florida, on the western shore of Lake Panasoffkee. The town is situated at an elevation of approximately 30 feet above sea level. The lake is approximately 8,000 acres in size and is the largest lake in Sumter County. The lake is fed by several small creeks and rivers, including the Withlacoochee River.
The town is located in a humid subtropical climate zone, with hot, humid summers and mild winters. The average annual temperature is around 73 degrees Fahrenheit, with average highs in the summer reaching around 90 degrees and average lows in the winter reaching around 50 degrees. The area receives an average of 54 inches of rain per year.
Economy
The economy of Lake Panasoffkee is largely based on tourism and recreation. The town is home to several marinas, restaurants, and other businesses catering to tourists and visitors. The town is also home to several fishing guides and charter services, as well as a number of campgrounds and RV parks.
The town is also home to several manufacturing and industrial businesses, including a paper mill and a lumber mill. The town is also home to a number of agricultural businesses, including citrus groves and cattle ranches.
Demographics
As of the 2010 census, the population of Lake Panasoffkee was 1,719. The racial makeup of the town was 94.3% White, 2.2% African American, 0.7% Native American, 0.3% Asian, 0.1% Pacific Islander, and 2.4% from other races. Hispanic or Latino of any race were 4.2% of the population.
The median household income in the town was $30,938, and the median family income was $37,813. The per capita income for the town was $17,845. About 17.3% of the population was below the poverty line.
Common Questions
What is Per Capita Income in Lake Panasoffkee?
Per Capita income in Lake Panasoffkee is $27,390.
What is the Median Family Income in Lake Panasoffkee?
Median Family Income in Lake Panasoffkee is $51,458.
What is the Median Household income in Lake Panasoffkee?
Median Household Income in Lake Panasoffkee is $45,222.
What is Income or Wage Gap in Lake Panasoffkee?
Income or Wage Gap in Lake Panasoffkee is 44.2%.
Women in Lake Panasoffkee earn 55.8 cents for every dollar earned by a man.
What is Inequality or Gini Index in Lake Panasoffkee?
Inequality or Gini Index in Lake Panasoffkee is 0.45.
What is the Total Population of Lake Panasoffkee?
Total Population of Lake Panasoffkee is 4,173.
What is the Total Male Population of Lake Panasoffkee?
Total Male Population of Lake Panasoffkee is 1,962.
What is the Total Female Population of Lake Panasoffkee?
Total Female Population of Lake Panasoffkee is 2,211.
What is the Ratio of Males per 100 Females in Lake Panasoffkee?
There are 88.74 Males per 100 Females in Lake Panasoffkee.
What is the Ratio of Females per 100 Males in Lake Panasoffkee?
There are 112.69 Females per 100 Males in Lake Panasoffkee.
What is the Median Population Age in Lake Panasoffkee?
Median Population Age in Lake Panasoffkee is 49.4 Years.
What is the Average Family Size in Lake Panasoffkee
Average Family Size in Lake Panasoffkee is 2.7 People.
What is the Average Household Size in Lake Panasoffkee
Average Household Size in Lake Panasoffkee is 2.2 People.
How Large is the Labor Force in Lake Panasoffkee?
There are 1,825 People in the Labor Forcein in Lake Panasoffkee.
What is the Percentage of People in the Labor Force in Lake Panasoffkee?
52.3% of People are in the Labor Force in Lake Panasoffkee.
What is the Unemployment Rate in Lake Panasoffkee?
Unemployment Rate in Lake Panasoffkee is 4.2%.