Zip Codes with the Highest Percentage of Population Employed in Arts, Entertainment & Recreation in South Dakota
RELATED REPORTS & OPTIONS
Arts, Entertainment & Recreation
South Dakota
Compare Zip Codes
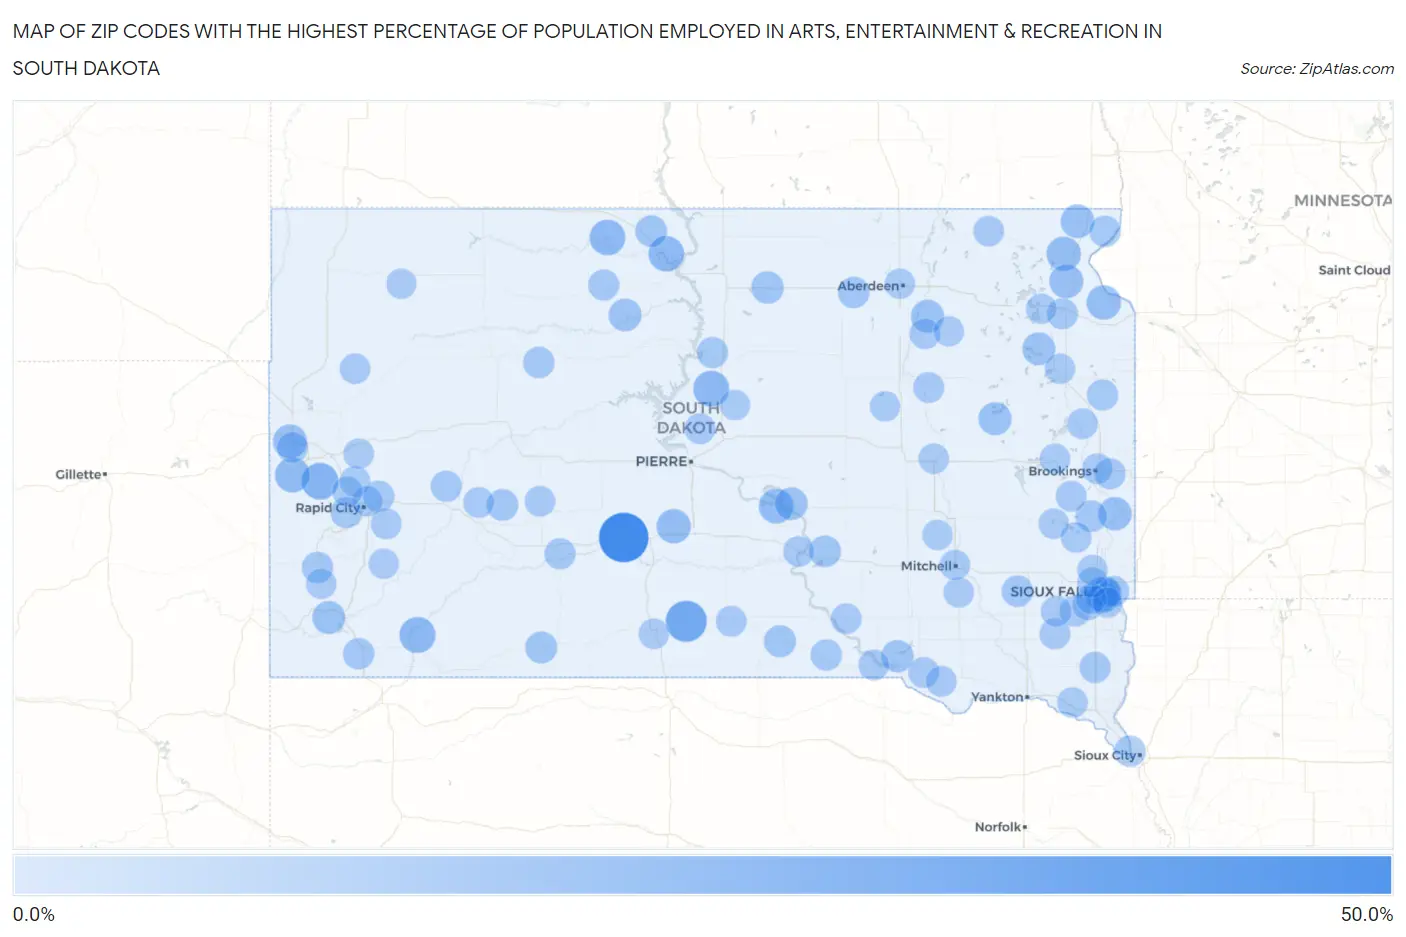
Map of Zip Codes with the Highest Percentage of Population Employed in Arts, Entertainment & Recreation in South Dakota
0.0%
50.0%
Zip Codes with the Highest Percentage of Population Employed in Arts, Entertainment & Recreation in South Dakota
| Zip Code | % Employed | vs State | vs National | |
| 1. | 57562 | 47.7% | 1.9%(+45.8)#1 | 2.1%(+45.6)#38 |
| 2. | 57563 | 26.7% | 1.9%(+24.8)#2 | 2.1%(+24.6)#105 |
| 3. | 57732 | 16.8% | 1.9%(+15.0)#3 | 2.1%(+14.8)#260 |
| 4. | 57520 | 14.7% | 1.9%(+12.8)#4 | 2.1%(+12.6)#352 |
| 5. | 57764 | 14.7% | 1.9%(+12.8)#5 | 2.1%(+12.6)#354 |
| 6. | 57197 | 14.4% | 1.9%(+12.5)#6 | 2.1%(+12.3)#369 |
| 7. | 57621 | 14.0% | 1.9%(+12.1)#7 | 2.1%(+11.9)#394 |
| 8. | 57658 | 13.6% | 1.9%(+11.7)#8 | 2.1%(+11.5)#413 |
| 9. | 57754 | 12.2% | 1.9%(+10.3)#9 | 2.1%(+10.1)#492 |
| 10. | 57548 | 11.7% | 1.9%(+9.85)#10 | 2.1%(+9.65)#533 |
| 11. | 57227 | 10.9% | 1.9%(+8.97)#11 | 2.1%(+8.77)#612 |
| 12. | 57262 | 10.8% | 1.9%(+8.96)#12 | 2.1%(+8.77)#613 |
| 13. | 57531 | 10.6% | 1.9%(+8.75)#13 | 2.1%(+8.56)#633 |
| 14. | 57257 | 9.8% | 1.9%(+7.93)#14 | 2.1%(+7.74)#728 |
| 15. | 57799 | 9.7% | 1.9%(+7.82)#15 | 2.1%(+7.63)#745 |
| 16. | 57255 | 9.1% | 1.9%(+7.20)#16 | 2.1%(+7.01)#836 |
| 17. | 57028 | 8.5% | 1.9%(+6.60)#17 | 2.1%(+6.41)#942 |
| 18. | 57474 | 7.9% | 1.9%(+5.97)#18 | 2.1%(+5.77)#1,097 |
| 19. | 57278 | 7.8% | 1.9%(+5.89)#19 | 2.1%(+5.69)#1,115 |
| 20. | 57747 | 7.7% | 1.9%(+5.83)#20 | 2.1%(+5.63)#1,127 |
| 21. | 57235 | 7.2% | 1.9%(+5.29)#21 | 2.1%(+5.09)#1,274 |
| 22. | 57661 | 7.0% | 1.9%(+5.15)#22 | 2.1%(+4.96)#1,316 |
| 23. | 57339 | 7.0% | 1.9%(+5.11)#23 | 2.1%(+4.91)#1,332 |
| 24. | 57428 | 6.4% | 1.9%(+4.49)#24 | 2.1%(+4.29)#1,549 |
| 25. | 57356 | 6.3% | 1.9%(+4.44)#25 | 2.1%(+4.24)#1,571 |
| 26. | 57529 | 5.2% | 1.9%(+3.29)#26 | 2.1%(+3.10)#2,166 |
| 27. | 57551 | 5.1% | 1.9%(+3.19)#27 | 2.1%(+3.00)#2,234 |
| 28. | 57370 | 5.0% | 1.9%(+3.11)#28 | 2.1%(+2.92)#2,286 |
| 29. | 57642 | 5.0% | 1.9%(+3.09)#29 | 2.1%(+2.89)#2,303 |
| 30. | 57775 | 4.5% | 1.9%(+2.61)#30 | 2.1%(+2.42)#2,743 |
| 31. | 57017 | 4.3% | 1.9%(+2.41)#31 | 2.1%(+2.22)#2,966 |
| 32. | 57319 | 4.2% | 1.9%(+2.34)#32 | 2.1%(+2.15)#3,042 |
| 33. | 57451 | 4.0% | 1.9%(+2.12)#33 | 2.1%(+1.92)#3,327 |
| 34. | 57763 | 3.8% | 1.9%(+1.96)#34 | 2.1%(+1.76)#3,558 |
| 35. | 57730 | 3.8% | 1.9%(+1.91)#35 | 2.1%(+1.72)#3,630 |
| 36. | 57260 | 3.8% | 1.9%(+1.87)#36 | 2.1%(+1.68)#3,691 |
| 37. | 57049 | 3.7% | 1.9%(+1.83)#37 | 2.1%(+1.63)#3,748 |
| 38. | 57538 | 3.6% | 1.9%(+1.76)#38 | 2.1%(+1.57)#3,852 |
| 39. | 57623 | 3.5% | 1.9%(+1.58)#39 | 2.1%(+1.39)#4,197 |
| 40. | 57004 | 3.4% | 1.9%(+1.53)#40 | 2.1%(+1.34)#4,310 |
| 41. | 57442 | 3.4% | 1.9%(+1.49)#41 | 2.1%(+1.29)#4,411 |
| 42. | 57791 | 3.3% | 1.9%(+1.44)#42 | 2.1%(+1.25)#4,503 |
| 43. | 57543 | 3.3% | 1.9%(+1.37)#43 | 2.1%(+1.17)#4,668 |
| 44. | 57706 | 3.2% | 1.9%(+1.35)#44 | 2.1%(+1.16)#4,699 |
| 45. | 57656 | 3.2% | 1.9%(+1.34)#45 | 2.1%(+1.14)#4,730 |
| 46. | 57702 | 3.2% | 1.9%(+1.29)#46 | 2.1%(+1.10)#4,852 |
| 47. | 57226 | 3.1% | 1.9%(+1.20)#47 | 2.1%(+1.01)#5,098 |
| 48. | 57002 | 3.1% | 1.9%(+1.20)#48 | 2.1%(+1.00)#5,110 |
| 49. | 57783 | 3.0% | 1.9%(+1.08)#49 | 2.1%(+0.883)#5,461 |
| 50. | 57266 | 2.9% | 1.9%(+1.000)#50 | 2.1%(+0.806)#5,683 |
| 51. | 57036 | 2.8% | 1.9%(+0.933)#51 | 2.1%(+0.739)#5,912 |
| 52. | 57015 | 2.8% | 1.9%(+0.864)#52 | 2.1%(+0.670)#6,175 |
| 53. | 57703 | 2.7% | 1.9%(+0.799)#53 | 2.1%(+0.605)#6,408 |
| 54. | 57440 | 2.7% | 1.9%(+0.790)#54 | 2.1%(+0.596)#6,447 |
| 55. | 57105 | 2.7% | 1.9%(+0.768)#55 | 2.1%(+0.574)#6,534 |
| 56. | 57380 | 2.6% | 1.9%(+0.721)#56 | 2.1%(+0.527)#6,718 |
| 57. | 57365 | 2.5% | 1.9%(+0.621)#57 | 2.1%(+0.426)#7,139 |
| 58. | 57053 | 2.5% | 1.9%(+0.619)#58 | 2.1%(+0.424)#7,146 |
| 59. | 57501 | 2.5% | 1.9%(+0.604)#59 | 2.1%(+0.410)#7,209 |
| 60. | 57790 | 2.5% | 1.9%(+0.595)#60 | 2.1%(+0.401)#7,250 |
| 61. | 57329 | 2.5% | 1.9%(+0.587)#61 | 2.1%(+0.393)#7,288 |
| 62. | 57050 | 2.5% | 1.9%(+0.571)#62 | 2.1%(+0.376)#7,360 |
| 63. | 57580 | 2.4% | 1.9%(+0.548)#63 | 2.1%(+0.354)#7,480 |
| 64. | 57234 | 2.3% | 1.9%(+0.441)#64 | 2.1%(+0.246)#7,987 |
| 65. | 57429 | 2.3% | 1.9%(+0.437)#65 | 2.1%(+0.243)#8,007 |
| 66. | 57007 | 2.3% | 1.9%(+0.384)#66 | 2.1%(+0.190)#8,259 |
| 67. | 57069 | 2.2% | 1.9%(+0.336)#67 | 2.1%(+0.142)#8,496 |
| 68. | 57103 | 2.2% | 1.9%(+0.333)#68 | 2.1%(+0.139)#8,510 |
| 69. | 57369 | 2.2% | 1.9%(+0.301)#69 | 2.1%(+0.107)#8,708 |
| 70. | 57430 | 2.2% | 1.9%(+0.277)#70 | 2.1%(+0.083)#8,826 |
| 71. | 57760 | 2.1% | 1.9%(+0.226)#71 | 2.1%(+0.032)#9,131 |
| 72. | 57016 | 2.1% | 1.9%(+0.224)#72 | 2.1%(+0.030)#9,147 |
| 73. | 57064 | 2.1% | 1.9%(+0.205)#73 | 2.1%(+0.011)#9,251 |
| 74. | 57110 | 2.1% | 1.9%(+0.205)#74 | 2.1%(+0.011)#9,254 |
| 75. | 57335 | 2.1% | 1.9%(+0.195)#75 | 2.1%(+0.001)#9,311 |
| 76. | 57567 | 2.1% | 1.9%(+0.186)#76 | 2.1%(-0.008)#9,346 |
| 77. | 57769 | 1.9% | 1.9%(+0.000)#77 | 2.1%(-0.194)#10,443 |
| 78. | 57350 | 1.8% | 1.9%(-0.063)#78 | 2.1%(-0.257)#10,843 |
| 79. | 57201 | 1.8% | 1.9%(-0.069)#79 | 2.1%(-0.263)#10,875 |
| 80. | 57701 | 1.8% | 1.9%(-0.070)#80 | 2.1%(-0.264)#10,894 |
| 81. | 57718 | 1.8% | 1.9%(-0.125)#81 | 2.1%(-0.319)#11,271 |
| 82. | 57359 | 1.8% | 1.9%(-0.129)#82 | 2.1%(-0.323)#11,302 |
| 83. | 57107 | 1.7% | 1.9%(-0.147)#83 | 2.1%(-0.341)#11,429 |
| 84. | 57042 | 1.7% | 1.9%(-0.150)#84 | 2.1%(-0.344)#11,458 |
| 85. | 57555 | 1.7% | 1.9%(-0.192)#85 | 2.1%(-0.386)#11,755 |
| 86. | 57106 | 1.7% | 1.9%(-0.195)#86 | 2.1%(-0.390)#11,790 |
| 87. | 57334 | 1.7% | 1.9%(-0.237)#87 | 2.1%(-0.432)#12,075 |
| 88. | 57212 | 1.6% | 1.9%(-0.243)#88 | 2.1%(-0.437)#12,124 |
| 89. | 57773 | 1.6% | 1.9%(-0.276)#89 | 2.1%(-0.470)#12,362 |
| 90. | 57785 | 1.6% | 1.9%(-0.285)#90 | 2.1%(-0.479)#12,437 |
| 91. | 57434 | 1.6% | 1.9%(-0.320)#91 | 2.1%(-0.514)#12,717 |
| 92. | 57564 | 1.6% | 1.9%(-0.333)#92 | 2.1%(-0.527)#12,809 |
| 93. | 57108 | 1.6% | 1.9%(-0.334)#93 | 2.1%(-0.528)#12,819 |
| 94. | 57744 | 1.5% | 1.9%(-0.347)#94 | 2.1%(-0.541)#12,945 |
| 95. | 57401 | 1.5% | 1.9%(-0.359)#95 | 2.1%(-0.553)#13,037 |
| 96. | 57273 | 1.5% | 1.9%(-0.373)#96 | 2.1%(-0.567)#13,143 |
| 97. | 57020 | 1.5% | 1.9%(-0.396)#97 | 2.1%(-0.590)#13,281 |
| 98. | 57301 | 1.5% | 1.9%(-0.405)#98 | 2.1%(-0.599)#13,347 |
| 99. | 57649 | 1.5% | 1.9%(-0.407)#99 | 2.1%(-0.601)#13,365 |
| 100. | 57476 | 1.5% | 1.9%(-0.418)#100 | 2.1%(-0.612)#13,443 |
Common Questions
What are the Top 10 Zip Codes with the Highest Percentage of Population Employed in Arts, Entertainment & Recreation in South Dakota?
Top 10 Zip Codes with the Highest Percentage of Population Employed in Arts, Entertainment & Recreation in South Dakota are:
What zip code has the Highest Percentage of Population Employed in Arts, Entertainment & Recreation in South Dakota?
57562 has the Highest Percentage of Population Employed in Arts, Entertainment & Recreation in South Dakota with 47.7%.
What is the Percentage of Population Employed in Arts, Entertainment & Recreation in the State of South Dakota?
Percentage of Population Employed in Arts, Entertainment & Recreation in South Dakota is 1.9%.
What is the Percentage of Population Employed in Arts, Entertainment & Recreation in the United States?
Percentage of Population Employed in Arts, Entertainment & Recreation in the United States is 2.1%.