Ponderosa Pines, MT Map & Demographics
Ponderosa Pines Map
Ponderosa Pines Overview
$28,225
PER CAPITA INCOME
$82,953
AVG FAMILY INCOME
$83,203
AVG HOUSEHOLD INCOME
8.5%
WAGE / INCOME GAP [ % ]
91.5¢/ $1
WAGE / INCOME GAP [ $ ]
0.29
INEQUALITY / GINI INDEX
841
TOTAL POPULATION
421
MALE POPULATION
420
FEMALE POPULATION
100.24
MALES / 100 FEMALES
99.76
FEMALES / 100 MALES
45.8
MEDIAN AGE
2.7
AVG FAMILY SIZE
2.9
AVG HOUSEHOLD SIZE
473
LABOR FORCE [ PEOPLE ]
70.1%
PERCENT IN LABOR FORCE
Income in Ponderosa Pines
Income Overview in Ponderosa Pines
Per Capita Income in Ponderosa Pines is $28,225, while median incomes of families and households are $82,953 and $83,203 respectively.
| Characteristic | Number | Measure |
| Per Capita Income | 841 | $28,225 |
| Median Family Income | 281 | $82,953 |
| Mean Family Income | 281 | $70,767 |
| Median Household Income | 287 | $83,203 |
| Mean Household Income | 287 | $74,148 |
| Income Deficit | 281 | $0 |
| Wage / Income Gap (%) | 841 | 8.50% |
| Wage / Income Gap ($) | 841 | 91.50¢ per $1 |
| Gini / Inequality Index | 841 | 0.29 |
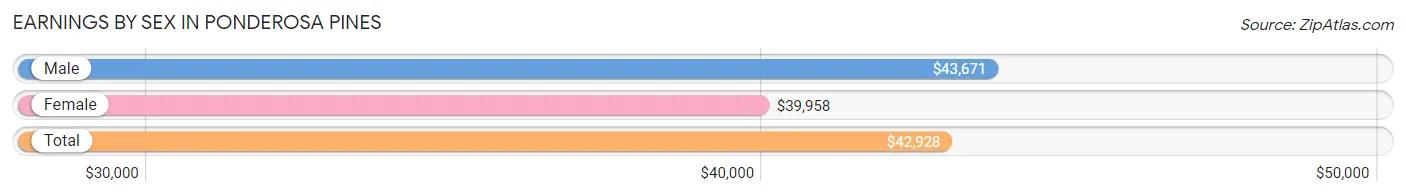
Earnings by Sex in Ponderosa Pines
Average Earnings in Ponderosa Pines are $42,928, $43,671 for men and $39,958 for women, a difference of 8.5%.
| Sex | Number | Average Earnings |
| Male | 314 (62.1%) | $43,671 |
| Female | 192 (37.9%) | $39,958 |
| Total | 506 (100.0%) | $42,928 |
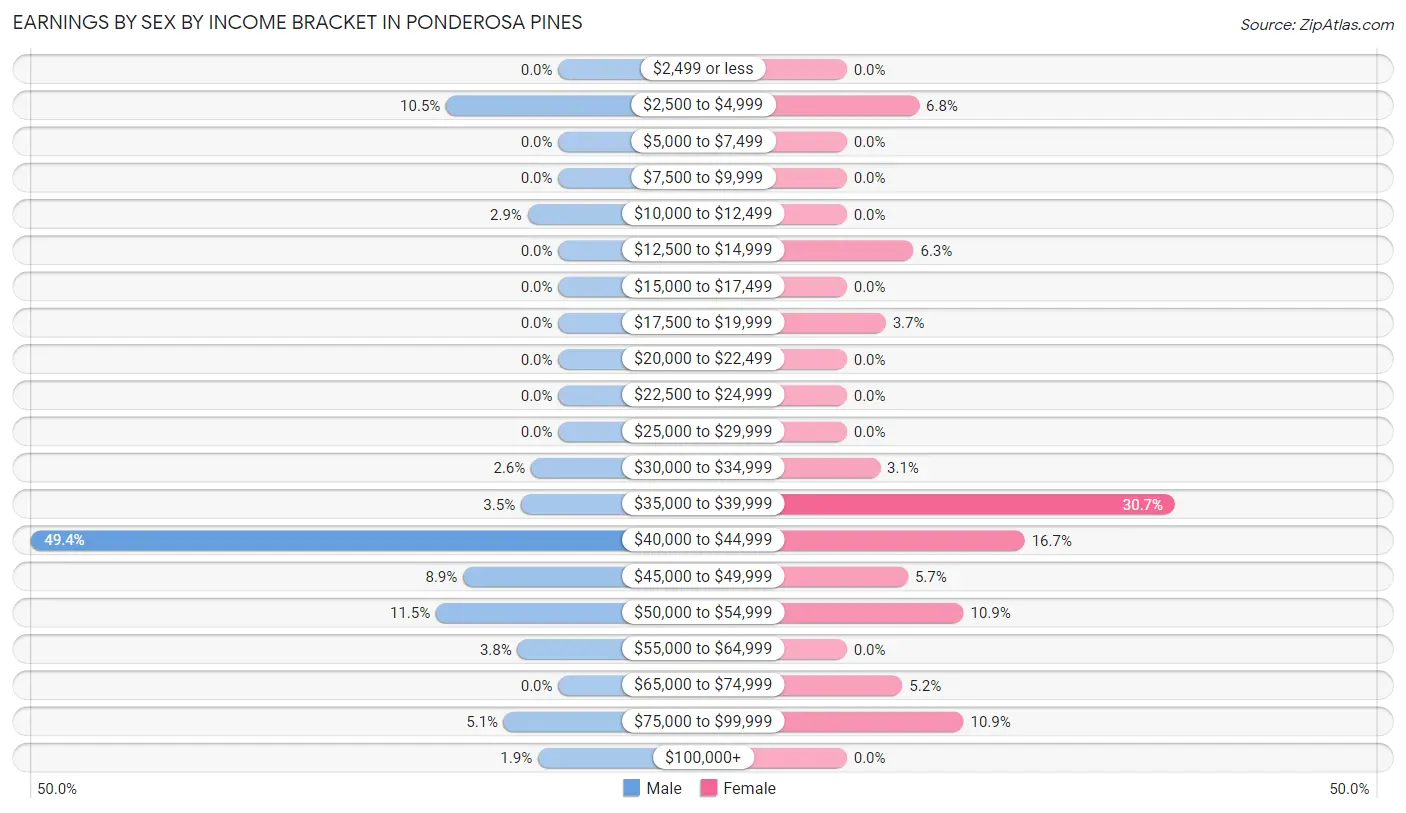
Earnings by Sex by Income Bracket in Ponderosa Pines
The most common earnings brackets in Ponderosa Pines are $40,000 to $44,999 for men (155 | 49.4%) and $35,000 to $39,999 for women (59 | 30.7%).
| Income | Male | Female |
| $2,499 or less | 0 (0.0%) | 0 (0.0%) |
| $2,500 to $4,999 | 33 (10.5%) | 13 (6.8%) |
| $5,000 to $7,499 | 0 (0.0%) | 0 (0.0%) |
| $7,500 to $9,999 | 0 (0.0%) | 0 (0.0%) |
| $10,000 to $12,499 | 9 (2.9%) | 0 (0.0%) |
| $12,500 to $14,999 | 0 (0.0%) | 12 (6.2%) |
| $15,000 to $17,499 | 0 (0.0%) | 0 (0.0%) |
| $17,500 to $19,999 | 0 (0.0%) | 7 (3.6%) |
| $20,000 to $22,499 | 0 (0.0%) | 0 (0.0%) |
| $22,500 to $24,999 | 0 (0.0%) | 0 (0.0%) |
| $25,000 to $29,999 | 0 (0.0%) | 0 (0.0%) |
| $30,000 to $34,999 | 8 (2.5%) | 6 (3.1%) |
| $35,000 to $39,999 | 11 (3.5%) | 59 (30.7%) |
| $40,000 to $44,999 | 155 (49.4%) | 32 (16.7%) |
| $45,000 to $49,999 | 28 (8.9%) | 11 (5.7%) |
| $50,000 to $54,999 | 36 (11.5%) | 21 (10.9%) |
| $55,000 to $64,999 | 12 (3.8%) | 0 (0.0%) |
| $65,000 to $74,999 | 0 (0.0%) | 10 (5.2%) |
| $75,000 to $99,999 | 16 (5.1%) | 21 (10.9%) |
| $100,000+ | 6 (1.9%) | 0 (0.0%) |
| Total | 314 (100.0%) | 192 (100.0%) |
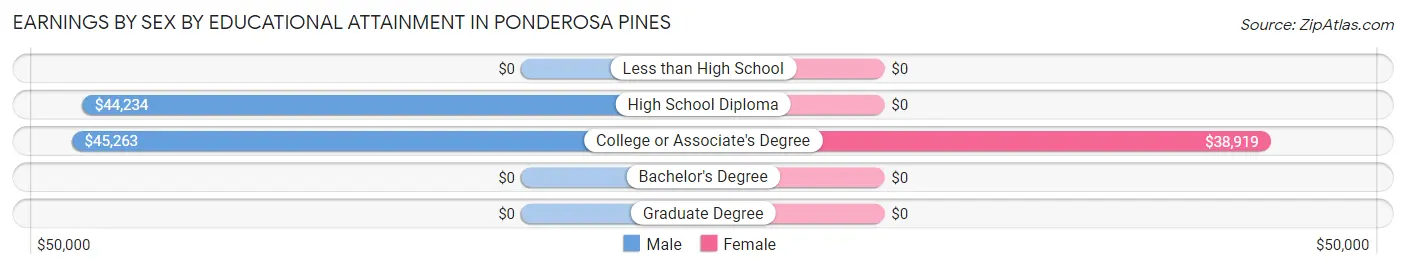
Earnings by Sex by Educational Attainment in Ponderosa Pines
Average earnings in Ponderosa Pines are $43,784 for men and $39,831 for women, a difference of 9.0%. Men with an educational attainment of college or associate's degree enjoy the highest average annual earnings of $45,263, while those with high school diploma education earn the least with $44,234. Women with an educational attainment of college or associate's degree earn the most with the average annual earnings of $38,919, while those with college or associate's degree education have the smallest earnings of $38,919.
| Educational Attainment | Male Income | Female Income |
| Less than High School | - | - |
| High School Diploma | $44,234 | $0 |
| College or Associate's Degree | $45,263 | $38,919 |
| Bachelor's Degree | - | - |
| Graduate Degree | - | - |
| Total | $43,784 | $39,831 |
Family Income in Ponderosa Pines
Family Income Brackets in Ponderosa Pines
According to the Ponderosa Pines family income data, there are 99 families falling into the $75,000 to $99,999 income range, which is the most common income bracket and makes up 35.2% of all families.
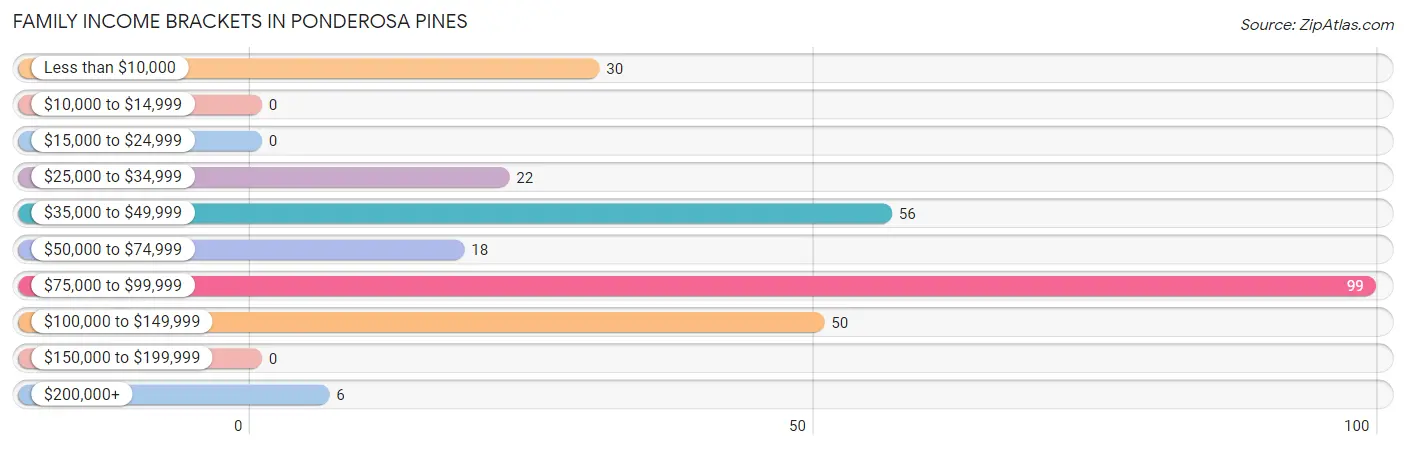
| Income Bracket | # Families | % Families |
| Less than $10,000 | 30 | 10.7% |
| $10,000 to $14,999 | 0 | 0.0% |
| $15,000 to $24,999 | 0 | 0.0% |
| $25,000 to $34,999 | 22 | 7.8% |
| $35,000 to $49,999 | 56 | 19.9% |
| $50,000 to $74,999 | 18 | 6.4% |
| $75,000 to $99,999 | 99 | 35.2% |
| $100,000 to $149,999 | 50 | 17.8% |
| $150,000 to $199,999 | 0 | 0.0% |
| $200,000+ | 6 | 2.1% |
Family Income by Famaliy Size in Ponderosa Pines
2-person families (175 | 62.3%) account for the highest median family income in Ponderosa Pines with $83,609 per family, while 2-person families (175 | 62.3%) have the highest median income of $41,804 per family member.
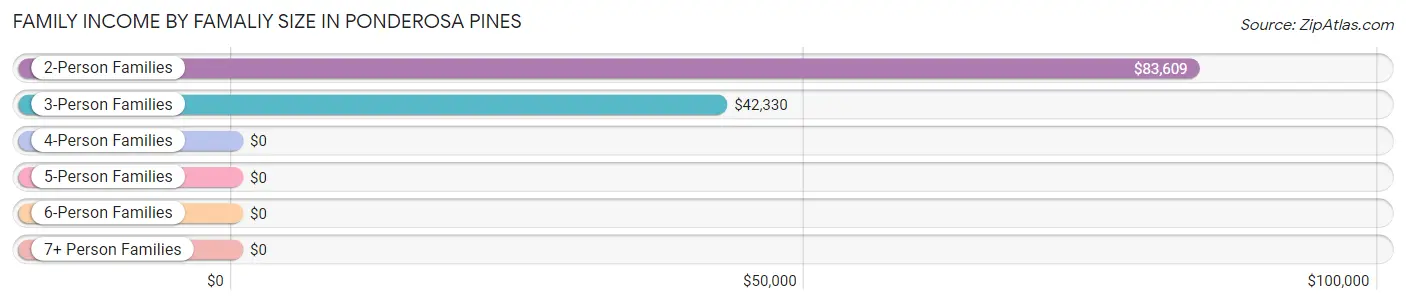
| Income Bracket | # Families | Median Income |
| 2-Person Families | 175 (62.3%) | $83,609 |
| 3-Person Families | 82 (29.2%) | $42,330 |
| 4-Person Families | 12 (4.3%) | $0 |
| 5-Person Families | 12 (4.3%) | $0 |
| 6-Person Families | 0 (0.0%) | $0 |
| 7+ Person Families | 0 (0.0%) | $0 |
| Total | 281 (100.0%) | $82,953 |
Family Income by Number of Earners in Ponderosa Pines
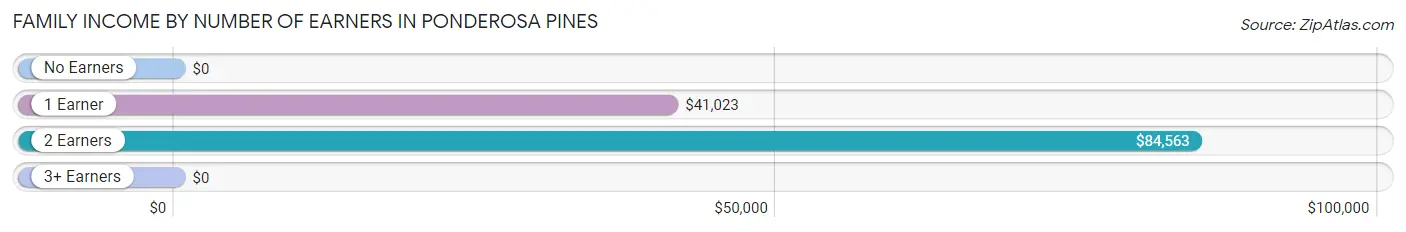
| Number of Earners | # Families | Median Income |
| No Earners | 37 (13.2%) | $0 |
| 1 Earner | 66 (23.5%) | $41,023 |
| 2 Earners | 178 (63.3%) | $84,563 |
| 3+ Earners | 0 (0.0%) | $0 |
| Total | 281 (100.0%) | $82,953 |
Household Income in Ponderosa Pines
Household Income Brackets in Ponderosa Pines
With 110 households falling in the category, the $75,000 to $99,999 income range is the most frequent in Ponderosa Pines, accounting for 38.3% of all households.
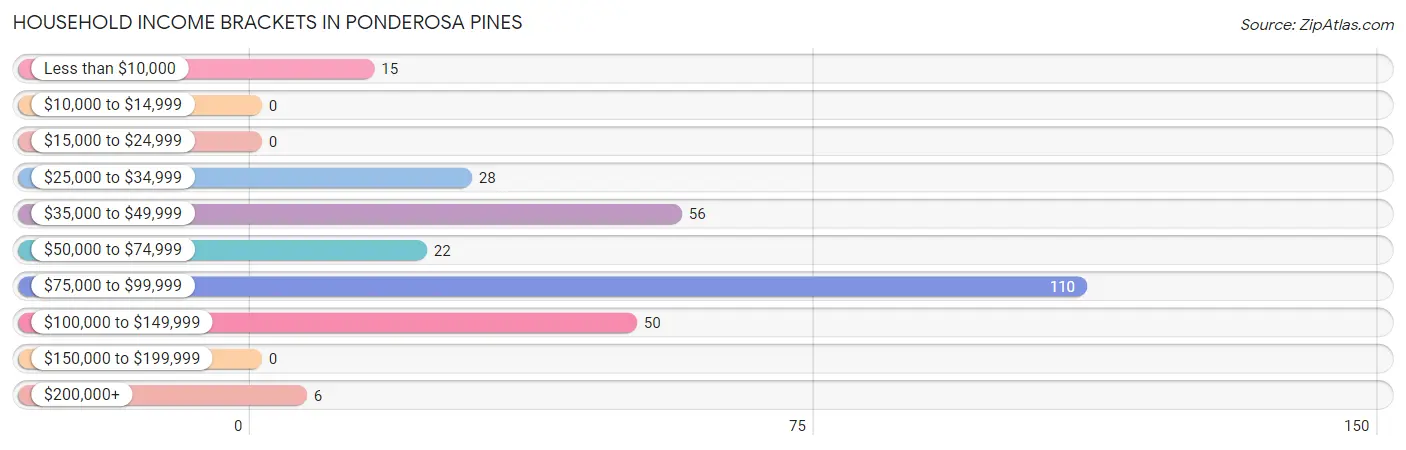
| Income Bracket | # Households | % Households |
| Less than $10,000 | 15 | 5.2% |
| $10,000 to $14,999 | 0 | 0.0% |
| $15,000 to $24,999 | 0 | 0.0% |
| $25,000 to $34,999 | 28 | 9.8% |
| $35,000 to $49,999 | 56 | 19.5% |
| $50,000 to $74,999 | 22 | 7.7% |
| $75,000 to $99,999 | 110 | 38.3% |
| $100,000 to $149,999 | 50 | 17.4% |
| $150,000 to $199,999 | 0 | 0.0% |
| $200,000+ | 6 | 2.1% |
Household Income by Householder Age in Ponderosa Pines
The median household income in Ponderosa Pines is $83,203, with the highest median household income of $85,066 found in the 25 to 44 years age bracket for the primary householder. A total of 99 households (34.5%) fall into this category.
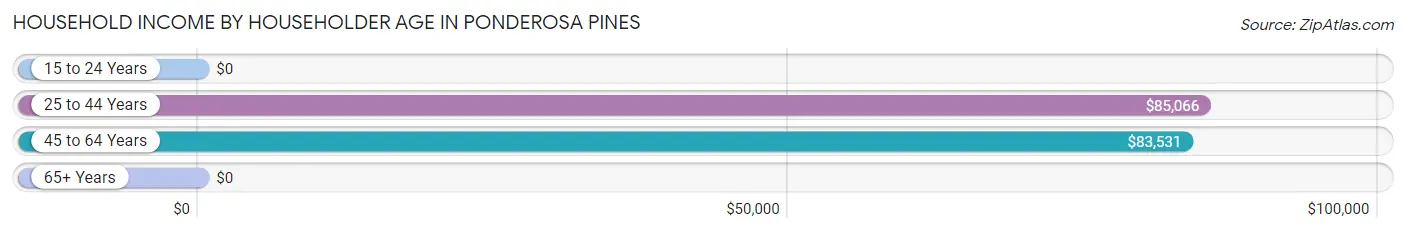
| Income Bracket | # Households | Median Income |
| 15 to 24 Years | 0 (0.0%) | $0 |
| 25 to 44 Years | 99 (34.5%) | $85,066 |
| 45 to 64 Years | 166 (57.8%) | $83,531 |
| 65+ Years | 22 (7.7%) | $0 |
| Total | 287 (100.0%) | $83,203 |
Poverty in Ponderosa Pines
Income Below Poverty by Sex and Age in Ponderosa Pines
With 3.6% poverty level for males and 21.7% for females among the residents of Ponderosa Pines, 35 to 44 year old males and 25 to 34 year old females are the most vulnerable to poverty, with 15 males (32.6%) and 15 females (55.6%) in their respective age groups living below the poverty level.
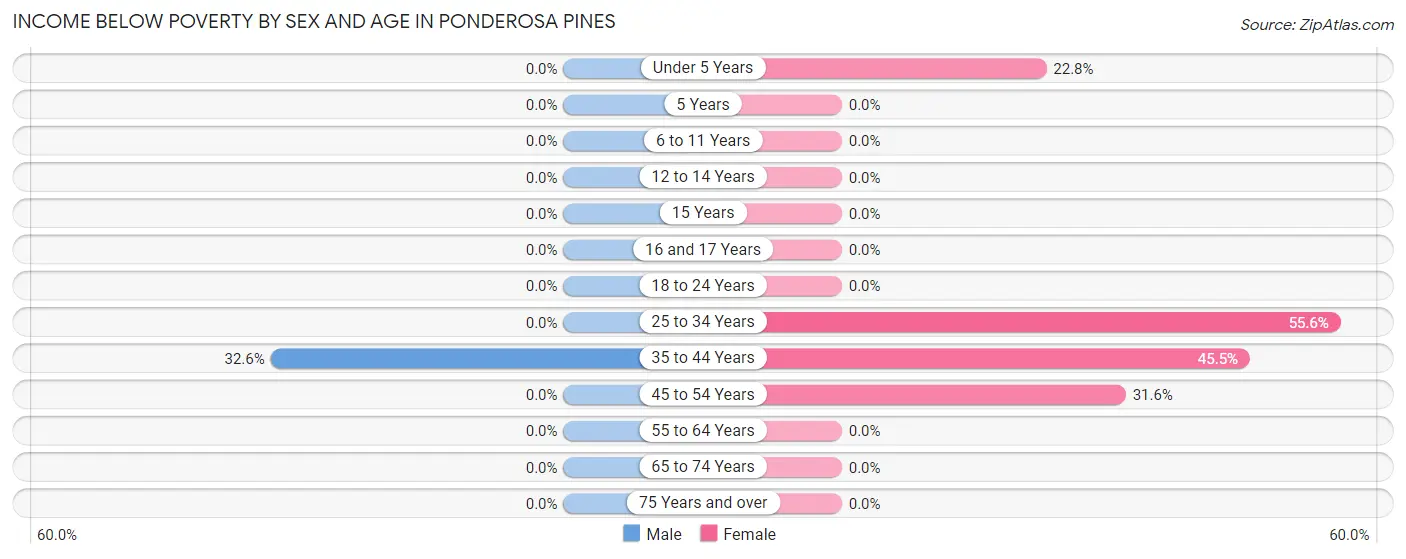
| Age Bracket | Male | Female |
| Under 5 Years | 0 (0.0%) | 18 (22.8%) |
| 5 Years | 0 (0.0%) | 0 (0.0%) |
| 6 to 11 Years | 0 (0.0%) | 0 (0.0%) |
| 12 to 14 Years | 0 (0.0%) | 0 (0.0%) |
| 15 Years | 0 (0.0%) | 0 (0.0%) |
| 16 and 17 Years | 0 (0.0%) | 0 (0.0%) |
| 18 to 24 Years | 0 (0.0%) | 0 (0.0%) |
| 25 to 34 Years | 0 (0.0%) | 15 (55.6%) |
| 35 to 44 Years | 15 (32.6%) | 15 (45.5%) |
| 45 to 54 Years | 0 (0.0%) | 43 (31.6%) |
| 55 to 64 Years | 0 (0.0%) | 0 (0.0%) |
| 65 to 74 Years | 0 (0.0%) | 0 (0.0%) |
| 75 Years and over | 0 (0.0%) | 0 (0.0%) |
| Total | 15 (3.6%) | 91 (21.7%) |
Income Above Poverty by Sex and Age in Ponderosa Pines
According to the poverty statistics in Ponderosa Pines, males aged under 5 years and females aged 6 to 11 years are the age groups that are most secure financially, with 100.0% of males and 100.0% of females in these age groups living above the poverty line.
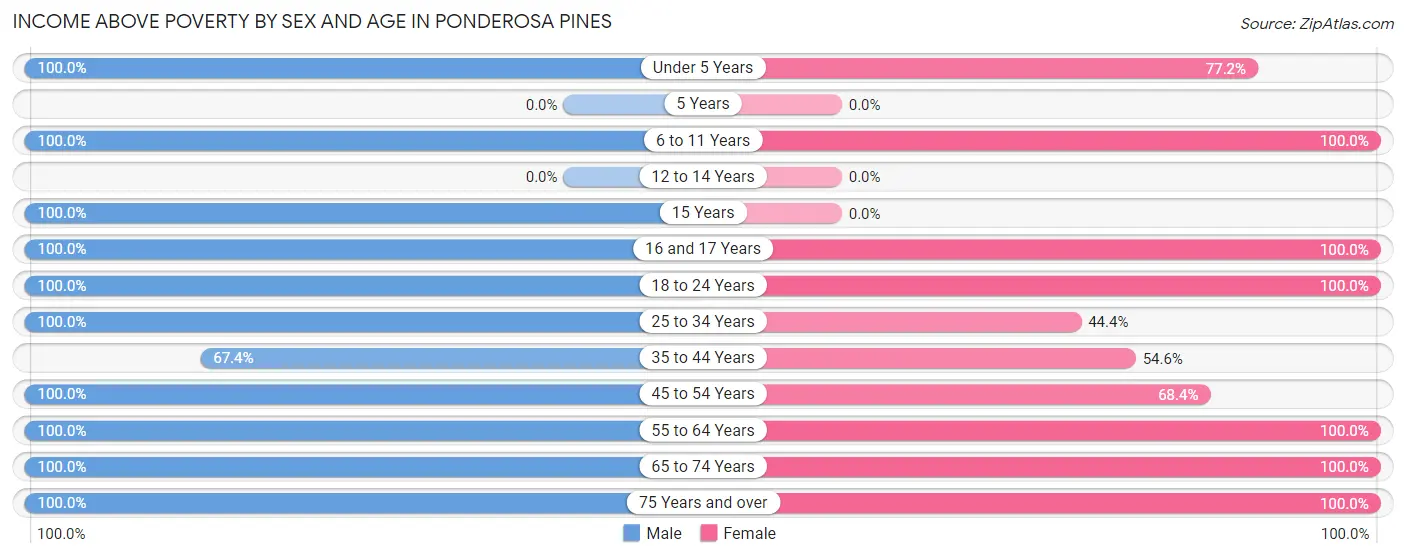
| Age Bracket | Male | Female |
| Under 5 Years | 14 (100.0%) | 61 (77.2%) |
| 5 Years | 0 (0.0%) | 0 (0.0%) |
| 6 to 11 Years | 24 (100.0%) | 11 (100.0%) |
| 12 to 14 Years | 0 (0.0%) | 0 (0.0%) |
| 15 Years | 38 (100.0%) | 0 (0.0%) |
| 16 and 17 Years | 29 (100.0%) | 37 (100.0%) |
| 18 to 24 Years | 8 (100.0%) | 19 (100.0%) |
| 25 to 34 Years | 43 (100.0%) | 12 (44.4%) |
| 35 to 44 Years | 31 (67.4%) | 18 (54.5%) |
| 45 to 54 Years | 126 (100.0%) | 93 (68.4%) |
| 55 to 64 Years | 73 (100.0%) | 44 (100.0%) |
| 65 to 74 Years | 8 (100.0%) | 20 (100.0%) |
| 75 Years and over | 12 (100.0%) | 14 (100.0%) |
| Total | 406 (96.4%) | 329 (78.3%) |
Income Below Poverty Among Married-Couple Families in Ponderosa Pines
The poverty statistics for married-couple families in Ponderosa Pines show that 8.2% or 15 of the total 184 families live below the poverty line. Families with no children have the highest poverty rate of 11.3%, comprising of 15 families. On the other hand, families with 1 or 2 children have the lowest poverty rate of 0.0%, which includes 0 families.
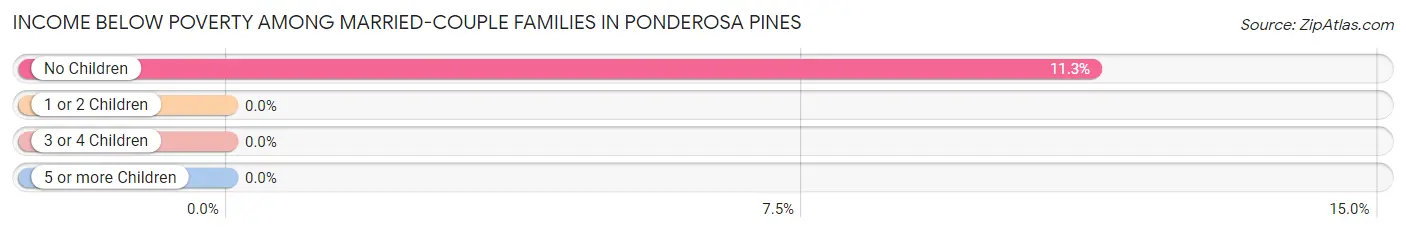
| Children | Above Poverty | Below Poverty |
| No Children | 118 (88.7%) | 15 (11.3%) |
| 1 or 2 Children | 39 (100.0%) | 0 (0.0%) |
| 3 or 4 Children | 12 (100.0%) | 0 (0.0%) |
| 5 or more Children | 0 (0.0%) | 0 (0.0%) |
| Total | 169 (91.8%) | 15 (8.2%) |
Income Below Poverty Among Single-Parent Households in Ponderosa Pines
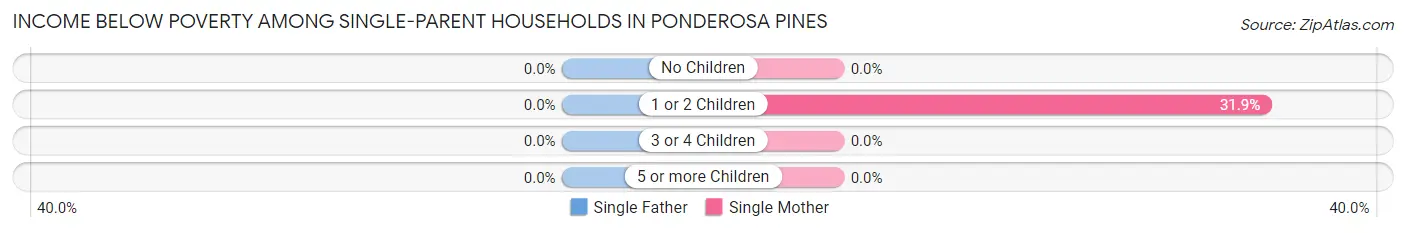
| Children | Single Father | Single Mother |
| No Children | 0 (0.0%) | 0 (0.0%) |
| 1 or 2 Children | 0 (0.0%) | 15 (31.9%) |
| 3 or 4 Children | 0 (0.0%) | 0 (0.0%) |
| 5 or more Children | 0 (0.0%) | 0 (0.0%) |
| Total | 0 (0.0%) | 15 (31.9%) |
Income Below Poverty Among Married-Couple vs Single-Parent Households in Ponderosa Pines
The poverty data for Ponderosa Pines shows that 15 of the married-couple family households (8.2%) and 15 of the single-parent households (15.5%) are living below the poverty level. Within the married-couple family households, those with no children have the highest poverty rate, with 15 households (11.3%) falling below the poverty line. Among the single-parent households, those with 1 or 2 children have the highest poverty rate, with 15 household (16.5%) living below poverty.
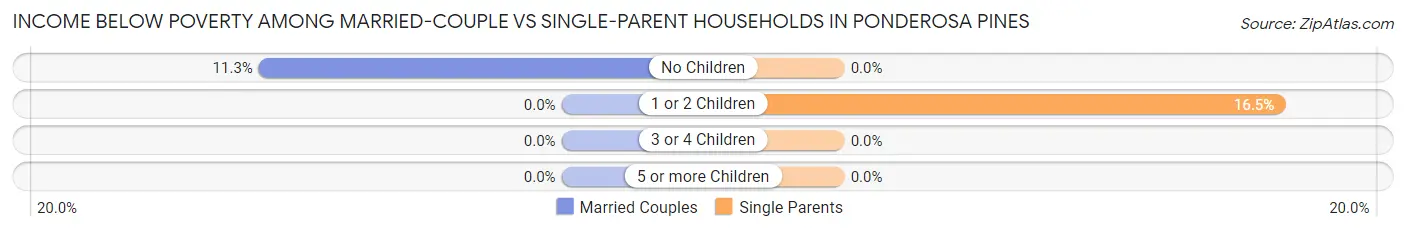
| Children | Married-Couple Families | Single-Parent Households |
| No Children | 15 (11.3%) | 0 (0.0%) |
| 1 or 2 Children | 0 (0.0%) | 15 (16.5%) |
| 3 or 4 Children | 0 (0.0%) | 0 (0.0%) |
| 5 or more Children | 0 (0.0%) | 0 (0.0%) |
| Total | 15 (8.2%) | 15 (15.5%) |
Race in Ponderosa Pines
The most populous races in Ponderosa Pines are White / Caucasian (833 | 99.1%), and Two or more Races (8 | 0.9%).
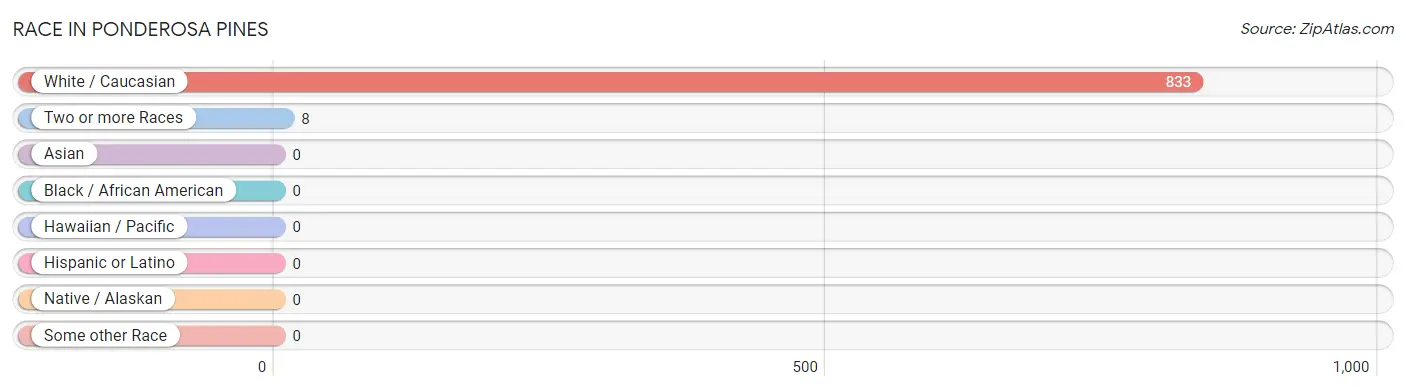
| Race | # Population | % Population |
| Asian | 0 | 0.0% |
| Black / African American | 0 | 0.0% |
| Hawaiian / Pacific | 0 | 0.0% |
| Hispanic or Latino | 0 | 0.0% |
| Native / Alaskan | 0 | 0.0% |
| White / Caucasian | 833 | 99.1% |
| Two or more Races | 8 | 0.9% |
| Some other Race | 0 | 0.0% |
| Total | 841 | 100.0% |
Ancestry in Ponderosa Pines
The most populous ancestries reported in Ponderosa Pines are American (129 | 15.3%), Irish (95 | 11.3%), English (91 | 10.8%), Norwegian (91 | 10.8%), and Dutch (78 | 9.3%), together accounting for 57.6% of all Ponderosa Pines residents.
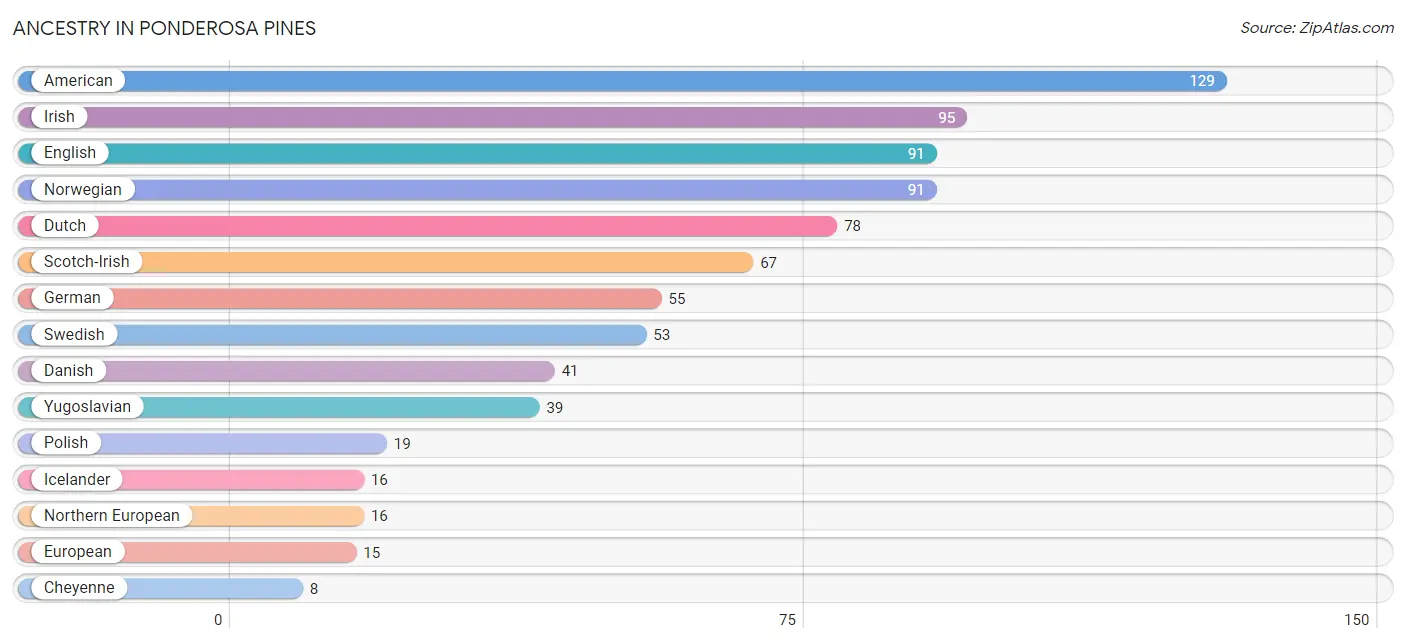
| Ancestry | # Population | % Population |
| American | 129 | 15.3% |
| Cheyenne | 8 | 0.9% |
| Danish | 41 | 4.9% |
| Dutch | 78 | 9.3% |
| English | 91 | 10.8% |
| European | 15 | 1.8% |
| German | 55 | 6.5% |
| Icelander | 16 | 1.9% |
| Irish | 95 | 11.3% |
| Italian | 7 | 0.8% |
| Northern European | 16 | 1.9% |
| Norwegian | 91 | 10.8% |
| Polish | 19 | 2.3% |
| Scotch-Irish | 67 | 8.0% |
| Swedish | 53 | 6.3% |
| Welsh | 8 | 0.9% |
| Yugoslavian | 39 | 4.6% | View All 17 Rows |
Immigrants in Ponderosa Pines

| Immigration Origin | # Population | % Population | View All 0 Rows |
Sex and Age in Ponderosa Pines
Sex and Age in Ponderosa Pines
The most populous age groups in Ponderosa Pines are 50 to 54 Years (111 | 26.4%) for men and 45 to 49 Years (80 | 19.1%) for women.
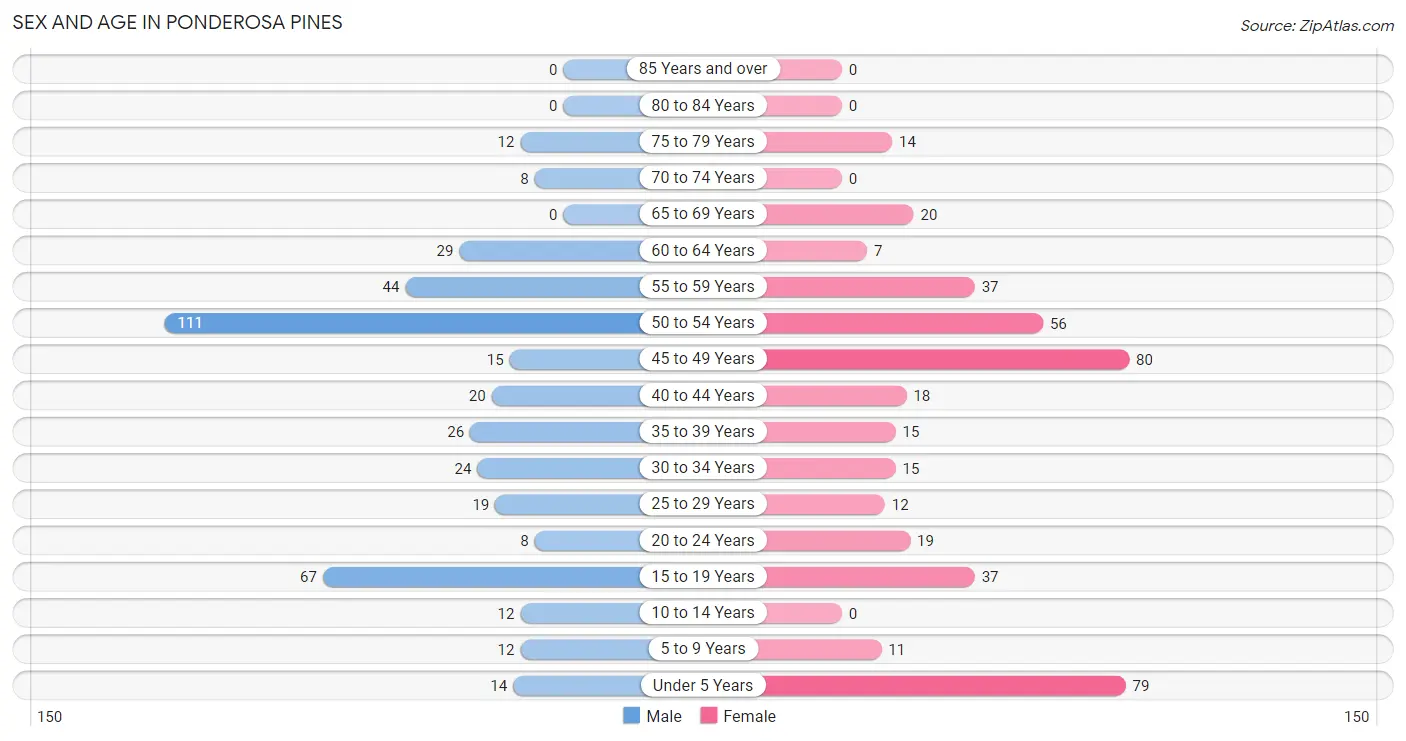
| Age Bracket | Male | Female |
| Under 5 Years | 14 (3.3%) | 79 (18.8%) |
| 5 to 9 Years | 12 (2.9%) | 11 (2.6%) |
| 10 to 14 Years | 12 (2.9%) | 0 (0.0%) |
| 15 to 19 Years | 67 (15.9%) | 37 (8.8%) |
| 20 to 24 Years | 8 (1.9%) | 19 (4.5%) |
| 25 to 29 Years | 19 (4.5%) | 12 (2.9%) |
| 30 to 34 Years | 24 (5.7%) | 15 (3.6%) |
| 35 to 39 Years | 26 (6.2%) | 15 (3.6%) |
| 40 to 44 Years | 20 (4.8%) | 18 (4.3%) |
| 45 to 49 Years | 15 (3.6%) | 80 (19.1%) |
| 50 to 54 Years | 111 (26.4%) | 56 (13.3%) |
| 55 to 59 Years | 44 (10.4%) | 37 (8.8%) |
| 60 to 64 Years | 29 (6.9%) | 7 (1.7%) |
| 65 to 69 Years | 0 (0.0%) | 20 (4.8%) |
| 70 to 74 Years | 8 (1.9%) | 0 (0.0%) |
| 75 to 79 Years | 12 (2.9%) | 14 (3.3%) |
| 80 to 84 Years | 0 (0.0%) | 0 (0.0%) |
| 85 Years and over | 0 (0.0%) | 0 (0.0%) |
| Total | 421 (100.0%) | 420 (100.0%) |
Families and Households in Ponderosa Pines
Median Family Size in Ponderosa Pines
The median family size in Ponderosa Pines is 2.72 persons per family, with single male/father families (50 | 17.8%) accounting for the largest median family size of 2.96 persons per family. On the other hand, single female/mother families (47 | 16.7%) represent the smallest median family size with 2.30 persons per family.
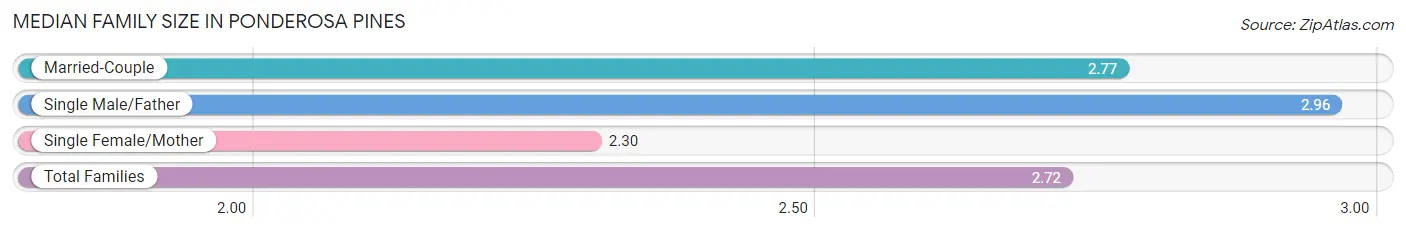
| Family Type | # Families | Family Size |
| Married-Couple | 184 (65.5%) | 2.77 |
| Single Male/Father | 50 (17.8%) | 2.96 |
| Single Female/Mother | 47 (16.7%) | 2.30 |
| Total Families | 281 (100.0%) | 2.72 |
Median Household Size in Ponderosa Pines
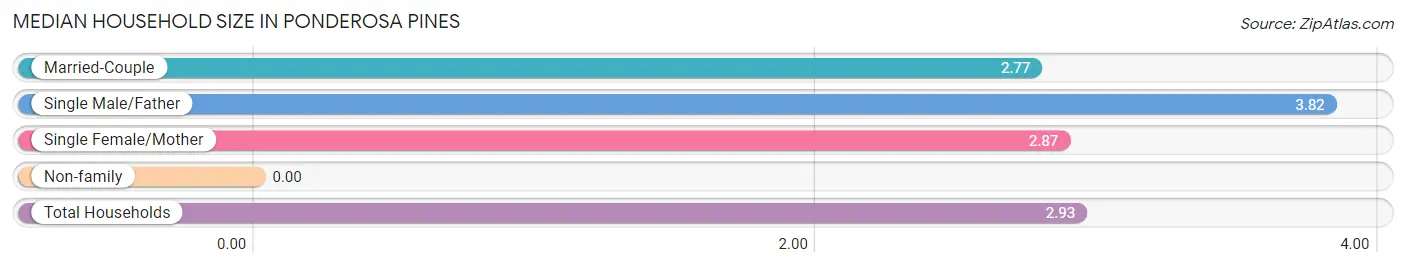
| Household Type | # Households | Household Size |
| Married-Couple | 184 (64.1%) | 2.77 |
| Single Male/Father | 50 (17.4%) | 3.82 |
| Single Female/Mother | 47 (16.4%) | 2.87 |
| Non-family | 6 (2.1%) | - |
| Total Households | 287 (100.0%) | 2.93 |
Household Size by Marriage Status in Ponderosa Pines
Out of a total of 287 households in Ponderosa Pines, 281 (97.9%) are family households, while 6 (2.1%) are nonfamily households. The most numerous type of family households are 2-person households, comprising 160, and the most common type of nonfamily households are 1-person households, comprising 6.
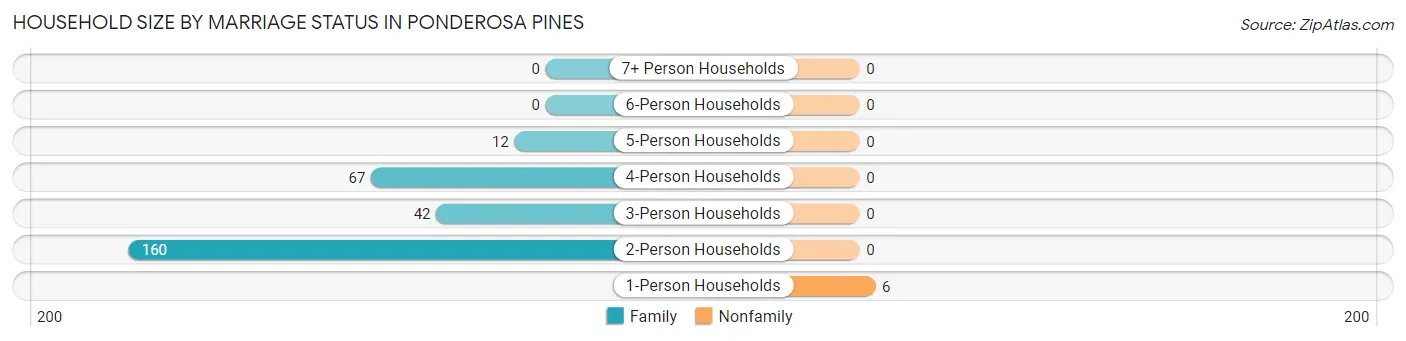
| Household Size | Family Households | Nonfamily Households |
| 1-Person Households | - | 6 (2.1%) |
| 2-Person Households | 160 (55.7%) | 0 (0.0%) |
| 3-Person Households | 42 (14.6%) | 0 (0.0%) |
| 4-Person Households | 67 (23.3%) | 0 (0.0%) |
| 5-Person Households | 12 (4.2%) | 0 (0.0%) |
| 6-Person Households | 0 (0.0%) | 0 (0.0%) |
| 7+ Person Households | 0 (0.0%) | 0 (0.0%) |
| Total | 281 (97.9%) | 6 (2.1%) |
Female Fertility in Ponderosa Pines
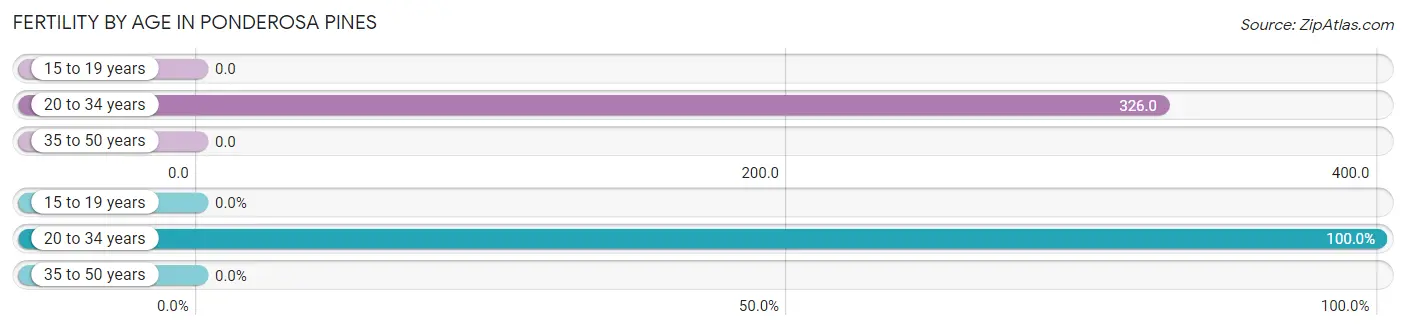
Fertility by Age in Ponderosa Pines
Average fertility rate in Ponderosa Pines is 77.0 births per 1,000 women. Women in the age bracket of 20 to 34 years have the highest fertility rate with 326.0 births per 1,000 women. Women in the age bracket of 20 to 34 years acount for 100.0% of all women with births.
| Age Bracket | Women with Births | Births / 1,000 Women |
| 15 to 19 years | 0 (0.0%) | 0.0 |
| 20 to 34 years | 15 (100.0%) | 326.0 |
| 35 to 50 years | 0 (0.0%) | 0.0 |
| Total | 15 (100.0%) | 77.0 |
Fertility by Age by Marriage Status in Ponderosa Pines
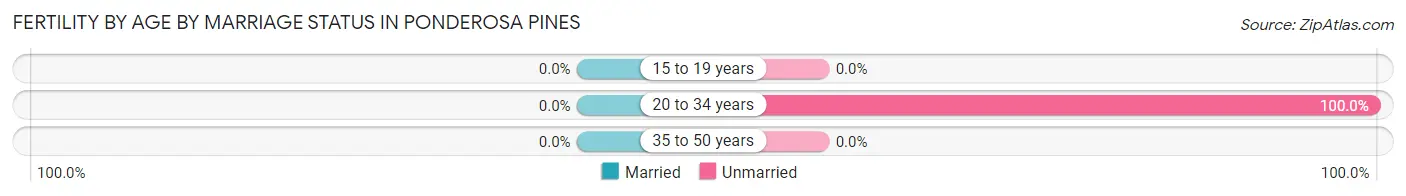
| Age Bracket | Married | Unmarried |
| 15 to 19 years | 0 (0.0%) | 0 (0.0%) |
| 20 to 34 years | 0 (0.0%) | 15 (100.0%) |
| 35 to 50 years | 0 (0.0%) | 0 (0.0%) |
| Total | 0 (0.0%) | 15 (100.0%) |
Fertility by Education in Ponderosa Pines
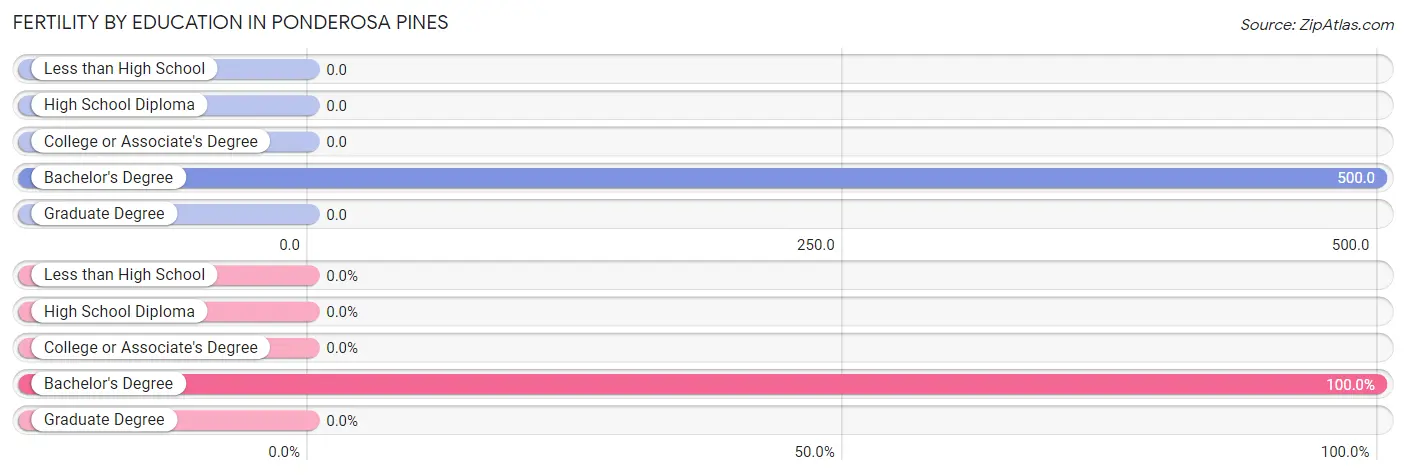
| Educational Attainment | Women with Births | Births / 1,000 Women |
| Less than High School | 0 (0.0%) | 0.0 |
| High School Diploma | 0 (0.0%) | 0.0 |
| College or Associate's Degree | 0 (0.0%) | 0.0 |
| Bachelor's Degree | 15 (100.0%) | 500.0 |
| Graduate Degree | 0 (0.0%) | 0.0 |
| Total | 15 (100.0%) | 77.0 |
Fertility by Education by Marriage Status in Ponderosa Pines
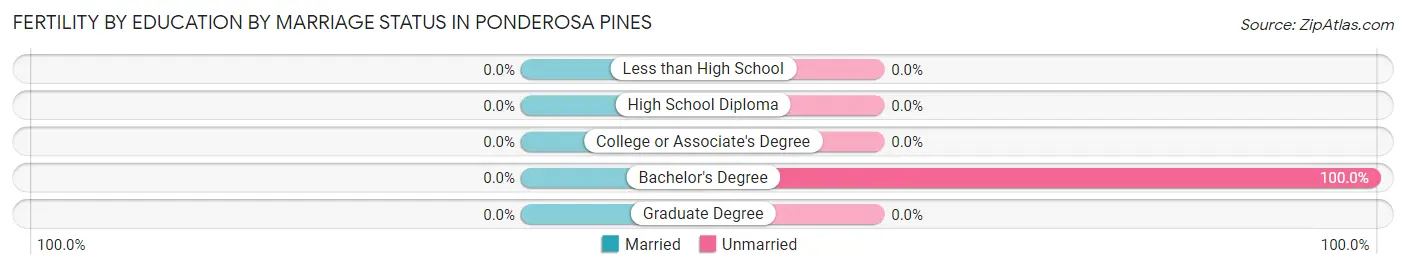
| Educational Attainment | Married | Unmarried |
| Less than High School | 0 (0.0%) | 0 (0.0%) |
| High School Diploma | 0 (0.0%) | 0 (0.0%) |
| College or Associate's Degree | 0 (0.0%) | 0 (0.0%) |
| Bachelor's Degree | 0 (0.0%) | 15 (100.0%) |
| Graduate Degree | 0 (0.0%) | 0 (0.0%) |
| Total | 0 (0.0%) | 15 (100.0%) |
Employment Characteristics in Ponderosa Pines
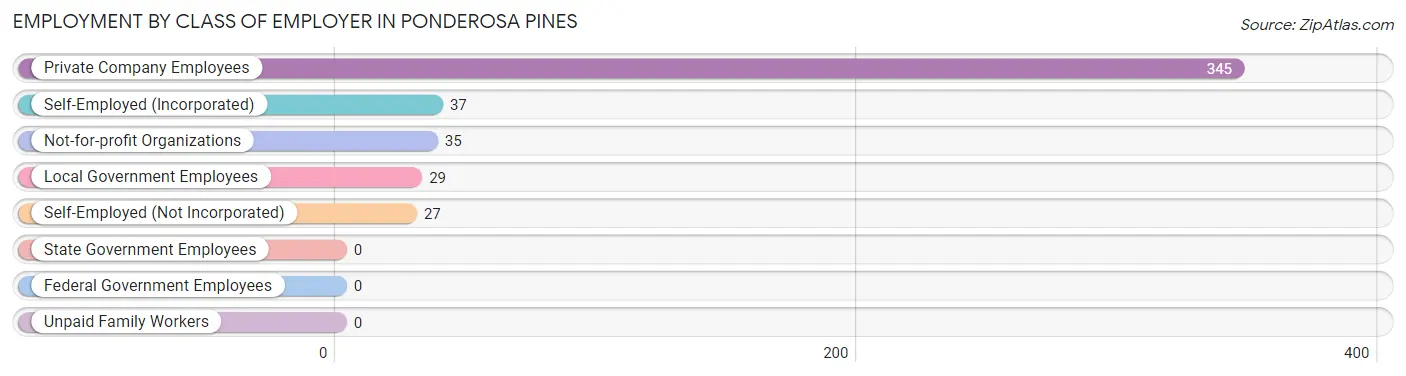
Employment by Class of Employer in Ponderosa Pines
Among the 473 employed individuals in Ponderosa Pines, private company employees (345 | 72.9%), self-employed (incorporated) (37 | 7.8%), and not-for-profit organizations (35 | 7.4%) make up the most common classes of employment.
| Employer Class | # Employees | % Employees |
| Private Company Employees | 345 | 72.9% |
| Self-Employed (Incorporated) | 37 | 7.8% |
| Self-Employed (Not Incorporated) | 27 | 5.7% |
| Not-for-profit Organizations | 35 | 7.4% |
| Local Government Employees | 29 | 6.1% |
| State Government Employees | 0 | 0.0% |
| Federal Government Employees | 0 | 0.0% |
| Unpaid Family Workers | 0 | 0.0% |
| Total | 473 | 100.0% |
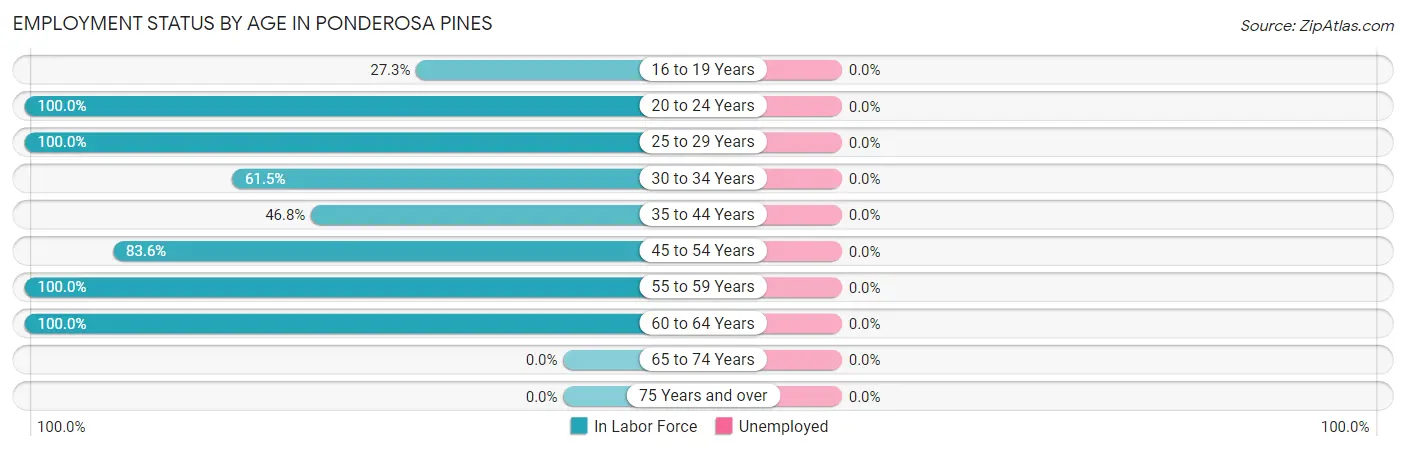
Employment Status by Age in Ponderosa Pines
| Age Bracket | In Labor Force | Unemployed |
| 16 to 19 Years | 18 (27.3%) | 0 (0.0%) |
| 20 to 24 Years | 27 (100.0%) | 0 (0.0%) |
| 25 to 29 Years | 31 (100.0%) | 0 (0.0%) |
| 30 to 34 Years | 24 (61.5%) | 0 (0.0%) |
| 35 to 44 Years | 37 (46.8%) | 0 (0.0%) |
| 45 to 54 Years | 219 (83.6%) | 0 (0.0%) |
| 55 to 59 Years | 81 (100.0%) | 0 (0.0%) |
| 60 to 64 Years | 36 (100.0%) | 0 (0.0%) |
| 65 to 74 Years | 0 (0.0%) | 0 (0.0%) |
| 75 Years and over | 0 (0.0%) | 0 (0.0%) |
| Total | 473 (70.1%) | 0 (0.0%) |
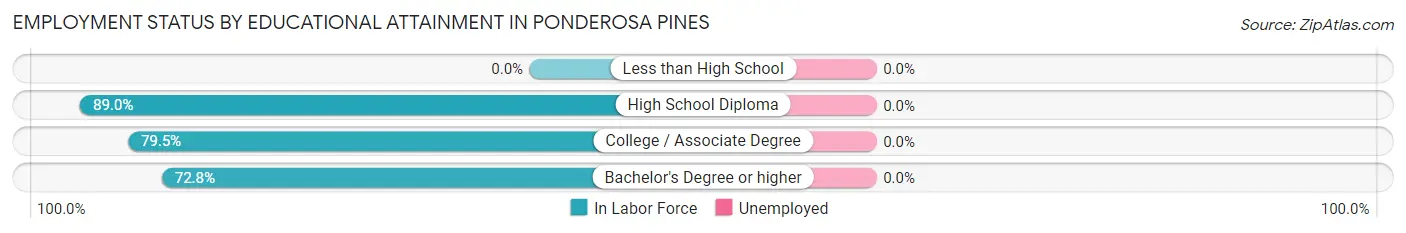
Employment Status by Educational Attainment in Ponderosa Pines
| Educational Attainment | In Labor Force | Unemployed |
| Less than High School | 0 (0.0%) | 0 (0.0%) |
| High School Diploma | 162 (89.0%) | 0 (0.0%) |
| College / Associate Degree | 167 (79.5%) | 0 (0.0%) |
| Bachelor's Degree or higher | 99 (72.8%) | 0 (0.0%) |
| Total | 428 (81.1%) | 0 (0.0%) |
Employment Occupations by Sex in Ponderosa Pines
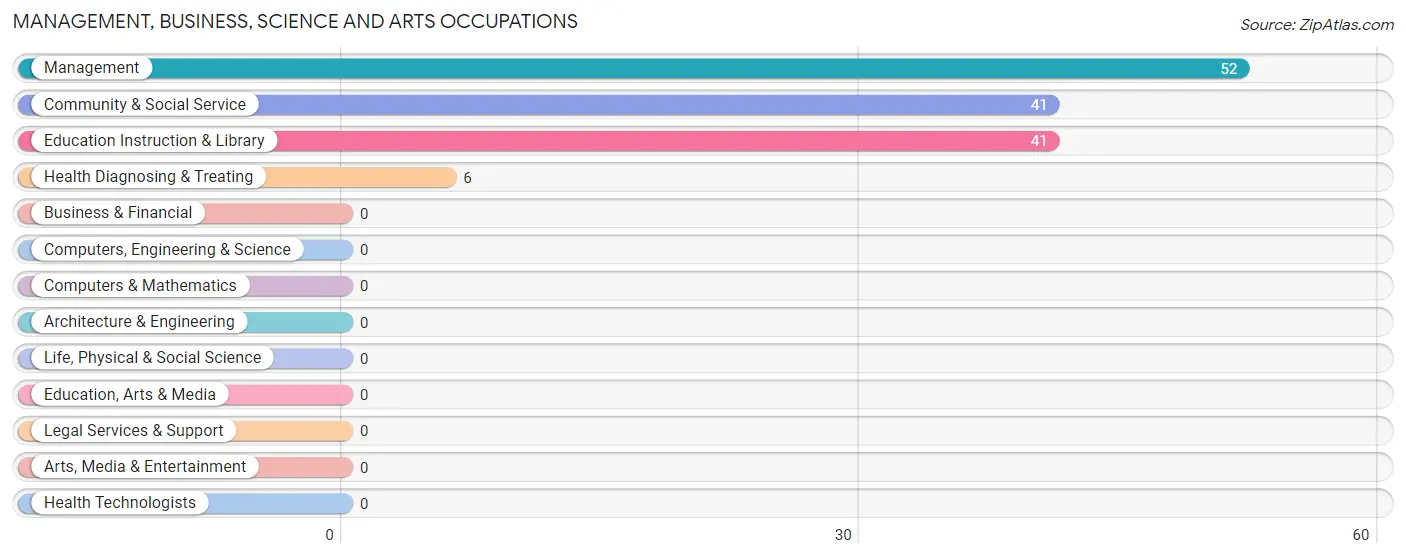
Management, Business, Science and Arts Occupations
The most common Management, Business, Science and Arts occupations in Ponderosa Pines are Management (52 | 11.0%), Community & Social Service (41 | 8.7%), Education Instruction & Library (41 | 8.7%), and Health Diagnosing & Treating (6 | 1.3%).
Management, Business, Science and Arts Occupations by Sex
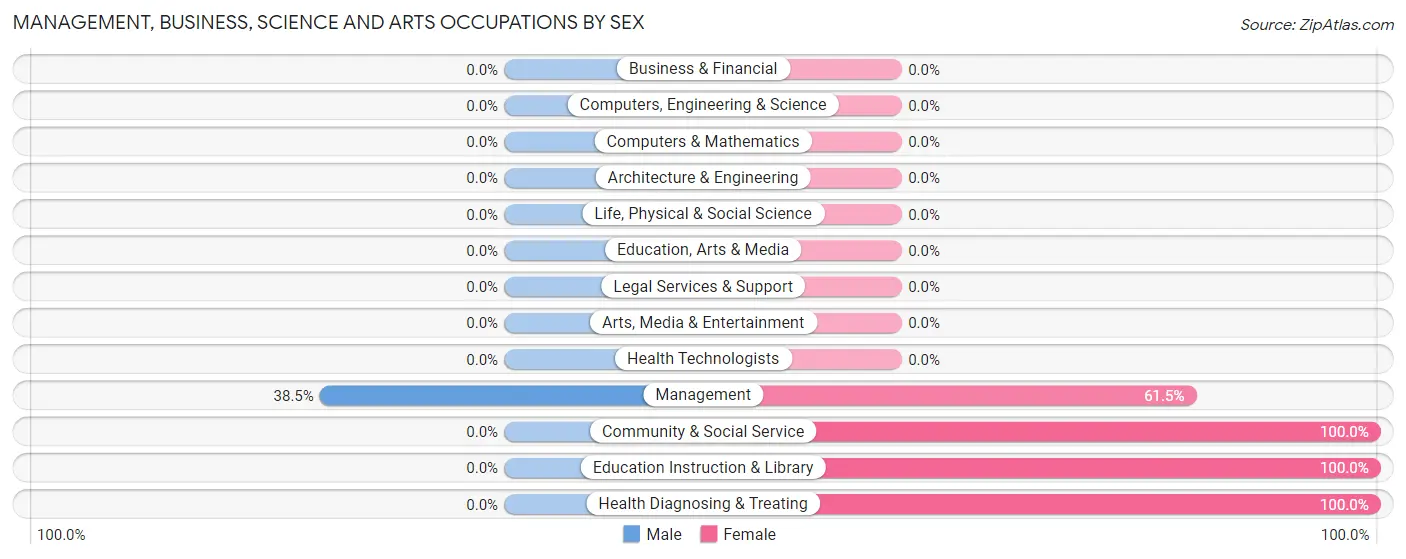
| Occupation | Male | Female |
| Management | 20 (38.5%) | 32 (61.5%) |
| Business & Financial | 0 (0.0%) | 0 (0.0%) |
| Computers, Engineering & Science | 0 (0.0%) | 0 (0.0%) |
| Computers & Mathematics | 0 (0.0%) | 0 (0.0%) |
| Architecture & Engineering | 0 (0.0%) | 0 (0.0%) |
| Life, Physical & Social Science | 0 (0.0%) | 0 (0.0%) |
| Community & Social Service | 0 (0.0%) | 41 (100.0%) |
| Education, Arts & Media | 0 (0.0%) | 0 (0.0%) |
| Legal Services & Support | 0 (0.0%) | 0 (0.0%) |
| Education Instruction & Library | 0 (0.0%) | 41 (100.0%) |
| Arts, Media & Entertainment | 0 (0.0%) | 0 (0.0%) |
| Health Diagnosing & Treating | 0 (0.0%) | 6 (100.0%) |
| Health Technologists | 0 (0.0%) | 0 (0.0%) |
| Total (Category) | 20 (20.2%) | 79 (79.8%) |
| Total (Overall) | 294 (62.2%) | 179 (37.8%) |
Services Occupations
The most common Services occupations in Ponderosa Pines are , and Food Preparation & Serving (18 | 3.8%).
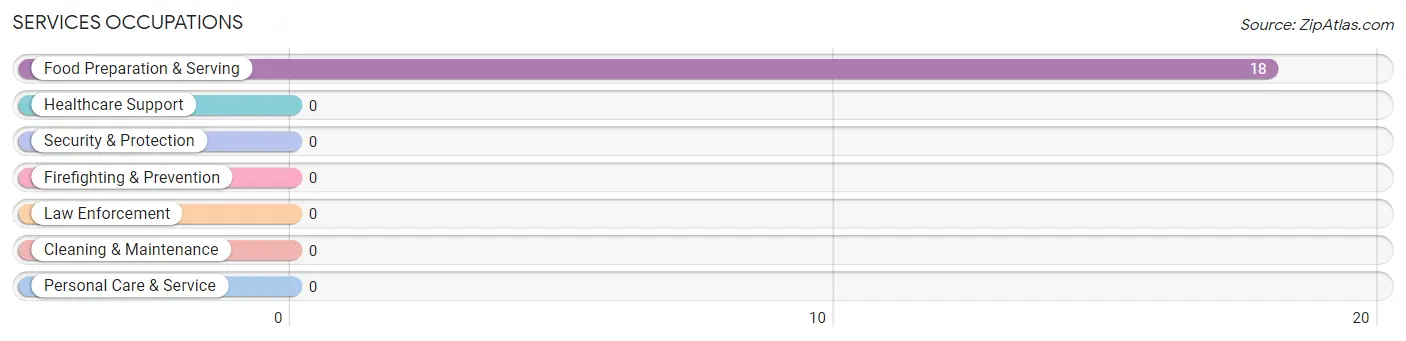
Services Occupations by Sex
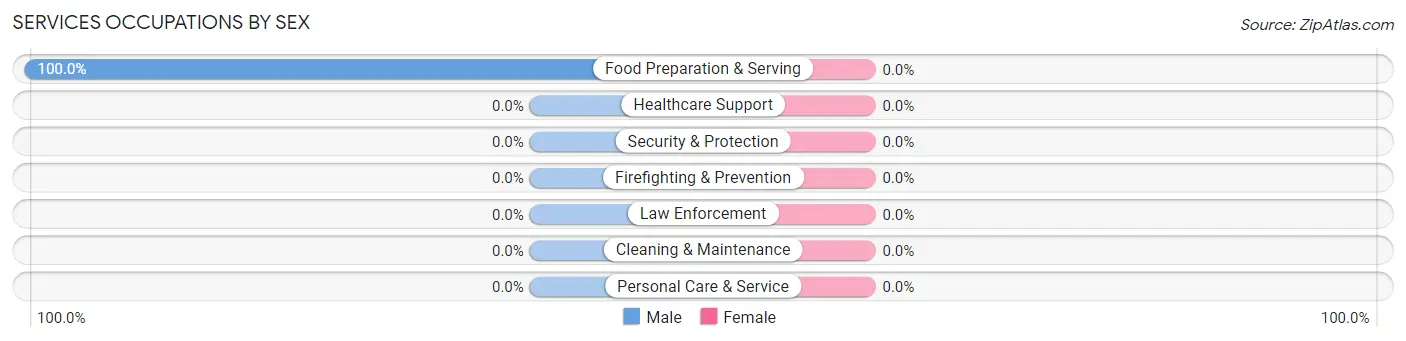
| Occupation | Male | Female |
| Healthcare Support | 0 (0.0%) | 0 (0.0%) |
| Security & Protection | 0 (0.0%) | 0 (0.0%) |
| Firefighting & Prevention | 0 (0.0%) | 0 (0.0%) |
| Law Enforcement | 0 (0.0%) | 0 (0.0%) |
| Food Preparation & Serving | 18 (100.0%) | 0 (0.0%) |
| Cleaning & Maintenance | 0 (0.0%) | 0 (0.0%) |
| Personal Care & Service | 0 (0.0%) | 0 (0.0%) |
| Total (Category) | 18 (100.0%) | 0 (0.0%) |
| Total (Overall) | 294 (62.2%) | 179 (37.8%) |
Sales and Office Occupations
The most common Sales and Office occupations in Ponderosa Pines are Sales & Related (54 | 11.4%), and Office & Administration (28 | 5.9%).
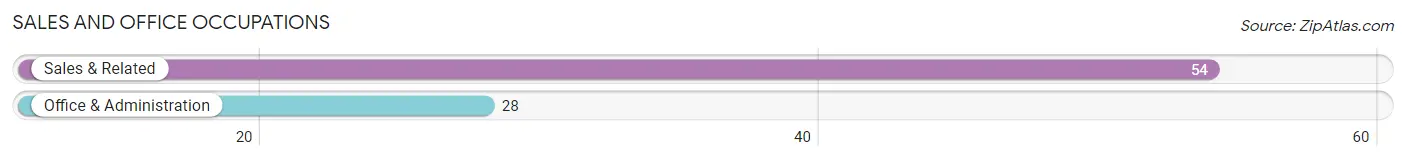
Sales and Office Occupations by Sex

| Occupation | Male | Female |
| Sales & Related | 44 (81.5%) | 10 (18.5%) |
| Office & Administration | 9 (32.1%) | 19 (67.9%) |
| Total (Category) | 53 (64.6%) | 29 (35.4%) |
| Total (Overall) | 294 (62.2%) | 179 (37.8%) |
Natural Resources, Construction and Maintenance Occupations
The most common Natural Resources, Construction and Maintenance occupations in Ponderosa Pines are , and Construction & Extraction (60 | 12.7%).
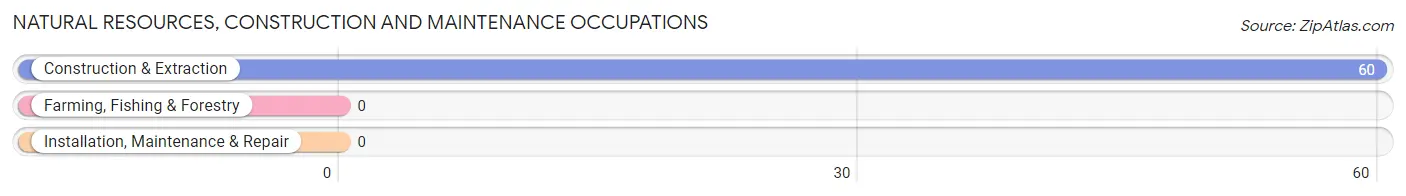
Natural Resources, Construction and Maintenance Occupations by Sex
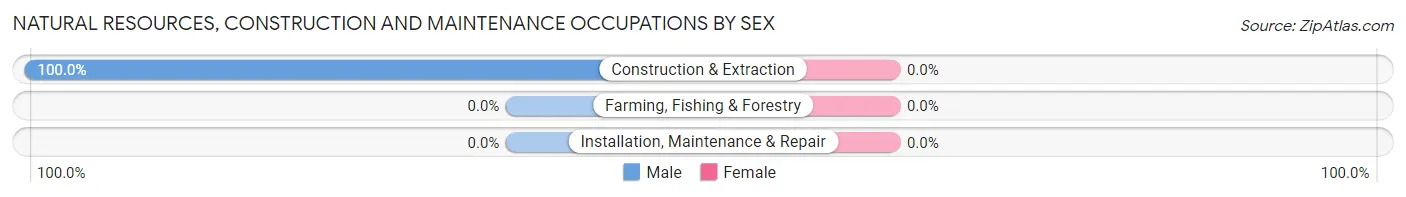
| Occupation | Male | Female |
| Farming, Fishing & Forestry | 0 (0.0%) | 0 (0.0%) |
| Construction & Extraction | 60 (100.0%) | 0 (0.0%) |
| Installation, Maintenance & Repair | 0 (0.0%) | 0 (0.0%) |
| Total (Category) | 60 (100.0%) | 0 (0.0%) |
| Total (Overall) | 294 (62.2%) | 179 (37.8%) |
Production, Transportation and Moving Occupations
The most common Production, Transportation and Moving occupations in Ponderosa Pines are Production (146 | 30.9%), Transportation (59 | 12.5%), and Material Moving (9 | 1.9%).
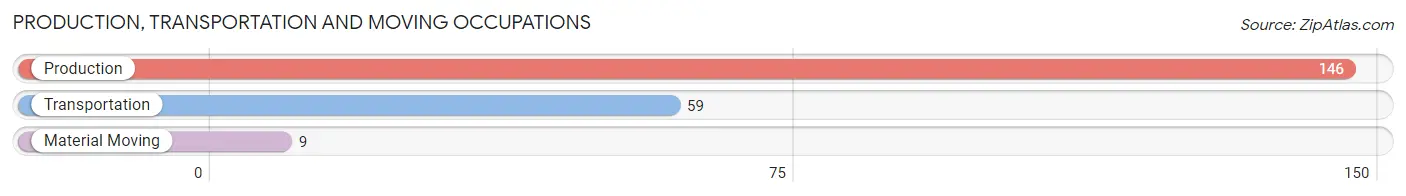
Production, Transportation and Moving Occupations by Sex
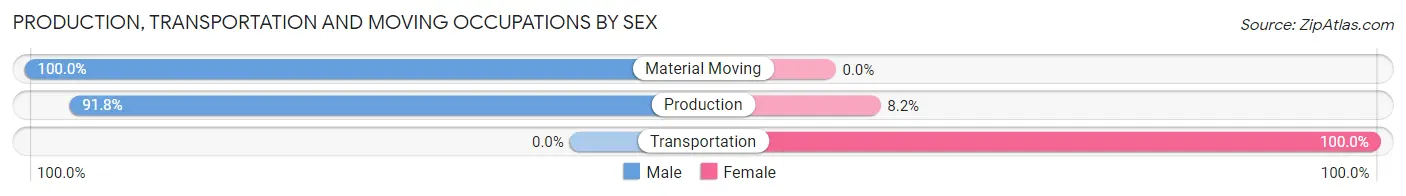
| Occupation | Male | Female |
| Production | 134 (91.8%) | 12 (8.2%) |
| Transportation | 0 (0.0%) | 59 (100.0%) |
| Material Moving | 9 (100.0%) | 0 (0.0%) |
| Total (Category) | 143 (66.8%) | 71 (33.2%) |
| Total (Overall) | 294 (62.2%) | 179 (37.8%) |
Employment Industries by Sex in Ponderosa Pines
Employment Industries in Ponderosa Pines
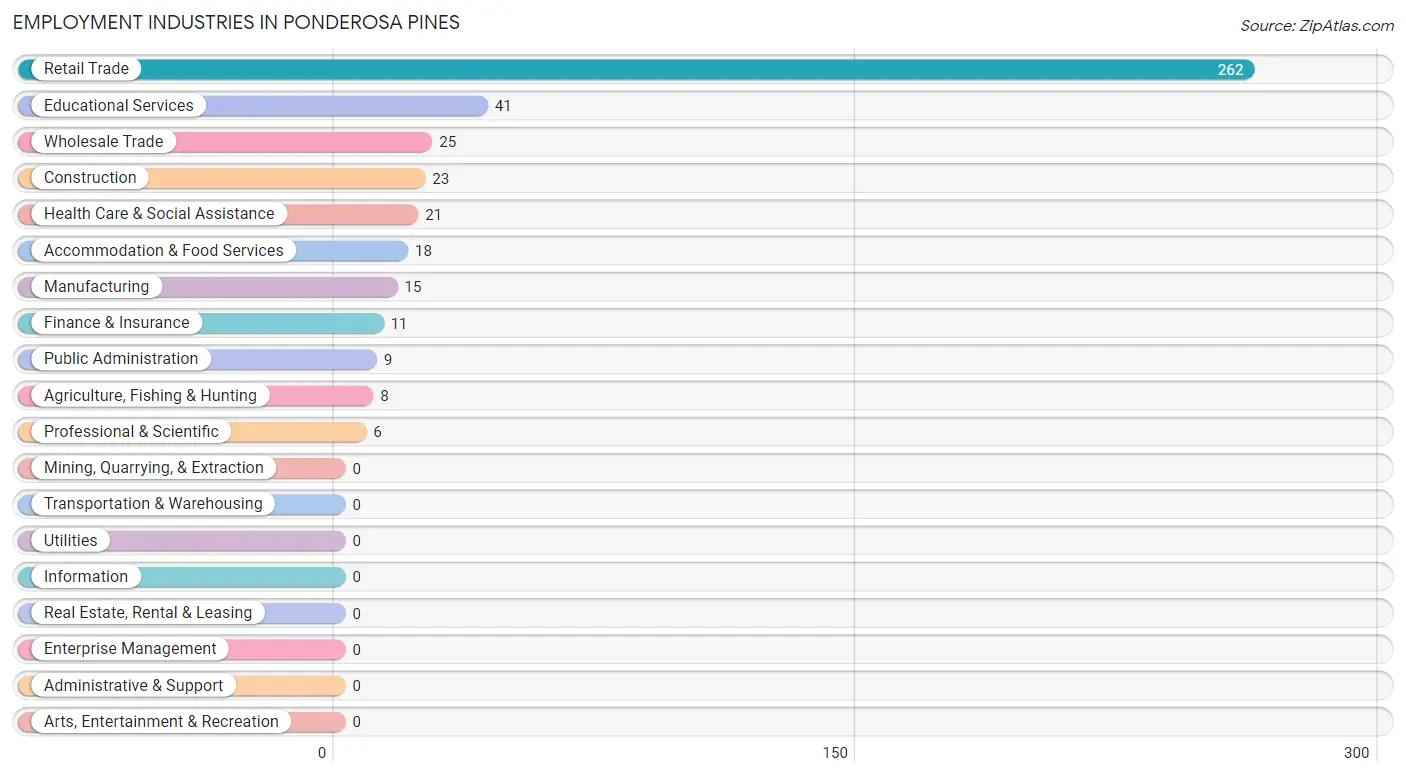
The major employment industries in Ponderosa Pines include Retail Trade (262 | 55.4%), Educational Services (41 | 8.7%), Wholesale Trade (25 | 5.3%), Construction (23 | 4.9%), and Health Care & Social Assistance (21 | 4.4%).
Employment Industries by Sex in Ponderosa Pines
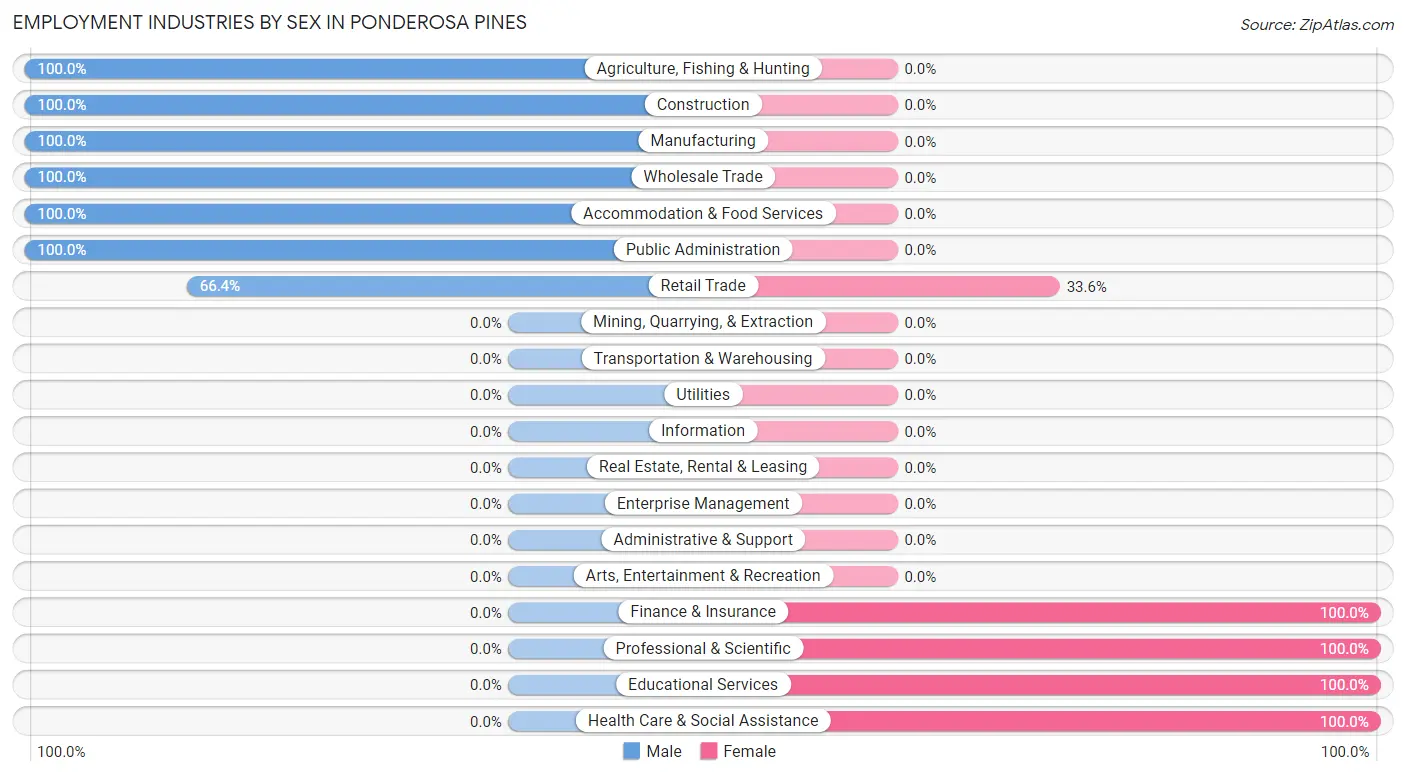
The Ponderosa Pines industries that see more men than women are Agriculture, Fishing & Hunting (100.0%), Construction (100.0%), and Manufacturing (100.0%), whereas the industries that tend to have a higher number of women are Finance & Insurance (100.0%), Professional & Scientific (100.0%), and Educational Services (100.0%).
| Industry | Male | Female |
| Agriculture, Fishing & Hunting | 8 (100.0%) | 0 (0.0%) |
| Mining, Quarrying, & Extraction | 0 (0.0%) | 0 (0.0%) |
| Construction | 23 (100.0%) | 0 (0.0%) |
| Manufacturing | 15 (100.0%) | 0 (0.0%) |
| Wholesale Trade | 25 (100.0%) | 0 (0.0%) |
| Retail Trade | 174 (66.4%) | 88 (33.6%) |
| Transportation & Warehousing | 0 (0.0%) | 0 (0.0%) |
| Utilities | 0 (0.0%) | 0 (0.0%) |
| Information | 0 (0.0%) | 0 (0.0%) |
| Finance & Insurance | 0 (0.0%) | 11 (100.0%) |
| Real Estate, Rental & Leasing | 0 (0.0%) | 0 (0.0%) |
| Professional & Scientific | 0 (0.0%) | 6 (100.0%) |
| Enterprise Management | 0 (0.0%) | 0 (0.0%) |
| Administrative & Support | 0 (0.0%) | 0 (0.0%) |
| Educational Services | 0 (0.0%) | 41 (100.0%) |
| Health Care & Social Assistance | 0 (0.0%) | 21 (100.0%) |
| Arts, Entertainment & Recreation | 0 (0.0%) | 0 (0.0%) |
| Accommodation & Food Services | 18 (100.0%) | 0 (0.0%) |
| Public Administration | 9 (100.0%) | 0 (0.0%) |
| Total | 294 (62.2%) | 179 (37.8%) |
Education in Ponderosa Pines
School Enrollment in Ponderosa Pines
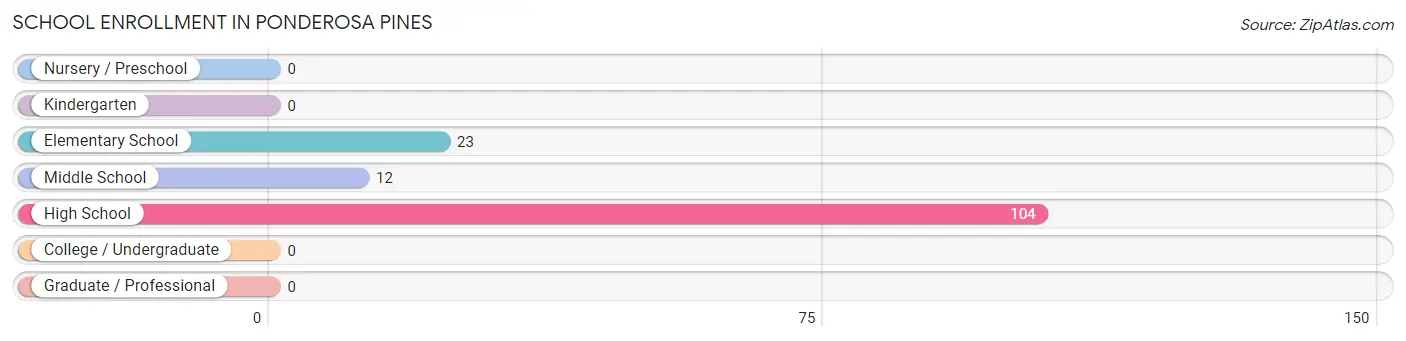
The most common levels of schooling among the 139 students in Ponderosa Pines are high school (104 | 74.8%), elementary school (23 | 16.6%), and middle school (12 | 8.6%).
| School Level | # Students | % Students |
| Nursery / Preschool | 0 | 0.0% |
| Kindergarten | 0 | 0.0% |
| Elementary School | 23 | 16.6% |
| Middle School | 12 | 8.6% |
| High School | 104 | 74.8% |
| College / Undergraduate | 0 | 0.0% |
| Graduate / Professional | 0 | 0.0% |
| Total | 139 | 100.0% |
School Enrollment by Age by Funding Source in Ponderosa Pines
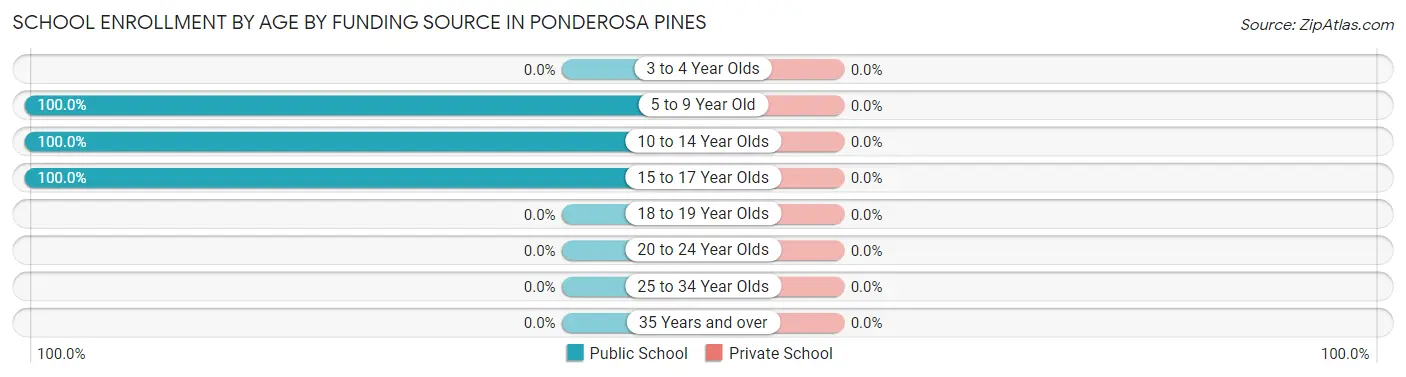
| Age Bracket | Public School | Private School |
| 3 to 4 Year Olds | 0 (0.0%) | 0 (0.0%) |
| 5 to 9 Year Old | 23 (100.0%) | 0 (0.0%) |
| 10 to 14 Year Olds | 12 (100.0%) | 0 (0.0%) |
| 15 to 17 Year Olds | 104 (100.0%) | 0 (0.0%) |
| 18 to 19 Year Olds | 0 (0.0%) | 0 (0.0%) |
| 20 to 24 Year Olds | 0 (0.0%) | 0 (0.0%) |
| 25 to 34 Year Olds | 0 (0.0%) | 0 (0.0%) |
| 35 Years and over | 0 (0.0%) | 0 (0.0%) |
| Total | 139 (100.0%) | 0 (0.0%) |
Educational Attainment by Field of Study in Ponderosa Pines
Business (57 | 41.9%), psychology (44 | 32.4%), physical & health sciences (20 | 14.7%), and social sciences (15 | 11.0%) are the most common fields of study among 136 individuals in Ponderosa Pines who have obtained a bachelor's degree or higher.
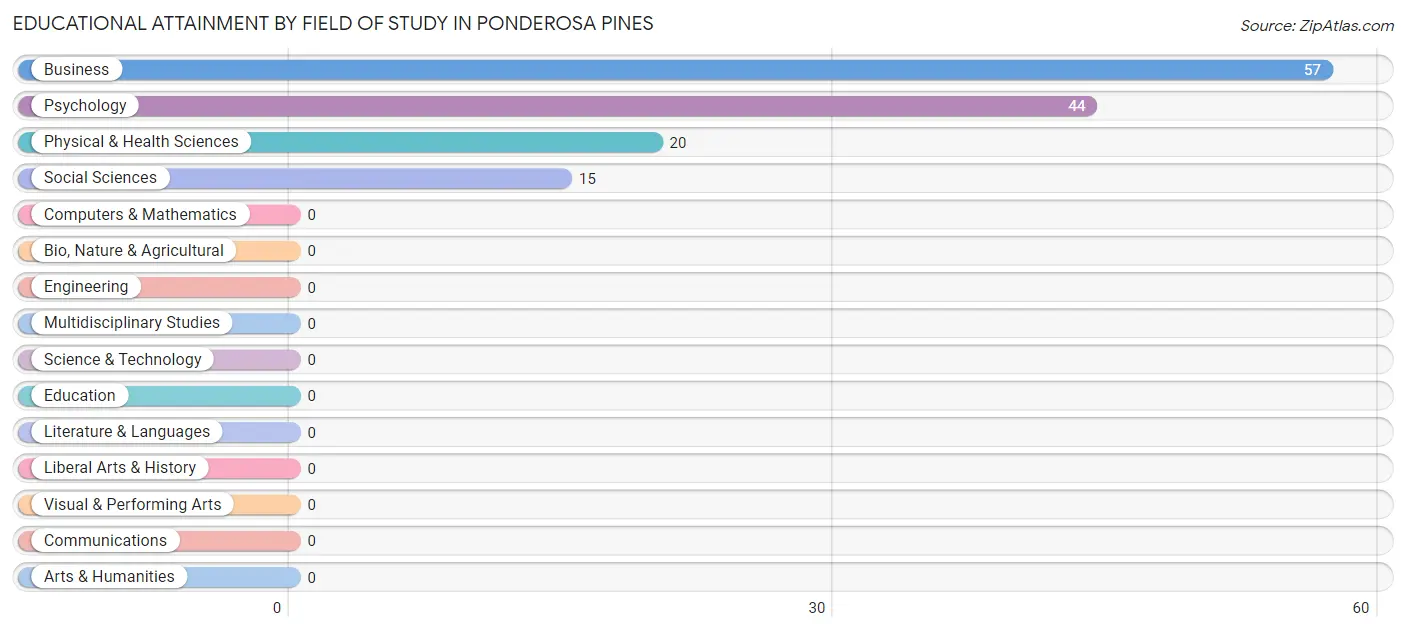
| Field of Study | # Graduates | % Graduates |
| Computers & Mathematics | 0 | 0.0% |
| Bio, Nature & Agricultural | 0 | 0.0% |
| Physical & Health Sciences | 20 | 14.7% |
| Psychology | 44 | 32.4% |
| Social Sciences | 15 | 11.0% |
| Engineering | 0 | 0.0% |
| Multidisciplinary Studies | 0 | 0.0% |
| Science & Technology | 0 | 0.0% |
| Business | 57 | 41.9% |
| Education | 0 | 0.0% |
| Literature & Languages | 0 | 0.0% |
| Liberal Arts & History | 0 | 0.0% |
| Visual & Performing Arts | 0 | 0.0% |
| Communications | 0 | 0.0% |
| Arts & Humanities | 0 | 0.0% |
| Total | 136 | 100.0% |
Transportation & Commute in Ponderosa Pines
Vehicle Availability by Sex in Ponderosa Pines
The most prevalent vehicle ownership categories in Ponderosa Pines are males with 3 vehicles (143, accounting for 48.6%) and females with 3 vehicles (114, making up 79.9%).
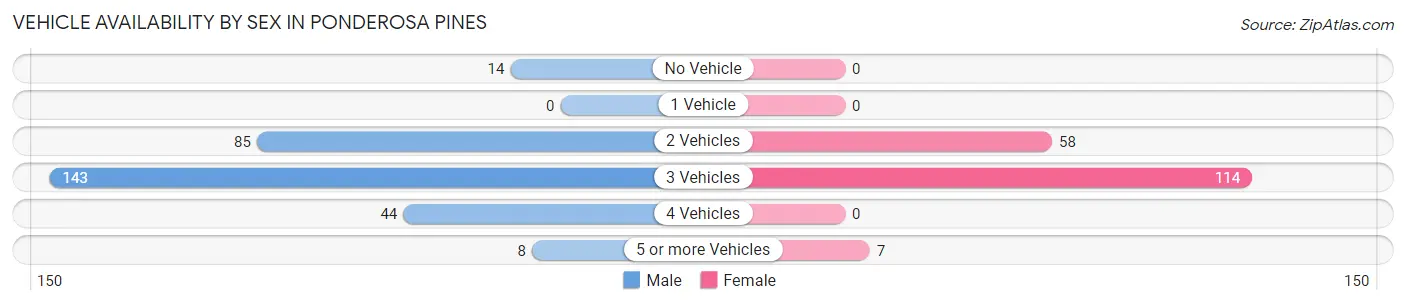
| Vehicles Available | Male | Female |
| No Vehicle | 14 (4.8%) | 0 (0.0%) |
| 1 Vehicle | 0 (0.0%) | 0 (0.0%) |
| 2 Vehicles | 85 (28.9%) | 58 (32.4%) |
| 3 Vehicles | 143 (48.6%) | 114 (63.7%) |
| 4 Vehicles | 44 (15.0%) | 0 (0.0%) |
| 5 or more Vehicles | 8 (2.7%) | 7 (3.9%) |
| Total | 294 (100.0%) | 179 (100.0%) |
Commute Time in Ponderosa Pines
The most frequently occuring commute durations in Ponderosa Pines are 45 to 59 minutes (213 commuters, 48.7%), 30 to 34 minutes (71 commuters, 16.3%), and 60 to 89 minutes (55 commuters, 12.6%).
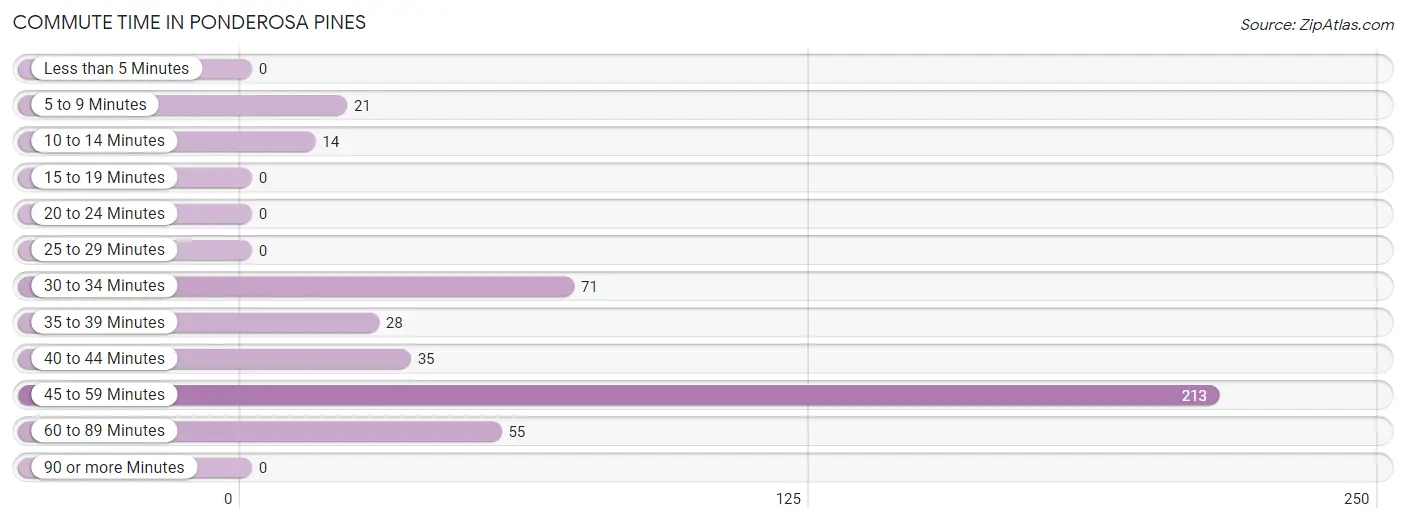
| Commute Time | # Commuters | % Commuters |
| Less than 5 Minutes | 0 | 0.0% |
| 5 to 9 Minutes | 21 | 4.8% |
| 10 to 14 Minutes | 14 | 3.2% |
| 15 to 19 Minutes | 0 | 0.0% |
| 20 to 24 Minutes | 0 | 0.0% |
| 25 to 29 Minutes | 0 | 0.0% |
| 30 to 34 Minutes | 71 | 16.3% |
| 35 to 39 Minutes | 28 | 6.4% |
| 40 to 44 Minutes | 35 | 8.0% |
| 45 to 59 Minutes | 213 | 48.7% |
| 60 to 89 Minutes | 55 | 12.6% |
| 90 or more Minutes | 0 | 0.0% |
Commute Time by Sex in Ponderosa Pines
The most common commute times in Ponderosa Pines are 45 to 59 minutes (194 commuters, 69.5%) for males and 30 to 34 minutes (71 commuters, 44.9%) for females.
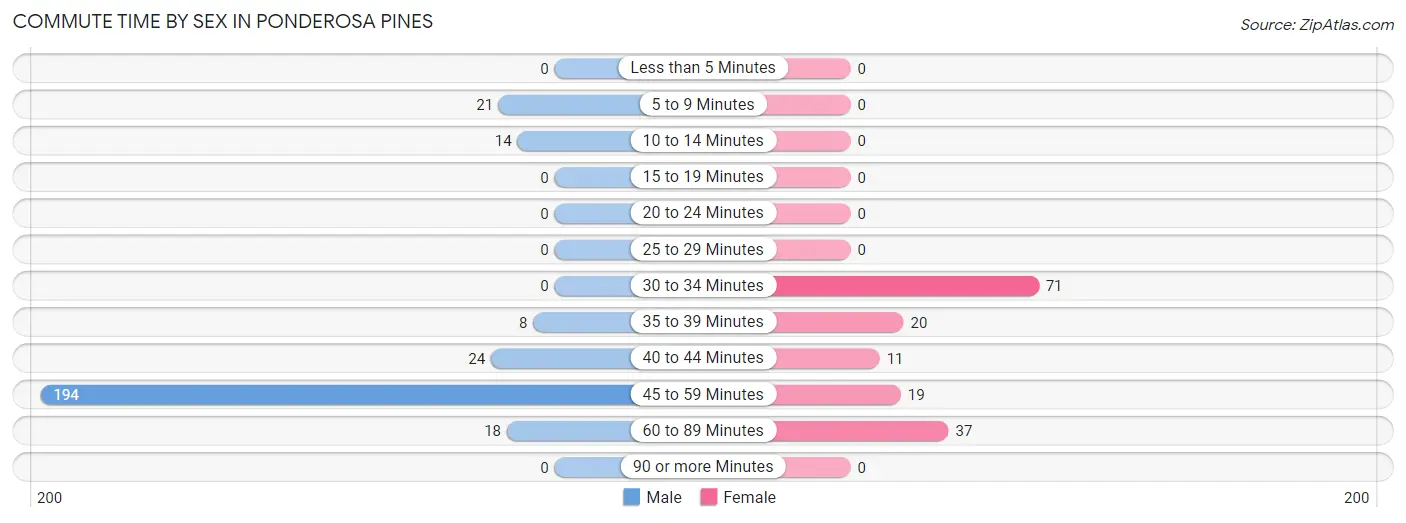
| Commute Time | Male | Female |
| Less than 5 Minutes | 0 (0.0%) | 0 (0.0%) |
| 5 to 9 Minutes | 21 (7.5%) | 0 (0.0%) |
| 10 to 14 Minutes | 14 (5.0%) | 0 (0.0%) |
| 15 to 19 Minutes | 0 (0.0%) | 0 (0.0%) |
| 20 to 24 Minutes | 0 (0.0%) | 0 (0.0%) |
| 25 to 29 Minutes | 0 (0.0%) | 0 (0.0%) |
| 30 to 34 Minutes | 0 (0.0%) | 71 (44.9%) |
| 35 to 39 Minutes | 8 (2.9%) | 20 (12.7%) |
| 40 to 44 Minutes | 24 (8.6%) | 11 (7.0%) |
| 45 to 59 Minutes | 194 (69.5%) | 19 (12.0%) |
| 60 to 89 Minutes | 18 (6.5%) | 37 (23.4%) |
| 90 or more Minutes | 0 (0.0%) | 0 (0.0%) |
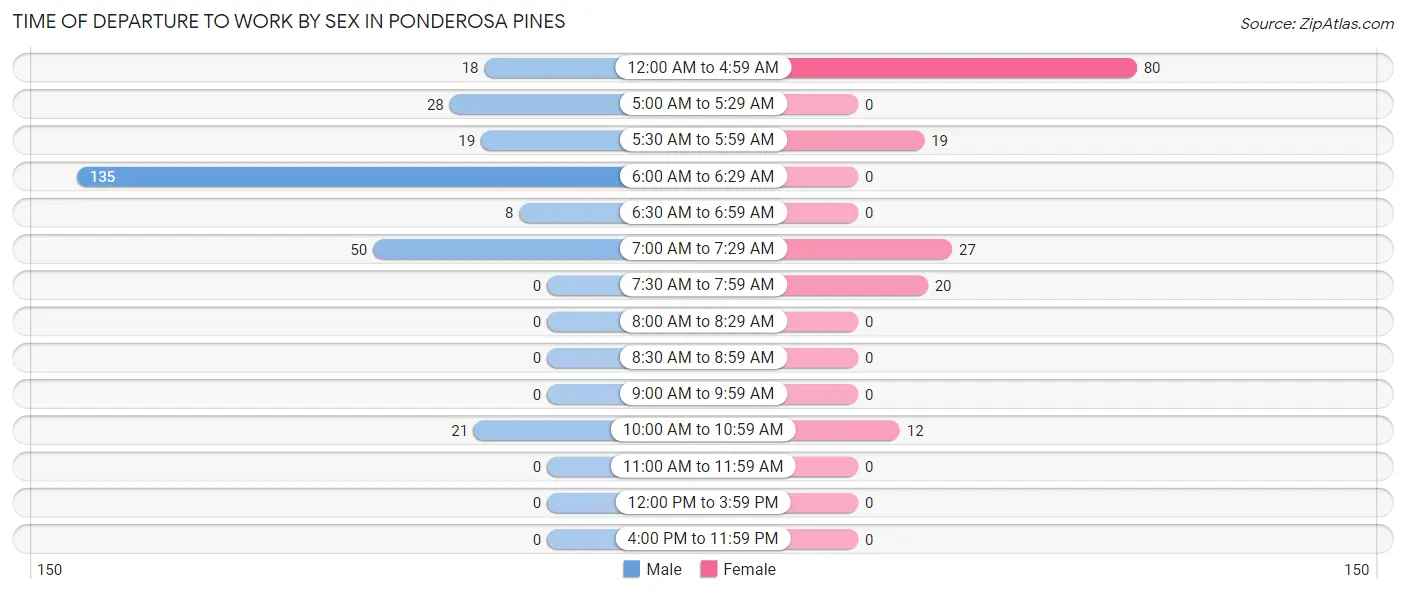
Time of Departure to Work by Sex in Ponderosa Pines
The most frequent times of departure to work in Ponderosa Pines are 6:00 AM to 6:29 AM (135, 48.4%) for males and 12:00 AM to 4:59 AM (80, 50.6%) for females.
| Time of Departure | Male | Female |
| 12:00 AM to 4:59 AM | 18 (6.5%) | 80 (50.6%) |
| 5:00 AM to 5:29 AM | 28 (10.0%) | 0 (0.0%) |
| 5:30 AM to 5:59 AM | 19 (6.8%) | 19 (12.0%) |
| 6:00 AM to 6:29 AM | 135 (48.4%) | 0 (0.0%) |
| 6:30 AM to 6:59 AM | 8 (2.9%) | 0 (0.0%) |
| 7:00 AM to 7:29 AM | 50 (17.9%) | 27 (17.1%) |
| 7:30 AM to 7:59 AM | 0 (0.0%) | 20 (12.7%) |
| 8:00 AM to 8:29 AM | 0 (0.0%) | 0 (0.0%) |
| 8:30 AM to 8:59 AM | 0 (0.0%) | 0 (0.0%) |
| 9:00 AM to 9:59 AM | 0 (0.0%) | 0 (0.0%) |
| 10:00 AM to 10:59 AM | 21 (7.5%) | 12 (7.6%) |
| 11:00 AM to 11:59 AM | 0 (0.0%) | 0 (0.0%) |
| 12:00 PM to 3:59 PM | 0 (0.0%) | 0 (0.0%) |
| 4:00 PM to 11:59 PM | 0 (0.0%) | 0 (0.0%) |
| Total | 279 (100.0%) | 158 (100.0%) |
Housing Occupancy in Ponderosa Pines
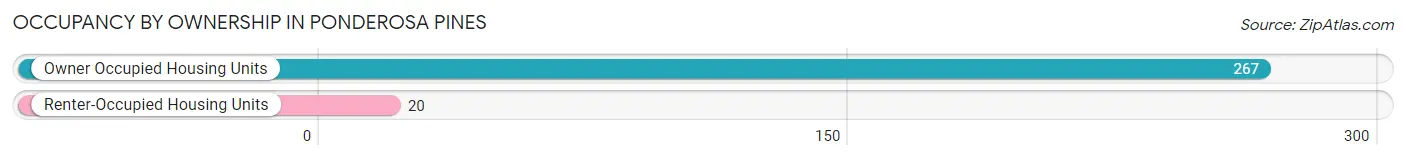
Occupancy by Ownership in Ponderosa Pines
Of the total 287 dwellings in Ponderosa Pines, owner-occupied units account for 267 (93.0%), while renter-occupied units make up 20 (7.0%).
| Occupancy | # Housing Units | % Housing Units |
| Owner Occupied Housing Units | 267 | 93.0% |
| Renter-Occupied Housing Units | 20 | 7.0% |
| Total Occupied Housing Units | 287 | 100.0% |
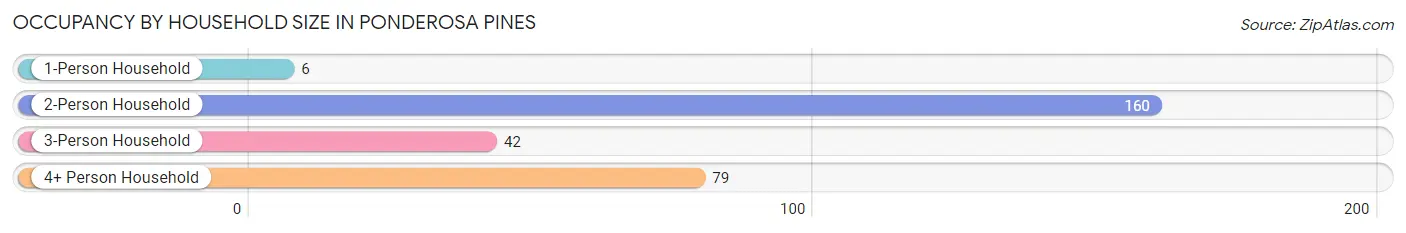
Occupancy by Household Size in Ponderosa Pines
| Household Size | # Housing Units | % Housing Units |
| 1-Person Household | 6 | 2.1% |
| 2-Person Household | 160 | 55.7% |
| 3-Person Household | 42 | 14.6% |
| 4+ Person Household | 79 | 27.5% |
| Total Housing Units | 287 | 100.0% |
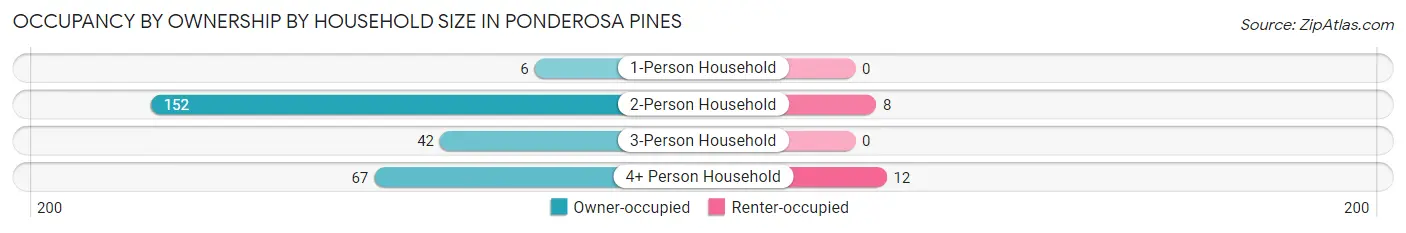
Occupancy by Ownership by Household Size in Ponderosa Pines
| Household Size | Owner-occupied | Renter-occupied |
| 1-Person Household | 6 (100.0%) | 0 (0.0%) |
| 2-Person Household | 152 (95.0%) | 8 (5.0%) |
| 3-Person Household | 42 (100.0%) | 0 (0.0%) |
| 4+ Person Household | 67 (84.8%) | 12 (15.2%) |
| Total Housing Units | 267 (93.0%) | 20 (7.0%) |
Occupancy by Educational Attainment in Ponderosa Pines
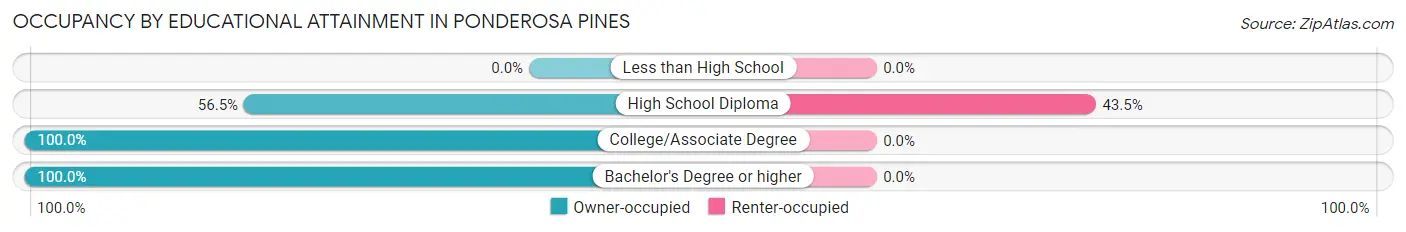
| Household Size | Owner-occupied | Renter-occupied |
| Less than High School | 0 (0.0%) | 0 (0.0%) |
| High School Diploma | 26 (56.5%) | 20 (43.5%) |
| College/Associate Degree | 154 (100.0%) | 0 (0.0%) |
| Bachelor's Degree or higher | 87 (100.0%) | 0 (0.0%) |
Occupancy by Age of Householder in Ponderosa Pines
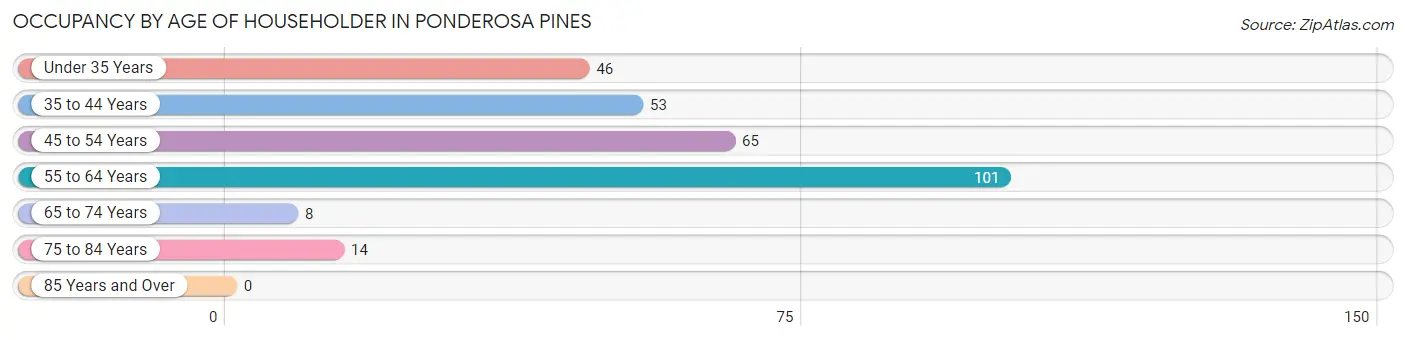
| Age Bracket | # Households | % Households |
| Under 35 Years | 46 | 16.0% |
| 35 to 44 Years | 53 | 18.5% |
| 45 to 54 Years | 65 | 22.7% |
| 55 to 64 Years | 101 | 35.2% |
| 65 to 74 Years | 8 | 2.8% |
| 75 to 84 Years | 14 | 4.9% |
| 85 Years and Over | 0 | 0.0% |
| Total | 287 | 100.0% |
Housing Finances in Ponderosa Pines
Median Income by Occupancy in Ponderosa Pines
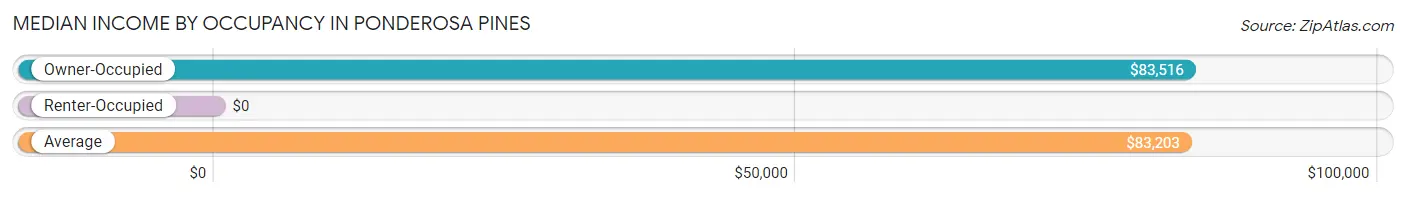
| Occupancy Type | # Households | Median Income |
| Owner-Occupied | 267 (93.0%) | $83,516 |
| Renter-Occupied | 20 (7.0%) | $0 |
| Average | 287 (100.0%) | $83,203 |
Occupancy by Householder Income Bracket in Ponderosa Pines
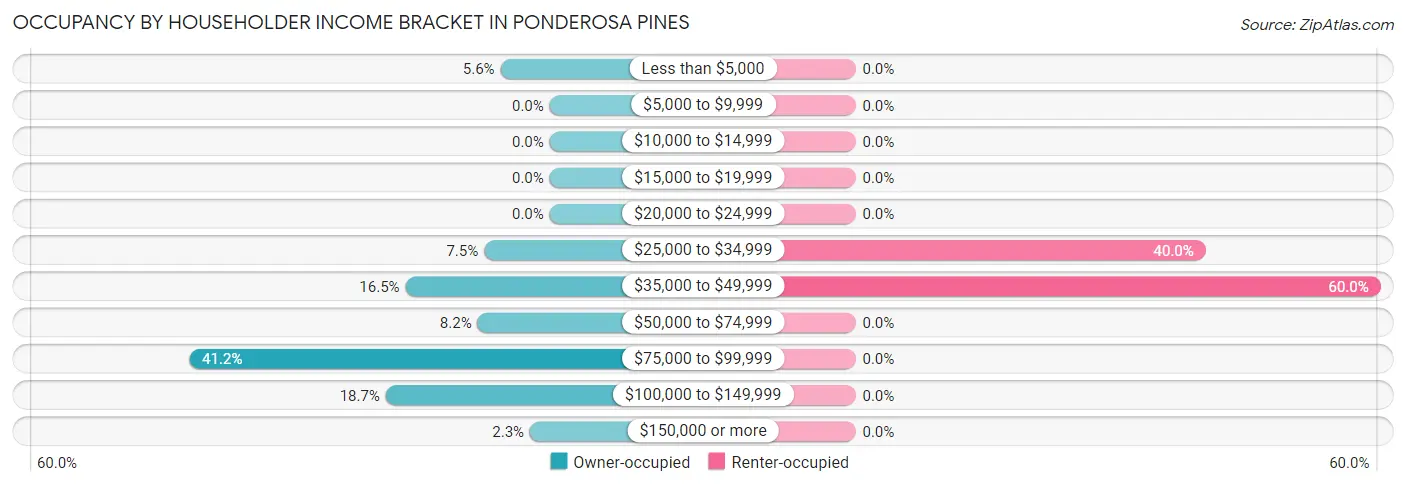
| Income Bracket | Owner-occupied | Renter-occupied |
| Less than $5,000 | 15 (5.6%) | 0 (0.0%) |
| $5,000 to $9,999 | 0 (0.0%) | 0 (0.0%) |
| $10,000 to $14,999 | 0 (0.0%) | 0 (0.0%) |
| $15,000 to $19,999 | 0 (0.0%) | 0 (0.0%) |
| $20,000 to $24,999 | 0 (0.0%) | 0 (0.0%) |
| $25,000 to $34,999 | 20 (7.5%) | 8 (40.0%) |
| $35,000 to $49,999 | 44 (16.5%) | 12 (60.0%) |
| $50,000 to $74,999 | 22 (8.2%) | 0 (0.0%) |
| $75,000 to $99,999 | 110 (41.2%) | 0 (0.0%) |
| $100,000 to $149,999 | 50 (18.7%) | 0 (0.0%) |
| $150,000 or more | 6 (2.2%) | 0 (0.0%) |
| Total | 267 (100.0%) | 20 (100.0%) |
Monthly Housing Cost Tiers in Ponderosa Pines
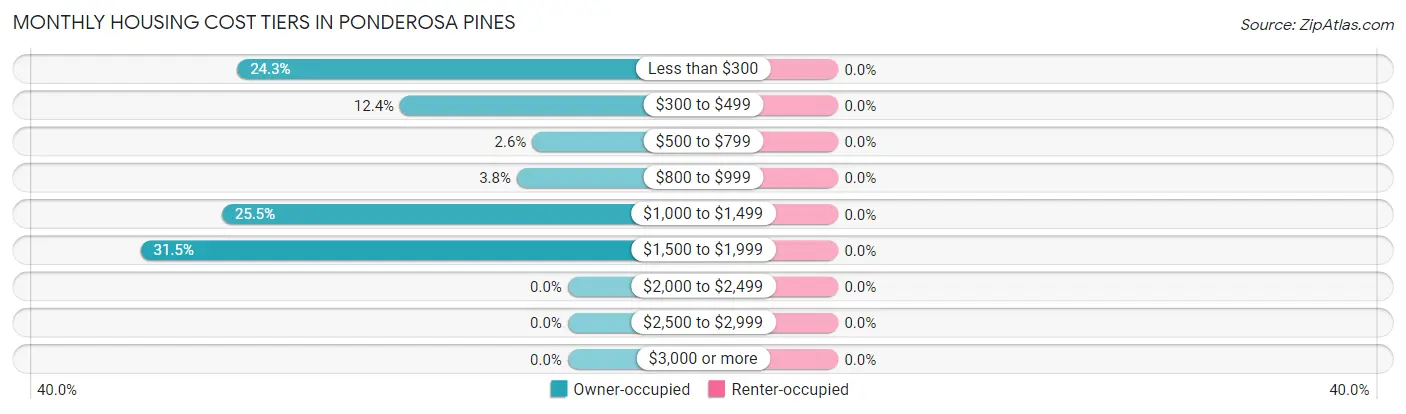
| Monthly Cost | Owner-occupied | Renter-occupied |
| Less than $300 | 65 (24.3%) | 0 (0.0%) |
| $300 to $499 | 33 (12.4%) | 0 (0.0%) |
| $500 to $799 | 7 (2.6%) | 0 (0.0%) |
| $800 to $999 | 10 (3.7%) | 0 (0.0%) |
| $1,000 to $1,499 | 68 (25.5%) | 0 (0.0%) |
| $1,500 to $1,999 | 84 (31.5%) | 0 (0.0%) |
| $2,000 to $2,499 | 0 (0.0%) | 0 (0.0%) |
| $2,500 to $2,999 | 0 (0.0%) | 0 (0.0%) |
| $3,000 or more | 0 (0.0%) | 0 (0.0%) |
| Total | 267 (100.0%) | 20 (100.0%) |
Physical Housing Characteristics in Ponderosa Pines
Housing Structures in Ponderosa Pines
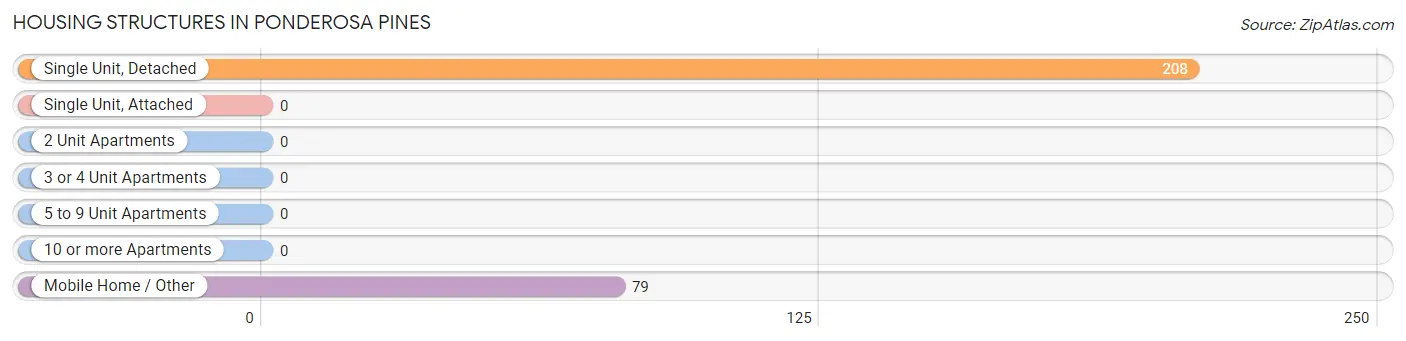
| Structure Type | # Housing Units | % Housing Units |
| Single Unit, Detached | 208 | 72.5% |
| Single Unit, Attached | 0 | 0.0% |
| 2 Unit Apartments | 0 | 0.0% |
| 3 or 4 Unit Apartments | 0 | 0.0% |
| 5 to 9 Unit Apartments | 0 | 0.0% |
| 10 or more Apartments | 0 | 0.0% |
| Mobile Home / Other | 79 | 27.5% |
| Total | 287 | 100.0% |
Housing Structures by Occupancy in Ponderosa Pines
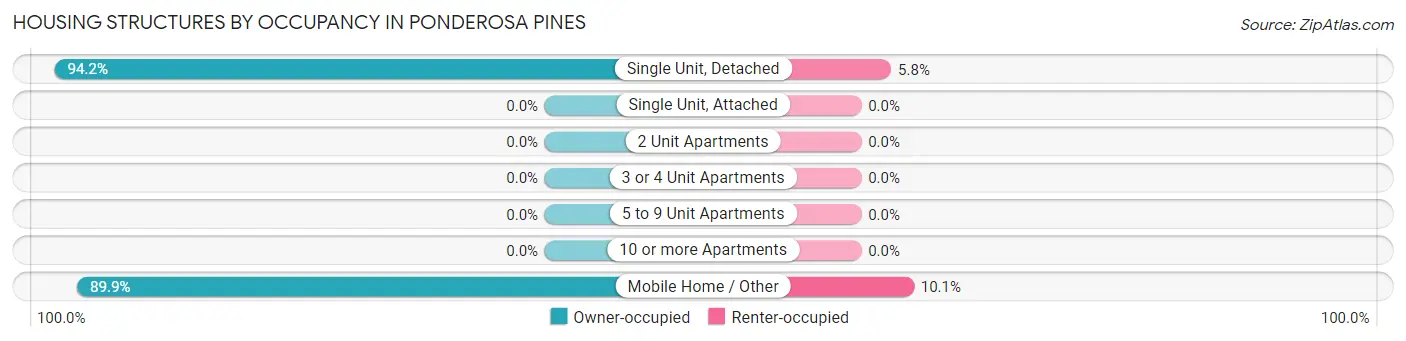
| Structure Type | Owner-occupied | Renter-occupied |
| Single Unit, Detached | 196 (94.2%) | 12 (5.8%) |
| Single Unit, Attached | 0 (0.0%) | 0 (0.0%) |
| 2 Unit Apartments | 0 (0.0%) | 0 (0.0%) |
| 3 or 4 Unit Apartments | 0 (0.0%) | 0 (0.0%) |
| 5 to 9 Unit Apartments | 0 (0.0%) | 0 (0.0%) |
| 10 or more Apartments | 0 (0.0%) | 0 (0.0%) |
| Mobile Home / Other | 71 (89.9%) | 8 (10.1%) |
| Total | 267 (93.0%) | 20 (7.0%) |
Housing Structures by Number of Rooms in Ponderosa Pines
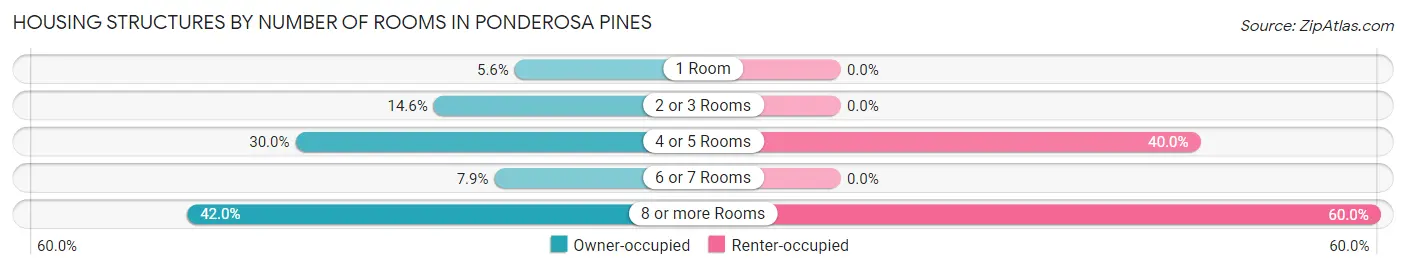
| Number of Rooms | Owner-occupied | Renter-occupied |
| 1 Room | 15 (5.6%) | 0 (0.0%) |
| 2 or 3 Rooms | 39 (14.6%) | 0 (0.0%) |
| 4 or 5 Rooms | 80 (30.0%) | 8 (40.0%) |
| 6 or 7 Rooms | 21 (7.9%) | 0 (0.0%) |
| 8 or more Rooms | 112 (41.9%) | 12 (60.0%) |
| Total | 267 (100.0%) | 20 (100.0%) |
Housing Structure by Heating Type in Ponderosa Pines
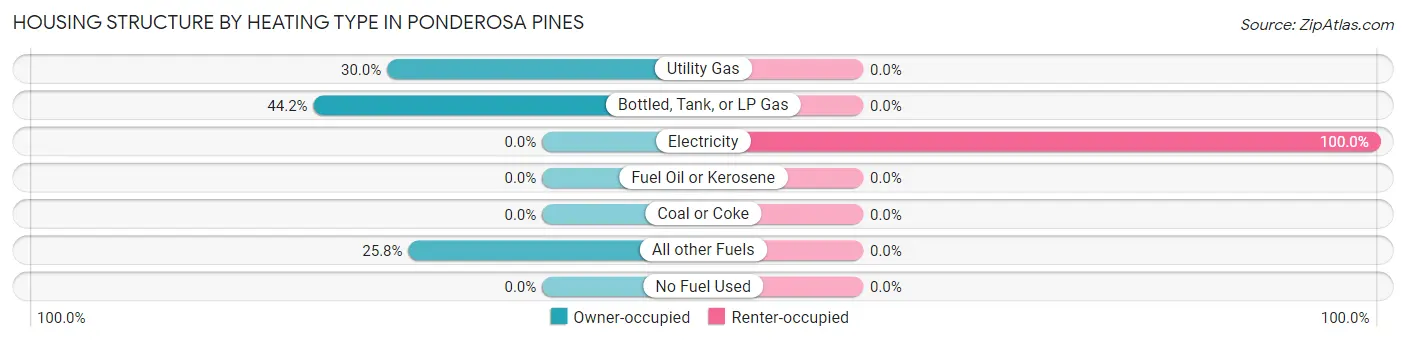
| Heating Type | Owner-occupied | Renter-occupied |
| Utility Gas | 80 (30.0%) | 0 (0.0%) |
| Bottled, Tank, or LP Gas | 118 (44.2%) | 0 (0.0%) |
| Electricity | 0 (0.0%) | 20 (100.0%) |
| Fuel Oil or Kerosene | 0 (0.0%) | 0 (0.0%) |
| Coal or Coke | 0 (0.0%) | 0 (0.0%) |
| All other Fuels | 69 (25.8%) | 0 (0.0%) |
| No Fuel Used | 0 (0.0%) | 0 (0.0%) |
| Total | 267 (100.0%) | 20 (100.0%) |
Household Vehicle Usage in Ponderosa Pines
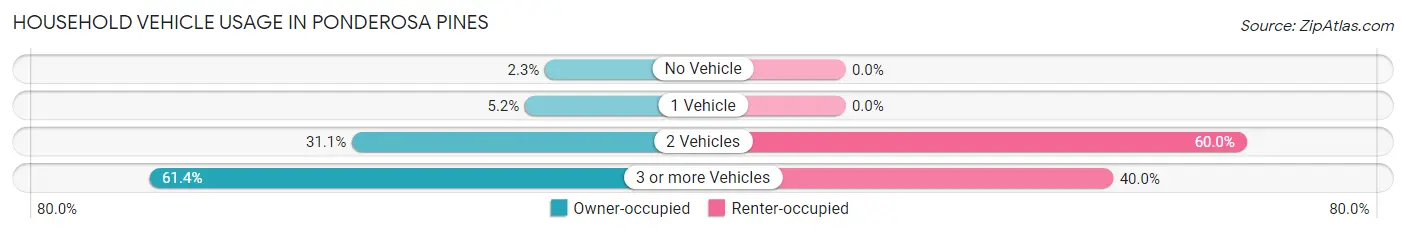
| Vehicles per Household | Owner-occupied | Renter-occupied |
| No Vehicle | 6 (2.2%) | 0 (0.0%) |
| 1 Vehicle | 14 (5.2%) | 0 (0.0%) |
| 2 Vehicles | 83 (31.1%) | 12 (60.0%) |
| 3 or more Vehicles | 164 (61.4%) | 8 (40.0%) |
| Total | 267 (100.0%) | 20 (100.0%) |
Real Estate & Mortgages in Ponderosa Pines
Real Estate and Mortgage Overview in Ponderosa Pines
| Characteristic | Without Mortgage | With Mortgage |
| Housing Units | 130 | 137 |
| Median Property Value | $116,400 | $293,300 |
| Median Household Income | $83,432 | $0 |
| Monthly Housing Costs | $300 | $0 |
| Real Estate Taxes | $1,770 | $0 |
Property Value by Mortgage Status in Ponderosa Pines
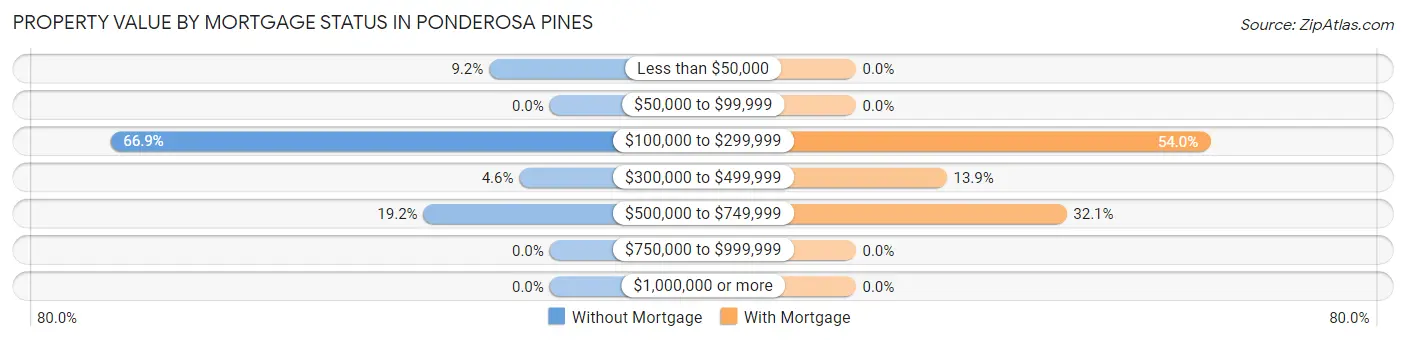
| Property Value | Without Mortgage | With Mortgage |
| Less than $50,000 | 12 (9.2%) | 0 (0.0%) |
| $50,000 to $99,999 | 0 (0.0%) | 0 (0.0%) |
| $100,000 to $299,999 | 87 (66.9%) | 74 (54.0%) |
| $300,000 to $499,999 | 6 (4.6%) | 19 (13.9%) |
| $500,000 to $749,999 | 25 (19.2%) | 44 (32.1%) |
| $750,000 to $999,999 | 0 (0.0%) | 0 (0.0%) |
| $1,000,000 or more | 0 (0.0%) | 0 (0.0%) |
| Total | 130 (100.0%) | 137 (100.0%) |
Household Income by Mortgage Status in Ponderosa Pines
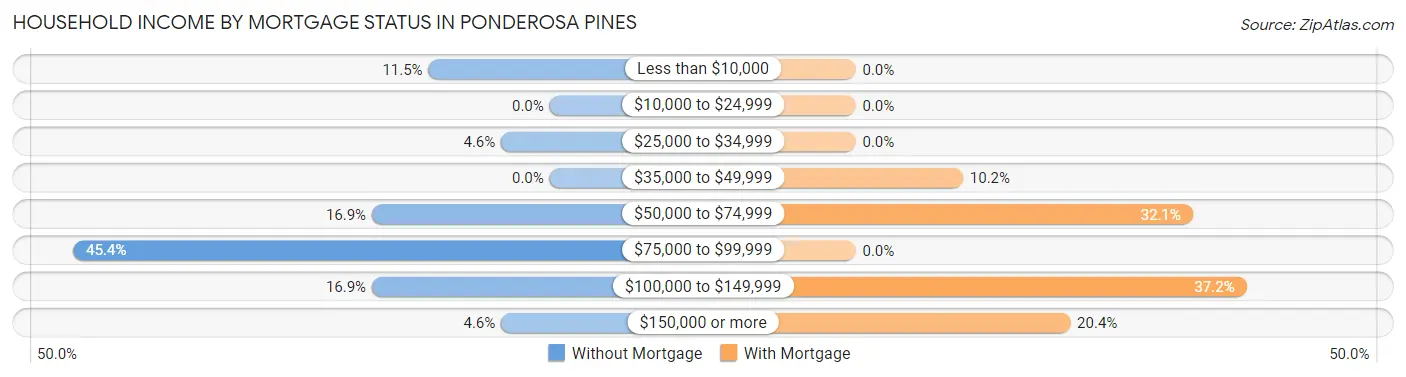
| Household Income | Without Mortgage | With Mortgage |
| Less than $10,000 | 15 (11.5%) | 0 (0.0%) |
| $10,000 to $24,999 | 0 (0.0%) | 0 (0.0%) |
| $25,000 to $34,999 | 6 (4.6%) | 0 (0.0%) |
| $35,000 to $49,999 | 0 (0.0%) | 14 (10.2%) |
| $50,000 to $74,999 | 22 (16.9%) | 44 (32.1%) |
| $75,000 to $99,999 | 59 (45.4%) | 0 (0.0%) |
| $100,000 to $149,999 | 22 (16.9%) | 51 (37.2%) |
| $150,000 or more | 6 (4.6%) | 28 (20.4%) |
| Total | 130 (100.0%) | 137 (100.0%) |
Property Value to Household Income Ratio in Ponderosa Pines
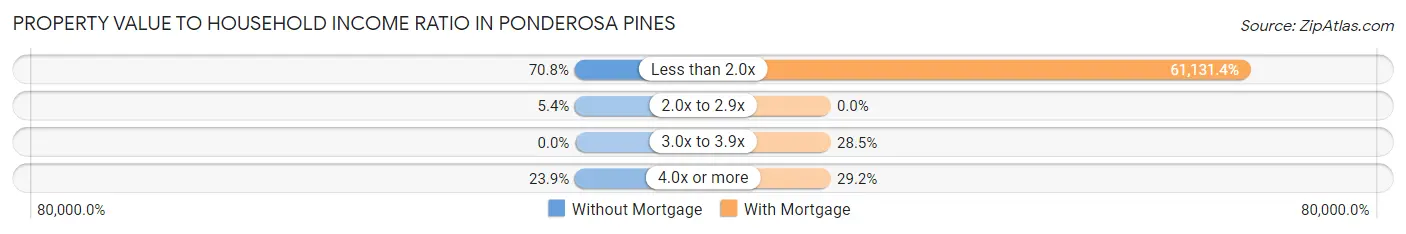
| Value-to-Income Ratio | Without Mortgage | With Mortgage |
| Less than 2.0x | 92 (70.8%) | 83,750 (61,131.4%) |
| 2.0x to 2.9x | 7 (5.4%) | 0 (0.0%) |
| 3.0x to 3.9x | 0 (0.0%) | 39 (28.5%) |
| 4.0x or more | 31 (23.8%) | 40 (29.2%) |
| Total | 130 (100.0%) | 137 (100.0%) |
Real Estate Taxes by Mortgage Status in Ponderosa Pines
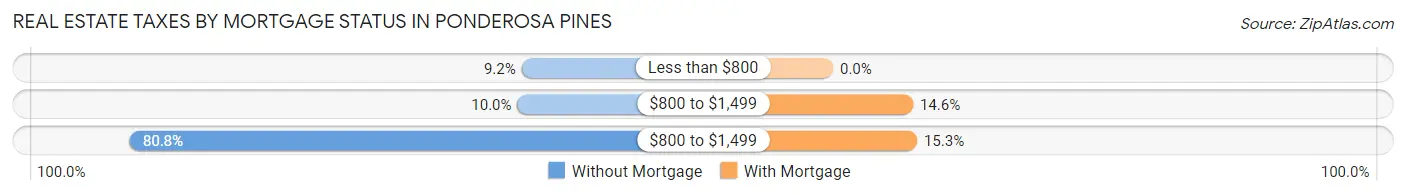
| Property Taxes | Without Mortgage | With Mortgage |
| Less than $800 | 12 (9.2%) | 0 (0.0%) |
| $800 to $1,499 | 13 (10.0%) | 20 (14.6%) |
| $800 to $1,499 | 105 (80.8%) | 21 (15.3%) |
| Total | 130 (100.0%) | 137 (100.0%) |
Health & Disability in Ponderosa Pines
Health Insurance Coverage by Age in Ponderosa Pines
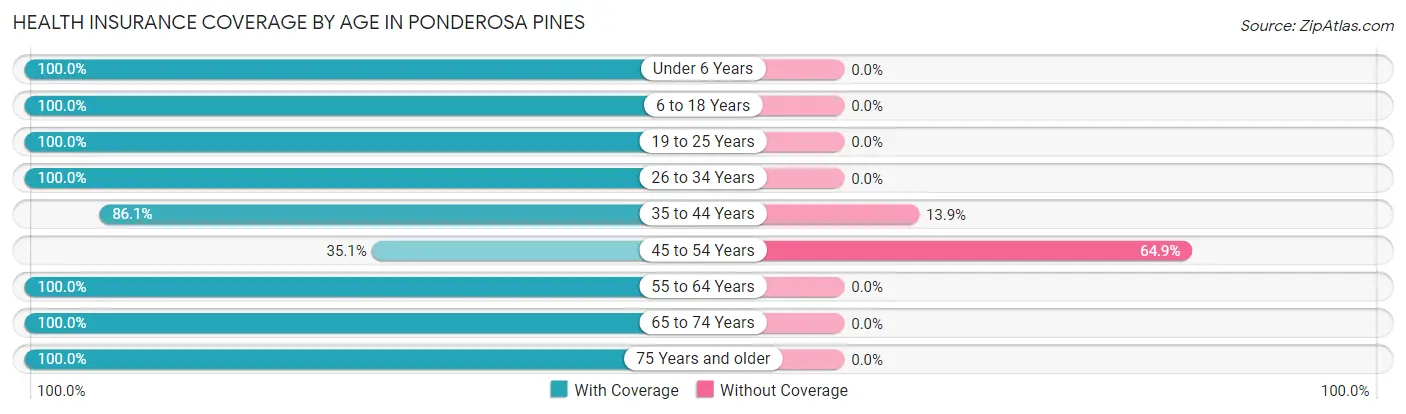
| Age Bracket | With Coverage | Without Coverage |
| Under 6 Years | 93 (100.0%) | 0 (0.0%) |
| 6 to 18 Years | 139 (100.0%) | 0 (0.0%) |
| 19 to 25 Years | 27 (100.0%) | 0 (0.0%) |
| 26 to 34 Years | 70 (100.0%) | 0 (0.0%) |
| 35 to 44 Years | 68 (86.1%) | 11 (13.9%) |
| 45 to 54 Years | 92 (35.1%) | 170 (64.9%) |
| 55 to 64 Years | 117 (100.0%) | 0 (0.0%) |
| 65 to 74 Years | 28 (100.0%) | 0 (0.0%) |
| 75 Years and older | 26 (100.0%) | 0 (0.0%) |
| Total | 660 (78.5%) | 181 (21.5%) |
Health Insurance Coverage by Citizenship Status in Ponderosa Pines
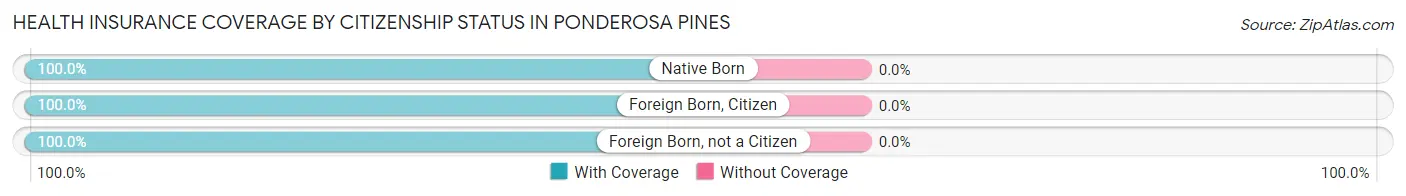
| Citizenship Status | With Coverage | Without Coverage |
| Native Born | 93 (100.0%) | 0 (0.0%) |
| Foreign Born, Citizen | 139 (100.0%) | 0 (0.0%) |
| Foreign Born, not a Citizen | 27 (100.0%) | 0 (0.0%) |
Health Insurance Coverage by Household Income in Ponderosa Pines
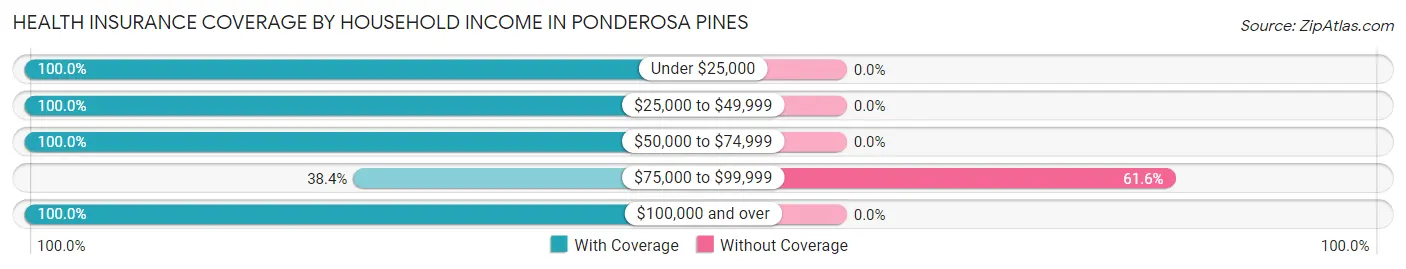
| Household Income | With Coverage | Without Coverage |
| Under $25,000 | 30 (100.0%) | 0 (0.0%) |
| $25,000 to $49,999 | 282 (100.0%) | 0 (0.0%) |
| $50,000 to $74,999 | 74 (100.0%) | 0 (0.0%) |
| $75,000 to $99,999 | 113 (38.4%) | 181 (61.6%) |
| $100,000 and over | 161 (100.0%) | 0 (0.0%) |
Public vs Private Health Insurance Coverage by Age in Ponderosa Pines
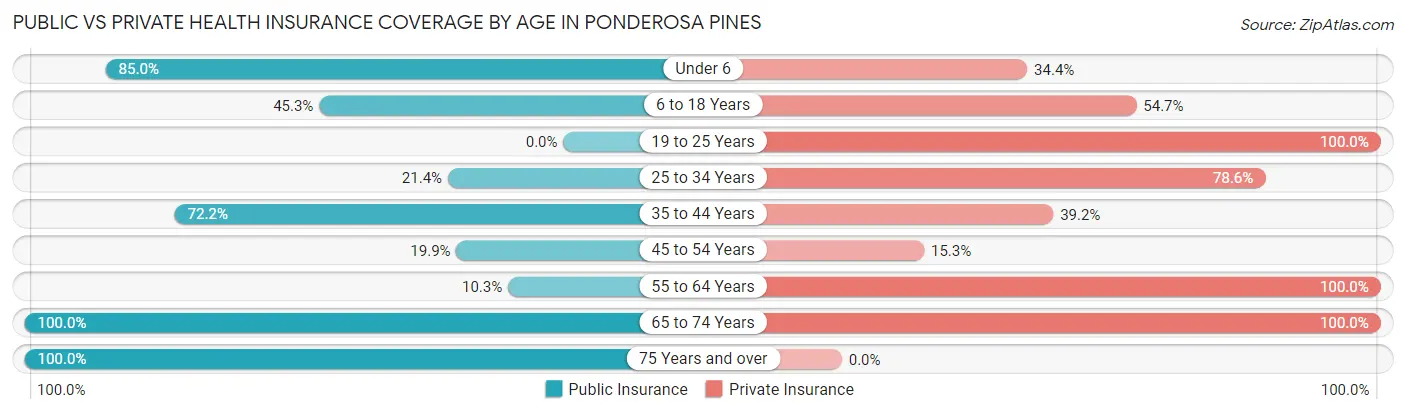
| Age Bracket | Public Insurance | Private Insurance |
| Under 6 | 79 (85.0%) | 32 (34.4%) |
| 6 to 18 Years | 63 (45.3%) | 76 (54.7%) |
| 19 to 25 Years | 0 (0.0%) | 27 (100.0%) |
| 25 to 34 Years | 15 (21.4%) | 55 (78.6%) |
| 35 to 44 Years | 57 (72.2%) | 31 (39.2%) |
| 45 to 54 Years | 52 (19.9%) | 40 (15.3%) |
| 55 to 64 Years | 12 (10.3%) | 117 (100.0%) |
| 65 to 74 Years | 28 (100.0%) | 28 (100.0%) |
| 75 Years and over | 26 (100.0%) | 0 (0.0%) |
| Total | 332 (39.5%) | 406 (48.3%) |
Disability Status by Sex by Age in Ponderosa Pines
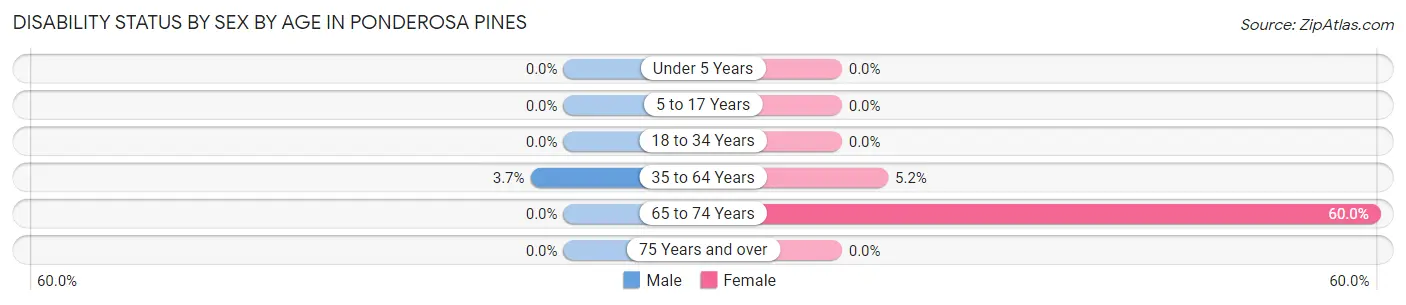
| Age Bracket | Male | Female |
| Under 5 Years | 0 (0.0%) | 0 (0.0%) |
| 5 to 17 Years | 0 (0.0%) | 0 (0.0%) |
| 18 to 34 Years | 0 (0.0%) | 0 (0.0%) |
| 35 to 64 Years | 9 (3.7%) | 11 (5.2%) |
| 65 to 74 Years | 0 (0.0%) | 12 (60.0%) |
| 75 Years and over | 0 (0.0%) | 0 (0.0%) |
Disability Class by Sex by Age in Ponderosa Pines
Disability Class: Hearing Difficulty
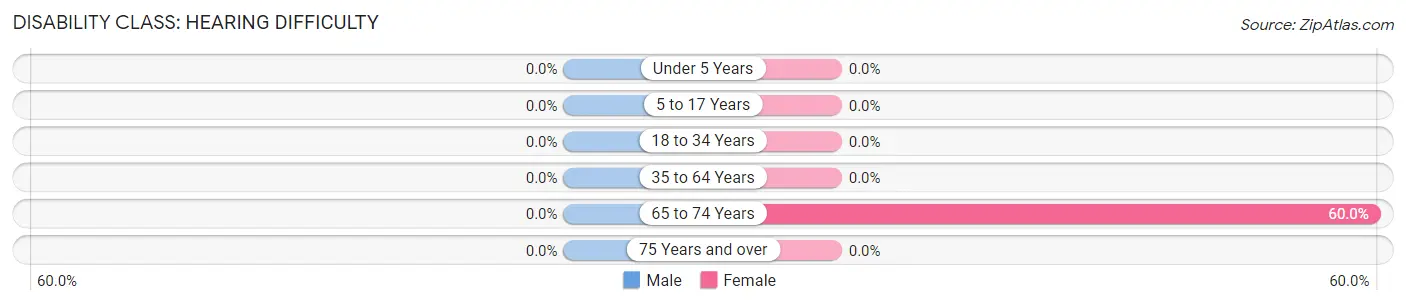
| Age Bracket | Male | Female |
| Under 5 Years | 0 (0.0%) | 0 (0.0%) |
| 5 to 17 Years | 0 (0.0%) | 0 (0.0%) |
| 18 to 34 Years | 0 (0.0%) | 0 (0.0%) |
| 35 to 64 Years | 0 (0.0%) | 0 (0.0%) |
| 65 to 74 Years | 0 (0.0%) | 12 (60.0%) |
| 75 Years and over | 0 (0.0%) | 0 (0.0%) |
Disability Class: Vision Difficulty
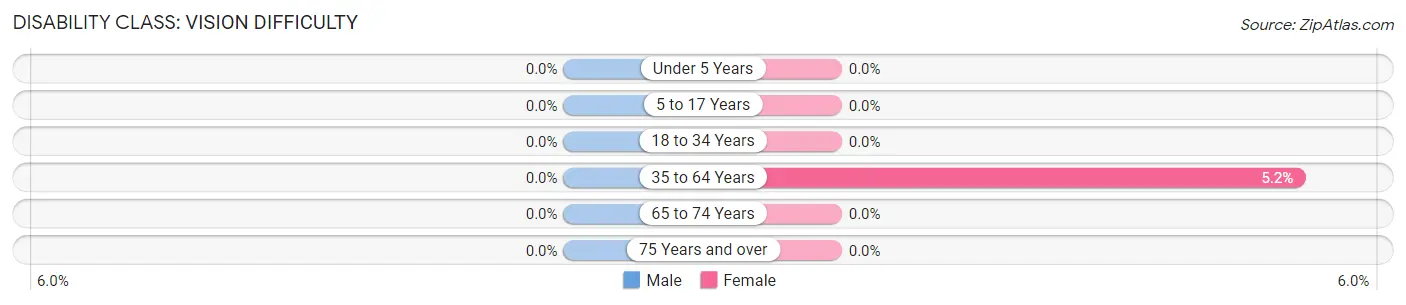
| Age Bracket | Male | Female |
| Under 5 Years | 0 (0.0%) | 0 (0.0%) |
| 5 to 17 Years | 0 (0.0%) | 0 (0.0%) |
| 18 to 34 Years | 0 (0.0%) | 0 (0.0%) |
| 35 to 64 Years | 0 (0.0%) | 11 (5.2%) |
| 65 to 74 Years | 0 (0.0%) | 0 (0.0%) |
| 75 Years and over | 0 (0.0%) | 0 (0.0%) |
Disability Class: Cognitive Difficulty
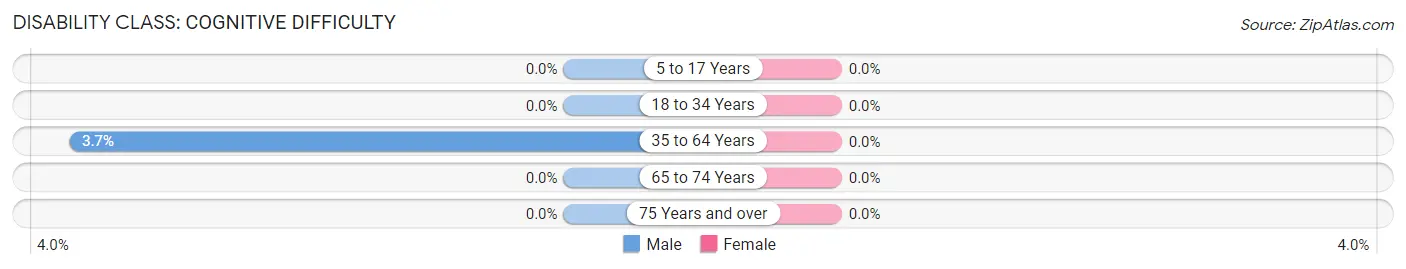
| Age Bracket | Male | Female |
| 5 to 17 Years | 0 (0.0%) | 0 (0.0%) |
| 18 to 34 Years | 0 (0.0%) | 0 (0.0%) |
| 35 to 64 Years | 9 (3.7%) | 0 (0.0%) |
| 65 to 74 Years | 0 (0.0%) | 0 (0.0%) |
| 75 Years and over | 0 (0.0%) | 0 (0.0%) |
Disability Class: Ambulatory Difficulty
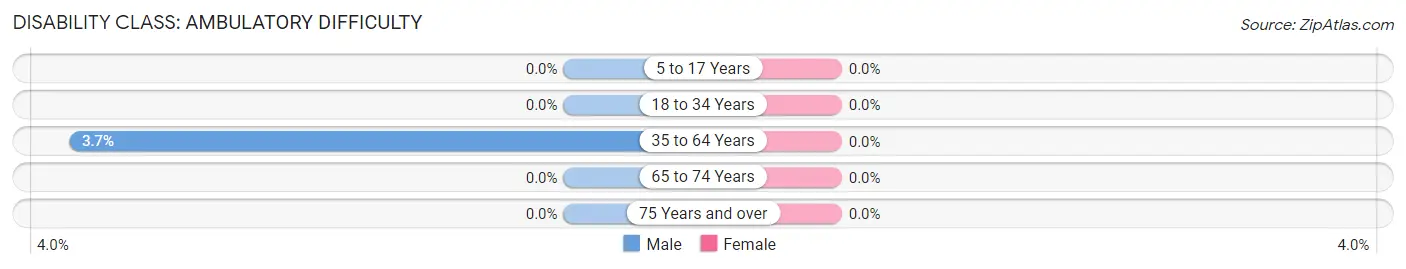
| Age Bracket | Male | Female |
| 5 to 17 Years | 0 (0.0%) | 0 (0.0%) |
| 18 to 34 Years | 0 (0.0%) | 0 (0.0%) |
| 35 to 64 Years | 9 (3.7%) | 0 (0.0%) |
| 65 to 74 Years | 0 (0.0%) | 0 (0.0%) |
| 75 Years and over | 0 (0.0%) | 0 (0.0%) |
Disability Class: Self-Care Difficulty
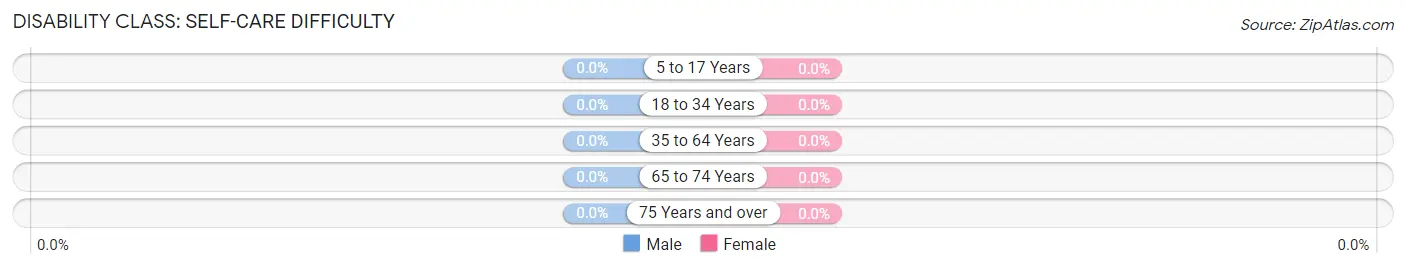
| Age Bracket | Male | Female |
| 5 to 17 Years | 0 (0.0%) | 0 (0.0%) |
| 18 to 34 Years | 0 (0.0%) | 0 (0.0%) |
| 35 to 64 Years | 0 (0.0%) | 0 (0.0%) |
| 65 to 74 Years | 0 (0.0%) | 0 (0.0%) |
| 75 Years and over | 0 (0.0%) | 0 (0.0%) |
Technology Access in Ponderosa Pines
Computing Device Access in Ponderosa Pines
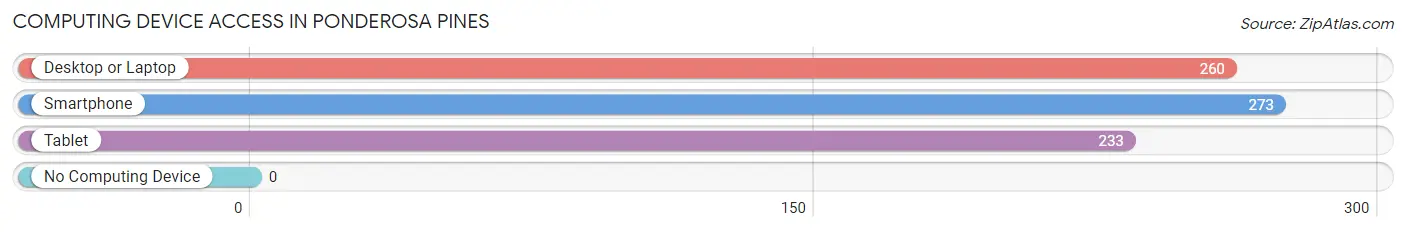
| Device Type | # Households | % Households |
| Desktop or Laptop | 260 | 90.6% |
| Smartphone | 273 | 95.1% |
| Tablet | 233 | 81.2% |
| No Computing Device | 0 | 0.0% |
| Total | 287 | 100.0% |
Internet Access in Ponderosa Pines
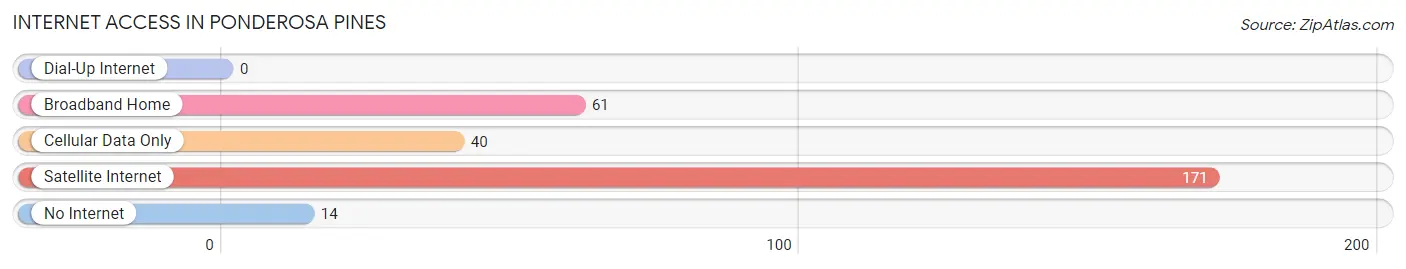
| Internet Type | # Households | % Households |
| Dial-Up Internet | 0 | 0.0% |
| Broadband Home | 61 | 21.2% |
| Cellular Data Only | 40 | 13.9% |
| Satellite Internet | 171 | 59.6% |
| No Internet | 14 | 4.9% |
| Total | 287 | 100.0% |
Ponderosa Pines Summary
Ponderosa Pines, Montana is a small town located in the western part of the state, near the Idaho border. It is situated in the foothills of the Rocky Mountains, and is surrounded by beautiful pine forests. The town has a population of just over 1,000 people, and is a popular destination for outdoor enthusiasts.
Geography
Ponderosa Pines is located in the western part of Montana, near the Idaho border. It is situated in the foothills of the Rocky Mountains, and is surrounded by beautiful pine forests. The town is located at an elevation of 4,500 feet, and has a total area of 1.2 square miles. The climate is semi-arid, with hot summers and cold winters.
History
Ponderosa Pines was founded in the late 1800s by settlers who were drawn to the area by the abundance of timber. The town was originally called “Pine Grove”, but the name was changed to Ponderosa Pines in the early 1900s. The town grew slowly over the years, and by the 1950s it had become a popular destination for outdoor enthusiasts.
Economy
The economy of Ponderosa Pines is largely based on tourism. The town is a popular destination for outdoor activities such as camping, fishing, hunting, and hiking. There are also several small businesses in the town, including restaurants, shops, and lodging. The town also has a small airport, which serves as a hub for private and commercial flights.
Demographics
As of the 2010 census, the population of Ponderosa Pines was 1,072. The racial makeup of the town was 95.3% White, 0.7% African American, 0.3% Native American, 0.2% Asian, 0.1% Pacific Islander, and 3.4% from other races. The median household income was $37,500, and the median age was 44.
Conclusion
Ponderosa Pines, Montana is a small town located in the western part of the state, near the Idaho border. It is situated in the foothills of the Rocky Mountains, and is surrounded by beautiful pine forests. The town has a population of just over 1,000 people, and is a popular destination for outdoor enthusiasts. The economy of Ponderosa Pines is largely based on tourism, and the town is home to several small businesses. The racial makeup of the town is predominantly White, with a small percentage of African American, Native American, Asian, and Pacific Islander residents.
Common Questions
What is Per Capita Income in Ponderosa Pines?
Per Capita income in Ponderosa Pines is $28,225.
What is the Median Family Income in Ponderosa Pines?
Median Family Income in Ponderosa Pines is $82,953.
What is the Median Household income in Ponderosa Pines?
Median Household Income in Ponderosa Pines is $83,203.
What is Income or Wage Gap in Ponderosa Pines?
Income or Wage Gap in Ponderosa Pines is 8.5%.
Women in Ponderosa Pines earn 91.5 cents for every dollar earned by a man.
What is Inequality or Gini Index in Ponderosa Pines?
Inequality or Gini Index in Ponderosa Pines is 0.29.
What is the Total Population of Ponderosa Pines?
Total Population of Ponderosa Pines is 841.
What is the Total Male Population of Ponderosa Pines?
Total Male Population of Ponderosa Pines is 421.
What is the Total Female Population of Ponderosa Pines?
Total Female Population of Ponderosa Pines is 420.
What is the Ratio of Males per 100 Females in Ponderosa Pines?
There are 100.24 Males per 100 Females in Ponderosa Pines.
What is the Ratio of Females per 100 Males in Ponderosa Pines?
There are 99.76 Females per 100 Males in Ponderosa Pines.
What is the Median Population Age in Ponderosa Pines?
Median Population Age in Ponderosa Pines is 45.8 Years.
What is the Average Family Size in Ponderosa Pines
Average Family Size in Ponderosa Pines is 2.7 People.
What is the Average Household Size in Ponderosa Pines
Average Household Size in Ponderosa Pines is 2.9 People.
How Large is the Labor Force in Ponderosa Pines?
There are 473 People in the Labor Forcein in Ponderosa Pines.
What is the Percentage of People in the Labor Force in Ponderosa Pines?
70.1% of People are in the Labor Force in Ponderosa Pines.