Zip Codes with the Lowest Poverty Level Among Children Under the Age of 5 in Montana
RELATED REPORTS & OPTIONS
Lowest Poverty | Child 0-5
Montana
Compare Zip Codes
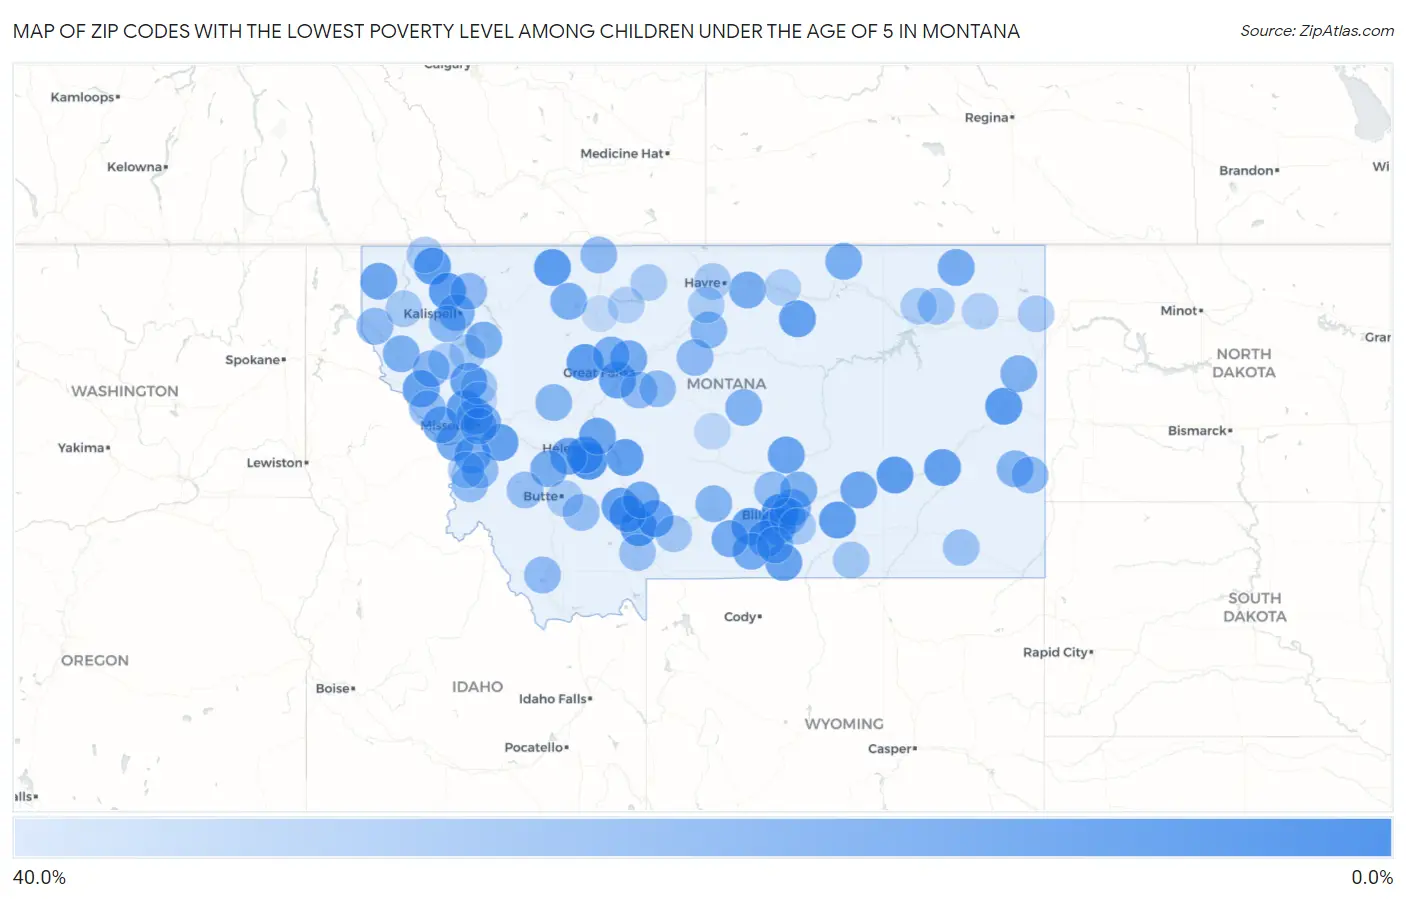
Map of Zip Codes with the Lowest Poverty Level Among Children Under the Age of 5 in Montana
40.0%
0.0%
Zip Codes with the Lowest Poverty Level Among Children Under the Age of 5 in Montana
| Zip Code | Child Poverty | vs State | vs National | |
| 1. | 59106 | 1.9% | 16.3%(-14.4)#1 | 18.1%(-16.2)#764 |
| 2. | 59634 | 2.0% | 16.3%(-14.3)#2 | 18.1%(-16.1)#840 |
| 3. | 59918 | 3.2% | 16.3%(-13.0)#3 | 18.1%(-14.8)#1,662 |
| 4. | 59427 | 3.3% | 16.3%(-13.0)#4 | 18.1%(-14.8)#1,672 |
| 5. | 59937 | 3.3% | 16.3%(-13.0)#5 | 18.1%(-14.8)#1,697 |
| 6. | 59718 | 3.3% | 16.3%(-13.0)#6 | 18.1%(-14.8)#1,702 |
| 7. | 59330 | 3.5% | 16.3%(-12.8)#7 | 18.1%(-14.6)#1,810 |
| 8. | 59327 | 3.6% | 16.3%(-12.7)#8 | 18.1%(-14.5)#1,856 |
| 9. | 59436 | 4.2% | 16.3%(-12.1)#9 | 18.1%(-13.8)#2,355 |
| 10. | 59019 | 5.1% | 16.3%(-11.2)#10 | 18.1%(-13.0)#2,942 |
| 11. | 59034 | 5.1% | 16.3%(-11.1)#11 | 18.1%(-12.9)#2,986 |
| 12. | 59834 | 5.1% | 16.3%(-11.1)#12 | 18.1%(-12.9)#3,003 |
| 13. | 59644 | 5.3% | 16.3%(-11.0)#13 | 18.1%(-12.8)#3,092 |
| 14. | 59601 | 5.7% | 16.3%(-10.6)#14 | 18.1%(-12.4)#3,360 |
| 15. | 59301 | 6.4% | 16.3%(-9.84)#15 | 18.1%(-11.6)#3,897 |
| 16. | 59524 | 6.5% | 16.3%(-9.82)#16 | 18.1%(-11.6)#3,905 |
| 17. | 59825 | 6.5% | 16.3%(-9.79)#17 | 18.1%(-11.6)#3,923 |
| 18. | 59044 | 6.6% | 16.3%(-9.64)#18 | 18.1%(-11.4)#4,014 |
| 19. | 59866 | 6.8% | 16.3%(-9.46)#19 | 18.1%(-11.2)#4,163 |
| 20. | 59014 | 6.9% | 16.3%(-9.38)#20 | 18.1%(-11.2)#4,208 |
| 21. | 59752 | 6.9% | 16.3%(-9.33)#21 | 18.1%(-11.1)#4,254 |
| 22. | 59824 | 7.4% | 16.3%(-8.91)#22 | 18.1%(-10.7)#4,520 |
| 23. | 59072 | 7.6% | 16.3%(-8.72)#23 | 18.1%(-10.5)#4,639 |
| 24. | 59715 | 7.7% | 16.3%(-8.61)#24 | 18.1%(-10.4)#4,710 |
| 25. | 59741 | 8.0% | 16.3%(-8.29)#25 | 18.1%(-10.1)#4,908 |
| 26. | 59485 | 8.0% | 16.3%(-8.28)#26 | 18.1%(-10.1)#4,925 |
| 27. | 59038 | 8.8% | 16.3%(-7.45)#27 | 18.1%(-9.24)#5,496 |
| 28. | 59847 | 8.9% | 16.3%(-7.40)#28 | 18.1%(-9.19)#5,524 |
| 29. | 59935 | 8.9% | 16.3%(-7.38)#29 | 18.1%(-9.16)#5,537 |
| 30. | 59728 | 9.1% | 16.3%(-7.18)#30 | 18.1%(-8.97)#5,692 |
| 31. | 59041 | 9.2% | 16.3%(-7.10)#31 | 18.1%(-8.89)#5,734 |
| 32. | 59602 | 9.2% | 16.3%(-7.07)#32 | 18.1%(-8.86)#5,753 |
| 33. | 59820 | 10.9% | 16.3%(-5.34)#33 | 18.1%(-7.13)#6,802 |
| 34. | 59070 | 11.1% | 16.3%(-5.16)#34 | 18.1%(-6.95)#6,903 |
| 35. | 59714 | 11.3% | 16.3%(-5.02)#35 | 18.1%(-6.81)#7,006 |
| 36. | 59404 | 11.3% | 16.3%(-5.01)#36 | 18.1%(-6.80)#7,009 |
| 37. | 59263 | 11.5% | 16.3%(-4.74)#37 | 18.1%(-6.52)#7,170 |
| 38. | 59001 | 11.9% | 16.3%(-4.34)#38 | 18.1%(-6.12)#7,424 |
| 39. | 59523 | 12.1% | 16.3%(-4.20)#39 | 18.1%(-5.98)#7,514 |
| 40. | 59802 | 12.5% | 16.3%(-3.81)#40 | 18.1%(-5.60)#7,732 |
| 41. | 59722 | 12.6% | 16.3%(-3.63)#41 | 18.1%(-5.42)#7,845 |
| 42. | 59901 | 12.7% | 16.3%(-3.54)#42 | 18.1%(-5.33)#7,888 |
| 43. | 59808 | 12.8% | 16.3%(-3.50)#43 | 18.1%(-5.29)#7,912 |
| 44. | 59486 | 12.8% | 16.3%(-3.46)#44 | 18.1%(-5.24)#7,937 |
| 45. | 59468 | 12.9% | 16.3%(-3.42)#45 | 18.1%(-5.21)#7,959 |
| 46. | 59544 | 13.0% | 16.3%(-3.23)#46 | 18.1%(-5.02)#8,077 |
| 47. | 59105 | 13.1% | 16.3%(-3.18)#47 | 18.1%(-4.97)#8,092 |
| 48. | 59870 | 13.1% | 16.3%(-3.16)#48 | 18.1%(-4.95)#8,116 |
| 49. | 59911 | 13.5% | 16.3%(-2.80)#49 | 18.1%(-4.59)#8,334 |
| 50. | 59079 | 13.9% | 16.3%(-2.39)#50 | 18.1%(-4.17)#8,575 |
| 51. | 59873 | 13.9% | 16.3%(-2.39)#51 | 18.1%(-4.17)#8,577 |
| 52. | 59262 | 14.7% | 16.3%(-1.57)#52 | 18.1%(-3.36)#9,042 |
| 53. | 59457 | 15.7% | 16.3%(-0.528)#53 | 18.1%(-2.31)#9,619 |
| 54. | 59011 | 15.9% | 16.3%(-0.367)#54 | 18.1%(-2.15)#9,707 |
| 55. | 59102 | 16.1% | 16.3%(-0.170)#55 | 18.1%(-1.96)#9,821 |
| 56. | 59344 | 16.1% | 16.3%(-0.147)#56 | 18.1%(-1.93)#9,830 |
| 57. | 59859 | 16.8% | 16.3%(+0.524)#57 | 18.1%(-1.26)#10,173 |
| 58. | 59639 | 17.2% | 16.3%(+0.966)#58 | 18.1%(-0.821)#10,362 |
| 59. | 59920 | 17.5% | 16.3%(+1.27)#59 | 18.1%(-0.519)#10,489 |
| 60. | 59520 | 17.8% | 16.3%(+1.50)#60 | 18.1%(-0.285)#10,606 |
| 61. | 59029 | 17.9% | 16.3%(+1.58)#61 | 18.1%(-0.206)#10,649 |
| 62. | 59313 | 18.6% | 16.3%(+2.36)#62 | 18.1%(+0.571)#10,999 |
| 63. | 59446 | 18.7% | 16.3%(+2.39)#63 | 18.1%(+0.604)#11,018 |
| 64. | 59482 | 18.9% | 16.3%(+2.59)#64 | 18.1%(+0.805)#11,112 |
| 65. | 59853 | 18.9% | 16.3%(+2.59)#65 | 18.1%(+0.805)#11,113 |
| 66. | 59405 | 19.3% | 16.3%(+3.06)#66 | 18.1%(+1.28)#11,328 |
| 67. | 59725 | 19.4% | 16.3%(+3.11)#67 | 18.1%(+1.32)#11,352 |
| 68. | 59912 | 19.4% | 16.3%(+3.13)#68 | 18.1%(+1.35)#11,367 |
| 69. | 59840 | 20.0% | 16.3%(+3.70)#69 | 18.1%(+1.91)#11,585 |
| 70. | 59412 | 20.0% | 16.3%(+3.72)#70 | 18.1%(+1.94)#11,615 |
| 71. | 59015 | 20.0% | 16.3%(+3.72)#71 | 18.1%(+1.94)#11,655 |
| 72. | 59828 | 20.1% | 16.3%(+3.82)#72 | 18.1%(+2.03)#11,694 |
| 73. | 59872 | 20.6% | 16.3%(+4.36)#73 | 18.1%(+2.57)#11,923 |
| 74. | 59801 | 21.2% | 16.3%(+4.96)#74 | 18.1%(+3.17)#12,155 |
| 75. | 59759 | 21.3% | 16.3%(+4.98)#75 | 18.1%(+3.20)#12,168 |
| 76. | 59711 | 21.3% | 16.3%(+5.01)#76 | 18.1%(+3.22)#12,182 |
| 77. | 59730 | 22.4% | 16.3%(+6.09)#77 | 18.1%(+4.31)#12,659 |
| 78. | 59225 | 23.2% | 16.3%(+6.91)#78 | 18.1%(+5.13)#12,984 |
| 79. | 59317 | 23.3% | 16.3%(+6.98)#79 | 18.1%(+5.19)#13,015 |
| 80. | 59047 | 25.1% | 16.3%(+8.80)#80 | 18.1%(+7.01)#13,718 |
| 81. | 59050 | 25.4% | 16.3%(+9.10)#81 | 18.1%(+7.31)#13,813 |
| 82. | 59101 | 25.8% | 16.3%(+9.57)#82 | 18.1%(+7.78)#13,976 |
| 83. | 59841 | 25.9% | 16.3%(+9.61)#83 | 18.1%(+7.82)#13,989 |
| 84. | 59865 | 25.9% | 16.3%(+9.64)#84 | 18.1%(+7.85)#14,000 |
| 85. | 59923 | 26.7% | 16.3%(+10.4)#85 | 18.1%(+8.62)#14,270 |
| 86. | 59701 | 26.7% | 16.3%(+10.4)#86 | 18.1%(+8.66)#14,278 |
| 87. | 59212 | 27.3% | 16.3%(+11.0)#87 | 18.1%(+9.21)#14,459 |
| 88. | 59501 | 27.3% | 16.3%(+11.1)#88 | 18.1%(+9.26)#14,474 |
| 89. | 59917 | 27.5% | 16.3%(+11.2)#89 | 18.1%(+9.42)#14,535 |
| 90. | 59248 | 27.8% | 16.3%(+11.5)#90 | 18.1%(+9.71)#14,637 |
| 91. | 59521 | 28.0% | 16.3%(+11.7)#91 | 18.1%(+9.91)#14,701 |
| 92. | 59860 | 28.0% | 16.3%(+11.7)#92 | 18.1%(+9.96)#14,713 |
| 93. | 59522 | 28.2% | 16.3%(+11.9)#93 | 18.1%(+10.1)#14,760 |
| 94. | 59845 | 28.6% | 16.3%(+12.3)#94 | 18.1%(+10.5)#14,878 |
| 95. | 59526 | 29.2% | 16.3%(+12.9)#95 | 18.1%(+11.1)#15,078 |
| 96. | 59456 | 30.0% | 16.3%(+13.7)#96 | 18.1%(+11.9)#15,330 |
| 97. | 59255 | 30.2% | 16.3%(+13.9)#97 | 18.1%(+12.1)#15,365 |
| 98. | 59821 | 33.0% | 16.3%(+16.7)#98 | 18.1%(+14.9)#16,080 |
| 99. | 59418 | 33.3% | 16.3%(+17.1)#99 | 18.1%(+15.3)#16,241 |
| 100. | 59425 | 34.5% | 16.3%(+18.2)#100 | 18.1%(+16.4)#16,479 |
Common Questions
What are the Top 10 Zip Codes with the Lowest Poverty Level Among Children Under the Age of 5 in Montana?
Top 10 Zip Codes with the Lowest Poverty Level Among Children Under the Age of 5 in Montana are:
What zip code has the Lowest Poverty Level Among Children Under the Age of 5 in Montana?
59106 has the Lowest Poverty Level Among Children Under the Age of 5 in Montana with 1.9%.
What is the Poverty Level Among Children Under the Age of 5 in the State of Montana?
Poverty Level Among Children Under the Age of 5 in Montana is 16.3%.
What is the Poverty Level Among Children Under the Age of 5 in the United States?
Poverty Level Among Children Under the Age of 5 in the United States is 18.1%.