Bayou L Ourse, LA Map & Demographics
Bayou L Ourse Map
Bayou L Ourse Overview
$25,152
PER CAPITA INCOME
$51,250
AVG FAMILY INCOME
$45,777
AVG HOUSEHOLD INCOME
44.8%
WAGE / INCOME GAP [ % ]
55.2¢/ $1
WAGE / INCOME GAP [ $ ]
0.55
INEQUALITY / GINI INDEX
2,039
TOTAL POPULATION
985
MALE POPULATION
1,054
FEMALE POPULATION
93.45
MALES / 100 FEMALES
107.01
FEMALES / 100 MALES
36.0
MEDIAN AGE
3.4
AVG FAMILY SIZE
3.2
AVG HOUSEHOLD SIZE
805
LABOR FORCE [ PEOPLE ]
51.4%
PERCENT IN LABOR FORCE
11.8%
UNEMPLOYMENT RATE
Income in Bayou L Ourse
Income Overview in Bayou L Ourse
Per Capita Income in Bayou L Ourse is $25,152, while median incomes of families and households are $51,250 and $45,777 respectively.
| Characteristic | Number | Measure |
| Per Capita Income | 2,039 | $25,152 |
| Median Family Income | 544 | $51,250 |
| Mean Family Income | 544 | $84,388 |
| Median Household Income | 646 | $45,777 |
| Mean Household Income | 646 | $79,877 |
| Income Deficit | 544 | $0 |
| Wage / Income Gap (%) | 2,039 | 44.75% |
| Wage / Income Gap ($) | 2,039 | 55.25¢ per $1 |
| Gini / Inequality Index | 2,039 | 0.55 |
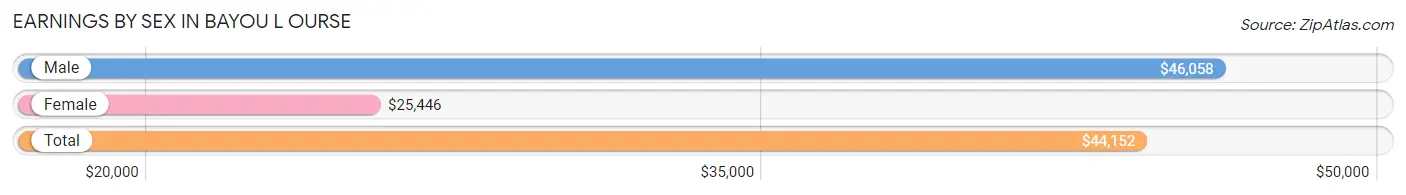
Earnings by Sex in Bayou L Ourse
Average Earnings in Bayou L Ourse are $44,152, $46,058 for men and $25,446 for women, a difference of 44.8%.
| Sex | Number | Average Earnings |
| Male | 507 (65.2%) | $46,058 |
| Female | 270 (34.7%) | $25,446 |
| Total | 777 (100.0%) | $44,152 |
Earnings by Sex by Income Bracket in Bayou L Ourse
The most common earnings brackets in Bayou L Ourse are $75,000 to $99,999 for men (113 | 22.3%) and $50,000 to $54,999 for women (79 | 29.3%).

| Income | Male | Female |
| $2,499 or less | 0 (0.0%) | 65 (24.1%) |
| $2,500 to $4,999 | 20 (3.9%) | 0 (0.0%) |
| $5,000 to $7,499 | 48 (9.5%) | 0 (0.0%) |
| $7,500 to $9,999 | 0 (0.0%) | 0 (0.0%) |
| $10,000 to $12,499 | 0 (0.0%) | 0 (0.0%) |
| $12,500 to $14,999 | 0 (0.0%) | 0 (0.0%) |
| $15,000 to $17,499 | 9 (1.8%) | 36 (13.3%) |
| $17,500 to $19,999 | 0 (0.0%) | 0 (0.0%) |
| $20,000 to $22,499 | 34 (6.7%) | 0 (0.0%) |
| $22,500 to $24,999 | 31 (6.1%) | 24 (8.9%) |
| $25,000 to $29,999 | 0 (0.0%) | 56 (20.7%) |
| $30,000 to $34,999 | 0 (0.0%) | 10 (3.7%) |
| $35,000 to $39,999 | 0 (0.0%) | 0 (0.0%) |
| $40,000 to $44,999 | 84 (16.6%) | 0 (0.0%) |
| $45,000 to $49,999 | 65 (12.8%) | 0 (0.0%) |
| $50,000 to $54,999 | 20 (3.9%) | 79 (29.3%) |
| $55,000 to $64,999 | 39 (7.7%) | 0 (0.0%) |
| $65,000 to $74,999 | 0 (0.0%) | 0 (0.0%) |
| $75,000 to $99,999 | 113 (22.3%) | 0 (0.0%) |
| $100,000+ | 44 (8.7%) | 0 (0.0%) |
| Total | 507 (100.0%) | 270 (100.0%) |
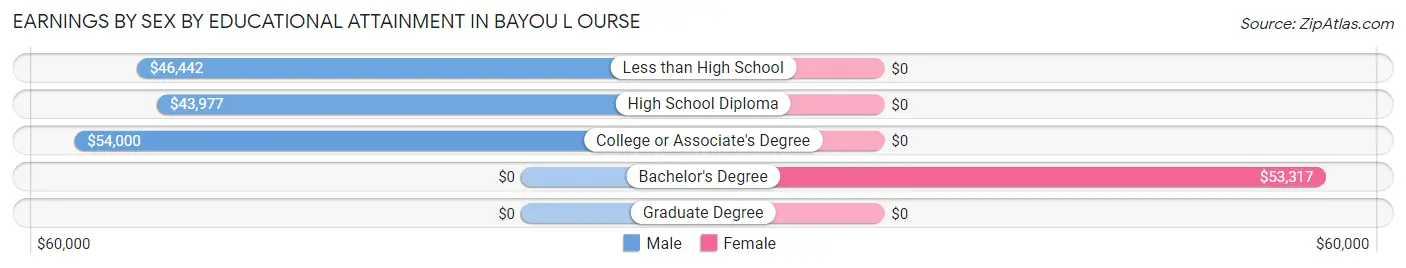
Earnings by Sex by Educational Attainment in Bayou L Ourse
Average earnings in Bayou L Ourse are $46,442 for men and $25,915 for women, a difference of 44.2%. Men with an educational attainment of college or associate's degree enjoy the highest average annual earnings of $54,000, while those with high school diploma education earn the least with $43,977. Women with an educational attainment of bachelor's degree earn the most with the average annual earnings of $53,317, while those with bachelor's degree education have the smallest earnings of $53,317.
| Educational Attainment | Male Income | Female Income |
| Less than High School | $46,442 | $0 |
| High School Diploma | $43,977 | $0 |
| College or Associate's Degree | $54,000 | $0 |
| Bachelor's Degree | - | - |
| Graduate Degree | - | - |
| Total | $46,442 | $25,915 |
Family Income in Bayou L Ourse
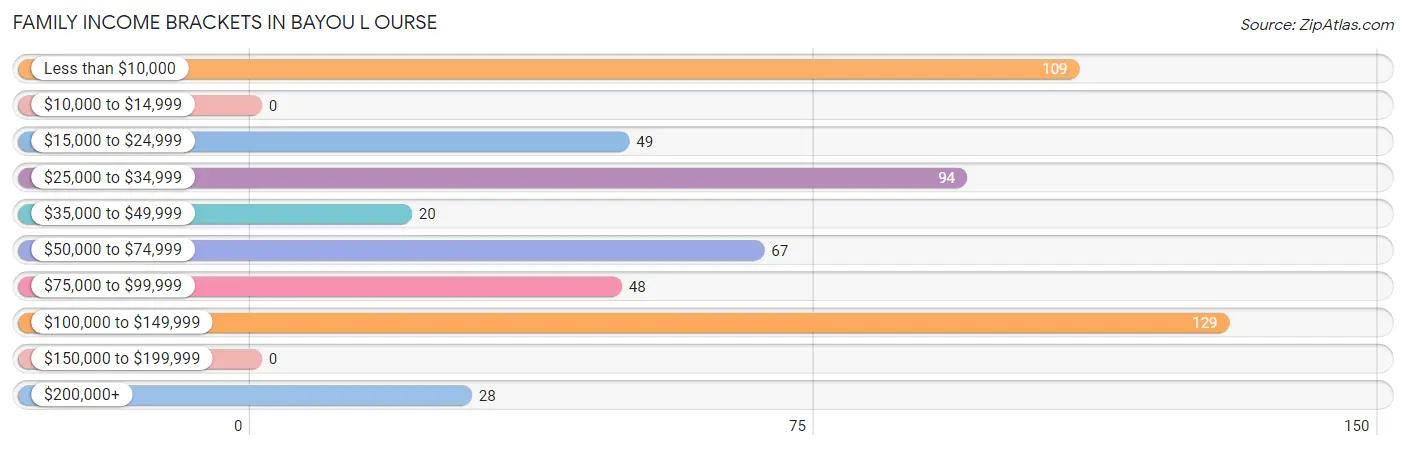
Family Income Brackets in Bayou L Ourse
According to the Bayou L Ourse family income data, there are 129 families falling into the $100,000 to $149,999 income range, which is the most common income bracket and makes up 23.7% of all families.
| Income Bracket | # Families | % Families |
| Less than $10,000 | 109 | 20.0% |
| $10,000 to $14,999 | 0 | 0.0% |
| $15,000 to $24,999 | 49 | 9.0% |
| $25,000 to $34,999 | 94 | 17.3% |
| $35,000 to $49,999 | 20 | 3.7% |
| $50,000 to $74,999 | 67 | 12.3% |
| $75,000 to $99,999 | 48 | 8.8% |
| $100,000 to $149,999 | 129 | 23.7% |
| $150,000 to $199,999 | 0 | 0.0% |
| $200,000+ | 28 | 5.1% |
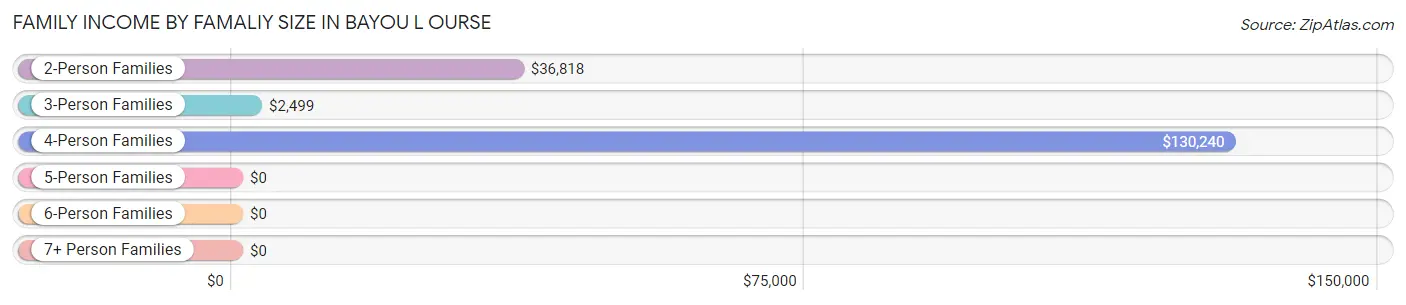
Family Income by Famaliy Size in Bayou L Ourse
4-person families (161 | 29.6%) account for the highest median family income in Bayou L Ourse with $130,240 per family, while 4-person families (161 | 29.6%) have the highest median income of $32,560 per family member.
| Income Bracket | # Families | Median Income |
| 2-Person Families | 162 (29.8%) | $36,818 |
| 3-Person Families | 150 (27.6%) | $2,499 |
| 4-Person Families | 161 (29.6%) | $130,240 |
| 5-Person Families | 20 (3.7%) | $0 |
| 6-Person Families | 51 (9.4%) | $0 |
| 7+ Person Families | 0 (0.0%) | $0 |
| Total | 544 (100.0%) | $51,250 |
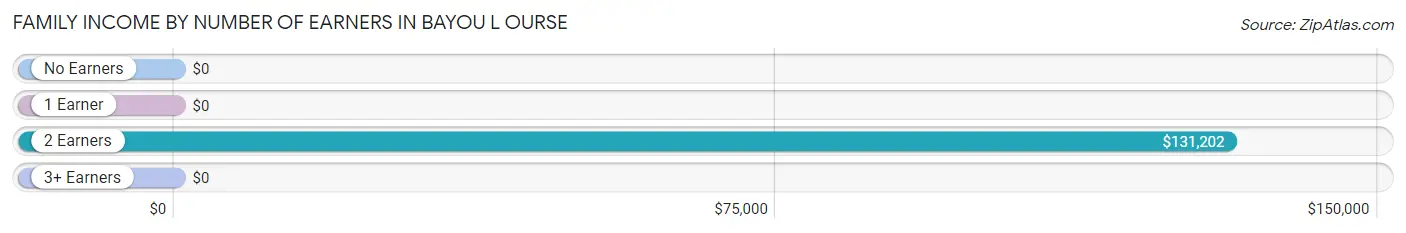
Family Income by Number of Earners in Bayou L Ourse
| Number of Earners | # Families | Median Income |
| No Earners | 213 (39.2%) | $0 |
| 1 Earner | 114 (21.0%) | $0 |
| 2 Earners | 161 (29.6%) | $131,202 |
| 3+ Earners | 56 (10.3%) | $0 |
| Total | 544 (100.0%) | $51,250 |
Household Income in Bayou L Ourse
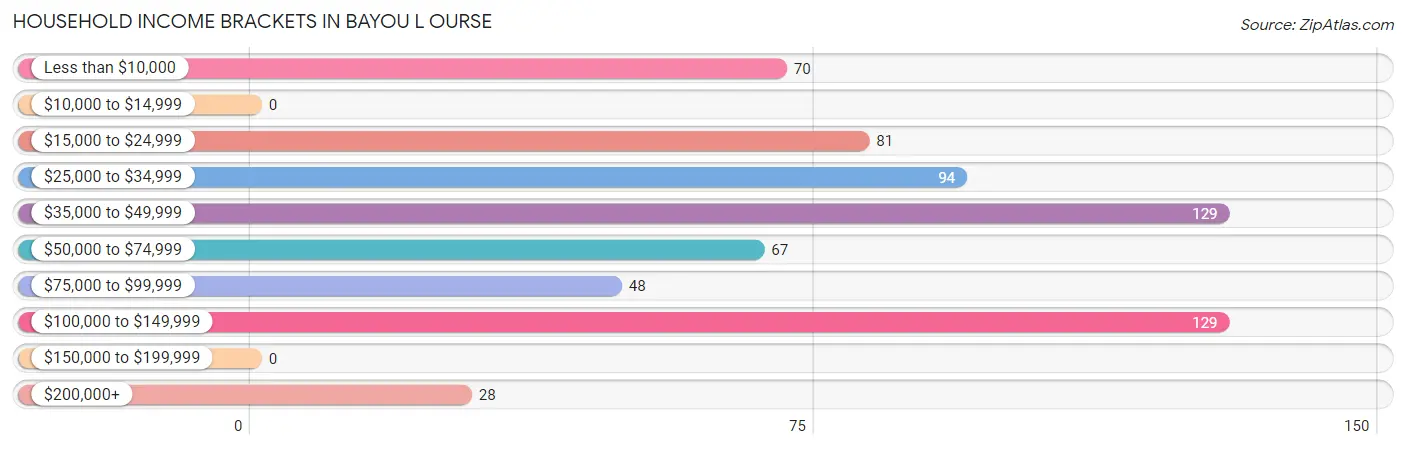
Household Income Brackets in Bayou L Ourse
With 129 households falling in the category, the $35,000 to $49,999 income range is the most frequent in Bayou L Ourse, accounting for 20.0% of all households.
| Income Bracket | # Households | % Households |
| Less than $10,000 | 70 | 10.8% |
| $10,000 to $14,999 | 0 | 0.0% |
| $15,000 to $24,999 | 81 | 12.5% |
| $25,000 to $34,999 | 94 | 14.6% |
| $35,000 to $49,999 | 129 | 20.0% |
| $50,000 to $74,999 | 67 | 10.4% |
| $75,000 to $99,999 | 48 | 7.4% |
| $100,000 to $149,999 | 129 | 20.0% |
| $150,000 to $199,999 | 0 | 0.0% |
| $200,000+ | 28 | 4.3% |
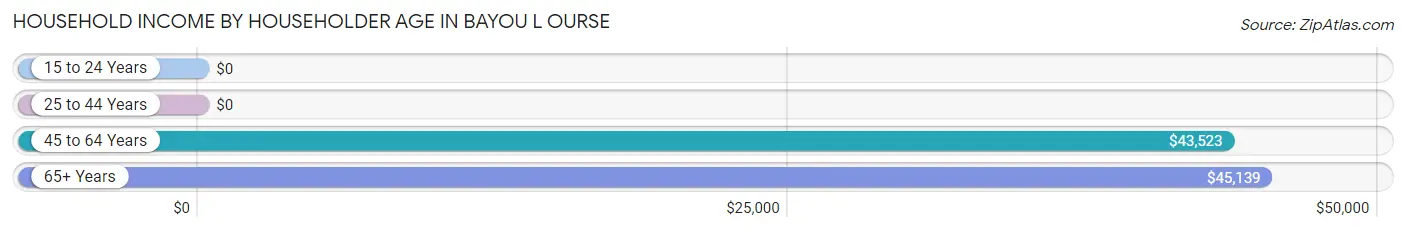
Household Income by Householder Age in Bayou L Ourse
The median household income in Bayou L Ourse is $45,777, with the highest median household income of $45,139 found in the 65+ years age bracket for the primary householder. A total of 151 households (23.4%) fall into this category. Meanwhile, the 15 to 24 years age bracket for the primary householder has the lowest median household income of $0, with 65 households (10.1%) in this group.
| Income Bracket | # Households | Median Income |
| 15 to 24 Years | 65 (10.1%) | $0 |
| 25 to 44 Years | 214 (33.1%) | $0 |
| 45 to 64 Years | 216 (33.4%) | $43,523 |
| 65+ Years | 151 (23.4%) | $45,139 |
| Total | 646 (100.0%) | $45,777 |
Poverty in Bayou L Ourse
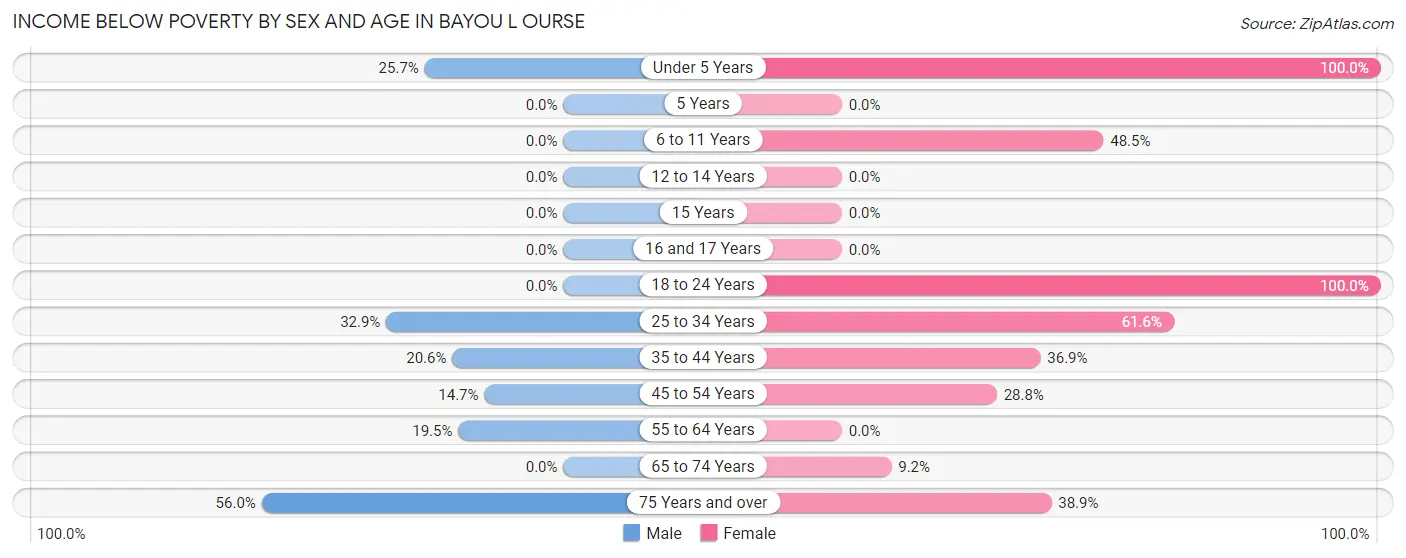
Income Below Poverty by Sex and Age in Bayou L Ourse
With 17.3% poverty level for males and 49.2% for females among the residents of Bayou L Ourse, 75 year old and over males and under 5 year old females are the most vulnerable to poverty, with 14 males (56.0%) and 129 females (100.0%) in their respective age groups living below the poverty level.
| Age Bracket | Male | Female |
| Under 5 Years | 26 (25.7%) | 129 (100.0%) |
| 5 Years | 0 (0.0%) | 0 (0.0%) |
| 6 to 11 Years | 0 (0.0%) | 50 (48.5%) |
| 12 to 14 Years | 0 (0.0%) | 0 (0.0%) |
| 15 Years | 0 (0.0%) | 0 (0.0%) |
| 16 and 17 Years | 0 (0.0%) | 0 (0.0%) |
| 18 to 24 Years | 0 (0.0%) | 131 (100.0%) |
| 25 to 34 Years | 48 (32.9%) | 69 (61.6%) |
| 35 to 44 Years | 34 (20.6%) | 94 (36.9%) |
| 45 to 54 Years | 17 (14.7%) | 23 (28.7%) |
| 55 to 64 Years | 31 (19.5%) | 0 (0.0%) |
| 65 to 74 Years | 0 (0.0%) | 9 (9.2%) |
| 75 Years and over | 14 (56.0%) | 14 (38.9%) |
| Total | 170 (17.3%) | 519 (49.2%) |
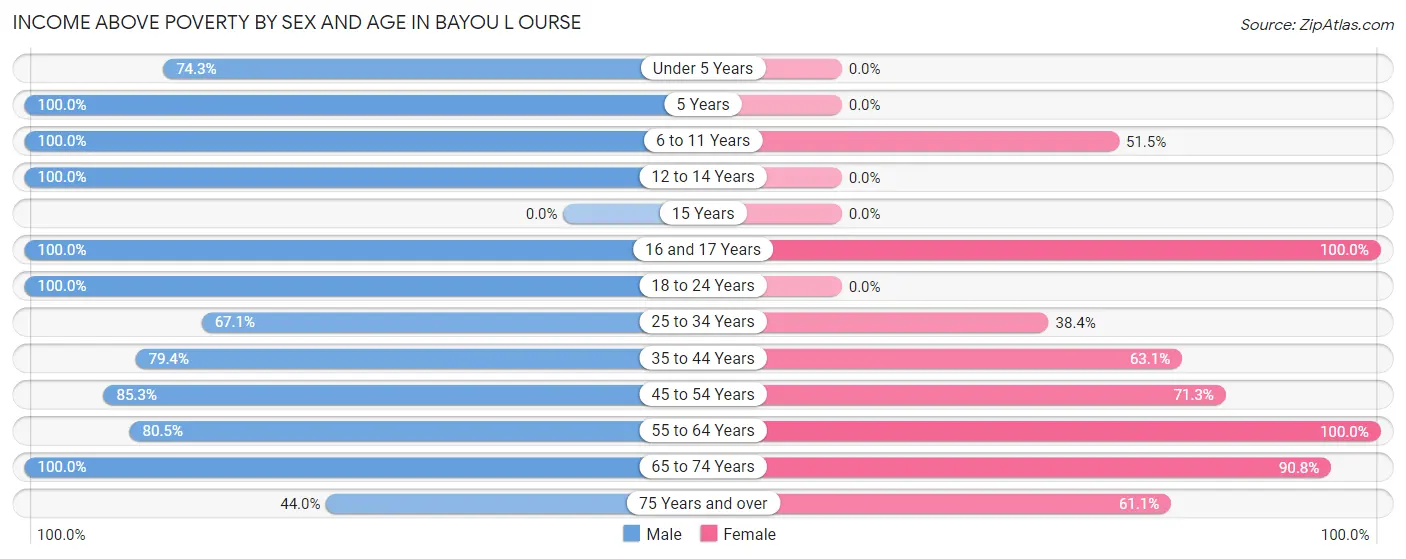
Income Above Poverty by Sex and Age in Bayou L Ourse
According to the poverty statistics in Bayou L Ourse, males aged 5 years and females aged 16 and 17 years are the age groups that are most secure financially, with 100.0% of males and 100.0% of females in these age groups living above the poverty line.
| Age Bracket | Male | Female |
| Under 5 Years | 75 (74.3%) | 0 (0.0%) |
| 5 Years | 55 (100.0%) | 0 (0.0%) |
| 6 to 11 Years | 30 (100.0%) | 53 (51.5%) |
| 12 to 14 Years | 54 (100.0%) | 0 (0.0%) |
| 15 Years | 0 (0.0%) | 0 (0.0%) |
| 16 and 17 Years | 29 (100.0%) | 21 (100.0%) |
| 18 to 24 Years | 32 (100.0%) | 0 (0.0%) |
| 25 to 34 Years | 98 (67.1%) | 43 (38.4%) |
| 35 to 44 Years | 131 (79.4%) | 161 (63.1%) |
| 45 to 54 Years | 99 (85.3%) | 57 (71.3%) |
| 55 to 64 Years | 128 (80.5%) | 89 (100.0%) |
| 65 to 74 Years | 73 (100.0%) | 89 (90.8%) |
| 75 Years and over | 11 (44.0%) | 22 (61.1%) |
| Total | 815 (82.7%) | 535 (50.8%) |
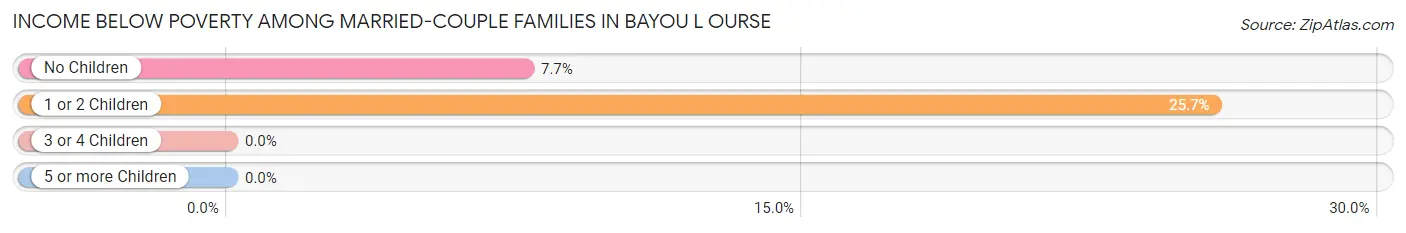
Income Below Poverty Among Married-Couple Families in Bayou L Ourse
The poverty statistics for married-couple families in Bayou L Ourse show that 17.6% or 71 of the total 403 families live below the poverty line. Families with 1 or 2 children have the highest poverty rate of 25.7%, comprising of 57 families. On the other hand, families with no children have the lowest poverty rate of 7.7%, which includes 14 families.
| Children | Above Poverty | Below Poverty |
| No Children | 167 (92.3%) | 14 (7.7%) |
| 1 or 2 Children | 165 (74.3%) | 57 (25.7%) |
| 3 or 4 Children | 0 (0.0%) | 0 (0.0%) |
| 5 or more Children | 0 (0.0%) | 0 (0.0%) |
| Total | 332 (82.4%) | 71 (17.6%) |
Income Below Poverty Among Single-Parent Households in Bayou L Ourse
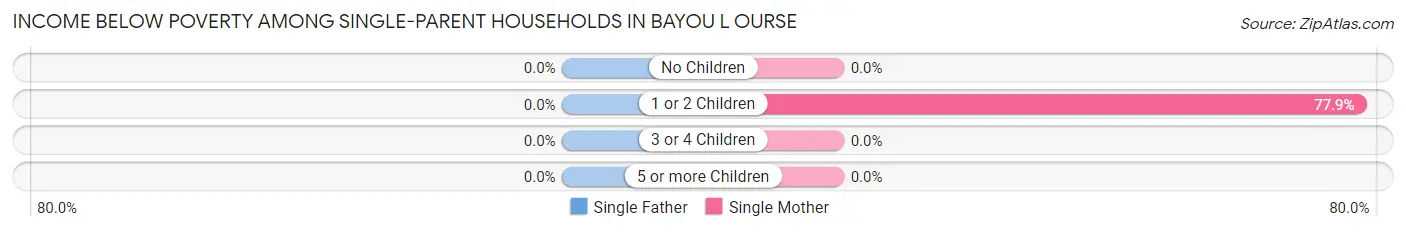
| Children | Single Father | Single Mother |
| No Children | 0 (0.0%) | 0 (0.0%) |
| 1 or 2 Children | 0 (0.0%) | 95 (77.9%) |
| 3 or 4 Children | 0 (0.0%) | 0 (0.0%) |
| 5 or more Children | 0 (0.0%) | 0 (0.0%) |
| Total | 0 (0.0%) | 95 (67.4%) |
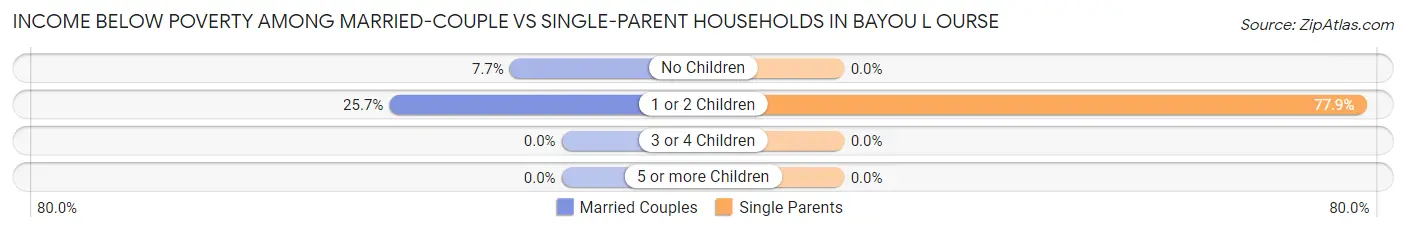
Income Below Poverty Among Married-Couple vs Single-Parent Households in Bayou L Ourse
The poverty data for Bayou L Ourse shows that 71 of the married-couple family households (17.6%) and 95 of the single-parent households (67.4%) are living below the poverty level. Within the married-couple family households, those with 1 or 2 children have the highest poverty rate, with 57 households (25.7%) falling below the poverty line. Among the single-parent households, those with 1 or 2 children have the highest poverty rate, with 95 household (77.9%) living below poverty.
| Children | Married-Couple Families | Single-Parent Households |
| No Children | 14 (7.7%) | 0 (0.0%) |
| 1 or 2 Children | 57 (25.7%) | 95 (77.9%) |
| 3 or 4 Children | 0 (0.0%) | 0 (0.0%) |
| 5 or more Children | 0 (0.0%) | 0 (0.0%) |
| Total | 71 (17.6%) | 95 (67.4%) |
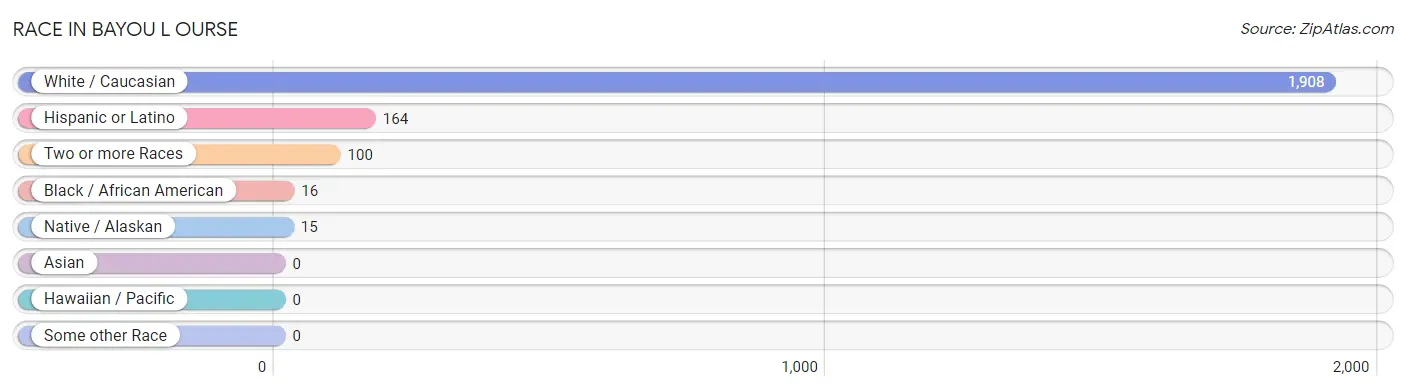
Race in Bayou L Ourse
The most populous races in Bayou L Ourse are White / Caucasian (1,908 | 93.6%), Hispanic or Latino (164 | 8.0%), and Two or more Races (100 | 4.9%).
| Race | # Population | % Population |
| Asian | 0 | 0.0% |
| Black / African American | 16 | 0.8% |
| Hawaiian / Pacific | 0 | 0.0% |
| Hispanic or Latino | 164 | 8.0% |
| Native / Alaskan | 15 | 0.7% |
| White / Caucasian | 1,908 | 93.6% |
| Two or more Races | 100 | 4.9% |
| Some other Race | 0 | 0.0% |
| Total | 2,039 | 100.0% |
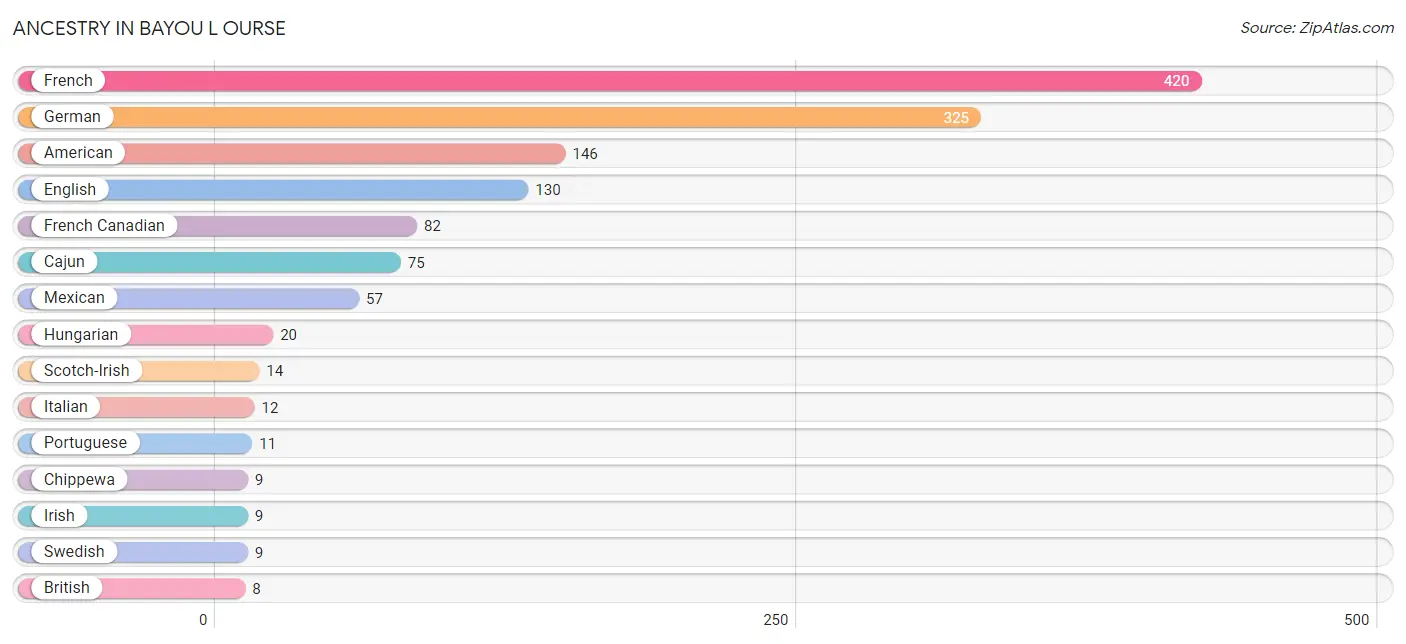
Ancestry in Bayou L Ourse
The most populous ancestries reported in Bayou L Ourse are French (420 | 20.6%), German (325 | 15.9%), American (146 | 7.2%), English (130 | 6.4%), and French Canadian (82 | 4.0%), together accounting for 54.1% of all Bayou L Ourse residents.
| Ancestry | # Population | % Population |
| American | 146 | 7.2% |
| British | 8 | 0.4% |
| Cajun | 75 | 3.7% |
| Chippewa | 9 | 0.4% |
| English | 130 | 6.4% |
| French | 420 | 20.6% |
| French Canadian | 82 | 4.0% |
| German | 325 | 15.9% |
| Houma | 6 | 0.3% |
| Hungarian | 20 | 1.0% |
| Irish | 9 | 0.4% |
| Italian | 12 | 0.6% |
| Mexican | 57 | 2.8% |
| Portuguese | 11 | 0.5% |
| Scotch-Irish | 14 | 0.7% |
| Swedish | 9 | 0.4% | View All 16 Rows |
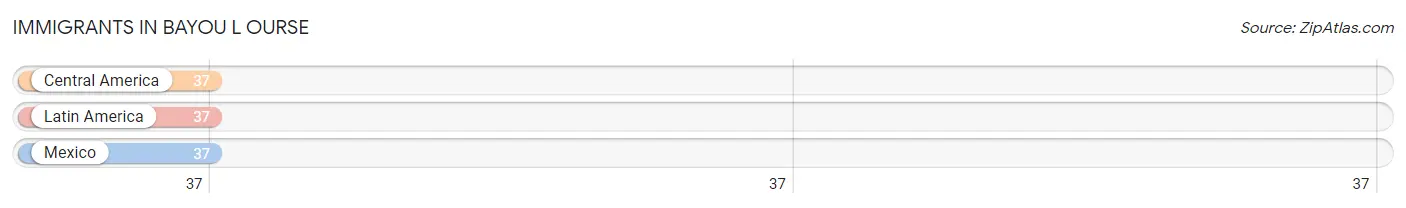
Immigrants in Bayou L Ourse
The most numerous immigrant groups reported in Bayou L Ourse came from Central America (37 | 1.8%), Latin America (37 | 1.8%), and Mexico (37 | 1.8%), together accounting for 5.4% of all Bayou L Ourse residents.
| Immigration Origin | # Population | % Population |
| Central America | 37 | 1.8% |
| Latin America | 37 | 1.8% |
| Mexico | 37 | 1.8% | View All 3 Rows |
Sex and Age in Bayou L Ourse
Sex and Age in Bayou L Ourse
The most populous age groups in Bayou L Ourse are 35 to 39 Years (154 | 15.6%) for men and 40 to 44 Years (166 | 15.8%) for women.
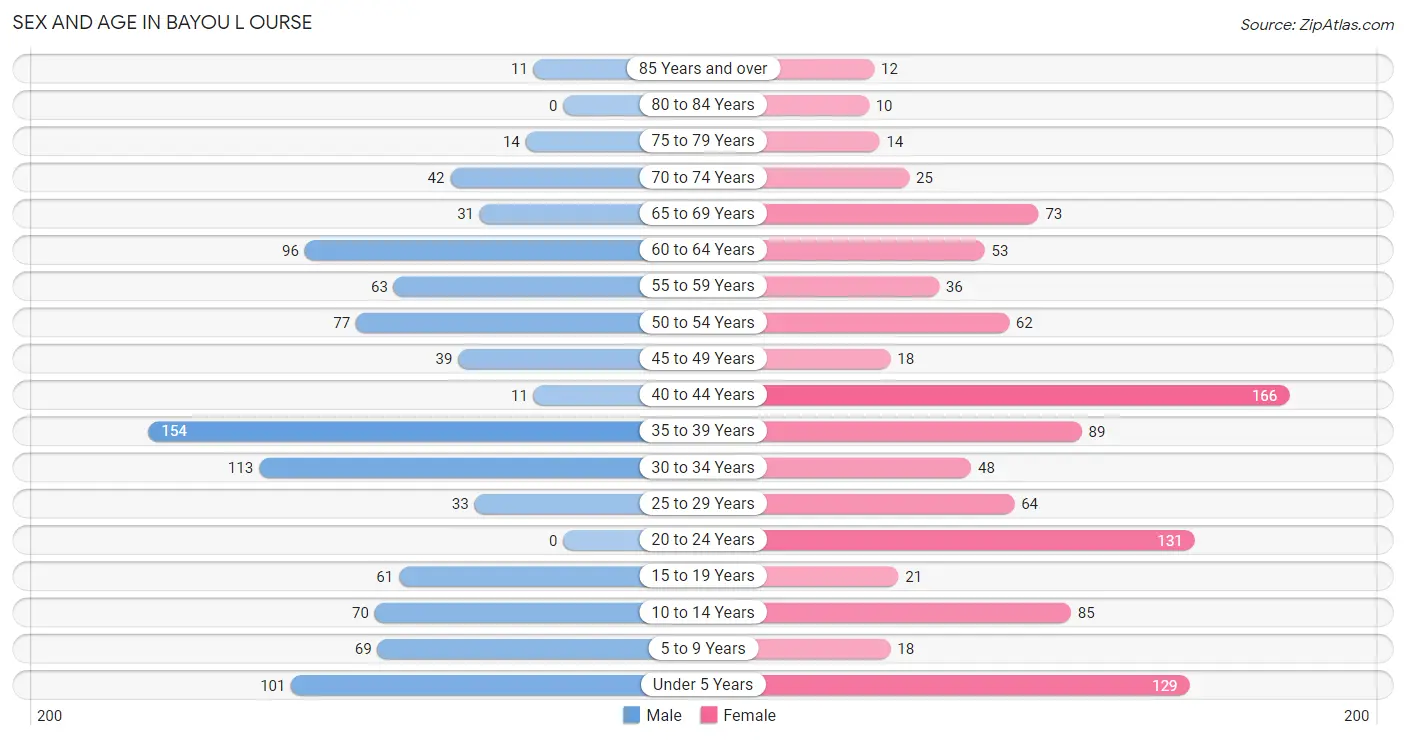
| Age Bracket | Male | Female |
| Under 5 Years | 101 (10.2%) | 129 (12.2%) |
| 5 to 9 Years | 69 (7.0%) | 18 (1.7%) |
| 10 to 14 Years | 70 (7.1%) | 85 (8.1%) |
| 15 to 19 Years | 61 (6.2%) | 21 (2.0%) |
| 20 to 24 Years | 0 (0.0%) | 131 (12.4%) |
| 25 to 29 Years | 33 (3.4%) | 64 (6.1%) |
| 30 to 34 Years | 113 (11.5%) | 48 (4.5%) |
| 35 to 39 Years | 154 (15.6%) | 89 (8.4%) |
| 40 to 44 Years | 11 (1.1%) | 166 (15.8%) |
| 45 to 49 Years | 39 (4.0%) | 18 (1.7%) |
| 50 to 54 Years | 77 (7.8%) | 62 (5.9%) |
| 55 to 59 Years | 63 (6.4%) | 36 (3.4%) |
| 60 to 64 Years | 96 (9.8%) | 53 (5.0%) |
| 65 to 69 Years | 31 (3.2%) | 73 (6.9%) |
| 70 to 74 Years | 42 (4.3%) | 25 (2.4%) |
| 75 to 79 Years | 14 (1.4%) | 14 (1.3%) |
| 80 to 84 Years | 0 (0.0%) | 10 (0.9%) |
| 85 Years and over | 11 (1.1%) | 12 (1.1%) |
| Total | 985 (100.0%) | 1,054 (100.0%) |
Families and Households in Bayou L Ourse
Median Family Size in Bayou L Ourse
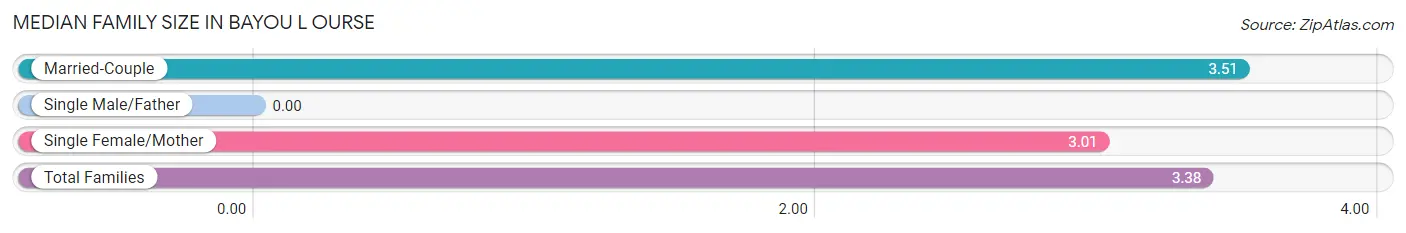
| Family Type | # Families | Family Size |
| Married-Couple | 403 (74.1%) | 3.51 |
| Single Male/Father | 0 (0.0%) | - |
| Single Female/Mother | 141 (25.9%) | 3.01 |
| Total Families | 544 (100.0%) | 3.38 |
Median Household Size in Bayou L Ourse
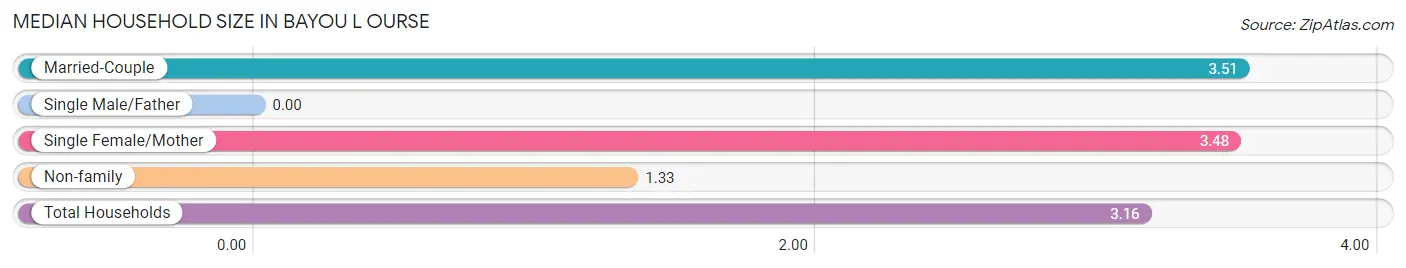
| Household Type | # Households | Household Size |
| Married-Couple | 403 (62.4%) | 3.51 |
| Single Male/Father | 0 (0.0%) | - |
| Single Female/Mother | 141 (21.8%) | 3.48 |
| Non-family | 102 (15.8%) | 1.33 |
| Total Households | 646 (100.0%) | 3.16 |
Household Size by Marriage Status in Bayou L Ourse
Out of a total of 646 households in Bayou L Ourse, 544 (84.2%) are family households, while 102 (15.8%) are nonfamily households. The most numerous type of family households are 4-person households, comprising 226, and the most common type of nonfamily households are 1-person households, comprising 58.
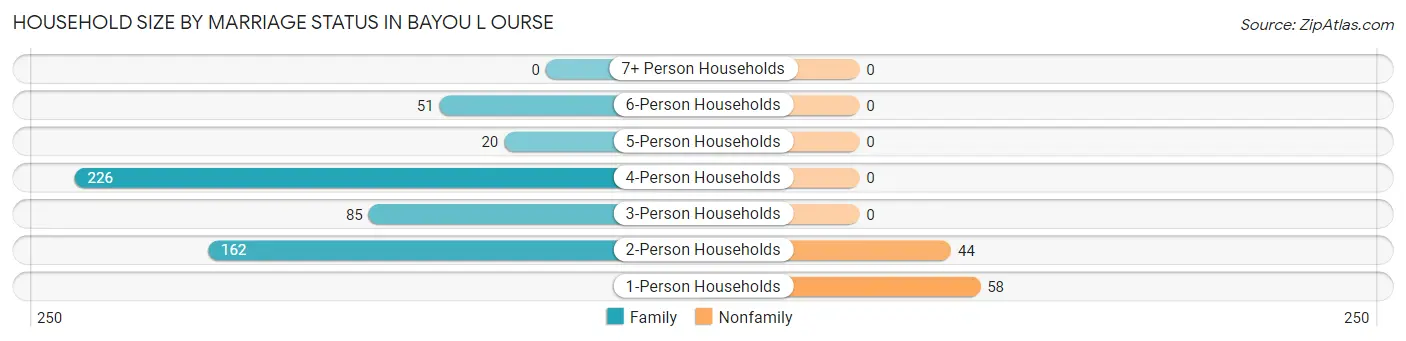
| Household Size | Family Households | Nonfamily Households |
| 1-Person Households | - | 58 (9.0%) |
| 2-Person Households | 162 (25.1%) | 44 (6.8%) |
| 3-Person Households | 85 (13.2%) | 0 (0.0%) |
| 4-Person Households | 226 (35.0%) | 0 (0.0%) |
| 5-Person Households | 20 (3.1%) | 0 (0.0%) |
| 6-Person Households | 51 (7.9%) | 0 (0.0%) |
| 7+ Person Households | 0 (0.0%) | 0 (0.0%) |
| Total | 544 (84.2%) | 102 (15.8%) |
Female Fertility in Bayou L Ourse
Fertility by Age in Bayou L Ourse
| Age Bracket | Women with Births | Births / 1,000 Women |
| 15 to 19 years | 0 (0.0%) | 0.0 |
| 20 to 34 years | 0 (0.0%) | 0.0 |
| 35 to 50 years | 0 (0.0%) | 0.0 |
| Total | 0 (0.0%) | 0.0 |
Fertility by Age by Marriage Status in Bayou L Ourse
| Age Bracket | Married | Unmarried |
| 15 to 19 years | 0 (0.0%) | 0 (0.0%) |
| 20 to 34 years | 0 (0.0%) | 0 (0.0%) |
| 35 to 50 years | 0 (0.0%) | 0 (0.0%) |
| Total | 0 (0.0%) | 0 (0.0%) |
Fertility by Education in Bayou L Ourse
| Educational Attainment | Women with Births | Births / 1,000 Women |
| Less than High School | 0 (0.0%) | 0.0 |
| High School Diploma | 0 (0.0%) | 0.0 |
| College or Associate's Degree | 0 (0.0%) | 0.0 |
| Bachelor's Degree | 0 (0.0%) | 0.0 |
| Graduate Degree | 0 (0.0%) | 0.0 |
| Total | 0 (0.0%) | 0.0 |
Fertility by Education by Marriage Status in Bayou L Ourse
| Educational Attainment | Married | Unmarried |
| Less than High School | 0 (0.0%) | 0 (0.0%) |
| High School Diploma | 0 (0.0%) | 0 (0.0%) |
| College or Associate's Degree | 0 (0.0%) | 0 (0.0%) |
| Bachelor's Degree | 0 (0.0%) | 0 (0.0%) |
| Graduate Degree | 0 (0.0%) | 0 (0.0%) |
| Total | 0 (0.0%) | 0 (0.0%) |
Employment Characteristics in Bayou L Ourse
Employment by Class of Employer in Bayou L Ourse
Among the 653 employed individuals in Bayou L Ourse, private company employees (523 | 80.1%), state government employees (75 | 11.5%), and self-employed (incorporated) (44 | 6.7%) make up the most common classes of employment.
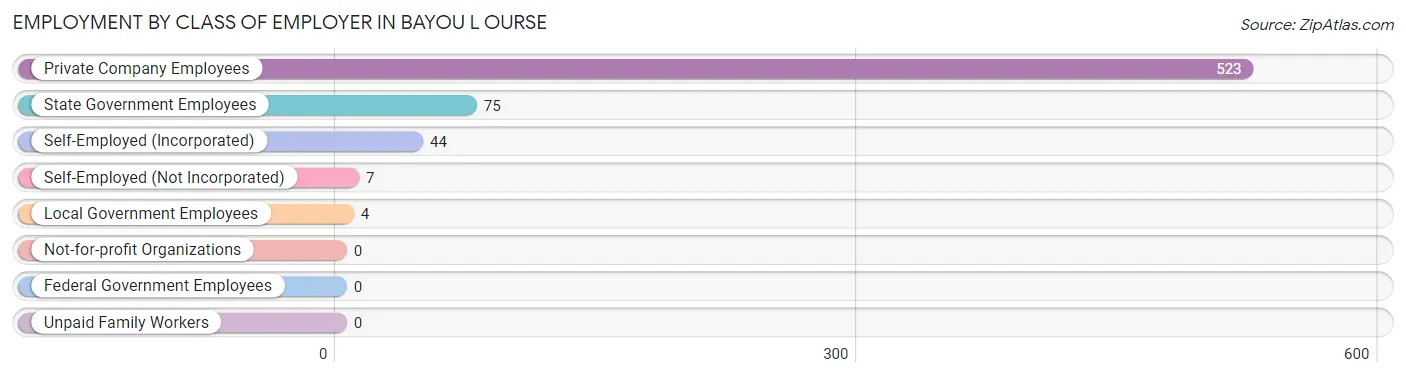
| Employer Class | # Employees | % Employees |
| Private Company Employees | 523 | 80.1% |
| Self-Employed (Incorporated) | 44 | 6.7% |
| Self-Employed (Not Incorporated) | 7 | 1.1% |
| Not-for-profit Organizations | 0 | 0.0% |
| Local Government Employees | 4 | 0.6% |
| State Government Employees | 75 | 11.5% |
| Federal Government Employees | 0 | 0.0% |
| Unpaid Family Workers | 0 | 0.0% |
| Total | 653 | 100.0% |
Employment Status by Age in Bayou L Ourse
According to the labor force statistics for Bayou L Ourse, out of the total population over 16 years of age (1,567), 51.4% or 805 individuals are in the labor force, with 11.8% or 95 of them unemployed. The age group with the highest labor force participation rate is 35 to 44 years, with 71.4% or 300 individuals in the labor force. Within the labor force, the 20 to 24 years age range has the highest percentage of unemployed individuals, with 100.0% or 66 of them being unemployed.
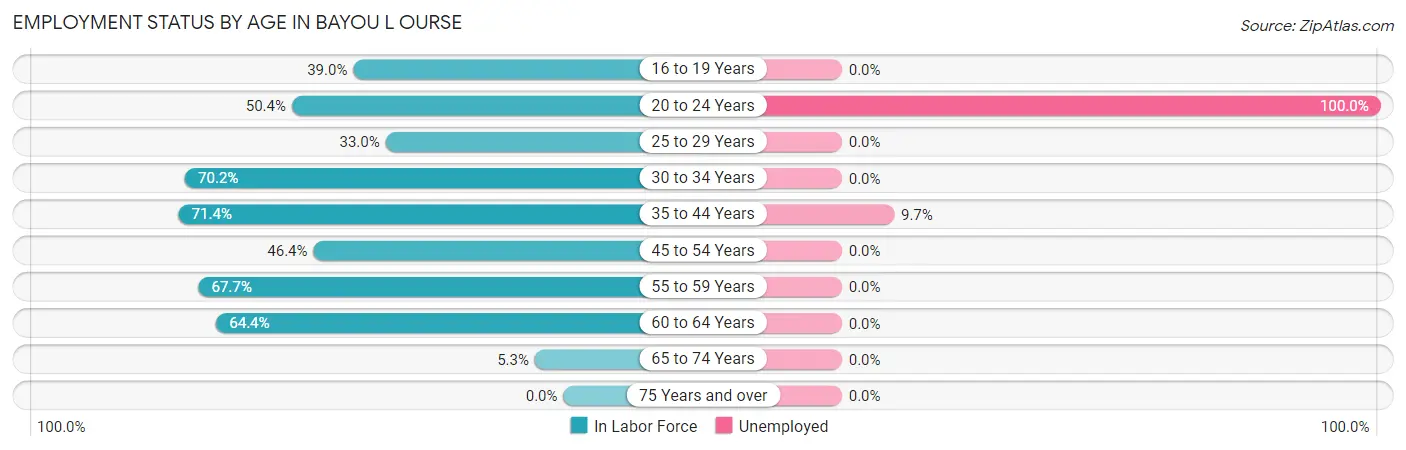
| Age Bracket | In Labor Force | Unemployed |
| 16 to 19 Years | 32 (39.0%) | 0 (0.0%) |
| 20 to 24 Years | 66 (50.4%) | 66 (100.0%) |
| 25 to 29 Years | 32 (33.0%) | 0 (0.0%) |
| 30 to 34 Years | 113 (70.2%) | 0 (0.0%) |
| 35 to 44 Years | 300 (71.4%) | 29 (9.7%) |
| 45 to 54 Years | 91 (46.4%) | 0 (0.0%) |
| 55 to 59 Years | 67 (67.7%) | 0 (0.0%) |
| 60 to 64 Years | 96 (64.4%) | 0 (0.0%) |
| 65 to 74 Years | 9 (5.3%) | 0 (0.0%) |
| 75 Years and over | 0 (0.0%) | 0 (0.0%) |
| Total | 805 (51.4%) | 95 (11.8%) |
Employment Status by Educational Attainment in Bayou L Ourse
According to labor force statistics for Bayou L Ourse, 62.3% of individuals (699) out of the total population between 25 and 64 years of age (1,122) are in the labor force, with 4.1% or 29 of them being unemployed. The group with the highest labor force participation rate are those with the educational attainment of bachelor's degree or higher, with 86.3% or 101 individuals in the labor force. Within the labor force, individuals with high school diploma education have the highest percentage of unemployment, with 10.4% or 29 of them being unemployed.
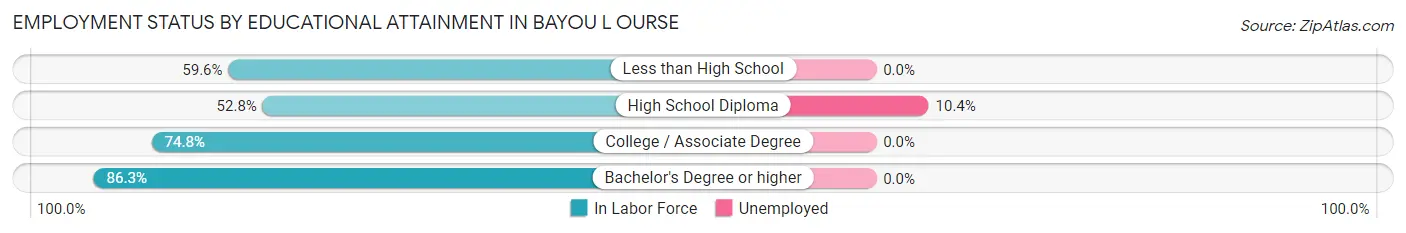
| Educational Attainment | In Labor Force | Unemployed |
| Less than High School | 146 (59.6%) | 0 (0.0%) |
| High School Diploma | 280 (52.8%) | 55 (10.4%) |
| College / Associate Degree | 172 (74.8%) | 0 (0.0%) |
| Bachelor's Degree or higher | 101 (86.3%) | 0 (0.0%) |
| Total | 699 (62.3%) | 46 (4.1%) |
Employment Occupations by Sex in Bayou L Ourse
Management, Business, Science and Arts Occupations
The most common Management, Business, Science and Arts occupations in Bayou L Ourse are Community & Social Service (79 | 11.1%), Education Instruction & Library (79 | 11.1%), and Management (7 | 1.0%).
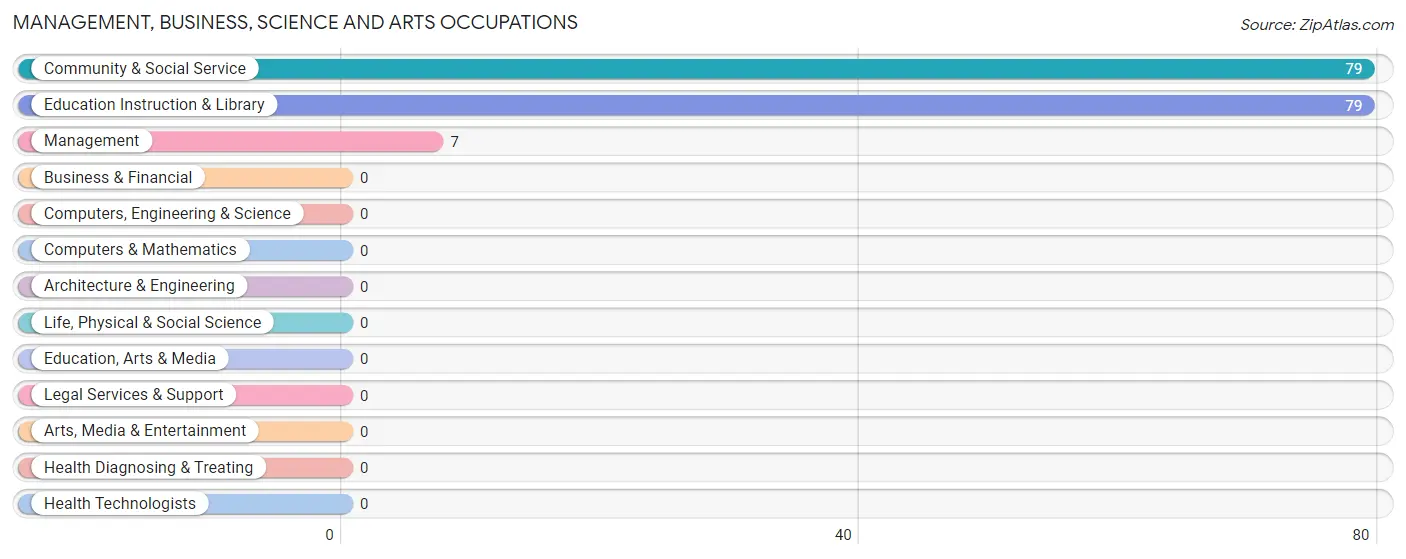
Management, Business, Science and Arts Occupations by Sex
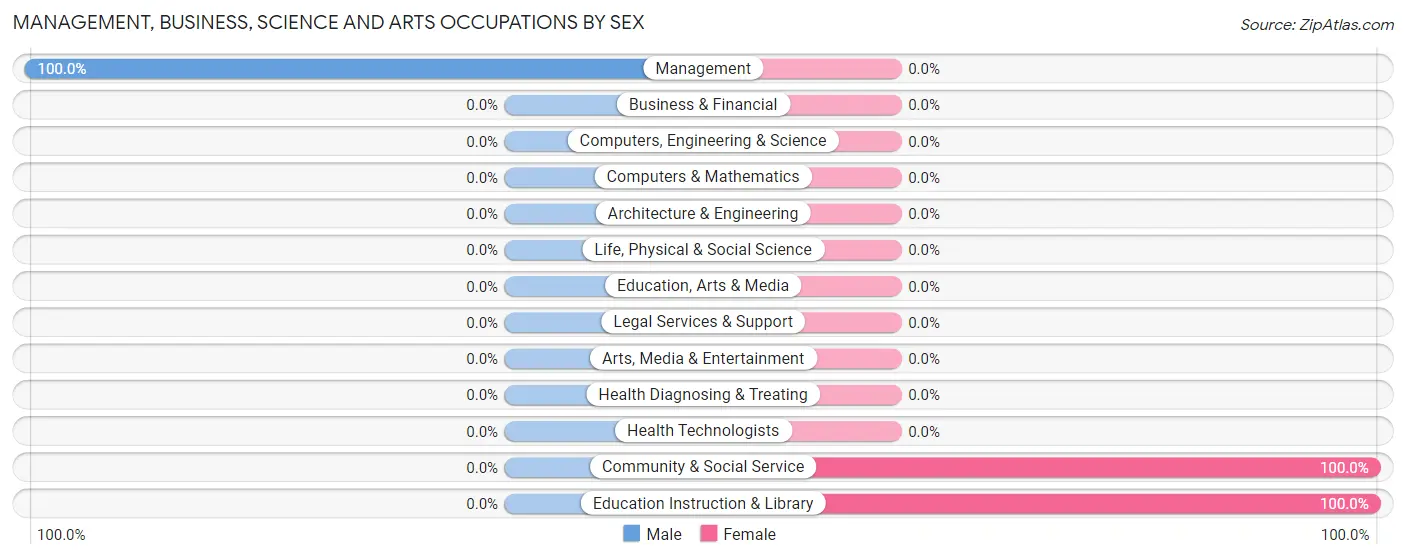
| Occupation | Male | Female |
| Management | 7 (100.0%) | 0 (0.0%) |
| Business & Financial | 0 (0.0%) | 0 (0.0%) |
| Computers, Engineering & Science | 0 (0.0%) | 0 (0.0%) |
| Computers & Mathematics | 0 (0.0%) | 0 (0.0%) |
| Architecture & Engineering | 0 (0.0%) | 0 (0.0%) |
| Life, Physical & Social Science | 0 (0.0%) | 0 (0.0%) |
| Community & Social Service | 0 (0.0%) | 79 (100.0%) |
| Education, Arts & Media | 0 (0.0%) | 0 (0.0%) |
| Legal Services & Support | 0 (0.0%) | 0 (0.0%) |
| Education Instruction & Library | 0 (0.0%) | 79 (100.0%) |
| Arts, Media & Entertainment | 0 (0.0%) | 0 (0.0%) |
| Health Diagnosing & Treating | 0 (0.0%) | 0 (0.0%) |
| Health Technologists | 0 (0.0%) | 0 (0.0%) |
| Total (Category) | 7 (8.1%) | 79 (91.9%) |
| Total (Overall) | 507 (71.3%) | 204 (28.7%) |
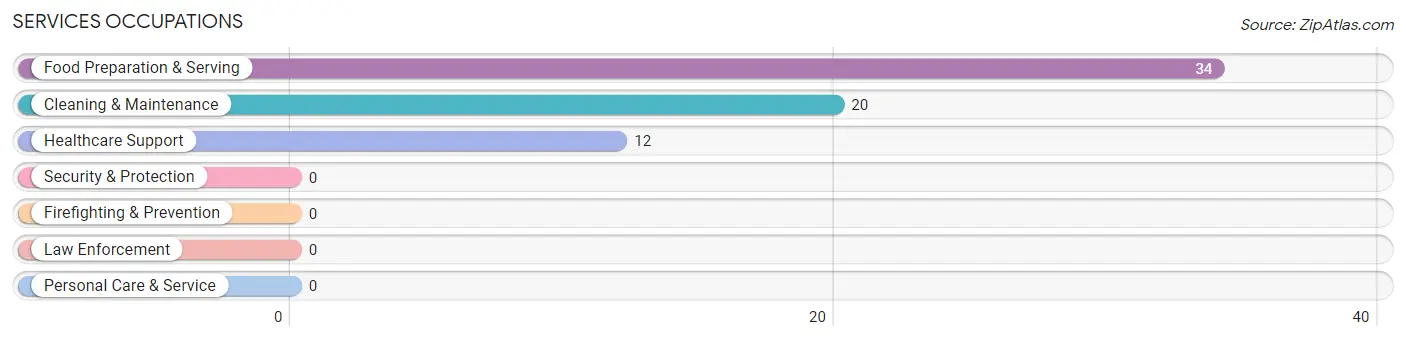
Services Occupations
The most common Services occupations in Bayou L Ourse are Food Preparation & Serving (34 | 4.8%), Cleaning & Maintenance (20 | 2.8%), and Healthcare Support (12 | 1.7%).
Services Occupations by Sex
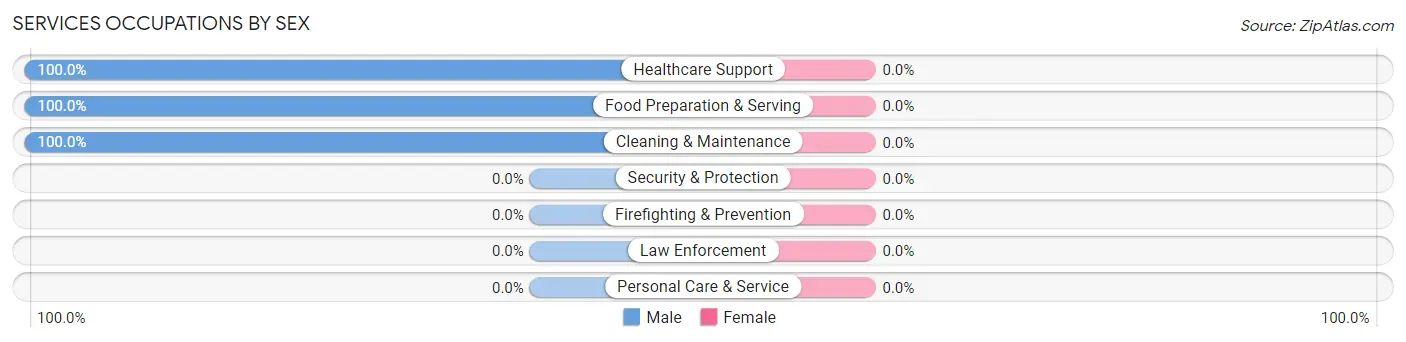
| Occupation | Male | Female |
| Healthcare Support | 12 (100.0%) | 0 (0.0%) |
| Security & Protection | 0 (0.0%) | 0 (0.0%) |
| Firefighting & Prevention | 0 (0.0%) | 0 (0.0%) |
| Law Enforcement | 0 (0.0%) | 0 (0.0%) |
| Food Preparation & Serving | 34 (100.0%) | 0 (0.0%) |
| Cleaning & Maintenance | 20 (100.0%) | 0 (0.0%) |
| Personal Care & Service | 0 (0.0%) | 0 (0.0%) |
| Total (Category) | 66 (100.0%) | 0 (0.0%) |
| Total (Overall) | 507 (71.3%) | 204 (28.7%) |
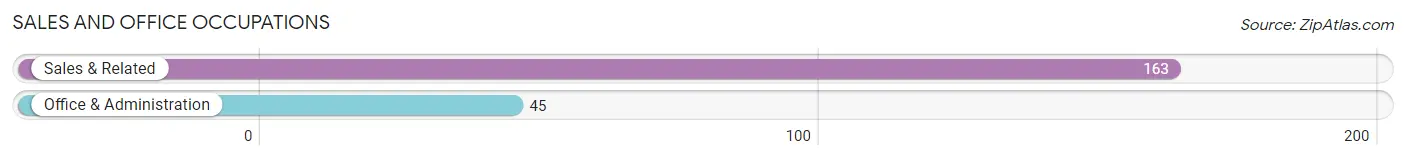
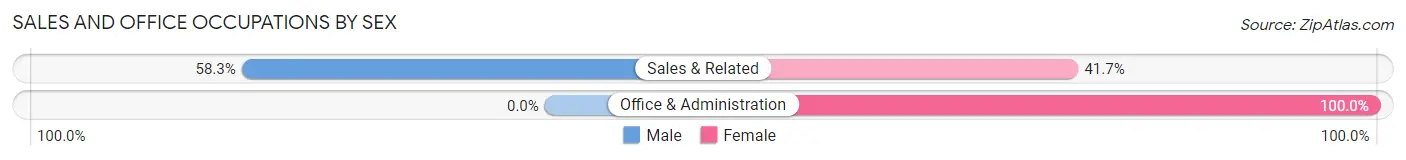
Sales and Office Occupations
The most common Sales and Office occupations in Bayou L Ourse are Sales & Related (163 | 22.9%), and Office & Administration (45 | 6.3%).
Sales and Office Occupations by Sex
| Occupation | Male | Female |
| Sales & Related | 95 (58.3%) | 68 (41.7%) |
| Office & Administration | 0 (0.0%) | 45 (100.0%) |
| Total (Category) | 95 (45.7%) | 113 (54.3%) |
| Total (Overall) | 507 (71.3%) | 204 (28.7%) |
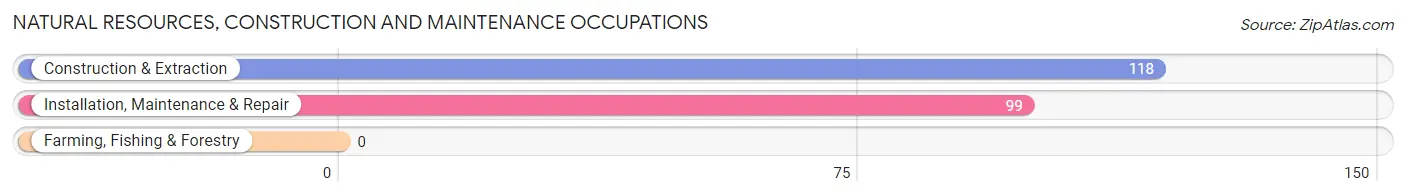
Natural Resources, Construction and Maintenance Occupations
The most common Natural Resources, Construction and Maintenance occupations in Bayou L Ourse are Construction & Extraction (118 | 16.6%), and Installation, Maintenance & Repair (99 | 13.9%).
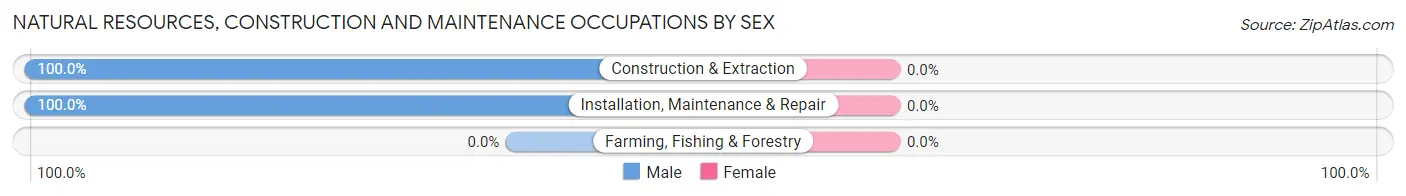
Natural Resources, Construction and Maintenance Occupations by Sex
| Occupation | Male | Female |
| Farming, Fishing & Forestry | 0 (0.0%) | 0 (0.0%) |
| Construction & Extraction | 118 (100.0%) | 0 (0.0%) |
| Installation, Maintenance & Repair | 99 (100.0%) | 0 (0.0%) |
| Total (Category) | 217 (100.0%) | 0 (0.0%) |
| Total (Overall) | 507 (71.3%) | 204 (28.7%) |
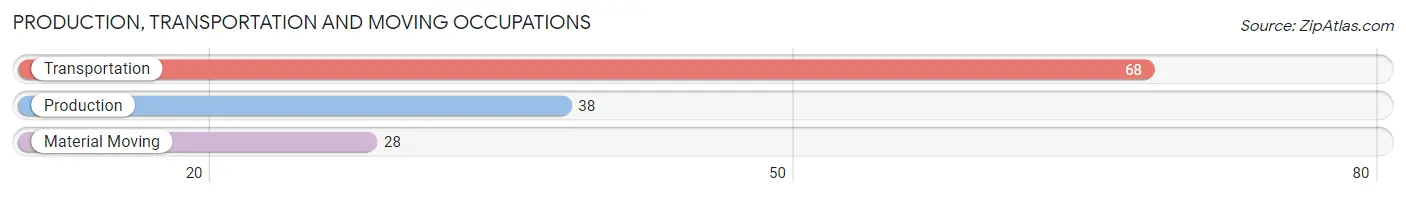
Production, Transportation and Moving Occupations
The most common Production, Transportation and Moving occupations in Bayou L Ourse are Transportation (68 | 9.6%), Production (38 | 5.3%), and Material Moving (28 | 3.9%).
Production, Transportation and Moving Occupations by Sex
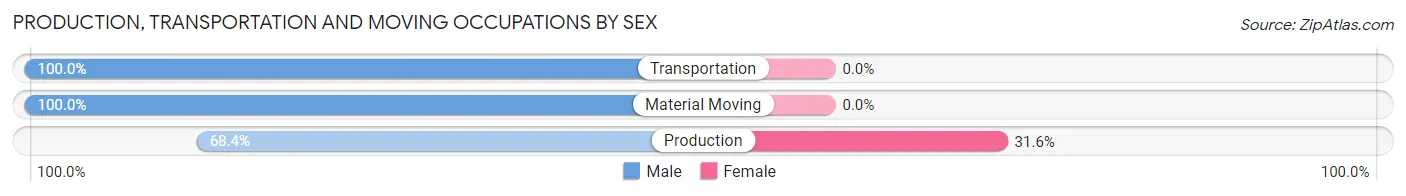
| Occupation | Male | Female |
| Production | 26 (68.4%) | 12 (31.6%) |
| Transportation | 68 (100.0%) | 0 (0.0%) |
| Material Moving | 28 (100.0%) | 0 (0.0%) |
| Total (Category) | 122 (91.0%) | 12 (9.0%) |
| Total (Overall) | 507 (71.3%) | 204 (28.7%) |
Employment Industries by Sex in Bayou L Ourse
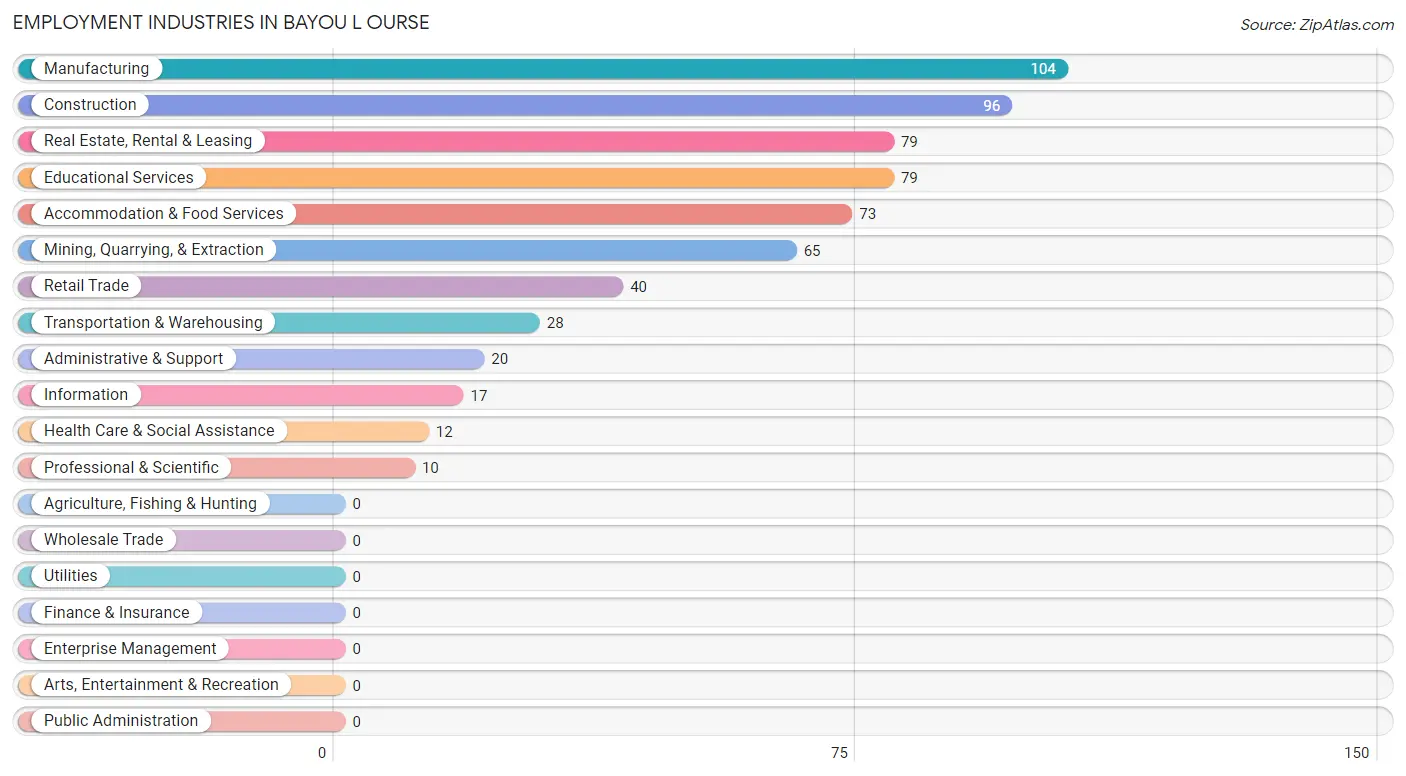
Employment Industries in Bayou L Ourse
The major employment industries in Bayou L Ourse include Manufacturing (104 | 14.6%), Construction (96 | 13.5%), Real Estate, Rental & Leasing (79 | 11.1%), Educational Services (79 | 11.1%), and Accommodation & Food Services (73 | 10.3%).
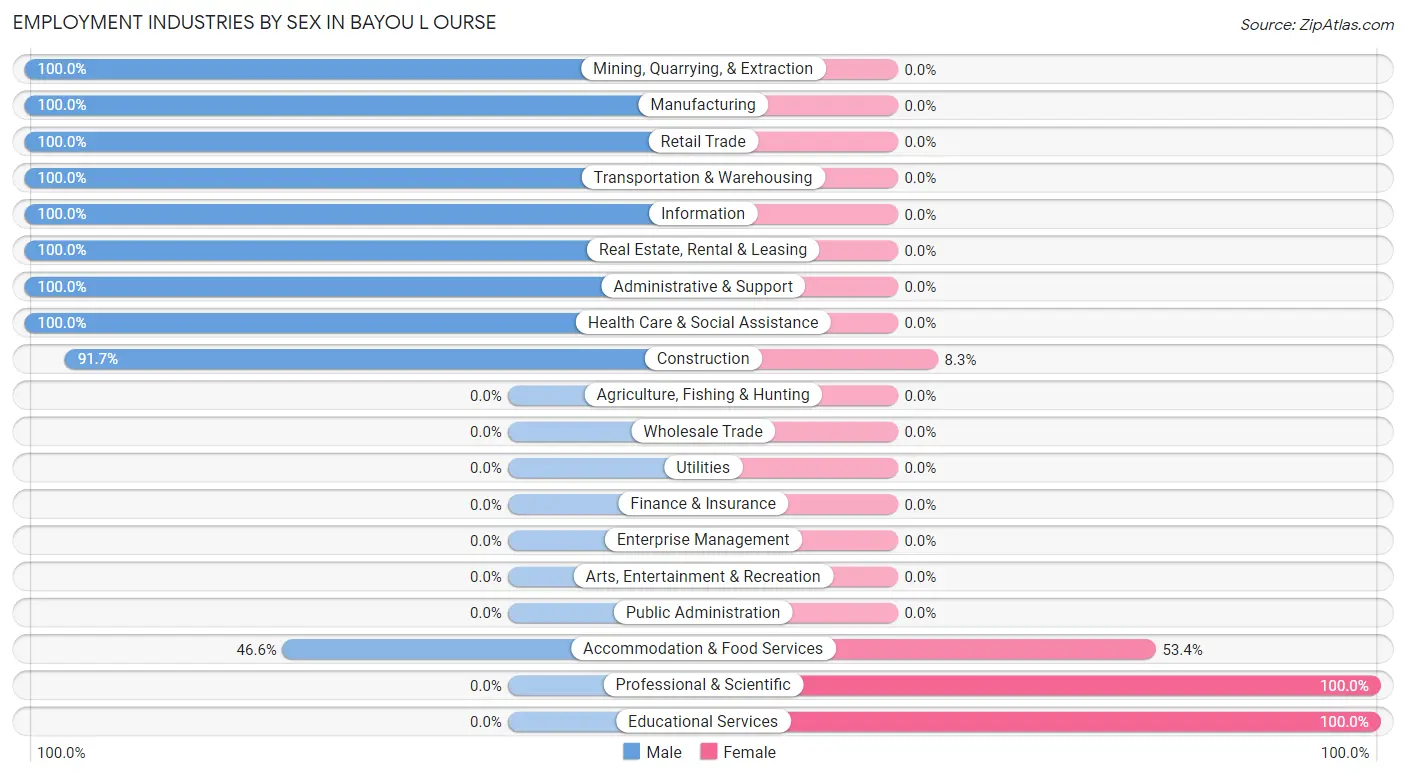
Employment Industries by Sex in Bayou L Ourse
The Bayou L Ourse industries that see more men than women are Mining, Quarrying, & Extraction (100.0%), Manufacturing (100.0%), and Retail Trade (100.0%), whereas the industries that tend to have a higher number of women are Professional & Scientific (100.0%), Educational Services (100.0%), and Accommodation & Food Services (53.4%).
| Industry | Male | Female |
| Agriculture, Fishing & Hunting | 0 (0.0%) | 0 (0.0%) |
| Mining, Quarrying, & Extraction | 65 (100.0%) | 0 (0.0%) |
| Construction | 88 (91.7%) | 8 (8.3%) |
| Manufacturing | 104 (100.0%) | 0 (0.0%) |
| Wholesale Trade | 0 (0.0%) | 0 (0.0%) |
| Retail Trade | 40 (100.0%) | 0 (0.0%) |
| Transportation & Warehousing | 28 (100.0%) | 0 (0.0%) |
| Utilities | 0 (0.0%) | 0 (0.0%) |
| Information | 17 (100.0%) | 0 (0.0%) |
| Finance & Insurance | 0 (0.0%) | 0 (0.0%) |
| Real Estate, Rental & Leasing | 79 (100.0%) | 0 (0.0%) |
| Professional & Scientific | 0 (0.0%) | 10 (100.0%) |
| Enterprise Management | 0 (0.0%) | 0 (0.0%) |
| Administrative & Support | 20 (100.0%) | 0 (0.0%) |
| Educational Services | 0 (0.0%) | 79 (100.0%) |
| Health Care & Social Assistance | 12 (100.0%) | 0 (0.0%) |
| Arts, Entertainment & Recreation | 0 (0.0%) | 0 (0.0%) |
| Accommodation & Food Services | 34 (46.6%) | 39 (53.4%) |
| Public Administration | 0 (0.0%) | 0 (0.0%) |
| Total | 507 (71.3%) | 204 (28.7%) |
Education in Bayou L Ourse
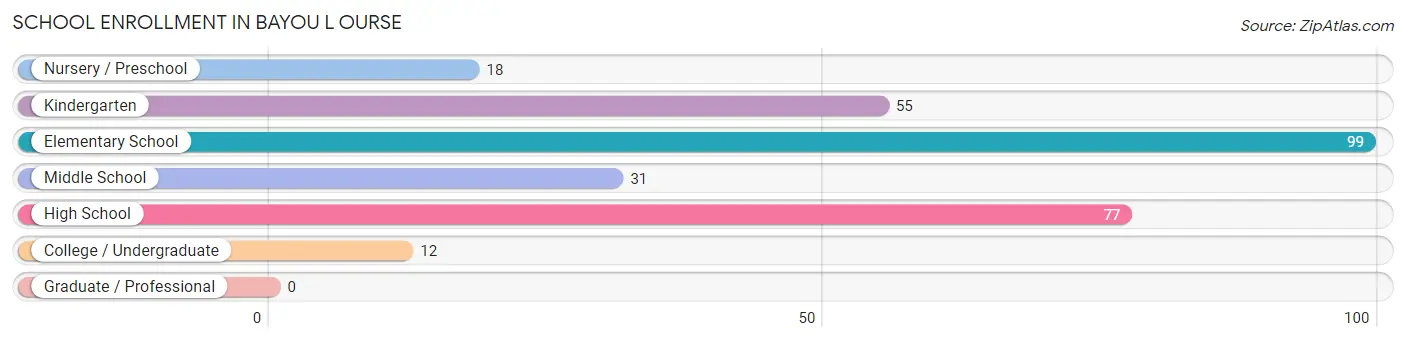
School Enrollment in Bayou L Ourse
The most common levels of schooling among the 292 students in Bayou L Ourse are elementary school (99 | 33.9%), high school (77 | 26.4%), and kindergarten (55 | 18.8%).
| School Level | # Students | % Students |
| Nursery / Preschool | 18 | 6.2% |
| Kindergarten | 55 | 18.8% |
| Elementary School | 99 | 33.9% |
| Middle School | 31 | 10.6% |
| High School | 77 | 26.4% |
| College / Undergraduate | 12 | 4.1% |
| Graduate / Professional | 0 | 0.0% |
| Total | 292 | 100.0% |
School Enrollment by Age by Funding Source in Bayou L Ourse
Out of a total of 292 students who are enrolled in schools in Bayou L Ourse, 165 (56.5%) attend a private institution, while the remaining 127 (43.5%) are enrolled in public schools. The age group of 15 to 17 year olds has the highest likelihood of being enrolled in private schools, with 29 (76.3% in the age bracket) enrolled. Conversely, the age group of 18 to 19 year olds has the lowest likelihood of being enrolled in a private school, with 12 (100.0% in the age bracket) attending a public institution.
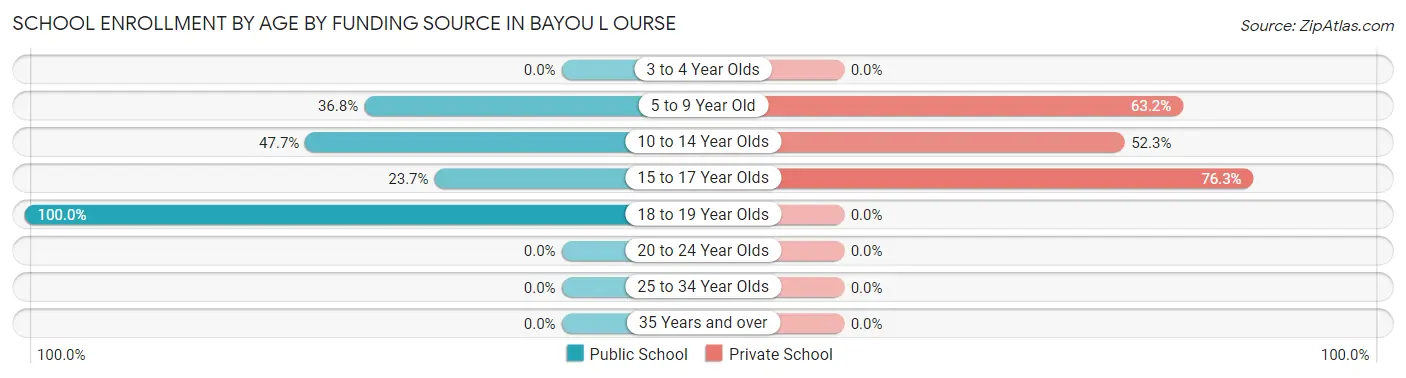
| Age Bracket | Public School | Private School |
| 3 to 4 Year Olds | 0 (0.0%) | 0 (0.0%) |
| 5 to 9 Year Old | 32 (36.8%) | 55 (63.2%) |
| 10 to 14 Year Olds | 74 (47.7%) | 81 (52.3%) |
| 15 to 17 Year Olds | 9 (23.7%) | 29 (76.3%) |
| 18 to 19 Year Olds | 12 (100.0%) | 0 (0.0%) |
| 20 to 24 Year Olds | 0 (0.0%) | 0 (0.0%) |
| 25 to 34 Year Olds | 0 (0.0%) | 0 (0.0%) |
| 35 Years and over | 0 (0.0%) | 0 (0.0%) |
| Total | 127 (43.5%) | 165 (56.5%) |
Educational Attainment by Field of Study in Bayou L Ourse
Engineering (75 | 57.3%), education (34 | 26.0%), computers & mathematics (12 | 9.2%), and science & technology (10 | 7.6%) are the most common fields of study among 131 individuals in Bayou L Ourse who have obtained a bachelor's degree or higher.
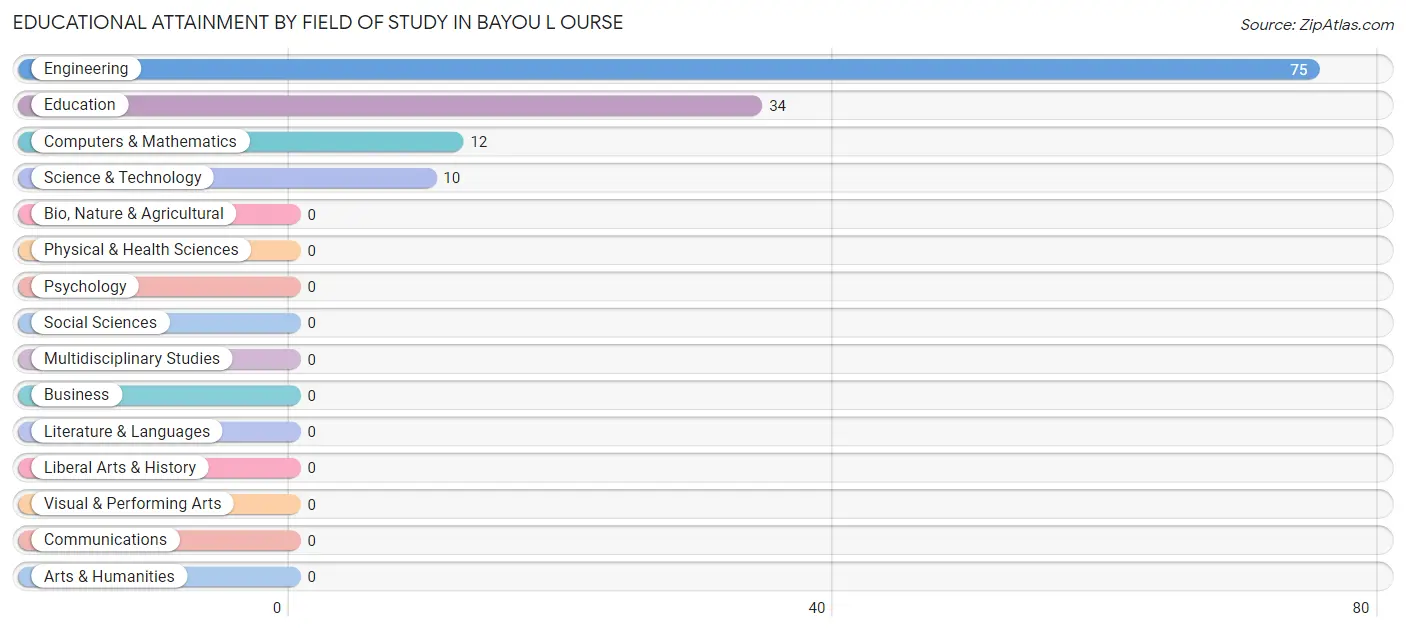
| Field of Study | # Graduates | % Graduates |
| Computers & Mathematics | 12 | 9.2% |
| Bio, Nature & Agricultural | 0 | 0.0% |
| Physical & Health Sciences | 0 | 0.0% |
| Psychology | 0 | 0.0% |
| Social Sciences | 0 | 0.0% |
| Engineering | 75 | 57.3% |
| Multidisciplinary Studies | 0 | 0.0% |
| Science & Technology | 10 | 7.6% |
| Business | 0 | 0.0% |
| Education | 34 | 26.0% |
| Literature & Languages | 0 | 0.0% |
| Liberal Arts & History | 0 | 0.0% |
| Visual & Performing Arts | 0 | 0.0% |
| Communications | 0 | 0.0% |
| Arts & Humanities | 0 | 0.0% |
| Total | 131 | 100.0% |
Transportation & Commute in Bayou L Ourse
Vehicle Availability by Sex in Bayou L Ourse
The most prevalent vehicle ownership categories in Bayou L Ourse are males with 2 vehicles (318, accounting for 69.0%) and females with 2 vehicles (97, making up 165.6%).
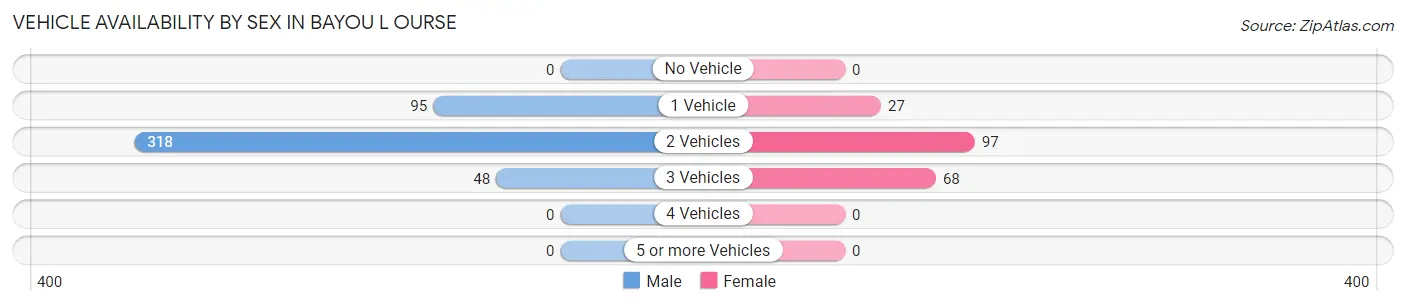
| Vehicles Available | Male | Female |
| No Vehicle | 0 (0.0%) | 0 (0.0%) |
| 1 Vehicle | 95 (20.6%) | 27 (14.1%) |
| 2 Vehicles | 318 (69.0%) | 97 (50.5%) |
| 3 Vehicles | 48 (10.4%) | 68 (35.4%) |
| 4 Vehicles | 0 (0.0%) | 0 (0.0%) |
| 5 or more Vehicles | 0 (0.0%) | 0 (0.0%) |
| Total | 461 (100.0%) | 192 (100.0%) |
Commute Time in Bayou L Ourse
The most frequently occuring commute durations in Bayou L Ourse are 15 to 19 minutes (154 commuters, 24.6%), 30 to 34 minutes (116 commuters, 18.5%), and 10 to 14 minutes (78 commuters, 12.5%).
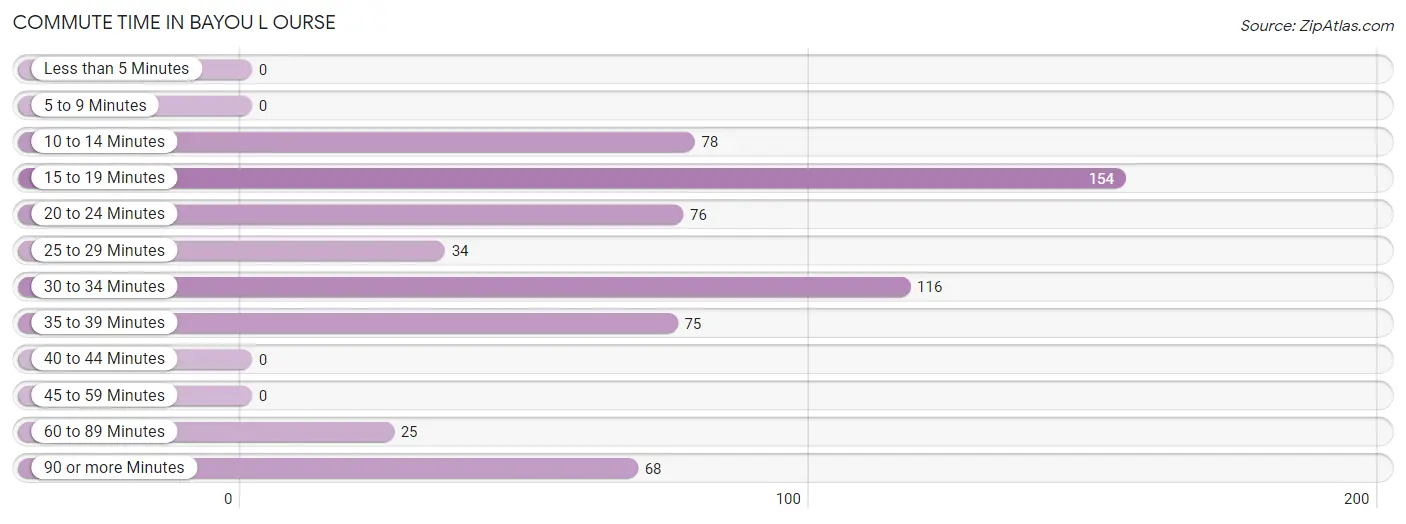
| Commute Time | # Commuters | % Commuters |
| Less than 5 Minutes | 0 | 0.0% |
| 5 to 9 Minutes | 0 | 0.0% |
| 10 to 14 Minutes | 78 | 12.5% |
| 15 to 19 Minutes | 154 | 24.6% |
| 20 to 24 Minutes | 76 | 12.1% |
| 25 to 29 Minutes | 34 | 5.4% |
| 30 to 34 Minutes | 116 | 18.5% |
| 35 to 39 Minutes | 75 | 12.0% |
| 40 to 44 Minutes | 0 | 0.0% |
| 45 to 59 Minutes | 0 | 0.0% |
| 60 to 89 Minutes | 25 | 4.0% |
| 90 or more Minutes | 68 | 10.9% |
Commute Time by Sex in Bayou L Ourse
The most common commute times in Bayou L Ourse are 15 to 19 minutes (154 commuters, 35.5%) for males and 30 to 34 minutes (105 commuters, 54.7%) for females.
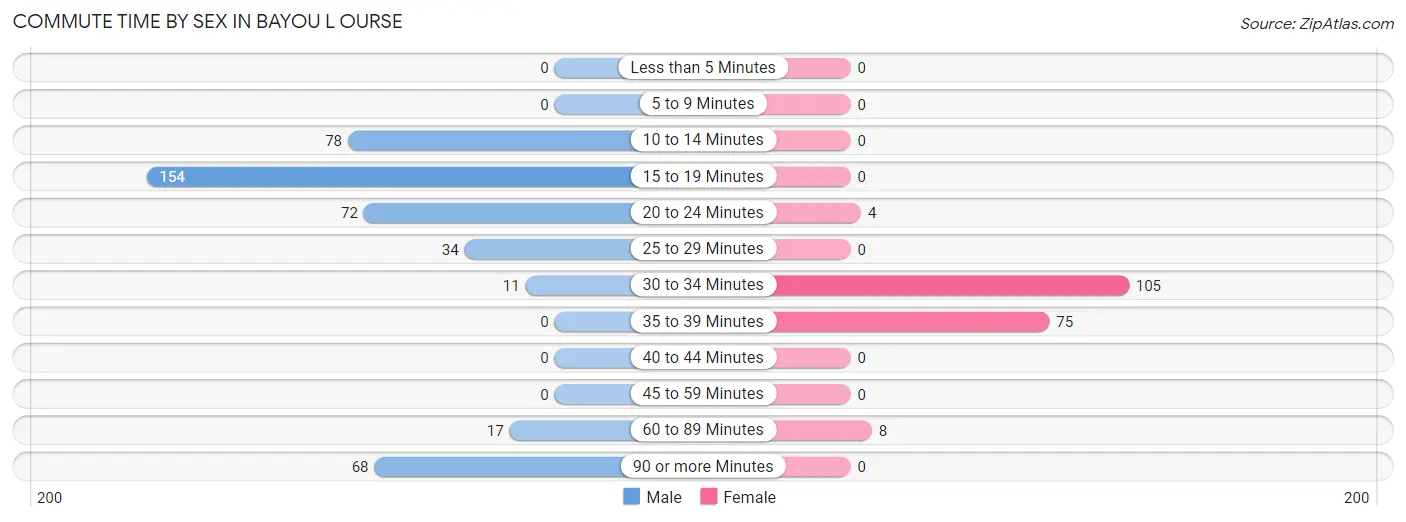
| Commute Time | Male | Female |
| Less than 5 Minutes | 0 (0.0%) | 0 (0.0%) |
| 5 to 9 Minutes | 0 (0.0%) | 0 (0.0%) |
| 10 to 14 Minutes | 78 (18.0%) | 0 (0.0%) |
| 15 to 19 Minutes | 154 (35.5%) | 0 (0.0%) |
| 20 to 24 Minutes | 72 (16.6%) | 4 (2.1%) |
| 25 to 29 Minutes | 34 (7.8%) | 0 (0.0%) |
| 30 to 34 Minutes | 11 (2.5%) | 105 (54.7%) |
| 35 to 39 Minutes | 0 (0.0%) | 75 (39.1%) |
| 40 to 44 Minutes | 0 (0.0%) | 0 (0.0%) |
| 45 to 59 Minutes | 0 (0.0%) | 0 (0.0%) |
| 60 to 89 Minutes | 17 (3.9%) | 8 (4.2%) |
| 90 or more Minutes | 68 (15.7%) | 0 (0.0%) |
Time of Departure to Work by Sex in Bayou L Ourse
The most frequent times of departure to work in Bayou L Ourse are 7:00 AM to 7:29 AM (115, 26.5%) for males and 7:00 AM to 7:29 AM (99, 51.6%) for females.
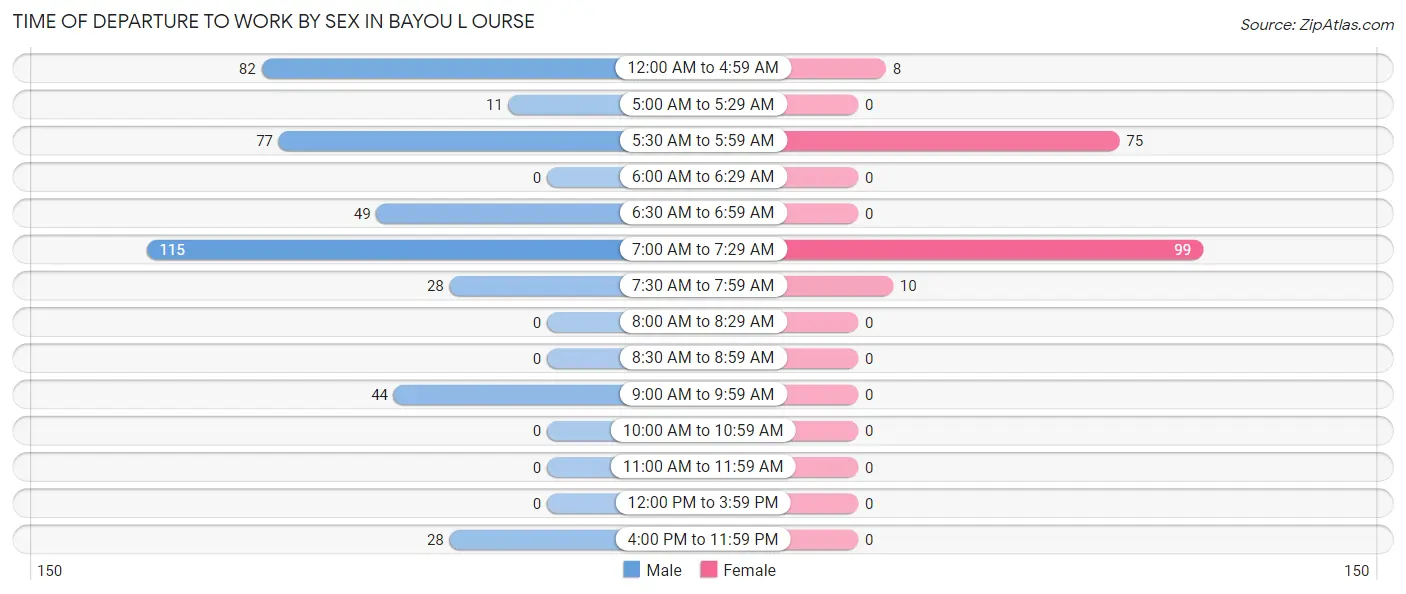
| Time of Departure | Male | Female |
| 12:00 AM to 4:59 AM | 82 (18.9%) | 8 (4.2%) |
| 5:00 AM to 5:29 AM | 11 (2.5%) | 0 (0.0%) |
| 5:30 AM to 5:59 AM | 77 (17.7%) | 75 (39.1%) |
| 6:00 AM to 6:29 AM | 0 (0.0%) | 0 (0.0%) |
| 6:30 AM to 6:59 AM | 49 (11.3%) | 0 (0.0%) |
| 7:00 AM to 7:29 AM | 115 (26.5%) | 99 (51.6%) |
| 7:30 AM to 7:59 AM | 28 (6.5%) | 10 (5.2%) |
| 8:00 AM to 8:29 AM | 0 (0.0%) | 0 (0.0%) |
| 8:30 AM to 8:59 AM | 0 (0.0%) | 0 (0.0%) |
| 9:00 AM to 9:59 AM | 44 (10.1%) | 0 (0.0%) |
| 10:00 AM to 10:59 AM | 0 (0.0%) | 0 (0.0%) |
| 11:00 AM to 11:59 AM | 0 (0.0%) | 0 (0.0%) |
| 12:00 PM to 3:59 PM | 0 (0.0%) | 0 (0.0%) |
| 4:00 PM to 11:59 PM | 28 (6.5%) | 0 (0.0%) |
| Total | 434 (100.0%) | 192 (100.0%) |
Housing Occupancy in Bayou L Ourse
Occupancy by Ownership in Bayou L Ourse
Of the total 646 dwellings in Bayou L Ourse, owner-occupied units account for 587 (90.9%), while renter-occupied units make up 59 (9.1%).
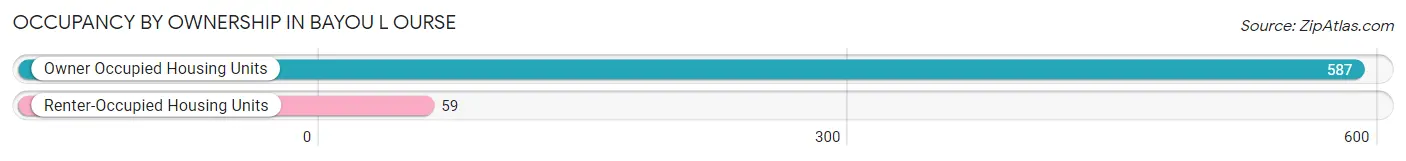
| Occupancy | # Housing Units | % Housing Units |
| Owner Occupied Housing Units | 587 | 90.9% |
| Renter-Occupied Housing Units | 59 | 9.1% |
| Total Occupied Housing Units | 646 | 100.0% |
Occupancy by Household Size in Bayou L Ourse
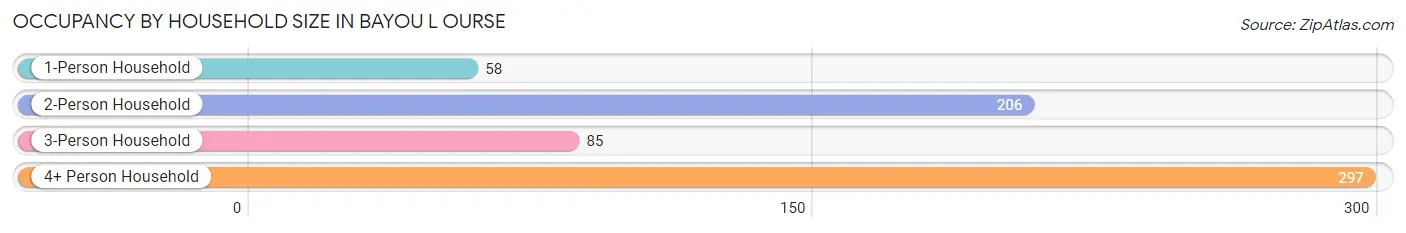
| Household Size | # Housing Units | % Housing Units |
| 1-Person Household | 58 | 9.0% |
| 2-Person Household | 206 | 31.9% |
| 3-Person Household | 85 | 13.2% |
| 4+ Person Household | 297 | 46.0% |
| Total Housing Units | 646 | 100.0% |
Occupancy by Ownership by Household Size in Bayou L Ourse
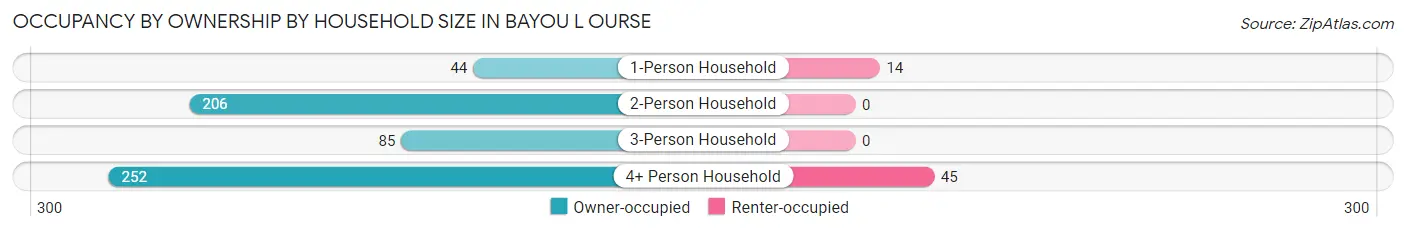
| Household Size | Owner-occupied | Renter-occupied |
| 1-Person Household | 44 (75.9%) | 14 (24.1%) |
| 2-Person Household | 206 (100.0%) | 0 (0.0%) |
| 3-Person Household | 85 (100.0%) | 0 (0.0%) |
| 4+ Person Household | 252 (84.9%) | 45 (15.1%) |
| Total Housing Units | 587 (90.9%) | 59 (9.1%) |
Occupancy by Educational Attainment in Bayou L Ourse
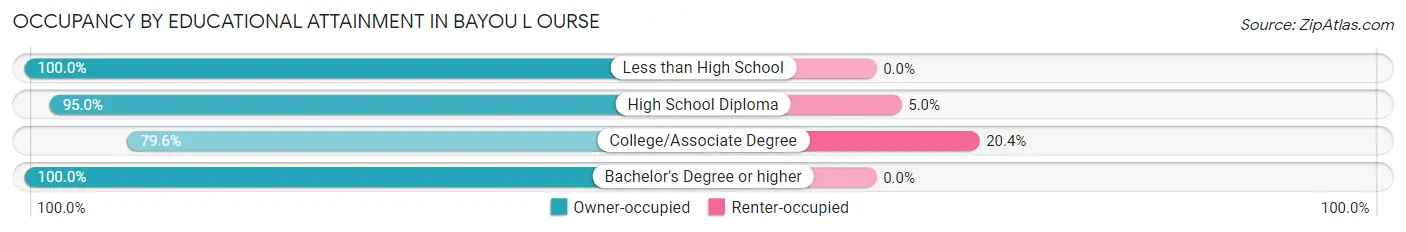
| Household Size | Owner-occupied | Renter-occupied |
| Less than High School | 176 (100.0%) | 0 (0.0%) |
| High School Diploma | 210 (95.0%) | 11 (5.0%) |
| College/Associate Degree | 187 (79.6%) | 48 (20.4%) |
| Bachelor's Degree or higher | 14 (100.0%) | 0 (0.0%) |
Occupancy by Age of Householder in Bayou L Ourse
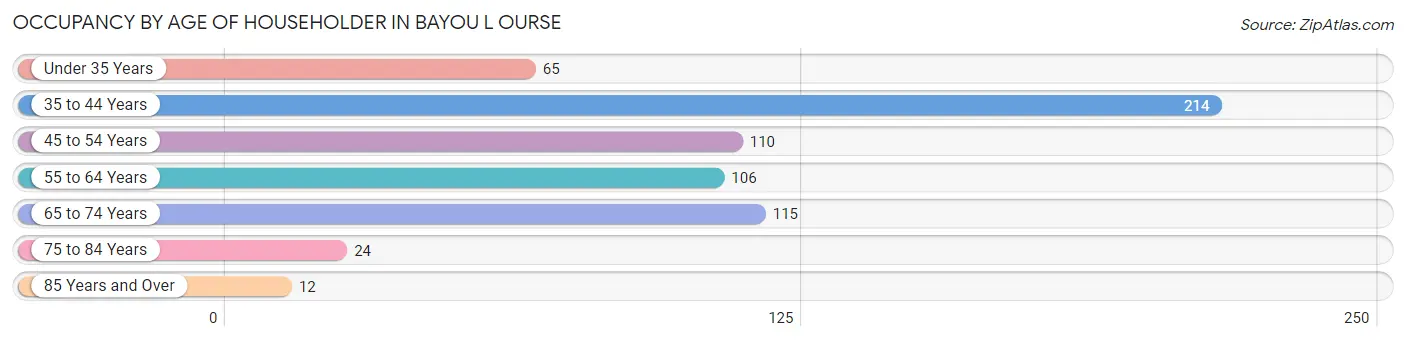
| Age Bracket | # Households | % Households |
| Under 35 Years | 65 | 10.1% |
| 35 to 44 Years | 214 | 33.1% |
| 45 to 54 Years | 110 | 17.0% |
| 55 to 64 Years | 106 | 16.4% |
| 65 to 74 Years | 115 | 17.8% |
| 75 to 84 Years | 24 | 3.7% |
| 85 Years and Over | 12 | 1.9% |
| Total | 646 | 100.0% |
Housing Finances in Bayou L Ourse
Median Income by Occupancy in Bayou L Ourse
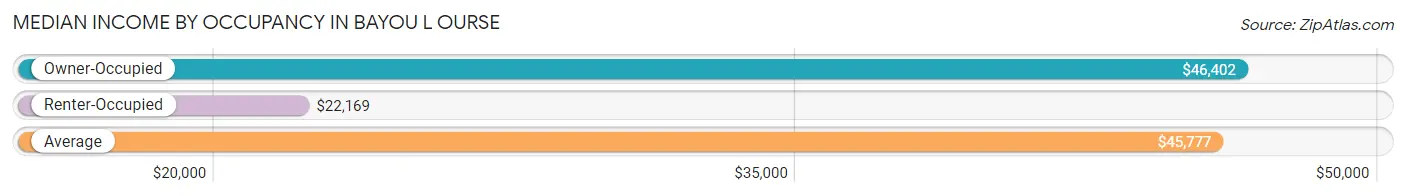
| Occupancy Type | # Households | Median Income |
| Owner-Occupied | 587 (90.9%) | $46,402 |
| Renter-Occupied | 59 (9.1%) | $22,169 |
| Average | 646 (100.0%) | $45,777 |
Occupancy by Householder Income Bracket in Bayou L Ourse

| Income Bracket | Owner-occupied | Renter-occupied |
| Less than $5,000 | 53 (9.0%) | 0 (0.0%) |
| $5,000 to $9,999 | 17 (2.9%) | 0 (0.0%) |
| $10,000 to $14,999 | 0 (0.0%) | 0 (0.0%) |
| $15,000 to $19,999 | 11 (1.9%) | 0 (0.0%) |
| $20,000 to $24,999 | 22 (3.7%) | 48 (81.4%) |
| $25,000 to $34,999 | 94 (16.0%) | 0 (0.0%) |
| $35,000 to $49,999 | 129 (22.0%) | 0 (0.0%) |
| $50,000 to $74,999 | 56 (9.5%) | 11 (18.6%) |
| $75,000 to $99,999 | 48 (8.2%) | 0 (0.0%) |
| $100,000 to $149,999 | 129 (22.0%) | 0 (0.0%) |
| $150,000 or more | 28 (4.8%) | 0 (0.0%) |
| Total | 587 (100.0%) | 59 (100.0%) |
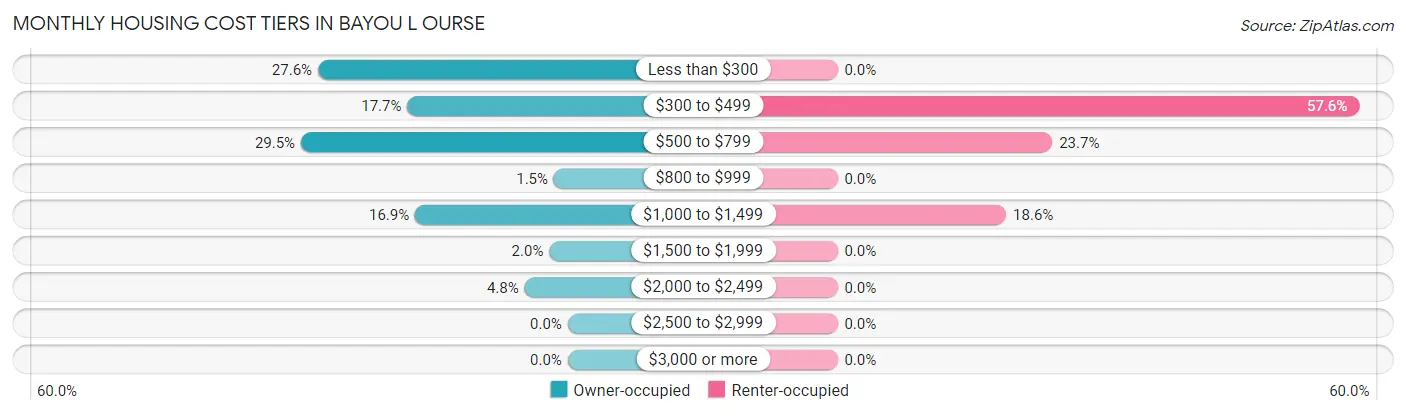
Monthly Housing Cost Tiers in Bayou L Ourse
| Monthly Cost | Owner-occupied | Renter-occupied |
| Less than $300 | 162 (27.6%) | 0 (0.0%) |
| $300 to $499 | 104 (17.7%) | 34 (57.6%) |
| $500 to $799 | 173 (29.5%) | 14 (23.7%) |
| $800 to $999 | 9 (1.5%) | 0 (0.0%) |
| $1,000 to $1,499 | 99 (16.9%) | 11 (18.6%) |
| $1,500 to $1,999 | 12 (2.0%) | 0 (0.0%) |
| $2,000 to $2,499 | 28 (4.8%) | 0 (0.0%) |
| $2,500 to $2,999 | 0 (0.0%) | 0 (0.0%) |
| $3,000 or more | 0 (0.0%) | 0 (0.0%) |
| Total | 587 (100.0%) | 59 (100.0%) |
Physical Housing Characteristics in Bayou L Ourse
Housing Structures in Bayou L Ourse
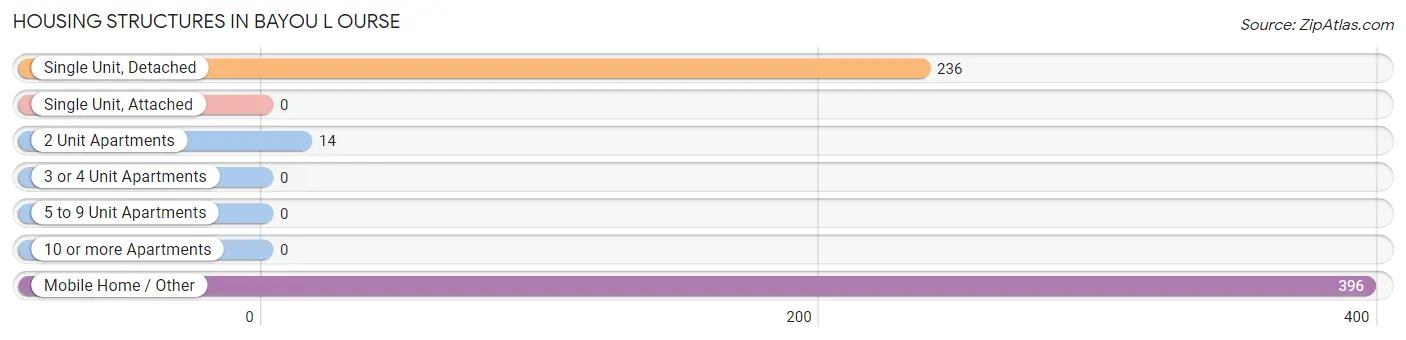
| Structure Type | # Housing Units | % Housing Units |
| Single Unit, Detached | 236 | 36.5% |
| Single Unit, Attached | 0 | 0.0% |
| 2 Unit Apartments | 14 | 2.2% |
| 3 or 4 Unit Apartments | 0 | 0.0% |
| 5 to 9 Unit Apartments | 0 | 0.0% |
| 10 or more Apartments | 0 | 0.0% |
| Mobile Home / Other | 396 | 61.3% |
| Total | 646 | 100.0% |
Housing Structures by Occupancy in Bayou L Ourse
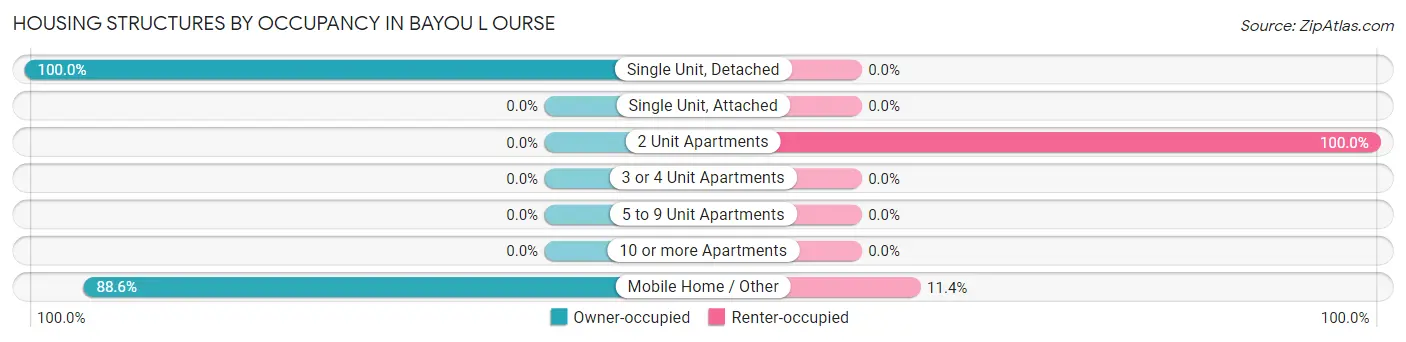
| Structure Type | Owner-occupied | Renter-occupied |
| Single Unit, Detached | 236 (100.0%) | 0 (0.0%) |
| Single Unit, Attached | 0 (0.0%) | 0 (0.0%) |
| 2 Unit Apartments | 0 (0.0%) | 14 (100.0%) |
| 3 or 4 Unit Apartments | 0 (0.0%) | 0 (0.0%) |
| 5 to 9 Unit Apartments | 0 (0.0%) | 0 (0.0%) |
| 10 or more Apartments | 0 (0.0%) | 0 (0.0%) |
| Mobile Home / Other | 351 (88.6%) | 45 (11.4%) |
| Total | 587 (90.9%) | 59 (9.1%) |
Housing Structures by Number of Rooms in Bayou L Ourse
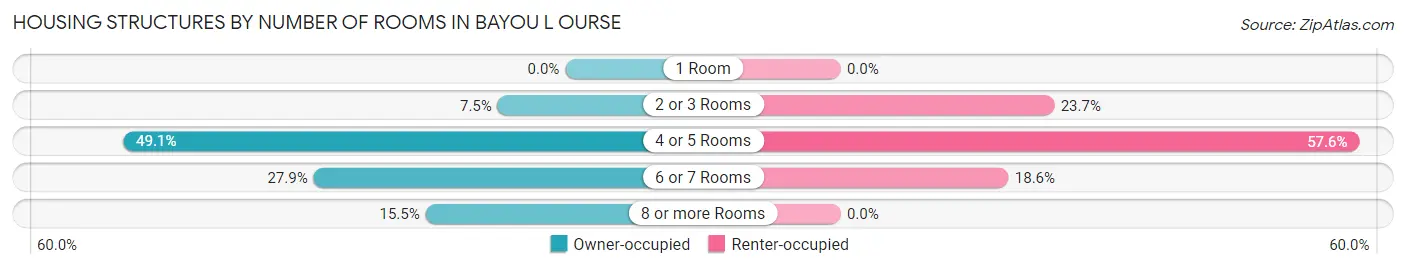
| Number of Rooms | Owner-occupied | Renter-occupied |
| 1 Room | 0 (0.0%) | 0 (0.0%) |
| 2 or 3 Rooms | 44 (7.5%) | 14 (23.7%) |
| 4 or 5 Rooms | 288 (49.1%) | 34 (57.6%) |
| 6 or 7 Rooms | 164 (27.9%) | 11 (18.6%) |
| 8 or more Rooms | 91 (15.5%) | 0 (0.0%) |
| Total | 587 (100.0%) | 59 (100.0%) |
Housing Structure by Heating Type in Bayou L Ourse
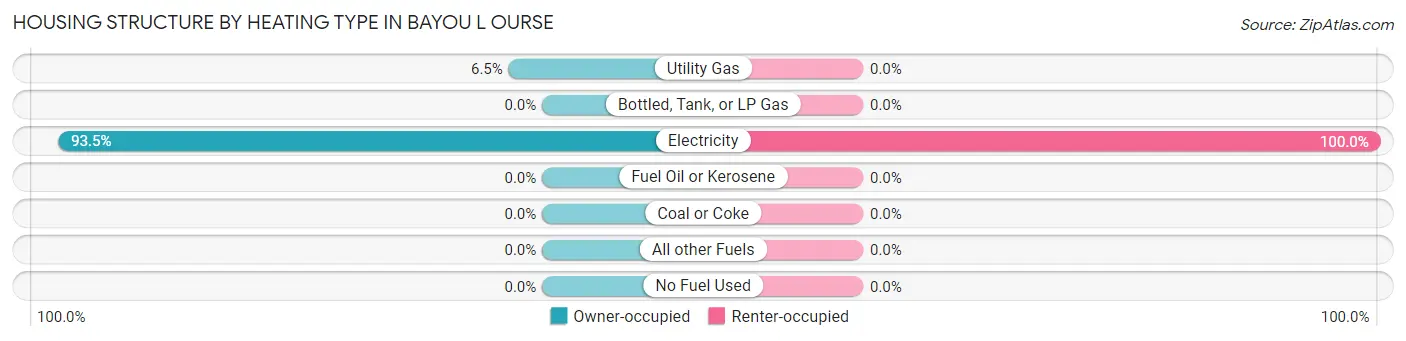
| Heating Type | Owner-occupied | Renter-occupied |
| Utility Gas | 38 (6.5%) | 0 (0.0%) |
| Bottled, Tank, or LP Gas | 0 (0.0%) | 0 (0.0%) |
| Electricity | 549 (93.5%) | 59 (100.0%) |
| Fuel Oil or Kerosene | 0 (0.0%) | 0 (0.0%) |
| Coal or Coke | 0 (0.0%) | 0 (0.0%) |
| All other Fuels | 0 (0.0%) | 0 (0.0%) |
| No Fuel Used | 0 (0.0%) | 0 (0.0%) |
| Total | 587 (100.0%) | 59 (100.0%) |
Household Vehicle Usage in Bayou L Ourse
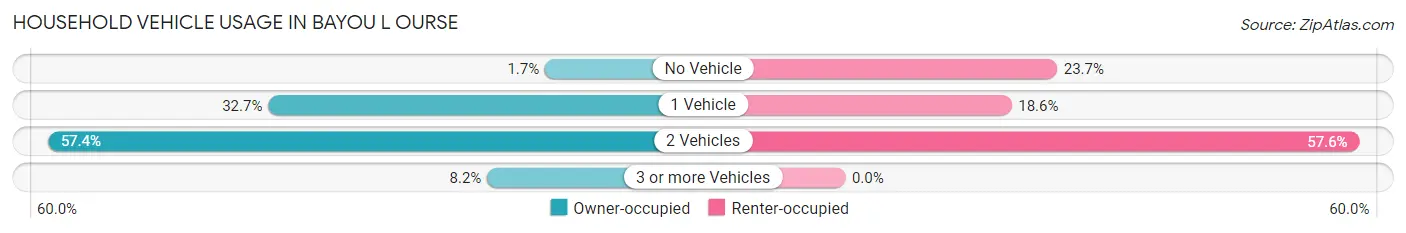
| Vehicles per Household | Owner-occupied | Renter-occupied |
| No Vehicle | 10 (1.7%) | 14 (23.7%) |
| 1 Vehicle | 192 (32.7%) | 11 (18.6%) |
| 2 Vehicles | 337 (57.4%) | 34 (57.6%) |
| 3 or more Vehicles | 48 (8.2%) | 0 (0.0%) |
| Total | 587 (100.0%) | 59 (100.0%) |
Real Estate & Mortgages in Bayou L Ourse
Real Estate and Mortgage Overview in Bayou L Ourse
| Characteristic | Without Mortgage | With Mortgage |
| Housing Units | 424 | 163 |
| Median Property Value | $78,400 | $80,800 |
| Median Household Income | $44,034 | $10 |
| Monthly Housing Costs | $337 | $0 |
| Real Estate Taxes | $289 | $33 |
Property Value by Mortgage Status in Bayou L Ourse
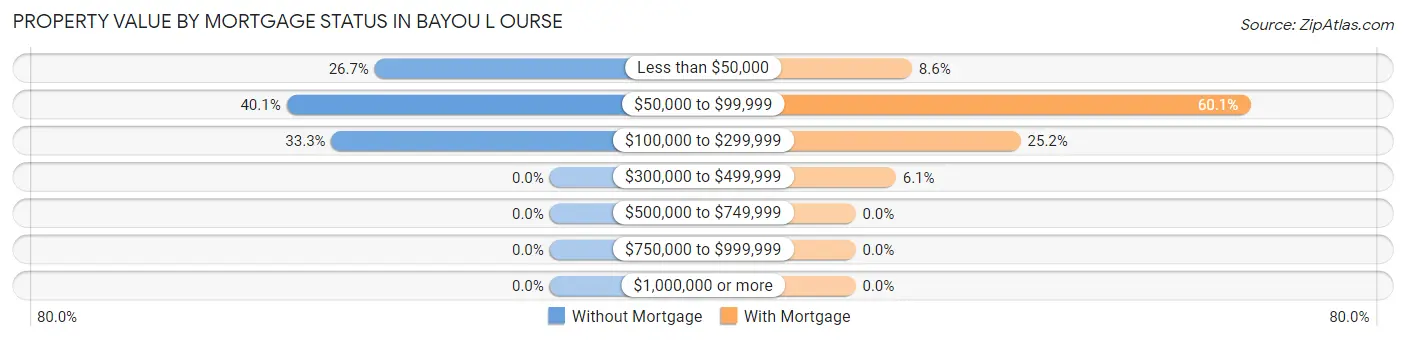
| Property Value | Without Mortgage | With Mortgage |
| Less than $50,000 | 113 (26.7%) | 14 (8.6%) |
| $50,000 to $99,999 | 170 (40.1%) | 98 (60.1%) |
| $100,000 to $299,999 | 141 (33.3%) | 41 (25.2%) |
| $300,000 to $499,999 | 0 (0.0%) | 10 (6.1%) |
| $500,000 to $749,999 | 0 (0.0%) | 0 (0.0%) |
| $750,000 to $999,999 | 0 (0.0%) | 0 (0.0%) |
| $1,000,000 or more | 0 (0.0%) | 0 (0.0%) |
| Total | 424 (100.0%) | 163 (100.0%) |
Household Income by Mortgage Status in Bayou L Ourse
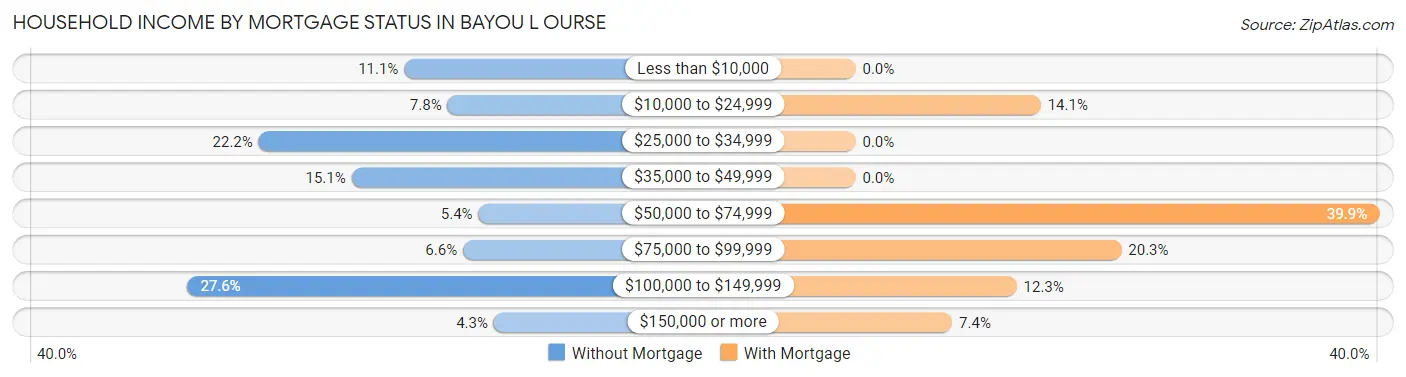
| Household Income | Without Mortgage | With Mortgage |
| Less than $10,000 | 47 (11.1%) | 0 (0.0%) |
| $10,000 to $24,999 | 33 (7.8%) | 23 (14.1%) |
| $25,000 to $34,999 | 94 (22.2%) | 0 (0.0%) |
| $35,000 to $49,999 | 64 (15.1%) | 0 (0.0%) |
| $50,000 to $74,999 | 23 (5.4%) | 65 (39.9%) |
| $75,000 to $99,999 | 28 (6.6%) | 33 (20.3%) |
| $100,000 to $149,999 | 117 (27.6%) | 20 (12.3%) |
| $150,000 or more | 18 (4.3%) | 12 (7.4%) |
| Total | 424 (100.0%) | 163 (100.0%) |
Property Value to Household Income Ratio in Bayou L Ourse
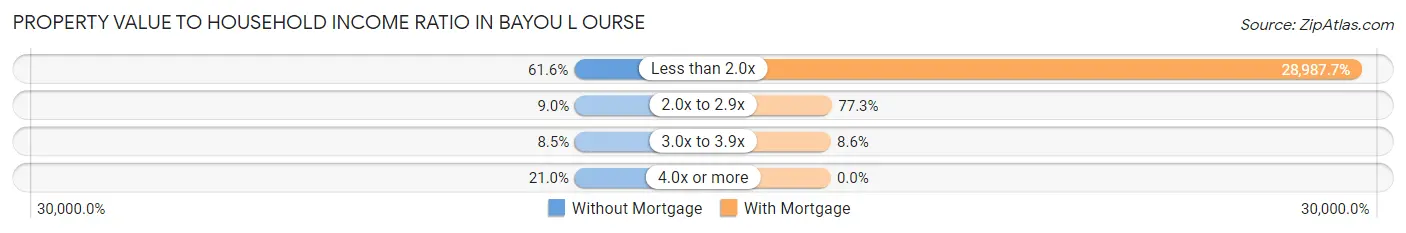
| Value-to-Income Ratio | Without Mortgage | With Mortgage |
| Less than 2.0x | 261 (61.6%) | 47,250 (28,987.7%) |
| 2.0x to 2.9x | 38 (9.0%) | 126 (77.3%) |
| 3.0x to 3.9x | 36 (8.5%) | 14 (8.6%) |
| 4.0x or more | 89 (21.0%) | 0 (0.0%) |
| Total | 424 (100.0%) | 163 (100.0%) |
Real Estate Taxes by Mortgage Status in Bayou L Ourse
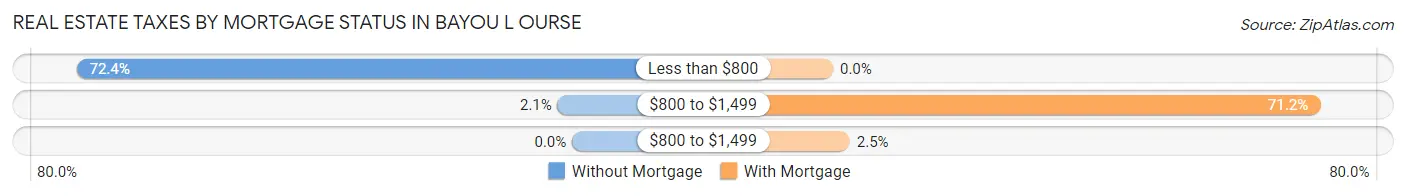
| Property Taxes | Without Mortgage | With Mortgage |
| Less than $800 | 307 (72.4%) | 0 (0.0%) |
| $800 to $1,499 | 9 (2.1%) | 116 (71.2%) |
| $800 to $1,499 | 0 (0.0%) | 4 (2.5%) |
| Total | 424 (100.0%) | 163 (100.0%) |
Health & Disability in Bayou L Ourse
Health Insurance Coverage by Age in Bayou L Ourse
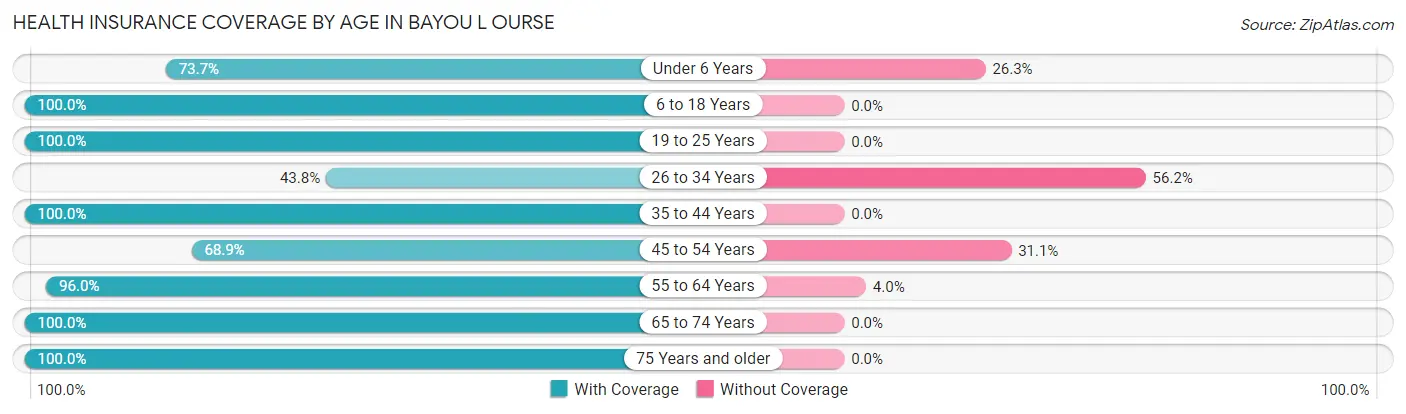
| Age Bracket | With Coverage | Without Coverage |
| Under 6 Years | 210 (73.7%) | 75 (26.3%) |
| 6 to 18 Years | 249 (100.0%) | 0 (0.0%) |
| 19 to 25 Years | 151 (100.0%) | 0 (0.0%) |
| 26 to 34 Years | 113 (43.8%) | 145 (56.2%) |
| 35 to 44 Years | 420 (100.0%) | 0 (0.0%) |
| 45 to 54 Years | 135 (68.9%) | 61 (31.1%) |
| 55 to 64 Years | 238 (96.0%) | 10 (4.0%) |
| 65 to 74 Years | 171 (100.0%) | 0 (0.0%) |
| 75 Years and older | 61 (100.0%) | 0 (0.0%) |
| Total | 1,748 (85.7%) | 291 (14.3%) |
Health Insurance Coverage by Citizenship Status in Bayou L Ourse
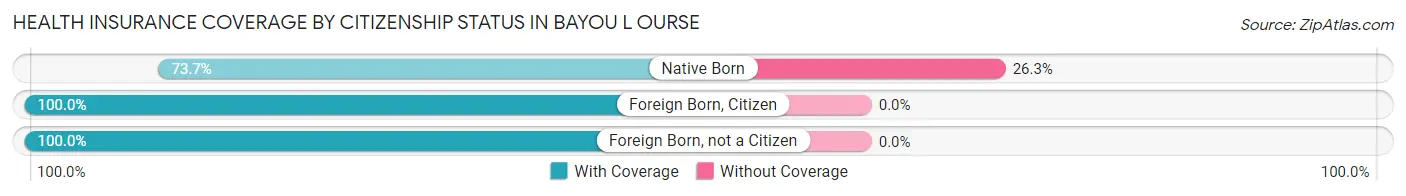
| Citizenship Status | With Coverage | Without Coverage |
| Native Born | 210 (73.7%) | 75 (26.3%) |
| Foreign Born, Citizen | 249 (100.0%) | 0 (0.0%) |
| Foreign Born, not a Citizen | 151 (100.0%) | 0 (0.0%) |
Health Insurance Coverage by Household Income in Bayou L Ourse
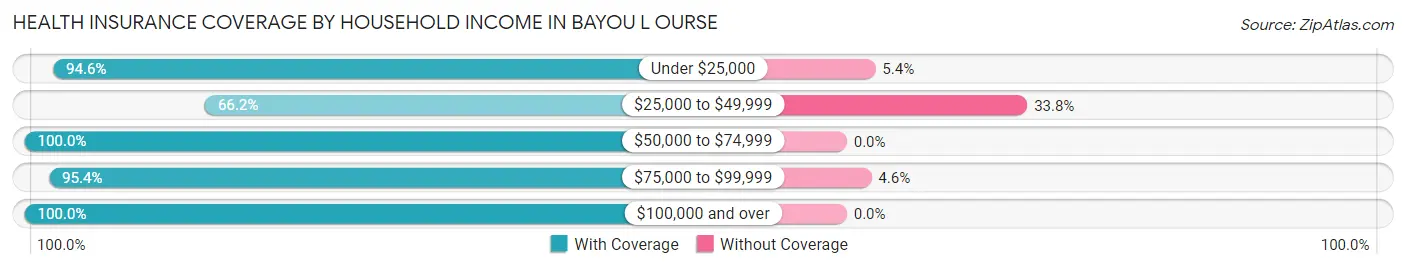
| Household Income | With Coverage | Without Coverage |
| Under $25,000 | 300 (94.6%) | 17 (5.4%) |
| $25,000 to $49,999 | 517 (66.2%) | 264 (33.8%) |
| $50,000 to $74,999 | 178 (100.0%) | 0 (0.0%) |
| $75,000 to $99,999 | 207 (95.4%) | 10 (4.6%) |
| $100,000 and over | 546 (100.0%) | 0 (0.0%) |
Public vs Private Health Insurance Coverage by Age in Bayou L Ourse
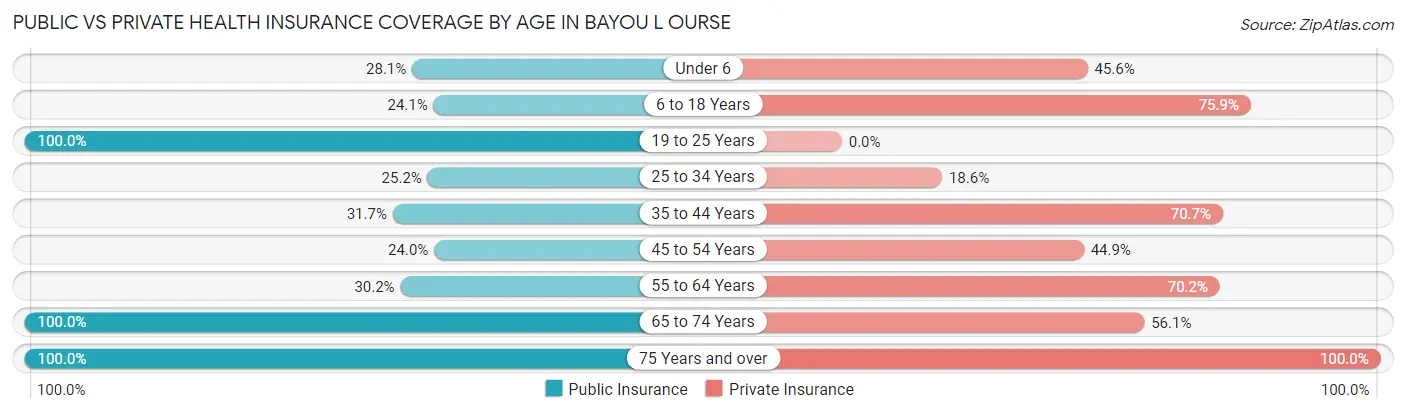
| Age Bracket | Public Insurance | Private Insurance |
| Under 6 | 80 (28.1%) | 130 (45.6%) |
| 6 to 18 Years | 60 (24.1%) | 189 (75.9%) |
| 19 to 25 Years | 151 (100.0%) | 0 (0.0%) |
| 25 to 34 Years | 65 (25.2%) | 48 (18.6%) |
| 35 to 44 Years | 133 (31.7%) | 297 (70.7%) |
| 45 to 54 Years | 47 (24.0%) | 88 (44.9%) |
| 55 to 64 Years | 75 (30.2%) | 174 (70.2%) |
| 65 to 74 Years | 171 (100.0%) | 96 (56.1%) |
| 75 Years and over | 61 (100.0%) | 61 (100.0%) |
| Total | 843 (41.3%) | 1,083 (53.1%) |
Disability Status by Sex by Age in Bayou L Ourse
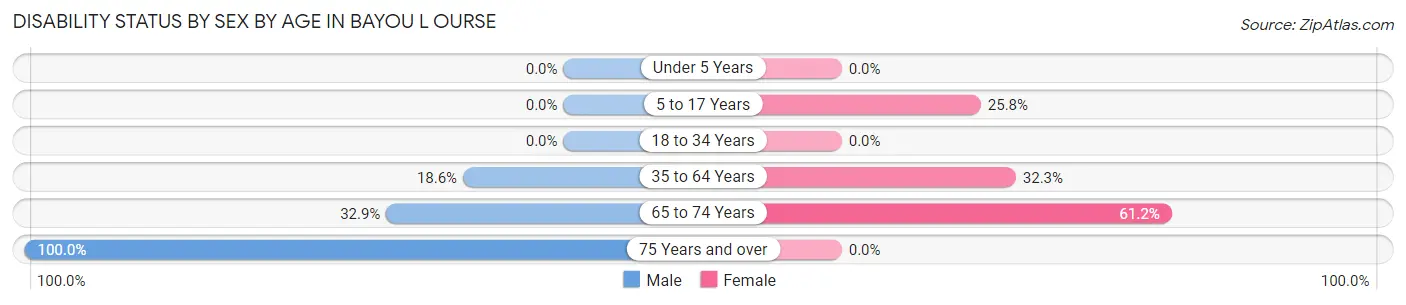
| Age Bracket | Male | Female |
| Under 5 Years | 0 (0.0%) | 0 (0.0%) |
| 5 to 17 Years | 0 (0.0%) | 32 (25.8%) |
| 18 to 34 Years | 0 (0.0%) | 0 (0.0%) |
| 35 to 64 Years | 82 (18.6%) | 137 (32.3%) |
| 65 to 74 Years | 24 (32.9%) | 60 (61.2%) |
| 75 Years and over | 25 (100.0%) | 0 (0.0%) |
Disability Class by Sex by Age in Bayou L Ourse
Disability Class: Hearing Difficulty
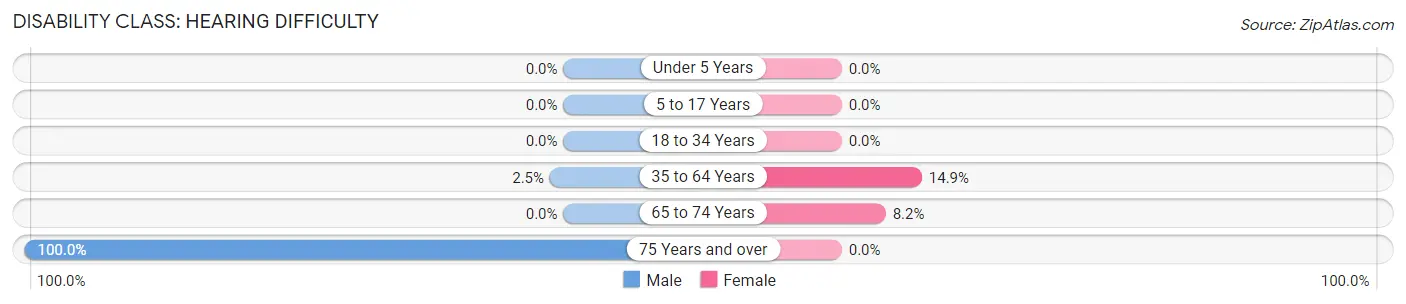
| Age Bracket | Male | Female |
| Under 5 Years | 0 (0.0%) | 0 (0.0%) |
| 5 to 17 Years | 0 (0.0%) | 0 (0.0%) |
| 18 to 34 Years | 0 (0.0%) | 0 (0.0%) |
| 35 to 64 Years | 11 (2.5%) | 63 (14.9%) |
| 65 to 74 Years | 0 (0.0%) | 8 (8.2%) |
| 75 Years and over | 25 (100.0%) | 0 (0.0%) |
Disability Class: Vision Difficulty
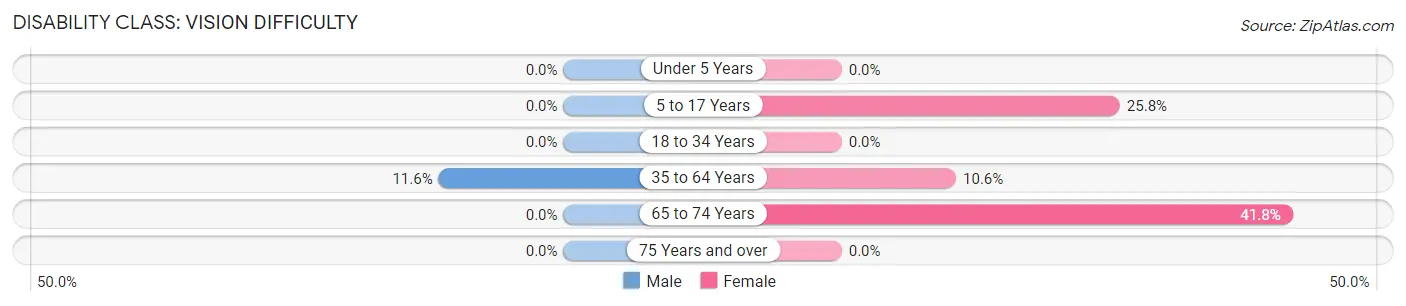
| Age Bracket | Male | Female |
| Under 5 Years | 0 (0.0%) | 0 (0.0%) |
| 5 to 17 Years | 0 (0.0%) | 32 (25.8%) |
| 18 to 34 Years | 0 (0.0%) | 0 (0.0%) |
| 35 to 64 Years | 51 (11.6%) | 45 (10.6%) |
| 65 to 74 Years | 0 (0.0%) | 41 (41.8%) |
| 75 Years and over | 0 (0.0%) | 0 (0.0%) |
Disability Class: Cognitive Difficulty
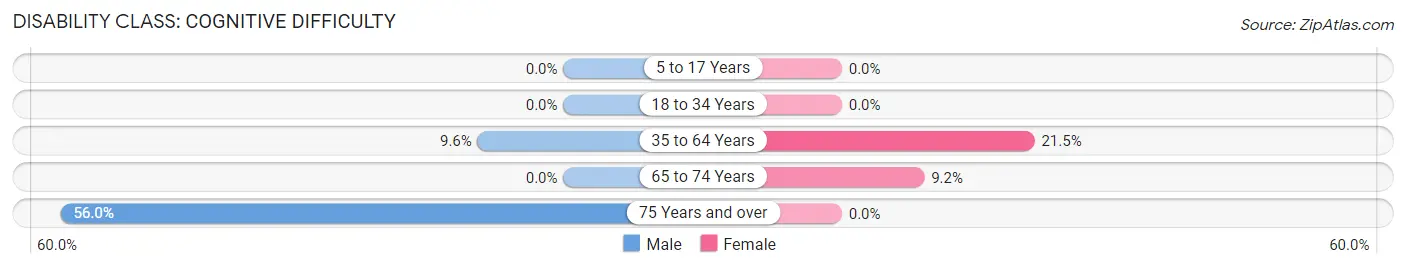
| Age Bracket | Male | Female |
| 5 to 17 Years | 0 (0.0%) | 0 (0.0%) |
| 18 to 34 Years | 0 (0.0%) | 0 (0.0%) |
| 35 to 64 Years | 42 (9.6%) | 91 (21.5%) |
| 65 to 74 Years | 0 (0.0%) | 9 (9.2%) |
| 75 Years and over | 14 (56.0%) | 0 (0.0%) |
Disability Class: Ambulatory Difficulty
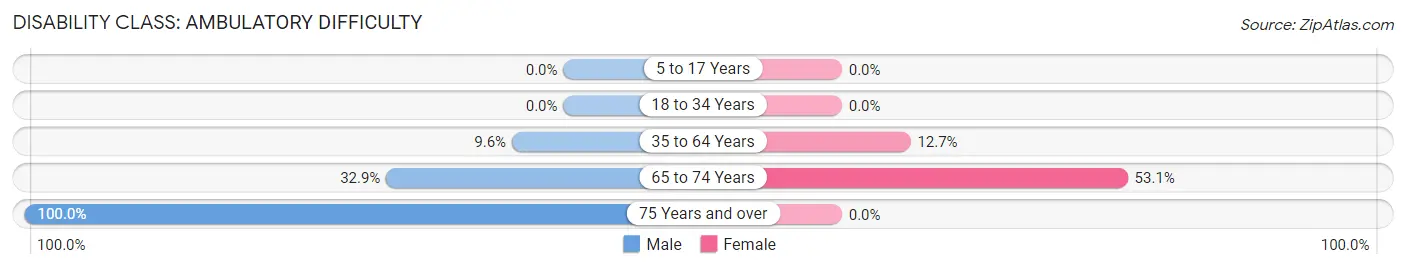
| Age Bracket | Male | Female |
| 5 to 17 Years | 0 (0.0%) | 0 (0.0%) |
| 18 to 34 Years | 0 (0.0%) | 0 (0.0%) |
| 35 to 64 Years | 42 (9.6%) | 54 (12.7%) |
| 65 to 74 Years | 24 (32.9%) | 52 (53.1%) |
| 75 Years and over | 25 (100.0%) | 0 (0.0%) |
Disability Class: Self-Care Difficulty
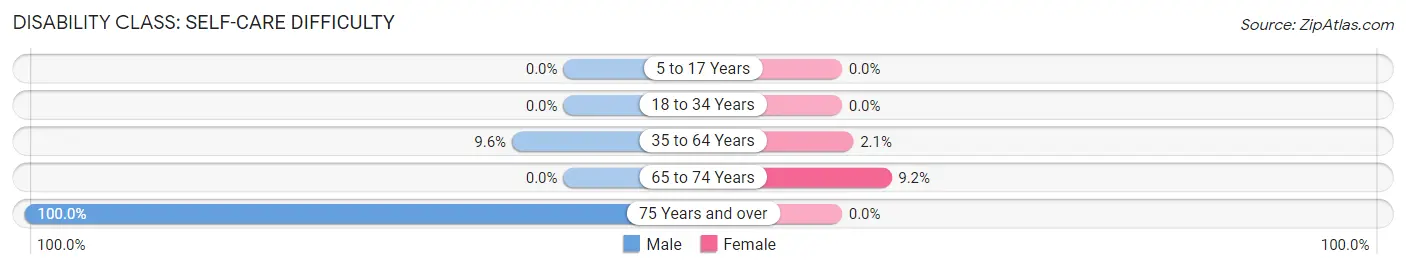
| Age Bracket | Male | Female |
| 5 to 17 Years | 0 (0.0%) | 0 (0.0%) |
| 18 to 34 Years | 0 (0.0%) | 0 (0.0%) |
| 35 to 64 Years | 42 (9.6%) | 9 (2.1%) |
| 65 to 74 Years | 0 (0.0%) | 9 (9.2%) |
| 75 Years and over | 25 (100.0%) | 0 (0.0%) |
Technology Access in Bayou L Ourse
Computing Device Access in Bayou L Ourse
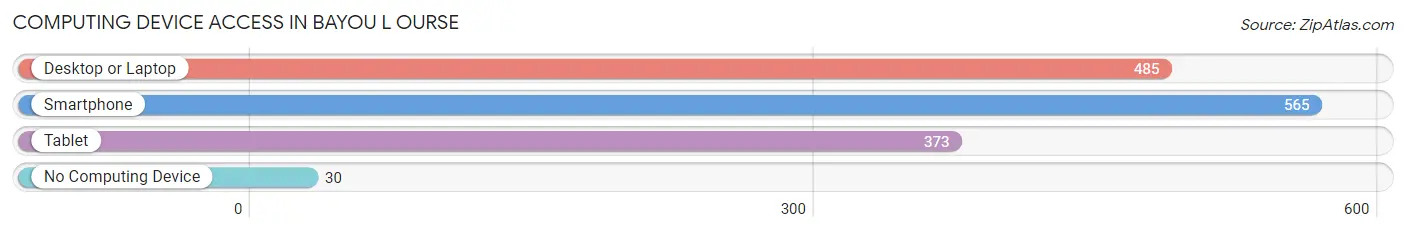
| Device Type | # Households | % Households |
| Desktop or Laptop | 485 | 75.1% |
| Smartphone | 565 | 87.5% |
| Tablet | 373 | 57.7% |
| No Computing Device | 30 | 4.6% |
| Total | 646 | 100.0% |
Internet Access in Bayou L Ourse
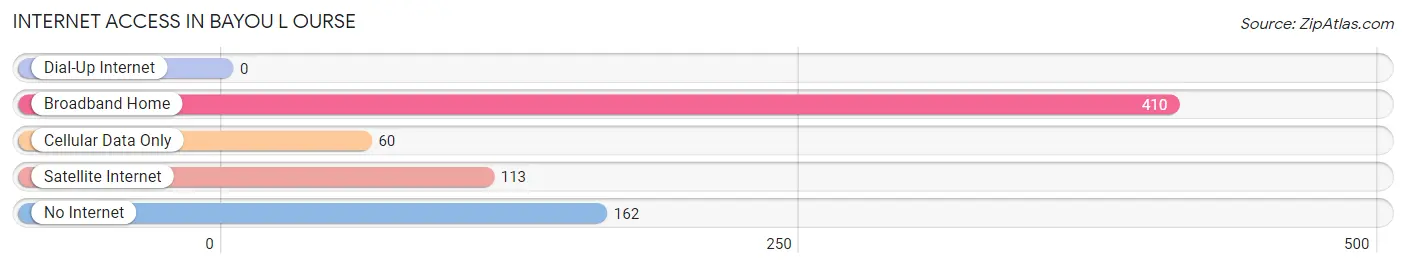
| Internet Type | # Households | % Households |
| Dial-Up Internet | 0 | 0.0% |
| Broadband Home | 410 | 63.5% |
| Cellular Data Only | 60 | 9.3% |
| Satellite Internet | 113 | 17.5% |
| No Internet | 162 | 25.1% |
| Total | 646 | 100.0% |
Bayou L Ourse Summary
Bayou La Ourse is a small unincorporated community located in the southeastern corner of Louisiana, in the United States. It is situated in the parish of Terrebonne, and is part of the Houma-Thibodaux Metropolitan Statistical Area. The population of Bayou La Ourse was estimated to be 1,845 in the year 2000.
History
The area that is now Bayou La Ourse was originally inhabited by the Chitimacha Indians. The first European settlers arrived in the area in the late 1700s, and the town was officially founded in 1820. The town was named after the nearby bayou, which was named by French explorers in the early 1700s.
The town was originally a small fishing village, and the main industry was shrimping. In the late 1800s, the town began to grow as the lumber industry began to take off. The town was also home to a number of sawmills and other wood-related businesses.
In the early 1900s, the town began to experience a period of growth and prosperity. The population increased, and the town began to develop a number of businesses and services. The town was also home to a number of churches, schools, and other civic organizations.
Geography
Bayou La Ourse is located in the southeastern corner of Louisiana, in the United States. It is situated in the parish of Terrebonne, and is part of the Houma-Thibodaux Metropolitan Statistical Area. The town is located on the banks of the Bayou La Ourse, which is a tributary of the Gulf of Mexico.
The town is located in a humid subtropical climate zone, and experiences hot, humid summers and mild winters. The average annual temperature is around 70 degrees Fahrenheit, and the average annual precipitation is around 60 inches.
Economy
The economy of Bayou La Ourse is largely based on the fishing and shrimping industries. The town is home to a number of seafood processing plants, and the town is also home to a number of boatyards and marinas.
The town is also home to a number of other businesses, including retail stores, restaurants, and other services. The town is also home to a number of churches, schools, and other civic organizations.
Demographics
The population of Bayou La Ourse was estimated to be 1,845 in the year 2000. The population is largely composed of people of French and Cajun descent. The town is also home to a number of other ethnic groups, including African Americans, Hispanics, and Asians.
The median household income in Bayou La Ourse is around $30,000, and the median home value is around $90,000. The town is served by the Terrebonne Parish School District, and the town is also home to a number of churches, schools, and other civic organizations.
Common Questions
What is Per Capita Income in Bayou L Ourse?
Per Capita income in Bayou L Ourse is $25,152.
What is the Median Family Income in Bayou L Ourse?
Median Family Income in Bayou L Ourse is $51,250.
What is the Median Household income in Bayou L Ourse?
Median Household Income in Bayou L Ourse is $45,777.
What is Income or Wage Gap in Bayou L Ourse?
Income or Wage Gap in Bayou L Ourse is 44.8%.
Women in Bayou L Ourse earn 55.2 cents for every dollar earned by a man.
What is Inequality or Gini Index in Bayou L Ourse?
Inequality or Gini Index in Bayou L Ourse is 0.55.
What is the Total Population of Bayou L Ourse?
Total Population of Bayou L Ourse is 2,039.
What is the Total Male Population of Bayou L Ourse?
Total Male Population of Bayou L Ourse is 985.
What is the Total Female Population of Bayou L Ourse?
Total Female Population of Bayou L Ourse is 1,054.
What is the Ratio of Males per 100 Females in Bayou L Ourse?
There are 93.45 Males per 100 Females in Bayou L Ourse.
What is the Ratio of Females per 100 Males in Bayou L Ourse?
There are 107.01 Females per 100 Males in Bayou L Ourse.
What is the Median Population Age in Bayou L Ourse?
Median Population Age in Bayou L Ourse is 36.0 Years.
What is the Average Family Size in Bayou L Ourse
Average Family Size in Bayou L Ourse is 3.4 People.
What is the Average Household Size in Bayou L Ourse
Average Household Size in Bayou L Ourse is 3.2 People.
How Large is the Labor Force in Bayou L Ourse?
There are 805 People in the Labor Forcein in Bayou L Ourse.
What is the Percentage of People in the Labor Force in Bayou L Ourse?
51.4% of People are in the Labor Force in Bayou L Ourse.
What is the Unemployment Rate in Bayou L Ourse?
Unemployment Rate in Bayou L Ourse is 11.8%.