Presquille, LA Map & Demographics
Presquille Map
Presquille Overview
$29,809
PER CAPITA INCOME
$118,173
AVG FAMILY INCOME
$102,731
AVG HOUSEHOLD INCOME
42.0%
WAGE / INCOME GAP [ % ]
58.0¢/ $1
WAGE / INCOME GAP [ $ ]
0.38
INEQUALITY / GINI INDEX
2,136
TOTAL POPULATION
1,001
MALE POPULATION
1,135
FEMALE POPULATION
88.19
MALES / 100 FEMALES
113.39
FEMALES / 100 MALES
29.5
MEDIAN AGE
3.7
AVG FAMILY SIZE
3.7
AVG HOUSEHOLD SIZE
892
LABOR FORCE [ PEOPLE ]
66.2%
PERCENT IN LABOR FORCE
19.8%
UNEMPLOYMENT RATE
Income in Presquille
Income Overview in Presquille
Per Capita Income in Presquille is $29,809, while median incomes of families and households are $118,173 and $102,731 respectively.
| Characteristic | Number | Measure |
| Per Capita Income | 2,136 | $29,809 |
| Median Family Income | 431 | $118,173 |
| Mean Family Income | 431 | $132,518 |
| Median Household Income | 578 | $102,731 |
| Mean Household Income | 578 | $105,970 |
| Income Deficit | 431 | $0 |
| Wage / Income Gap (%) | 2,136 | 41.99% |
| Wage / Income Gap ($) | 2,136 | 58.01¢ per $1 |
| Gini / Inequality Index | 2,136 | 0.38 |
Earnings by Sex in Presquille
Average Earnings in Presquille are $68,032, $69,977 for men and $40,591 for women, a difference of 42.0%.
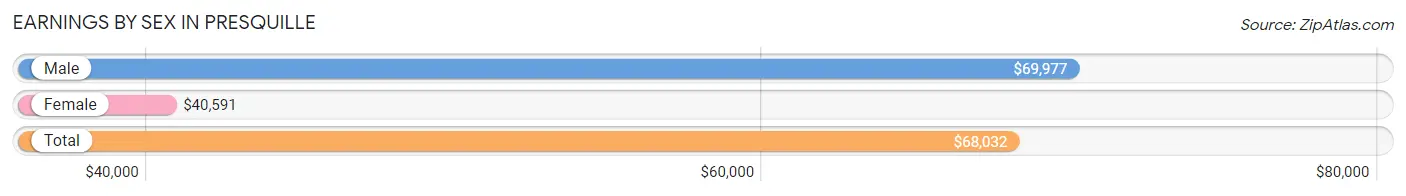
| Sex | Number | Average Earnings |
| Male | 457 (57.3%) | $69,977 |
| Female | 340 (42.7%) | $40,591 |
| Total | 797 (100.0%) | $68,032 |
Earnings by Sex by Income Bracket in Presquille
The most common earnings brackets in Presquille are $100,000+ for men (143 | 31.3%) and $100,000+ for women (82 | 24.1%).
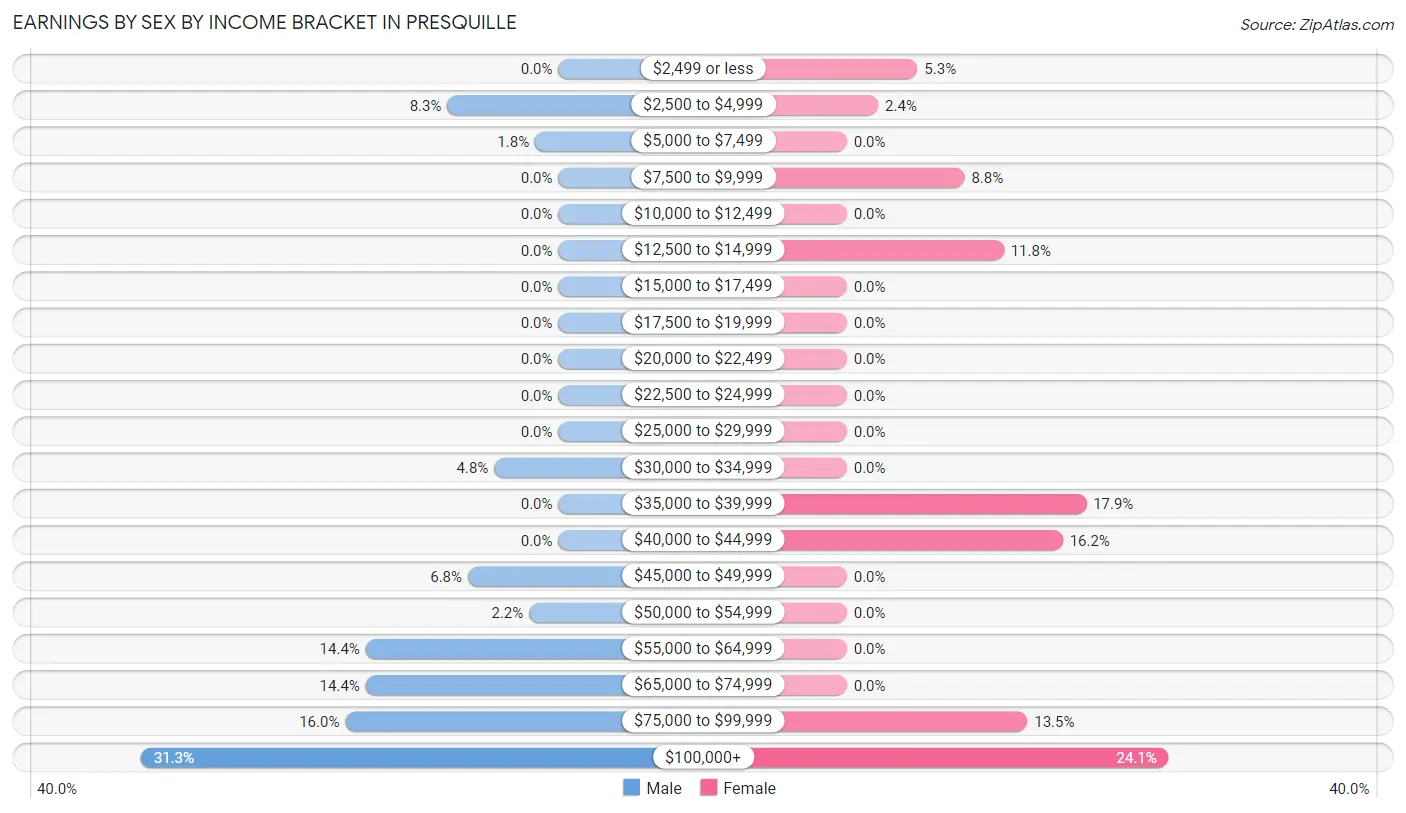
| Income | Male | Female |
| $2,499 or less | 0 (0.0%) | 18 (5.3%) |
| $2,500 to $4,999 | 38 (8.3%) | 8 (2.4%) |
| $5,000 to $7,499 | 8 (1.8%) | 0 (0.0%) |
| $7,500 to $9,999 | 0 (0.0%) | 30 (8.8%) |
| $10,000 to $12,499 | 0 (0.0%) | 0 (0.0%) |
| $12,500 to $14,999 | 0 (0.0%) | 40 (11.8%) |
| $15,000 to $17,499 | 0 (0.0%) | 0 (0.0%) |
| $17,500 to $19,999 | 0 (0.0%) | 0 (0.0%) |
| $20,000 to $22,499 | 0 (0.0%) | 0 (0.0%) |
| $22,500 to $24,999 | 0 (0.0%) | 0 (0.0%) |
| $25,000 to $29,999 | 0 (0.0%) | 0 (0.0%) |
| $30,000 to $34,999 | 22 (4.8%) | 0 (0.0%) |
| $35,000 to $39,999 | 0 (0.0%) | 61 (17.9%) |
| $40,000 to $44,999 | 0 (0.0%) | 55 (16.2%) |
| $45,000 to $49,999 | 31 (6.8%) | 0 (0.0%) |
| $50,000 to $54,999 | 10 (2.2%) | 0 (0.0%) |
| $55,000 to $64,999 | 66 (14.4%) | 0 (0.0%) |
| $65,000 to $74,999 | 66 (14.4%) | 0 (0.0%) |
| $75,000 to $99,999 | 73 (16.0%) | 46 (13.5%) |
| $100,000+ | 143 (31.3%) | 82 (24.1%) |
| Total | 457 (100.0%) | 340 (100.0%) |
Earnings by Sex by Educational Attainment in Presquille
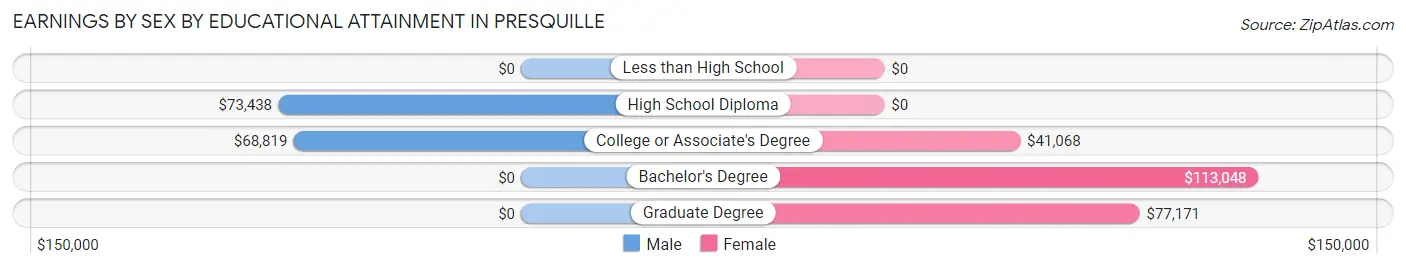
| Educational Attainment | Male Income | Female Income |
| Less than High School | - | - |
| High School Diploma | $73,438 | $0 |
| College or Associate's Degree | $68,819 | $41,068 |
| Bachelor's Degree | - | - |
| Graduate Degree | - | - |
| Total | $77,730 | $0 |
Family Income in Presquille
Family Income Brackets in Presquille
According to the Presquille family income data, there are 127 families falling into the $100,000 to $149,999 income range, which is the most common income bracket and makes up 29.5% of all families.
| Income Bracket | # Families | % Families |
| Less than $10,000 | 6 | 1.4% |
| $10,000 to $14,999 | 0 | 0.0% |
| $15,000 to $24,999 | 0 | 0.0% |
| $25,000 to $34,999 | 0 | 0.0% |
| $35,000 to $49,999 | 31 | 7.2% |
| $50,000 to $74,999 | 76 | 17.6% |
| $75,000 to $99,999 | 24 | 5.6% |
| $100,000 to $149,999 | 127 | 29.5% |
| $150,000 to $199,999 | 70 | 16.2% |
| $200,000+ | 97 | 22.5% |
Family Income by Famaliy Size in Presquille
4-person families (181 | 42.0%) account for the highest median family income in Presquille with $112,768 per family, while 4-person families (181 | 42.0%) have the highest median income of $28,192 per family member.
| Income Bracket | # Families | Median Income |
| 2-Person Families | 106 (24.6%) | $0 |
| 3-Person Families | 99 (23.0%) | $0 |
| 4-Person Families | 181 (42.0%) | $112,768 |
| 5-Person Families | 20 (4.6%) | $0 |
| 6-Person Families | 25 (5.8%) | $0 |
| 7+ Person Families | 0 (0.0%) | $0 |
| Total | 431 (100.0%) | $118,173 |
Family Income by Number of Earners in Presquille
| Number of Earners | # Families | Median Income |
| No Earners | 37 (8.6%) | $48,672 |
| 1 Earner | 121 (28.1%) | $68,750 |
| 2 Earners | 246 (57.1%) | $156,852 |
| 3+ Earners | 27 (6.3%) | $0 |
| Total | 431 (100.0%) | $118,173 |
Household Income in Presquille
Household Income Brackets in Presquille
With 127 households falling in the category, the $100,000 to $149,999 income range is the most frequent in Presquille, accounting for 22.0% of all households.
| Income Bracket | # Households | % Households |
| Less than $10,000 | 6 | 1.0% |
| $10,000 to $14,999 | 0 | 0.0% |
| $15,000 to $24,999 | 77 | 13.3% |
| $25,000 to $34,999 | 62 | 10.7% |
| $35,000 to $49,999 | 31 | 5.4% |
| $50,000 to $74,999 | 84 | 14.5% |
| $75,000 to $99,999 | 24 | 4.2% |
| $100,000 to $149,999 | 127 | 22.0% |
| $150,000 to $199,999 | 70 | 12.1% |
| $200,000+ | 97 | 16.8% |
Household Income by Householder Age in Presquille
The median household income in Presquille is $102,731, with the highest median household income of $155,556 found in the 45 to 64 years age bracket for the primary householder. A total of 272 households (47.1%) fall into this category.
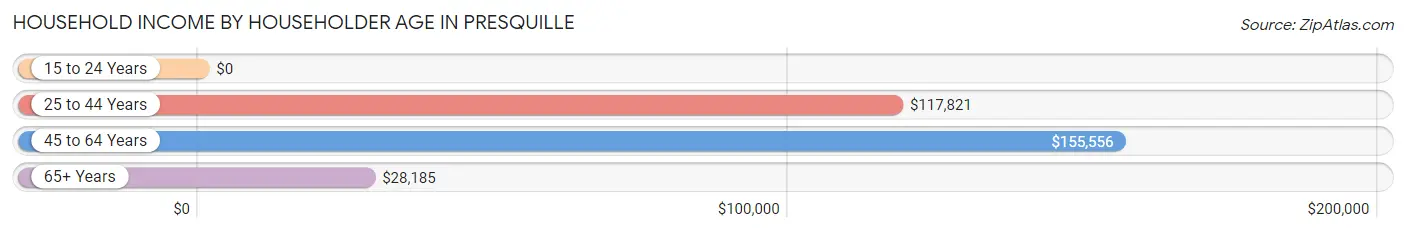
| Income Bracket | # Households | Median Income |
| 15 to 24 Years | 0 (0.0%) | $0 |
| 25 to 44 Years | 118 (20.4%) | $117,821 |
| 45 to 64 Years | 272 (47.1%) | $155,556 |
| 65+ Years | 188 (32.5%) | $28,185 |
| Total | 578 (100.0%) | $102,731 |
Poverty in Presquille
Income Below Poverty by Sex and Age in Presquille
With 0.7% poverty level for males and 4.0% for females among the residents of Presquille, 55 to 64 year old males and 35 to 44 year old females are the most vulnerable to poverty, with 6 males (5.4%) and 30 females (31.9%) in their respective age groups living below the poverty level.
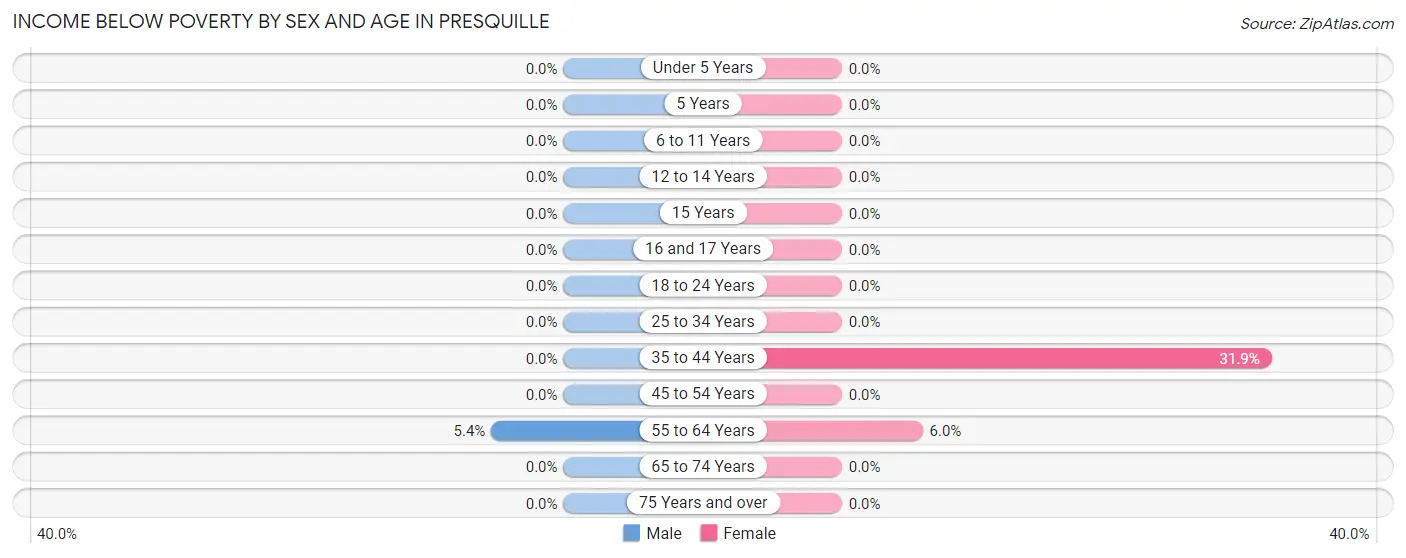
| Age Bracket | Male | Female |
| Under 5 Years | 0 (0.0%) | 0 (0.0%) |
| 5 Years | 0 (0.0%) | 0 (0.0%) |
| 6 to 11 Years | 0 (0.0%) | 0 (0.0%) |
| 12 to 14 Years | 0 (0.0%) | 0 (0.0%) |
| 15 Years | 0 (0.0%) | 0 (0.0%) |
| 16 and 17 Years | 0 (0.0%) | 0 (0.0%) |
| 18 to 24 Years | 0 (0.0%) | 0 (0.0%) |
| 25 to 34 Years | 0 (0.0%) | 0 (0.0%) |
| 35 to 44 Years | 0 (0.0%) | 30 (31.9%) |
| 45 to 54 Years | 0 (0.0%) | 0 (0.0%) |
| 55 to 64 Years | 6 (5.4%) | 6 (6.0%) |
| 65 to 74 Years | 0 (0.0%) | 0 (0.0%) |
| 75 Years and over | 0 (0.0%) | 0 (0.0%) |
| Total | 6 (0.7%) | 36 (4.0%) |
Income Above Poverty by Sex and Age in Presquille
According to the poverty statistics in Presquille, males aged under 5 years and females aged under 5 years are the age groups that are most secure financially, with 100.0% of males and 100.0% of females in these age groups living above the poverty line.
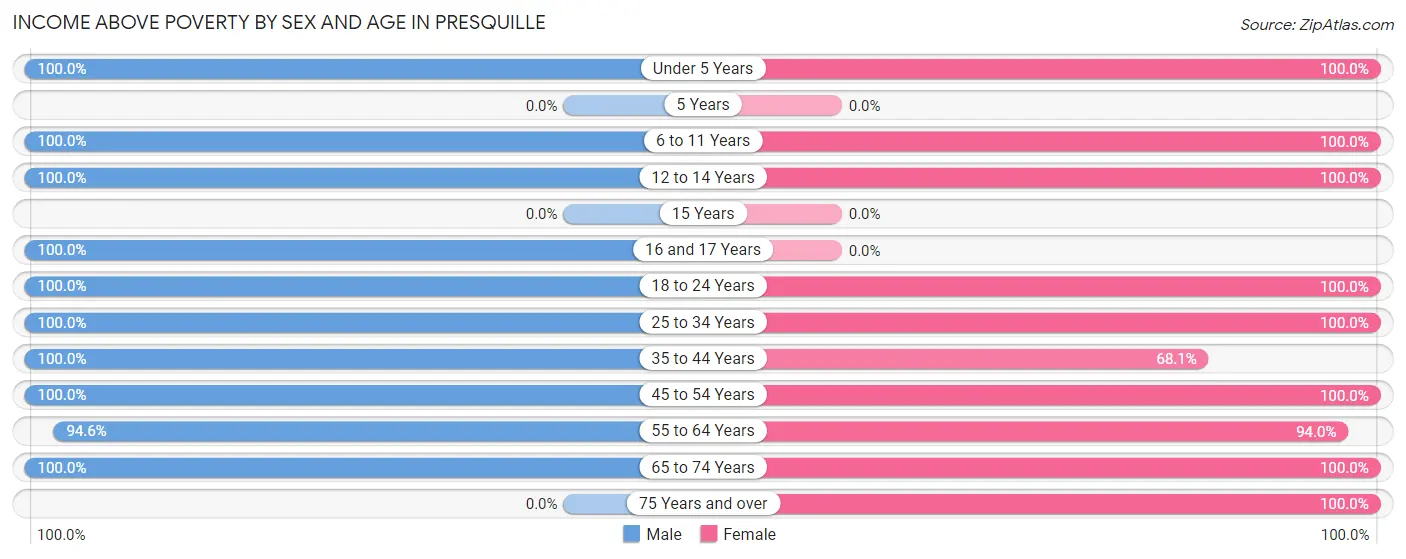
| Age Bracket | Male | Female |
| Under 5 Years | 41 (100.0%) | 19 (100.0%) |
| 5 Years | 0 (0.0%) | 0 (0.0%) |
| 6 to 11 Years | 41 (100.0%) | 214 (100.0%) |
| 12 to 14 Years | 57 (100.0%) | 71 (100.0%) |
| 15 Years | 0 (0.0%) | 0 (0.0%) |
| 16 and 17 Years | 22 (100.0%) | 0 (0.0%) |
| 18 to 24 Years | 107 (100.0%) | 43 (100.0%) |
| 25 to 34 Years | 144 (100.0%) | 80 (100.0%) |
| 35 to 44 Years | 75 (100.0%) | 64 (68.1%) |
| 45 to 54 Years | 173 (100.0%) | 139 (100.0%) |
| 55 to 64 Years | 106 (94.6%) | 94 (94.0%) |
| 65 to 74 Years | 113 (100.0%) | 49 (100.0%) |
| 75 Years and over | 0 (0.0%) | 96 (100.0%) |
| Total | 879 (99.3%) | 869 (96.0%) |
Income Below Poverty Among Married-Couple Families in Presquille
The poverty statistics for married-couple families in Presquille show that 1.6% or 6 of the total 381 families live below the poverty line. Families with no children have the highest poverty rate of 3.8%, comprising of 6 families. On the other hand, families with 1 or 2 children have the lowest poverty rate of 0.0%, which includes 0 families.
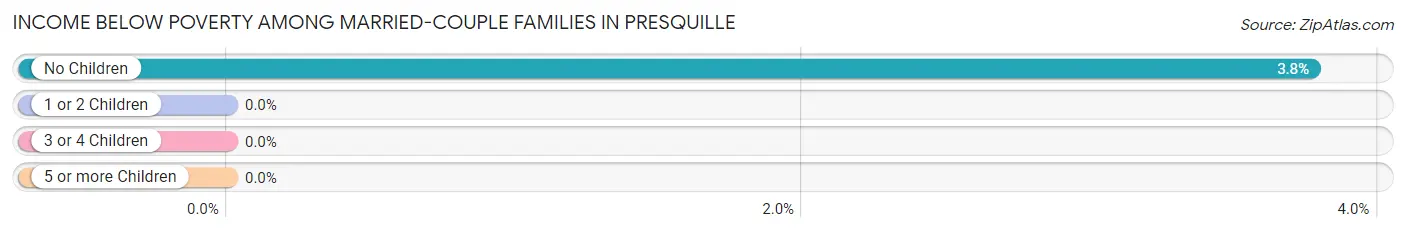
| Children | Above Poverty | Below Poverty |
| No Children | 153 (96.2%) | 6 (3.8%) |
| 1 or 2 Children | 222 (100.0%) | 0 (0.0%) |
| 3 or 4 Children | 0 (0.0%) | 0 (0.0%) |
| 5 or more Children | 0 (0.0%) | 0 (0.0%) |
| Total | 375 (98.4%) | 6 (1.6%) |
Income Below Poverty Among Single-Parent Households in Presquille
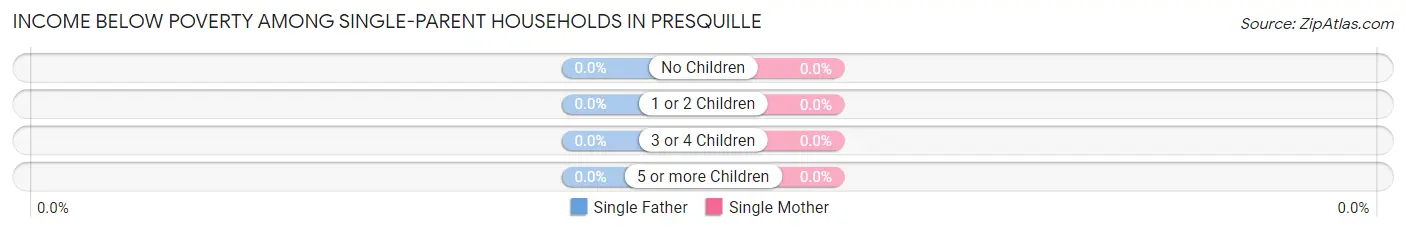
| Children | Single Father | Single Mother |
| No Children | 0 (0.0%) | 0 (0.0%) |
| 1 or 2 Children | 0 (0.0%) | 0 (0.0%) |
| 3 or 4 Children | 0 (0.0%) | 0 (0.0%) |
| 5 or more Children | 0 (0.0%) | 0 (0.0%) |
| Total | 0 (0.0%) | 0 (0.0%) |
Income Below Poverty Among Married-Couple vs Single-Parent Households in Presquille
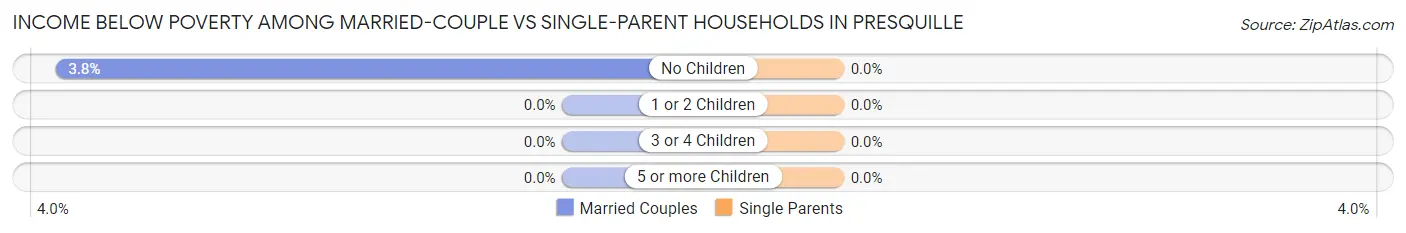
| Children | Married-Couple Families | Single-Parent Households |
| No Children | 6 (3.8%) | 0 (0.0%) |
| 1 or 2 Children | 0 (0.0%) | 0 (0.0%) |
| 3 or 4 Children | 0 (0.0%) | 0 (0.0%) |
| 5 or more Children | 0 (0.0%) | 0 (0.0%) |
| Total | 6 (1.6%) | 0 (0.0%) |
Race in Presquille
The most populous races in Presquille are White / Caucasian (2,073 | 97.1%), Two or more Races (44 | 2.1%), and Hispanic or Latino (19 | 0.9%).
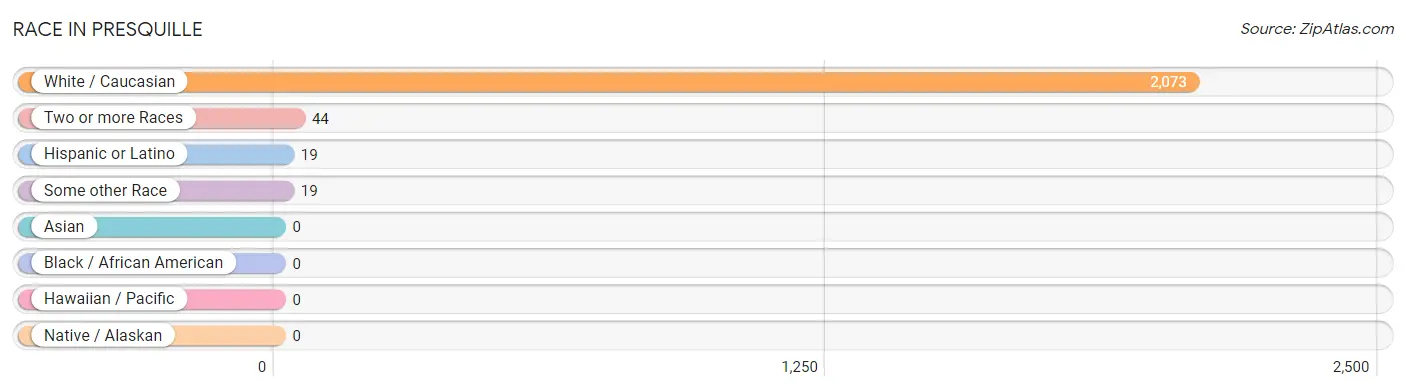
| Race | # Population | % Population |
| Asian | 0 | 0.0% |
| Black / African American | 0 | 0.0% |
| Hawaiian / Pacific | 0 | 0.0% |
| Hispanic or Latino | 19 | 0.9% |
| Native / Alaskan | 0 | 0.0% |
| White / Caucasian | 2,073 | 97.1% |
| Two or more Races | 44 | 2.1% |
| Some other Race | 19 | 0.9% |
| Total | 2,136 | 100.0% |
Ancestry in Presquille
The most populous ancestries reported in Presquille are French (602 | 28.2%), French Canadian (112 | 5.2%), European (93 | 4.3%), American (51 | 2.4%), and English (50 | 2.3%), together accounting for 42.5% of all Presquille residents.
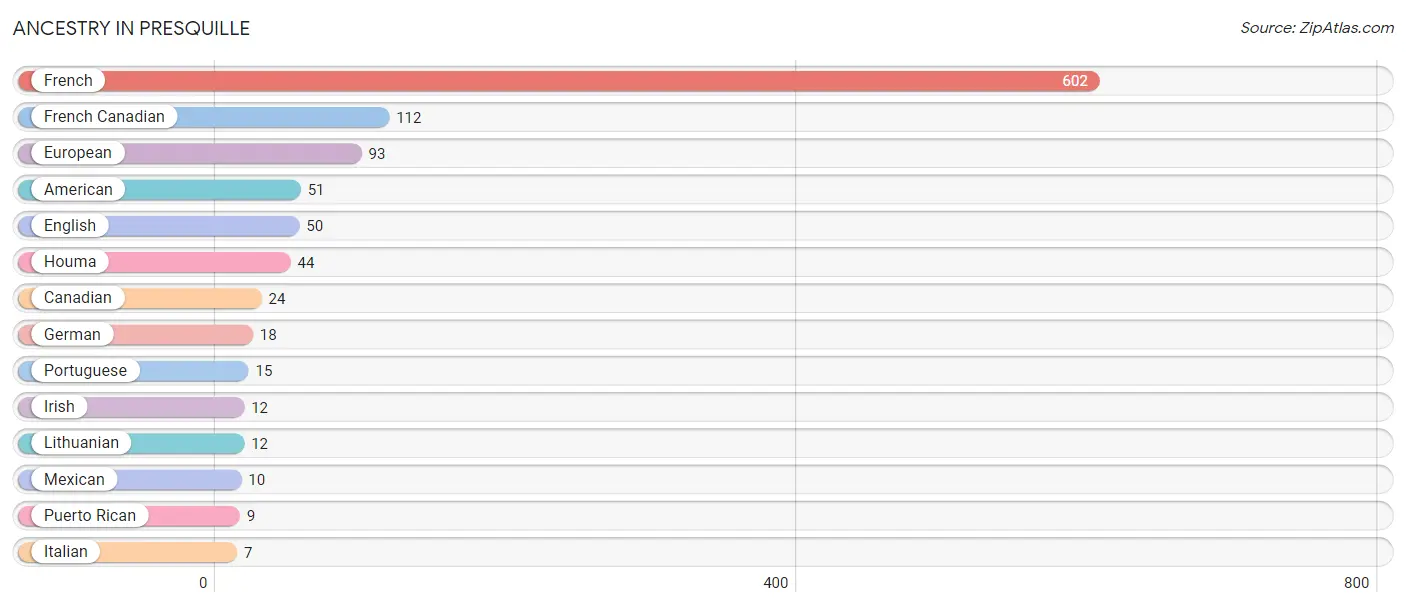
| Ancestry | # Population | % Population |
| American | 51 | 2.4% |
| Canadian | 24 | 1.1% |
| English | 50 | 2.3% |
| European | 93 | 4.3% |
| French | 602 | 28.2% |
| French Canadian | 112 | 5.2% |
| German | 18 | 0.8% |
| Houma | 44 | 2.1% |
| Irish | 12 | 0.6% |
| Italian | 7 | 0.3% |
| Lithuanian | 12 | 0.6% |
| Mexican | 10 | 0.5% |
| Portuguese | 15 | 0.7% |
| Puerto Rican | 9 | 0.4% | View All 14 Rows |
Immigrants in Presquille

| Immigration Origin | # Population | % Population | View All 0 Rows |
Sex and Age in Presquille
Sex and Age in Presquille
The most populous age groups in Presquille are 50 to 54 Years (173 | 17.3%) for men and 5 to 9 Years (314 | 27.7%) for women.
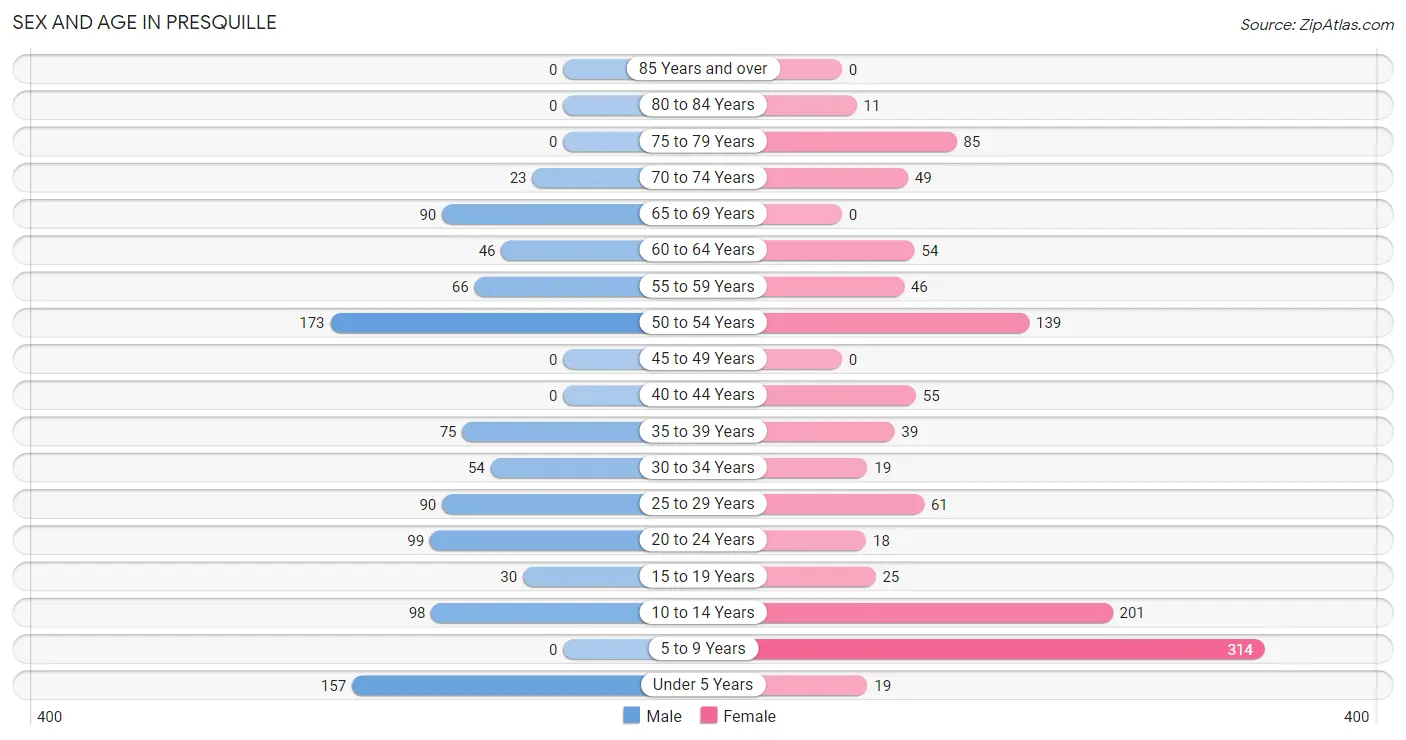
| Age Bracket | Male | Female |
| Under 5 Years | 157 (15.7%) | 19 (1.7%) |
| 5 to 9 Years | 0 (0.0%) | 314 (27.7%) |
| 10 to 14 Years | 98 (9.8%) | 201 (17.7%) |
| 15 to 19 Years | 30 (3.0%) | 25 (2.2%) |
| 20 to 24 Years | 99 (9.9%) | 18 (1.6%) |
| 25 to 29 Years | 90 (9.0%) | 61 (5.4%) |
| 30 to 34 Years | 54 (5.4%) | 19 (1.7%) |
| 35 to 39 Years | 75 (7.5%) | 39 (3.4%) |
| 40 to 44 Years | 0 (0.0%) | 55 (4.9%) |
| 45 to 49 Years | 0 (0.0%) | 0 (0.0%) |
| 50 to 54 Years | 173 (17.3%) | 139 (12.2%) |
| 55 to 59 Years | 66 (6.6%) | 46 (4.1%) |
| 60 to 64 Years | 46 (4.6%) | 54 (4.8%) |
| 65 to 69 Years | 90 (9.0%) | 0 (0.0%) |
| 70 to 74 Years | 23 (2.3%) | 49 (4.3%) |
| 75 to 79 Years | 0 (0.0%) | 85 (7.5%) |
| 80 to 84 Years | 0 (0.0%) | 11 (1.0%) |
| 85 Years and over | 0 (0.0%) | 0 (0.0%) |
| Total | 1,001 (100.0%) | 1,135 (100.0%) |
Families and Households in Presquille
Median Family Size in Presquille
The median family size in Presquille is 3.74 persons per family, with single female/mother families (15 | 3.5%) accounting for the largest median family size of 8.6 persons per family. On the other hand, single male/father families (35 | 8.1%) represent the smallest median family size with 2.80 persons per family.
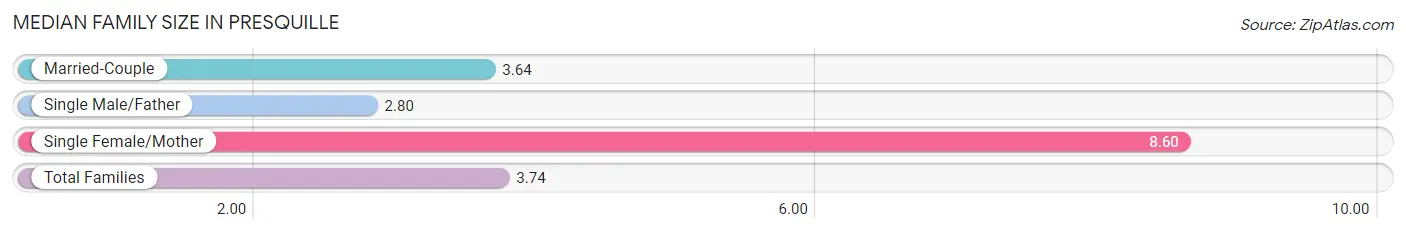
| Family Type | # Families | Family Size |
| Married-Couple | 381 (88.4%) | 3.64 |
| Single Male/Father | 35 (8.1%) | 2.80 |
| Single Female/Mother | 15 (3.5%) | 8.60 |
| Total Families | 431 (100.0%) | 3.74 |
Median Household Size in Presquille
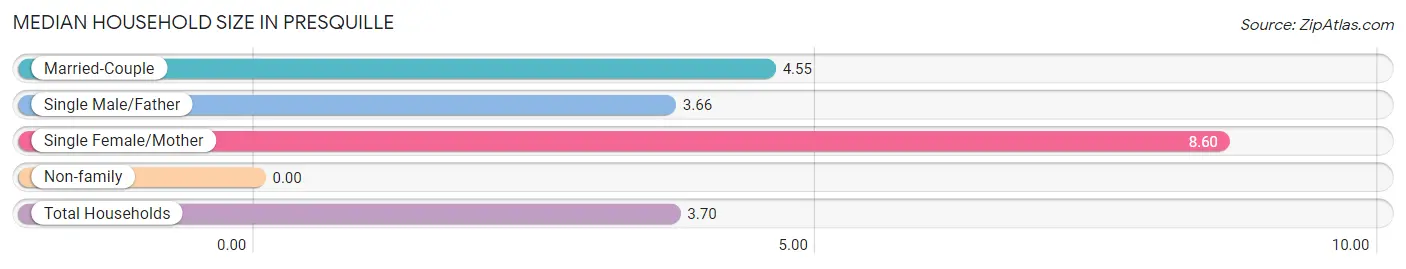
| Household Type | # Households | Household Size |
| Married-Couple | 381 (65.9%) | 4.55 |
| Single Male/Father | 35 (6.1%) | 3.66 |
| Single Female/Mother | 15 (2.6%) | 8.60 |
| Non-family | 147 (25.4%) | - |
| Total Households | 578 (100.0%) | 3.70 |
Household Size by Marriage Status in Presquille
Out of a total of 578 households in Presquille, 431 (74.6%) are family households, while 147 (25.4%) are nonfamily households. The most numerous type of family households are 4-person households, comprising 185, and the most common type of nonfamily households are 1-person households, comprising 147.
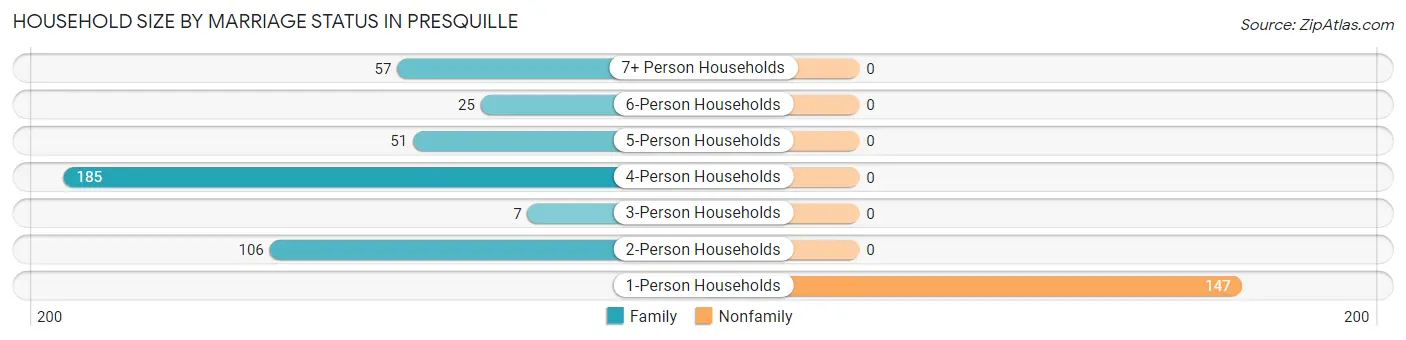
| Household Size | Family Households | Nonfamily Households |
| 1-Person Households | - | 147 (25.4%) |
| 2-Person Households | 106 (18.3%) | 0 (0.0%) |
| 3-Person Households | 7 (1.2%) | 0 (0.0%) |
| 4-Person Households | 185 (32.0%) | 0 (0.0%) |
| 5-Person Households | 51 (8.8%) | 0 (0.0%) |
| 6-Person Households | 25 (4.3%) | 0 (0.0%) |
| 7+ Person Households | 57 (9.9%) | 0 (0.0%) |
| Total | 431 (74.6%) | 147 (25.4%) |
Female Fertility in Presquille
Fertility by Age in Presquille
Average fertility rate in Presquille is 60.0 births per 1,000 women. Women in the age bracket of 20 to 34 years have the highest fertility rate with 184.0 births per 1,000 women. Women in the age bracket of 20 to 34 years acount for 100.0% of all women with births.
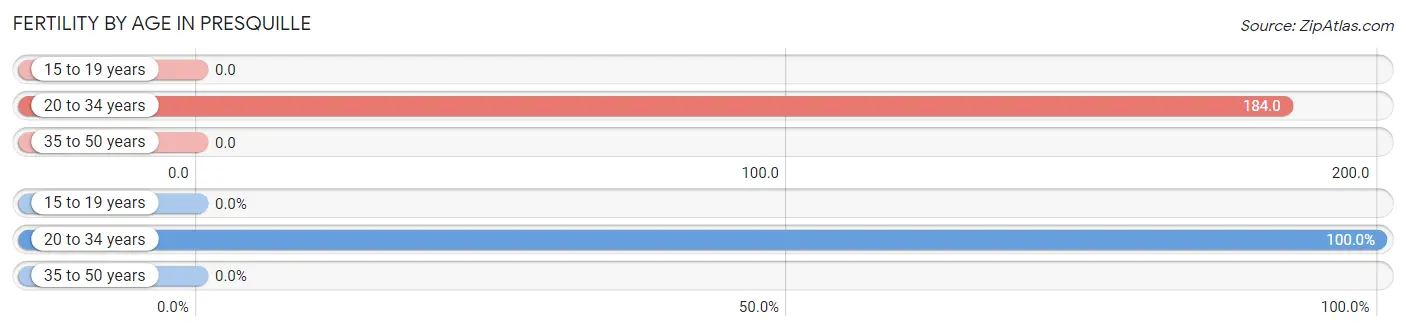
| Age Bracket | Women with Births | Births / 1,000 Women |
| 15 to 19 years | 0 (0.0%) | 0.0 |
| 20 to 34 years | 18 (100.0%) | 184.0 |
| 35 to 50 years | 0 (0.0%) | 0.0 |
| Total | 18 (100.0%) | 60.0 |
Fertility by Age by Marriage Status in Presquille
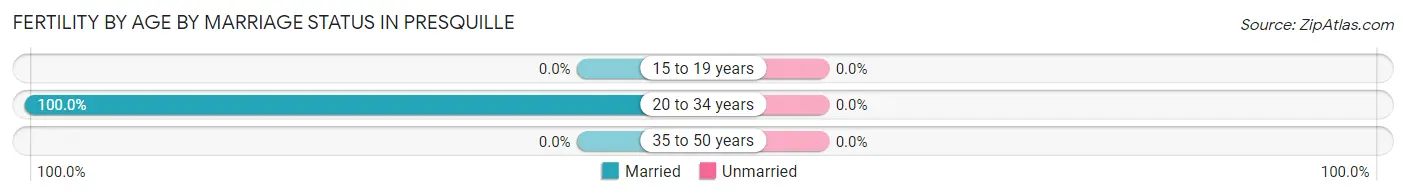
| Age Bracket | Married | Unmarried |
| 15 to 19 years | 0 (0.0%) | 0 (0.0%) |
| 20 to 34 years | 18 (100.0%) | 0 (0.0%) |
| 35 to 50 years | 0 (0.0%) | 0 (0.0%) |
| Total | 18 (100.0%) | 0 (0.0%) |
Fertility by Education in Presquille
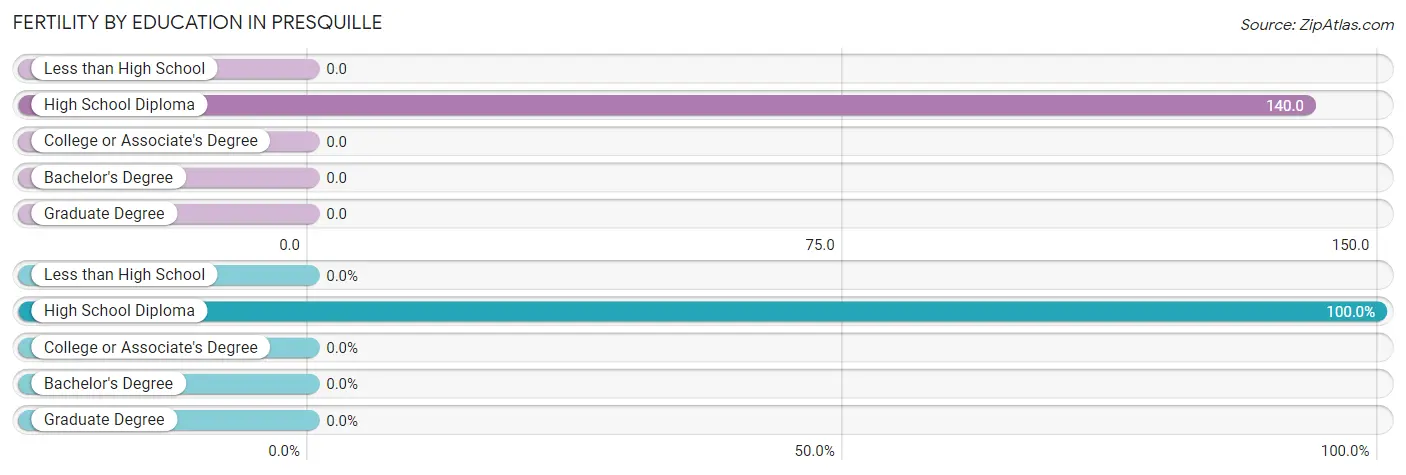
| Educational Attainment | Women with Births | Births / 1,000 Women |
| Less than High School | 0 (0.0%) | 0.0 |
| High School Diploma | 18 (100.0%) | 140.0 |
| College or Associate's Degree | 0 (0.0%) | 0.0 |
| Bachelor's Degree | 0 (0.0%) | 0.0 |
| Graduate Degree | 0 (0.0%) | 0.0 |
| Total | 18 (100.0%) | 60.0 |
Fertility by Education by Marriage Status in Presquille
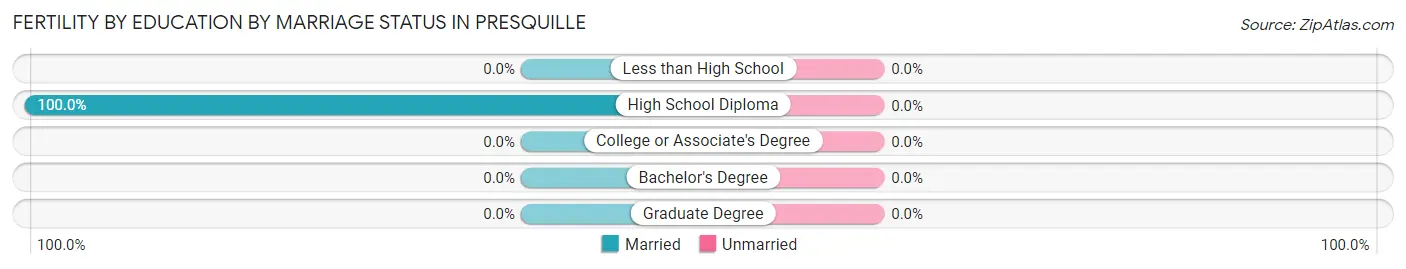
| Educational Attainment | Married | Unmarried |
| Less than High School | 0 (0.0%) | 0 (0.0%) |
| High School Diploma | 18 (100.0%) | 0 (0.0%) |
| College or Associate's Degree | 0 (0.0%) | 0 (0.0%) |
| Bachelor's Degree | 0 (0.0%) | 0 (0.0%) |
| Graduate Degree | 0 (0.0%) | 0 (0.0%) |
| Total | 18 (100.0%) | 0 (0.0%) |
Employment Characteristics in Presquille
Employment by Class of Employer in Presquille
Among the 715 employed individuals in Presquille, private company employees (545 | 76.2%), local government employees (72 | 10.1%), and state government employees (47 | 6.6%) make up the most common classes of employment.
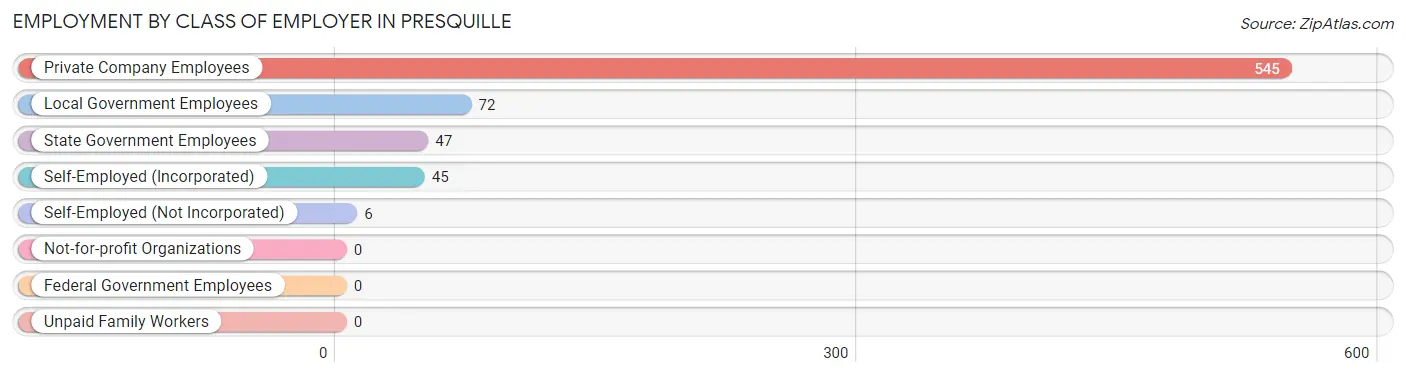
| Employer Class | # Employees | % Employees |
| Private Company Employees | 545 | 76.2% |
| Self-Employed (Incorporated) | 45 | 6.3% |
| Self-Employed (Not Incorporated) | 6 | 0.8% |
| Not-for-profit Organizations | 0 | 0.0% |
| Local Government Employees | 72 | 10.1% |
| State Government Employees | 47 | 6.6% |
| Federal Government Employees | 0 | 0.0% |
| Unpaid Family Workers | 0 | 0.0% |
| Total | 715 | 100.0% |
Employment Status by Age in Presquille
According to the labor force statistics for Presquille, out of the total population over 16 years of age (1,347), 66.2% or 892 individuals are in the labor force, with 19.8% or 177 of them unemployed. The age group with the highest labor force participation rate is 25 to 29 years, with 100.0% or 151 individuals in the labor force. Within the labor force, the 25 to 29 years age range has the highest percentage of unemployed individuals, with 59.6% or 90 of them being unemployed.
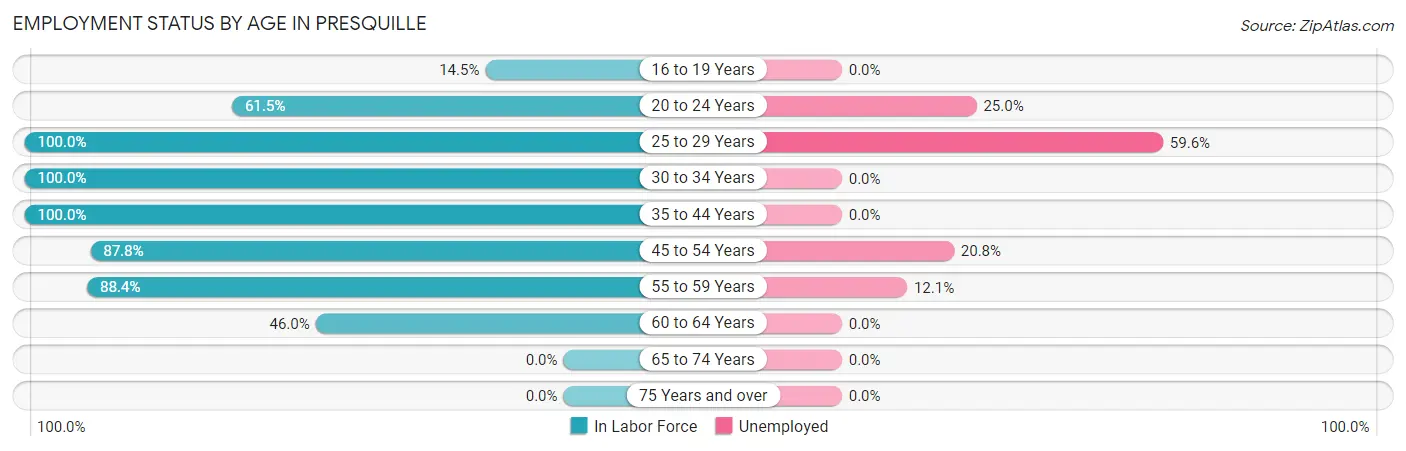
| Age Bracket | In Labor Force | Unemployed |
| 16 to 19 Years | 8 (14.5%) | 0 (0.0%) |
| 20 to 24 Years | 72 (61.5%) | 18 (25.0%) |
| 25 to 29 Years | 151 (100.0%) | 90 (59.6%) |
| 30 to 34 Years | 73 (100.0%) | 0 (0.0%) |
| 35 to 44 Years | 169 (100.0%) | 0 (0.0%) |
| 45 to 54 Years | 274 (87.8%) | 57 (20.8%) |
| 55 to 59 Years | 99 (88.4%) | 12 (12.1%) |
| 60 to 64 Years | 46 (46.0%) | 0 (0.0%) |
| 65 to 74 Years | 0 (0.0%) | 0 (0.0%) |
| 75 Years and over | 0 (0.0%) | 0 (0.0%) |
| Total | 892 (66.2%) | 177 (19.8%) |
Employment Status by Educational Attainment in Presquille
According to labor force statistics for Presquille, 88.5% of individuals (812) out of the total population between 25 and 64 years of age (917) are in the labor force, with 19.6% or 159 of them being unemployed. The group with the highest labor force participation rate are those with the educational attainment of less than high school, with 100.0% or 79 individuals in the labor force. Within the labor force, individuals with bachelor's degree or higher education have the highest percentage of unemployment, with 29.4% or 57 of them being unemployed.
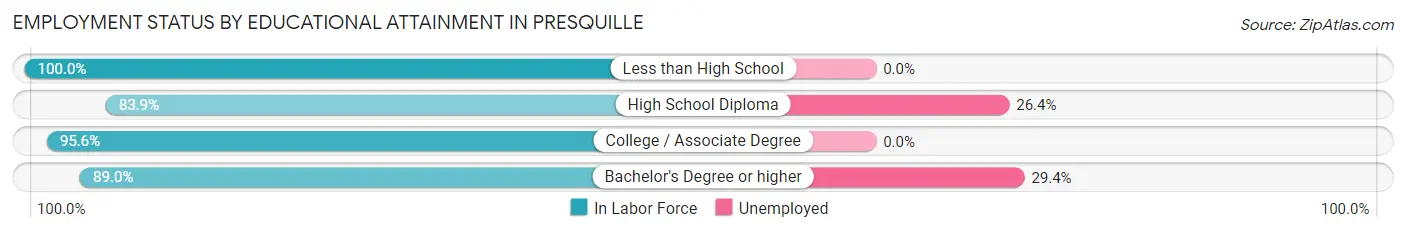
| Educational Attainment | In Labor Force | Unemployed |
| Less than High School | 79 (100.0%) | 0 (0.0%) |
| High School Diploma | 386 (83.9%) | 121 (26.4%) |
| College / Associate Degree | 153 (95.6%) | 0 (0.0%) |
| Bachelor's Degree or higher | 194 (89.0%) | 64 (29.4%) |
| Total | 812 (88.5%) | 180 (19.6%) |
Employment Occupations by Sex in Presquille
Management, Business, Science and Arts Occupations
The most common Management, Business, Science and Arts occupations in Presquille are Management (135 | 18.9%), Community & Social Service (28 | 3.9%), Education Instruction & Library (28 | 3.9%), Health Diagnosing & Treating (19 | 2.7%), and Health Technologists (19 | 2.7%).
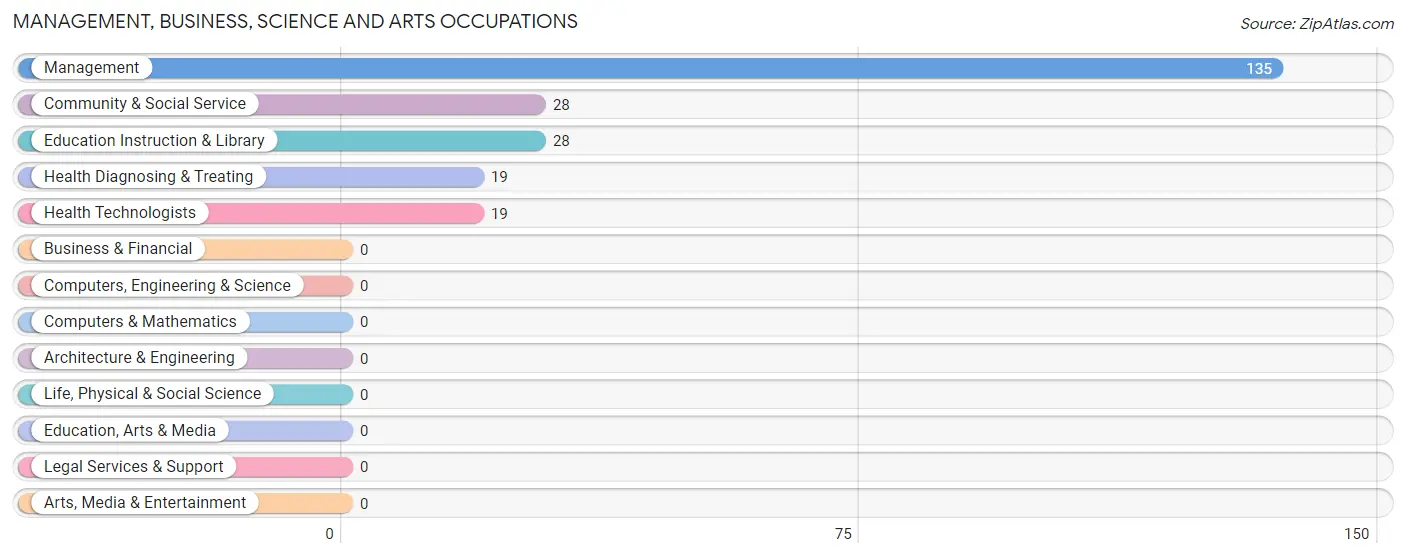
Management, Business, Science and Arts Occupations by Sex
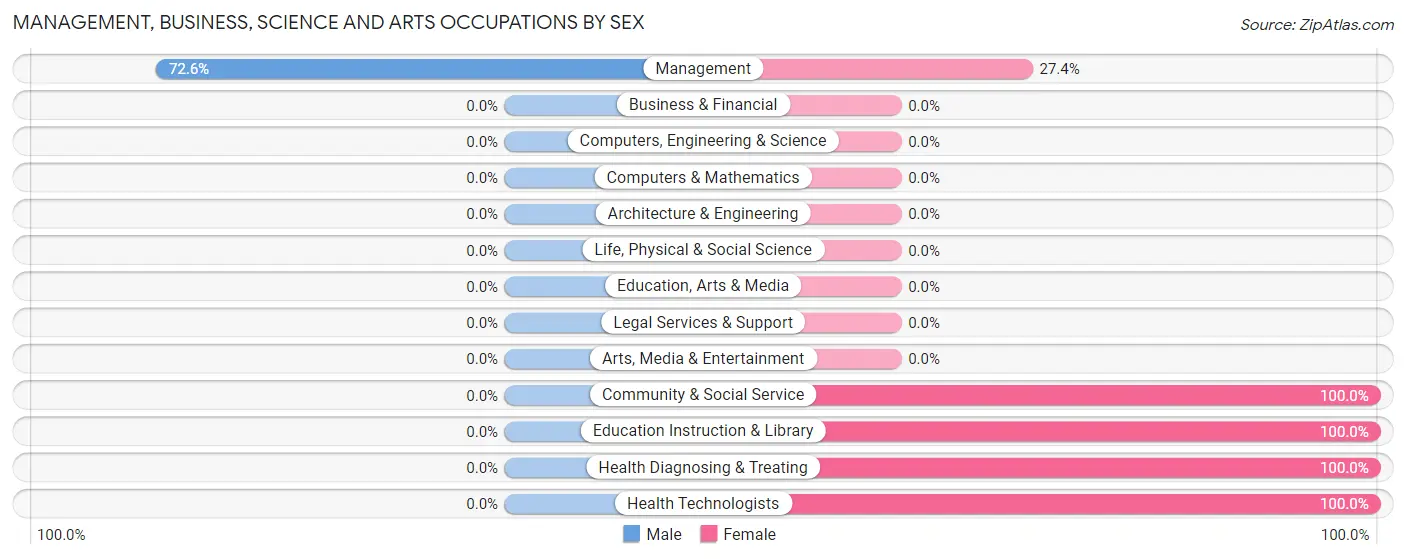
| Occupation | Male | Female |
| Management | 98 (72.6%) | 37 (27.4%) |
| Business & Financial | 0 (0.0%) | 0 (0.0%) |
| Computers, Engineering & Science | 0 (0.0%) | 0 (0.0%) |
| Computers & Mathematics | 0 (0.0%) | 0 (0.0%) |
| Architecture & Engineering | 0 (0.0%) | 0 (0.0%) |
| Life, Physical & Social Science | 0 (0.0%) | 0 (0.0%) |
| Community & Social Service | 0 (0.0%) | 28 (100.0%) |
| Education, Arts & Media | 0 (0.0%) | 0 (0.0%) |
| Legal Services & Support | 0 (0.0%) | 0 (0.0%) |
| Education Instruction & Library | 0 (0.0%) | 28 (100.0%) |
| Arts, Media & Entertainment | 0 (0.0%) | 0 (0.0%) |
| Health Diagnosing & Treating | 0 (0.0%) | 19 (100.0%) |
| Health Technologists | 0 (0.0%) | 19 (100.0%) |
| Total (Category) | 98 (53.8%) | 84 (46.2%) |
| Total (Overall) | 457 (63.9%) | 258 (36.1%) |
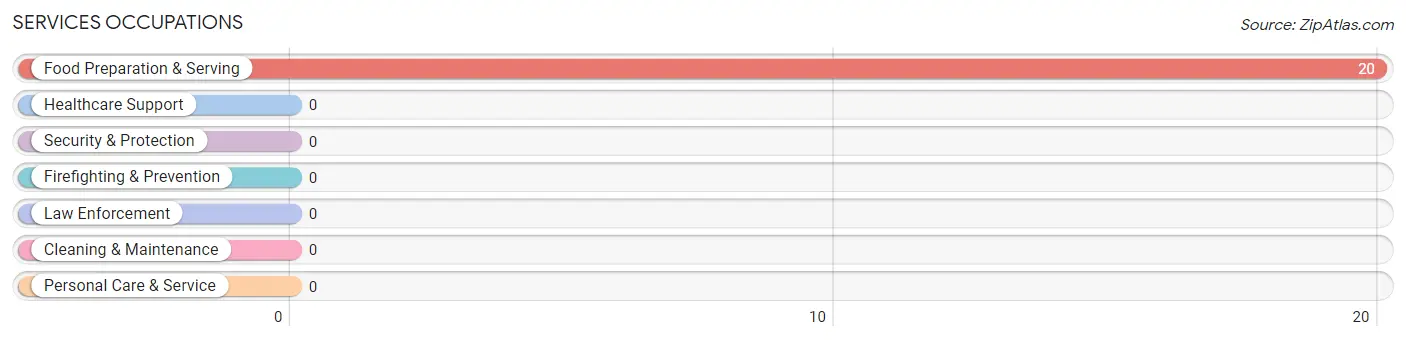
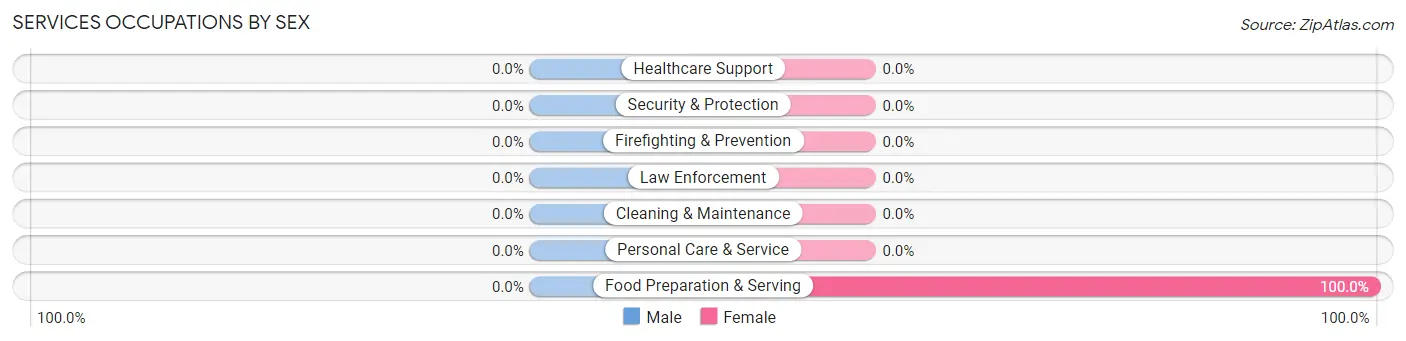
Services Occupations
The most common Services occupations in Presquille are , and Food Preparation & Serving (20 | 2.8%).
Services Occupations by Sex
| Occupation | Male | Female |
| Healthcare Support | 0 (0.0%) | 0 (0.0%) |
| Security & Protection | 0 (0.0%) | 0 (0.0%) |
| Firefighting & Prevention | 0 (0.0%) | 0 (0.0%) |
| Law Enforcement | 0 (0.0%) | 0 (0.0%) |
| Food Preparation & Serving | 0 (0.0%) | 20 (100.0%) |
| Cleaning & Maintenance | 0 (0.0%) | 0 (0.0%) |
| Personal Care & Service | 0 (0.0%) | 0 (0.0%) |
| Total (Category) | 0 (0.0%) | 20 (100.0%) |
| Total (Overall) | 457 (63.9%) | 258 (36.1%) |
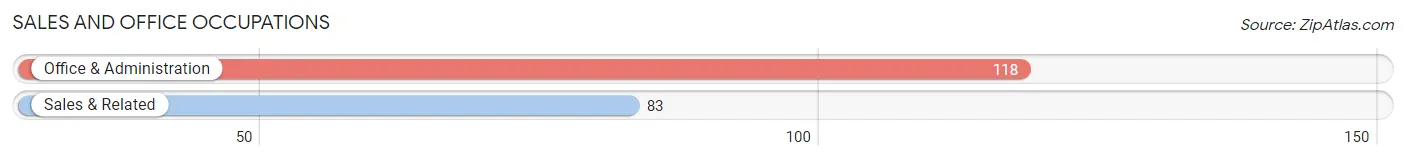
Sales and Office Occupations
The most common Sales and Office occupations in Presquille are Office & Administration (118 | 16.5%), and Sales & Related (83 | 11.6%).
Sales and Office Occupations by Sex
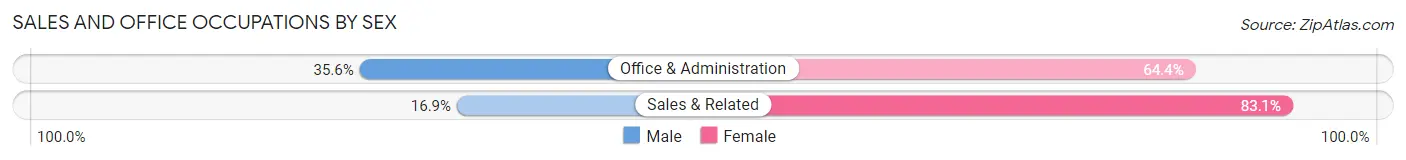
| Occupation | Male | Female |
| Sales & Related | 14 (16.9%) | 69 (83.1%) |
| Office & Administration | 42 (35.6%) | 76 (64.4%) |
| Total (Category) | 56 (27.9%) | 145 (72.1%) |
| Total (Overall) | 457 (63.9%) | 258 (36.1%) |
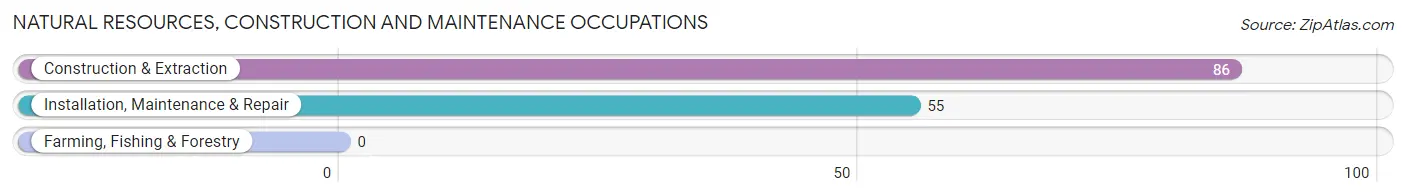
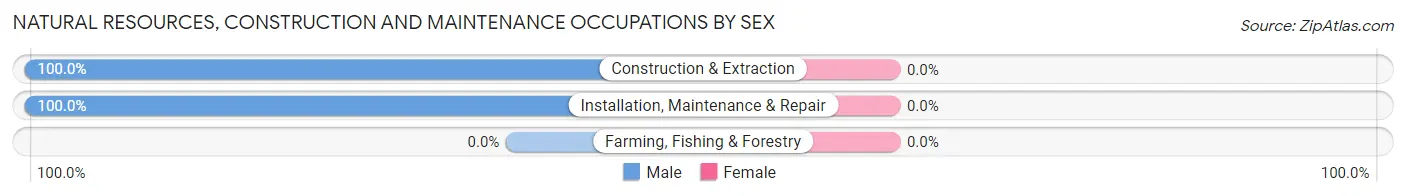
Natural Resources, Construction and Maintenance Occupations
The most common Natural Resources, Construction and Maintenance occupations in Presquille are Construction & Extraction (86 | 12.0%), and Installation, Maintenance & Repair (55 | 7.7%).
Natural Resources, Construction and Maintenance Occupations by Sex
| Occupation | Male | Female |
| Farming, Fishing & Forestry | 0 (0.0%) | 0 (0.0%) |
| Construction & Extraction | 86 (100.0%) | 0 (0.0%) |
| Installation, Maintenance & Repair | 55 (100.0%) | 0 (0.0%) |
| Total (Category) | 141 (100.0%) | 0 (0.0%) |
| Total (Overall) | 457 (63.9%) | 258 (36.1%) |
Production, Transportation and Moving Occupations
The most common Production, Transportation and Moving occupations in Presquille are Production (114 | 15.9%), Material Moving (35 | 4.9%), and Transportation (22 | 3.1%).
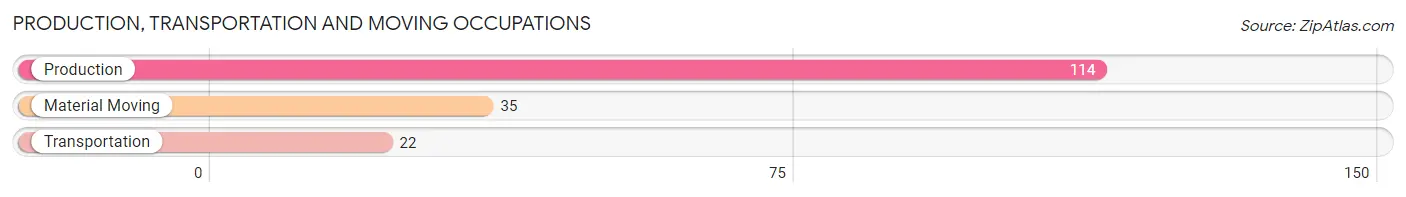
Production, Transportation and Moving Occupations by Sex
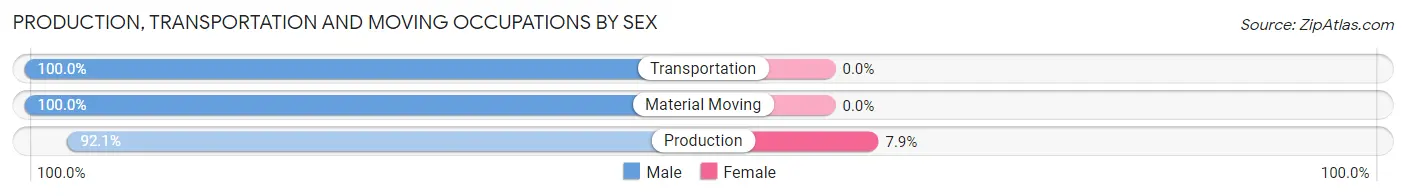
| Occupation | Male | Female |
| Production | 105 (92.1%) | 9 (7.9%) |
| Transportation | 22 (100.0%) | 0 (0.0%) |
| Material Moving | 35 (100.0%) | 0 (0.0%) |
| Total (Category) | 162 (94.7%) | 9 (5.3%) |
| Total (Overall) | 457 (63.9%) | 258 (36.1%) |
Employment Industries by Sex in Presquille
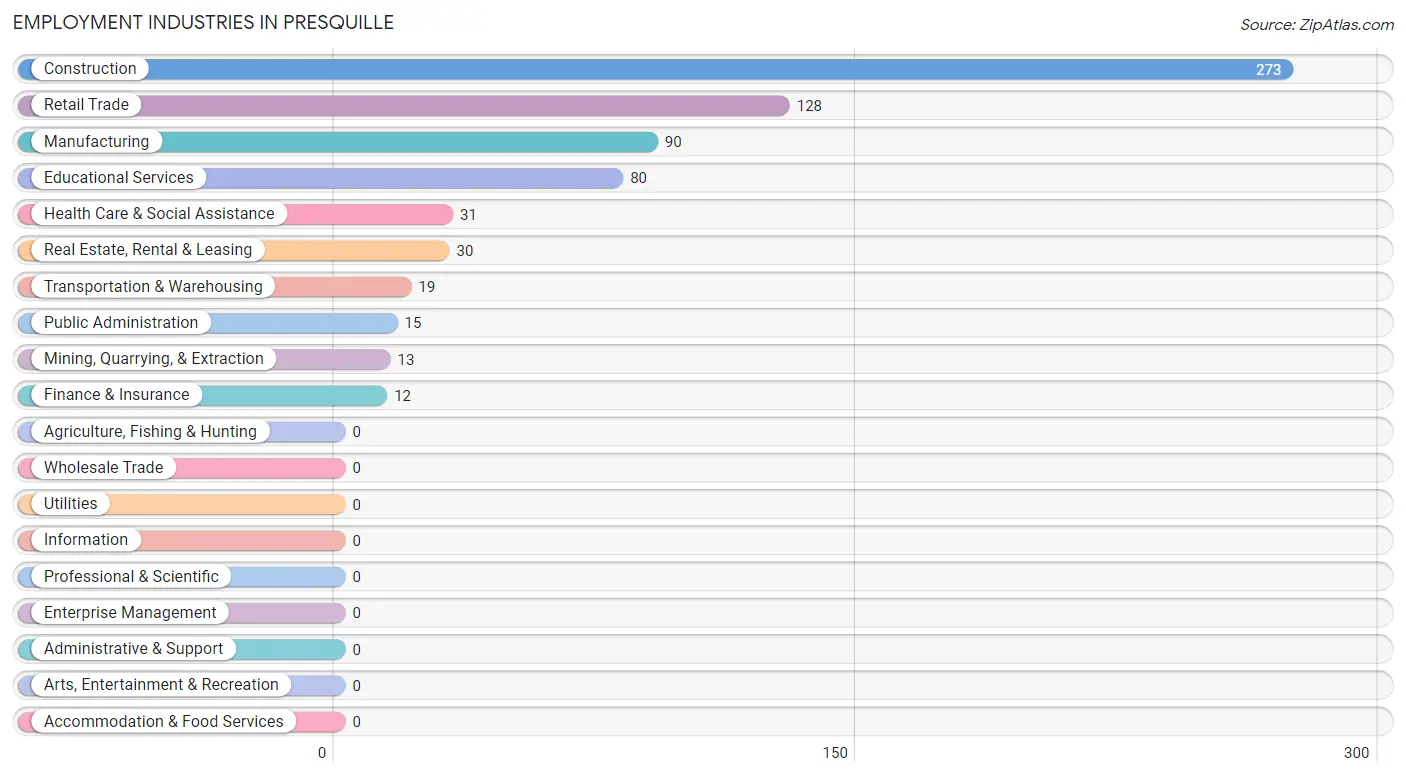
Employment Industries in Presquille
The major employment industries in Presquille include Construction (273 | 38.2%), Retail Trade (128 | 17.9%), Manufacturing (90 | 12.6%), Educational Services (80 | 11.2%), and Health Care & Social Assistance (31 | 4.3%).
Employment Industries by Sex in Presquille
The Presquille industries that see more men than women are Mining, Quarrying, & Extraction (100.0%), Finance & Insurance (100.0%), and Public Administration (100.0%), whereas the industries that tend to have a higher number of women are Real Estate, Rental & Leasing (100.0%), Health Care & Social Assistance (100.0%), and Educational Services (60.0%).
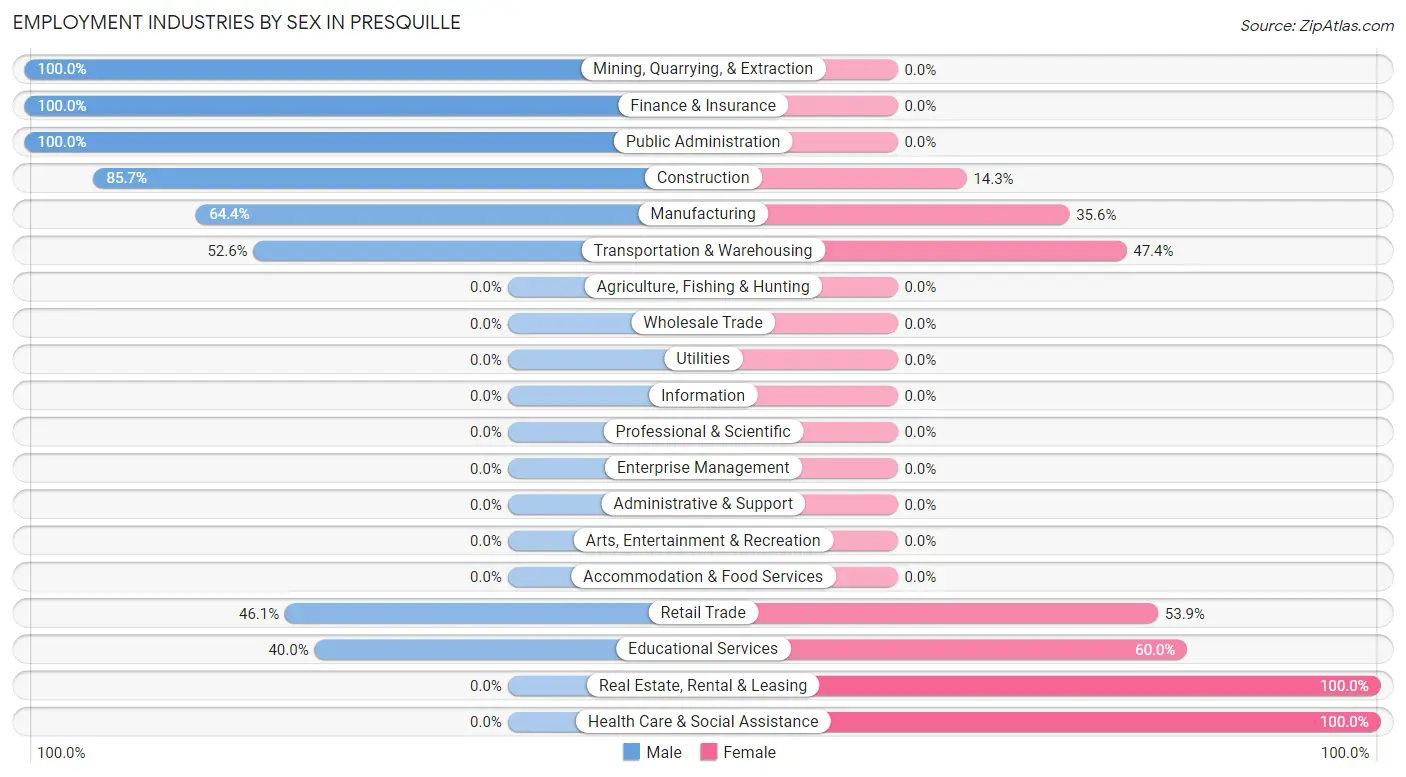
| Industry | Male | Female |
| Agriculture, Fishing & Hunting | 0 (0.0%) | 0 (0.0%) |
| Mining, Quarrying, & Extraction | 13 (100.0%) | 0 (0.0%) |
| Construction | 234 (85.7%) | 39 (14.3%) |
| Manufacturing | 58 (64.4%) | 32 (35.6%) |
| Wholesale Trade | 0 (0.0%) | 0 (0.0%) |
| Retail Trade | 59 (46.1%) | 69 (53.9%) |
| Transportation & Warehousing | 10 (52.6%) | 9 (47.4%) |
| Utilities | 0 (0.0%) | 0 (0.0%) |
| Information | 0 (0.0%) | 0 (0.0%) |
| Finance & Insurance | 12 (100.0%) | 0 (0.0%) |
| Real Estate, Rental & Leasing | 0 (0.0%) | 30 (100.0%) |
| Professional & Scientific | 0 (0.0%) | 0 (0.0%) |
| Enterprise Management | 0 (0.0%) | 0 (0.0%) |
| Administrative & Support | 0 (0.0%) | 0 (0.0%) |
| Educational Services | 32 (40.0%) | 48 (60.0%) |
| Health Care & Social Assistance | 0 (0.0%) | 31 (100.0%) |
| Arts, Entertainment & Recreation | 0 (0.0%) | 0 (0.0%) |
| Accommodation & Food Services | 0 (0.0%) | 0 (0.0%) |
| Public Administration | 15 (100.0%) | 0 (0.0%) |
| Total | 457 (63.9%) | 258 (36.1%) |
Education in Presquille
School Enrollment in Presquille
The most common levels of schooling among the 666 students in Presquille are elementary school (304 | 45.7%), middle school (127 | 19.1%), and high school (101 | 15.2%).
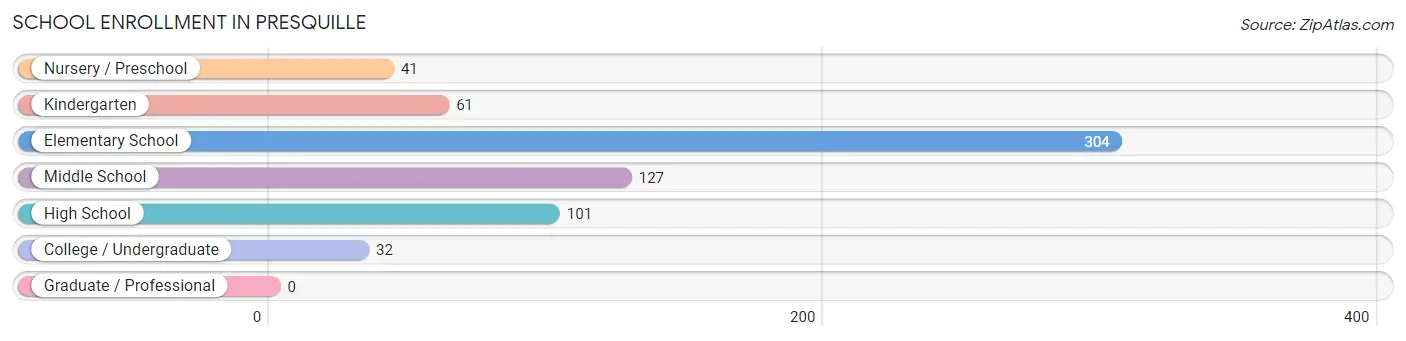
| School Level | # Students | % Students |
| Nursery / Preschool | 41 | 6.2% |
| Kindergarten | 61 | 9.2% |
| Elementary School | 304 | 45.7% |
| Middle School | 127 | 19.1% |
| High School | 101 | 15.2% |
| College / Undergraduate | 32 | 4.8% |
| Graduate / Professional | 0 | 0.0% |
| Total | 666 | 100.0% |
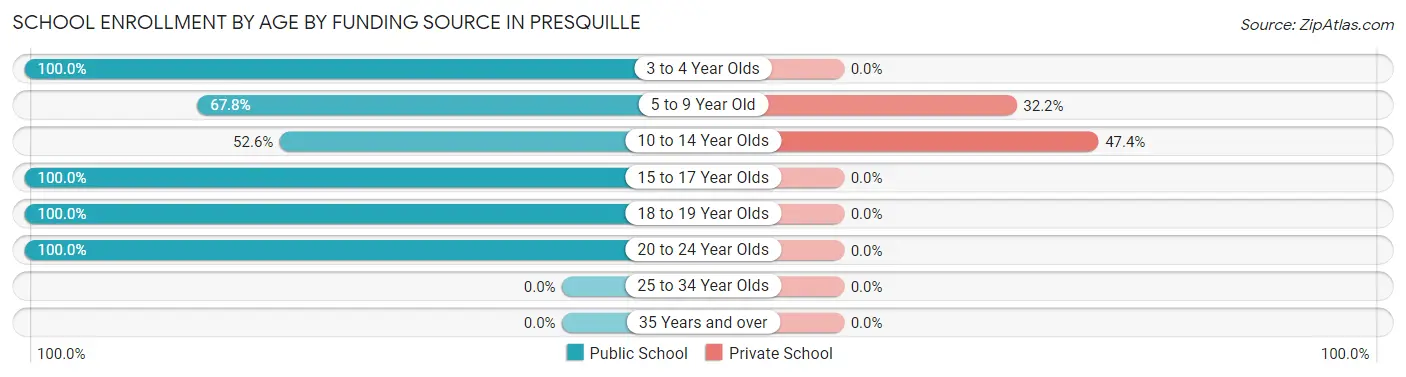
School Enrollment by Age by Funding Source in Presquille
Out of a total of 666 students who are enrolled in schools in Presquille, 211 (31.7%) attend a private institution, while the remaining 455 (68.3%) are enrolled in public schools. The age group of 10 to 14 year olds has the highest likelihood of being enrolled in private schools, with 110 (47.4% in the age bracket) enrolled. Conversely, the age group of 3 to 4 year olds has the lowest likelihood of being enrolled in a private school, with 41 (100.0% in the age bracket) attending a public institution.
| Age Bracket | Public School | Private School |
| 3 to 4 Year Olds | 41 (100.0%) | 0 (0.0%) |
| 5 to 9 Year Old | 213 (67.8%) | 101 (32.2%) |
| 10 to 14 Year Olds | 122 (52.6%) | 110 (47.4%) |
| 15 to 17 Year Olds | 22 (100.0%) | 0 (0.0%) |
| 18 to 19 Year Olds | 25 (100.0%) | 0 (0.0%) |
| 20 to 24 Year Olds | 32 (100.0%) | 0 (0.0%) |
| 25 to 34 Year Olds | 0 (0.0%) | 0 (0.0%) |
| 35 Years and over | 0 (0.0%) | 0 (0.0%) |
| Total | 455 (68.3%) | 211 (31.7%) |
Educational Attainment by Field of Study in Presquille
Science & technology (95 | 39.9%), education (48 | 20.2%), business (25 | 10.5%), social sciences (24 | 10.1%), and liberal arts & history (24 | 10.1%) are the most common fields of study among 238 individuals in Presquille who have obtained a bachelor's degree or higher.
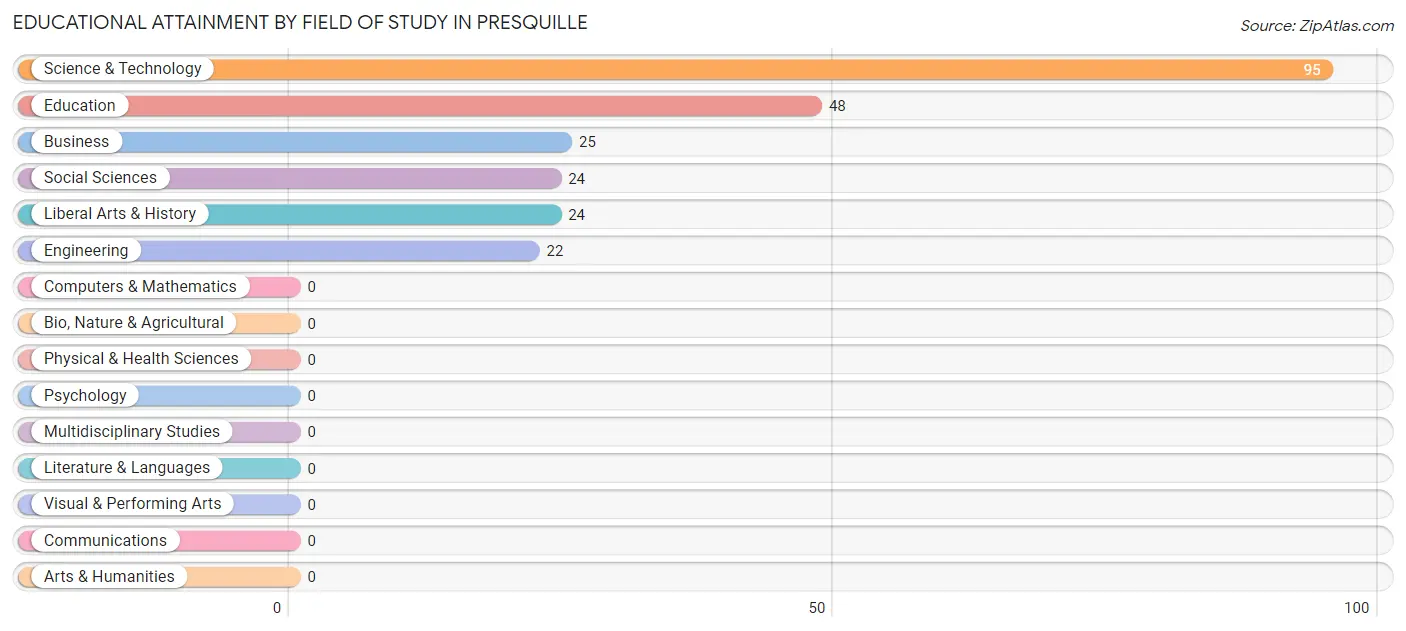
| Field of Study | # Graduates | % Graduates |
| Computers & Mathematics | 0 | 0.0% |
| Bio, Nature & Agricultural | 0 | 0.0% |
| Physical & Health Sciences | 0 | 0.0% |
| Psychology | 0 | 0.0% |
| Social Sciences | 24 | 10.1% |
| Engineering | 22 | 9.2% |
| Multidisciplinary Studies | 0 | 0.0% |
| Science & Technology | 95 | 39.9% |
| Business | 25 | 10.5% |
| Education | 48 | 20.2% |
| Literature & Languages | 0 | 0.0% |
| Liberal Arts & History | 24 | 10.1% |
| Visual & Performing Arts | 0 | 0.0% |
| Communications | 0 | 0.0% |
| Arts & Humanities | 0 | 0.0% |
| Total | 238 | 100.0% |
Transportation & Commute in Presquille
Vehicle Availability by Sex in Presquille
The most prevalent vehicle ownership categories in Presquille are males with 2 vehicles (337, accounting for 73.7%) and females with 2 vehicles (219, making up 130.6%).
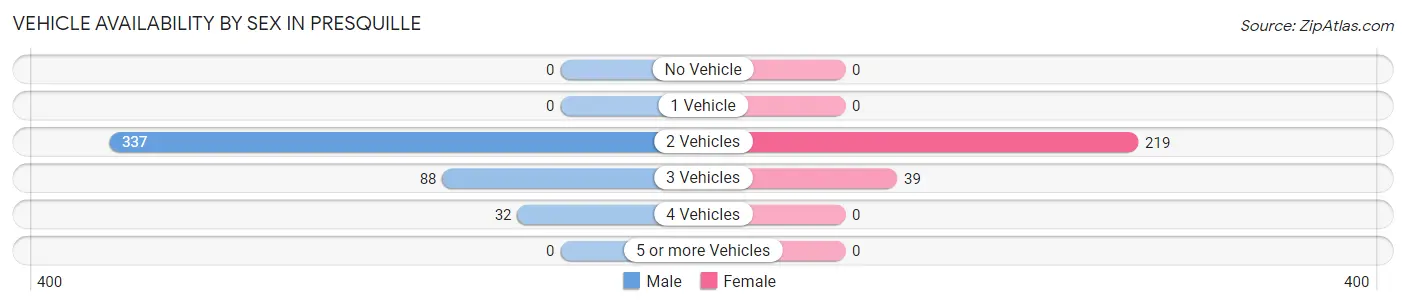
| Vehicles Available | Male | Female |
| No Vehicle | 0 (0.0%) | 0 (0.0%) |
| 1 Vehicle | 0 (0.0%) | 0 (0.0%) |
| 2 Vehicles | 337 (73.7%) | 219 (84.9%) |
| 3 Vehicles | 88 (19.3%) | 39 (15.1%) |
| 4 Vehicles | 32 (7.0%) | 0 (0.0%) |
| 5 or more Vehicles | 0 (0.0%) | 0 (0.0%) |
| Total | 457 (100.0%) | 258 (100.0%) |
Commute Time in Presquille
The most frequently occuring commute durations in Presquille are 15 to 19 minutes (230 commuters, 34.0%), 20 to 24 minutes (109 commuters, 16.1%), and 10 to 14 minutes (82 commuters, 12.1%).
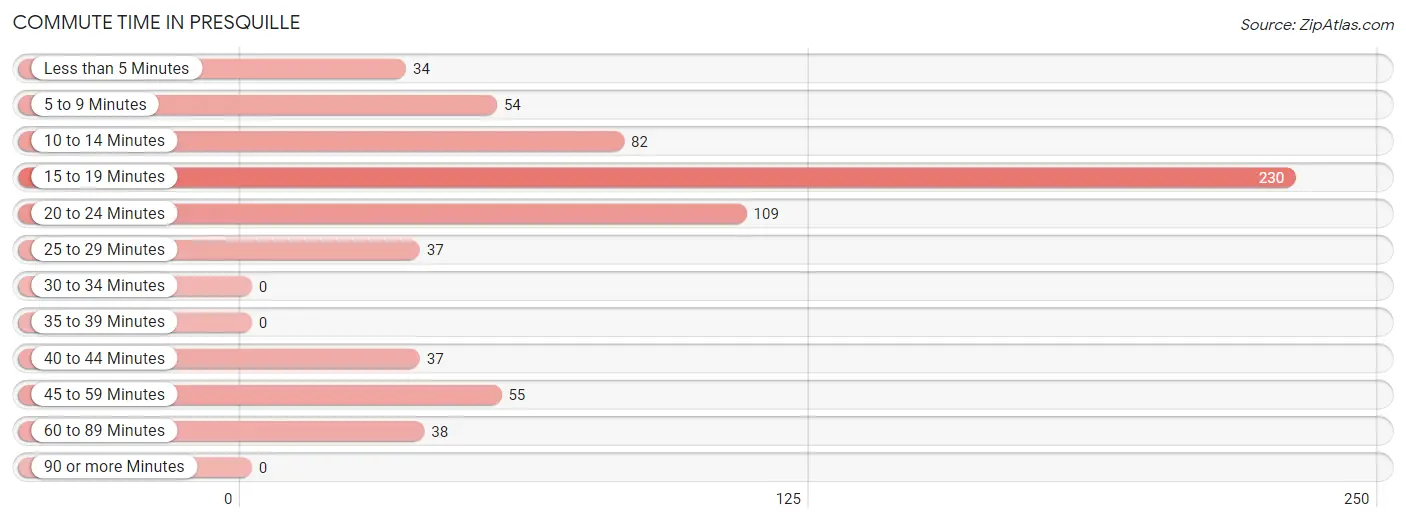
| Commute Time | # Commuters | % Commuters |
| Less than 5 Minutes | 34 | 5.0% |
| 5 to 9 Minutes | 54 | 8.0% |
| 10 to 14 Minutes | 82 | 12.1% |
| 15 to 19 Minutes | 230 | 34.0% |
| 20 to 24 Minutes | 109 | 16.1% |
| 25 to 29 Minutes | 37 | 5.5% |
| 30 to 34 Minutes | 0 | 0.0% |
| 35 to 39 Minutes | 0 | 0.0% |
| 40 to 44 Minutes | 37 | 5.5% |
| 45 to 59 Minutes | 55 | 8.1% |
| 60 to 89 Minutes | 38 | 5.6% |
| 90 or more Minutes | 0 | 0.0% |
Commute Time by Sex in Presquille
The most common commute times in Presquille are 15 to 19 minutes (110 commuters, 24.1%) for males and 15 to 19 minutes (120 commuters, 54.8%) for females.
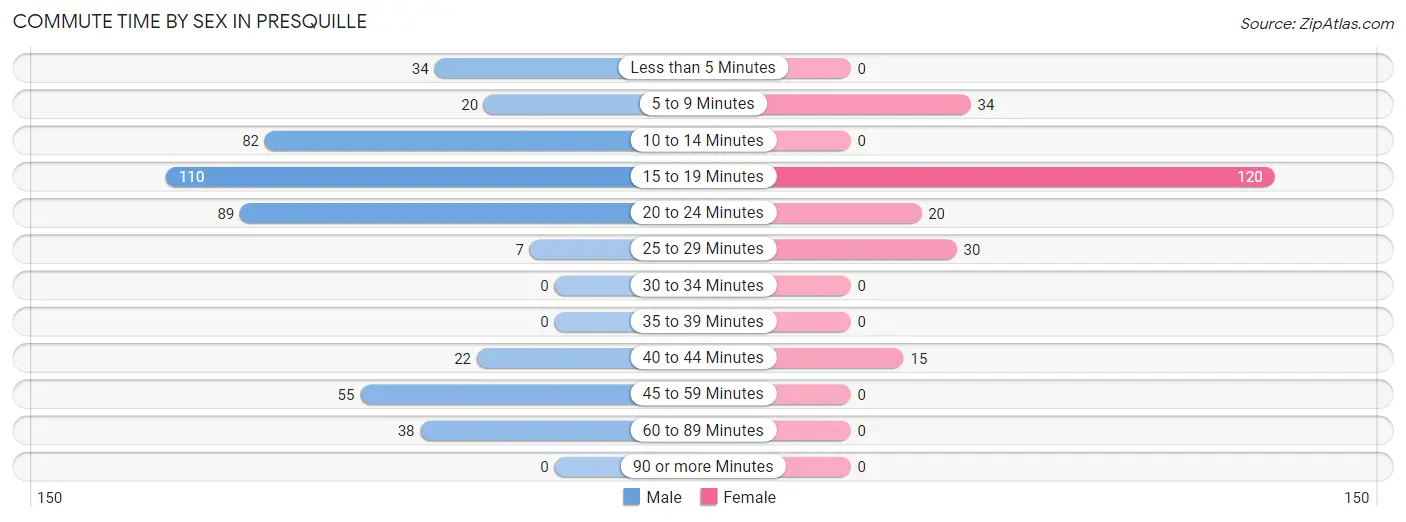
| Commute Time | Male | Female |
| Less than 5 Minutes | 34 (7.4%) | 0 (0.0%) |
| 5 to 9 Minutes | 20 (4.4%) | 34 (15.5%) |
| 10 to 14 Minutes | 82 (17.9%) | 0 (0.0%) |
| 15 to 19 Minutes | 110 (24.1%) | 120 (54.8%) |
| 20 to 24 Minutes | 89 (19.5%) | 20 (9.1%) |
| 25 to 29 Minutes | 7 (1.5%) | 30 (13.7%) |
| 30 to 34 Minutes | 0 (0.0%) | 0 (0.0%) |
| 35 to 39 Minutes | 0 (0.0%) | 0 (0.0%) |
| 40 to 44 Minutes | 22 (4.8%) | 15 (6.9%) |
| 45 to 59 Minutes | 55 (12.0%) | 0 (0.0%) |
| 60 to 89 Minutes | 38 (8.3%) | 0 (0.0%) |
| 90 or more Minutes | 0 (0.0%) | 0 (0.0%) |
Time of Departure to Work by Sex in Presquille
The most frequent times of departure to work in Presquille are 5:00 AM to 5:29 AM (112, 24.5%) for males and 6:30 AM to 6:59 AM (61, 27.9%) for females.
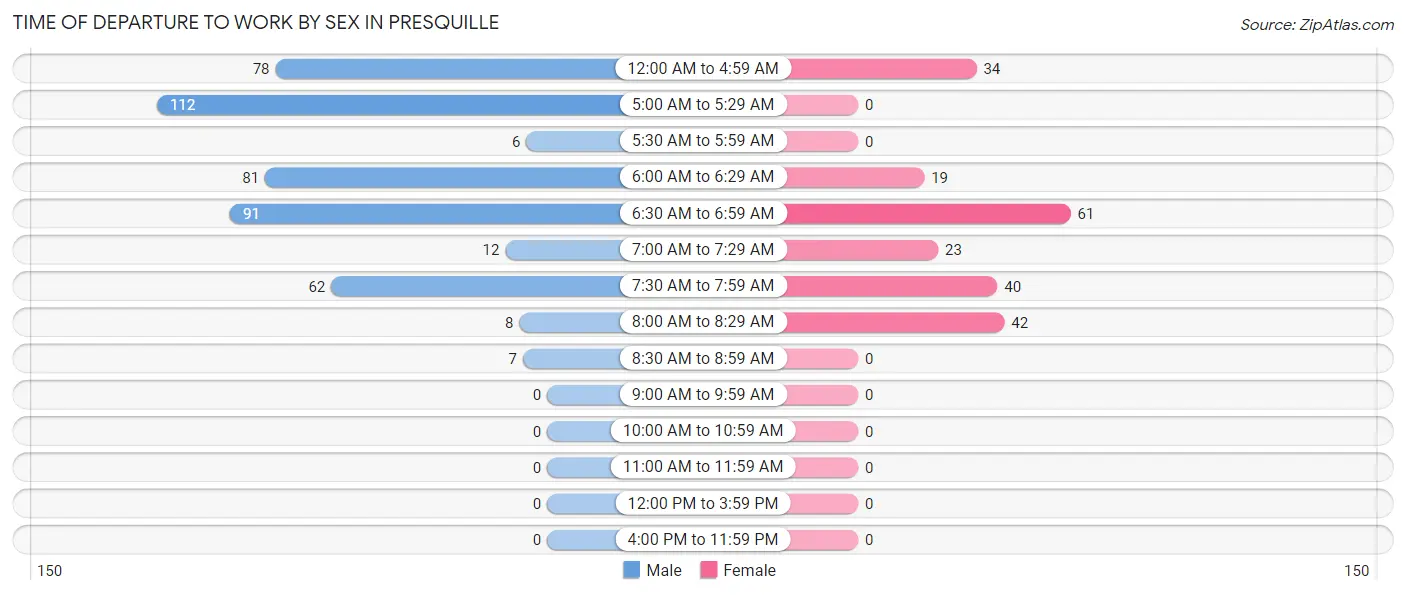
| Time of Departure | Male | Female |
| 12:00 AM to 4:59 AM | 78 (17.1%) | 34 (15.5%) |
| 5:00 AM to 5:29 AM | 112 (24.5%) | 0 (0.0%) |
| 5:30 AM to 5:59 AM | 6 (1.3%) | 0 (0.0%) |
| 6:00 AM to 6:29 AM | 81 (17.7%) | 19 (8.7%) |
| 6:30 AM to 6:59 AM | 91 (19.9%) | 61 (27.9%) |
| 7:00 AM to 7:29 AM | 12 (2.6%) | 23 (10.5%) |
| 7:30 AM to 7:59 AM | 62 (13.6%) | 40 (18.3%) |
| 8:00 AM to 8:29 AM | 8 (1.8%) | 42 (19.2%) |
| 8:30 AM to 8:59 AM | 7 (1.5%) | 0 (0.0%) |
| 9:00 AM to 9:59 AM | 0 (0.0%) | 0 (0.0%) |
| 10:00 AM to 10:59 AM | 0 (0.0%) | 0 (0.0%) |
| 11:00 AM to 11:59 AM | 0 (0.0%) | 0 (0.0%) |
| 12:00 PM to 3:59 PM | 0 (0.0%) | 0 (0.0%) |
| 4:00 PM to 11:59 PM | 0 (0.0%) | 0 (0.0%) |
| Total | 457 (100.0%) | 219 (100.0%) |
Housing Occupancy in Presquille
Occupancy by Ownership in Presquille
Of the total 578 dwellings in Presquille, owner-occupied units account for 501 (86.7%), while renter-occupied units make up 77 (13.3%).
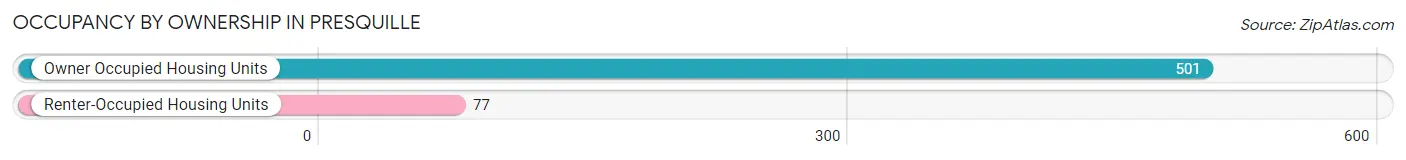
| Occupancy | # Housing Units | % Housing Units |
| Owner Occupied Housing Units | 501 | 86.7% |
| Renter-Occupied Housing Units | 77 | 13.3% |
| Total Occupied Housing Units | 578 | 100.0% |
Occupancy by Household Size in Presquille
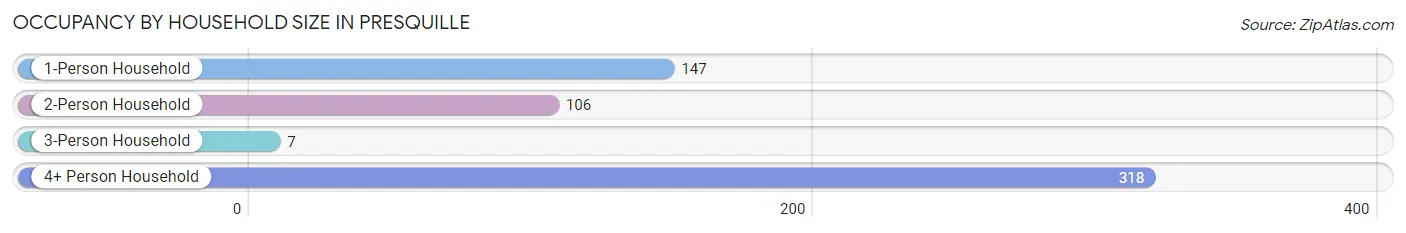
| Household Size | # Housing Units | % Housing Units |
| 1-Person Household | 147 | 25.4% |
| 2-Person Household | 106 | 18.3% |
| 3-Person Household | 7 | 1.2% |
| 4+ Person Household | 318 | 55.0% |
| Total Housing Units | 578 | 100.0% |
Occupancy by Ownership by Household Size in Presquille
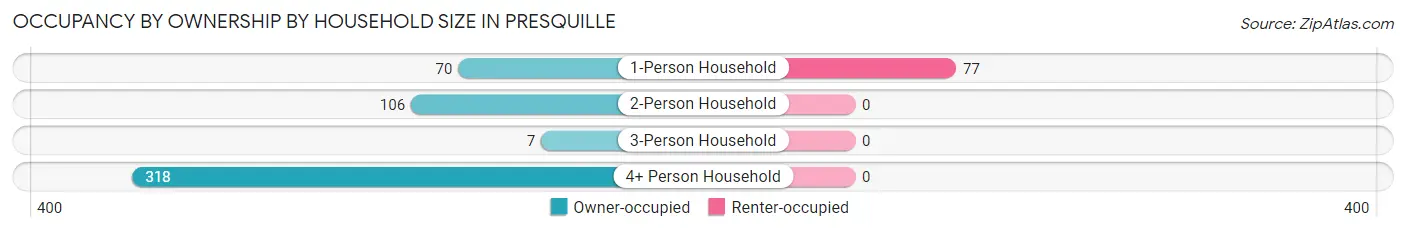
| Household Size | Owner-occupied | Renter-occupied |
| 1-Person Household | 70 (47.6%) | 77 (52.4%) |
| 2-Person Household | 106 (100.0%) | 0 (0.0%) |
| 3-Person Household | 7 (100.0%) | 0 (0.0%) |
| 4+ Person Household | 318 (100.0%) | 0 (0.0%) |
| Total Housing Units | 501 (86.7%) | 77 (13.3%) |
Occupancy by Educational Attainment in Presquille
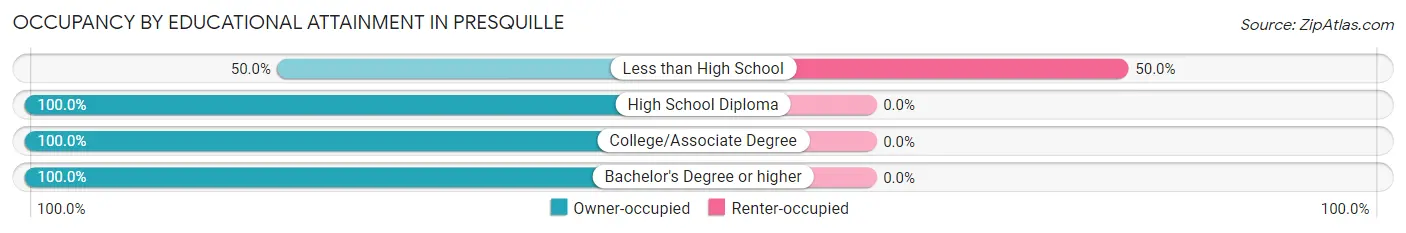
| Household Size | Owner-occupied | Renter-occupied |
| Less than High School | 77 (50.0%) | 77 (50.0%) |
| High School Diploma | 137 (100.0%) | 0 (0.0%) |
| College/Associate Degree | 127 (100.0%) | 0 (0.0%) |
| Bachelor's Degree or higher | 160 (100.0%) | 0 (0.0%) |
Occupancy by Age of Householder in Presquille
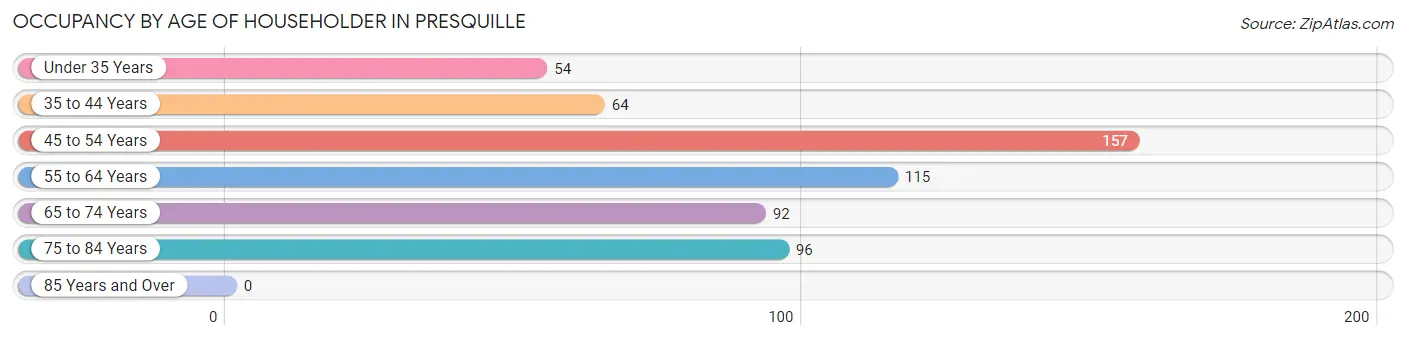
| Age Bracket | # Households | % Households |
| Under 35 Years | 54 | 9.3% |
| 35 to 44 Years | 64 | 11.1% |
| 45 to 54 Years | 157 | 27.2% |
| 55 to 64 Years | 115 | 19.9% |
| 65 to 74 Years | 92 | 15.9% |
| 75 to 84 Years | 96 | 16.6% |
| 85 Years and Over | 0 | 0.0% |
| Total | 578 | 100.0% |
Housing Finances in Presquille
Median Income by Occupancy in Presquille
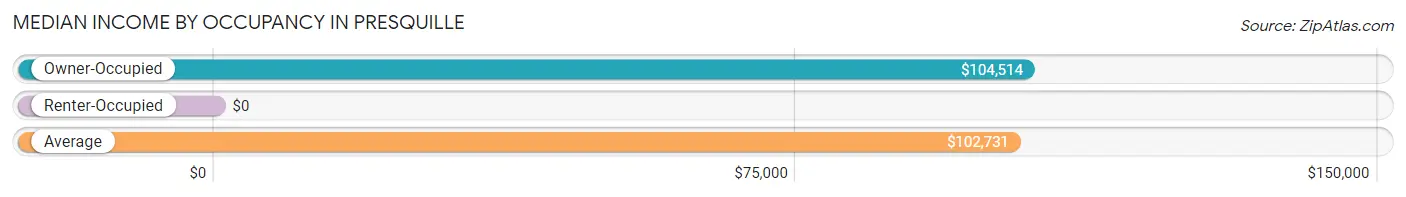
| Occupancy Type | # Households | Median Income |
| Owner-Occupied | 501 (86.7%) | $104,514 |
| Renter-Occupied | 77 (13.3%) | $0 |
| Average | 578 (100.0%) | $102,731 |
Occupancy by Householder Income Bracket in Presquille
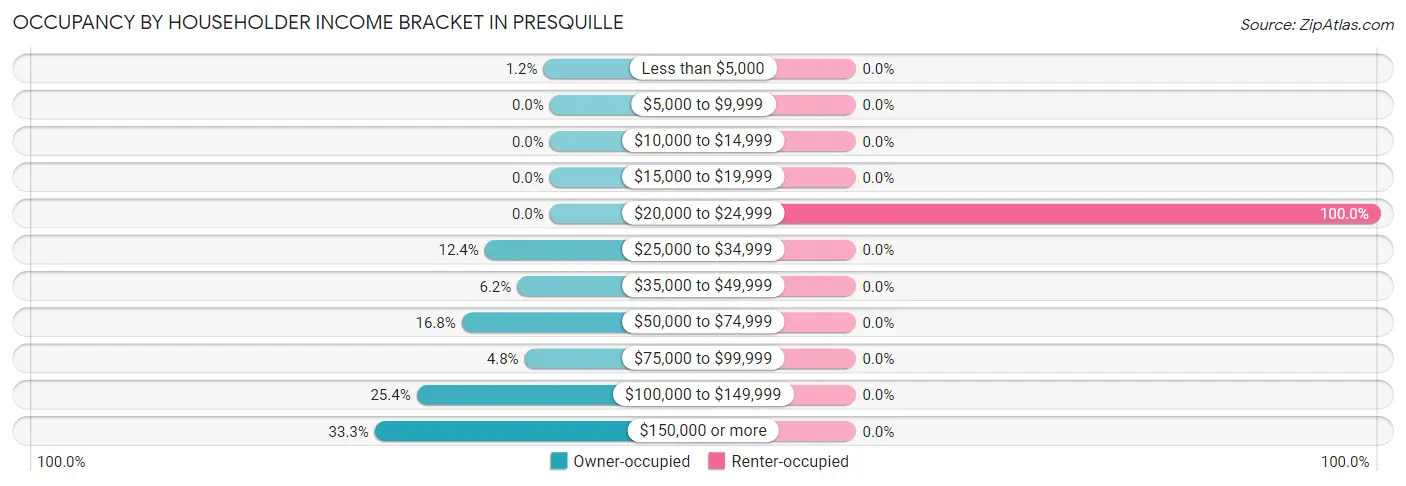
| Income Bracket | Owner-occupied | Renter-occupied |
| Less than $5,000 | 6 (1.2%) | 0 (0.0%) |
| $5,000 to $9,999 | 0 (0.0%) | 0 (0.0%) |
| $10,000 to $14,999 | 0 (0.0%) | 0 (0.0%) |
| $15,000 to $19,999 | 0 (0.0%) | 0 (0.0%) |
| $20,000 to $24,999 | 0 (0.0%) | 77 (100.0%) |
| $25,000 to $34,999 | 62 (12.4%) | 0 (0.0%) |
| $35,000 to $49,999 | 31 (6.2%) | 0 (0.0%) |
| $50,000 to $74,999 | 84 (16.8%) | 0 (0.0%) |
| $75,000 to $99,999 | 24 (4.8%) | 0 (0.0%) |
| $100,000 to $149,999 | 127 (25.4%) | 0 (0.0%) |
| $150,000 or more | 167 (33.3%) | 0 (0.0%) |
| Total | 501 (100.0%) | 77 (100.0%) |
Monthly Housing Cost Tiers in Presquille
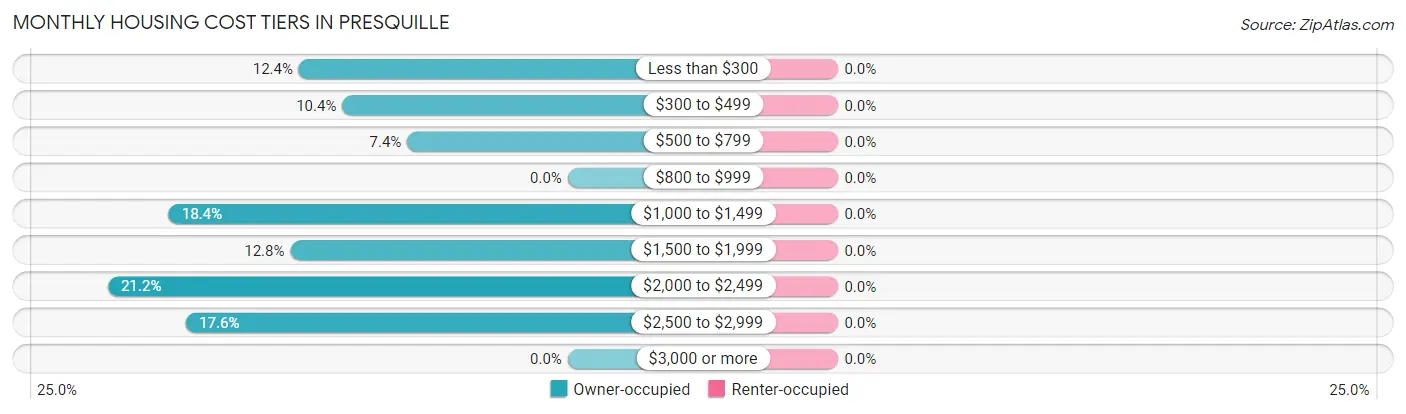
| Monthly Cost | Owner-occupied | Renter-occupied |
| Less than $300 | 62 (12.4%) | 0 (0.0%) |
| $300 to $499 | 52 (10.4%) | 0 (0.0%) |
| $500 to $799 | 37 (7.4%) | 0 (0.0%) |
| $800 to $999 | 0 (0.0%) | 0 (0.0%) |
| $1,000 to $1,499 | 92 (18.4%) | 0 (0.0%) |
| $1,500 to $1,999 | 64 (12.8%) | 0 (0.0%) |
| $2,000 to $2,499 | 106 (21.2%) | 0 (0.0%) |
| $2,500 to $2,999 | 88 (17.6%) | 0 (0.0%) |
| $3,000 or more | 0 (0.0%) | 0 (0.0%) |
| Total | 501 (100.0%) | 77 (100.0%) |
Physical Housing Characteristics in Presquille
Housing Structures in Presquille
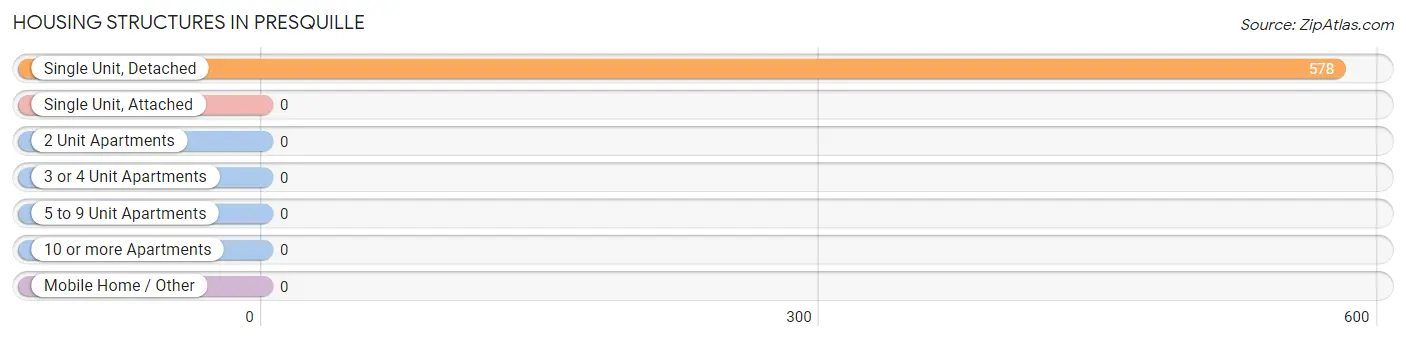
| Structure Type | # Housing Units | % Housing Units |
| Single Unit, Detached | 578 | 100.0% |
| Single Unit, Attached | 0 | 0.0% |
| 2 Unit Apartments | 0 | 0.0% |
| 3 or 4 Unit Apartments | 0 | 0.0% |
| 5 to 9 Unit Apartments | 0 | 0.0% |
| 10 or more Apartments | 0 | 0.0% |
| Mobile Home / Other | 0 | 0.0% |
| Total | 578 | 100.0% |
Housing Structures by Occupancy in Presquille
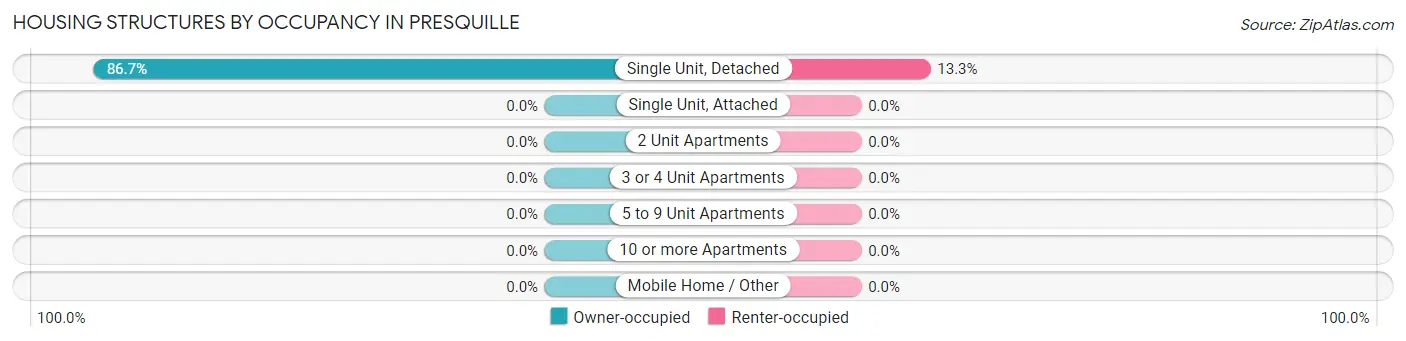
| Structure Type | Owner-occupied | Renter-occupied |
| Single Unit, Detached | 501 (86.7%) | 77 (13.3%) |
| Single Unit, Attached | 0 (0.0%) | 0 (0.0%) |
| 2 Unit Apartments | 0 (0.0%) | 0 (0.0%) |
| 3 or 4 Unit Apartments | 0 (0.0%) | 0 (0.0%) |
| 5 to 9 Unit Apartments | 0 (0.0%) | 0 (0.0%) |
| 10 or more Apartments | 0 (0.0%) | 0 (0.0%) |
| Mobile Home / Other | 0 (0.0%) | 0 (0.0%) |
| Total | 501 (86.7%) | 77 (13.3%) |
Housing Structures by Number of Rooms in Presquille
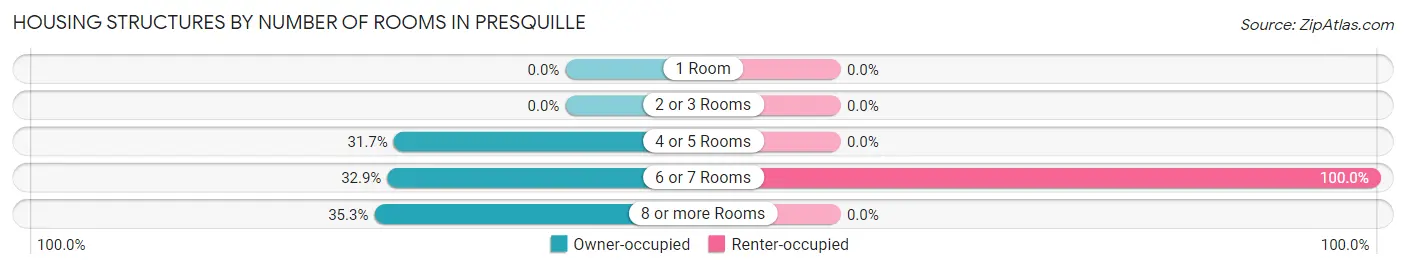
| Number of Rooms | Owner-occupied | Renter-occupied |
| 1 Room | 0 (0.0%) | 0 (0.0%) |
| 2 or 3 Rooms | 0 (0.0%) | 0 (0.0%) |
| 4 or 5 Rooms | 159 (31.7%) | 0 (0.0%) |
| 6 or 7 Rooms | 165 (32.9%) | 77 (100.0%) |
| 8 or more Rooms | 177 (35.3%) | 0 (0.0%) |
| Total | 501 (100.0%) | 77 (100.0%) |
Housing Structure by Heating Type in Presquille
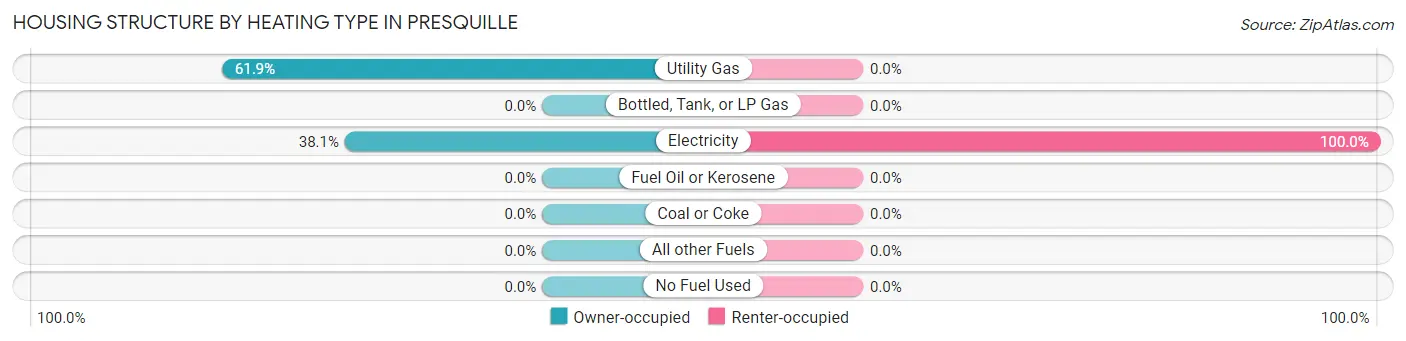
| Heating Type | Owner-occupied | Renter-occupied |
| Utility Gas | 310 (61.9%) | 0 (0.0%) |
| Bottled, Tank, or LP Gas | 0 (0.0%) | 0 (0.0%) |
| Electricity | 191 (38.1%) | 77 (100.0%) |
| Fuel Oil or Kerosene | 0 (0.0%) | 0 (0.0%) |
| Coal or Coke | 0 (0.0%) | 0 (0.0%) |
| All other Fuels | 0 (0.0%) | 0 (0.0%) |
| No Fuel Used | 0 (0.0%) | 0 (0.0%) |
| Total | 501 (100.0%) | 77 (100.0%) |
Household Vehicle Usage in Presquille
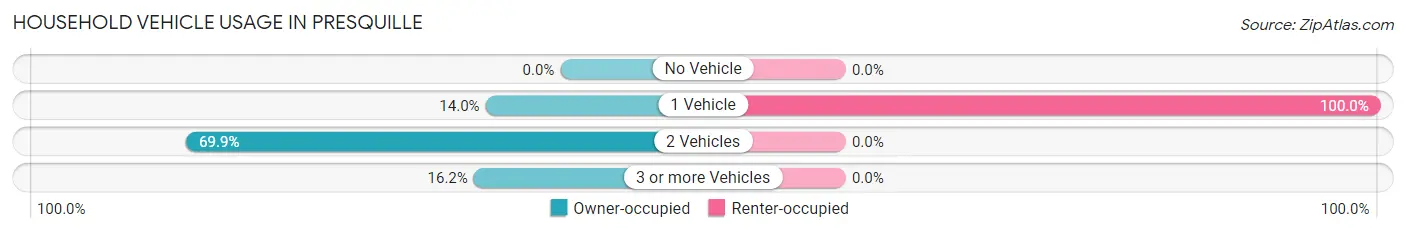
| Vehicles per Household | Owner-occupied | Renter-occupied |
| No Vehicle | 0 (0.0%) | 0 (0.0%) |
| 1 Vehicle | 70 (14.0%) | 77 (100.0%) |
| 2 Vehicles | 350 (69.9%) | 0 (0.0%) |
| 3 or more Vehicles | 81 (16.2%) | 0 (0.0%) |
| Total | 501 (100.0%) | 77 (100.0%) |
Real Estate & Mortgages in Presquille
Real Estate and Mortgage Overview in Presquille
| Characteristic | Without Mortgage | With Mortgage |
| Housing Units | 174 | 327 |
| Median Property Value | $193,500 | $276,500 |
| Median Household Income | $48,125 | $155 |
| Monthly Housing Costs | $441 | $0 |
| Real Estate Taxes | $1,515 | $0 |
Property Value by Mortgage Status in Presquille
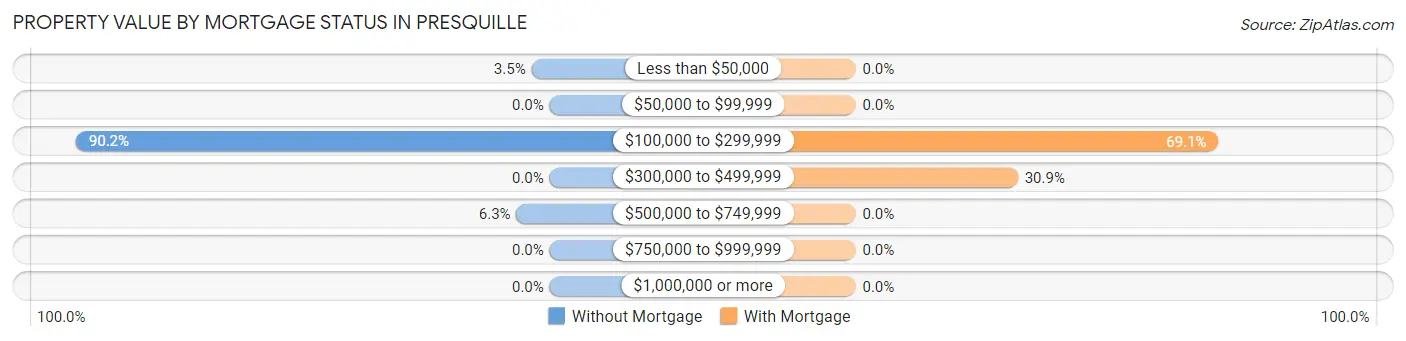
| Property Value | Without Mortgage | With Mortgage |
| Less than $50,000 | 6 (3.5%) | 0 (0.0%) |
| $50,000 to $99,999 | 0 (0.0%) | 0 (0.0%) |
| $100,000 to $299,999 | 157 (90.2%) | 226 (69.1%) |
| $300,000 to $499,999 | 0 (0.0%) | 101 (30.9%) |
| $500,000 to $749,999 | 11 (6.3%) | 0 (0.0%) |
| $750,000 to $999,999 | 0 (0.0%) | 0 (0.0%) |
| $1,000,000 or more | 0 (0.0%) | 0 (0.0%) |
| Total | 174 (100.0%) | 327 (100.0%) |
Household Income by Mortgage Status in Presquille
| Household Income | Without Mortgage | With Mortgage |
| Less than $10,000 | 6 (3.5%) | 0 (0.0%) |
| $10,000 to $24,999 | 0 (0.0%) | 0 (0.0%) |
| $25,000 to $34,999 | 62 (35.6%) | 0 (0.0%) |
| $35,000 to $49,999 | 31 (17.8%) | 0 (0.0%) |
| $50,000 to $74,999 | 49 (28.2%) | 0 (0.0%) |
| $75,000 to $99,999 | 14 (8.1%) | 35 (10.7%) |
| $100,000 to $149,999 | 0 (0.0%) | 10 (3.1%) |
| $150,000 or more | 12 (6.9%) | 127 (38.8%) |
| Total | 174 (100.0%) | 327 (100.0%) |
Property Value to Household Income Ratio in Presquille
| Value-to-Income Ratio | Without Mortgage | With Mortgage |
| Less than 2.0x | 43 (24.7%) | 143,938 (44,017.7%) |
| 2.0x to 2.9x | 7 (4.0%) | 174 (53.2%) |
| 3.0x to 3.9x | 17 (9.8%) | 138 (42.2%) |
| 4.0x or more | 107 (61.5%) | 15 (4.6%) |
| Total | 174 (100.0%) | 327 (100.0%) |
Real Estate Taxes by Mortgage Status in Presquille
| Property Taxes | Without Mortgage | With Mortgage |
| Less than $800 | 7 (4.0%) | 0 (0.0%) |
| $800 to $1,499 | 78 (44.8%) | 93 (28.4%) |
| $800 to $1,499 | 89 (51.1%) | 143 (43.7%) |
| Total | 174 (100.0%) | 327 (100.0%) |
Health & Disability in Presquille
Health Insurance Coverage by Age in Presquille
| Age Bracket | With Coverage | Without Coverage |
| Under 6 Years | 196 (82.7%) | 41 (17.3%) |
| 6 to 18 Years | 599 (100.0%) | 0 (0.0%) |
| 19 to 25 Years | 125 (100.0%) | 0 (0.0%) |
| 26 to 34 Years | 224 (100.0%) | 0 (0.0%) |
| 35 to 44 Years | 169 (100.0%) | 0 (0.0%) |
| 45 to 54 Years | 312 (100.0%) | 0 (0.0%) |
| 55 to 64 Years | 212 (100.0%) | 0 (0.0%) |
| 65 to 74 Years | 162 (100.0%) | 0 (0.0%) |
| 75 Years and older | 96 (100.0%) | 0 (0.0%) |
| Total | 2,095 (98.1%) | 41 (1.9%) |
Health Insurance Coverage by Citizenship Status in Presquille
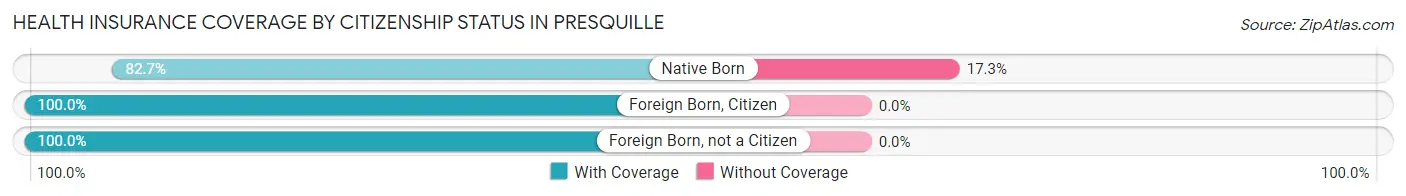
| Citizenship Status | With Coverage | Without Coverage |
| Native Born | 196 (82.7%) | 41 (17.3%) |
| Foreign Born, Citizen | 599 (100.0%) | 0 (0.0%) |
| Foreign Born, not a Citizen | 125 (100.0%) | 0 (0.0%) |
Health Insurance Coverage by Household Income in Presquille
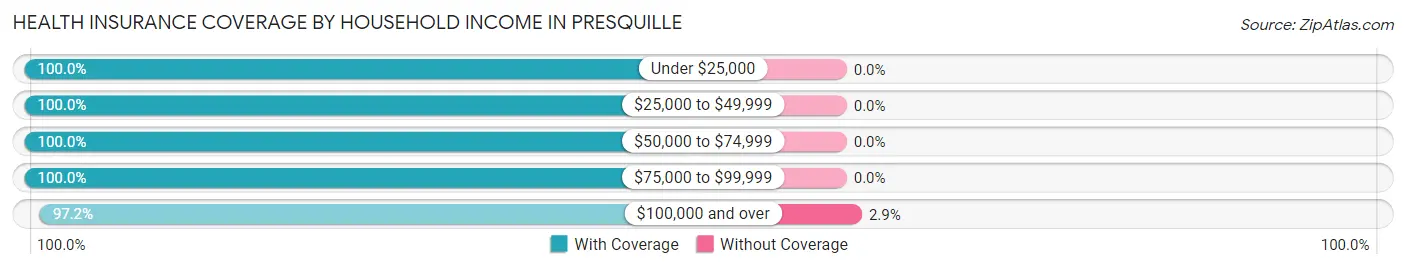
| Household Income | With Coverage | Without Coverage |
| Under $25,000 | 89 (100.0%) | 0 (0.0%) |
| $25,000 to $49,999 | 225 (100.0%) | 0 (0.0%) |
| $50,000 to $74,999 | 328 (100.0%) | 0 (0.0%) |
| $75,000 to $99,999 | 56 (100.0%) | 0 (0.0%) |
| $100,000 and over | 1,397 (97.2%) | 41 (2.9%) |
Public vs Private Health Insurance Coverage by Age in Presquille
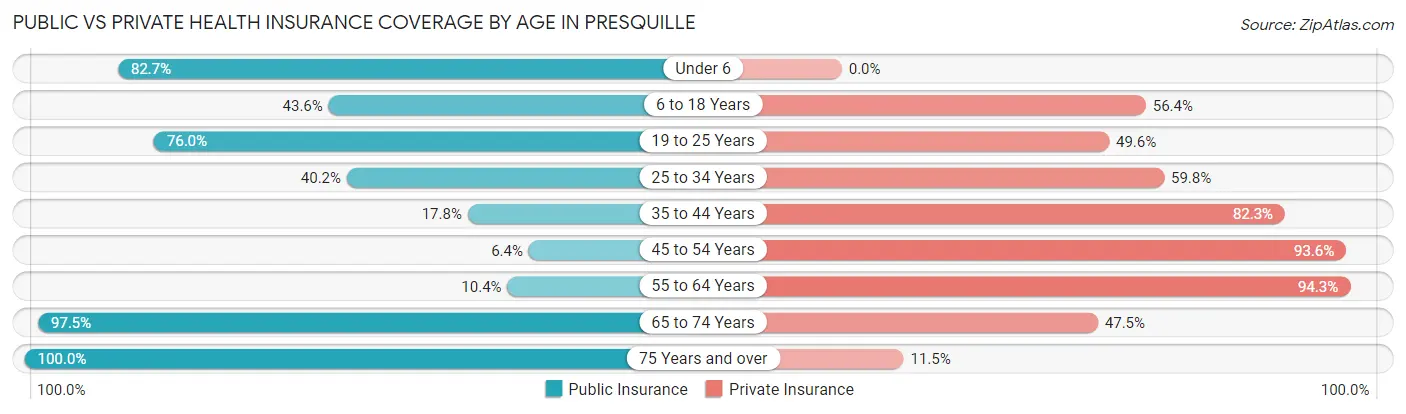
| Age Bracket | Public Insurance | Private Insurance |
| Under 6 | 196 (82.7%) | 0 (0.0%) |
| 6 to 18 Years | 261 (43.6%) | 338 (56.4%) |
| 19 to 25 Years | 95 (76.0%) | 62 (49.6%) |
| 25 to 34 Years | 90 (40.2%) | 134 (59.8%) |
| 35 to 44 Years | 30 (17.7%) | 139 (82.3%) |
| 45 to 54 Years | 20 (6.4%) | 292 (93.6%) |
| 55 to 64 Years | 22 (10.4%) | 200 (94.3%) |
| 65 to 74 Years | 158 (97.5%) | 77 (47.5%) |
| 75 Years and over | 96 (100.0%) | 11 (11.5%) |
| Total | 968 (45.3%) | 1,253 (58.7%) |
Disability Status by Sex by Age in Presquille
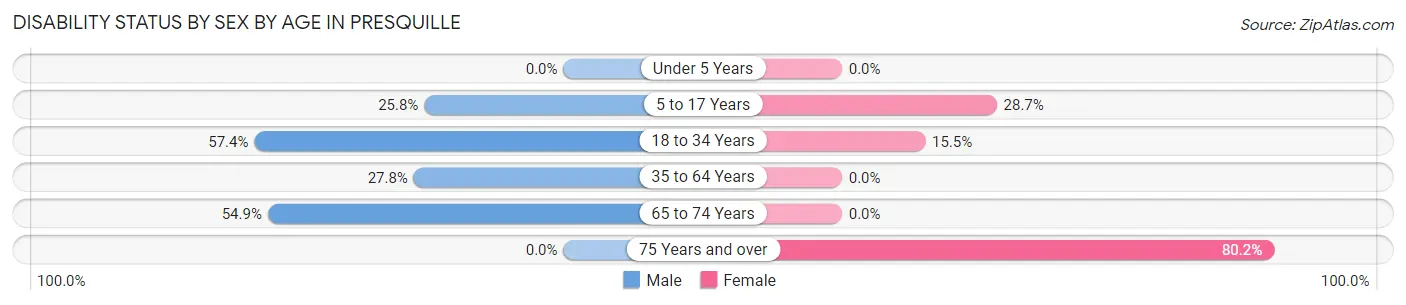
| Age Bracket | Male | Female |
| Under 5 Years | 0 (0.0%) | 0 (0.0%) |
| 5 to 17 Years | 31 (25.8%) | 148 (28.7%) |
| 18 to 34 Years | 144 (57.4%) | 19 (15.4%) |
| 35 to 64 Years | 100 (27.8%) | 0 (0.0%) |
| 65 to 74 Years | 62 (54.9%) | 0 (0.0%) |
| 75 Years and over | 0 (0.0%) | 77 (80.2%) |
Disability Class by Sex by Age in Presquille
Disability Class: Hearing Difficulty
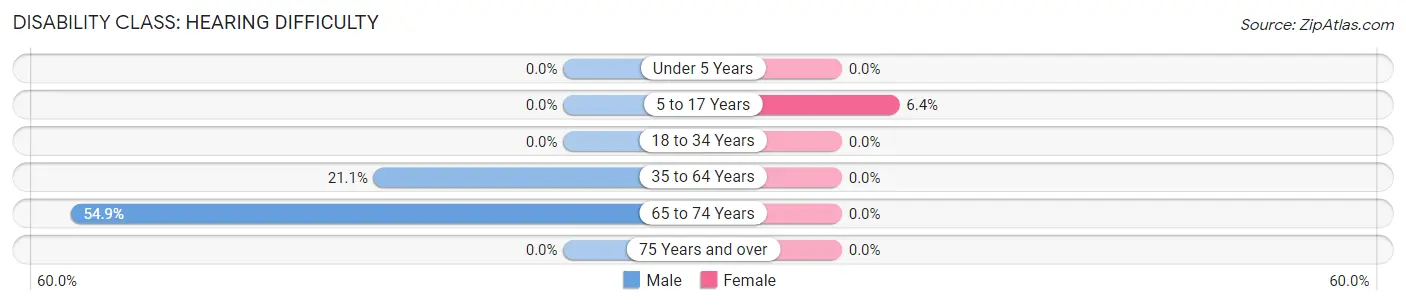
| Age Bracket | Male | Female |
| Under 5 Years | 0 (0.0%) | 0 (0.0%) |
| 5 to 17 Years | 0 (0.0%) | 33 (6.4%) |
| 18 to 34 Years | 0 (0.0%) | 0 (0.0%) |
| 35 to 64 Years | 76 (21.1%) | 0 (0.0%) |
| 65 to 74 Years | 62 (54.9%) | 0 (0.0%) |
| 75 Years and over | 0 (0.0%) | 0 (0.0%) |
Disability Class: Vision Difficulty
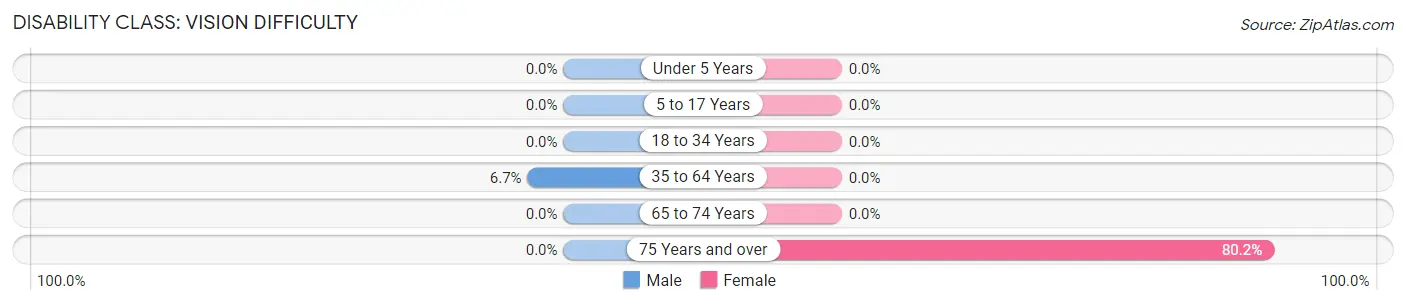
| Age Bracket | Male | Female |
| Under 5 Years | 0 (0.0%) | 0 (0.0%) |
| 5 to 17 Years | 0 (0.0%) | 0 (0.0%) |
| 18 to 34 Years | 0 (0.0%) | 0 (0.0%) |
| 35 to 64 Years | 24 (6.7%) | 0 (0.0%) |
| 65 to 74 Years | 0 (0.0%) | 0 (0.0%) |
| 75 Years and over | 0 (0.0%) | 77 (80.2%) |
Disability Class: Cognitive Difficulty
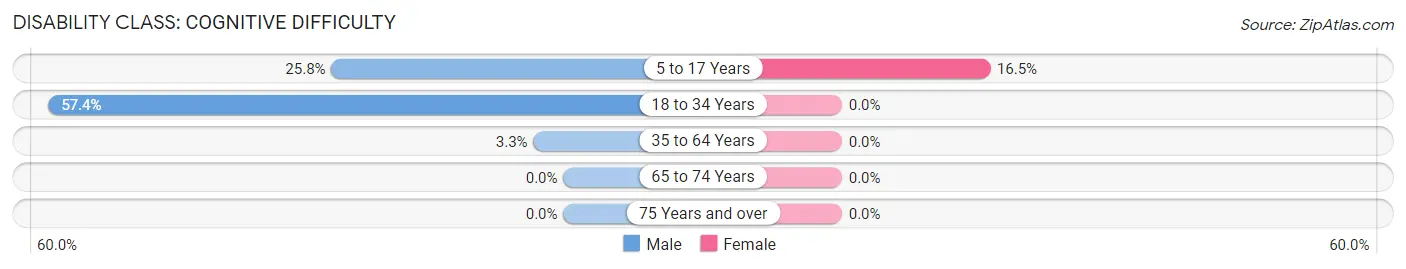
| Age Bracket | Male | Female |
| 5 to 17 Years | 31 (25.8%) | 85 (16.5%) |
| 18 to 34 Years | 144 (57.4%) | 0 (0.0%) |
| 35 to 64 Years | 12 (3.3%) | 0 (0.0%) |
| 65 to 74 Years | 0 (0.0%) | 0 (0.0%) |
| 75 Years and over | 0 (0.0%) | 0 (0.0%) |
Disability Class: Ambulatory Difficulty
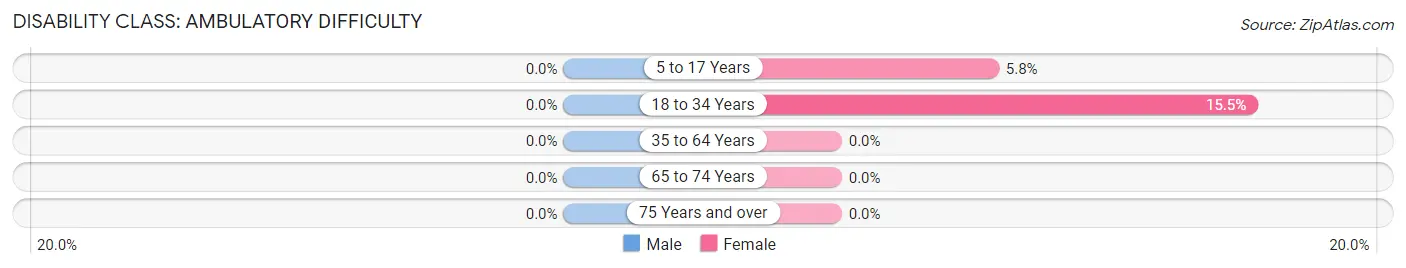
| Age Bracket | Male | Female |
| 5 to 17 Years | 0 (0.0%) | 30 (5.8%) |
| 18 to 34 Years | 0 (0.0%) | 19 (15.4%) |
| 35 to 64 Years | 0 (0.0%) | 0 (0.0%) |
| 65 to 74 Years | 0 (0.0%) | 0 (0.0%) |
| 75 Years and over | 0 (0.0%) | 0 (0.0%) |
Disability Class: Self-Care Difficulty
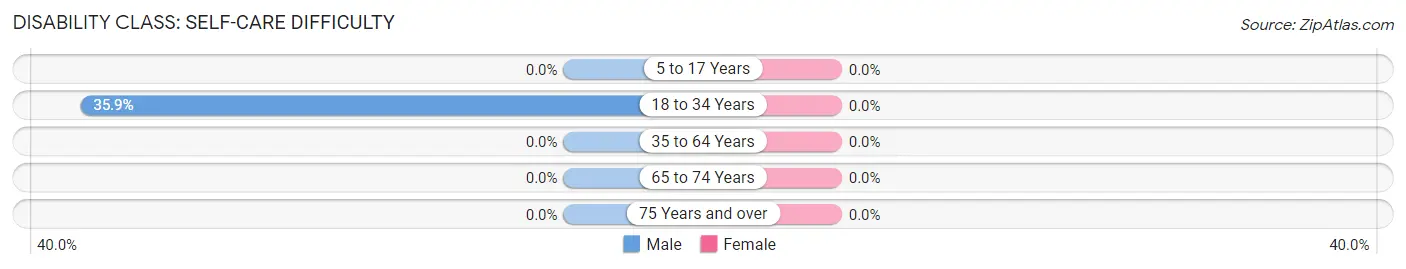
| Age Bracket | Male | Female |
| 5 to 17 Years | 0 (0.0%) | 0 (0.0%) |
| 18 to 34 Years | 90 (35.9%) | 0 (0.0%) |
| 35 to 64 Years | 0 (0.0%) | 0 (0.0%) |
| 65 to 74 Years | 0 (0.0%) | 0 (0.0%) |
| 75 Years and over | 0 (0.0%) | 0 (0.0%) |
Technology Access in Presquille
Computing Device Access in Presquille
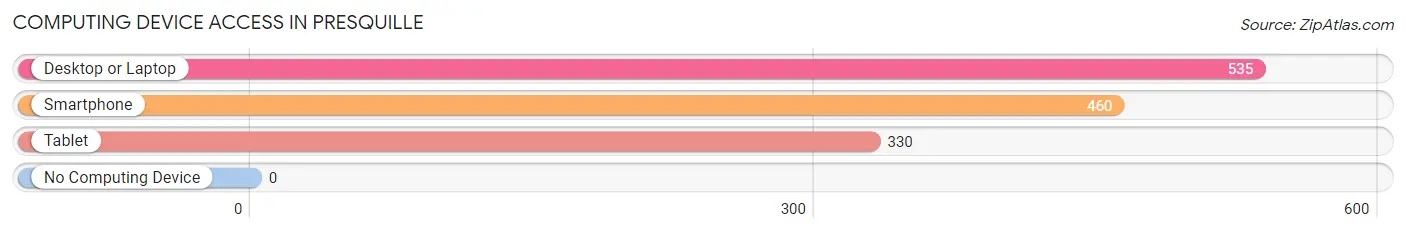
| Device Type | # Households | % Households |
| Desktop or Laptop | 535 | 92.6% |
| Smartphone | 460 | 79.6% |
| Tablet | 330 | 57.1% |
| No Computing Device | 0 | 0.0% |
| Total | 578 | 100.0% |
Internet Access in Presquille
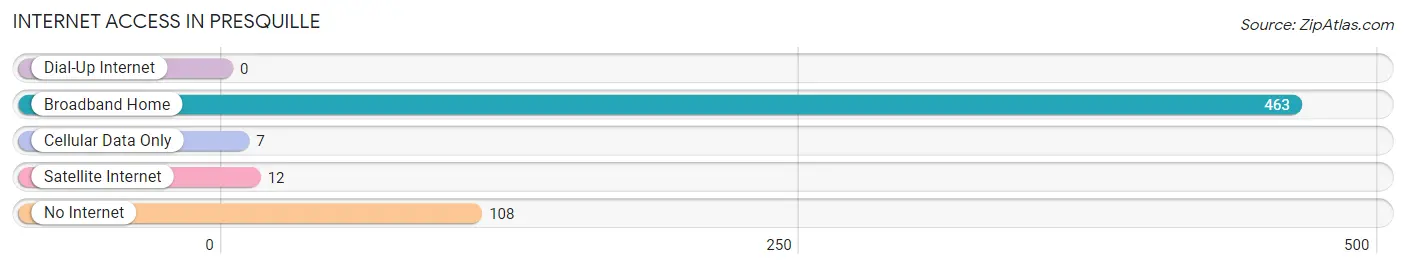
| Internet Type | # Households | % Households |
| Dial-Up Internet | 0 | 0.0% |
| Broadband Home | 463 | 80.1% |
| Cellular Data Only | 7 | 1.2% |
| Satellite Internet | 12 | 2.1% |
| No Internet | 108 | 18.7% |
| Total | 578 | 100.0% |
Presquille Summary
Presquille is a small unincorporated community located in St. Landry Parish, Louisiana. It is situated on the banks of the Bayou Teche, approximately 10 miles south of Opelousas. The population of Presquille is estimated to be around 500 people.
History
Presquille was founded in the early 1800s by French settlers who were attracted to the area by its fertile soil and abundant wildlife. The name “Presquille” is derived from the French word for “peninsula”, as the community is located on a peninsula formed by the Bayou Teche.
In the early 1900s, Presquille was a thriving agricultural community, with cotton, sugar cane, and rice being the main crops. The town also had a sawmill, a grist mill, and a general store.
In the 1950s, the town began to decline as many of its residents moved away in search of better economic opportunities. By the 1970s, the population had dwindled to just a few hundred people.
Geography
Presquille is located in the southwestern corner of St. Landry Parish, approximately 10 miles south of Opelousas. The town is situated on a peninsula formed by the Bayou Teche, which is a tributary of the Atchafalaya River.
The terrain of Presquille is mostly flat, with some rolling hills. The soil is mostly sandy loam, which is ideal for growing crops such as cotton, sugar cane, and rice.
Economy
The economy of Presquille is largely based on agriculture. Cotton, sugar cane, and rice are the main crops grown in the area. In addition, there are several small businesses in the town, including a general store, a sawmill, and a grist mill.
The town also has a few restaurants and bars as well as a few small shops
Demographics
As of the 2010 census, the population of Presquille was estimated to be around 500 people. The racial makeup of the town was 94.2% White, 3.2% African American, 0.8% Native American, and 1.8% from other races.
The median household income in Presquille was $30,000, and the median family income was $35,000. The per capita income was $14,000.
Conclusion
Presquille is a small unincorporated community located in St. Landry Parish, Louisiana. It was founded in the early 1800s by French settlers and has a population of around 500 people. The economy of Presquille is largely based on agriculture, with cotton, sugar cane, and rice being the main crops. The racial makeup of the town is 94.2% White, 3.2% African American, 0.8% Native American, and 1.8% from other races. The median household income in Presquille is $30,000, and the median family income is $35,000.
Common Questions
What is Per Capita Income in Presquille?
Per Capita income in Presquille is $29,809.
What is the Median Family Income in Presquille?
Median Family Income in Presquille is $118,173.
What is the Median Household income in Presquille?
Median Household Income in Presquille is $102,731.
What is Income or Wage Gap in Presquille?
Income or Wage Gap in Presquille is 42.0%.
Women in Presquille earn 58.0 cents for every dollar earned by a man.
What is Inequality or Gini Index in Presquille?
Inequality or Gini Index in Presquille is 0.38.
What is the Total Population of Presquille?
Total Population of Presquille is 2,136.
What is the Total Male Population of Presquille?
Total Male Population of Presquille is 1,001.
What is the Total Female Population of Presquille?
Total Female Population of Presquille is 1,135.
What is the Ratio of Males per 100 Females in Presquille?
There are 88.19 Males per 100 Females in Presquille.
What is the Ratio of Females per 100 Males in Presquille?
There are 113.39 Females per 100 Males in Presquille.
What is the Median Population Age in Presquille?
Median Population Age in Presquille is 29.5 Years.
What is the Average Family Size in Presquille
Average Family Size in Presquille is 3.7 People.
What is the Average Household Size in Presquille
Average Household Size in Presquille is 3.7 People.
How Large is the Labor Force in Presquille?
There are 892 People in the Labor Forcein in Presquille.
What is the Percentage of People in the Labor Force in Presquille?
66.2% of People are in the Labor Force in Presquille.
What is the Unemployment Rate in Presquille?
Unemployment Rate in Presquille is 19.8%.