South Mansfield, LA Map & Demographics
South Mansfield Map
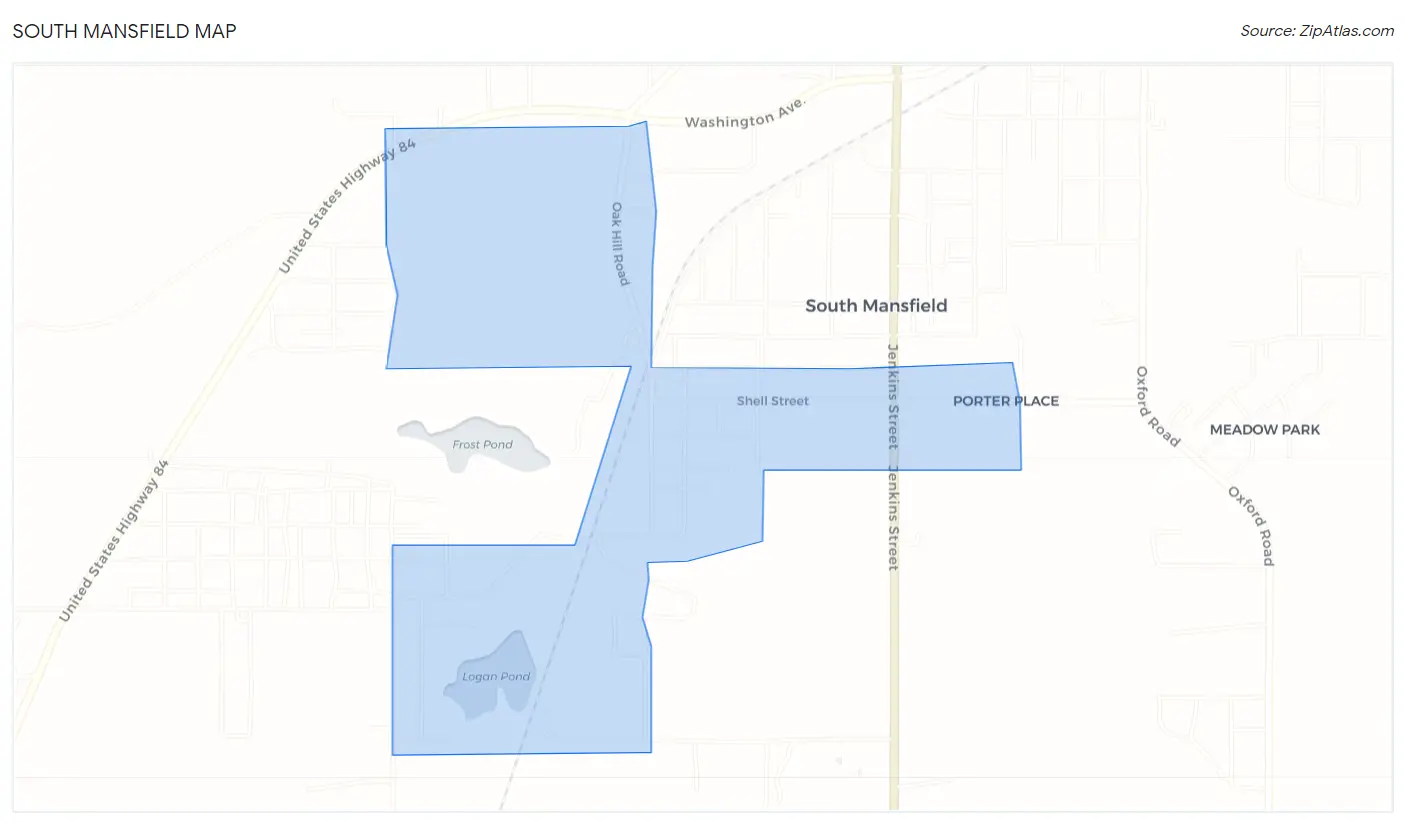
South Mansfield Overview
$15,756
PER CAPITA INCOME
$15,764
AVG HOUSEHOLD INCOME
0.54
INEQUALITY / GINI INDEX
584
TOTAL POPULATION
267
MALE POPULATION
317
FEMALE POPULATION
84.23
MALES / 100 FEMALES
118.73
FEMALES / 100 MALES
35.8
MEDIAN AGE
4.3
AVG FAMILY SIZE
2.2
AVG HOUSEHOLD SIZE
285
LABOR FORCE [ PEOPLE ]
54.7%
PERCENT IN LABOR FORCE
32.6%
UNEMPLOYMENT RATE
South Mansfield Area Codes
Income in South Mansfield
Income Overview in South Mansfield
| Characteristic | Number | Measure |
| Per Capita Income | 584 | $15,756 |
| Median Family Income | 96 | $0 |
| Mean Family Income | 96 | $63,921 |
| Median Household Income | 259 | $15,764 |
| Mean Household Income | 259 | $35,742 |
| Income Deficit | 96 | $0 |
| Wage / Income Gap (%) | 584 | 0.00% |
| Wage / Income Gap ($) | 584 | 100.00¢ per $1 |
| Gini / Inequality Index | 584 | 0.54 |
Earnings by Sex in South Mansfield
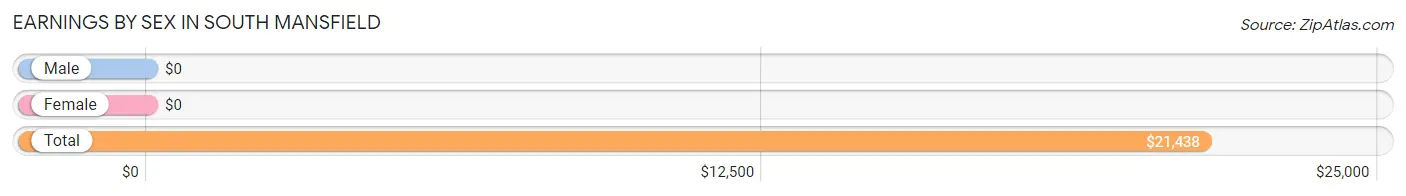
| Sex | Number | Average Earnings |
| Male | 68 (34.9%) | $0 |
| Female | 127 (65.1%) | $0 |
| Total | 195 (100.0%) | $21,438 |
Earnings by Sex by Income Bracket in South Mansfield
The most common earnings brackets in South Mansfield are $65,000 to $74,999 for men (23 | 33.8%) and $12,500 to $14,999 for women (63 | 49.6%).
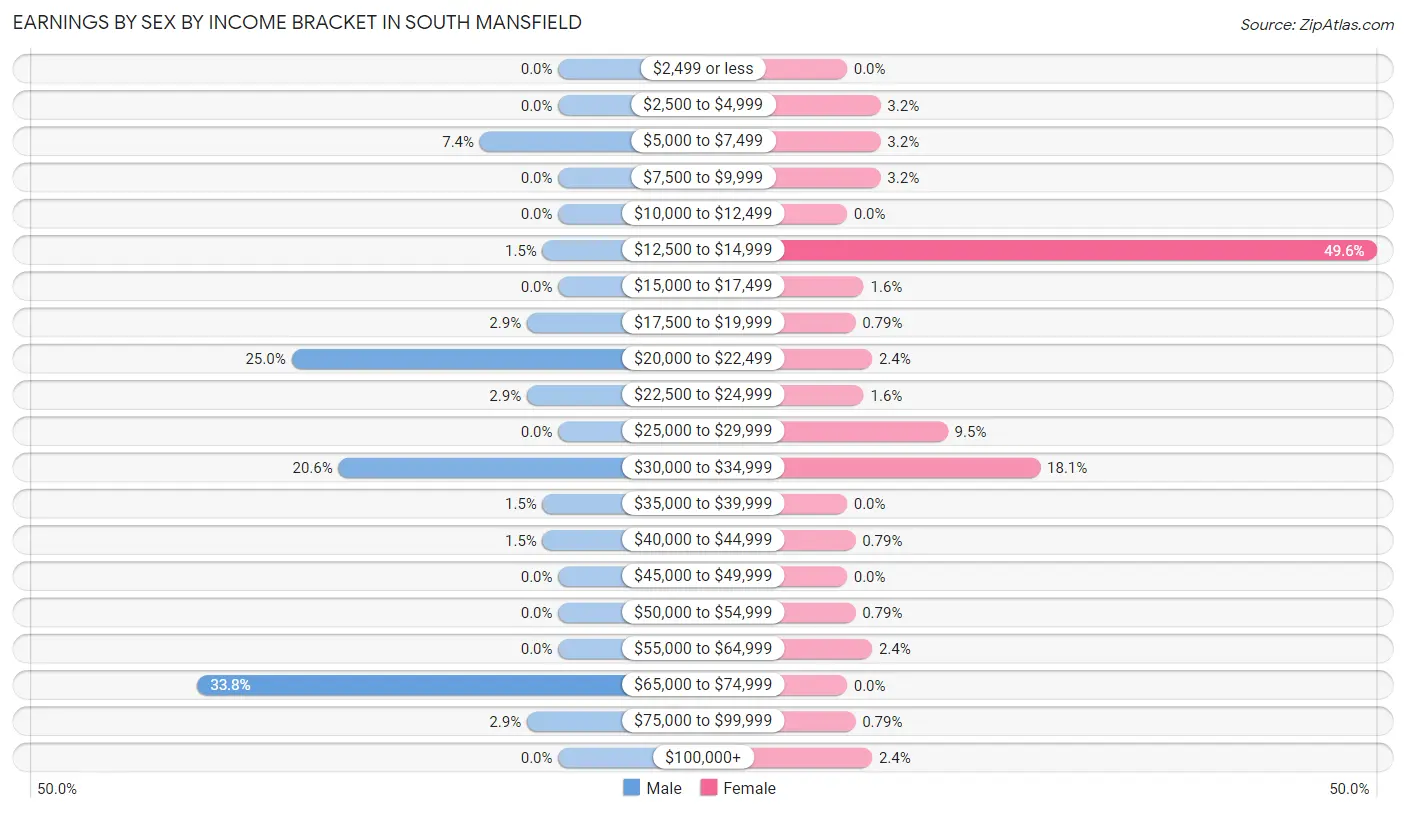
| Income | Male | Female |
| $2,499 or less | 0 (0.0%) | 0 (0.0%) |
| $2,500 to $4,999 | 0 (0.0%) | 4 (3.2%) |
| $5,000 to $7,499 | 5 (7.3%) | 4 (3.2%) |
| $7,500 to $9,999 | 0 (0.0%) | 4 (3.2%) |
| $10,000 to $12,499 | 0 (0.0%) | 0 (0.0%) |
| $12,500 to $14,999 | 1 (1.5%) | 63 (49.6%) |
| $15,000 to $17,499 | 0 (0.0%) | 2 (1.6%) |
| $17,500 to $19,999 | 2 (2.9%) | 1 (0.8%) |
| $20,000 to $22,499 | 17 (25.0%) | 3 (2.4%) |
| $22,500 to $24,999 | 2 (2.9%) | 2 (1.6%) |
| $25,000 to $29,999 | 0 (0.0%) | 12 (9.5%) |
| $30,000 to $34,999 | 14 (20.6%) | 23 (18.1%) |
| $35,000 to $39,999 | 1 (1.5%) | 0 (0.0%) |
| $40,000 to $44,999 | 1 (1.5%) | 1 (0.8%) |
| $45,000 to $49,999 | 0 (0.0%) | 0 (0.0%) |
| $50,000 to $54,999 | 0 (0.0%) | 1 (0.8%) |
| $55,000 to $64,999 | 0 (0.0%) | 3 (2.4%) |
| $65,000 to $74,999 | 23 (33.8%) | 0 (0.0%) |
| $75,000 to $99,999 | 2 (2.9%) | 1 (0.8%) |
| $100,000+ | 0 (0.0%) | 3 (2.4%) |
| Total | 68 (100.0%) | 127 (100.0%) |
Earnings by Sex by Educational Attainment in South Mansfield
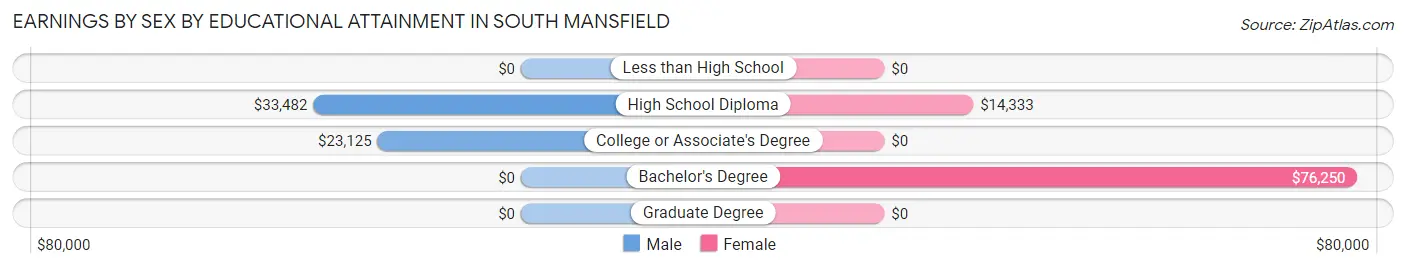
| Educational Attainment | Male Income | Female Income |
| Less than High School | - | - |
| High School Diploma | $33,482 | $14,333 |
| College or Associate's Degree | $23,125 | $0 |
| Bachelor's Degree | - | - |
| Graduate Degree | - | - |
| Total | - | - |
Family Income in South Mansfield
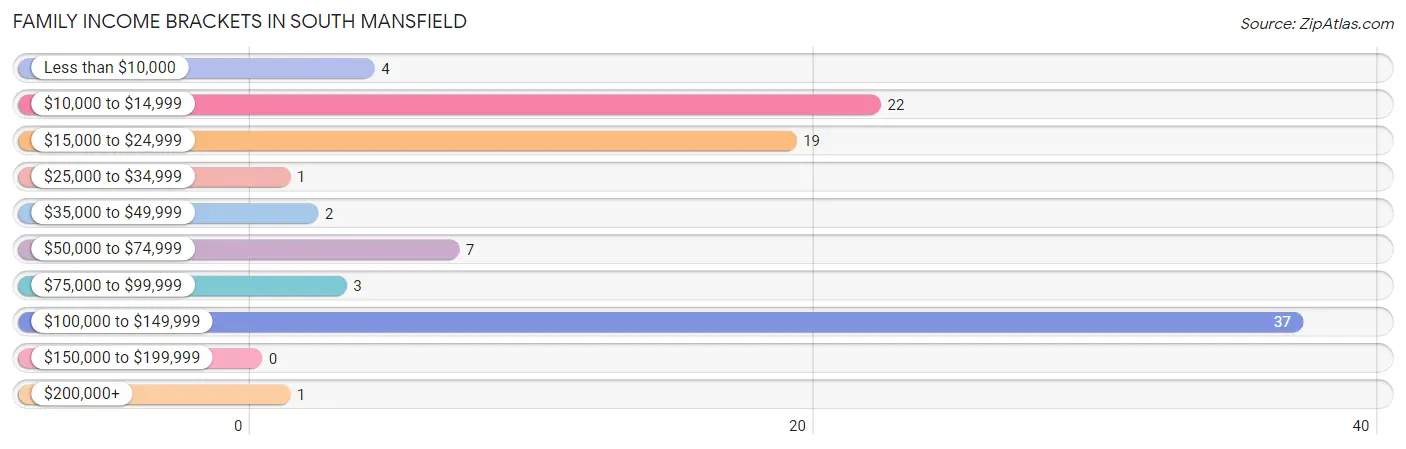
Family Income Brackets in South Mansfield
According to the South Mansfield family income data, there are 37 families falling into the $100,000 to $149,999 income range, which is the most common income bracket and makes up 38.5% of all families.
| Income Bracket | # Families | % Families |
| Less than $10,000 | 4 | 4.2% |
| $10,000 to $14,999 | 22 | 22.9% |
| $15,000 to $24,999 | 19 | 19.8% |
| $25,000 to $34,999 | 1 | 1.0% |
| $35,000 to $49,999 | 2 | 2.1% |
| $50,000 to $74,999 | 7 | 7.3% |
| $75,000 to $99,999 | 3 | 3.1% |
| $100,000 to $149,999 | 37 | 38.5% |
| $150,000 to $199,999 | 0 | 0.0% |
| $200,000+ | 1 | 1.0% |
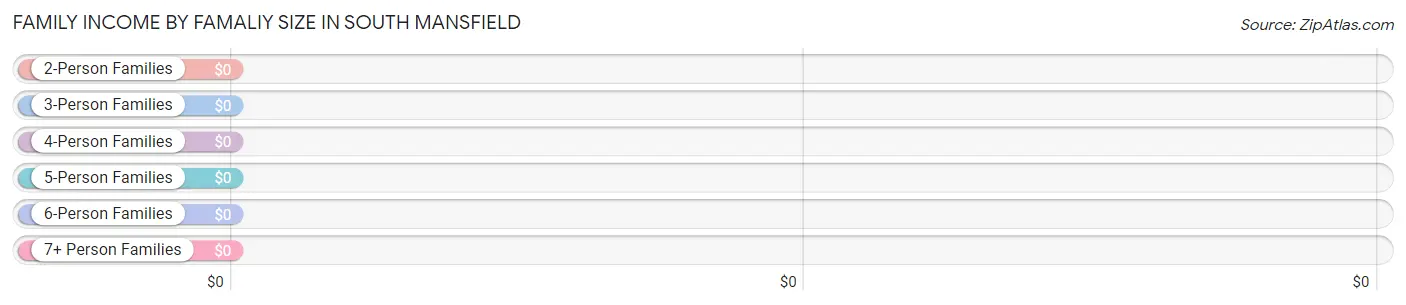
Family Income by Famaliy Size in South Mansfield
| Income Bracket | # Families | Median Income |
| 2-Person Families | 47 (49.0%) | $0 |
| 3-Person Families | 5 (5.2%) | $0 |
| 4-Person Families | 44 (45.8%) | $0 |
| 5-Person Families | 0 (0.0%) | $0 |
| 6-Person Families | 0 (0.0%) | $0 |
| 7+ Person Families | 0 (0.0%) | $0 |
| Total | 96 (100.0%) | $0 |
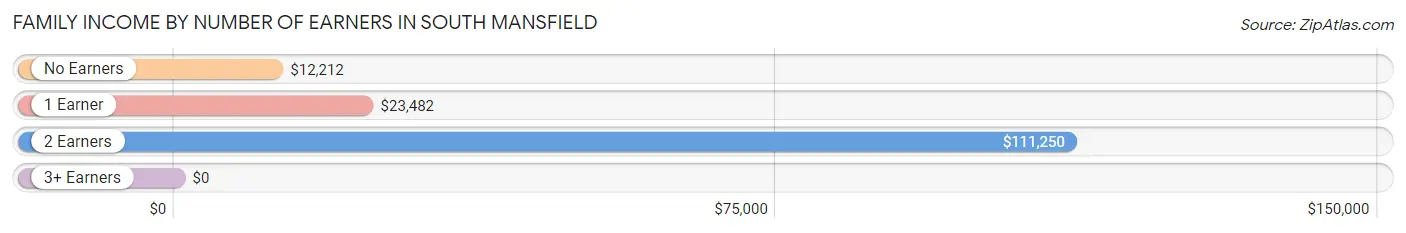
Family Income by Number of Earners in South Mansfield
| Number of Earners | # Families | Median Income |
| No Earners | 23 (24.0%) | $12,212 |
| 1 Earner | 29 (30.2%) | $23,482 |
| 2 Earners | 44 (45.8%) | $111,250 |
| 3+ Earners | 0 (0.0%) | $0 |
| Total | 96 (100.0%) | $0 |
Household Income in South Mansfield
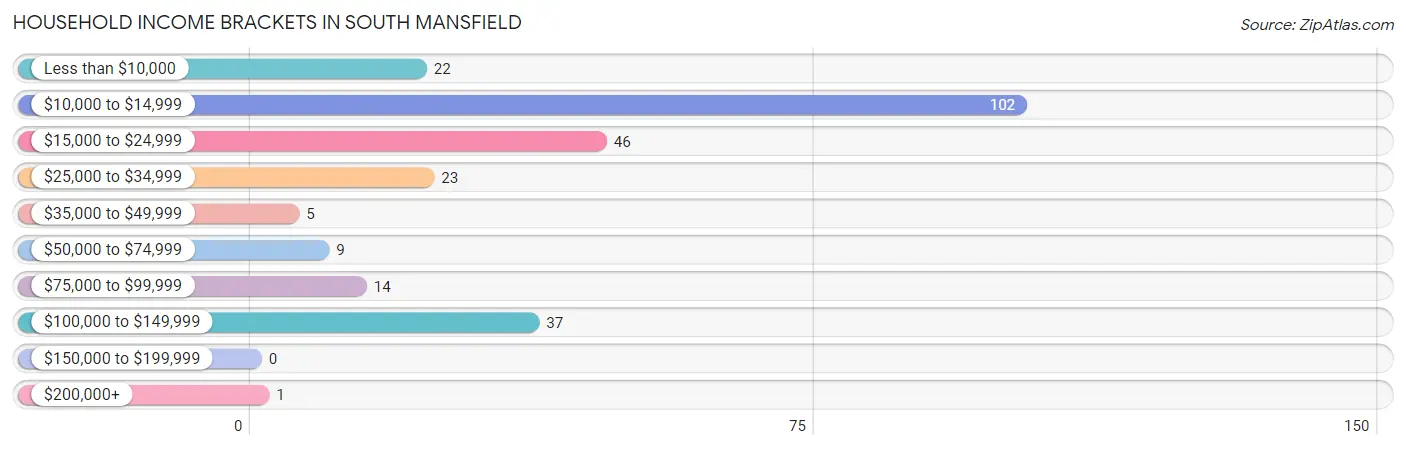
Household Income Brackets in South Mansfield
With 102 households falling in the category, the $10,000 to $14,999 income range is the most frequent in South Mansfield, accounting for 39.4% of all households.
| Income Bracket | # Households | % Households |
| Less than $10,000 | 22 | 8.5% |
| $10,000 to $14,999 | 102 | 39.4% |
| $15,000 to $24,999 | 46 | 17.8% |
| $25,000 to $34,999 | 23 | 8.9% |
| $35,000 to $49,999 | 5 | 1.9% |
| $50,000 to $74,999 | 9 | 3.5% |
| $75,000 to $99,999 | 14 | 5.4% |
| $100,000 to $149,999 | 37 | 14.3% |
| $150,000 to $199,999 | 0 | 0.0% |
| $200,000+ | 1 | 0.4% |
Household Income by Householder Age in South Mansfield
| Income Bracket | # Households | Median Income |
| 15 to 24 Years | 0 (0.0%) | $0 |
| 25 to 44 Years | 47 (18.1%) | $0 |
| 45 to 64 Years | 62 (23.9%) | $0 |
| 65+ Years | 150 (57.9%) | $0 |
| Total | 259 (100.0%) | $15,764 |
Poverty in South Mansfield
Income Below Poverty by Sex and Age in South Mansfield
With 47.6% poverty level for males and 72.2% for females among the residents of South Mansfield, under 5 year old males and under 5 year old females are the most vulnerable to poverty, with 3 males (100.0%) and 3 females (100.0%) in their respective age groups living below the poverty level.
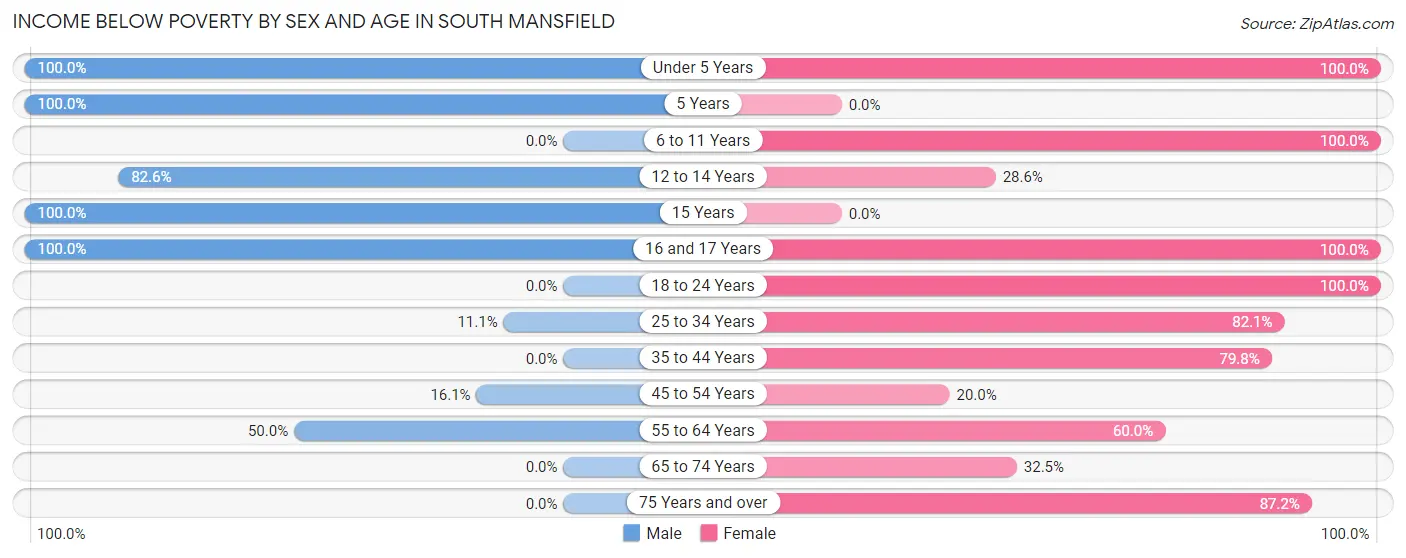
| Age Bracket | Male | Female |
| Under 5 Years | 3 (100.0%) | 3 (100.0%) |
| 5 Years | 12 (100.0%) | 0 (0.0%) |
| 6 to 11 Years | 0 (0.0%) | 3 (100.0%) |
| 12 to 14 Years | 19 (82.6%) | 2 (28.6%) |
| 15 Years | 6 (100.0%) | 0 (0.0%) |
| 16 and 17 Years | 71 (100.0%) | 3 (100.0%) |
| 18 to 24 Years | 0 (0.0%) | 25 (100.0%) |
| 25 to 34 Years | 4 (11.1%) | 23 (82.1%) |
| 35 to 44 Years | 0 (0.0%) | 67 (79.8%) |
| 45 to 54 Years | 5 (16.1%) | 3 (20.0%) |
| 55 to 64 Years | 7 (50.0%) | 12 (60.0%) |
| 65 to 74 Years | 0 (0.0%) | 13 (32.5%) |
| 75 Years and over | 0 (0.0%) | 75 (87.2%) |
| Total | 127 (47.6%) | 229 (72.2%) |
Income Above Poverty by Sex and Age in South Mansfield
According to the poverty statistics in South Mansfield, males aged 6 to 11 years and females aged 15 years are the age groups that are most secure financially, with 100.0% of males and 100.0% of females in these age groups living above the poverty line.
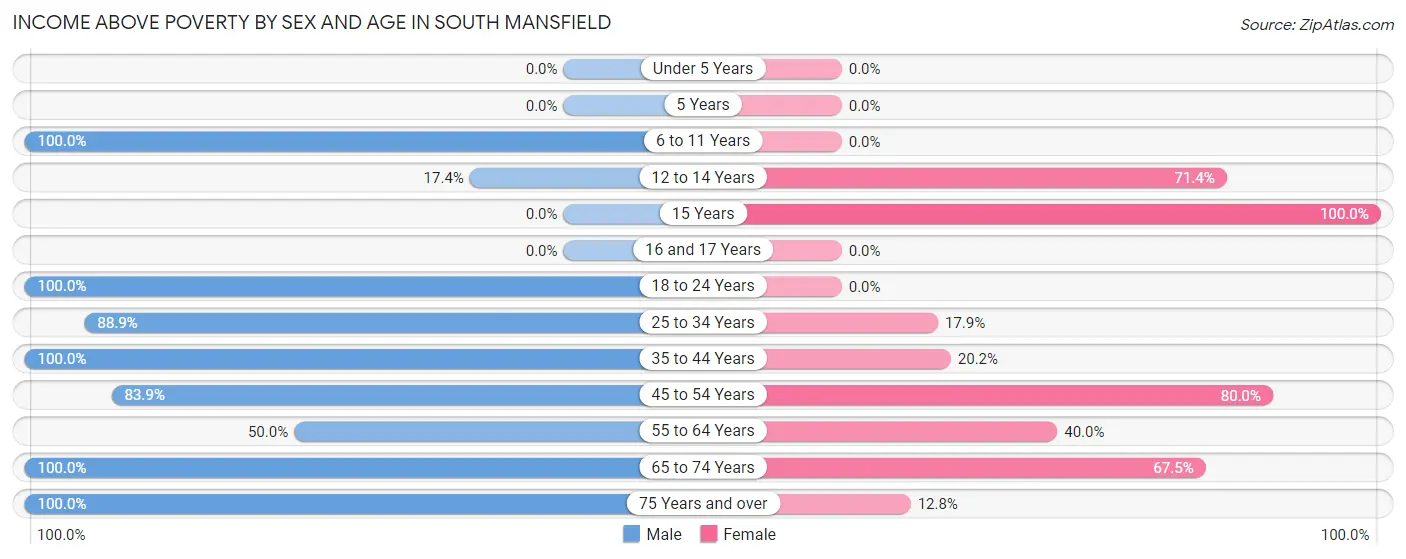
| Age Bracket | Male | Female |
| Under 5 Years | 0 (0.0%) | 0 (0.0%) |
| 5 Years | 0 (0.0%) | 0 (0.0%) |
| 6 to 11 Years | 3 (100.0%) | 0 (0.0%) |
| 12 to 14 Years | 4 (17.4%) | 5 (71.4%) |
| 15 Years | 0 (0.0%) | 3 (100.0%) |
| 16 and 17 Years | 0 (0.0%) | 0 (0.0%) |
| 18 to 24 Years | 18 (100.0%) | 0 (0.0%) |
| 25 to 34 Years | 32 (88.9%) | 5 (17.9%) |
| 35 to 44 Years | 8 (100.0%) | 17 (20.2%) |
| 45 to 54 Years | 26 (83.9%) | 12 (80.0%) |
| 55 to 64 Years | 7 (50.0%) | 8 (40.0%) |
| 65 to 74 Years | 40 (100.0%) | 27 (67.5%) |
| 75 Years and over | 2 (100.0%) | 11 (12.8%) |
| Total | 140 (52.4%) | 88 (27.8%) |
Income Below Poverty Among Married-Couple Families in South Mansfield
The poverty statistics for married-couple families in South Mansfield show that 2.2% or 1 of the total 45 families live below the poverty line. Families with no children have the highest poverty rate of 2.3%, comprising of 1 families. On the other hand, families with 1 or 2 children have the lowest poverty rate of 0.0%, which includes 0 families.
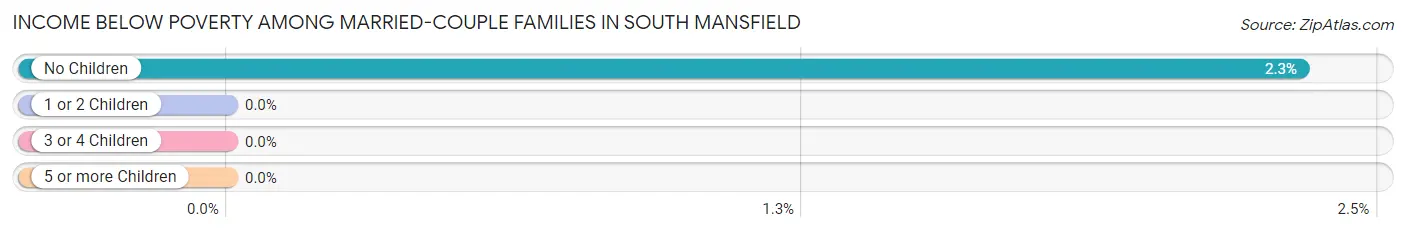
| Children | Above Poverty | Below Poverty |
| No Children | 42 (97.7%) | 1 (2.3%) |
| 1 or 2 Children | 2 (100.0%) | 0 (0.0%) |
| 3 or 4 Children | 0 (0.0%) | 0 (0.0%) |
| 5 or more Children | 0 (0.0%) | 0 (0.0%) |
| Total | 44 (97.8%) | 1 (2.2%) |
Income Below Poverty Among Single-Parent Households in South Mansfield
According to the poverty data in South Mansfield, 69.2% or 9 single-father households and 84.2% or 32 single-mother households are living below the poverty line. Among single-father households, those with 1 or 2 children have the highest poverty rate, with 9 households (81.8%) experiencing poverty. Likewise, among single-mother households, those with 1 or 2 children have the highest poverty rate, with 30 households (96.8%) falling below the poverty line.
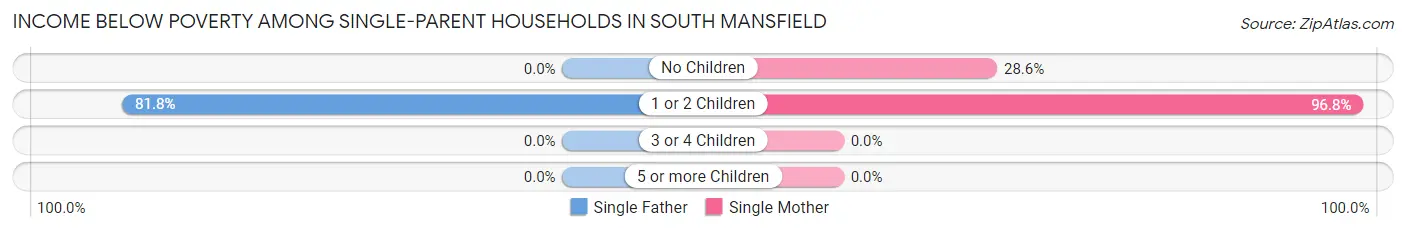
| Children | Single Father | Single Mother |
| No Children | 0 (0.0%) | 2 (28.6%) |
| 1 or 2 Children | 9 (81.8%) | 30 (96.8%) |
| 3 or 4 Children | 0 (0.0%) | 0 (0.0%) |
| 5 or more Children | 0 (0.0%) | 0 (0.0%) |
| Total | 9 (69.2%) | 32 (84.2%) |
Income Below Poverty Among Married-Couple vs Single-Parent Households in South Mansfield
The poverty data for South Mansfield shows that 1 of the married-couple family households (2.2%) and 41 of the single-parent households (80.4%) are living below the poverty level. Within the married-couple family households, those with no children have the highest poverty rate, with 1 households (2.3%) falling below the poverty line. Among the single-parent households, those with 1 or 2 children have the highest poverty rate, with 39 household (92.9%) living below poverty.
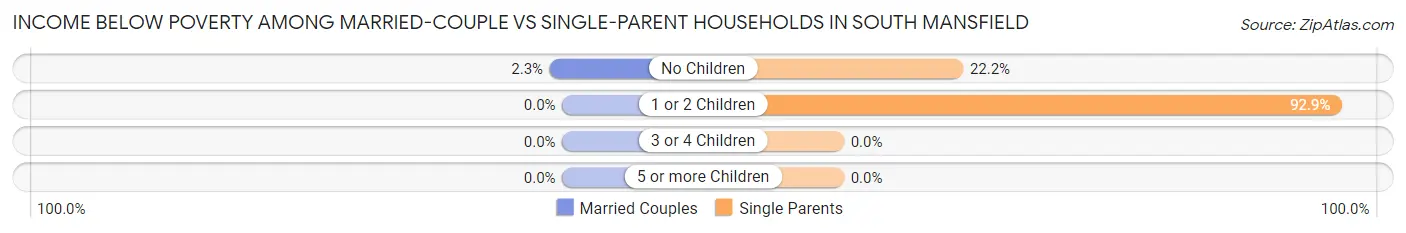
| Children | Married-Couple Families | Single-Parent Households |
| No Children | 1 (2.3%) | 2 (22.2%) |
| 1 or 2 Children | 0 (0.0%) | 39 (92.9%) |
| 3 or 4 Children | 0 (0.0%) | 0 (0.0%) |
| 5 or more Children | 0 (0.0%) | 0 (0.0%) |
| Total | 1 (2.2%) | 41 (80.4%) |
Race in South Mansfield
The most populous races in South Mansfield are Black / African American (482 | 82.5%), White / Caucasian (85 | 14.5%), and Two or more Races (17 | 2.9%).
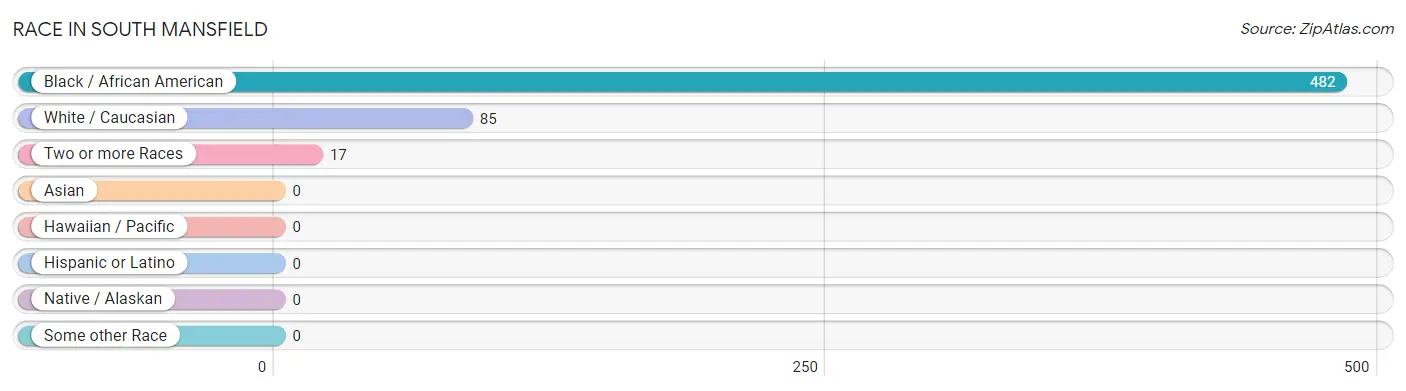
| Race | # Population | % Population |
| Asian | 0 | 0.0% |
| Black / African American | 482 | 82.5% |
| Hawaiian / Pacific | 0 | 0.0% |
| Hispanic or Latino | 0 | 0.0% |
| Native / Alaskan | 0 | 0.0% |
| White / Caucasian | 85 | 14.5% |
| Two or more Races | 17 | 2.9% |
| Some other Race | 0 | 0.0% |
| Total | 584 | 100.0% |
Ancestry in South Mansfield
The most populous ancestries reported in South Mansfield are English (67 | 11.5%), American (17 | 2.9%), Cherokee (6 | 1.0%), Irish (5 | 0.9%), and French (4 | 0.7%), together accounting for 16.9% of all South Mansfield residents.
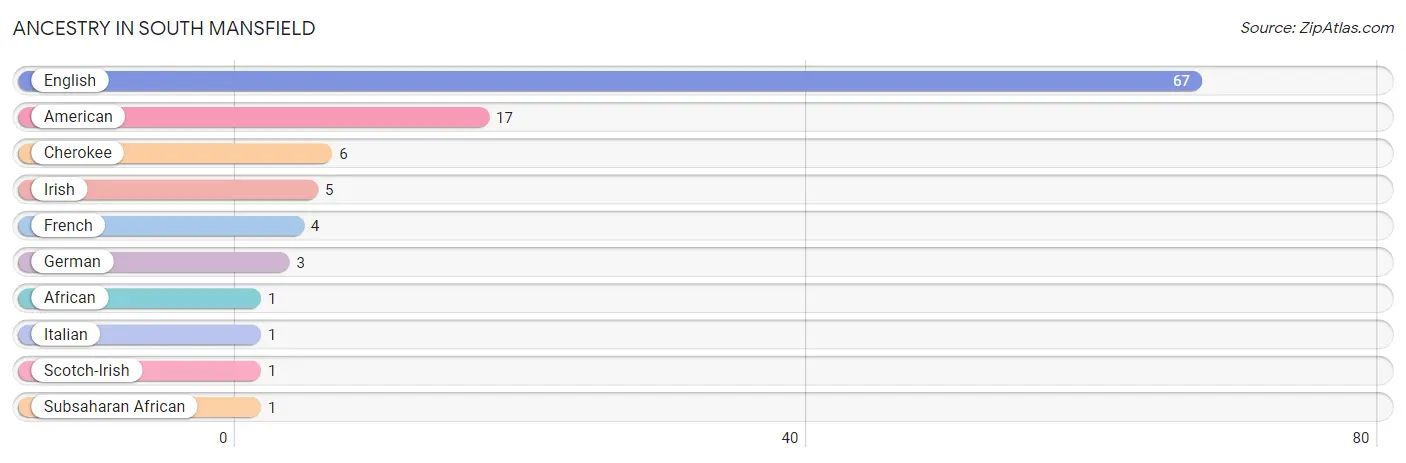
| Ancestry | # Population | % Population |
| African | 1 | 0.2% |
| American | 17 | 2.9% |
| Cherokee | 6 | 1.0% |
| English | 67 | 11.5% |
| French | 4 | 0.7% |
| German | 3 | 0.5% |
| Irish | 5 | 0.9% |
| Italian | 1 | 0.2% |
| Scotch-Irish | 1 | 0.2% |
| Subsaharan African | 1 | 0.2% | View All 10 Rows |
Immigrants in South Mansfield

| Immigration Origin | # Population | % Population | View All 0 Rows |
Sex and Age in South Mansfield
Sex and Age in South Mansfield
The most populous age groups in South Mansfield are 15 to 19 Years (77 | 28.8%) for men and 35 to 39 Years (72 | 22.7%) for women.
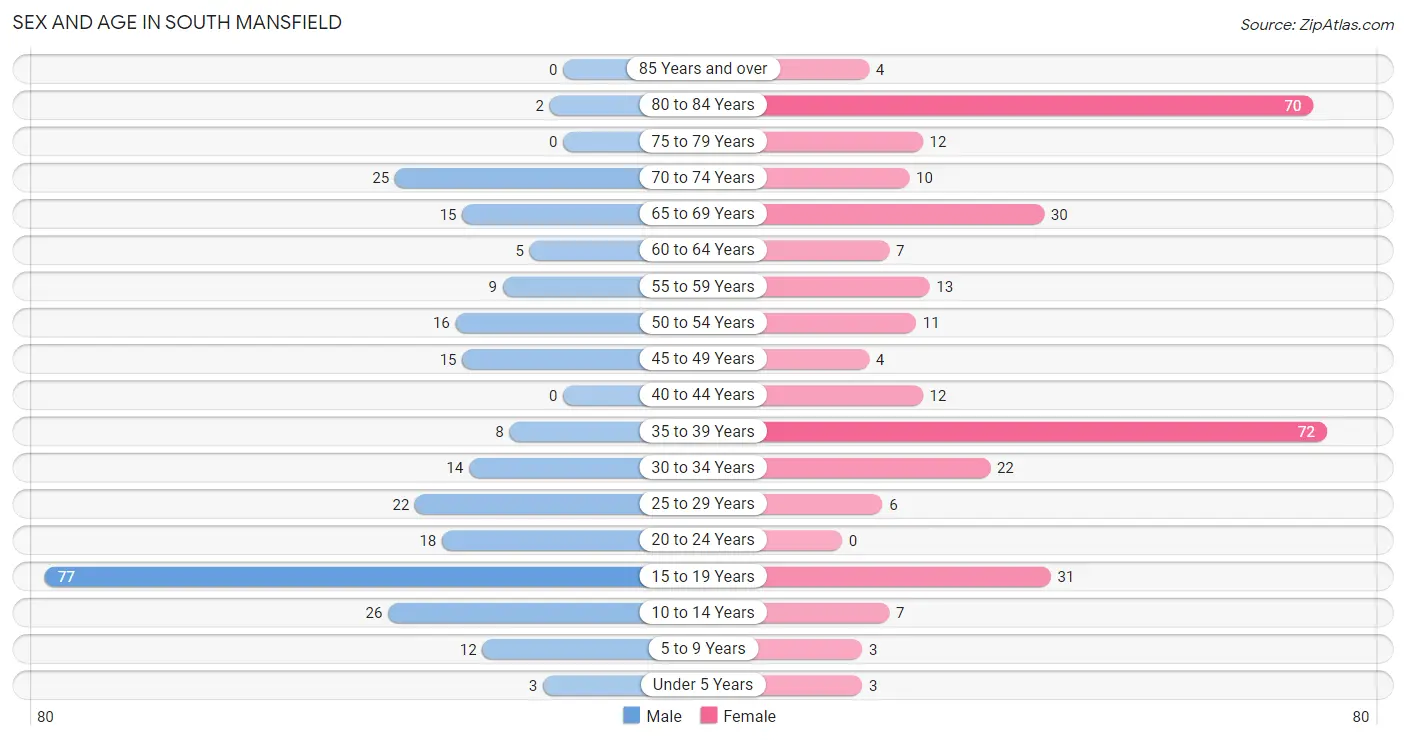
| Age Bracket | Male | Female |
| Under 5 Years | 3 (1.1%) | 3 (0.9%) |
| 5 to 9 Years | 12 (4.5%) | 3 (0.9%) |
| 10 to 14 Years | 26 (9.7%) | 7 (2.2%) |
| 15 to 19 Years | 77 (28.8%) | 31 (9.8%) |
| 20 to 24 Years | 18 (6.7%) | 0 (0.0%) |
| 25 to 29 Years | 22 (8.2%) | 6 (1.9%) |
| 30 to 34 Years | 14 (5.2%) | 22 (6.9%) |
| 35 to 39 Years | 8 (3.0%) | 72 (22.7%) |
| 40 to 44 Years | 0 (0.0%) | 12 (3.8%) |
| 45 to 49 Years | 15 (5.6%) | 4 (1.3%) |
| 50 to 54 Years | 16 (6.0%) | 11 (3.5%) |
| 55 to 59 Years | 9 (3.4%) | 13 (4.1%) |
| 60 to 64 Years | 5 (1.9%) | 7 (2.2%) |
| 65 to 69 Years | 15 (5.6%) | 30 (9.5%) |
| 70 to 74 Years | 25 (9.4%) | 10 (3.2%) |
| 75 to 79 Years | 0 (0.0%) | 12 (3.8%) |
| 80 to 84 Years | 2 (0.7%) | 70 (22.1%) |
| 85 Years and over | 0 (0.0%) | 4 (1.3%) |
| Total | 267 (100.0%) | 317 (100.0%) |
Families and Households in South Mansfield
Median Family Size in South Mansfield
The median family size in South Mansfield is 4.26 persons per family, with single female/mother families (38 | 39.6%) accounting for the largest median family size of 6.66 persons per family. On the other hand, married-couple families (45 | 46.9%) represent the smallest median family size with 2.49 persons per family.
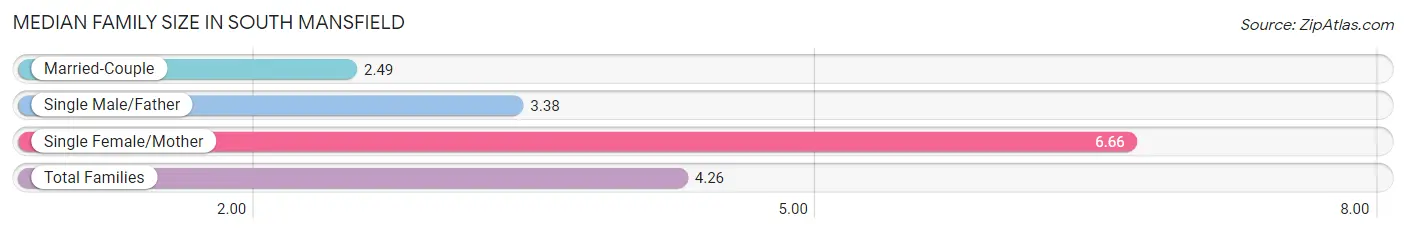
| Family Type | # Families | Family Size |
| Married-Couple | 45 (46.9%) | 2.49 |
| Single Male/Father | 13 (13.5%) | 3.38 |
| Single Female/Mother | 38 (39.6%) | 6.66 |
| Total Families | 96 (100.0%) | 4.26 |
Median Household Size in South Mansfield
The median household size in South Mansfield is 2.25 persons per household, with single female/mother households (38 | 14.7%) accounting for the largest median household size of 6.66 persons per household. non-family households (163 | 62.9%) represent the smallest median household size with 1.04 persons per household.
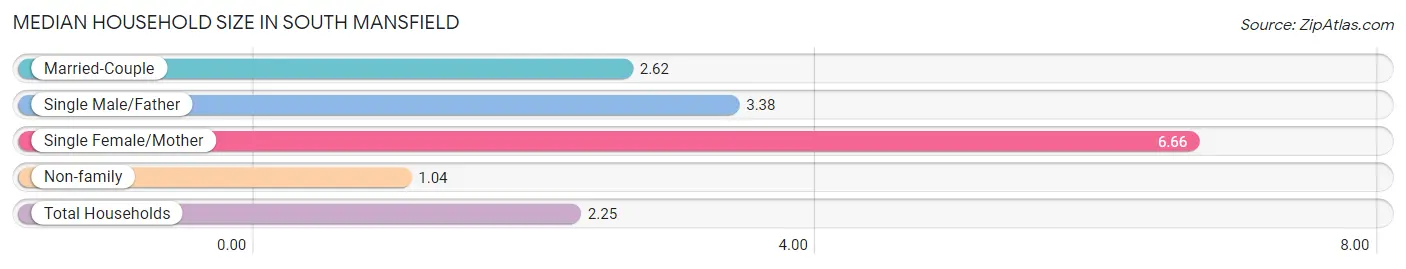
| Household Type | # Households | Household Size |
| Married-Couple | 45 (17.4%) | 2.62 |
| Single Male/Father | 13 (5.0%) | 3.38 |
| Single Female/Mother | 38 (14.7%) | 6.66 |
| Non-family | 163 (62.9%) | 1.04 |
| Total Households | 259 (100.0%) | 2.25 |
Household Size by Marriage Status in South Mansfield
Out of a total of 259 households in South Mansfield, 96 (37.1%) are family households, while 163 (62.9%) are nonfamily households. The most numerous type of family households are 4-person households, comprising 44, and the most common type of nonfamily households are 1-person households, comprising 152.
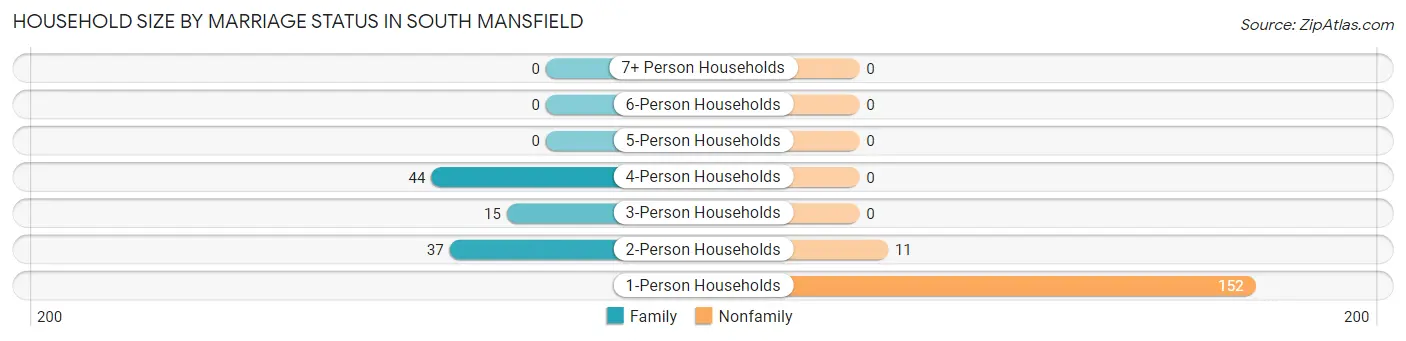
| Household Size | Family Households | Nonfamily Households |
| 1-Person Households | - | 152 (58.7%) |
| 2-Person Households | 37 (14.3%) | 11 (4.3%) |
| 3-Person Households | 15 (5.8%) | 0 (0.0%) |
| 4-Person Households | 44 (17.0%) | 0 (0.0%) |
| 5-Person Households | 0 (0.0%) | 0 (0.0%) |
| 6-Person Households | 0 (0.0%) | 0 (0.0%) |
| 7+ Person Households | 0 (0.0%) | 0 (0.0%) |
| Total | 96 (37.1%) | 163 (62.9%) |
Female Fertility in South Mansfield
Fertility by Age in South Mansfield
| Age Bracket | Women with Births | Births / 1,000 Women |
| 15 to 19 years | 0 (0.0%) | 0.0 |
| 20 to 34 years | 0 (0.0%) | 0.0 |
| 35 to 50 years | 0 (0.0%) | 0.0 |
| Total | 0 (0.0%) | 0.0 |
Fertility by Age by Marriage Status in South Mansfield
| Age Bracket | Married | Unmarried |
| 15 to 19 years | 0 (0.0%) | 0 (0.0%) |
| 20 to 34 years | 0 (0.0%) | 0 (0.0%) |
| 35 to 50 years | 0 (0.0%) | 0 (0.0%) |
| Total | 0 (0.0%) | 0 (0.0%) |
Fertility by Education in South Mansfield
| Educational Attainment | Women with Births | Births / 1,000 Women |
| Less than High School | 0 (0.0%) | 0.0 |
| High School Diploma | 0 (0.0%) | 0.0 |
| College or Associate's Degree | 0 (0.0%) | 0.0 |
| Bachelor's Degree | 0 (0.0%) | 0.0 |
| Graduate Degree | 0 (0.0%) | 0.0 |
| Total | 0 (0.0%) | 0.0 |
Fertility by Education by Marriage Status in South Mansfield
| Educational Attainment | Married | Unmarried |
| Less than High School | 0 (0.0%) | 0 (0.0%) |
| High School Diploma | 0 (0.0%) | 0 (0.0%) |
| College or Associate's Degree | 0 (0.0%) | 0 (0.0%) |
| Bachelor's Degree | 0 (0.0%) | 0 (0.0%) |
| Graduate Degree | 0 (0.0%) | 0 (0.0%) |
| Total | 0 (0.0%) | 0 (0.0%) |
Employment Characteristics in South Mansfield
Employment by Class of Employer in South Mansfield
Among the 192 employed individuals in South Mansfield, private company employees (161 | 83.9%), state government employees (16 | 8.3%), and local government employees (9 | 4.7%) make up the most common classes of employment.
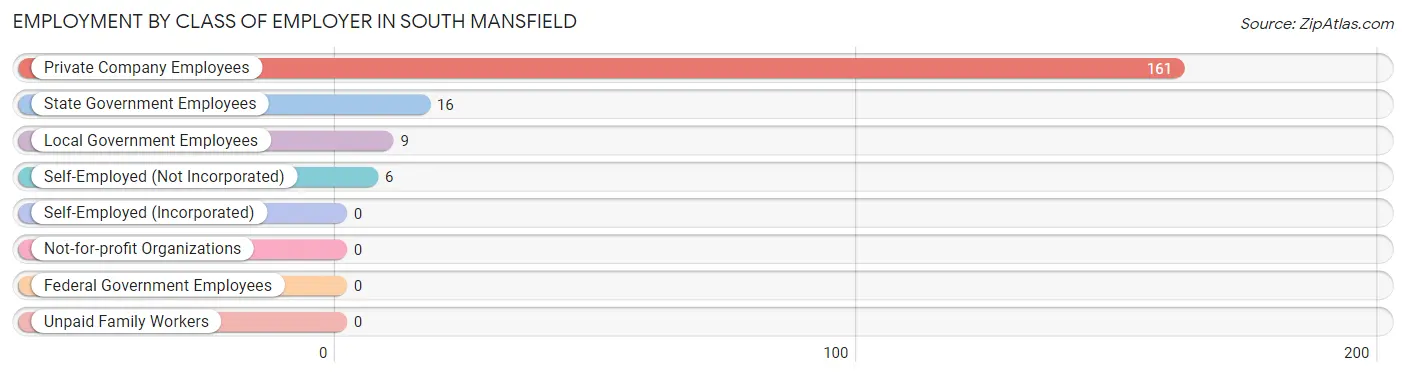
| Employer Class | # Employees | % Employees |
| Private Company Employees | 161 | 83.9% |
| Self-Employed (Incorporated) | 0 | 0.0% |
| Self-Employed (Not Incorporated) | 6 | 3.1% |
| Not-for-profit Organizations | 0 | 0.0% |
| Local Government Employees | 9 | 4.7% |
| State Government Employees | 16 | 8.3% |
| Federal Government Employees | 0 | 0.0% |
| Unpaid Family Workers | 0 | 0.0% |
| Total | 192 | 100.0% |
Employment Status by Age in South Mansfield
According to the labor force statistics for South Mansfield, out of the total population over 16 years of age (521), 54.7% or 285 individuals are in the labor force, with 32.6% or 93 of them unemployed. The age group with the highest labor force participation rate is 16 to 19 years, with 93.9% or 93 individuals in the labor force. Within the labor force, the 16 to 19 years age range has the highest percentage of unemployed individuals, with 100.0% or 93 of them being unemployed.
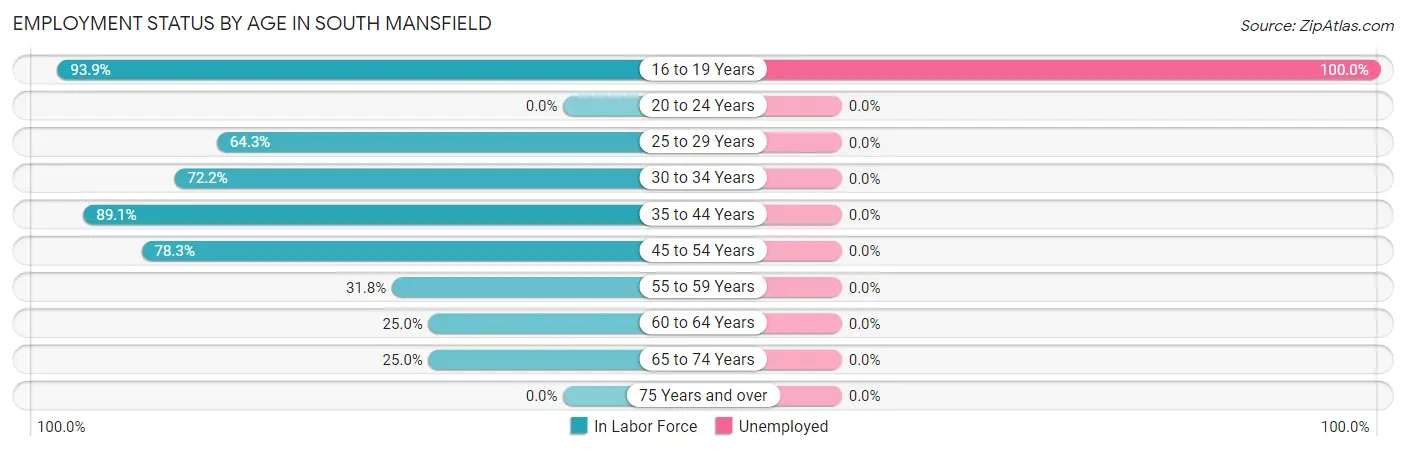
| Age Bracket | In Labor Force | Unemployed |
| 16 to 19 Years | 93 (93.9%) | 93 (100.0%) |
| 20 to 24 Years | 0 (0.0%) | 0 (0.0%) |
| 25 to 29 Years | 18 (64.3%) | 0 (0.0%) |
| 30 to 34 Years | 26 (72.2%) | 0 (0.0%) |
| 35 to 44 Years | 82 (89.1%) | 0 (0.0%) |
| 45 to 54 Years | 36 (78.3%) | 0 (0.0%) |
| 55 to 59 Years | 7 (31.8%) | 0 (0.0%) |
| 60 to 64 Years | 3 (25.0%) | 0 (0.0%) |
| 65 to 74 Years | 20 (25.0%) | 0 (0.0%) |
| 75 Years and over | 0 (0.0%) | 0 (0.0%) |
| Total | 285 (54.7%) | 93 (32.6%) |
Employment Status by Educational Attainment in South Mansfield
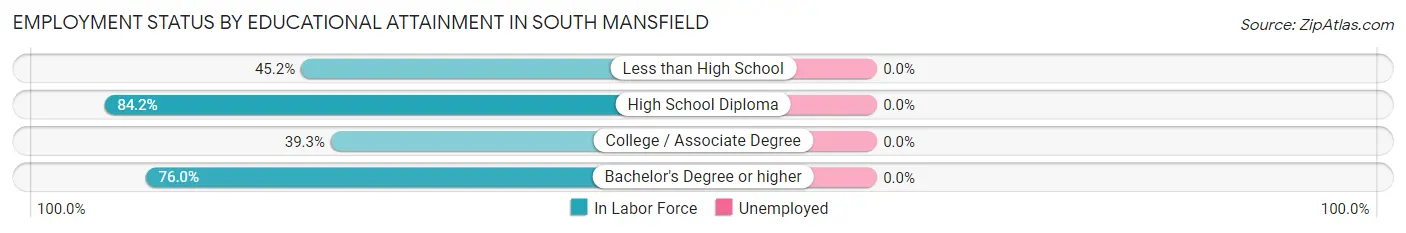
| Educational Attainment | In Labor Force | Unemployed |
| Less than High School | 14 (45.2%) | 0 (0.0%) |
| High School Diploma | 128 (84.2%) | 0 (0.0%) |
| College / Associate Degree | 11 (39.3%) | 0 (0.0%) |
| Bachelor's Degree or higher | 19 (76.0%) | 0 (0.0%) |
| Total | 172 (72.9%) | 0 (0.0%) |
Employment Occupations by Sex in South Mansfield
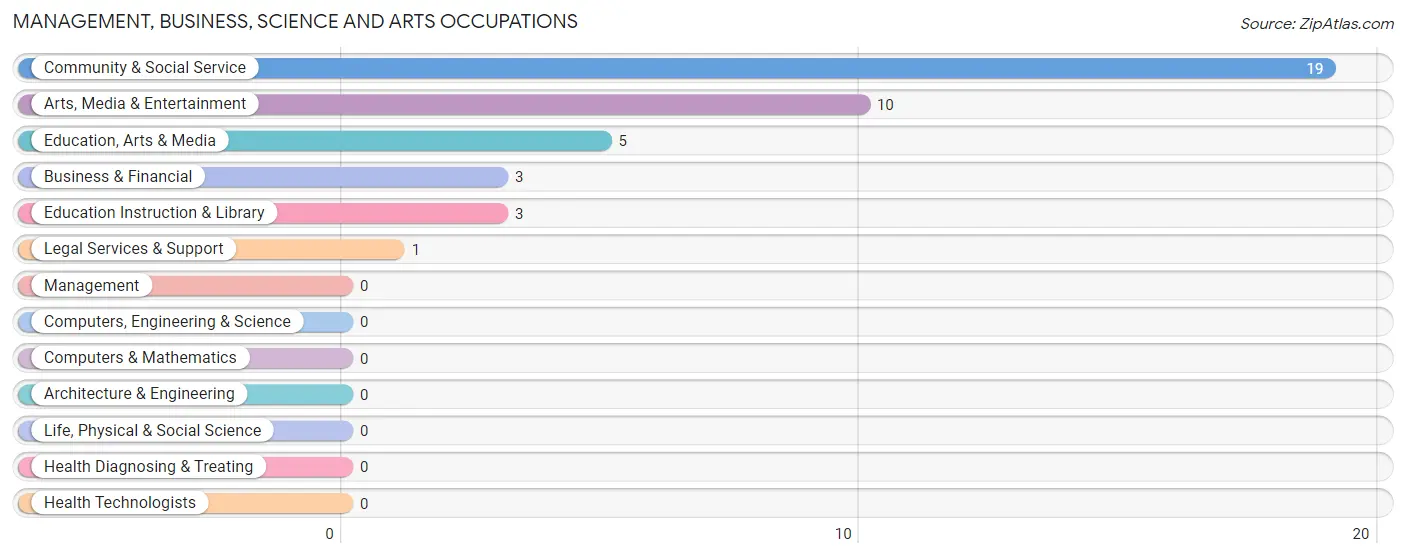
Management, Business, Science and Arts Occupations
The most common Management, Business, Science and Arts occupations in South Mansfield are Community & Social Service (19 | 9.9%), Arts, Media & Entertainment (10 | 5.2%), Education, Arts & Media (5 | 2.6%), Business & Financial (3 | 1.6%), and Education Instruction & Library (3 | 1.6%).
Management, Business, Science and Arts Occupations by Sex
Within the Management, Business, Science and Arts occupations in South Mansfield, the most male-oriented occupations are Arts, Media & Entertainment (100.0%), and Community & Social Service (52.6%), while the most female-oriented occupations are Business & Financial (100.0%), Education, Arts & Media (100.0%), and Legal Services & Support (100.0%).
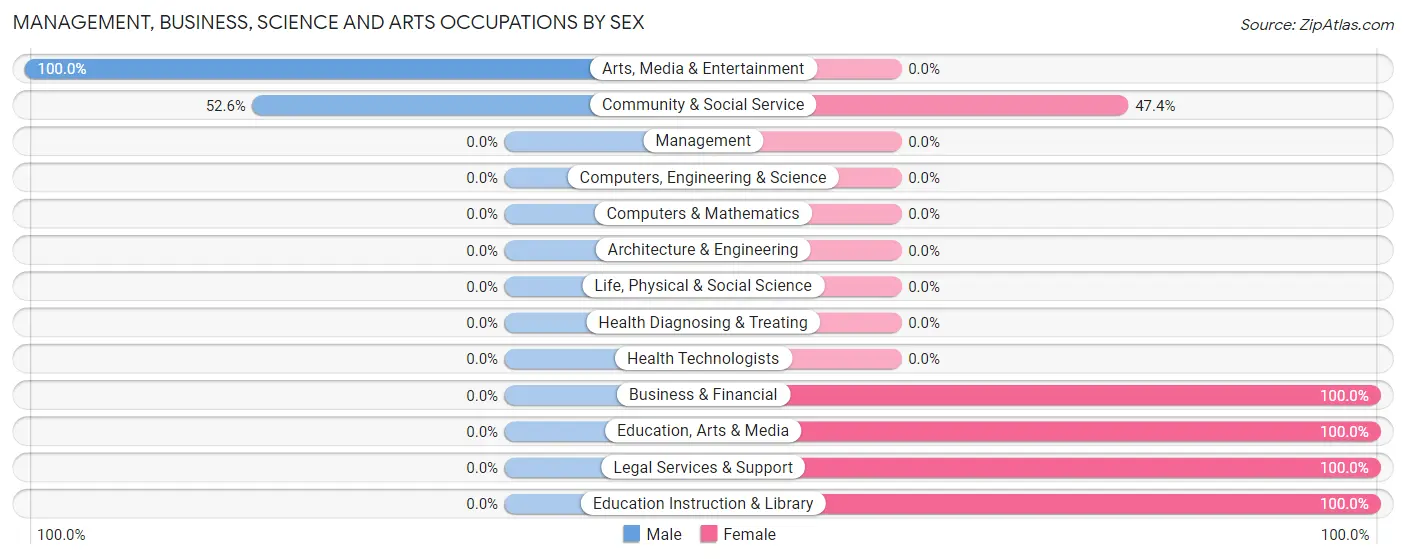
| Occupation | Male | Female |
| Management | 0 (0.0%) | 0 (0.0%) |
| Business & Financial | 0 (0.0%) | 3 (100.0%) |
| Computers, Engineering & Science | 0 (0.0%) | 0 (0.0%) |
| Computers & Mathematics | 0 (0.0%) | 0 (0.0%) |
| Architecture & Engineering | 0 (0.0%) | 0 (0.0%) |
| Life, Physical & Social Science | 0 (0.0%) | 0 (0.0%) |
| Community & Social Service | 10 (52.6%) | 9 (47.4%) |
| Education, Arts & Media | 0 (0.0%) | 5 (100.0%) |
| Legal Services & Support | 0 (0.0%) | 1 (100.0%) |
| Education Instruction & Library | 0 (0.0%) | 3 (100.0%) |
| Arts, Media & Entertainment | 10 (100.0%) | 0 (0.0%) |
| Health Diagnosing & Treating | 0 (0.0%) | 0 (0.0%) |
| Health Technologists | 0 (0.0%) | 0 (0.0%) |
| Total (Category) | 10 (45.5%) | 12 (54.5%) |
| Total (Overall) | 68 (35.4%) | 124 (64.6%) |
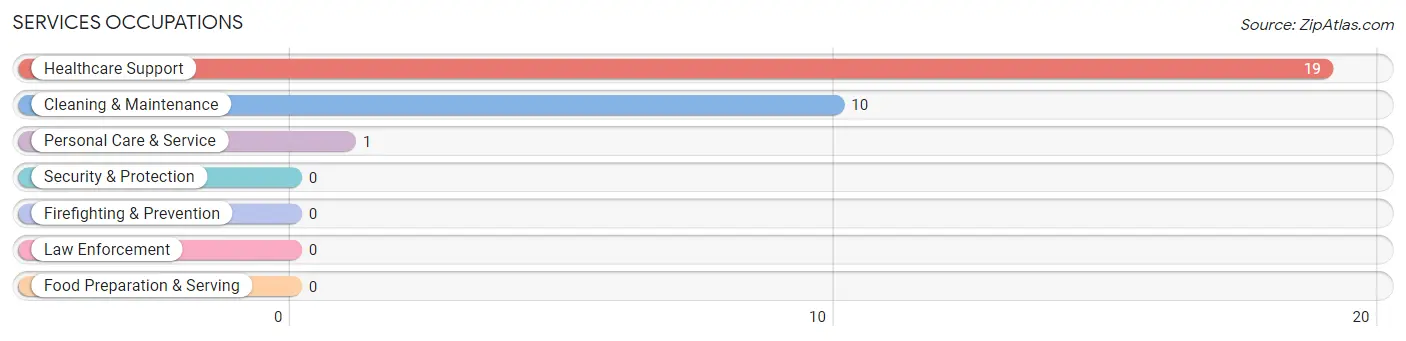
Services Occupations
The most common Services occupations in South Mansfield are Healthcare Support (19 | 9.9%), Cleaning & Maintenance (10 | 5.2%), and Personal Care & Service (1 | 0.5%).
Services Occupations by Sex
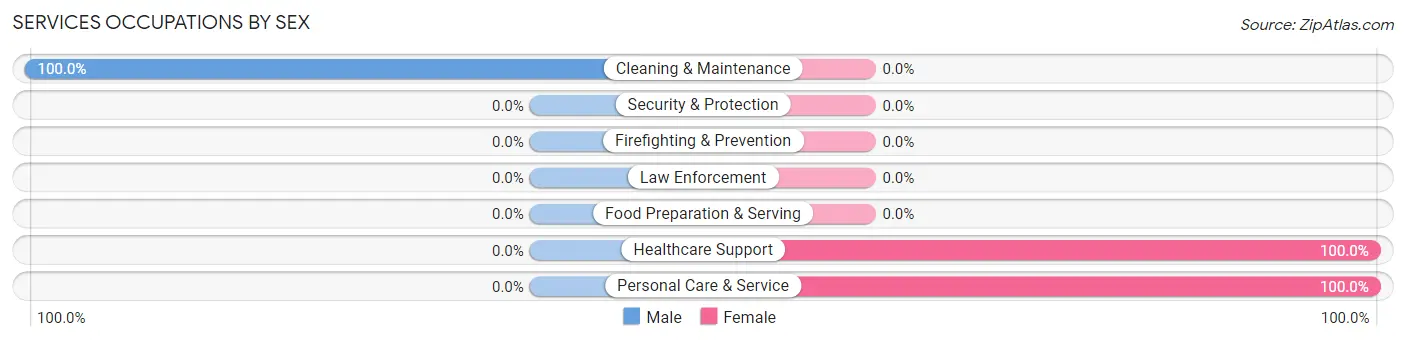
| Occupation | Male | Female |
| Healthcare Support | 0 (0.0%) | 19 (100.0%) |
| Security & Protection | 0 (0.0%) | 0 (0.0%) |
| Firefighting & Prevention | 0 (0.0%) | 0 (0.0%) |
| Law Enforcement | 0 (0.0%) | 0 (0.0%) |
| Food Preparation & Serving | 0 (0.0%) | 0 (0.0%) |
| Cleaning & Maintenance | 10 (100.0%) | 0 (0.0%) |
| Personal Care & Service | 0 (0.0%) | 1 (100.0%) |
| Total (Category) | 10 (33.3%) | 20 (66.7%) |
| Total (Overall) | 68 (35.4%) | 124 (64.6%) |
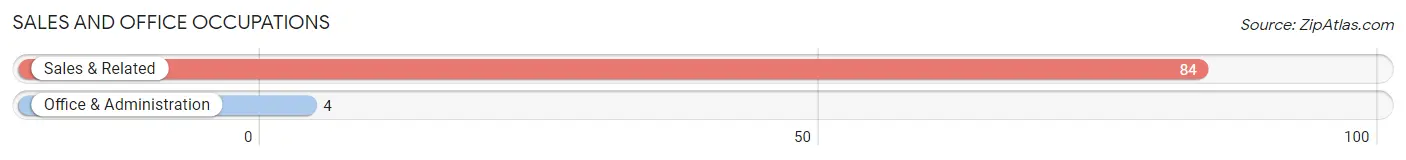
Sales and Office Occupations
The most common Sales and Office occupations in South Mansfield are Sales & Related (84 | 43.8%), and Office & Administration (4 | 2.1%).
Sales and Office Occupations by Sex
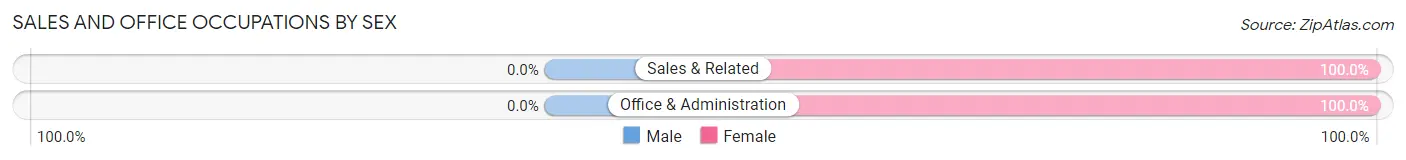
| Occupation | Male | Female |
| Sales & Related | 0 (0.0%) | 84 (100.0%) |
| Office & Administration | 0 (0.0%) | 4 (100.0%) |
| Total (Category) | 0 (0.0%) | 88 (100.0%) |
| Total (Overall) | 68 (35.4%) | 124 (64.6%) |
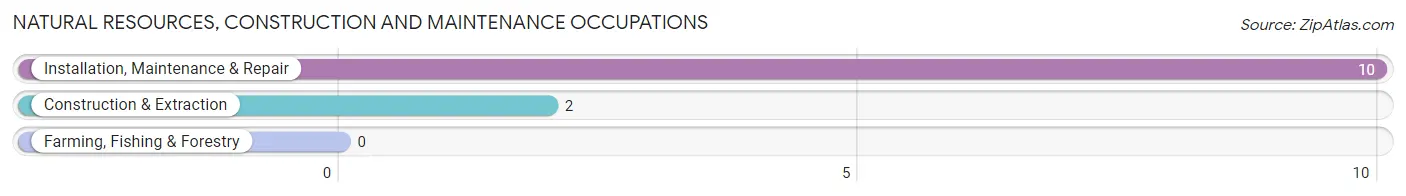
Natural Resources, Construction and Maintenance Occupations
The most common Natural Resources, Construction and Maintenance occupations in South Mansfield are Installation, Maintenance & Repair (10 | 5.2%), and Construction & Extraction (2 | 1.0%).
Natural Resources, Construction and Maintenance Occupations by Sex
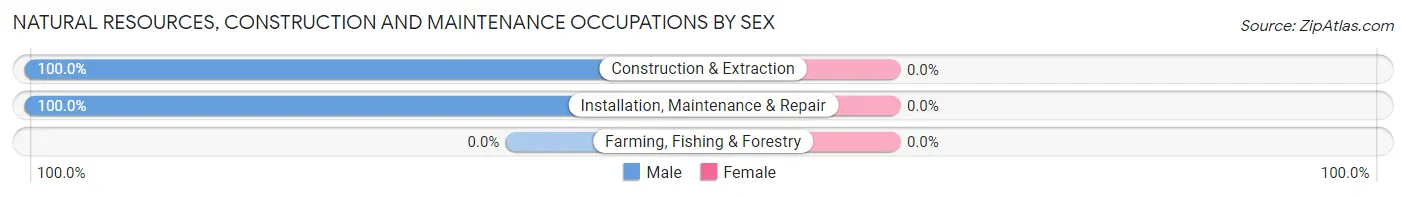
| Occupation | Male | Female |
| Farming, Fishing & Forestry | 0 (0.0%) | 0 (0.0%) |
| Construction & Extraction | 2 (100.0%) | 0 (0.0%) |
| Installation, Maintenance & Repair | 10 (100.0%) | 0 (0.0%) |
| Total (Category) | 12 (100.0%) | 0 (0.0%) |
| Total (Overall) | 68 (35.4%) | 124 (64.6%) |
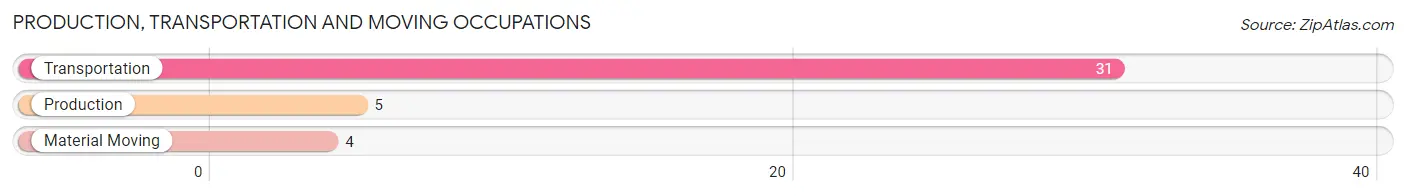
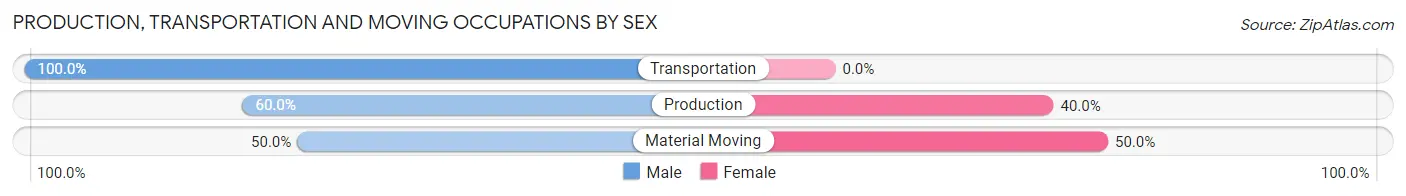
Production, Transportation and Moving Occupations
The most common Production, Transportation and Moving occupations in South Mansfield are Transportation (31 | 16.2%), Production (5 | 2.6%), and Material Moving (4 | 2.1%).
Production, Transportation and Moving Occupations by Sex
| Occupation | Male | Female |
| Production | 3 (60.0%) | 2 (40.0%) |
| Transportation | 31 (100.0%) | 0 (0.0%) |
| Material Moving | 2 (50.0%) | 2 (50.0%) |
| Total (Category) | 36 (90.0%) | 4 (10.0%) |
| Total (Overall) | 68 (35.4%) | 124 (64.6%) |
Employment Industries by Sex in South Mansfield
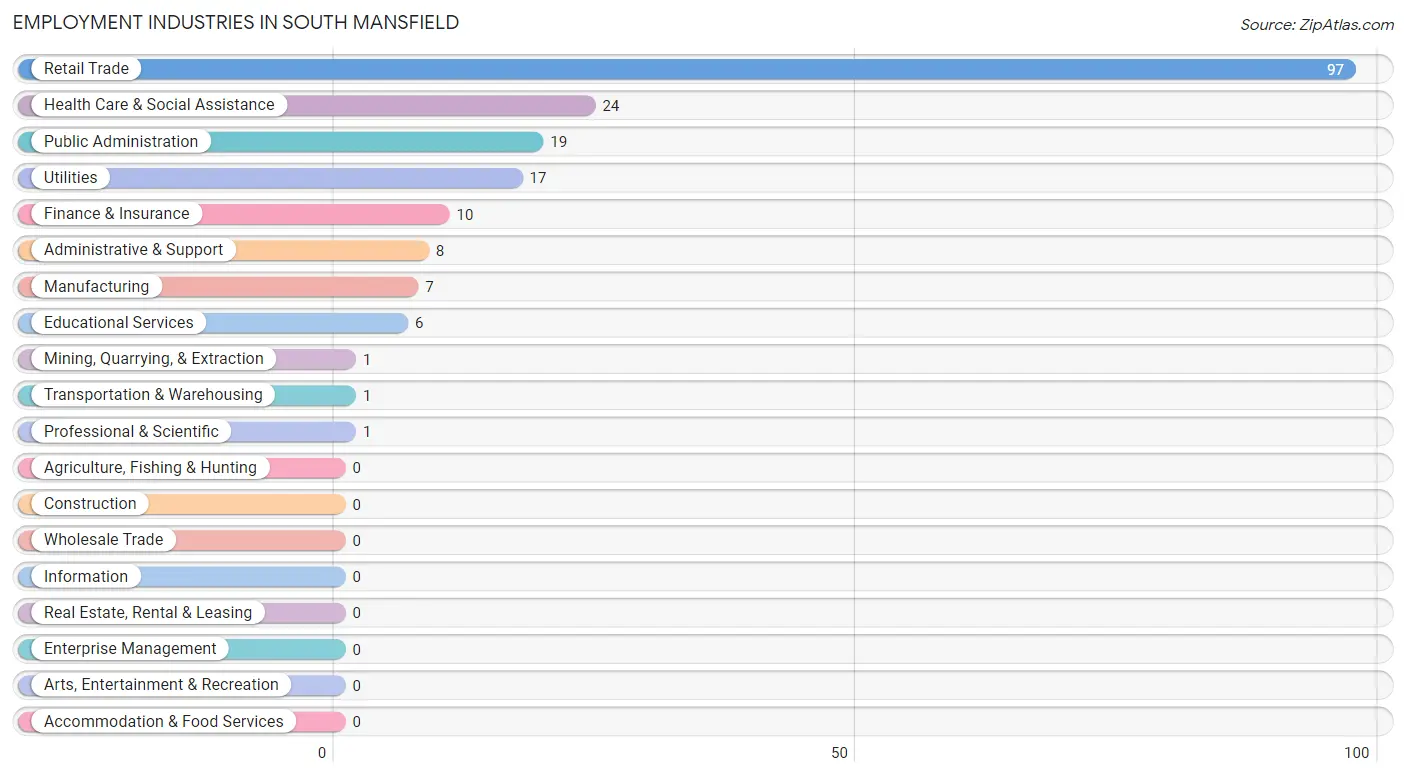
Employment Industries in South Mansfield
The major employment industries in South Mansfield include Retail Trade (97 | 50.5%), Health Care & Social Assistance (24 | 12.5%), Public Administration (19 | 9.9%), Utilities (17 | 8.8%), and Finance & Insurance (10 | 5.2%).
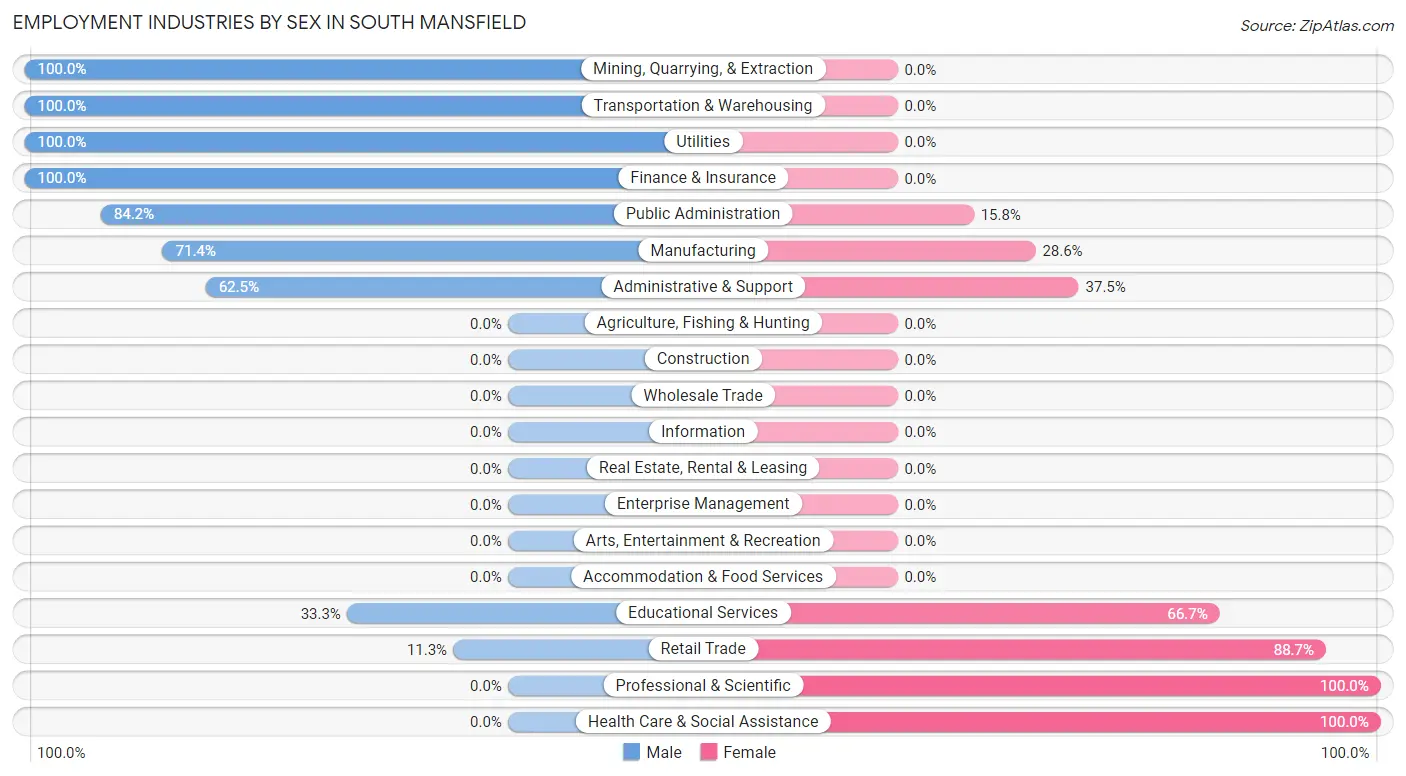
Employment Industries by Sex in South Mansfield
The South Mansfield industries that see more men than women are Mining, Quarrying, & Extraction (100.0%), Transportation & Warehousing (100.0%), and Utilities (100.0%), whereas the industries that tend to have a higher number of women are Professional & Scientific (100.0%), Health Care & Social Assistance (100.0%), and Retail Trade (88.7%).
| Industry | Male | Female |
| Agriculture, Fishing & Hunting | 0 (0.0%) | 0 (0.0%) |
| Mining, Quarrying, & Extraction | 1 (100.0%) | 0 (0.0%) |
| Construction | 0 (0.0%) | 0 (0.0%) |
| Manufacturing | 5 (71.4%) | 2 (28.6%) |
| Wholesale Trade | 0 (0.0%) | 0 (0.0%) |
| Retail Trade | 11 (11.3%) | 86 (88.7%) |
| Transportation & Warehousing | 1 (100.0%) | 0 (0.0%) |
| Utilities | 17 (100.0%) | 0 (0.0%) |
| Information | 0 (0.0%) | 0 (0.0%) |
| Finance & Insurance | 10 (100.0%) | 0 (0.0%) |
| Real Estate, Rental & Leasing | 0 (0.0%) | 0 (0.0%) |
| Professional & Scientific | 0 (0.0%) | 1 (100.0%) |
| Enterprise Management | 0 (0.0%) | 0 (0.0%) |
| Administrative & Support | 5 (62.5%) | 3 (37.5%) |
| Educational Services | 2 (33.3%) | 4 (66.7%) |
| Health Care & Social Assistance | 0 (0.0%) | 24 (100.0%) |
| Arts, Entertainment & Recreation | 0 (0.0%) | 0 (0.0%) |
| Accommodation & Food Services | 0 (0.0%) | 0 (0.0%) |
| Public Administration | 16 (84.2%) | 3 (15.8%) |
| Total | 68 (35.4%) | 124 (64.6%) |
Education in South Mansfield
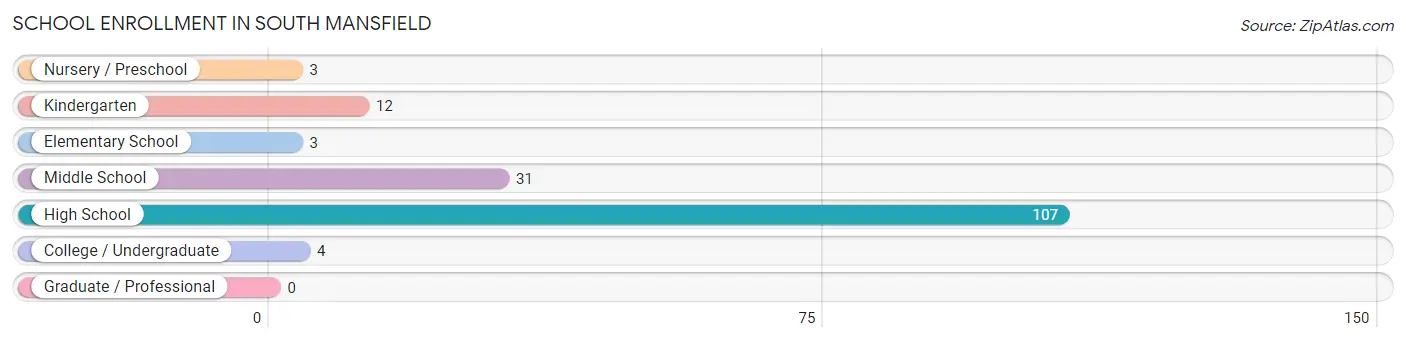
School Enrollment in South Mansfield
The most common levels of schooling among the 160 students in South Mansfield are high school (107 | 66.9%), middle school (31 | 19.4%), and kindergarten (12 | 7.5%).
| School Level | # Students | % Students |
| Nursery / Preschool | 3 | 1.9% |
| Kindergarten | 12 | 7.5% |
| Elementary School | 3 | 1.9% |
| Middle School | 31 | 19.4% |
| High School | 107 | 66.9% |
| College / Undergraduate | 4 | 2.5% |
| Graduate / Professional | 0 | 0.0% |
| Total | 160 | 100.0% |
School Enrollment by Age by Funding Source in South Mansfield
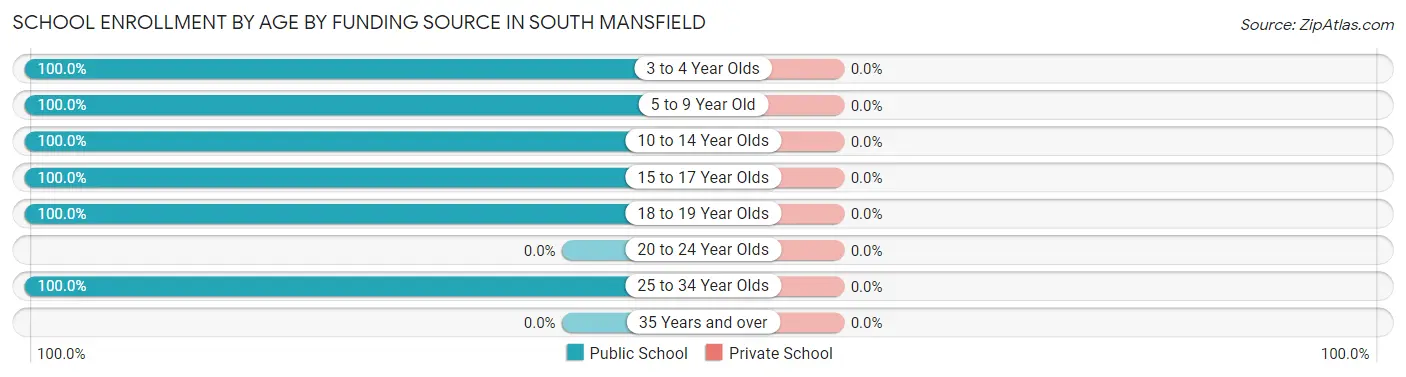
| Age Bracket | Public School | Private School |
| 3 to 4 Year Olds | 3 (100.0%) | 0 (0.0%) |
| 5 to 9 Year Old | 15 (100.0%) | 0 (0.0%) |
| 10 to 14 Year Olds | 33 (100.0%) | 0 (0.0%) |
| 15 to 17 Year Olds | 83 (100.0%) | 0 (0.0%) |
| 18 to 19 Year Olds | 22 (100.0%) | 0 (0.0%) |
| 20 to 24 Year Olds | 0 (0.0%) | 0 (0.0%) |
| 25 to 34 Year Olds | 4 (100.0%) | 0 (0.0%) |
| 35 Years and over | 0 (0.0%) | 0 (0.0%) |
| Total | 160 (100.0%) | 0 (0.0%) |
Educational Attainment by Field of Study in South Mansfield
Arts & humanities (10 | 32.3%), bio, nature & agricultural (8 | 25.8%), business (5 | 16.1%), education (3 | 9.7%), and liberal arts & history (3 | 9.7%) are the most common fields of study among 31 individuals in South Mansfield who have obtained a bachelor's degree or higher.
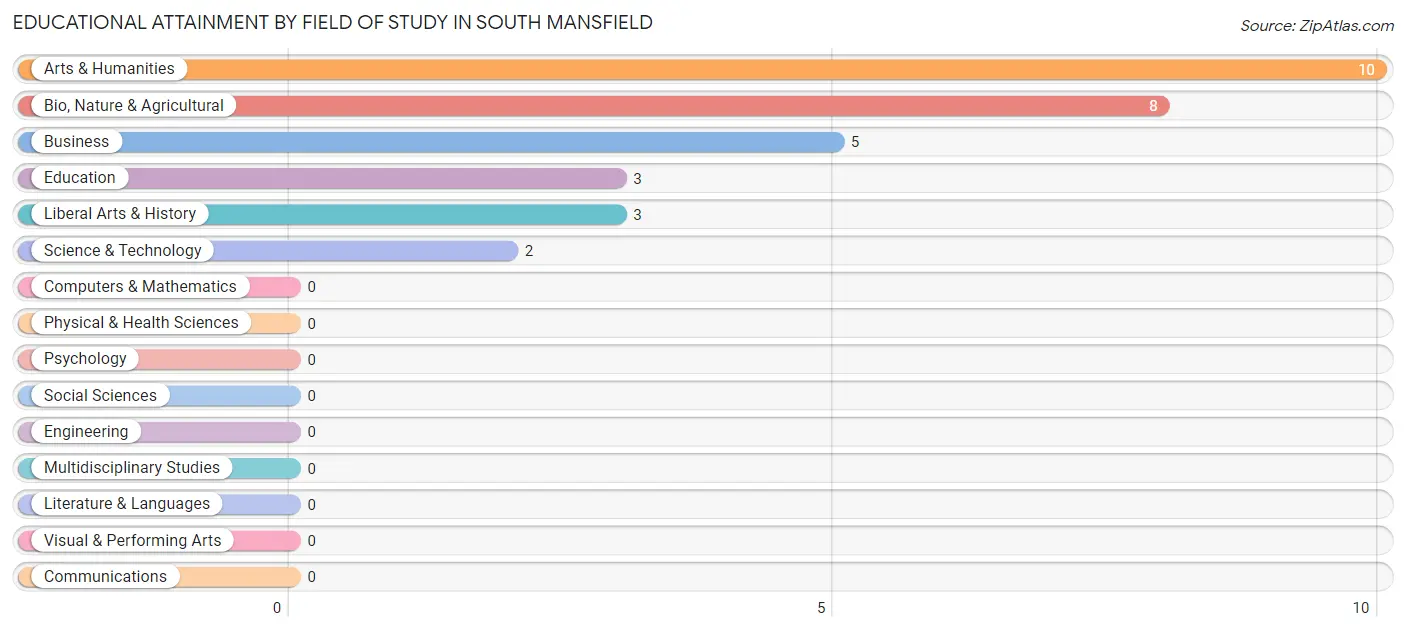
| Field of Study | # Graduates | % Graduates |
| Computers & Mathematics | 0 | 0.0% |
| Bio, Nature & Agricultural | 8 | 25.8% |
| Physical & Health Sciences | 0 | 0.0% |
| Psychology | 0 | 0.0% |
| Social Sciences | 0 | 0.0% |
| Engineering | 0 | 0.0% |
| Multidisciplinary Studies | 0 | 0.0% |
| Science & Technology | 2 | 6.5% |
| Business | 5 | 16.1% |
| Education | 3 | 9.7% |
| Literature & Languages | 0 | 0.0% |
| Liberal Arts & History | 3 | 9.7% |
| Visual & Performing Arts | 0 | 0.0% |
| Communications | 0 | 0.0% |
| Arts & Humanities | 10 | 32.3% |
| Total | 31 | 100.0% |
Transportation & Commute in South Mansfield
Vehicle Availability by Sex in South Mansfield
The most prevalent vehicle ownership categories in South Mansfield are males with 3 vehicles (19, accounting for 27.9%) and females with 3 vehicles (0, making up 15.3%).
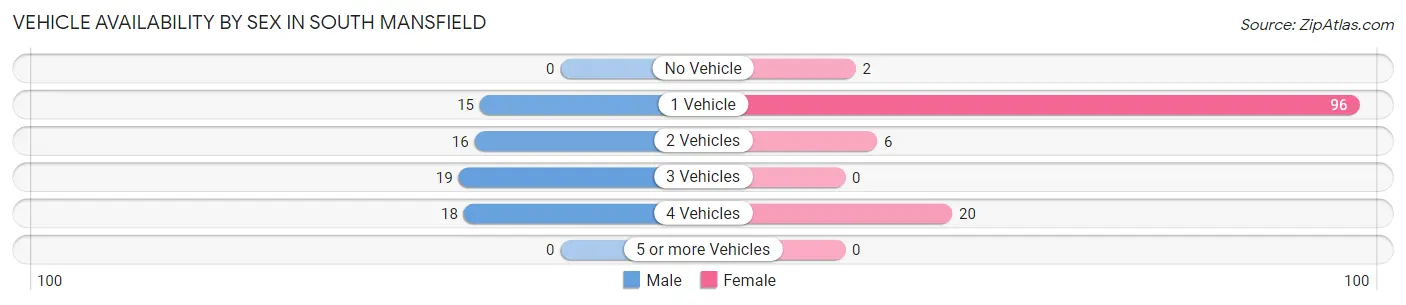
| Vehicles Available | Male | Female |
| No Vehicle | 0 (0.0%) | 2 (1.6%) |
| 1 Vehicle | 15 (22.1%) | 96 (77.4%) |
| 2 Vehicles | 16 (23.5%) | 6 (4.8%) |
| 3 Vehicles | 19 (27.9%) | 0 (0.0%) |
| 4 Vehicles | 18 (26.5%) | 20 (16.1%) |
| 5 or more Vehicles | 0 (0.0%) | 0 (0.0%) |
| Total | 68 (100.0%) | 124 (100.0%) |
Commute Time in South Mansfield
The most frequently occuring commute durations in South Mansfield are 10 to 14 minutes (79 commuters, 43.4%), 30 to 34 minutes (34 commuters, 18.7%), and 15 to 19 minutes (30 commuters, 16.5%).
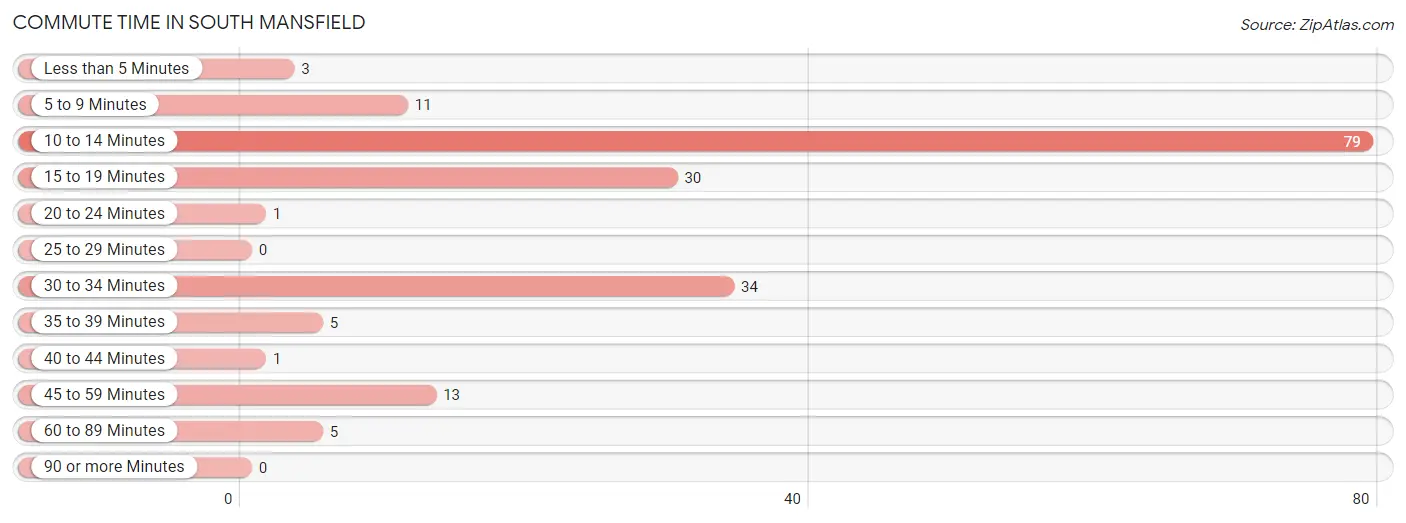
| Commute Time | # Commuters | % Commuters |
| Less than 5 Minutes | 3 | 1.7% |
| 5 to 9 Minutes | 11 | 6.0% |
| 10 to 14 Minutes | 79 | 43.4% |
| 15 to 19 Minutes | 30 | 16.5% |
| 20 to 24 Minutes | 1 | 0.5% |
| 25 to 29 Minutes | 0 | 0.0% |
| 30 to 34 Minutes | 34 | 18.7% |
| 35 to 39 Minutes | 5 | 2.8% |
| 40 to 44 Minutes | 1 | 0.5% |
| 45 to 59 Minutes | 13 | 7.1% |
| 60 to 89 Minutes | 5 | 2.8% |
| 90 or more Minutes | 0 | 0.0% |
Commute Time by Sex in South Mansfield
The most common commute times in South Mansfield are 15 to 19 minutes (30 commuters, 51.7%) for males and 10 to 14 minutes (69 commuters, 55.6%) for females.
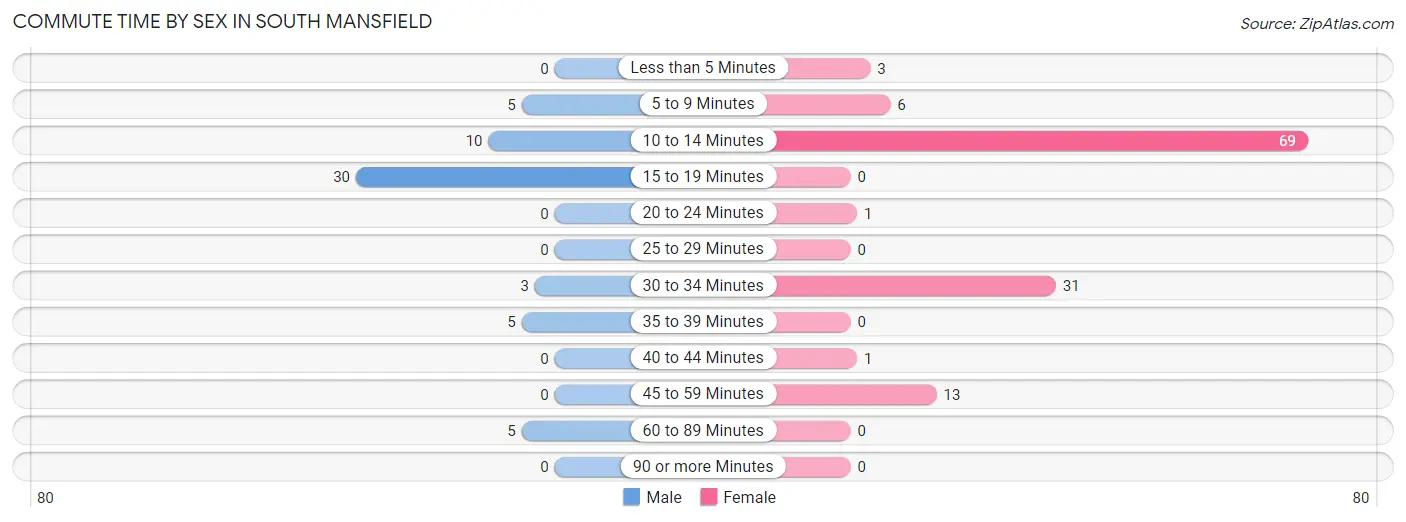
| Commute Time | Male | Female |
| Less than 5 Minutes | 0 (0.0%) | 3 (2.4%) |
| 5 to 9 Minutes | 5 (8.6%) | 6 (4.8%) |
| 10 to 14 Minutes | 10 (17.2%) | 69 (55.6%) |
| 15 to 19 Minutes | 30 (51.7%) | 0 (0.0%) |
| 20 to 24 Minutes | 0 (0.0%) | 1 (0.8%) |
| 25 to 29 Minutes | 0 (0.0%) | 0 (0.0%) |
| 30 to 34 Minutes | 3 (5.2%) | 31 (25.0%) |
| 35 to 39 Minutes | 5 (8.6%) | 0 (0.0%) |
| 40 to 44 Minutes | 0 (0.0%) | 1 (0.8%) |
| 45 to 59 Minutes | 0 (0.0%) | 13 (10.5%) |
| 60 to 89 Minutes | 5 (8.6%) | 0 (0.0%) |
| 90 or more Minutes | 0 (0.0%) | 0 (0.0%) |
Time of Departure to Work by Sex in South Mansfield
The most frequent times of departure to work in South Mansfield are 6:30 AM to 6:59 AM (17, 29.3%) for males and 7:30 AM to 7:59 AM (75, 60.5%) for females.
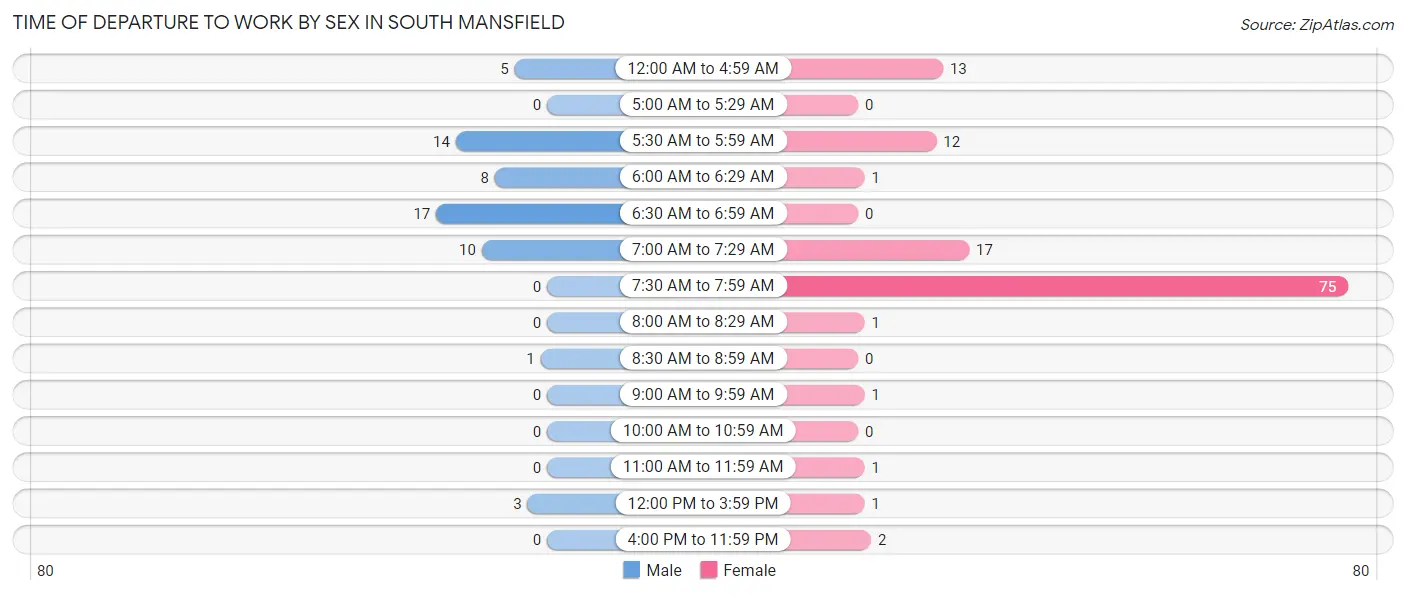
| Time of Departure | Male | Female |
| 12:00 AM to 4:59 AM | 5 (8.6%) | 13 (10.5%) |
| 5:00 AM to 5:29 AM | 0 (0.0%) | 0 (0.0%) |
| 5:30 AM to 5:59 AM | 14 (24.1%) | 12 (9.7%) |
| 6:00 AM to 6:29 AM | 8 (13.8%) | 1 (0.8%) |
| 6:30 AM to 6:59 AM | 17 (29.3%) | 0 (0.0%) |
| 7:00 AM to 7:29 AM | 10 (17.2%) | 17 (13.7%) |
| 7:30 AM to 7:59 AM | 0 (0.0%) | 75 (60.5%) |
| 8:00 AM to 8:29 AM | 0 (0.0%) | 1 (0.8%) |
| 8:30 AM to 8:59 AM | 1 (1.7%) | 0 (0.0%) |
| 9:00 AM to 9:59 AM | 0 (0.0%) | 1 (0.8%) |
| 10:00 AM to 10:59 AM | 0 (0.0%) | 0 (0.0%) |
| 11:00 AM to 11:59 AM | 0 (0.0%) | 1 (0.8%) |
| 12:00 PM to 3:59 PM | 3 (5.2%) | 1 (0.8%) |
| 4:00 PM to 11:59 PM | 0 (0.0%) | 2 (1.6%) |
| Total | 58 (100.0%) | 124 (100.0%) |
Housing Occupancy in South Mansfield
Occupancy by Ownership in South Mansfield
Of the total 259 dwellings in South Mansfield, owner-occupied units account for 70 (27.0%), while renter-occupied units make up 189 (73.0%).
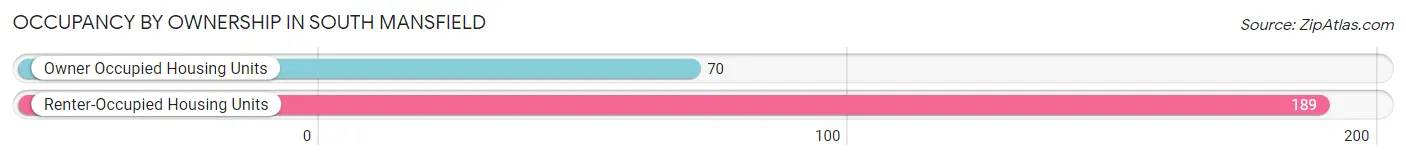
| Occupancy | # Housing Units | % Housing Units |
| Owner Occupied Housing Units | 70 | 27.0% |
| Renter-Occupied Housing Units | 189 | 73.0% |
| Total Occupied Housing Units | 259 | 100.0% |
Occupancy by Household Size in South Mansfield
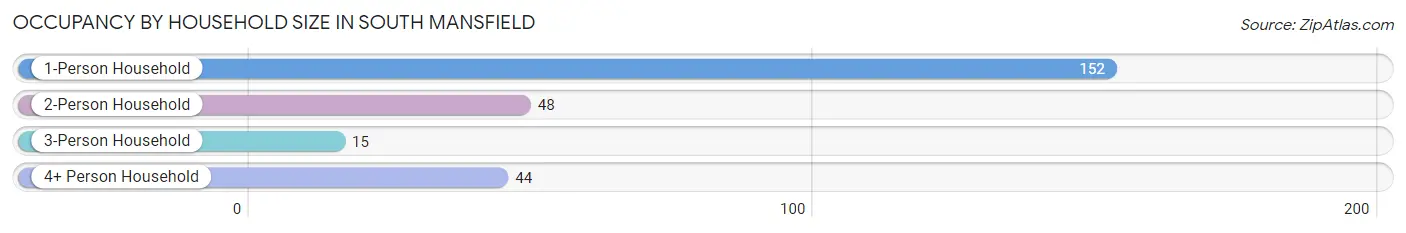
| Household Size | # Housing Units | % Housing Units |
| 1-Person Household | 152 | 58.7% |
| 2-Person Household | 48 | 18.5% |
| 3-Person Household | 15 | 5.8% |
| 4+ Person Household | 44 | 17.0% |
| Total Housing Units | 259 | 100.0% |
Occupancy by Ownership by Household Size in South Mansfield
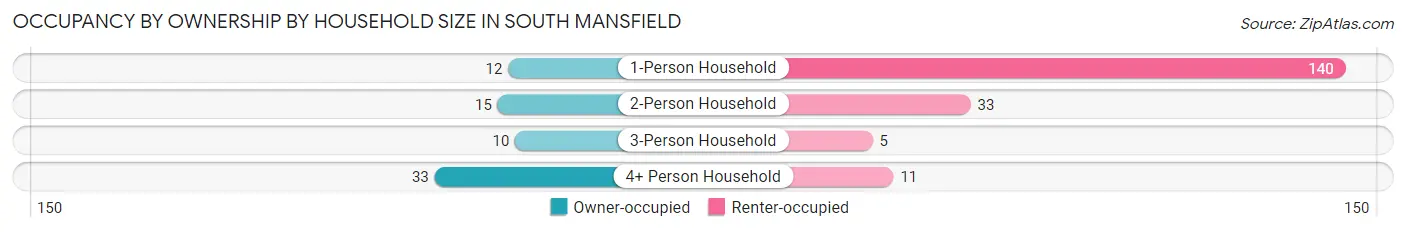
| Household Size | Owner-occupied | Renter-occupied |
| 1-Person Household | 12 (7.9%) | 140 (92.1%) |
| 2-Person Household | 15 (31.2%) | 33 (68.8%) |
| 3-Person Household | 10 (66.7%) | 5 (33.3%) |
| 4+ Person Household | 33 (75.0%) | 11 (25.0%) |
| Total Housing Units | 70 (27.0%) | 189 (73.0%) |
Occupancy by Educational Attainment in South Mansfield
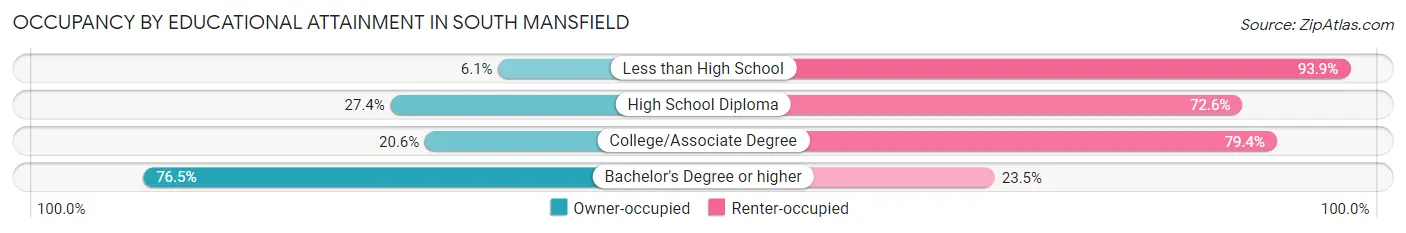
| Household Size | Owner-occupied | Renter-occupied |
| Less than High School | 2 (6.1%) | 31 (93.9%) |
| High School Diploma | 48 (27.4%) | 127 (72.6%) |
| College/Associate Degree | 7 (20.6%) | 27 (79.4%) |
| Bachelor's Degree or higher | 13 (76.5%) | 4 (23.5%) |
Occupancy by Age of Householder in South Mansfield
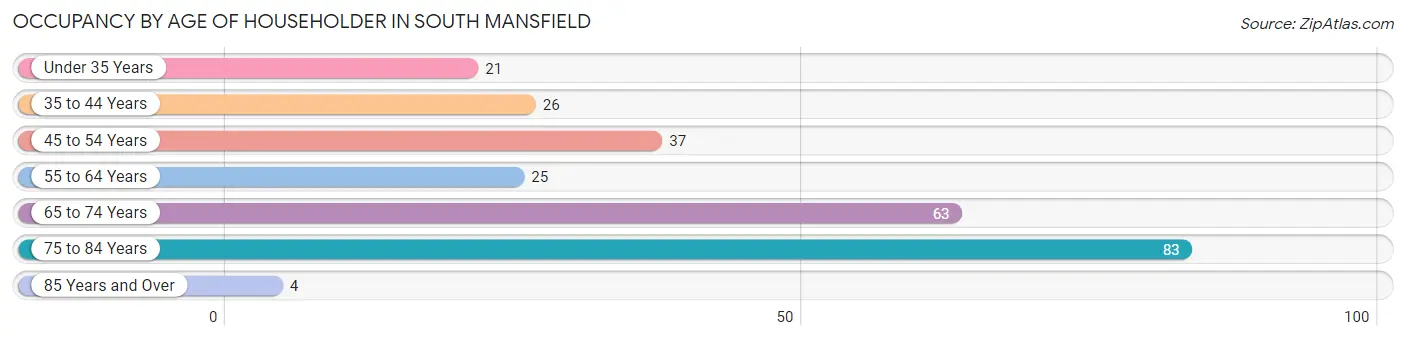
| Age Bracket | # Households | % Households |
| Under 35 Years | 21 | 8.1% |
| 35 to 44 Years | 26 | 10.0% |
| 45 to 54 Years | 37 | 14.3% |
| 55 to 64 Years | 25 | 9.7% |
| 65 to 74 Years | 63 | 24.3% |
| 75 to 84 Years | 83 | 32.1% |
| 85 Years and Over | 4 | 1.5% |
| Total | 259 | 100.0% |
Housing Finances in South Mansfield
Median Income by Occupancy in South Mansfield
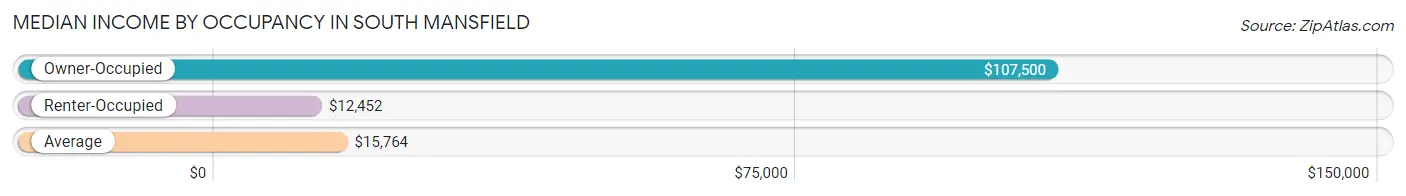
| Occupancy Type | # Households | Median Income |
| Owner-Occupied | 70 (27.0%) | $107,500 |
| Renter-Occupied | 189 (73.0%) | $12,452 |
| Average | 259 (100.0%) | $15,764 |
Occupancy by Householder Income Bracket in South Mansfield
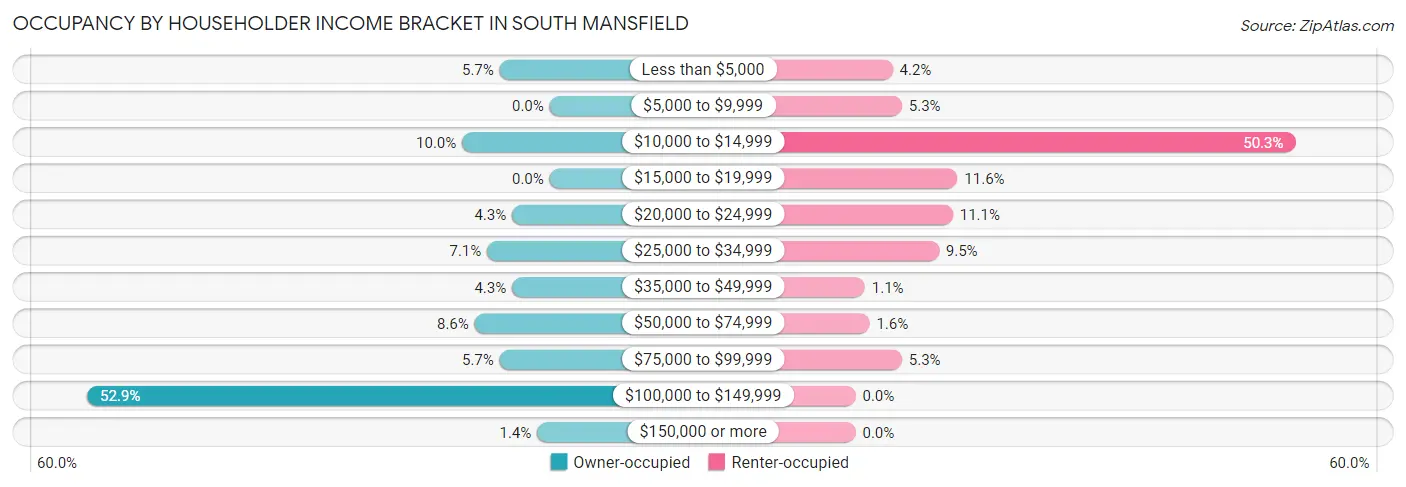
| Income Bracket | Owner-occupied | Renter-occupied |
| Less than $5,000 | 4 (5.7%) | 8 (4.2%) |
| $5,000 to $9,999 | 0 (0.0%) | 10 (5.3%) |
| $10,000 to $14,999 | 7 (10.0%) | 95 (50.3%) |
| $15,000 to $19,999 | 0 (0.0%) | 22 (11.6%) |
| $20,000 to $24,999 | 3 (4.3%) | 21 (11.1%) |
| $25,000 to $34,999 | 5 (7.1%) | 18 (9.5%) |
| $35,000 to $49,999 | 3 (4.3%) | 2 (1.1%) |
| $50,000 to $74,999 | 6 (8.6%) | 3 (1.6%) |
| $75,000 to $99,999 | 4 (5.7%) | 10 (5.3%) |
| $100,000 to $149,999 | 37 (52.9%) | 0 (0.0%) |
| $150,000 or more | 1 (1.4%) | 0 (0.0%) |
| Total | 70 (100.0%) | 189 (100.0%) |
Monthly Housing Cost Tiers in South Mansfield
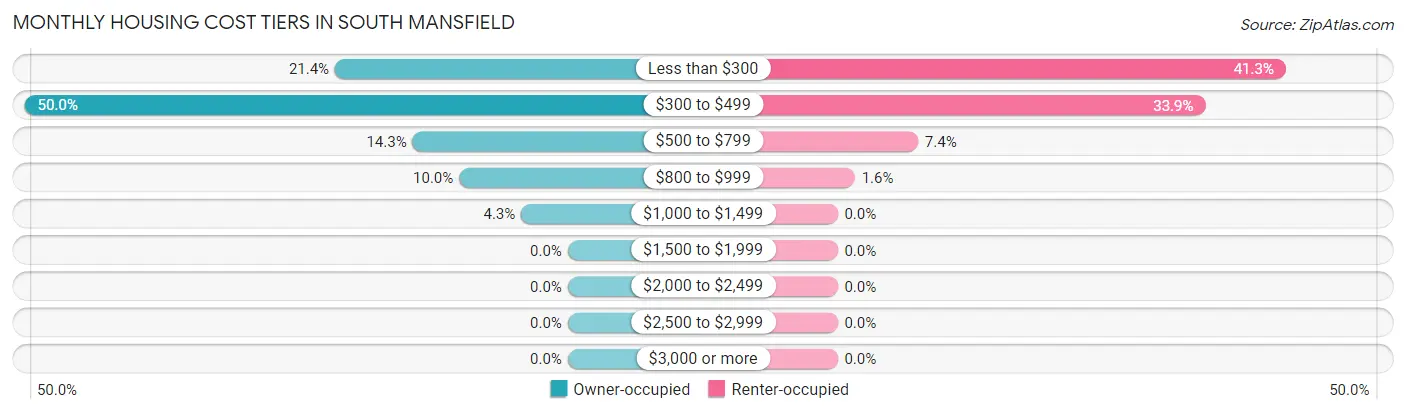
| Monthly Cost | Owner-occupied | Renter-occupied |
| Less than $300 | 15 (21.4%) | 78 (41.3%) |
| $300 to $499 | 35 (50.0%) | 64 (33.9%) |
| $500 to $799 | 10 (14.3%) | 14 (7.4%) |
| $800 to $999 | 7 (10.0%) | 3 (1.6%) |
| $1,000 to $1,499 | 3 (4.3%) | 0 (0.0%) |
| $1,500 to $1,999 | 0 (0.0%) | 0 (0.0%) |
| $2,000 to $2,499 | 0 (0.0%) | 0 (0.0%) |
| $2,500 to $2,999 | 0 (0.0%) | 0 (0.0%) |
| $3,000 or more | 0 (0.0%) | 0 (0.0%) |
| Total | 70 (100.0%) | 189 (100.0%) |
Physical Housing Characteristics in South Mansfield
Housing Structures in South Mansfield
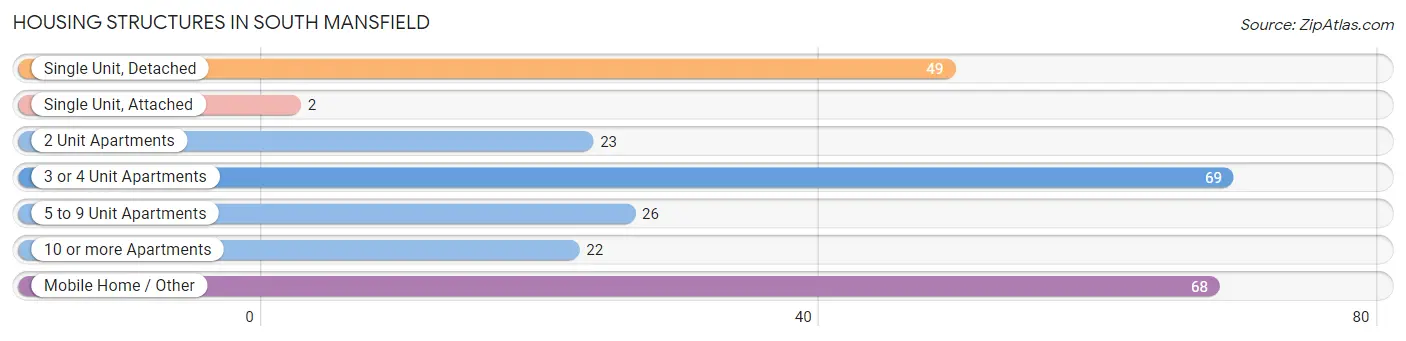
| Structure Type | # Housing Units | % Housing Units |
| Single Unit, Detached | 49 | 18.9% |
| Single Unit, Attached | 2 | 0.8% |
| 2 Unit Apartments | 23 | 8.9% |
| 3 or 4 Unit Apartments | 69 | 26.6% |
| 5 to 9 Unit Apartments | 26 | 10.0% |
| 10 or more Apartments | 22 | 8.5% |
| Mobile Home / Other | 68 | 26.3% |
| Total | 259 | 100.0% |
Housing Structures by Occupancy in South Mansfield
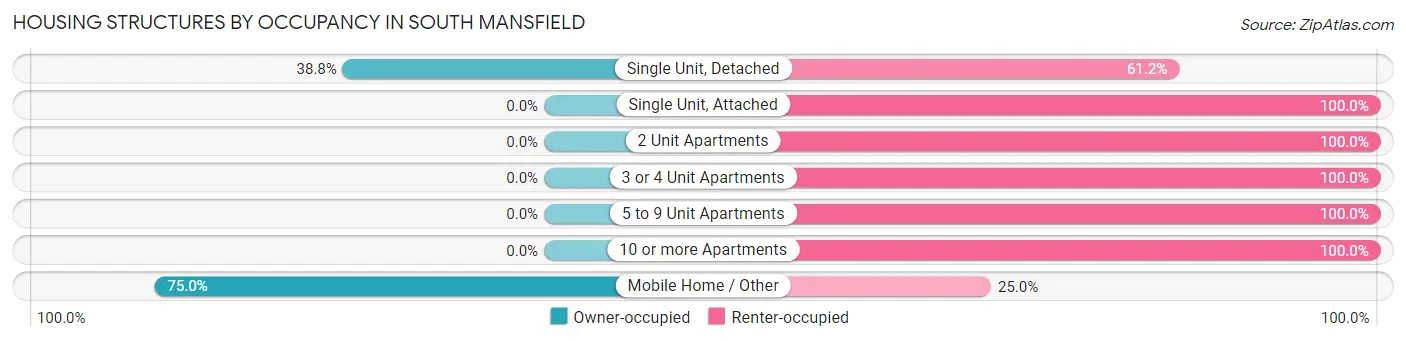
| Structure Type | Owner-occupied | Renter-occupied |
| Single Unit, Detached | 19 (38.8%) | 30 (61.2%) |
| Single Unit, Attached | 0 (0.0%) | 2 (100.0%) |
| 2 Unit Apartments | 0 (0.0%) | 23 (100.0%) |
| 3 or 4 Unit Apartments | 0 (0.0%) | 69 (100.0%) |
| 5 to 9 Unit Apartments | 0 (0.0%) | 26 (100.0%) |
| 10 or more Apartments | 0 (0.0%) | 22 (100.0%) |
| Mobile Home / Other | 51 (75.0%) | 17 (25.0%) |
| Total | 70 (27.0%) | 189 (73.0%) |
Housing Structures by Number of Rooms in South Mansfield
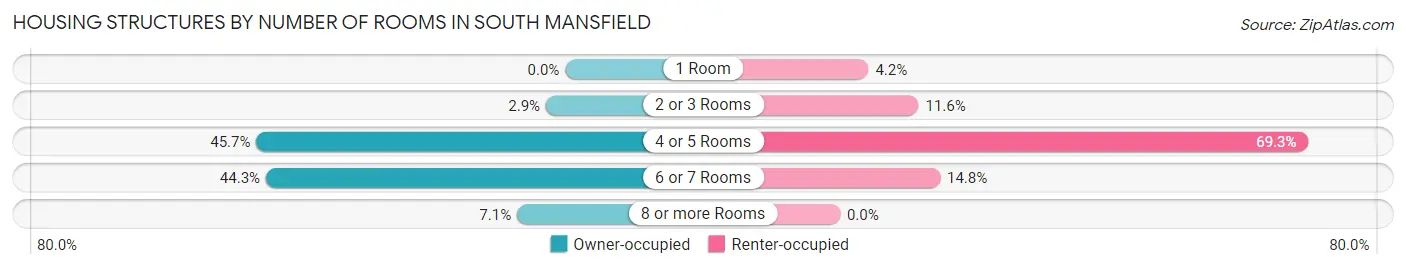
| Number of Rooms | Owner-occupied | Renter-occupied |
| 1 Room | 0 (0.0%) | 8 (4.2%) |
| 2 or 3 Rooms | 2 (2.9%) | 22 (11.6%) |
| 4 or 5 Rooms | 32 (45.7%) | 131 (69.3%) |
| 6 or 7 Rooms | 31 (44.3%) | 28 (14.8%) |
| 8 or more Rooms | 5 (7.1%) | 0 (0.0%) |
| Total | 70 (100.0%) | 189 (100.0%) |
Housing Structure by Heating Type in South Mansfield
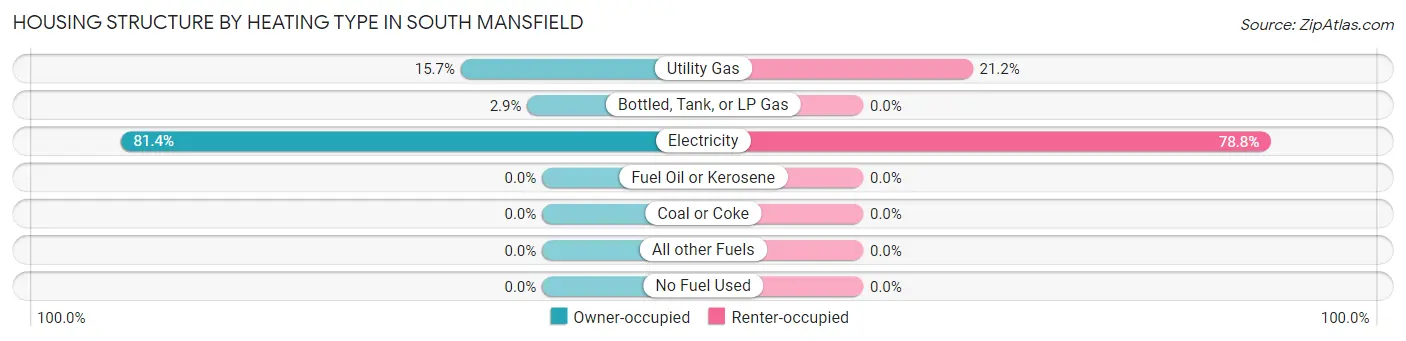
| Heating Type | Owner-occupied | Renter-occupied |
| Utility Gas | 11 (15.7%) | 40 (21.2%) |
| Bottled, Tank, or LP Gas | 2 (2.9%) | 0 (0.0%) |
| Electricity | 57 (81.4%) | 149 (78.8%) |
| Fuel Oil or Kerosene | 0 (0.0%) | 0 (0.0%) |
| Coal or Coke | 0 (0.0%) | 0 (0.0%) |
| All other Fuels | 0 (0.0%) | 0 (0.0%) |
| No Fuel Used | 0 (0.0%) | 0 (0.0%) |
| Total | 70 (100.0%) | 189 (100.0%) |
Household Vehicle Usage in South Mansfield
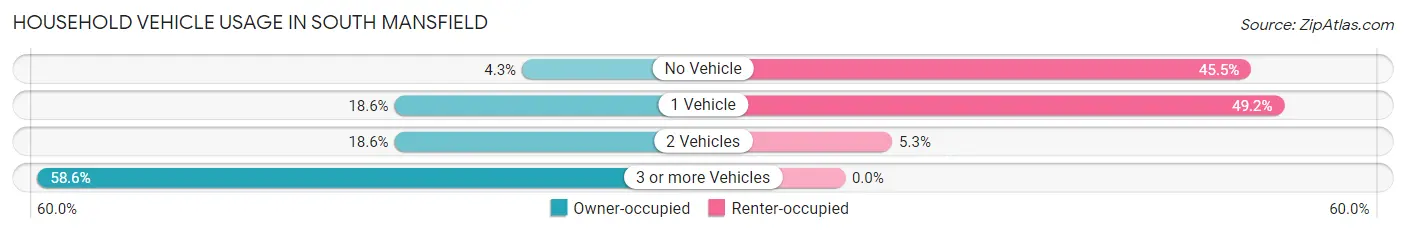
| Vehicles per Household | Owner-occupied | Renter-occupied |
| No Vehicle | 3 (4.3%) | 86 (45.5%) |
| 1 Vehicle | 13 (18.6%) | 93 (49.2%) |
| 2 Vehicles | 13 (18.6%) | 10 (5.3%) |
| 3 or more Vehicles | 41 (58.6%) | 0 (0.0%) |
| Total | 70 (100.0%) | 189 (100.0%) |
Real Estate & Mortgages in South Mansfield
Real Estate and Mortgage Overview in South Mansfield
| Characteristic | Without Mortgage | With Mortgage |
| Housing Units | 64 | 6 |
| Median Property Value | $83,500 | $137,500 |
| Median Household Income | $110,313 | $0 |
| Monthly Housing Costs | $436 | $0 |
| Real Estate Taxes | $199 | $3 |
Property Value by Mortgage Status in South Mansfield
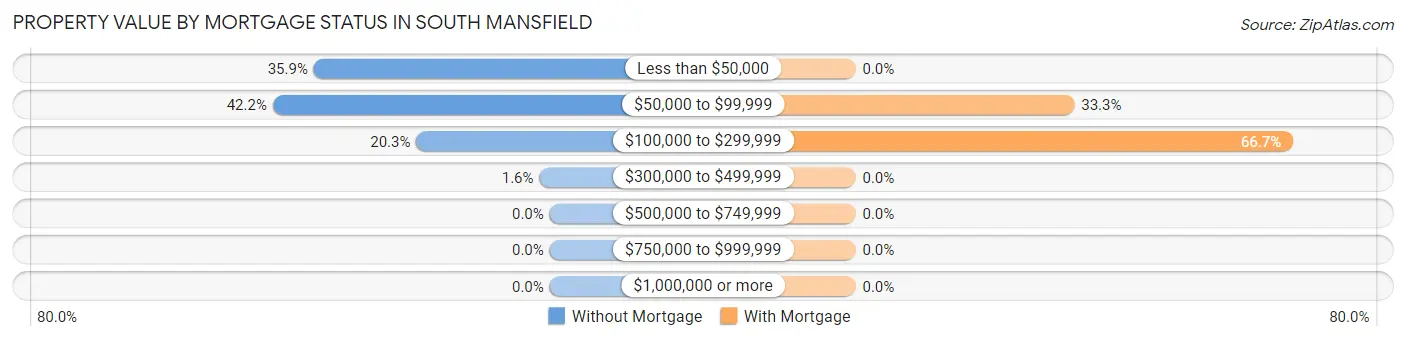
| Property Value | Without Mortgage | With Mortgage |
| Less than $50,000 | 23 (35.9%) | 0 (0.0%) |
| $50,000 to $99,999 | 27 (42.2%) | 2 (33.3%) |
| $100,000 to $299,999 | 13 (20.3%) | 4 (66.7%) |
| $300,000 to $499,999 | 1 (1.6%) | 0 (0.0%) |
| $500,000 to $749,999 | 0 (0.0%) | 0 (0.0%) |
| $750,000 to $999,999 | 0 (0.0%) | 0 (0.0%) |
| $1,000,000 or more | 0 (0.0%) | 0 (0.0%) |
| Total | 64 (100.0%) | 6 (100.0%) |
Household Income by Mortgage Status in South Mansfield
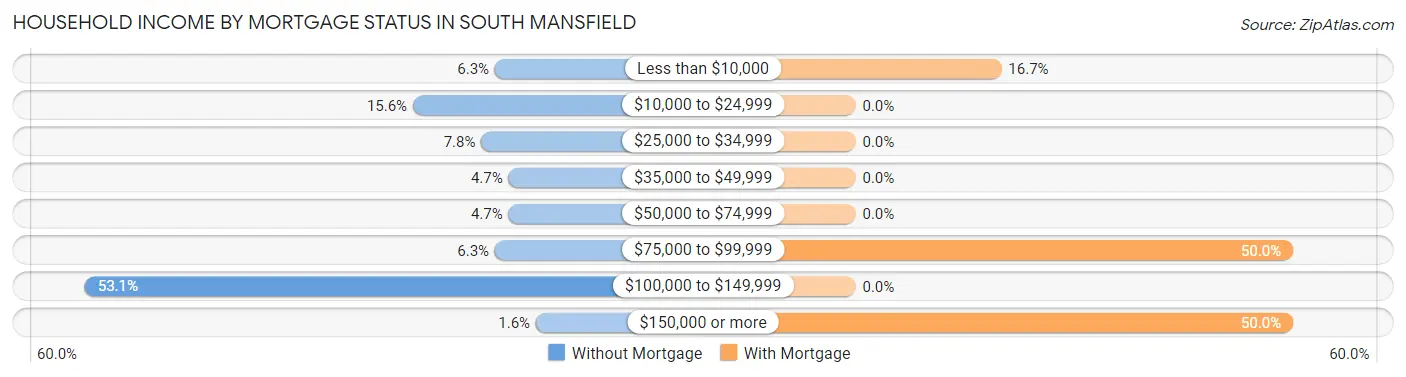
| Household Income | Without Mortgage | With Mortgage |
| Less than $10,000 | 4 (6.2%) | 1 (16.7%) |
| $10,000 to $24,999 | 10 (15.6%) | 0 (0.0%) |
| $25,000 to $34,999 | 5 (7.8%) | 0 (0.0%) |
| $35,000 to $49,999 | 3 (4.7%) | 0 (0.0%) |
| $50,000 to $74,999 | 3 (4.7%) | 0 (0.0%) |
| $75,000 to $99,999 | 4 (6.2%) | 3 (50.0%) |
| $100,000 to $149,999 | 34 (53.1%) | 0 (0.0%) |
| $150,000 or more | 1 (1.6%) | 3 (50.0%) |
| Total | 64 (100.0%) | 6 (100.0%) |
Property Value to Household Income Ratio in South Mansfield
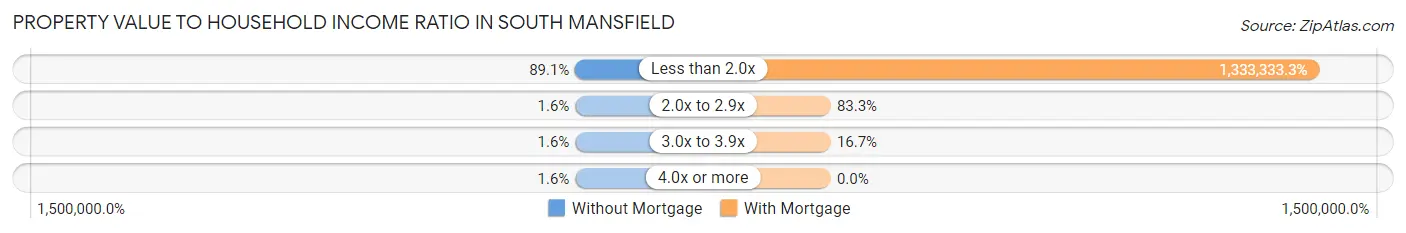
| Value-to-Income Ratio | Without Mortgage | With Mortgage |
| Less than 2.0x | 57 (89.1%) | 80,000 (1,333,333.3%) |
| 2.0x to 2.9x | 1 (1.6%) | 5 (83.3%) |
| 3.0x to 3.9x | 1 (1.6%) | 1 (16.7%) |
| 4.0x or more | 1 (1.6%) | 0 (0.0%) |
| Total | 64 (100.0%) | 6 (100.0%) |
Real Estate Taxes by Mortgage Status in South Mansfield
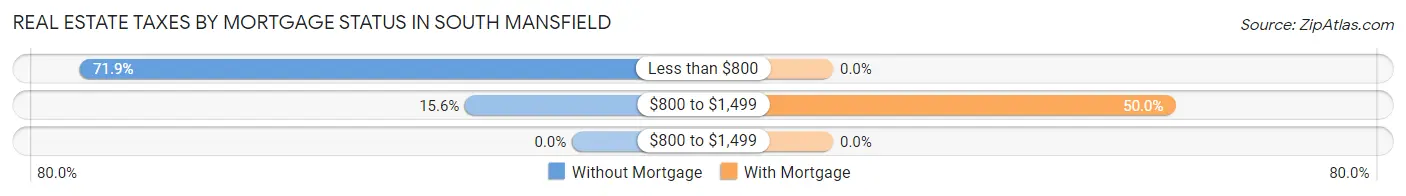
| Property Taxes | Without Mortgage | With Mortgage |
| Less than $800 | 46 (71.9%) | 0 (0.0%) |
| $800 to $1,499 | 10 (15.6%) | 3 (50.0%) |
| $800 to $1,499 | 0 (0.0%) | 0 (0.0%) |
| Total | 64 (100.0%) | 6 (100.0%) |
Health & Disability in South Mansfield
Health Insurance Coverage by Age in South Mansfield
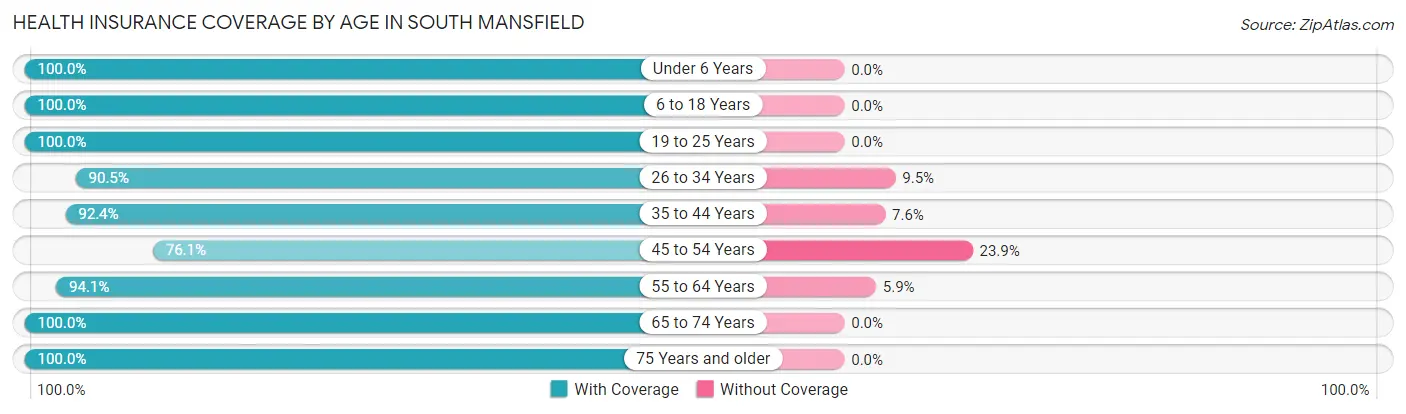
| Age Bracket | With Coverage | Without Coverage |
| Under 6 Years | 18 (100.0%) | 0 (0.0%) |
| 6 to 18 Years | 144 (100.0%) | 0 (0.0%) |
| 19 to 25 Years | 19 (100.0%) | 0 (0.0%) |
| 26 to 34 Years | 57 (90.5%) | 6 (9.5%) |
| 35 to 44 Years | 85 (92.4%) | 7 (7.6%) |
| 45 to 54 Years | 35 (76.1%) | 11 (23.9%) |
| 55 to 64 Years | 32 (94.1%) | 2 (5.9%) |
| 65 to 74 Years | 80 (100.0%) | 0 (0.0%) |
| 75 Years and older | 88 (100.0%) | 0 (0.0%) |
| Total | 558 (95.6%) | 26 (4.4%) |
Health Insurance Coverage by Citizenship Status in South Mansfield
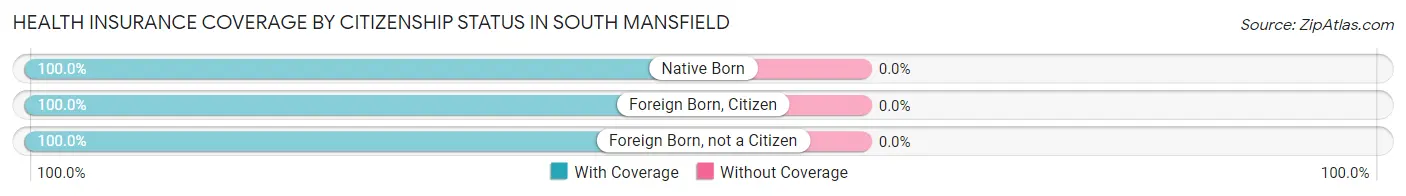
| Citizenship Status | With Coverage | Without Coverage |
| Native Born | 18 (100.0%) | 0 (0.0%) |
| Foreign Born, Citizen | 144 (100.0%) | 0 (0.0%) |
| Foreign Born, not a Citizen | 19 (100.0%) | 0 (0.0%) |
Health Insurance Coverage by Household Income in South Mansfield
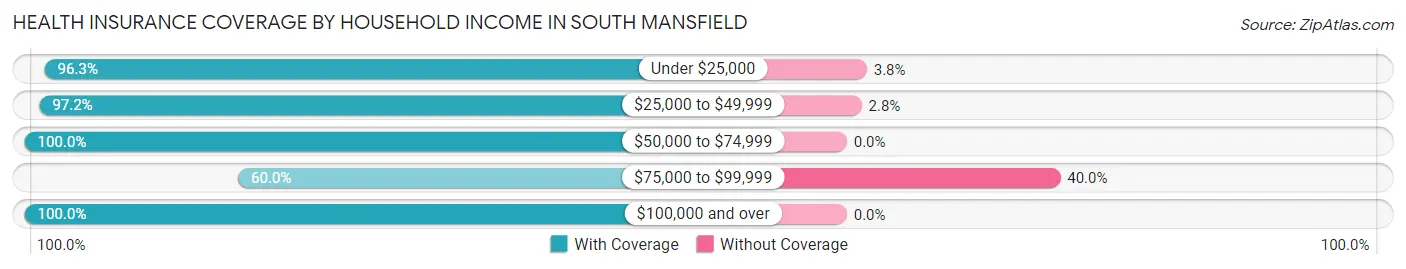
| Household Income | With Coverage | Without Coverage |
| Under $25,000 | 385 (96.3%) | 15 (3.7%) |
| $25,000 to $49,999 | 35 (97.2%) | 1 (2.8%) |
| $50,000 to $74,999 | 25 (100.0%) | 0 (0.0%) |
| $75,000 to $99,999 | 15 (60.0%) | 10 (40.0%) |
| $100,000 and over | 98 (100.0%) | 0 (0.0%) |
Public vs Private Health Insurance Coverage by Age in South Mansfield
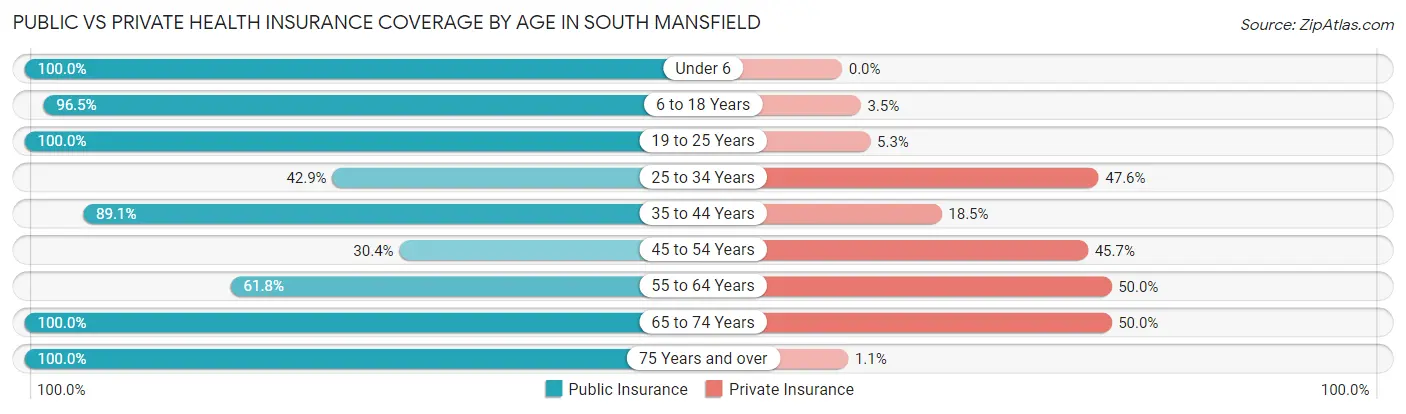
| Age Bracket | Public Insurance | Private Insurance |
| Under 6 | 18 (100.0%) | 0 (0.0%) |
| 6 to 18 Years | 139 (96.5%) | 5 (3.5%) |
| 19 to 25 Years | 19 (100.0%) | 1 (5.3%) |
| 25 to 34 Years | 27 (42.9%) | 30 (47.6%) |
| 35 to 44 Years | 82 (89.1%) | 17 (18.5%) |
| 45 to 54 Years | 14 (30.4%) | 21 (45.7%) |
| 55 to 64 Years | 21 (61.8%) | 17 (50.0%) |
| 65 to 74 Years | 80 (100.0%) | 40 (50.0%) |
| 75 Years and over | 88 (100.0%) | 1 (1.1%) |
| Total | 488 (83.6%) | 132 (22.6%) |
Disability Status by Sex by Age in South Mansfield
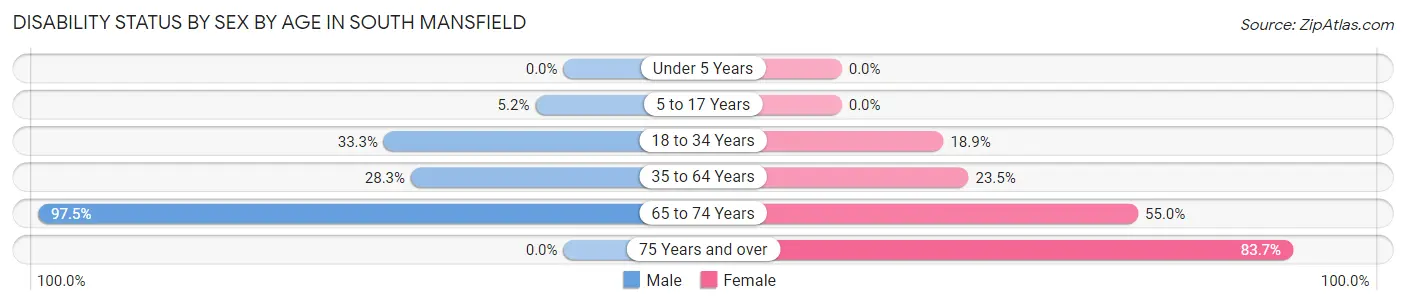
| Age Bracket | Male | Female |
| Under 5 Years | 0 (0.0%) | 0 (0.0%) |
| 5 to 17 Years | 6 (5.2%) | 0 (0.0%) |
| 18 to 34 Years | 18 (33.3%) | 10 (18.9%) |
| 35 to 64 Years | 15 (28.3%) | 28 (23.5%) |
| 65 to 74 Years | 39 (97.5%) | 22 (55.0%) |
| 75 Years and over | 0 (0.0%) | 72 (83.7%) |
Disability Class by Sex by Age in South Mansfield
Disability Class: Hearing Difficulty
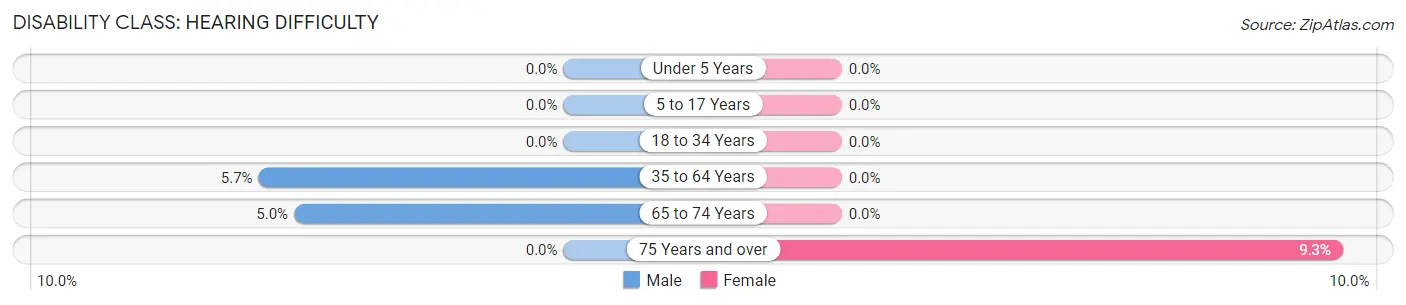
| Age Bracket | Male | Female |
| Under 5 Years | 0 (0.0%) | 0 (0.0%) |
| 5 to 17 Years | 0 (0.0%) | 0 (0.0%) |
| 18 to 34 Years | 0 (0.0%) | 0 (0.0%) |
| 35 to 64 Years | 3 (5.7%) | 0 (0.0%) |
| 65 to 74 Years | 2 (5.0%) | 0 (0.0%) |
| 75 Years and over | 0 (0.0%) | 8 (9.3%) |
Disability Class: Vision Difficulty
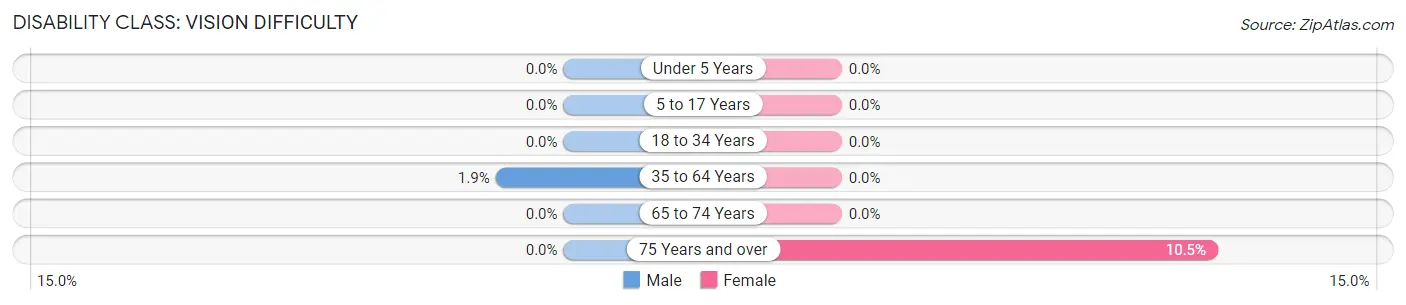
| Age Bracket | Male | Female |
| Under 5 Years | 0 (0.0%) | 0 (0.0%) |
| 5 to 17 Years | 0 (0.0%) | 0 (0.0%) |
| 18 to 34 Years | 0 (0.0%) | 0 (0.0%) |
| 35 to 64 Years | 1 (1.9%) | 0 (0.0%) |
| 65 to 74 Years | 0 (0.0%) | 0 (0.0%) |
| 75 Years and over | 0 (0.0%) | 9 (10.5%) |
Disability Class: Cognitive Difficulty
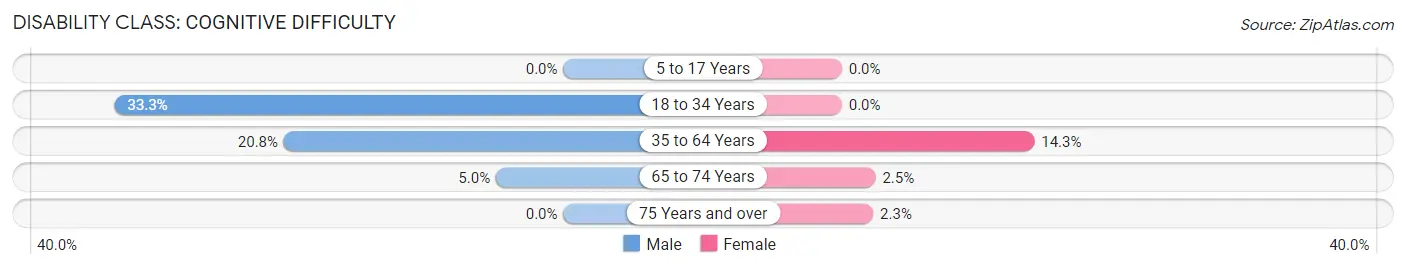
| Age Bracket | Male | Female |
| 5 to 17 Years | 0 (0.0%) | 0 (0.0%) |
| 18 to 34 Years | 18 (33.3%) | 0 (0.0%) |
| 35 to 64 Years | 11 (20.7%) | 17 (14.3%) |
| 65 to 74 Years | 2 (5.0%) | 1 (2.5%) |
| 75 Years and over | 0 (0.0%) | 2 (2.3%) |
Disability Class: Ambulatory Difficulty
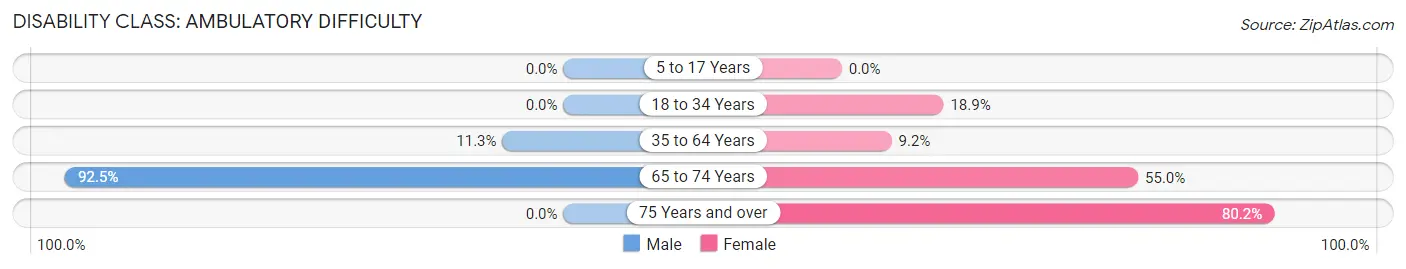
| Age Bracket | Male | Female |
| 5 to 17 Years | 0 (0.0%) | 0 (0.0%) |
| 18 to 34 Years | 0 (0.0%) | 10 (18.9%) |
| 35 to 64 Years | 6 (11.3%) | 11 (9.2%) |
| 65 to 74 Years | 37 (92.5%) | 22 (55.0%) |
| 75 Years and over | 0 (0.0%) | 69 (80.2%) |
Disability Class: Self-Care Difficulty
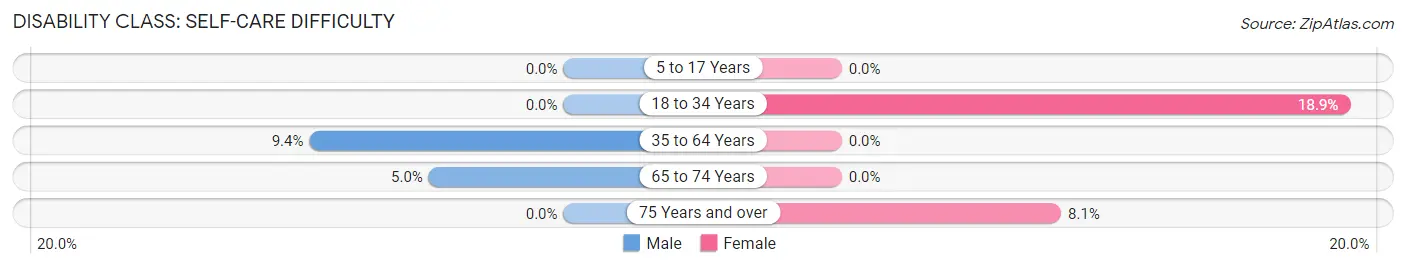
| Age Bracket | Male | Female |
| 5 to 17 Years | 0 (0.0%) | 0 (0.0%) |
| 18 to 34 Years | 0 (0.0%) | 10 (18.9%) |
| 35 to 64 Years | 5 (9.4%) | 0 (0.0%) |
| 65 to 74 Years | 2 (5.0%) | 0 (0.0%) |
| 75 Years and over | 0 (0.0%) | 7 (8.1%) |
Technology Access in South Mansfield
Computing Device Access in South Mansfield
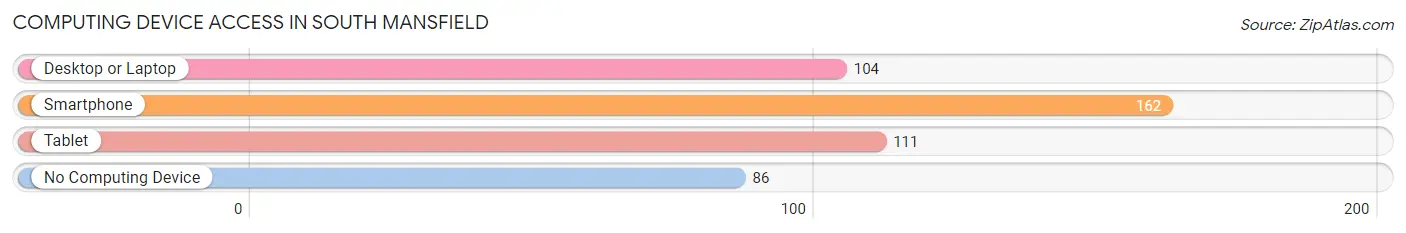
| Device Type | # Households | % Households |
| Desktop or Laptop | 104 | 40.2% |
| Smartphone | 162 | 62.5% |
| Tablet | 111 | 42.9% |
| No Computing Device | 86 | 33.2% |
| Total | 259 | 100.0% |
Internet Access in South Mansfield
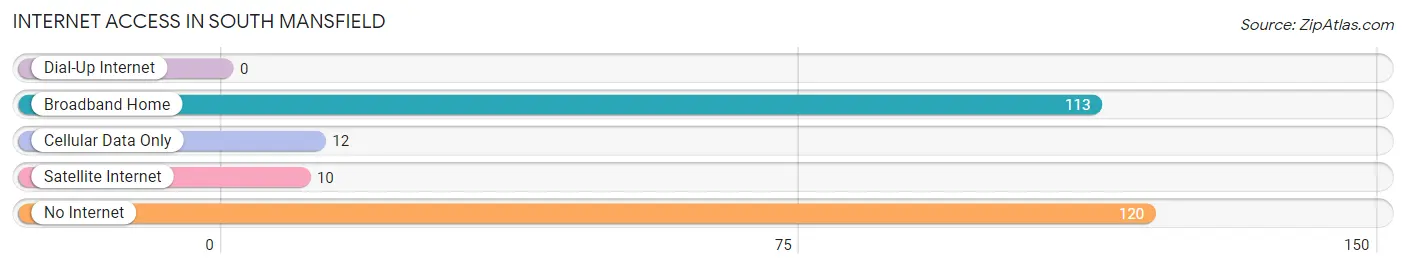
| Internet Type | # Households | % Households |
| Dial-Up Internet | 0 | 0.0% |
| Broadband Home | 113 | 43.6% |
| Cellular Data Only | 12 | 4.6% |
| Satellite Internet | 10 | 3.9% |
| No Internet | 120 | 46.3% |
| Total | 259 | 100.0% |
South Mansfield Summary
Mansfield is a small town located in DeSoto Parish, Louisiana. It is situated in the northwest corner of the state, approximately 30 miles south of Shreveport. The town has a population of approximately 5,000 people and is the parish seat of DeSoto Parish.
History
Mansfield was founded in 1839 by a group of settlers from the nearby town of Logansport. The town was named after General Mansfield, a hero of the War of 1812. The town was incorporated in 1845 and quickly became a center of commerce and industry. The town was home to several cotton plantations and sawmills, as well as a number of other businesses.
In 1861, the town was the site of the Battle of Mansfield, a major battle in the Civil War. The Confederate forces were victorious in the battle, but the town was heavily damaged. After the war, the town was rebuilt and continued to grow.
In the late 19th century, the town became a center of the timber industry. The town was also home to several brickyards and other businesses. In the early 20th century, the town was home to several oil refineries and other industries.
Geography
Mansfield is located in the northwest corner of Louisiana, approximately 30 miles south of Shreveport. The town is situated on the banks of the Red River, which forms the border between Louisiana and Texas. The town is surrounded by rolling hills and forests. The climate is humid subtropical, with hot summers and mild winters.
Economy
Mansfield’s economy is largely based on agriculture and timber. The town is home to several cotton plantations and sawmills, as well as a number of other businesses. The town is also home to several oil refineries and other industries.
Demographics
As of the 2010 census, the population of Mansfield was 5,001. The racial makeup of the town was 79.3% White, 17.2% African American, 0.3% Native American, 0.7% Asian, 0.1% Pacific Islander, and 2.4% from other races. Hispanic or Latino of any race were 3.2% of the population.
The median income for a household in the town was $30,938, and the median income for a family was $37,813. The per capita income for the town was $17,845. About 17.2% of families and 20.3% of the population were below the poverty line, including 28.2% of those under age 18 and 15.2% of those age 65 or over.
Conclusion
Mansfield is a small town located in DeSoto Parish, Louisiana. It is situated in the northwest corner of the state, approximately 30 miles south of Shreveport. The town has a population of approximately 5,000 people and is the parish seat of DeSoto Parish. The town was founded in 1839 and has a long history of agriculture and timber production. The town is also home to several oil refineries and other industries. The population of Mansfield is largely white, with a small percentage of African Americans and other races. The median income for a household in the town is $30,938, and the median income for a family is $37,813.
Common Questions
What is Per Capita Income in South Mansfield?
Per Capita income in South Mansfield is $15,756.
What is the Median Household income in South Mansfield?
Median Household Income in South Mansfield is $15,764.
What is Inequality or Gini Index in South Mansfield?
Inequality or Gini Index in South Mansfield is 0.54.
What is the Total Population of South Mansfield?
Total Population of South Mansfield is 584.
What is the Total Male Population of South Mansfield?
Total Male Population of South Mansfield is 267.
What is the Total Female Population of South Mansfield?
Total Female Population of South Mansfield is 317.
What is the Ratio of Males per 100 Females in South Mansfield?
There are 84.23 Males per 100 Females in South Mansfield.
What is the Ratio of Females per 100 Males in South Mansfield?
There are 118.73 Females per 100 Males in South Mansfield.
What is the Median Population Age in South Mansfield?
Median Population Age in South Mansfield is 35.8 Years.
What is the Average Family Size in South Mansfield
Average Family Size in South Mansfield is 4.3 People.
What is the Average Household Size in South Mansfield
Average Household Size in South Mansfield is 2.2 People.
How Large is the Labor Force in South Mansfield?
There are 285 People in the Labor Forcein in South Mansfield.
What is the Percentage of People in the Labor Force in South Mansfield?
54.7% of People are in the Labor Force in South Mansfield.
What is the Unemployment Rate in South Mansfield?
Unemployment Rate in South Mansfield is 32.6%.