Oretta, LA Map & Demographics
Oretta Map
Oretta Overview
$24,903
PER CAPITA INCOME
96.4%
WAGE / INCOME GAP [ % ]
3.6¢/ $1
WAGE / INCOME GAP [ $ ]
0.49
INEQUALITY / GINI INDEX
734
TOTAL POPULATION
440
MALE POPULATION
294
FEMALE POPULATION
149.66
MALES / 100 FEMALES
66.82
FEMALES / 100 MALES
34.5
MEDIAN AGE
10.5
AVG FAMILY SIZE
6.8
AVG HOUSEHOLD SIZE
266
LABOR FORCE [ PEOPLE ]
51.1%
PERCENT IN LABOR FORCE
10.2%
UNEMPLOYMENT RATE
Income in Oretta
Income Overview in Oretta
| Characteristic | Number | Measure |
| Per Capita Income | 734 | $24,903 |
| Median Family Income | 66 | $0 |
| Mean Family Income | 66 | $160,221 |
| Median Household Income | 108 | $0 |
| Mean Household Income | 108 | $102,015 |
| Income Deficit | 66 | $0 |
| Wage / Income Gap (%) | 734 | 96.41% |
| Wage / Income Gap ($) | 734 | 3.59¢ per $1 |
| Gini / Inequality Index | 734 | 0.49 |
Earnings by Sex in Oretta
Average Earnings in Oretta are $67,544, $69,561 for men and $2,499 for women, a difference of 96.4%.
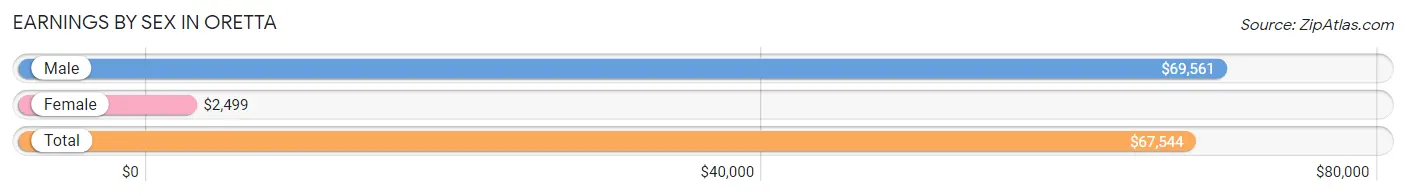
| Sex | Number | Average Earnings |
| Male | 242 (69.1%) | $69,561 |
| Female | 108 (30.9%) | $2,499 |
| Total | 350 (100.0%) | $67,544 |
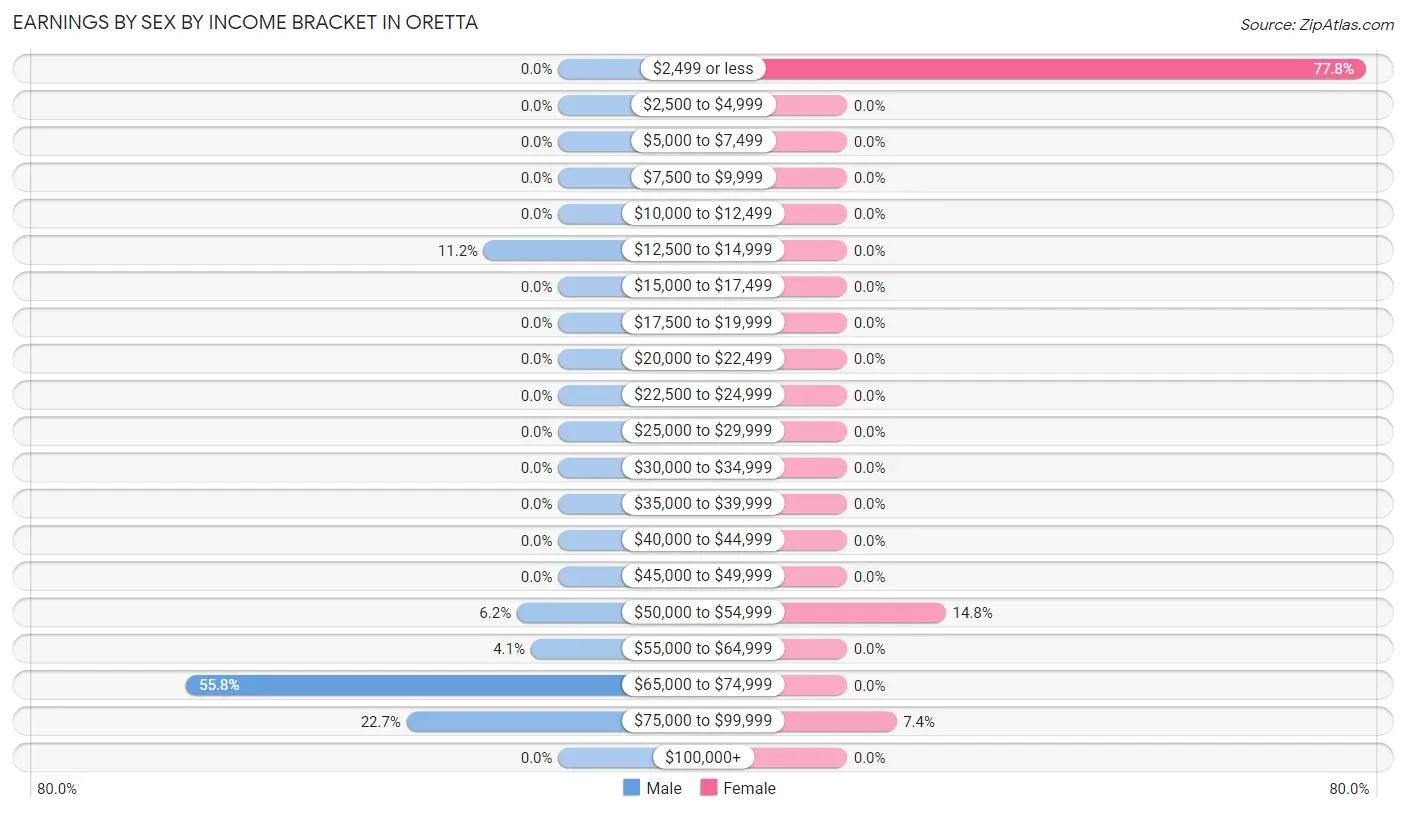
Earnings by Sex by Income Bracket in Oretta
The most common earnings brackets in Oretta are $65,000 to $74,999 for men (135 | 55.8%) and $2,499 or less for women (84 | 77.8%).
| Income | Male | Female |
| $2,499 or less | 0 (0.0%) | 84 (77.8%) |
| $2,500 to $4,999 | 0 (0.0%) | 0 (0.0%) |
| $5,000 to $7,499 | 0 (0.0%) | 0 (0.0%) |
| $7,500 to $9,999 | 0 (0.0%) | 0 (0.0%) |
| $10,000 to $12,499 | 0 (0.0%) | 0 (0.0%) |
| $12,500 to $14,999 | 27 (11.2%) | 0 (0.0%) |
| $15,000 to $17,499 | 0 (0.0%) | 0 (0.0%) |
| $17,500 to $19,999 | 0 (0.0%) | 0 (0.0%) |
| $20,000 to $22,499 | 0 (0.0%) | 0 (0.0%) |
| $22,500 to $24,999 | 0 (0.0%) | 0 (0.0%) |
| $25,000 to $29,999 | 0 (0.0%) | 0 (0.0%) |
| $30,000 to $34,999 | 0 (0.0%) | 0 (0.0%) |
| $35,000 to $39,999 | 0 (0.0%) | 0 (0.0%) |
| $40,000 to $44,999 | 0 (0.0%) | 0 (0.0%) |
| $45,000 to $49,999 | 0 (0.0%) | 0 (0.0%) |
| $50,000 to $54,999 | 15 (6.2%) | 16 (14.8%) |
| $55,000 to $64,999 | 10 (4.1%) | 0 (0.0%) |
| $65,000 to $74,999 | 135 (55.8%) | 0 (0.0%) |
| $75,000 to $99,999 | 55 (22.7%) | 8 (7.4%) |
| $100,000+ | 0 (0.0%) | 0 (0.0%) |
| Total | 242 (100.0%) | 108 (100.0%) |
Earnings by Sex by Educational Attainment in Oretta
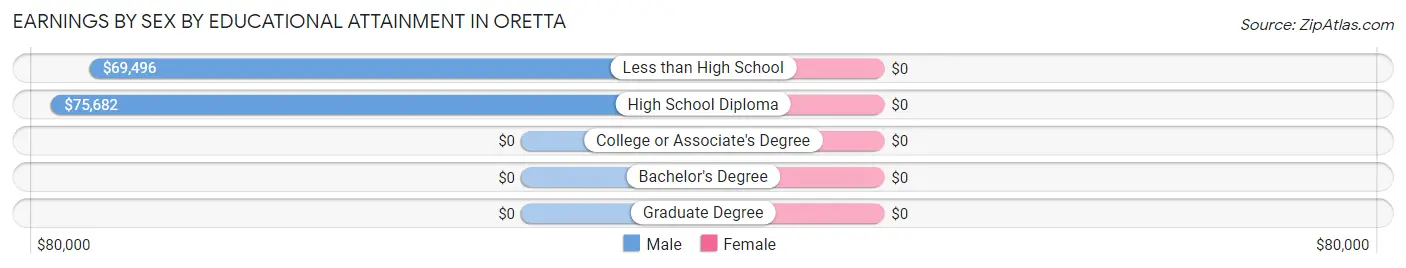
| Educational Attainment | Male Income | Female Income |
| Less than High School | $69,496 | $0 |
| High School Diploma | $75,682 | $0 |
| College or Associate's Degree | - | - |
| Bachelor's Degree | - | - |
| Graduate Degree | - | - |
| Total | $72,656 | $2,499 |
Family Income in Oretta
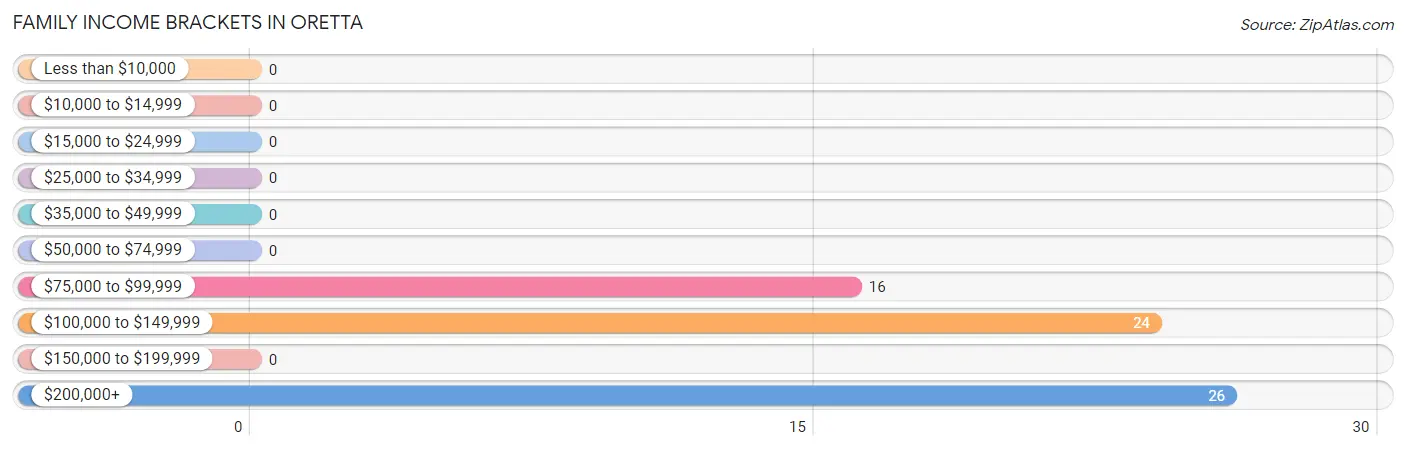
Family Income Brackets in Oretta
According to the Oretta family income data, there are 26 families falling into the $200,000+ income range, which is the most common income bracket and makes up 39.4% of all families.
| Income Bracket | # Families | % Families |
| Less than $10,000 | 0 | 0.0% |
| $10,000 to $14,999 | 0 | 0.0% |
| $15,000 to $24,999 | 0 | 0.0% |
| $25,000 to $34,999 | 0 | 0.0% |
| $35,000 to $49,999 | 0 | 0.0% |
| $50,000 to $74,999 | 0 | 0.0% |
| $75,000 to $99,999 | 16 | 24.2% |
| $100,000 to $149,999 | 24 | 36.4% |
| $150,000 to $199,999 | 0 | 0.0% |
| $200,000+ | 26 | 39.4% |
Family Income by Famaliy Size in Oretta
| Income Bracket | # Families | Median Income |
| 2-Person Families | 16 (24.2%) | $0 |
| 3-Person Families | 0 (0.0%) | $0 |
| 4-Person Families | 8 (12.1%) | $0 |
| 5-Person Families | 16 (24.2%) | $0 |
| 6-Person Families | 0 (0.0%) | $0 |
| 7+ Person Families | 26 (39.4%) | $0 |
| Total | 66 (100.0%) | $0 |
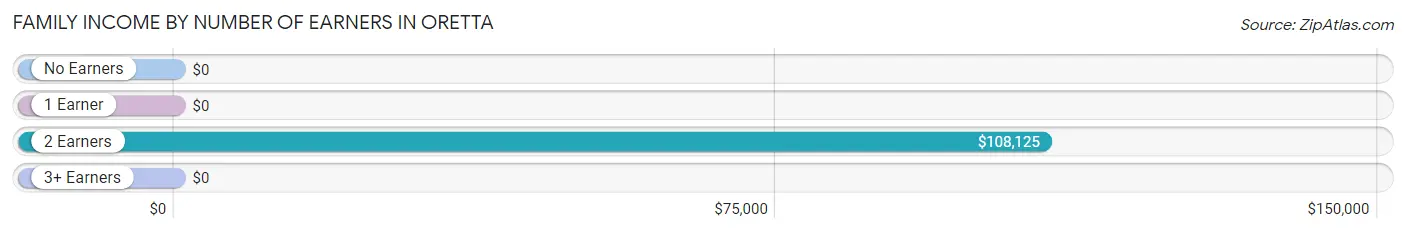
Family Income by Number of Earners in Oretta
| Number of Earners | # Families | Median Income |
| No Earners | 0 (0.0%) | $0 |
| 1 Earner | 0 (0.0%) | $0 |
| 2 Earners | 40 (60.6%) | $108,125 |
| 3+ Earners | 26 (39.4%) | $0 |
| Total | 66 (100.0%) | $0 |
Household Income in Oretta
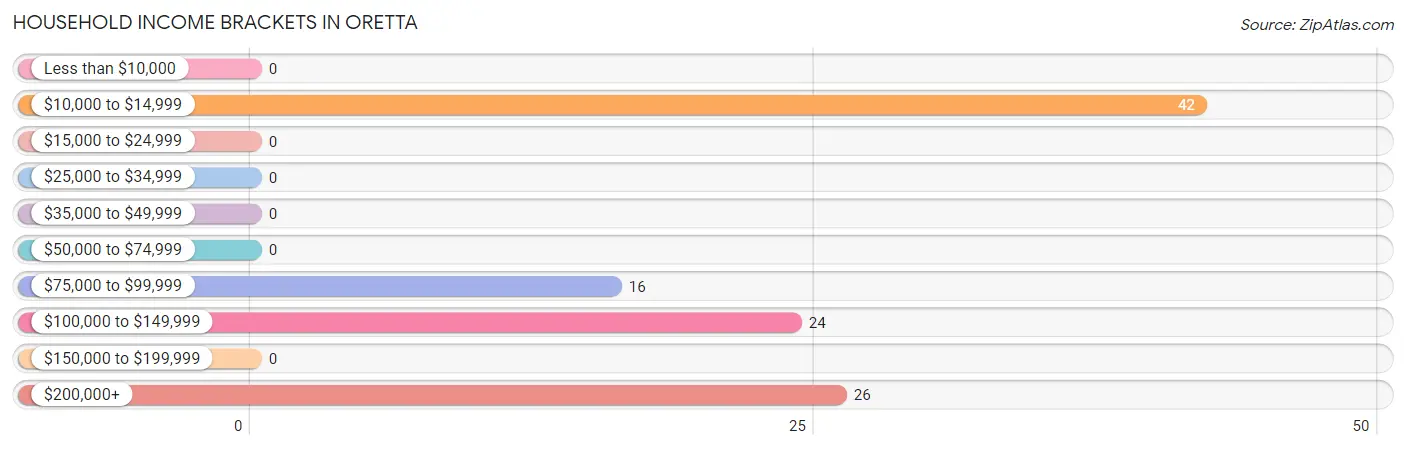
Household Income Brackets in Oretta
With 42 households falling in the category, the $10,000 to $14,999 income range is the most frequent in Oretta, accounting for 38.9% of all households.
| Income Bracket | # Households | % Households |
| Less than $10,000 | 0 | 0.0% |
| $10,000 to $14,999 | 42 | 38.9% |
| $15,000 to $24,999 | 0 | 0.0% |
| $25,000 to $34,999 | 0 | 0.0% |
| $35,000 to $49,999 | 0 | 0.0% |
| $50,000 to $74,999 | 0 | 0.0% |
| $75,000 to $99,999 | 16 | 14.8% |
| $100,000 to $149,999 | 24 | 22.2% |
| $150,000 to $199,999 | 0 | 0.0% |
| $200,000+ | 26 | 24.1% |
Household Income by Householder Age in Oretta
| Income Bracket | # Households | Median Income |
| 15 to 24 Years | 0 (0.0%) | $0 |
| 25 to 44 Years | 8 (7.4%) | $0 |
| 45 to 64 Years | 100 (92.6%) | $0 |
| 65+ Years | 0 (0.0%) | $0 |
| Total | 108 (100.0%) | $0 |
Poverty in Oretta
Income Below Poverty by Sex and Age in Oretta
With 4.8% poverty level for males and 7.1% for females among the residents of Oretta, 55 to 64 year old males and 45 to 54 year old females are the most vulnerable to poverty, with 21 males (58.3%) and 21 females (56.8%) in their respective age groups living below the poverty level.
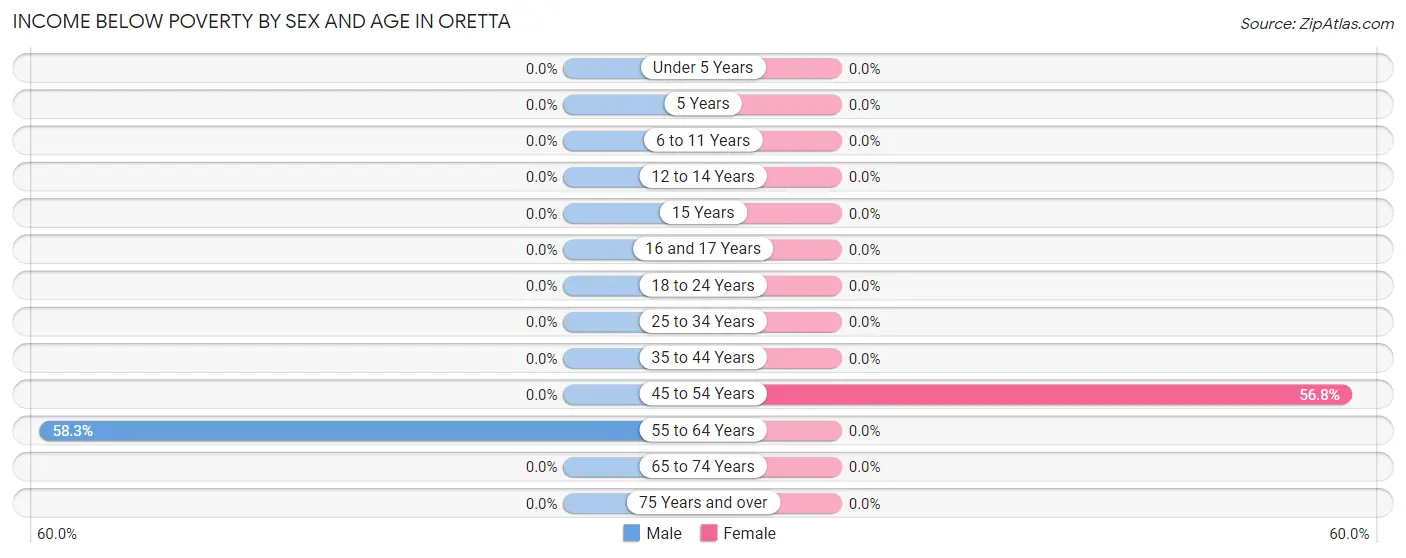
| Age Bracket | Male | Female |
| Under 5 Years | 0 (0.0%) | 0 (0.0%) |
| 5 Years | 0 (0.0%) | 0 (0.0%) |
| 6 to 11 Years | 0 (0.0%) | 0 (0.0%) |
| 12 to 14 Years | 0 (0.0%) | 0 (0.0%) |
| 15 Years | 0 (0.0%) | 0 (0.0%) |
| 16 and 17 Years | 0 (0.0%) | 0 (0.0%) |
| 18 to 24 Years | 0 (0.0%) | 0 (0.0%) |
| 25 to 34 Years | 0 (0.0%) | 0 (0.0%) |
| 35 to 44 Years | 0 (0.0%) | 0 (0.0%) |
| 45 to 54 Years | 0 (0.0%) | 21 (56.8%) |
| 55 to 64 Years | 21 (58.3%) | 0 (0.0%) |
| 65 to 74 Years | 0 (0.0%) | 0 (0.0%) |
| 75 Years and over | 0 (0.0%) | 0 (0.0%) |
| Total | 21 (4.8%) | 21 (7.1%) |
Income Above Poverty by Sex and Age in Oretta
According to the poverty statistics in Oretta, males aged under 5 years and females aged under 5 years are the age groups that are most secure financially, with 100.0% of males and 100.0% of females in these age groups living above the poverty line.
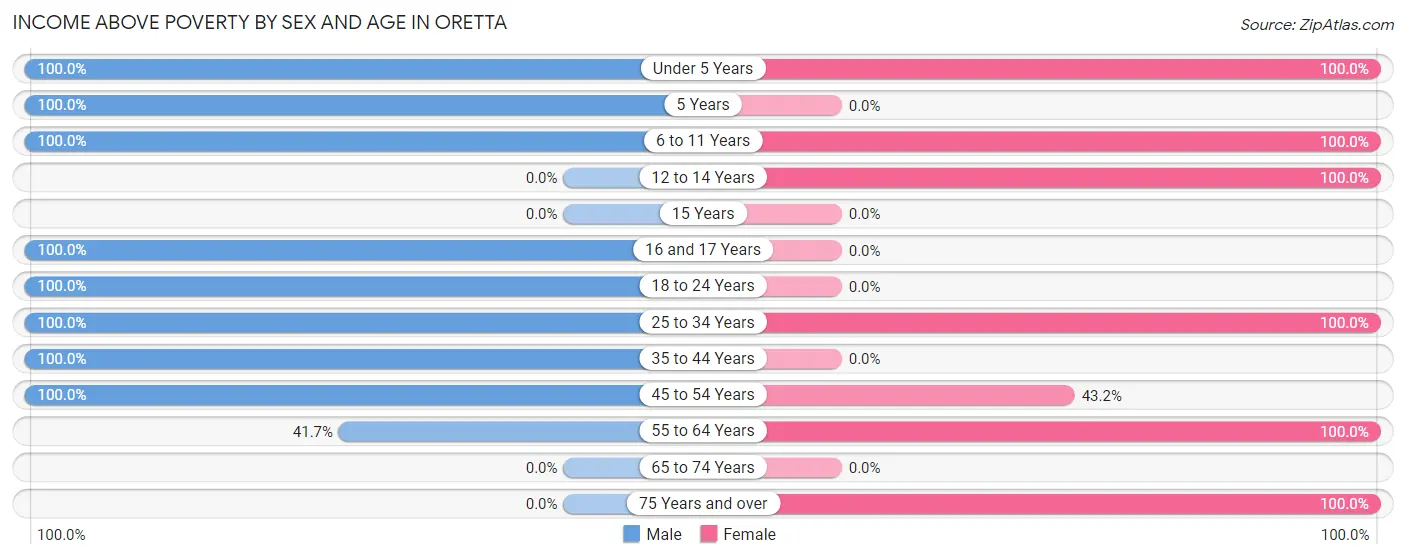
| Age Bracket | Male | Female |
| Under 5 Years | 8 (100.0%) | 9 (100.0%) |
| 5 Years | 30 (100.0%) | 0 (0.0%) |
| 6 to 11 Years | 70 (100.0%) | 77 (100.0%) |
| 12 to 14 Years | 0 (0.0%) | 19 (100.0%) |
| 15 Years | 0 (0.0%) | 0 (0.0%) |
| 16 and 17 Years | 17 (100.0%) | 0 (0.0%) |
| 18 to 24 Years | 79 (100.0%) | 0 (0.0%) |
| 25 to 34 Years | 10 (100.0%) | 92 (100.0%) |
| 35 to 44 Years | 168 (100.0%) | 0 (0.0%) |
| 45 to 54 Years | 22 (100.0%) | 16 (43.2%) |
| 55 to 64 Years | 15 (41.7%) | 42 (100.0%) |
| 65 to 74 Years | 0 (0.0%) | 0 (0.0%) |
| 75 Years and over | 0 (0.0%) | 18 (100.0%) |
| Total | 419 (95.2%) | 273 (92.9%) |
Income Below Poverty Among Married-Couple Families in Oretta
| Children | Above Poverty | Below Poverty |
| No Children | 16 (100.0%) | 0 (0.0%) |
| 1 or 2 Children | 24 (100.0%) | 0 (0.0%) |
| 3 or 4 Children | 26 (100.0%) | 0 (0.0%) |
| 5 or more Children | 0 (0.0%) | 0 (0.0%) |
| Total | 66 (100.0%) | 0 (0.0%) |
Income Below Poverty Among Single-Parent Households in Oretta
| Children | Single Father | Single Mother |
| No Children | 0 (0.0%) | 0 (0.0%) |
| 1 or 2 Children | 0 (0.0%) | 0 (0.0%) |
| 3 or 4 Children | 0 (0.0%) | 0 (0.0%) |
| 5 or more Children | 0 (0.0%) | 0 (0.0%) |
| Total | 0 (0.0%) | 0 (0.0%) |
Income Below Poverty Among Married-Couple vs Single-Parent Households in Oretta
| Children | Married-Couple Families | Single-Parent Households |
| No Children | 0 (0.0%) | 0 (0.0%) |
| 1 or 2 Children | 0 (0.0%) | 0 (0.0%) |
| 3 or 4 Children | 0 (0.0%) | 0 (0.0%) |
| 5 or more Children | 0 (0.0%) | 0 (0.0%) |
| Total | 0 (0.0%) | 0 (0.0%) |
Race in Oretta
The most populous races in Oretta are , and White / Caucasian (734 | 100.0%).
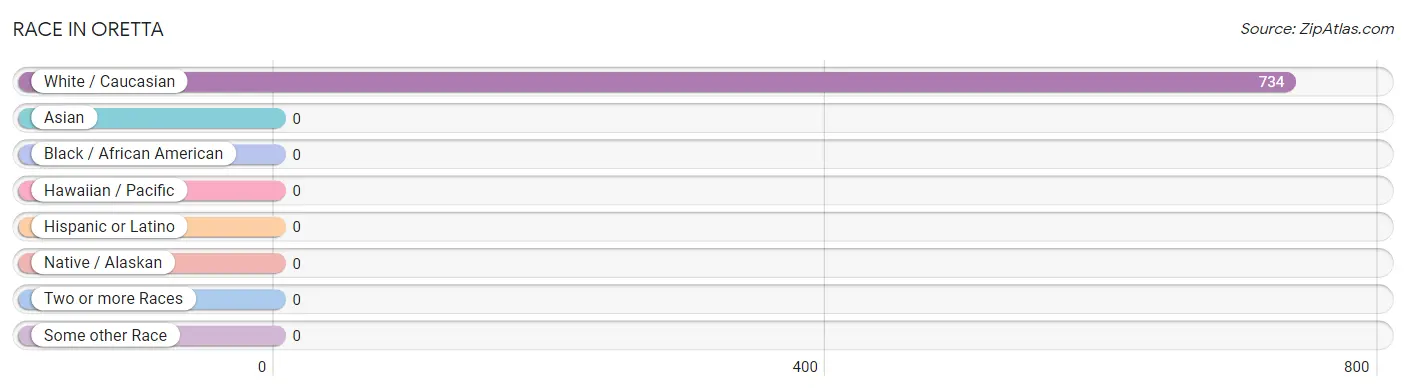
| Race | # Population | % Population |
| Asian | 0 | 0.0% |
| Black / African American | 0 | 0.0% |
| Hawaiian / Pacific | 0 | 0.0% |
| Hispanic or Latino | 0 | 0.0% |
| Native / Alaskan | 0 | 0.0% |
| White / Caucasian | 734 | 100.0% |
| Two or more Races | 0 | 0.0% |
| Some other Race | 0 | 0.0% |
| Total | 734 | 100.0% |
Ancestry in Oretta
The most populous ancestries reported in Oretta are German (136 | 18.5%), Irish (128 | 17.4%), French (111 | 15.1%), English (101 | 13.8%), and Romanian (49 | 6.7%), together accounting for 71.5% of all Oretta residents.
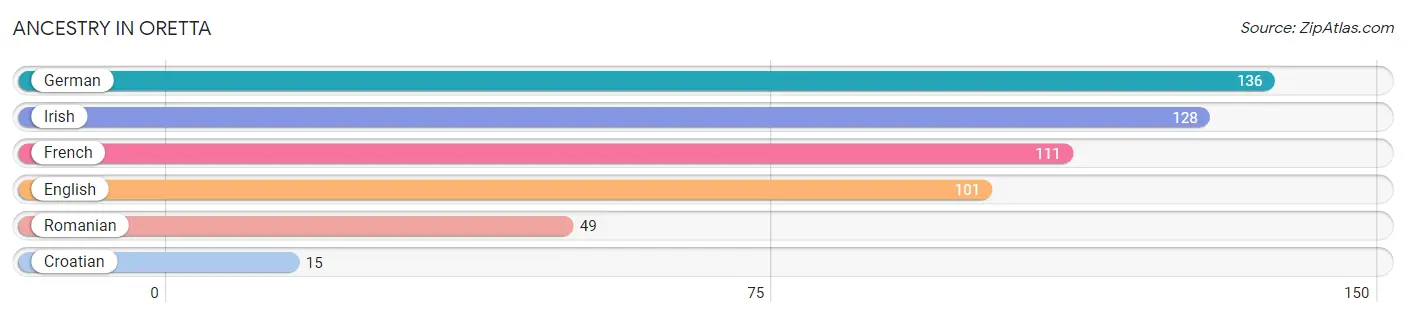
| Ancestry | # Population | % Population |
| Croatian | 15 | 2.0% |
| English | 101 | 13.8% |
| French | 111 | 15.1% |
| German | 136 | 18.5% |
| Irish | 128 | 17.4% |
| Romanian | 49 | 6.7% | View All 6 Rows |
Immigrants in Oretta

| Immigration Origin | # Population | % Population | View All 0 Rows |
Sex and Age in Oretta
Sex and Age in Oretta
The most populous age groups in Oretta are 40 to 44 Years (113 | 25.7%) for men and 30 to 34 Years (92 | 31.3%) for women.
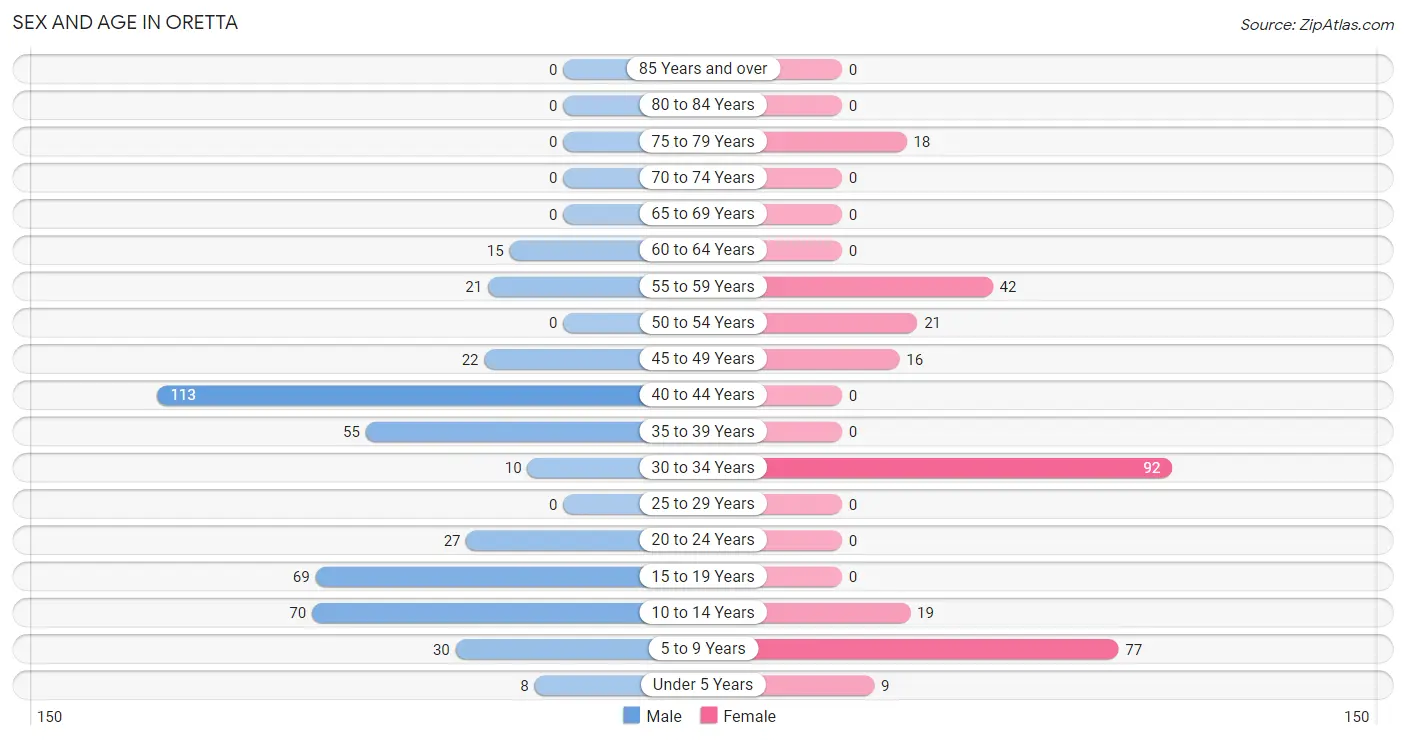
| Age Bracket | Male | Female |
| Under 5 Years | 8 (1.8%) | 9 (3.1%) |
| 5 to 9 Years | 30 (6.8%) | 77 (26.2%) |
| 10 to 14 Years | 70 (15.9%) | 19 (6.5%) |
| 15 to 19 Years | 69 (15.7%) | 0 (0.0%) |
| 20 to 24 Years | 27 (6.1%) | 0 (0.0%) |
| 25 to 29 Years | 0 (0.0%) | 0 (0.0%) |
| 30 to 34 Years | 10 (2.3%) | 92 (31.3%) |
| 35 to 39 Years | 55 (12.5%) | 0 (0.0%) |
| 40 to 44 Years | 113 (25.7%) | 0 (0.0%) |
| 45 to 49 Years | 22 (5.0%) | 16 (5.4%) |
| 50 to 54 Years | 0 (0.0%) | 21 (7.1%) |
| 55 to 59 Years | 21 (4.8%) | 42 (14.3%) |
| 60 to 64 Years | 15 (3.4%) | 0 (0.0%) |
| 65 to 69 Years | 0 (0.0%) | 0 (0.0%) |
| 70 to 74 Years | 0 (0.0%) | 0 (0.0%) |
| 75 to 79 Years | 0 (0.0%) | 18 (6.1%) |
| 80 to 84 Years | 0 (0.0%) | 0 (0.0%) |
| 85 Years and over | 0 (0.0%) | 0 (0.0%) |
| Total | 440 (100.0%) | 294 (100.0%) |
Families and Households in Oretta
Median Family Size in Oretta
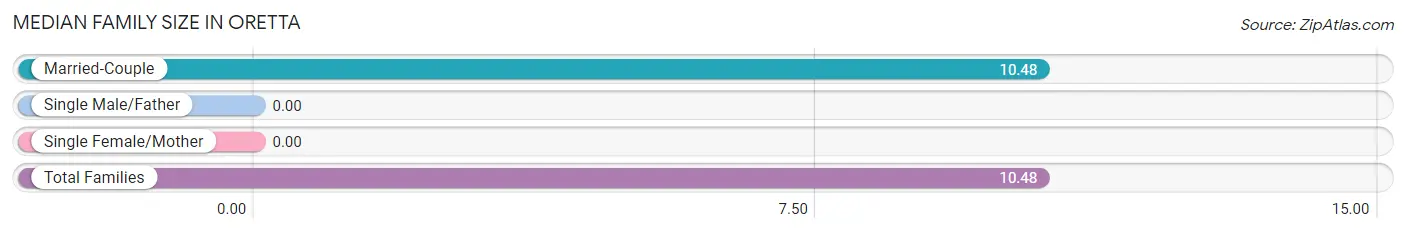
| Family Type | # Families | Family Size |
| Married-Couple | 66 (100.0%) | 10.48 |
| Single Male/Father | 0 (0.0%) | - |
| Single Female/Mother | 0 (0.0%) | - |
| Total Families | 66 (100.0%) | 10.48 |
Median Household Size in Oretta
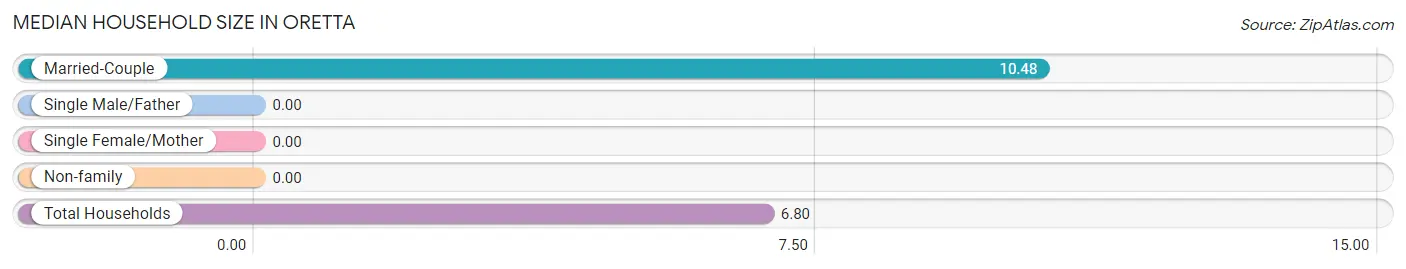
| Household Type | # Households | Household Size |
| Married-Couple | 66 (61.1%) | 10.48 |
| Single Male/Father | 0 (0.0%) | - |
| Single Female/Mother | 0 (0.0%) | - |
| Non-family | 42 (38.9%) | - |
| Total Households | 108 (100.0%) | 6.80 |
Household Size by Marriage Status in Oretta
Out of a total of 108 households in Oretta, 66 (61.1%) are family households, while 42 (38.9%) are nonfamily households. The most numerous type of family households are 7+ person households, comprising 26, and the most common type of nonfamily households are 1-person households, comprising 42.
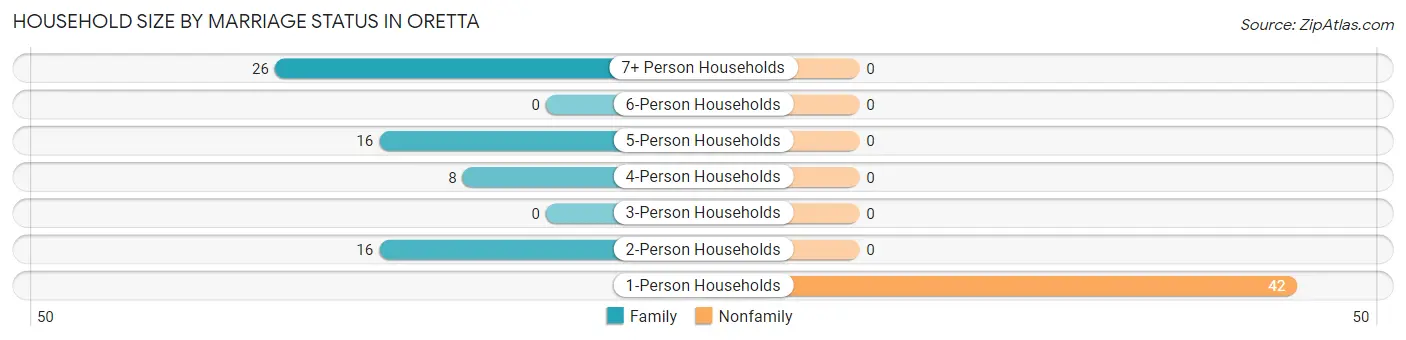
| Household Size | Family Households | Nonfamily Households |
| 1-Person Households | - | 42 (38.9%) |
| 2-Person Households | 16 (14.8%) | 0 (0.0%) |
| 3-Person Households | 0 (0.0%) | 0 (0.0%) |
| 4-Person Households | 8 (7.4%) | 0 (0.0%) |
| 5-Person Households | 16 (14.8%) | 0 (0.0%) |
| 6-Person Households | 0 (0.0%) | 0 (0.0%) |
| 7+ Person Households | 26 (24.1%) | 0 (0.0%) |
| Total | 66 (61.1%) | 42 (38.9%) |
Female Fertility in Oretta
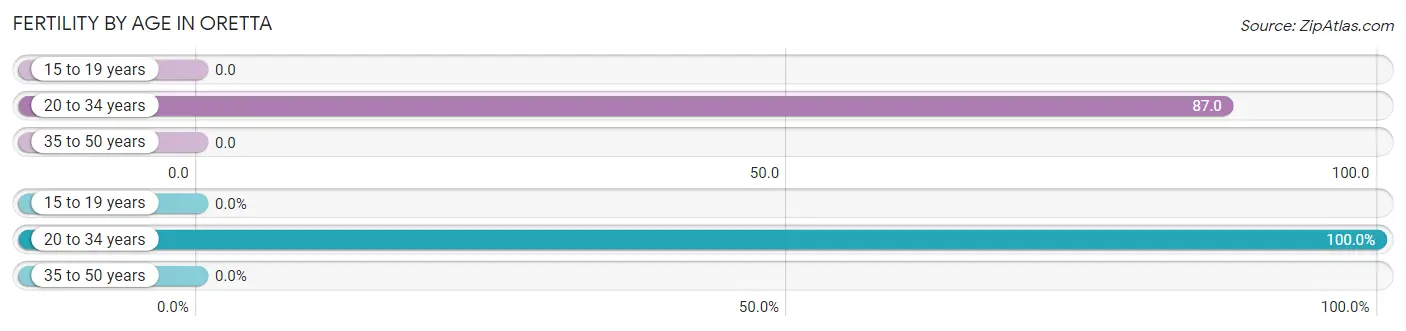
Fertility by Age in Oretta
Average fertility rate in Oretta is 74.0 births per 1,000 women. Women in the age bracket of 20 to 34 years have the highest fertility rate with 87.0 births per 1,000 women. Women in the age bracket of 20 to 34 years acount for 100.0% of all women with births.
| Age Bracket | Women with Births | Births / 1,000 Women |
| 15 to 19 years | 0 (0.0%) | 0.0 |
| 20 to 34 years | 8 (100.0%) | 87.0 |
| 35 to 50 years | 0 (0.0%) | 0.0 |
| Total | 8 (100.0%) | 74.0 |
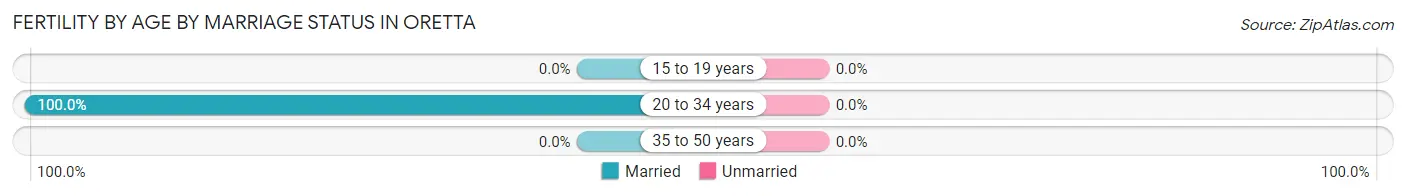
Fertility by Age by Marriage Status in Oretta
| Age Bracket | Married | Unmarried |
| 15 to 19 years | 0 (0.0%) | 0 (0.0%) |
| 20 to 34 years | 8 (100.0%) | 0 (0.0%) |
| 35 to 50 years | 0 (0.0%) | 0 (0.0%) |
| Total | 8 (100.0%) | 0 (0.0%) |
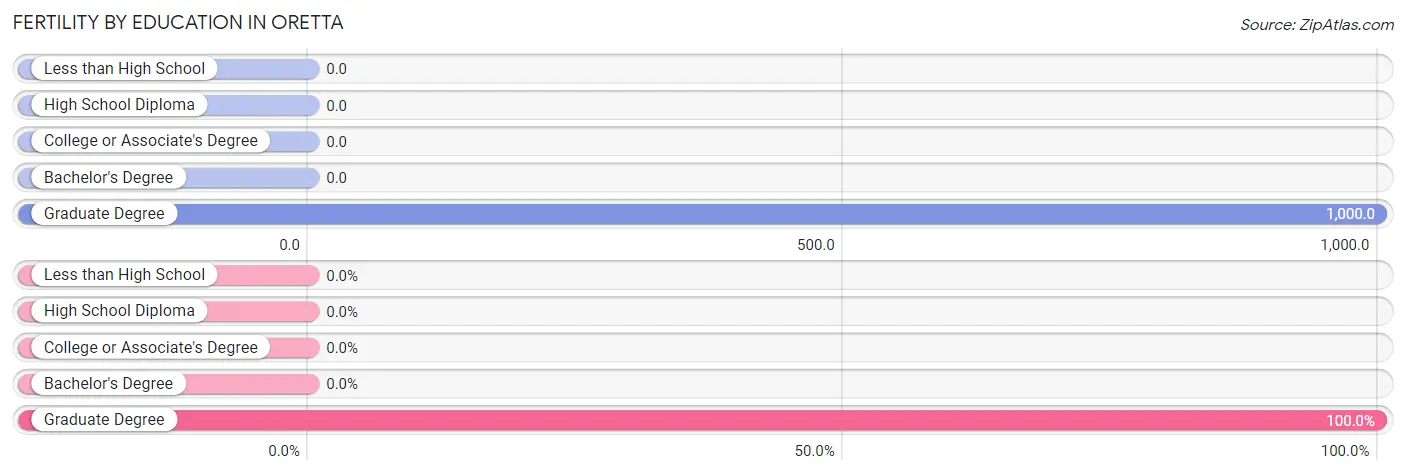
Fertility by Education in Oretta
| Educational Attainment | Women with Births | Births / 1,000 Women |
| Less than High School | 0 (0.0%) | 0.0 |
| High School Diploma | 0 (0.0%) | 0.0 |
| College or Associate's Degree | 0 (0.0%) | 0.0 |
| Bachelor's Degree | 0 (0.0%) | 0.0 |
| Graduate Degree | 8 (100.0%) | 1,000.0 |
| Total | 8 (100.0%) | 74.0 |
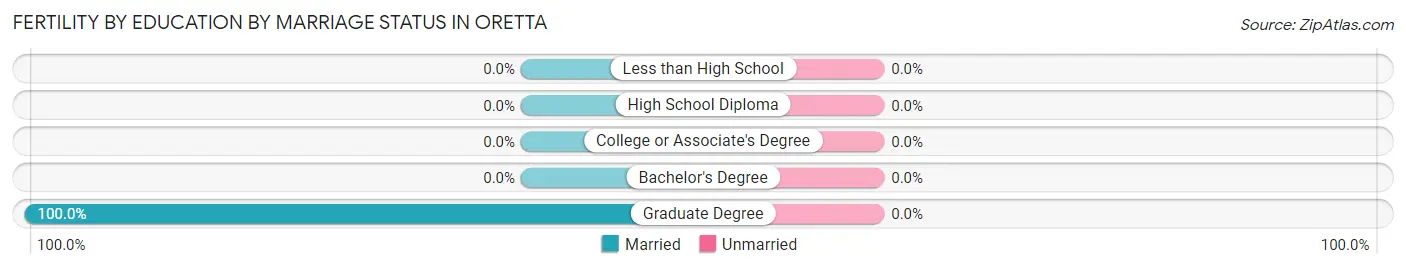
Fertility by Education by Marriage Status in Oretta
| Educational Attainment | Married | Unmarried |
| Less than High School | 0 (0.0%) | 0 (0.0%) |
| High School Diploma | 0 (0.0%) | 0 (0.0%) |
| College or Associate's Degree | 0 (0.0%) | 0 (0.0%) |
| Bachelor's Degree | 0 (0.0%) | 0 (0.0%) |
| Graduate Degree | 8 (100.0%) | 0 (0.0%) |
| Total | 8 (100.0%) | 0 (0.0%) |
Employment Characteristics in Oretta
Employment by Class of Employer in Oretta
Among the 239 employed individuals in Oretta, , and private company employees (239 | 100.0%) make up the most common classes of employment.
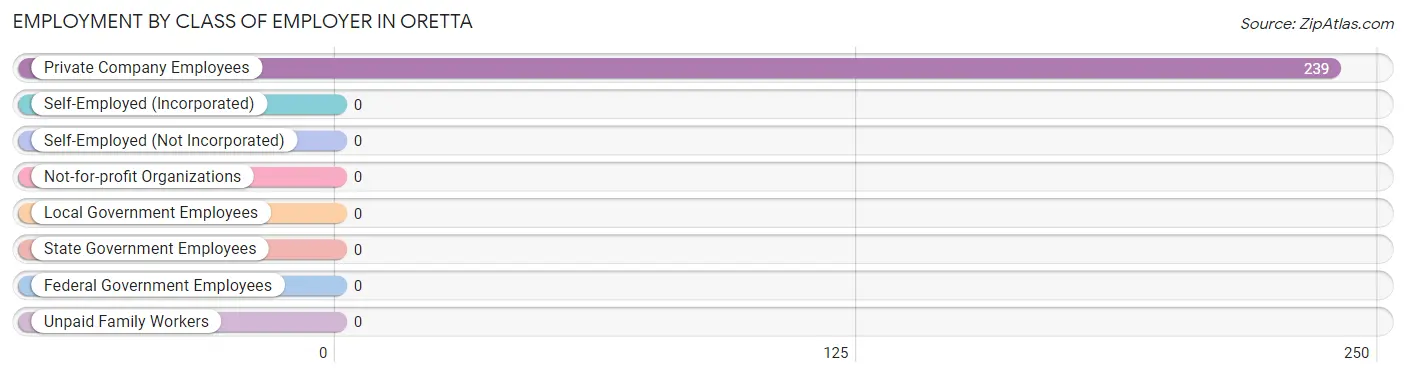
| Employer Class | # Employees | % Employees |
| Private Company Employees | 239 | 100.0% |
| Self-Employed (Incorporated) | 0 | 0.0% |
| Self-Employed (Not Incorporated) | 0 | 0.0% |
| Not-for-profit Organizations | 0 | 0.0% |
| Local Government Employees | 0 | 0.0% |
| State Government Employees | 0 | 0.0% |
| Federal Government Employees | 0 | 0.0% |
| Unpaid Family Workers | 0 | 0.0% |
| Total | 239 | 100.0% |
Employment Status by Age in Oretta
According to the labor force statistics for Oretta, out of the total population over 16 years of age (521), 51.1% or 266 individuals are in the labor force, with 10.2% or 27 of them unemployed. The age group with the highest labor force participation rate is 20 to 24 years, with 100.0% or 27 individuals in the labor force. Within the labor force, the 20 to 24 years age range has the highest percentage of unemployed individuals, with 100.0% or 27 of them being unemployed.
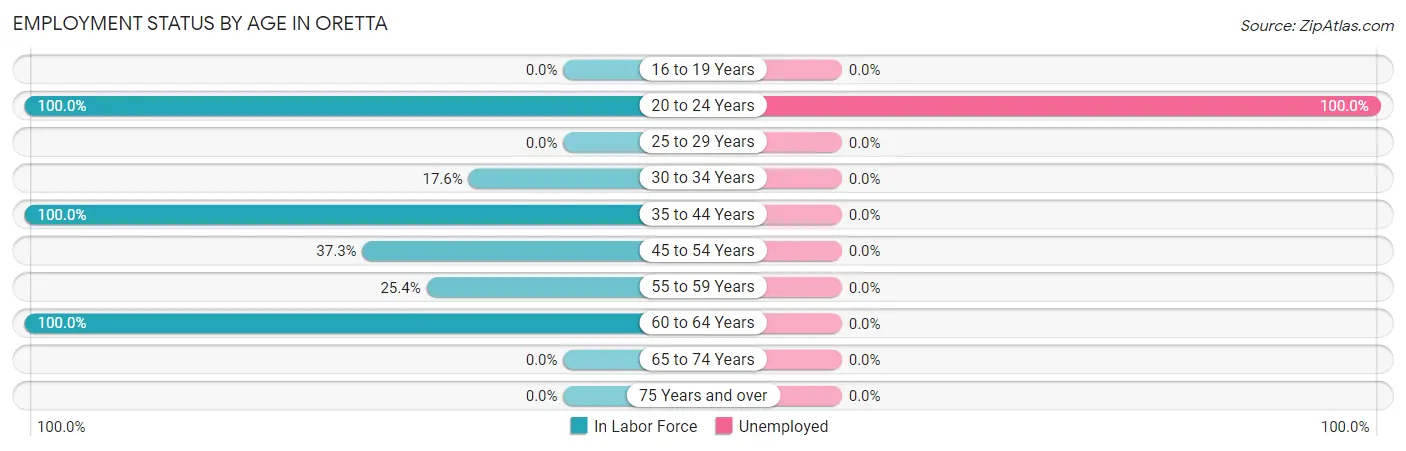
| Age Bracket | In Labor Force | Unemployed |
| 16 to 19 Years | 0 (0.0%) | 0 (0.0%) |
| 20 to 24 Years | 27 (100.0%) | 27 (100.0%) |
| 25 to 29 Years | 0 (0.0%) | 0 (0.0%) |
| 30 to 34 Years | 18 (17.6%) | 0 (0.0%) |
| 35 to 44 Years | 168 (100.0%) | 0 (0.0%) |
| 45 to 54 Years | 22 (37.3%) | 0 (0.0%) |
| 55 to 59 Years | 16 (25.4%) | 0 (0.0%) |
| 60 to 64 Years | 15 (100.0%) | 0 (0.0%) |
| 65 to 74 Years | 0 (0.0%) | 0 (0.0%) |
| 75 Years and over | 0 (0.0%) | 0 (0.0%) |
| Total | 266 (51.1%) | 27 (10.2%) |
Employment Status by Educational Attainment in Oretta
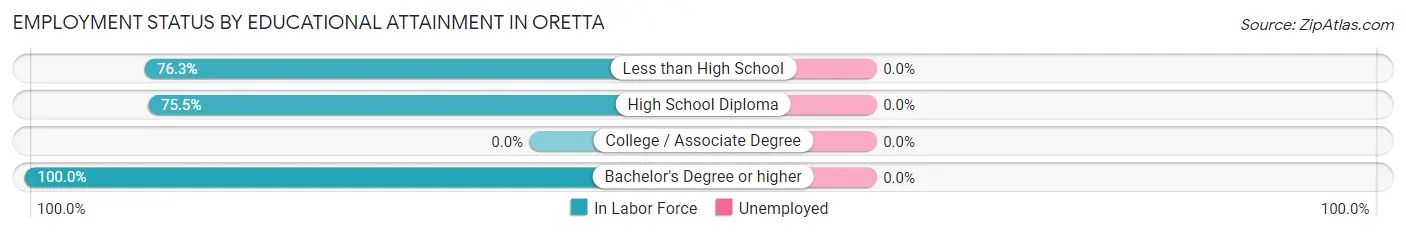
| Educational Attainment | In Labor Force | Unemployed |
| Less than High School | 135 (76.3%) | 0 (0.0%) |
| High School Diploma | 80 (75.5%) | 0 (0.0%) |
| College / Associate Degree | 0 (0.0%) | 0 (0.0%) |
| Bachelor's Degree or higher | 24 (100.0%) | 0 (0.0%) |
| Total | 239 (58.7%) | 0 (0.0%) |
Employment Occupations by Sex in Oretta
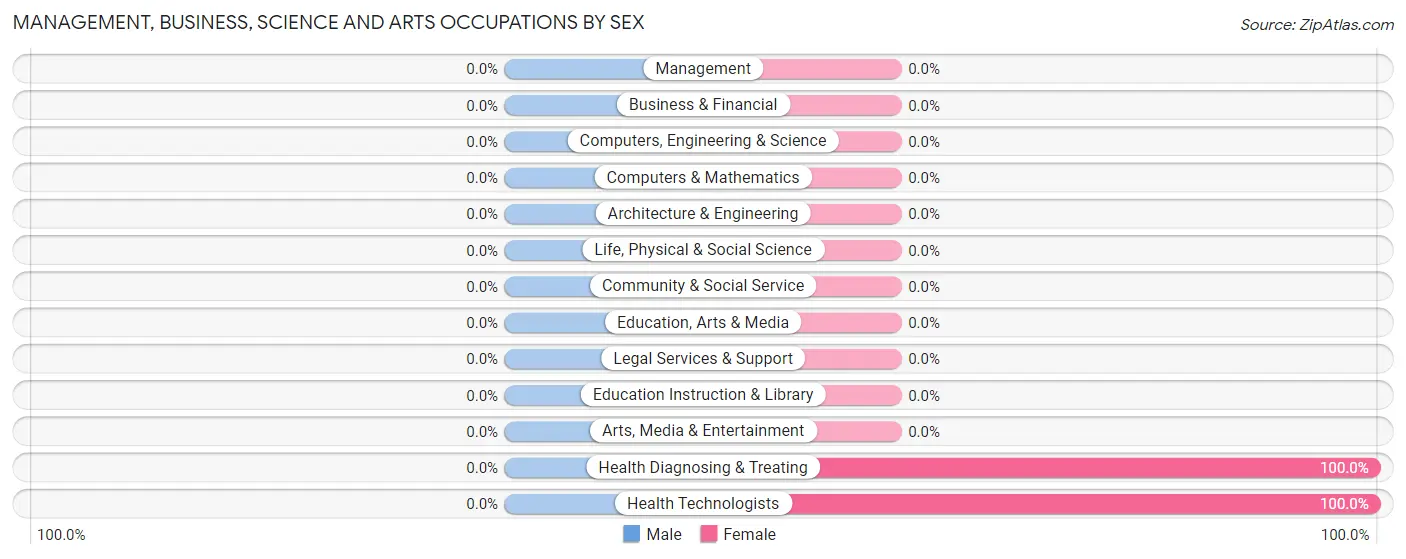
Management, Business, Science and Arts Occupations
The most common Management, Business, Science and Arts occupations in Oretta are Health Diagnosing & Treating (8 | 3.4%), and Health Technologists (8 | 3.4%).
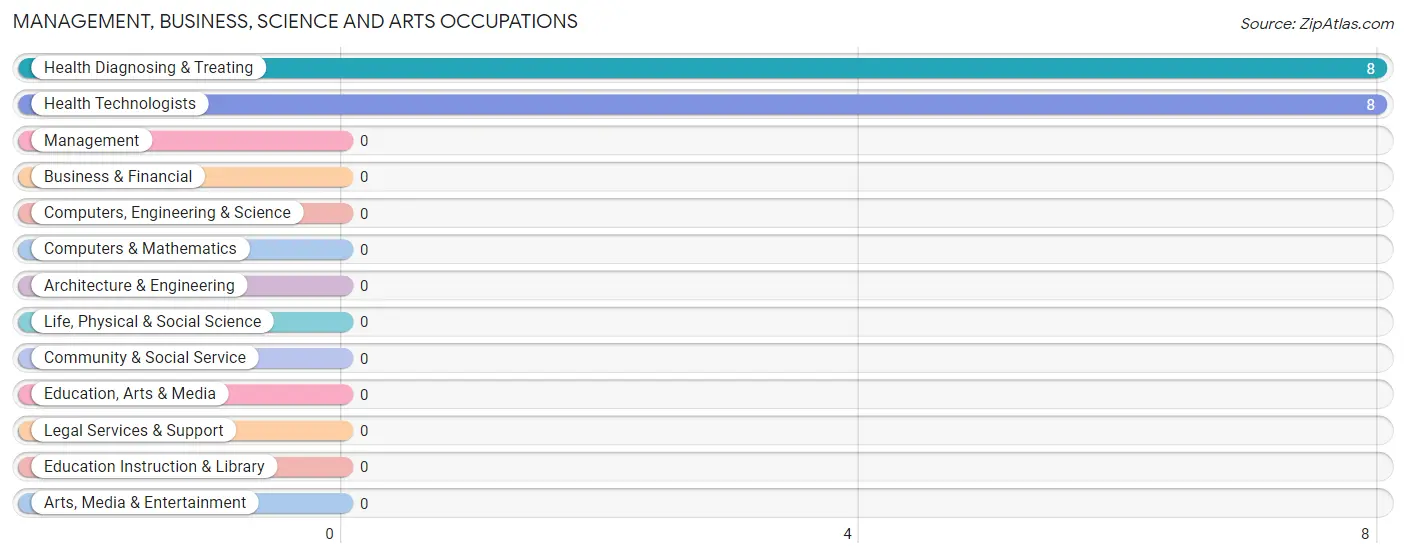
Management, Business, Science and Arts Occupations by Sex
| Occupation | Male | Female |
| Management | 0 (0.0%) | 0 (0.0%) |
| Business & Financial | 0 (0.0%) | 0 (0.0%) |
| Computers, Engineering & Science | 0 (0.0%) | 0 (0.0%) |
| Computers & Mathematics | 0 (0.0%) | 0 (0.0%) |
| Architecture & Engineering | 0 (0.0%) | 0 (0.0%) |
| Life, Physical & Social Science | 0 (0.0%) | 0 (0.0%) |
| Community & Social Service | 0 (0.0%) | 0 (0.0%) |
| Education, Arts & Media | 0 (0.0%) | 0 (0.0%) |
| Legal Services & Support | 0 (0.0%) | 0 (0.0%) |
| Education Instruction & Library | 0 (0.0%) | 0 (0.0%) |
| Arts, Media & Entertainment | 0 (0.0%) | 0 (0.0%) |
| Health Diagnosing & Treating | 0 (0.0%) | 8 (100.0%) |
| Health Technologists | 0 (0.0%) | 8 (100.0%) |
| Total (Category) | 0 (0.0%) | 8 (100.0%) |
| Total (Overall) | 215 (90.0%) | 24 (10.0%) |
Services Occupations
Services Occupations by Sex
| Occupation | Male | Female |
| Healthcare Support | 0 (0.0%) | 0 (0.0%) |
| Security & Protection | 0 (0.0%) | 0 (0.0%) |
| Firefighting & Prevention | 0 (0.0%) | 0 (0.0%) |
| Law Enforcement | 0 (0.0%) | 0 (0.0%) |
| Food Preparation & Serving | 0 (0.0%) | 0 (0.0%) |
| Cleaning & Maintenance | 0 (0.0%) | 0 (0.0%) |
| Personal Care & Service | 0 (0.0%) | 0 (0.0%) |
| Total (Category) | 0 (0.0%) | 0 (0.0%) |
| Total (Overall) | 215 (90.0%) | 24 (10.0%) |
Sales and Office Occupations
Sales and Office Occupations by Sex
| Occupation | Male | Female |
| Sales & Related | 0 (0.0%) | 0 (0.0%) |
| Office & Administration | 0 (0.0%) | 0 (0.0%) |
| Total (Category) | 0 (0.0%) | 0 (0.0%) |
| Total (Overall) | 215 (90.0%) | 24 (10.0%) |
Natural Resources, Construction and Maintenance Occupations
The most common Natural Resources, Construction and Maintenance occupations in Oretta are Installation, Maintenance & Repair (55 | 23.0%), and Construction & Extraction (37 | 15.5%).
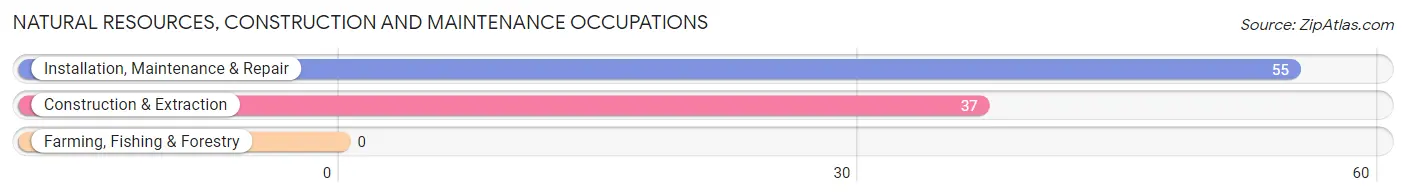
Natural Resources, Construction and Maintenance Occupations by Sex
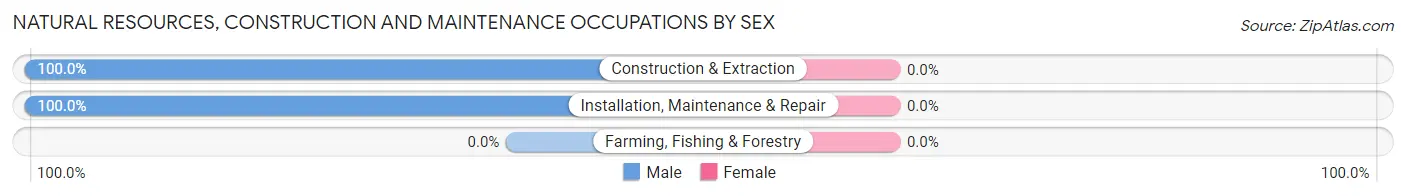
| Occupation | Male | Female |
| Farming, Fishing & Forestry | 0 (0.0%) | 0 (0.0%) |
| Construction & Extraction | 37 (100.0%) | 0 (0.0%) |
| Installation, Maintenance & Repair | 55 (100.0%) | 0 (0.0%) |
| Total (Category) | 92 (100.0%) | 0 (0.0%) |
| Total (Overall) | 215 (90.0%) | 24 (10.0%) |
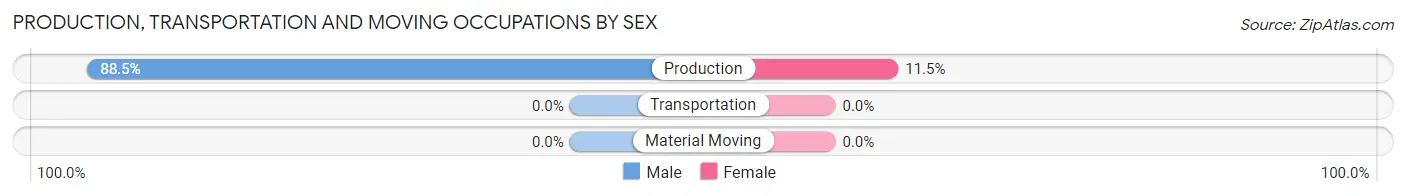
Production, Transportation and Moving Occupations
The most common Production, Transportation and Moving occupations in Oretta are , and Production (139 | 58.2%).
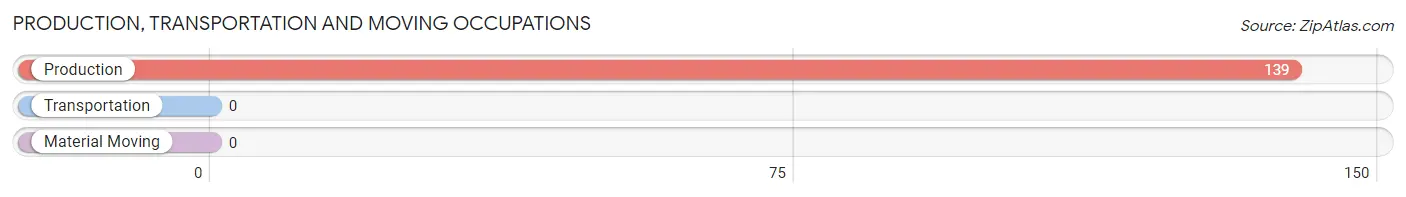
Production, Transportation and Moving Occupations by Sex
| Occupation | Male | Female |
| Production | 123 (88.5%) | 16 (11.5%) |
| Transportation | 0 (0.0%) | 0 (0.0%) |
| Material Moving | 0 (0.0%) | 0 (0.0%) |
| Total (Category) | 123 (88.5%) | 16 (11.5%) |
| Total (Overall) | 215 (90.0%) | 24 (10.0%) |
Employment Industries by Sex in Oretta
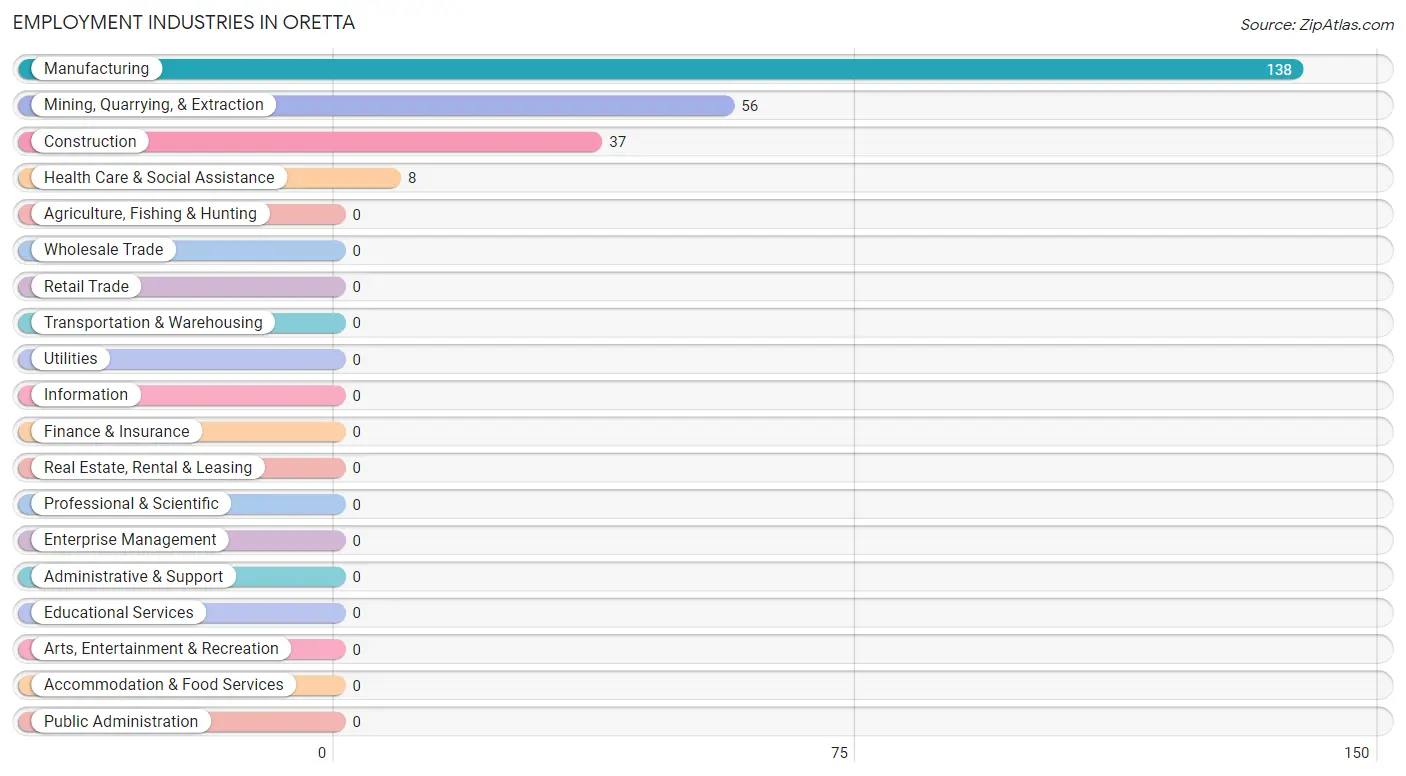
Employment Industries in Oretta
The major employment industries in Oretta include Manufacturing (138 | 57.7%), Mining, Quarrying, & Extraction (56 | 23.4%), Construction (37 | 15.5%), and Health Care & Social Assistance (8 | 3.4%).
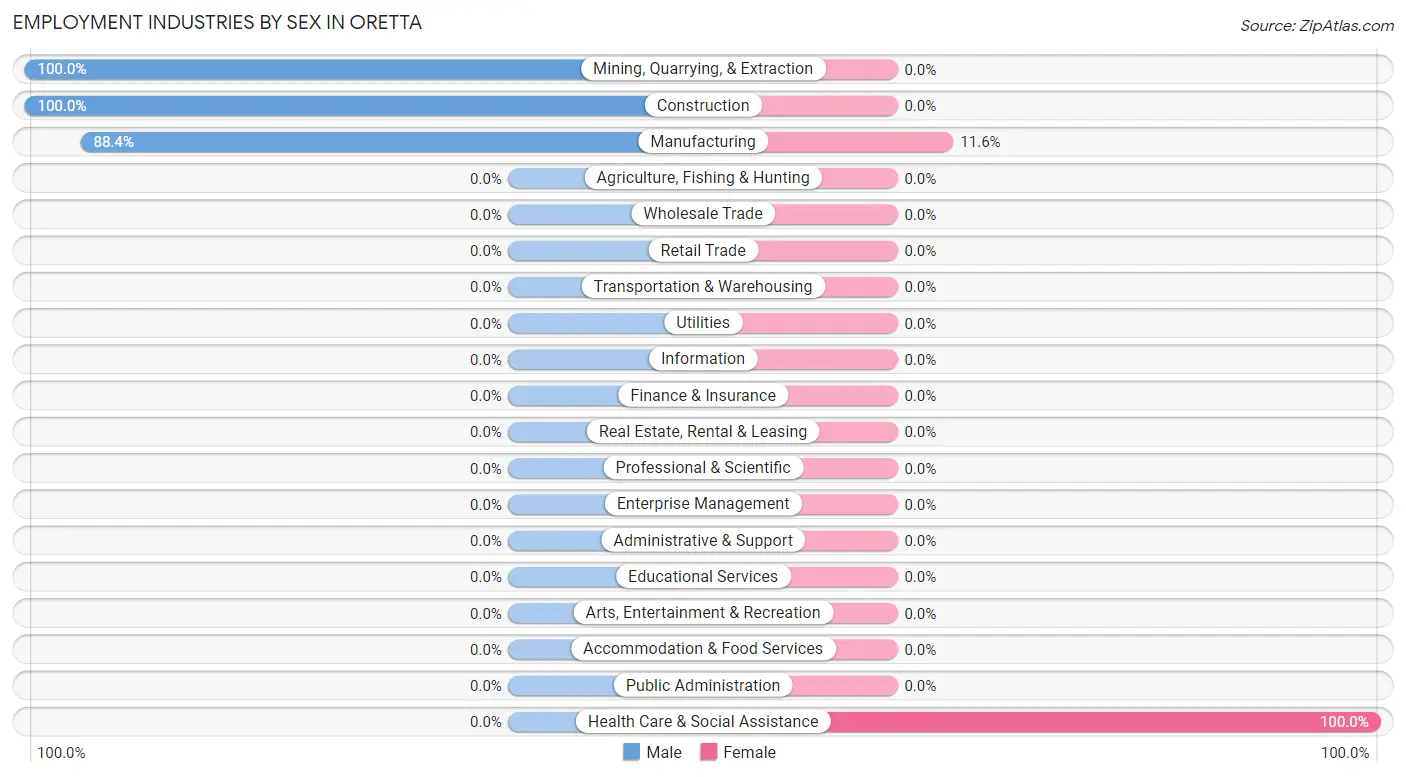
Employment Industries by Sex in Oretta
The Oretta industries that see more men than women are Mining, Quarrying, & Extraction (100.0%), Construction (100.0%), and Manufacturing (88.4%), whereas the industries that tend to have a higher number of women are Health Care & Social Assistance (100.0%), and Manufacturing (11.6%).
| Industry | Male | Female |
| Agriculture, Fishing & Hunting | 0 (0.0%) | 0 (0.0%) |
| Mining, Quarrying, & Extraction | 56 (100.0%) | 0 (0.0%) |
| Construction | 37 (100.0%) | 0 (0.0%) |
| Manufacturing | 122 (88.4%) | 16 (11.6%) |
| Wholesale Trade | 0 (0.0%) | 0 (0.0%) |
| Retail Trade | 0 (0.0%) | 0 (0.0%) |
| Transportation & Warehousing | 0 (0.0%) | 0 (0.0%) |
| Utilities | 0 (0.0%) | 0 (0.0%) |
| Information | 0 (0.0%) | 0 (0.0%) |
| Finance & Insurance | 0 (0.0%) | 0 (0.0%) |
| Real Estate, Rental & Leasing | 0 (0.0%) | 0 (0.0%) |
| Professional & Scientific | 0 (0.0%) | 0 (0.0%) |
| Enterprise Management | 0 (0.0%) | 0 (0.0%) |
| Administrative & Support | 0 (0.0%) | 0 (0.0%) |
| Educational Services | 0 (0.0%) | 0 (0.0%) |
| Health Care & Social Assistance | 0 (0.0%) | 8 (100.0%) |
| Arts, Entertainment & Recreation | 0 (0.0%) | 0 (0.0%) |
| Accommodation & Food Services | 0 (0.0%) | 0 (0.0%) |
| Public Administration | 0 (0.0%) | 0 (0.0%) |
| Total | 215 (90.0%) | 24 (10.0%) |
Education in Oretta
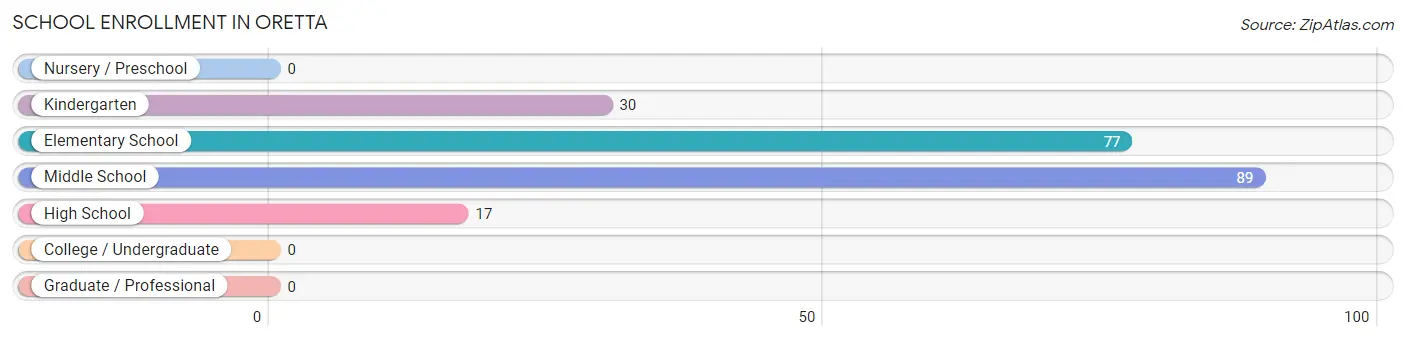
School Enrollment in Oretta
The most common levels of schooling among the 213 students in Oretta are middle school (89 | 41.8%), elementary school (77 | 36.1%), and kindergarten (30 | 14.1%).
| School Level | # Students | % Students |
| Nursery / Preschool | 0 | 0.0% |
| Kindergarten | 30 | 14.1% |
| Elementary School | 77 | 36.1% |
| Middle School | 89 | 41.8% |
| High School | 17 | 8.0% |
| College / Undergraduate | 0 | 0.0% |
| Graduate / Professional | 0 | 0.0% |
| Total | 213 | 100.0% |
School Enrollment by Age by Funding Source in Oretta
Out of a total of 213 students who are enrolled in schools in Oretta, 36 (16.9%) attend a private institution, while the remaining 177 (83.1%) are enrolled in public schools. The age group of 15 to 17 year olds has the highest likelihood of being enrolled in private schools, with 17 (100.0% in the age bracket) enrolled. Conversely, the age group of 5 to 9 year old has the lowest likelihood of being enrolled in a private school, with 107 (100.0% in the age bracket) attending a public institution.
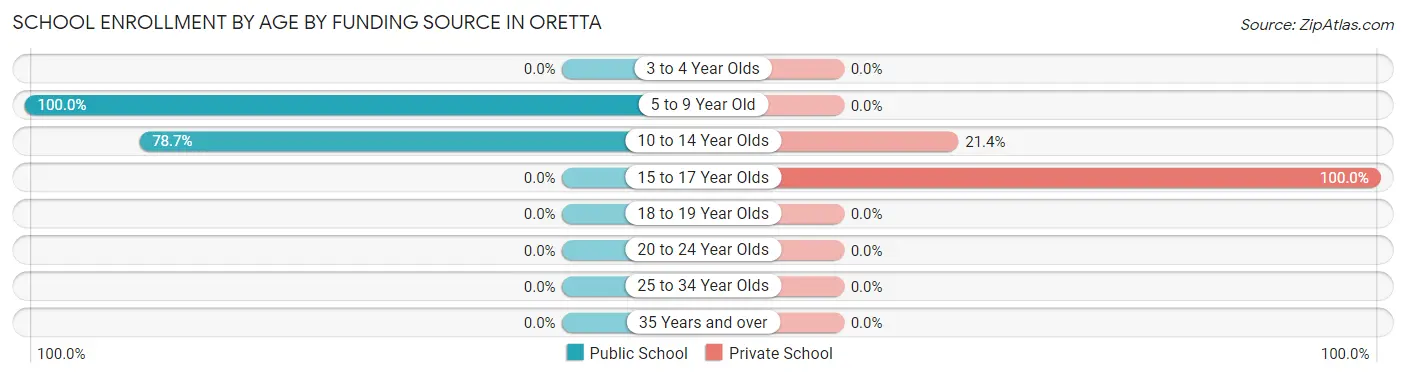
| Age Bracket | Public School | Private School |
| 3 to 4 Year Olds | 0 (0.0%) | 0 (0.0%) |
| 5 to 9 Year Old | 107 (100.0%) | 0 (0.0%) |
| 10 to 14 Year Olds | 70 (78.6%) | 19 (21.3%) |
| 15 to 17 Year Olds | 0 (0.0%) | 17 (100.0%) |
| 18 to 19 Year Olds | 0 (0.0%) | 0 (0.0%) |
| 20 to 24 Year Olds | 0 (0.0%) | 0 (0.0%) |
| 25 to 34 Year Olds | 0 (0.0%) | 0 (0.0%) |
| 35 Years and over | 0 (0.0%) | 0 (0.0%) |
| Total | 177 (83.1%) | 36 (16.9%) |
Educational Attainment by Field of Study in Oretta
Liberal arts & history (16 | 50.0%), science & technology (8 | 25.0%), and arts & humanities (8 | 25.0%) are the most common fields of study among 32 individuals in Oretta who have obtained a bachelor's degree or higher.
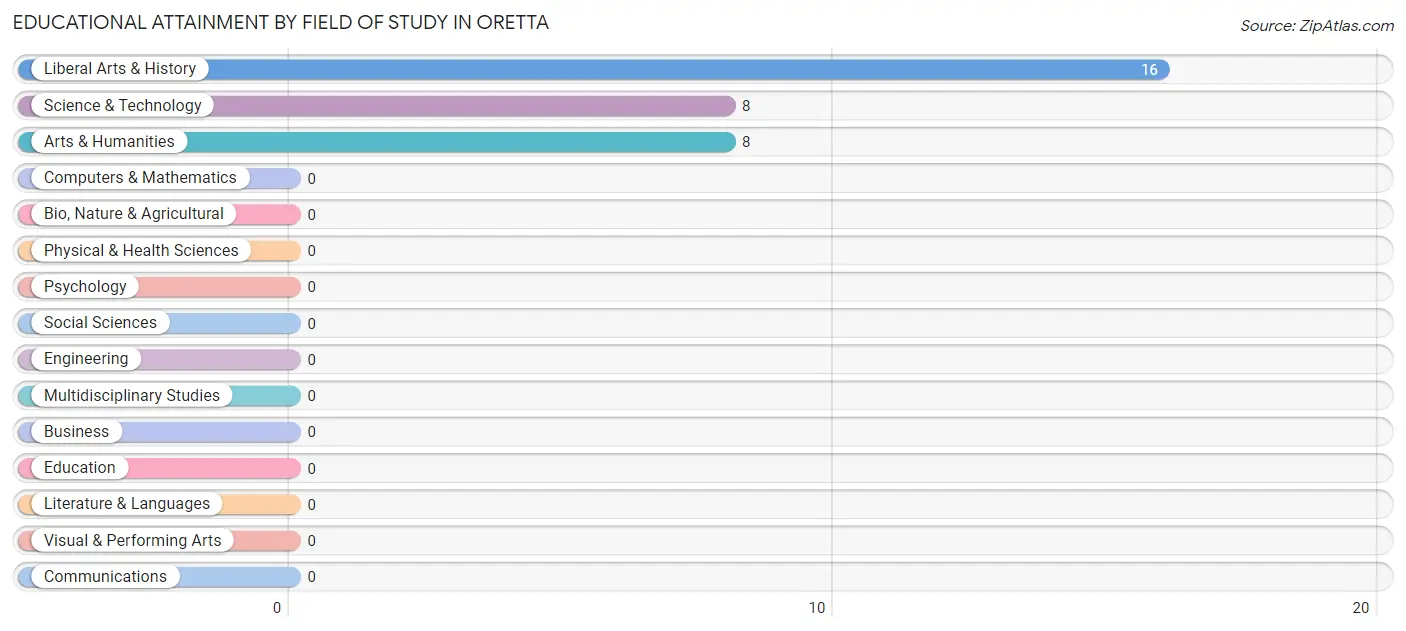
| Field of Study | # Graduates | % Graduates |
| Computers & Mathematics | 0 | 0.0% |
| Bio, Nature & Agricultural | 0 | 0.0% |
| Physical & Health Sciences | 0 | 0.0% |
| Psychology | 0 | 0.0% |
| Social Sciences | 0 | 0.0% |
| Engineering | 0 | 0.0% |
| Multidisciplinary Studies | 0 | 0.0% |
| Science & Technology | 8 | 25.0% |
| Business | 0 | 0.0% |
| Education | 0 | 0.0% |
| Literature & Languages | 0 | 0.0% |
| Liberal Arts & History | 16 | 50.0% |
| Visual & Performing Arts | 0 | 0.0% |
| Communications | 0 | 0.0% |
| Arts & Humanities | 8 | 25.0% |
| Total | 32 | 100.0% |
Transportation & Commute in Oretta
Vehicle Availability by Sex in Oretta
The most prevalent vehicle ownership categories in Oretta are males with 5 or more vehicles (168, accounting for 78.1%) and females with 5 or more vehicles (0, making up 700.0%).
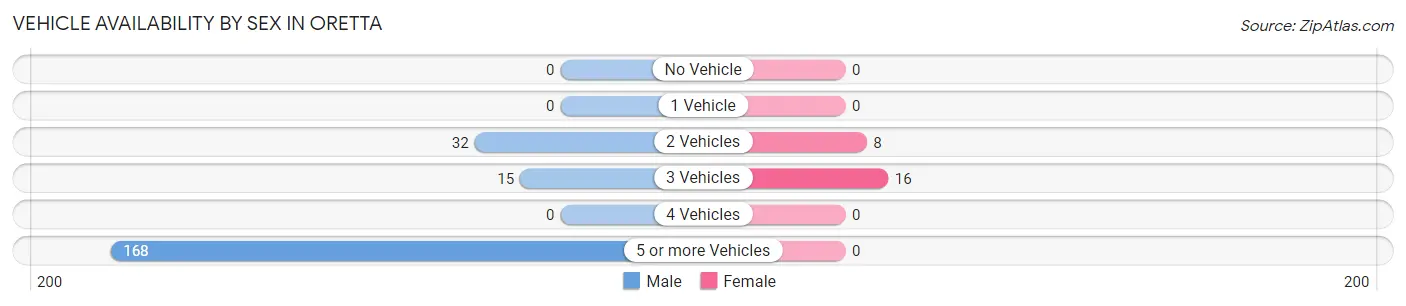
| Vehicles Available | Male | Female |
| No Vehicle | 0 (0.0%) | 0 (0.0%) |
| 1 Vehicle | 0 (0.0%) | 0 (0.0%) |
| 2 Vehicles | 32 (14.9%) | 8 (33.3%) |
| 3 Vehicles | 15 (7.0%) | 16 (66.7%) |
| 4 Vehicles | 0 (0.0%) | 0 (0.0%) |
| 5 or more Vehicles | 168 (78.1%) | 0 (0.0%) |
| Total | 215 (100.0%) | 24 (100.0%) |
Commute Time in Oretta
The most frequently occuring commute durations in Oretta are 25 to 29 minutes (113 commuters, 47.3%), 60 to 89 minutes (63 commuters, 26.4%), and 40 to 44 minutes (53 commuters, 22.2%).
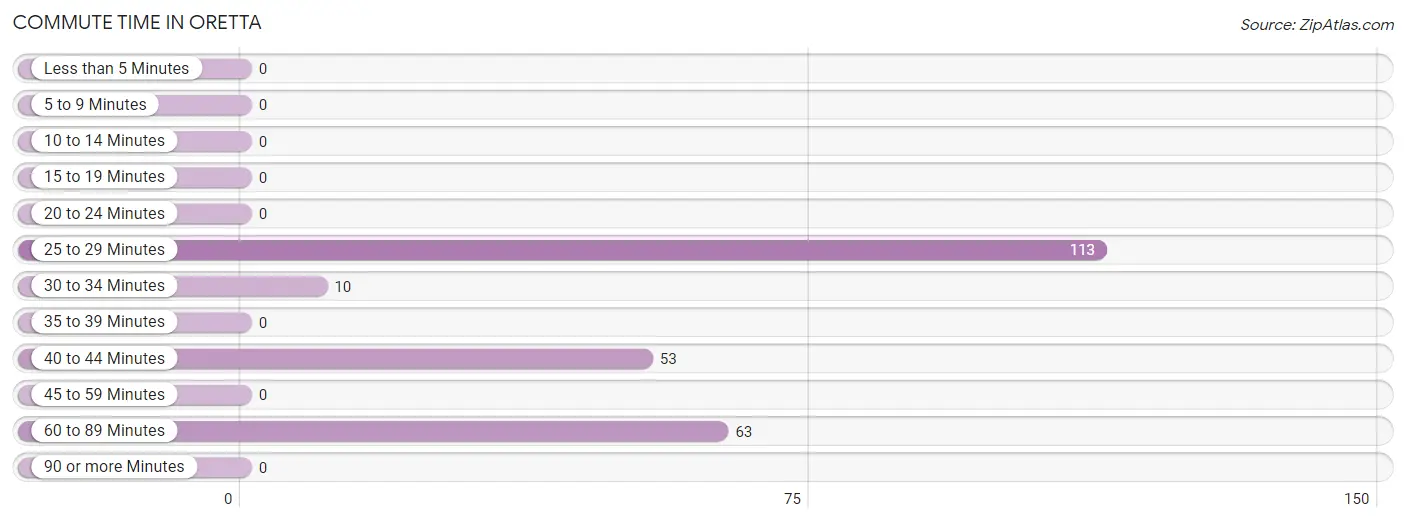
| Commute Time | # Commuters | % Commuters |
| Less than 5 Minutes | 0 | 0.0% |
| 5 to 9 Minutes | 0 | 0.0% |
| 10 to 14 Minutes | 0 | 0.0% |
| 15 to 19 Minutes | 0 | 0.0% |
| 20 to 24 Minutes | 0 | 0.0% |
| 25 to 29 Minutes | 113 | 47.3% |
| 30 to 34 Minutes | 10 | 4.2% |
| 35 to 39 Minutes | 0 | 0.0% |
| 40 to 44 Minutes | 53 | 22.2% |
| 45 to 59 Minutes | 0 | 0.0% |
| 60 to 89 Minutes | 63 | 26.4% |
| 90 or more Minutes | 0 | 0.0% |
Commute Time by Sex in Oretta
The most common commute times in Oretta are 25 to 29 minutes (113 commuters, 52.6%) for males and 40 to 44 minutes (16 commuters, 66.7%) for females.
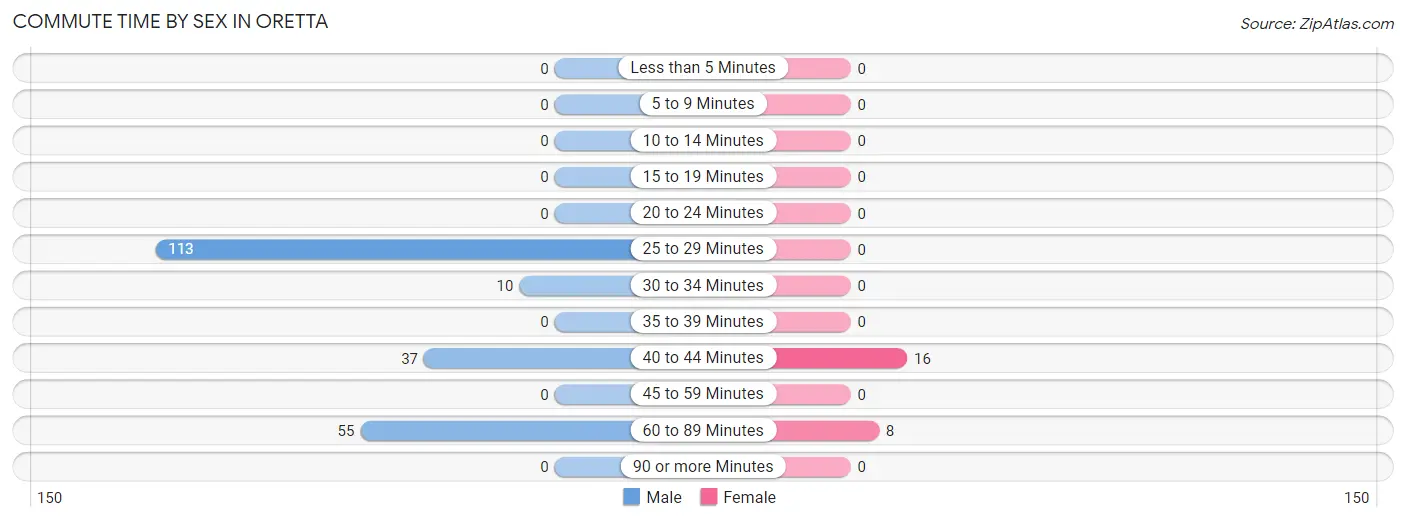
| Commute Time | Male | Female |
| Less than 5 Minutes | 0 (0.0%) | 0 (0.0%) |
| 5 to 9 Minutes | 0 (0.0%) | 0 (0.0%) |
| 10 to 14 Minutes | 0 (0.0%) | 0 (0.0%) |
| 15 to 19 Minutes | 0 (0.0%) | 0 (0.0%) |
| 20 to 24 Minutes | 0 (0.0%) | 0 (0.0%) |
| 25 to 29 Minutes | 113 (52.6%) | 0 (0.0%) |
| 30 to 34 Minutes | 10 (4.6%) | 0 (0.0%) |
| 35 to 39 Minutes | 0 (0.0%) | 0 (0.0%) |
| 40 to 44 Minutes | 37 (17.2%) | 16 (66.7%) |
| 45 to 59 Minutes | 0 (0.0%) | 0 (0.0%) |
| 60 to 89 Minutes | 55 (25.6%) | 8 (33.3%) |
| 90 or more Minutes | 0 (0.0%) | 0 (0.0%) |
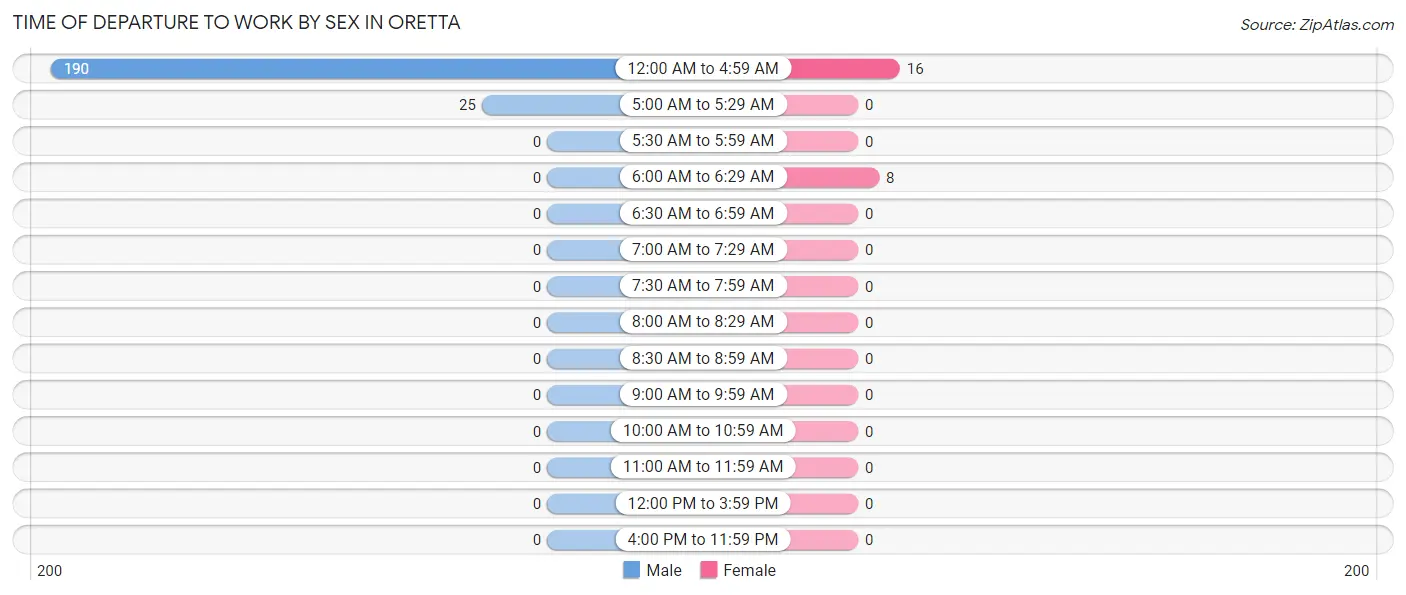
Time of Departure to Work by Sex in Oretta
The most frequent times of departure to work in Oretta are 12:00 AM to 4:59 AM (190, 88.4%) for males and 12:00 AM to 4:59 AM (16, 66.7%) for females.
| Time of Departure | Male | Female |
| 12:00 AM to 4:59 AM | 190 (88.4%) | 16 (66.7%) |
| 5:00 AM to 5:29 AM | 25 (11.6%) | 0 (0.0%) |
| 5:30 AM to 5:59 AM | 0 (0.0%) | 0 (0.0%) |
| 6:00 AM to 6:29 AM | 0 (0.0%) | 8 (33.3%) |
| 6:30 AM to 6:59 AM | 0 (0.0%) | 0 (0.0%) |
| 7:00 AM to 7:29 AM | 0 (0.0%) | 0 (0.0%) |
| 7:30 AM to 7:59 AM | 0 (0.0%) | 0 (0.0%) |
| 8:00 AM to 8:29 AM | 0 (0.0%) | 0 (0.0%) |
| 8:30 AM to 8:59 AM | 0 (0.0%) | 0 (0.0%) |
| 9:00 AM to 9:59 AM | 0 (0.0%) | 0 (0.0%) |
| 10:00 AM to 10:59 AM | 0 (0.0%) | 0 (0.0%) |
| 11:00 AM to 11:59 AM | 0 (0.0%) | 0 (0.0%) |
| 12:00 PM to 3:59 PM | 0 (0.0%) | 0 (0.0%) |
| 4:00 PM to 11:59 PM | 0 (0.0%) | 0 (0.0%) |
| Total | 215 (100.0%) | 24 (100.0%) |
Housing Occupancy in Oretta
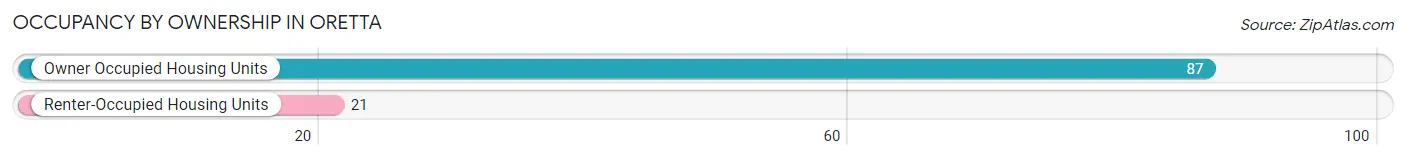
Occupancy by Ownership in Oretta
Of the total 108 dwellings in Oretta, owner-occupied units account for 87 (80.6%), while renter-occupied units make up 21 (19.4%).
| Occupancy | # Housing Units | % Housing Units |
| Owner Occupied Housing Units | 87 | 80.6% |
| Renter-Occupied Housing Units | 21 | 19.4% |
| Total Occupied Housing Units | 108 | 100.0% |
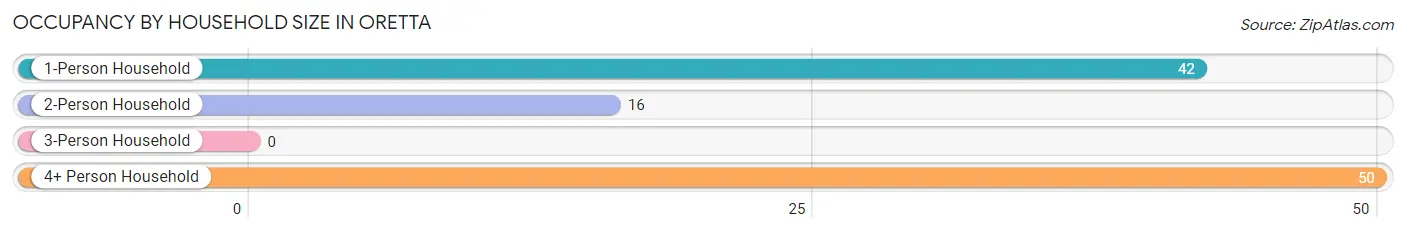
Occupancy by Household Size in Oretta
| Household Size | # Housing Units | % Housing Units |
| 1-Person Household | 42 | 38.9% |
| 2-Person Household | 16 | 14.8% |
| 3-Person Household | 0 | 0.0% |
| 4+ Person Household | 50 | 46.3% |
| Total Housing Units | 108 | 100.0% |
Occupancy by Ownership by Household Size in Oretta
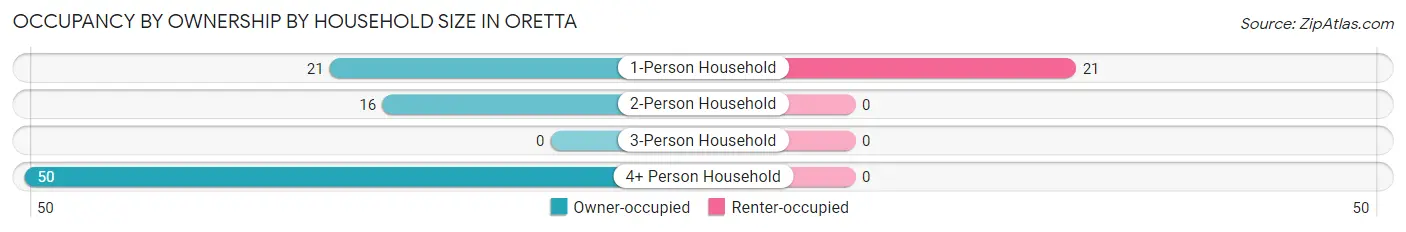
| Household Size | Owner-occupied | Renter-occupied |
| 1-Person Household | 21 (50.0%) | 21 (50.0%) |
| 2-Person Household | 16 (100.0%) | 0 (0.0%) |
| 3-Person Household | 0 (0.0%) | 0 (0.0%) |
| 4+ Person Household | 50 (100.0%) | 0 (0.0%) |
| Total Housing Units | 87 (80.6%) | 21 (19.4%) |
Occupancy by Educational Attainment in Oretta
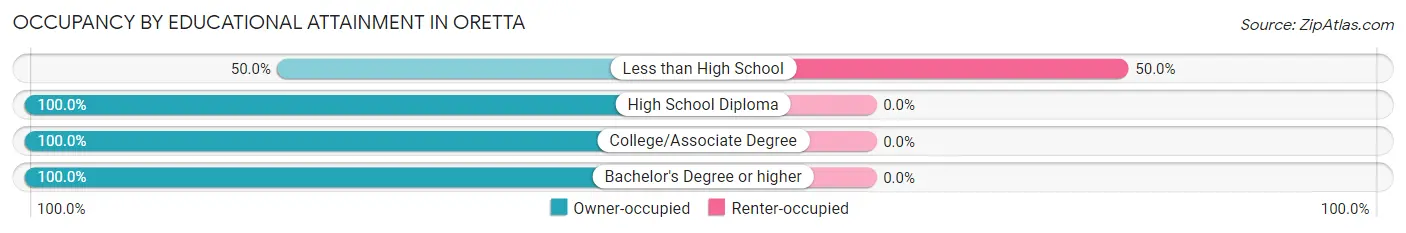
| Household Size | Owner-occupied | Renter-occupied |
| Less than High School | 21 (50.0%) | 21 (50.0%) |
| High School Diploma | 26 (100.0%) | 0 (0.0%) |
| College/Associate Degree | 16 (100.0%) | 0 (0.0%) |
| Bachelor's Degree or higher | 24 (100.0%) | 0 (0.0%) |
Occupancy by Age of Householder in Oretta
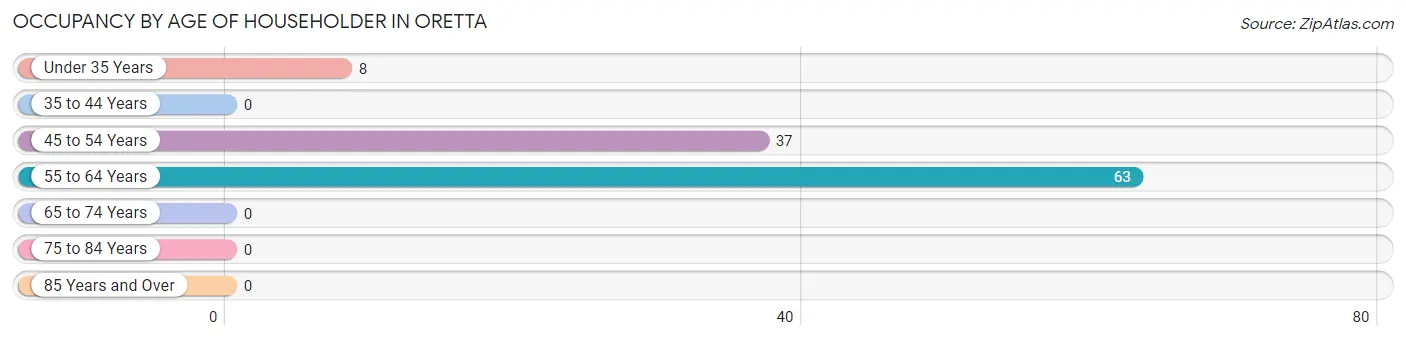
| Age Bracket | # Households | % Households |
| Under 35 Years | 8 | 7.4% |
| 35 to 44 Years | 0 | 0.0% |
| 45 to 54 Years | 37 | 34.3% |
| 55 to 64 Years | 63 | 58.3% |
| 65 to 74 Years | 0 | 0.0% |
| 75 to 84 Years | 0 | 0.0% |
| 85 Years and Over | 0 | 0.0% |
| Total | 108 | 100.0% |
Housing Finances in Oretta
Median Income by Occupancy in Oretta
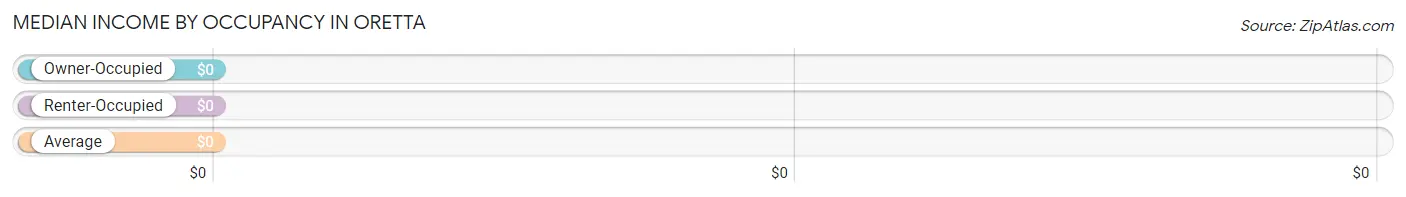
| Occupancy Type | # Households | Median Income |
| Owner-Occupied | 87 (80.6%) | $0 |
| Renter-Occupied | 21 (19.4%) | $0 |
| Average | 108 (100.0%) | $0 |
Occupancy by Householder Income Bracket in Oretta
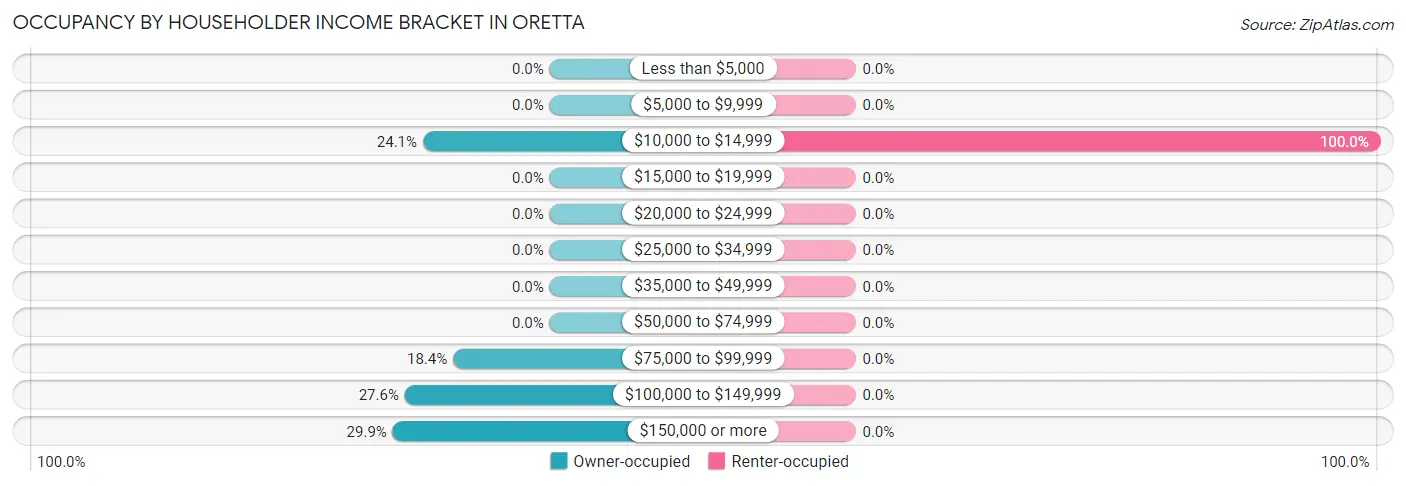
| Income Bracket | Owner-occupied | Renter-occupied |
| Less than $5,000 | 0 (0.0%) | 0 (0.0%) |
| $5,000 to $9,999 | 0 (0.0%) | 0 (0.0%) |
| $10,000 to $14,999 | 21 (24.1%) | 21 (100.0%) |
| $15,000 to $19,999 | 0 (0.0%) | 0 (0.0%) |
| $20,000 to $24,999 | 0 (0.0%) | 0 (0.0%) |
| $25,000 to $34,999 | 0 (0.0%) | 0 (0.0%) |
| $35,000 to $49,999 | 0 (0.0%) | 0 (0.0%) |
| $50,000 to $74,999 | 0 (0.0%) | 0 (0.0%) |
| $75,000 to $99,999 | 16 (18.4%) | 0 (0.0%) |
| $100,000 to $149,999 | 24 (27.6%) | 0 (0.0%) |
| $150,000 or more | 26 (29.9%) | 0 (0.0%) |
| Total | 87 (100.0%) | 21 (100.0%) |
Monthly Housing Cost Tiers in Oretta
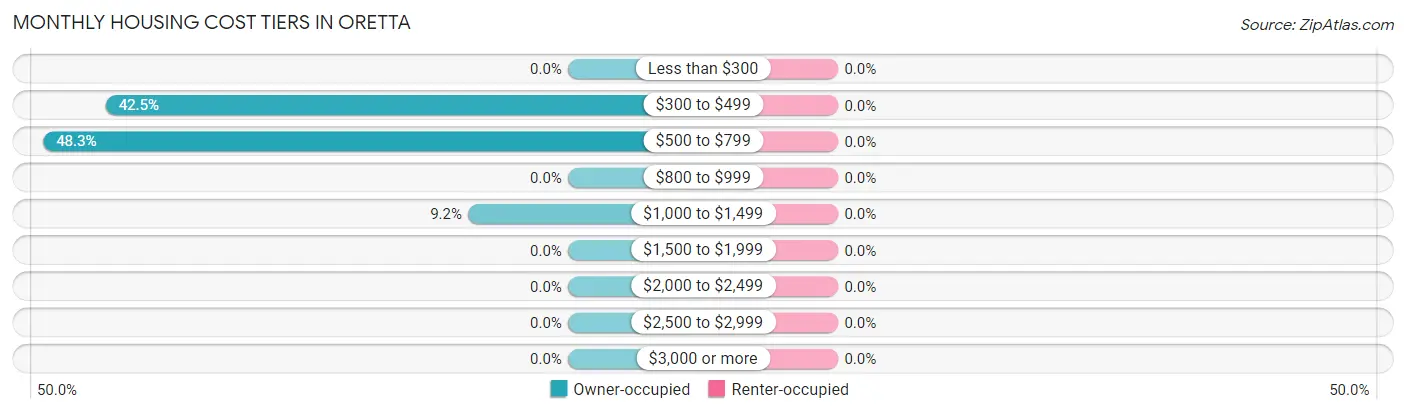
| Monthly Cost | Owner-occupied | Renter-occupied |
| Less than $300 | 0 (0.0%) | 0 (0.0%) |
| $300 to $499 | 37 (42.5%) | 0 (0.0%) |
| $500 to $799 | 42 (48.3%) | 0 (0.0%) |
| $800 to $999 | 0 (0.0%) | 0 (0.0%) |
| $1,000 to $1,499 | 8 (9.2%) | 0 (0.0%) |
| $1,500 to $1,999 | 0 (0.0%) | 0 (0.0%) |
| $2,000 to $2,499 | 0 (0.0%) | 0 (0.0%) |
| $2,500 to $2,999 | 0 (0.0%) | 0 (0.0%) |
| $3,000 or more | 0 (0.0%) | 0 (0.0%) |
| Total | 87 (100.0%) | 21 (100.0%) |
Physical Housing Characteristics in Oretta
Housing Structures in Oretta
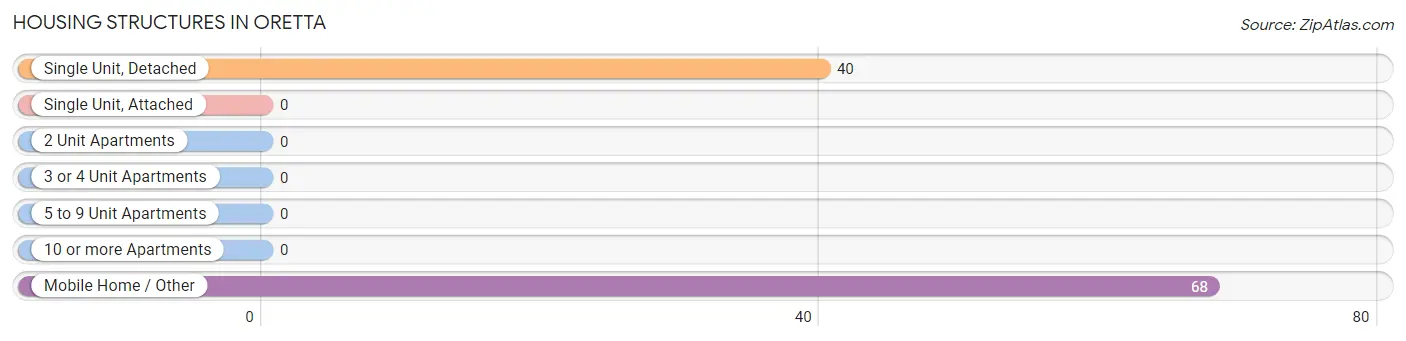
| Structure Type | # Housing Units | % Housing Units |
| Single Unit, Detached | 40 | 37.0% |
| Single Unit, Attached | 0 | 0.0% |
| 2 Unit Apartments | 0 | 0.0% |
| 3 or 4 Unit Apartments | 0 | 0.0% |
| 5 to 9 Unit Apartments | 0 | 0.0% |
| 10 or more Apartments | 0 | 0.0% |
| Mobile Home / Other | 68 | 63.0% |
| Total | 108 | 100.0% |
Housing Structures by Occupancy in Oretta
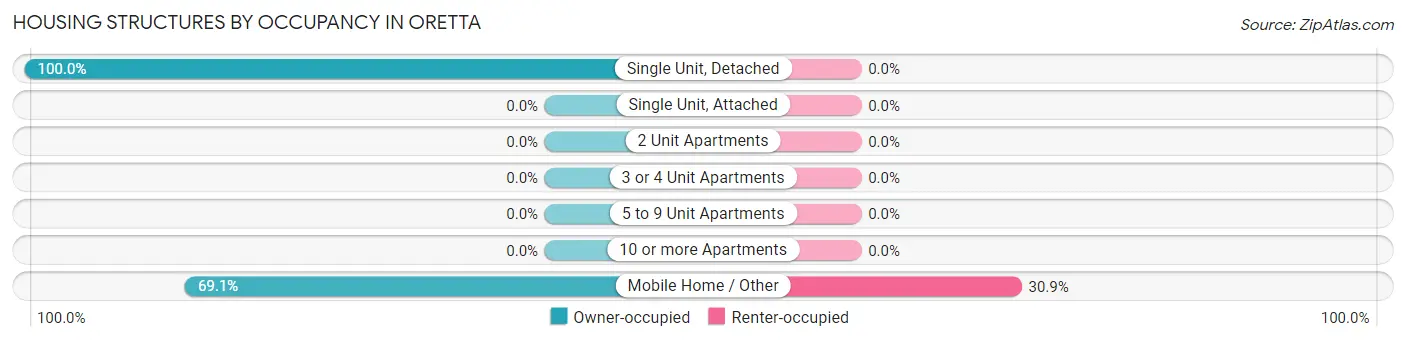
| Structure Type | Owner-occupied | Renter-occupied |
| Single Unit, Detached | 40 (100.0%) | 0 (0.0%) |
| Single Unit, Attached | 0 (0.0%) | 0 (0.0%) |
| 2 Unit Apartments | 0 (0.0%) | 0 (0.0%) |
| 3 or 4 Unit Apartments | 0 (0.0%) | 0 (0.0%) |
| 5 to 9 Unit Apartments | 0 (0.0%) | 0 (0.0%) |
| 10 or more Apartments | 0 (0.0%) | 0 (0.0%) |
| Mobile Home / Other | 47 (69.1%) | 21 (30.9%) |
| Total | 87 (80.6%) | 21 (19.4%) |
Housing Structures by Number of Rooms in Oretta
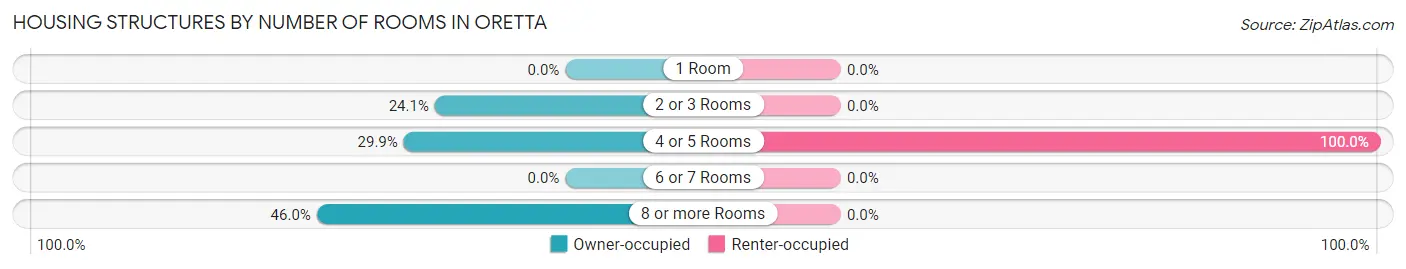
| Number of Rooms | Owner-occupied | Renter-occupied |
| 1 Room | 0 (0.0%) | 0 (0.0%) |
| 2 or 3 Rooms | 21 (24.1%) | 0 (0.0%) |
| 4 or 5 Rooms | 26 (29.9%) | 21 (100.0%) |
| 6 or 7 Rooms | 0 (0.0%) | 0 (0.0%) |
| 8 or more Rooms | 40 (46.0%) | 0 (0.0%) |
| Total | 87 (100.0%) | 21 (100.0%) |
Housing Structure by Heating Type in Oretta
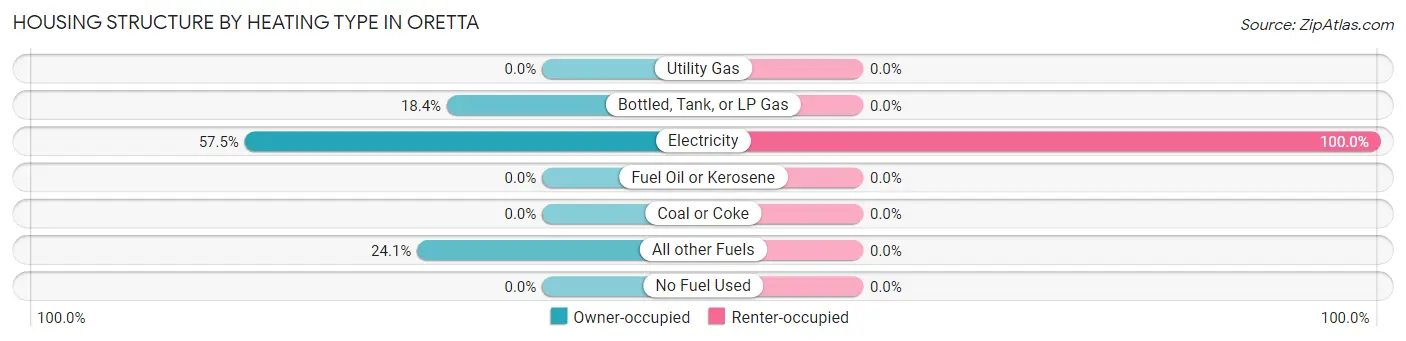
| Heating Type | Owner-occupied | Renter-occupied |
| Utility Gas | 0 (0.0%) | 0 (0.0%) |
| Bottled, Tank, or LP Gas | 16 (18.4%) | 0 (0.0%) |
| Electricity | 50 (57.5%) | 21 (100.0%) |
| Fuel Oil or Kerosene | 0 (0.0%) | 0 (0.0%) |
| Coal or Coke | 0 (0.0%) | 0 (0.0%) |
| All other Fuels | 21 (24.1%) | 0 (0.0%) |
| No Fuel Used | 0 (0.0%) | 0 (0.0%) |
| Total | 87 (100.0%) | 21 (100.0%) |
Household Vehicle Usage in Oretta
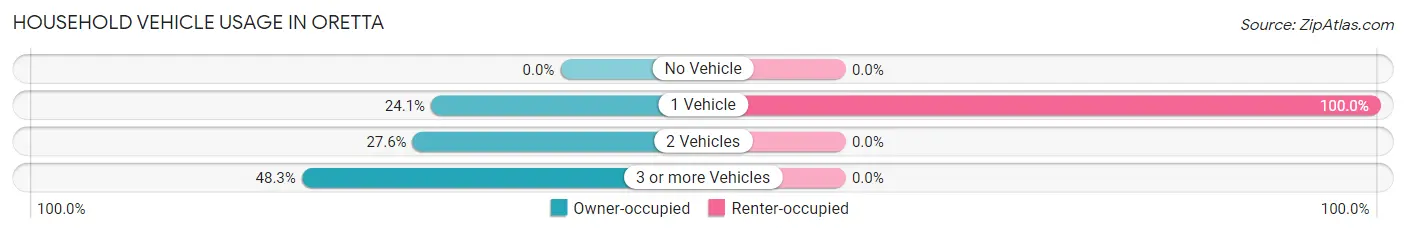
| Vehicles per Household | Owner-occupied | Renter-occupied |
| No Vehicle | 0 (0.0%) | 0 (0.0%) |
| 1 Vehicle | 21 (24.1%) | 21 (100.0%) |
| 2 Vehicles | 24 (27.6%) | 0 (0.0%) |
| 3 or more Vehicles | 42 (48.3%) | 0 (0.0%) |
| Total | 87 (100.0%) | 21 (100.0%) |
Real Estate & Mortgages in Oretta
Real Estate and Mortgage Overview in Oretta
| Characteristic | Without Mortgage | With Mortgage |
| Housing Units | 79 | 8 |
| Median Property Value | - | - |
| Median Household Income | - | - |
| Monthly Housing Costs | - | - |
| Real Estate Taxes | - | - |
Property Value by Mortgage Status in Oretta
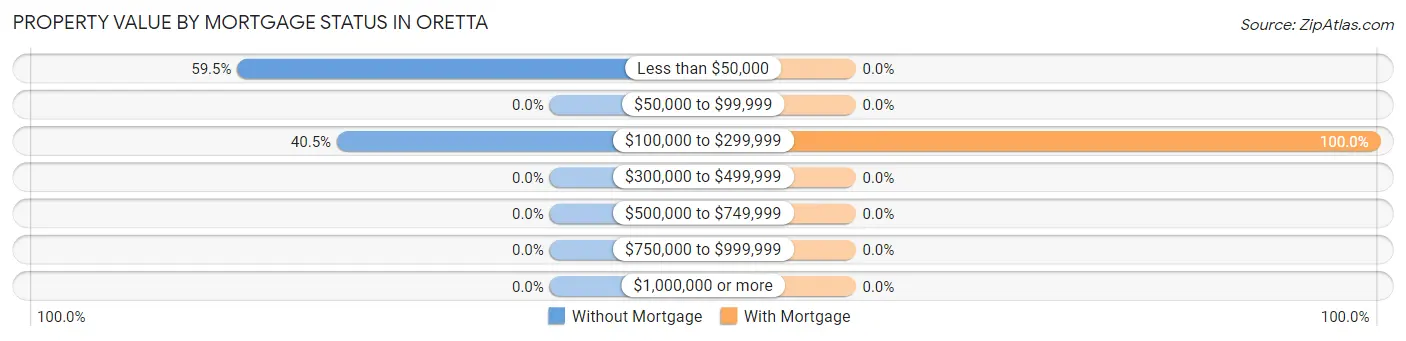
| Property Value | Without Mortgage | With Mortgage |
| Less than $50,000 | 47 (59.5%) | 0 (0.0%) |
| $50,000 to $99,999 | 0 (0.0%) | 0 (0.0%) |
| $100,000 to $299,999 | 32 (40.5%) | 8 (100.0%) |
| $300,000 to $499,999 | 0 (0.0%) | 0 (0.0%) |
| $500,000 to $749,999 | 0 (0.0%) | 0 (0.0%) |
| $750,000 to $999,999 | 0 (0.0%) | 0 (0.0%) |
| $1,000,000 or more | 0 (0.0%) | 0 (0.0%) |
| Total | 79 (100.0%) | 8 (100.0%) |
Household Income by Mortgage Status in Oretta
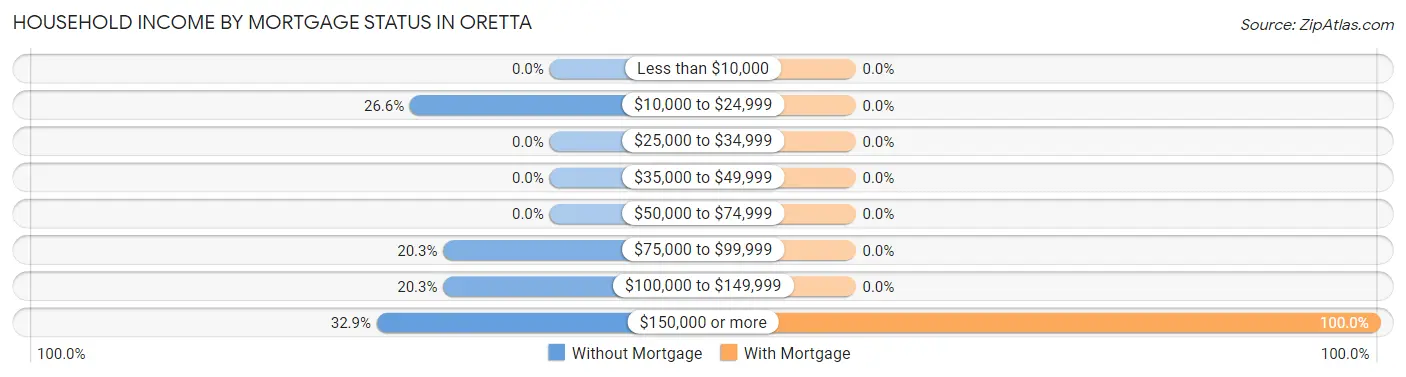
| Household Income | Without Mortgage | With Mortgage |
| Less than $10,000 | 0 (0.0%) | 0 (0.0%) |
| $10,000 to $24,999 | 21 (26.6%) | 0 (0.0%) |
| $25,000 to $34,999 | 0 (0.0%) | 0 (0.0%) |
| $35,000 to $49,999 | 0 (0.0%) | 0 (0.0%) |
| $50,000 to $74,999 | 0 (0.0%) | 0 (0.0%) |
| $75,000 to $99,999 | 16 (20.3%) | 0 (0.0%) |
| $100,000 to $149,999 | 16 (20.3%) | 0 (0.0%) |
| $150,000 or more | 26 (32.9%) | 8 (100.0%) |
| Total | 79 (100.0%) | 8 (100.0%) |
Property Value to Household Income Ratio in Oretta
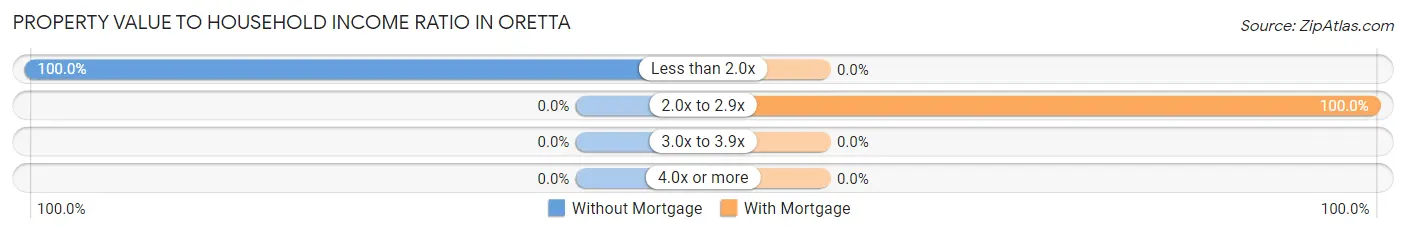
| Value-to-Income Ratio | Without Mortgage | With Mortgage |
| Less than 2.0x | 79 (100.0%) | 0 (0.0%) |
| 2.0x to 2.9x | 0 (0.0%) | 8 (100.0%) |
| 3.0x to 3.9x | 0 (0.0%) | 0 (0.0%) |
| 4.0x or more | 0 (0.0%) | 0 (0.0%) |
| Total | 79 (100.0%) | 8 (100.0%) |
Real Estate Taxes by Mortgage Status in Oretta
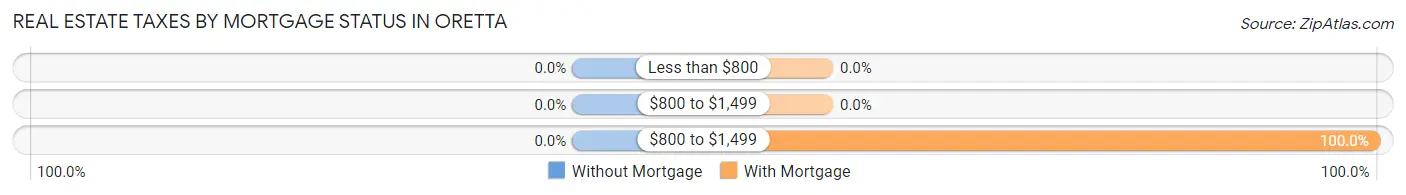
| Property Taxes | Without Mortgage | With Mortgage |
| Less than $800 | 0 (0.0%) | 0 (0.0%) |
| $800 to $1,499 | 0 (0.0%) | 0 (0.0%) |
| $800 to $1,499 | 0 (0.0%) | 8 (100.0%) |
| Total | 79 (100.0%) | 8 (100.0%) |
Health & Disability in Oretta
Health Insurance Coverage by Age in Oretta
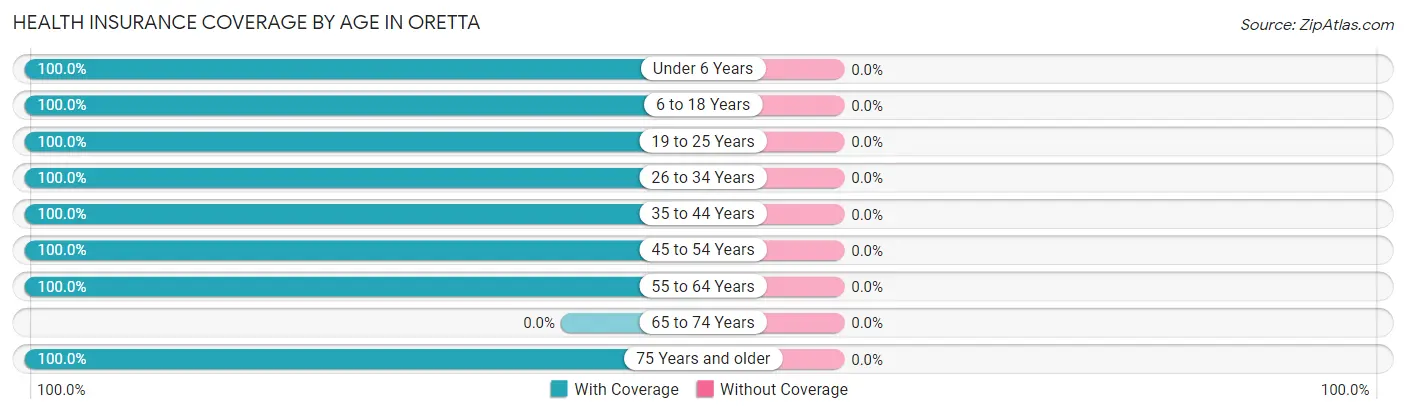
| Age Bracket | With Coverage | Without Coverage |
| Under 6 Years | 47 (100.0%) | 0 (0.0%) |
| 6 to 18 Years | 183 (100.0%) | 0 (0.0%) |
| 19 to 25 Years | 79 (100.0%) | 0 (0.0%) |
| 26 to 34 Years | 102 (100.0%) | 0 (0.0%) |
| 35 to 44 Years | 168 (100.0%) | 0 (0.0%) |
| 45 to 54 Years | 59 (100.0%) | 0 (0.0%) |
| 55 to 64 Years | 78 (100.0%) | 0 (0.0%) |
| 65 to 74 Years | 0 (0.0%) | 0 (0.0%) |
| 75 Years and older | 18 (100.0%) | 0 (0.0%) |
| Total | 734 (100.0%) | 0 (0.0%) |
Health Insurance Coverage by Citizenship Status in Oretta
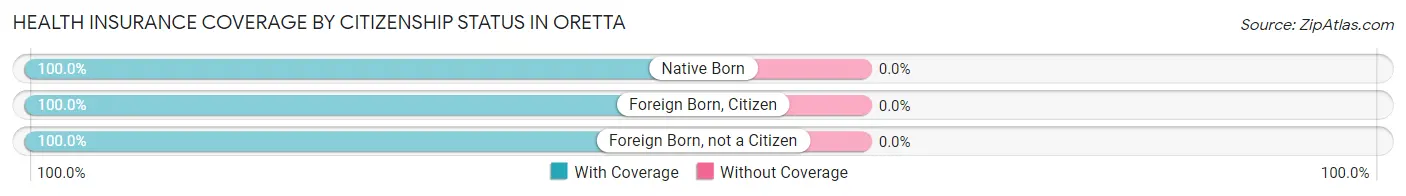
| Citizenship Status | With Coverage | Without Coverage |
| Native Born | 47 (100.0%) | 0 (0.0%) |
| Foreign Born, Citizen | 183 (100.0%) | 0 (0.0%) |
| Foreign Born, not a Citizen | 79 (100.0%) | 0 (0.0%) |
Health Insurance Coverage by Household Income in Oretta
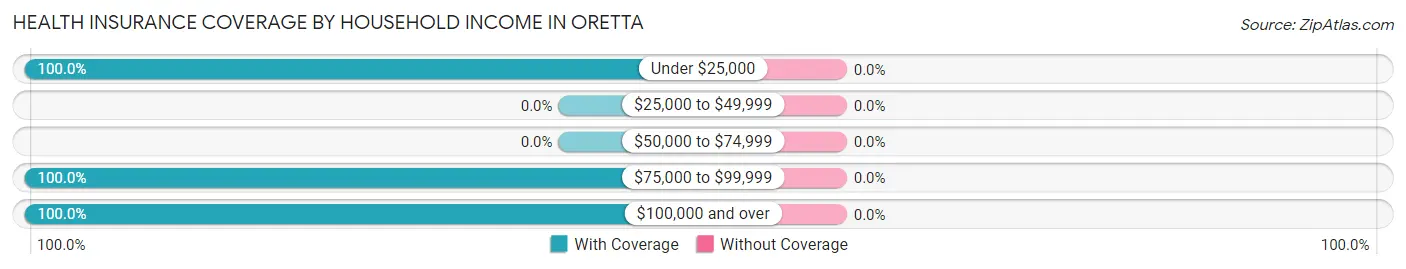
| Household Income | With Coverage | Without Coverage |
| Under $25,000 | 42 (100.0%) | 0 (0.0%) |
| $25,000 to $49,999 | 0 (0.0%) | 0 (0.0%) |
| $50,000 to $74,999 | 0 (0.0%) | 0 (0.0%) |
| $75,000 to $99,999 | 101 (100.0%) | 0 (0.0%) |
| $100,000 and over | 591 (100.0%) | 0 (0.0%) |
Public vs Private Health Insurance Coverage by Age in Oretta
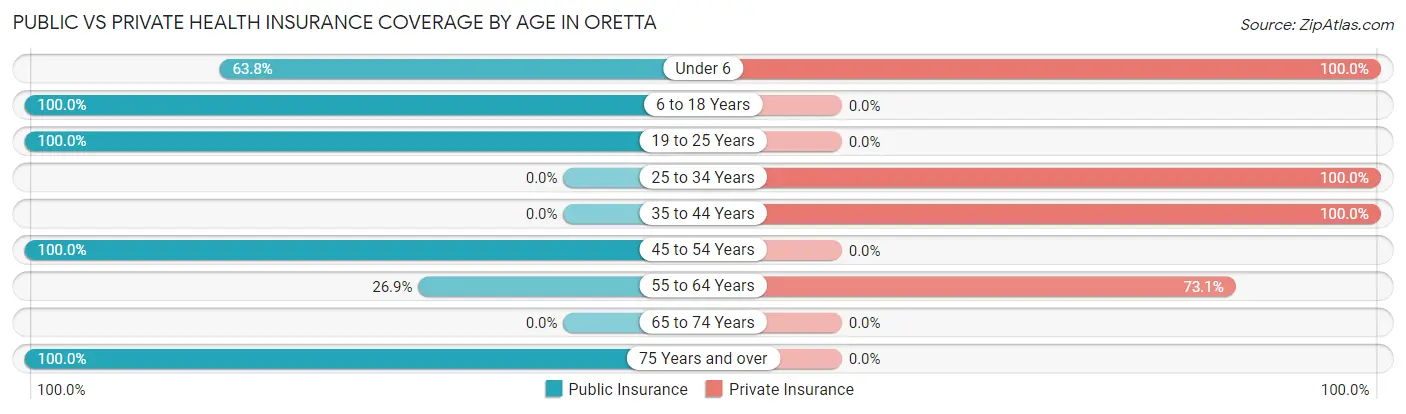
| Age Bracket | Public Insurance | Private Insurance |
| Under 6 | 30 (63.8%) | 47 (100.0%) |
| 6 to 18 Years | 183 (100.0%) | 0 (0.0%) |
| 19 to 25 Years | 79 (100.0%) | 0 (0.0%) |
| 25 to 34 Years | 0 (0.0%) | 102 (100.0%) |
| 35 to 44 Years | 0 (0.0%) | 168 (100.0%) |
| 45 to 54 Years | 59 (100.0%) | 0 (0.0%) |
| 55 to 64 Years | 21 (26.9%) | 57 (73.1%) |
| 65 to 74 Years | 0 (0.0%) | 0 (0.0%) |
| 75 Years and over | 18 (100.0%) | 0 (0.0%) |
| Total | 390 (53.1%) | 374 (50.9%) |
Disability Status by Sex by Age in Oretta
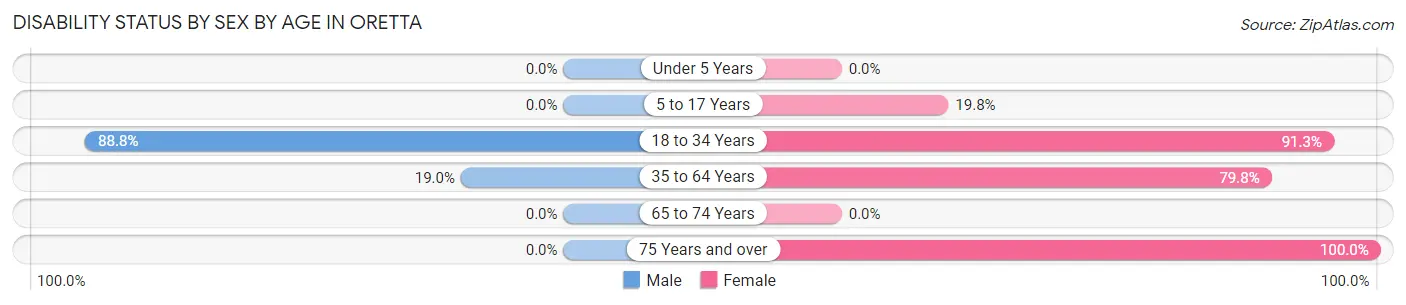
| Age Bracket | Male | Female |
| Under 5 Years | 0 (0.0%) | 0 (0.0%) |
| 5 to 17 Years | 0 (0.0%) | 19 (19.8%) |
| 18 to 34 Years | 79 (88.8%) | 84 (91.3%) |
| 35 to 64 Years | 43 (19.0%) | 63 (79.7%) |
| 65 to 74 Years | 0 (0.0%) | 0 (0.0%) |
| 75 Years and over | 0 (0.0%) | 18 (100.0%) |
Disability Class by Sex by Age in Oretta
Disability Class: Hearing Difficulty
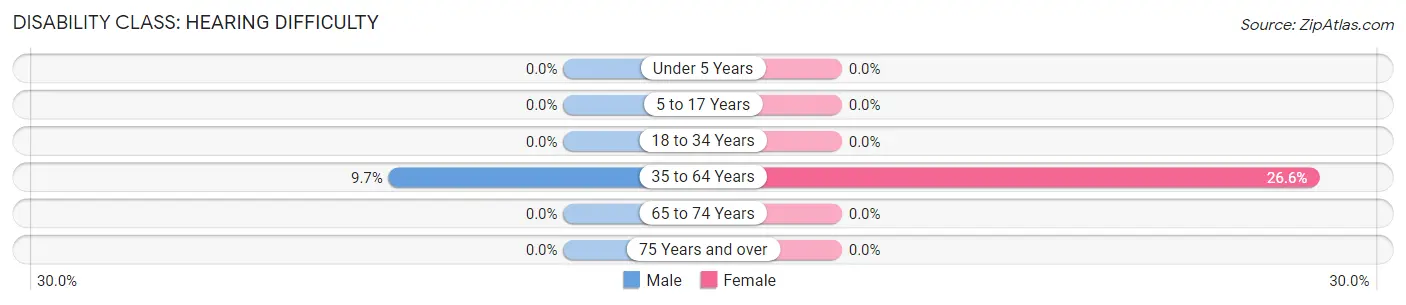
| Age Bracket | Male | Female |
| Under 5 Years | 0 (0.0%) | 0 (0.0%) |
| 5 to 17 Years | 0 (0.0%) | 0 (0.0%) |
| 18 to 34 Years | 0 (0.0%) | 0 (0.0%) |
| 35 to 64 Years | 22 (9.7%) | 21 (26.6%) |
| 65 to 74 Years | 0 (0.0%) | 0 (0.0%) |
| 75 Years and over | 0 (0.0%) | 0 (0.0%) |
Disability Class: Vision Difficulty
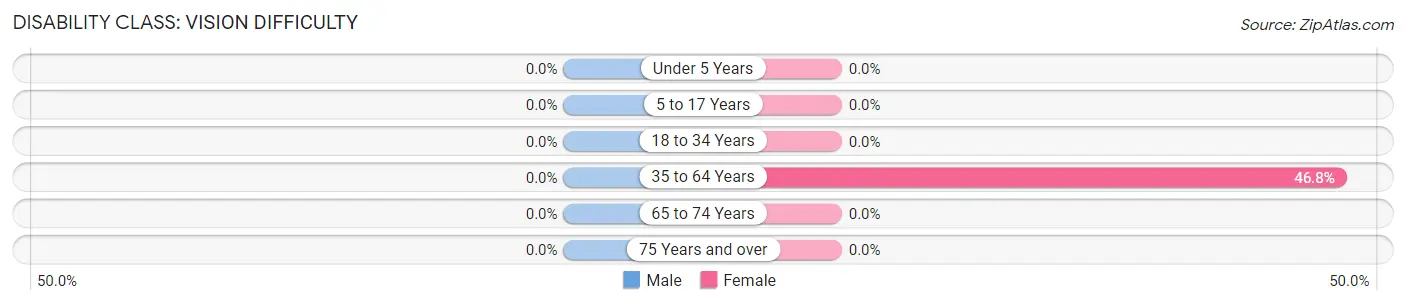
| Age Bracket | Male | Female |
| Under 5 Years | 0 (0.0%) | 0 (0.0%) |
| 5 to 17 Years | 0 (0.0%) | 0 (0.0%) |
| 18 to 34 Years | 0 (0.0%) | 0 (0.0%) |
| 35 to 64 Years | 0 (0.0%) | 37 (46.8%) |
| 65 to 74 Years | 0 (0.0%) | 0 (0.0%) |
| 75 Years and over | 0 (0.0%) | 0 (0.0%) |
Disability Class: Cognitive Difficulty
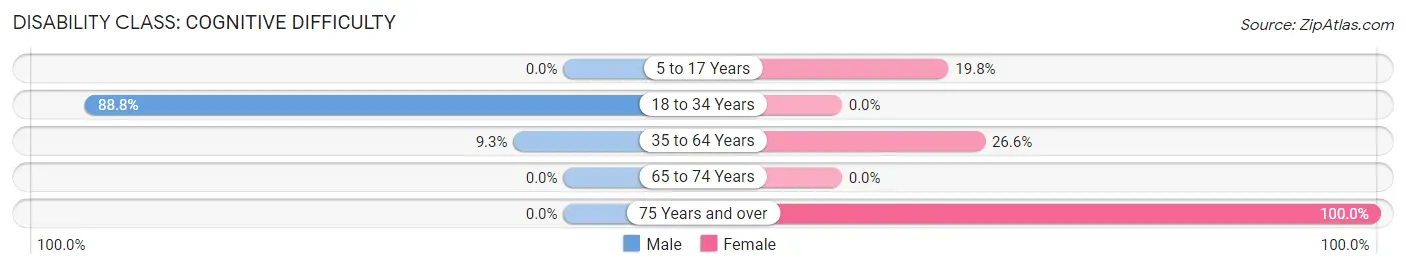
| Age Bracket | Male | Female |
| 5 to 17 Years | 0 (0.0%) | 19 (19.8%) |
| 18 to 34 Years | 79 (88.8%) | 0 (0.0%) |
| 35 to 64 Years | 21 (9.3%) | 21 (26.6%) |
| 65 to 74 Years | 0 (0.0%) | 0 (0.0%) |
| 75 Years and over | 0 (0.0%) | 18 (100.0%) |
Disability Class: Ambulatory Difficulty
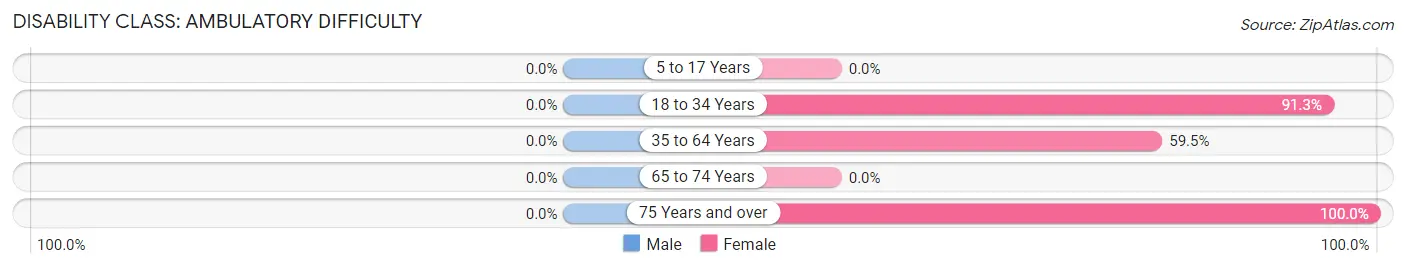
| Age Bracket | Male | Female |
| 5 to 17 Years | 0 (0.0%) | 0 (0.0%) |
| 18 to 34 Years | 0 (0.0%) | 84 (91.3%) |
| 35 to 64 Years | 0 (0.0%) | 47 (59.5%) |
| 65 to 74 Years | 0 (0.0%) | 0 (0.0%) |
| 75 Years and over | 0 (0.0%) | 18 (100.0%) |
Disability Class: Self-Care Difficulty
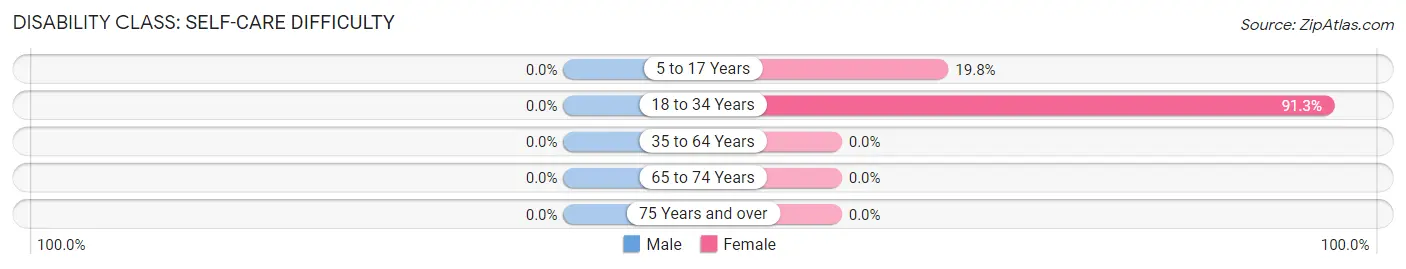
| Age Bracket | Male | Female |
| 5 to 17 Years | 0 (0.0%) | 19 (19.8%) |
| 18 to 34 Years | 0 (0.0%) | 84 (91.3%) |
| 35 to 64 Years | 0 (0.0%) | 0 (0.0%) |
| 65 to 74 Years | 0 (0.0%) | 0 (0.0%) |
| 75 Years and over | 0 (0.0%) | 0 (0.0%) |
Technology Access in Oretta
Computing Device Access in Oretta
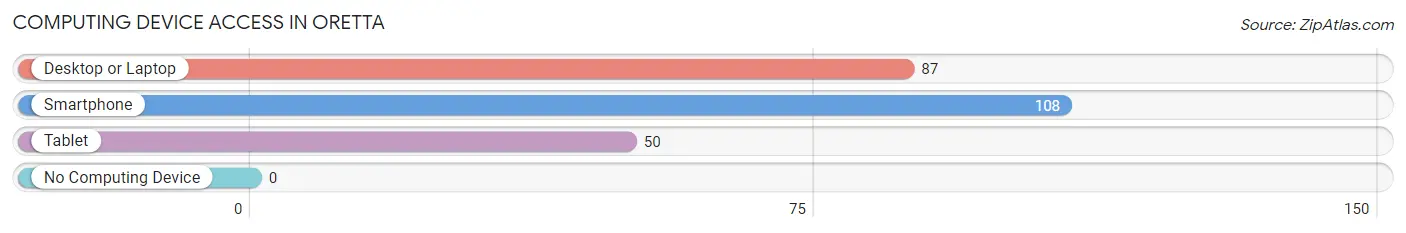
| Device Type | # Households | % Households |
| Desktop or Laptop | 87 | 80.6% |
| Smartphone | 108 | 100.0% |
| Tablet | 50 | 46.3% |
| No Computing Device | 0 | 0.0% |
| Total | 108 | 100.0% |
Internet Access in Oretta
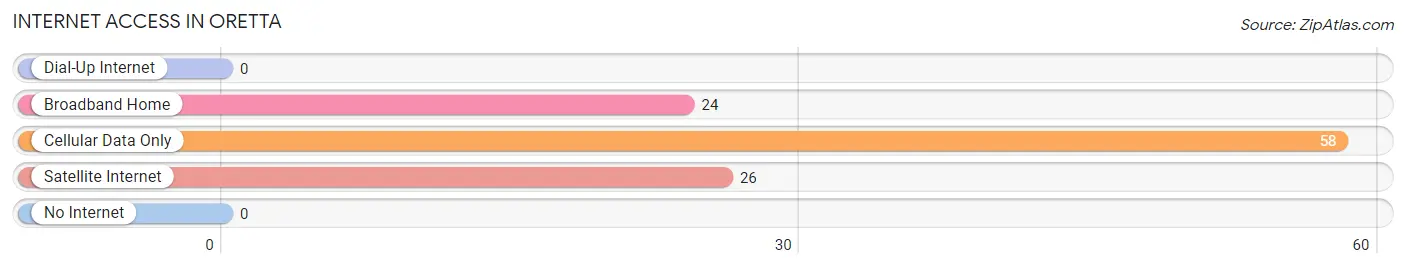
| Internet Type | # Households | % Households |
| Dial-Up Internet | 0 | 0.0% |
| Broadband Home | 24 | 22.2% |
| Cellular Data Only | 58 | 53.7% |
| Satellite Internet | 26 | 24.1% |
| No Internet | 0 | 0.0% |
| Total | 108 | 100.0% |
Oretta Summary
Oretta is a small unincorporated community located in the state of Louisiana, in the United States. It is situated in the northern part of the state, in the parish of Rapides. The population of Oretta was estimated to be around 1,000 people in the year 2000.
History
Oretta was founded in the late 19th century by a group of settlers from the nearby town of Alexandria. The settlers were looking for a place to settle and start a new life. They chose the area around Oretta because of its fertile soil and abundant natural resources. The town was named after the nearby Oretta Creek, which was named after a local Native American tribe.
The first settlers in Oretta were mostly farmers and ranchers. They grew cotton, corn, and other crops, and raised cattle and hogs. The town also had a few small businesses, such as a general store and a blacksmith shop.
In the early 20th century, Oretta began to grow and develop. The town was incorporated in 1912, and the first mayor was elected in 1913. The town continued to grow and develop throughout the 20th century, and by the year 2000, it had a population of around 1,000 people.
Geography
Oretta is located in the northern part of the state of Louisiana, in the parish of Rapides. It is situated in the Red River Valley, which is a fertile agricultural region. The town is located about 25 miles south of Alexandria, and about 50 miles north of Baton Rouge.
The terrain around Oretta is mostly flat, with some rolling hills. The climate is humid subtropical, with hot summers and mild winters. The average annual temperature is around 70 degrees Fahrenheit.
Economy
The economy of Oretta is largely based on agriculture. The town is located in a fertile agricultural region, and the main crops grown in the area are cotton, corn, soybeans, and wheat. The town also has a few small businesses, such as a general store and a blacksmith shop.
Demographics
As of the year 2000, the population of Oretta was estimated to be around 1,000 people. The racial makeup of the town was 97.2% White, 0.9% African American, 0.3% Native American, 0.3% Asian, and 1.3% from other races. The median household income was $30,000, and the median family income was $35,000. The per capita income was $15,000.
Common Questions
What is Per Capita Income in Oretta?
Per Capita income in Oretta is $24,903.
What is Income or Wage Gap in Oretta?
Income or Wage Gap in Oretta is 96.4%.
Women in Oretta earn 3.6 cents for every dollar earned by a man.
What is Inequality or Gini Index in Oretta?
Inequality or Gini Index in Oretta is 0.49.
What is the Total Population of Oretta?
Total Population of Oretta is 734.
What is the Total Male Population of Oretta?
Total Male Population of Oretta is 440.
What is the Total Female Population of Oretta?
Total Female Population of Oretta is 294.
What is the Ratio of Males per 100 Females in Oretta?
There are 149.66 Males per 100 Females in Oretta.
What is the Ratio of Females per 100 Males in Oretta?
There are 66.82 Females per 100 Males in Oretta.
What is the Median Population Age in Oretta?
Median Population Age in Oretta is 34.5 Years.
What is the Average Family Size in Oretta
Average Family Size in Oretta is 10.5 People.
What is the Average Household Size in Oretta
Average Household Size in Oretta is 6.8 People.
How Large is the Labor Force in Oretta?
There are 266 People in the Labor Forcein in Oretta.
What is the Percentage of People in the Labor Force in Oretta?
51.1% of People are in the Labor Force in Oretta.
What is the Unemployment Rate in Oretta?
Unemployment Rate in Oretta is 10.2%.