Reserve, LA Map & Demographics
Reserve Map
Reserve Overview
$23,827
PER CAPITA INCOME
$72,426
AVG FAMILY INCOME
$55,183
AVG HOUSEHOLD INCOME
27.2%
WAGE / INCOME GAP [ % ]
72.8¢/ $1
WAGE / INCOME GAP [ $ ]
0.40
INEQUALITY / GINI INDEX
8,012
TOTAL POPULATION
4,276
MALE POPULATION
3,736
FEMALE POPULATION
114.45
MALES / 100 FEMALES
87.37
FEMALES / 100 MALES
39.3
MEDIAN AGE
3.5
AVG FAMILY SIZE
2.6
AVG HOUSEHOLD SIZE
3,866
LABOR FORCE [ PEOPLE ]
58.5%
PERCENT IN LABOR FORCE
13.5%
UNEMPLOYMENT RATE
Reserve Zip Codes
Reserve Area Codes
Income in Reserve
Income Overview in Reserve
Per Capita Income in Reserve is $23,827, while median incomes of families and households are $72,426 and $55,183 respectively.
| Characteristic | Number | Measure |
| Per Capita Income | 8,012 | $23,827 |
| Median Family Income | 1,885 | $72,426 |
| Mean Family Income | 1,885 | $72,500 |
| Median Household Income | 3,021 | $55,183 |
| Mean Household Income | 3,021 | $61,137 |
| Income Deficit | 1,885 | $0 |
| Wage / Income Gap (%) | 8,012 | 27.24% |
| Wage / Income Gap ($) | 8,012 | 72.76¢ per $1 |
| Gini / Inequality Index | 8,012 | 0.40 |
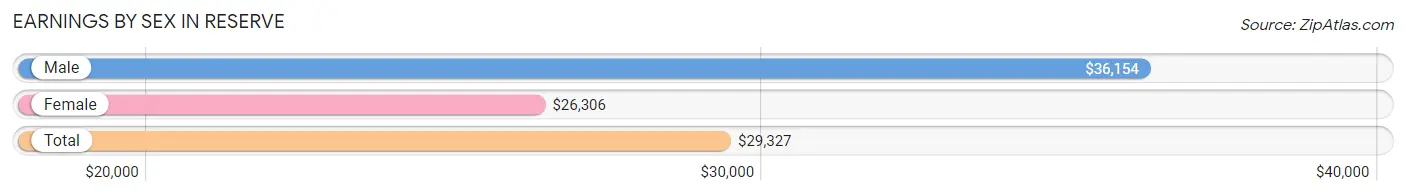
Earnings by Sex in Reserve
Average Earnings in Reserve are $29,327, $36,154 for men and $26,306 for women, a difference of 27.2%.
| Sex | Number | Average Earnings |
| Male | 1,890 (48.4%) | $36,154 |
| Female | 2,017 (51.6%) | $26,306 |
| Total | 3,907 (100.0%) | $29,327 |
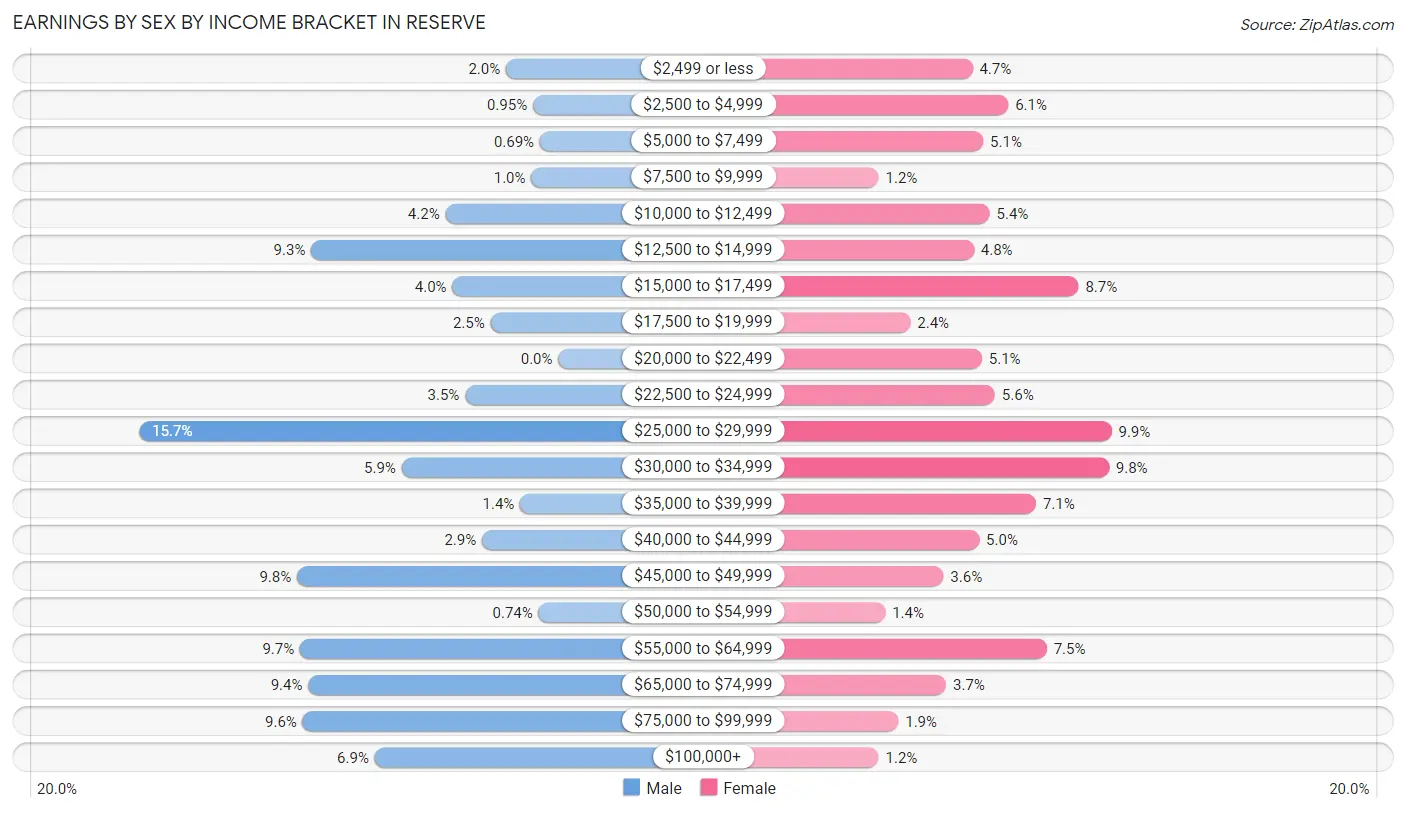
Earnings by Sex by Income Bracket in Reserve
The most common earnings brackets in Reserve are $25,000 to $29,999 for men (297 | 15.7%) and $25,000 to $29,999 for women (200 | 9.9%).
| Income | Male | Female |
| $2,499 or less | 37 (2.0%) | 95 (4.7%) |
| $2,500 to $4,999 | 18 (0.9%) | 122 (6.0%) |
| $5,000 to $7,499 | 13 (0.7%) | 103 (5.1%) |
| $7,500 to $9,999 | 19 (1.0%) | 24 (1.2%) |
| $10,000 to $12,499 | 80 (4.2%) | 108 (5.3%) |
| $12,500 to $14,999 | 175 (9.3%) | 96 (4.8%) |
| $15,000 to $17,499 | 75 (4.0%) | 175 (8.7%) |
| $17,500 to $19,999 | 48 (2.5%) | 48 (2.4%) |
| $20,000 to $22,499 | 0 (0.0%) | 102 (5.1%) |
| $22,500 to $24,999 | 66 (3.5%) | 112 (5.6%) |
| $25,000 to $29,999 | 297 (15.7%) | 200 (9.9%) |
| $30,000 to $34,999 | 111 (5.9%) | 198 (9.8%) |
| $35,000 to $39,999 | 27 (1.4%) | 143 (7.1%) |
| $40,000 to $44,999 | 54 (2.9%) | 100 (5.0%) |
| $45,000 to $49,999 | 185 (9.8%) | 73 (3.6%) |
| $50,000 to $54,999 | 14 (0.7%) | 29 (1.4%) |
| $55,000 to $64,999 | 183 (9.7%) | 151 (7.5%) |
| $65,000 to $74,999 | 177 (9.4%) | 75 (3.7%) |
| $75,000 to $99,999 | 181 (9.6%) | 39 (1.9%) |
| $100,000+ | 130 (6.9%) | 24 (1.2%) |
| Total | 1,890 (100.0%) | 2,017 (100.0%) |
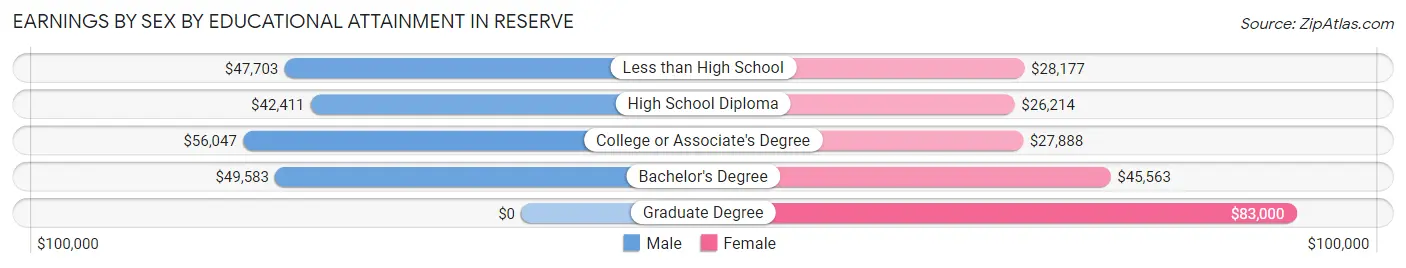
Earnings by Sex by Educational Attainment in Reserve
Average earnings in Reserve are $47,768 for men and $29,281 for women, a difference of 38.7%. Men with an educational attainment of college or associate's degree enjoy the highest average annual earnings of $56,047, while those with high school diploma education earn the least with $42,411. Women with an educational attainment of graduate degree earn the most with the average annual earnings of $83,000, while those with high school diploma education have the smallest earnings of $26,214.
| Educational Attainment | Male Income | Female Income |
| Less than High School | $47,703 | $28,177 |
| High School Diploma | $42,411 | $26,214 |
| College or Associate's Degree | $56,047 | $27,888 |
| Bachelor's Degree | $49,583 | $45,563 |
| Graduate Degree | - | - |
| Total | $47,768 | $29,281 |
Family Income in Reserve
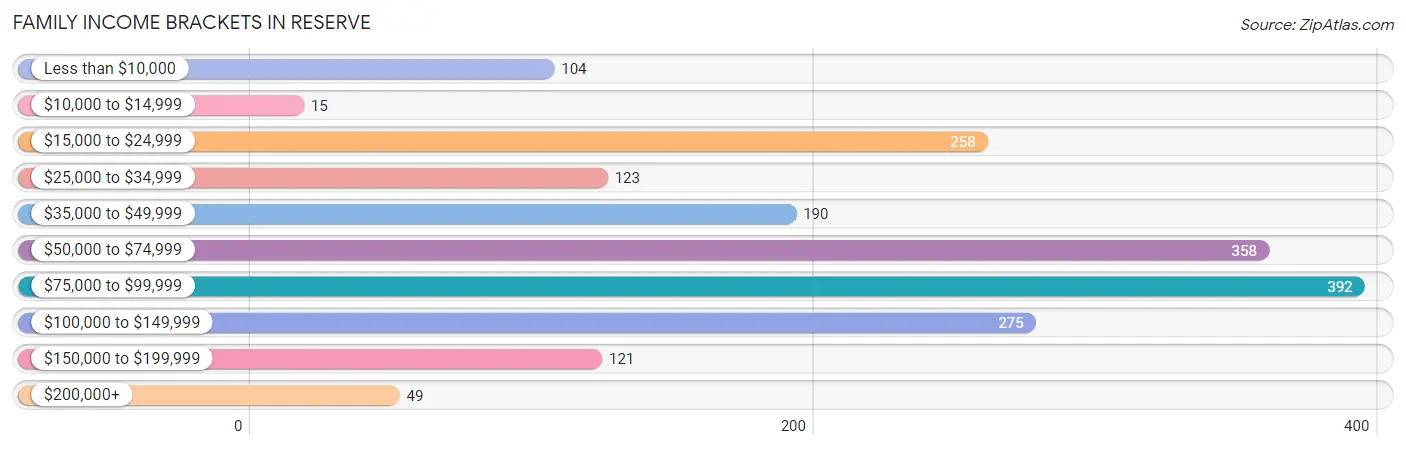
Family Income Brackets in Reserve
According to the Reserve family income data, there are 392 families falling into the $75,000 to $99,999 income range, which is the most common income bracket and makes up 20.8% of all families. Conversely, the $10,000 to $14,999 income bracket is the least frequent group with only 15 families (0.8%) belonging to this category.
| Income Bracket | # Families | % Families |
| Less than $10,000 | 104 | 5.5% |
| $10,000 to $14,999 | 15 | 0.8% |
| $15,000 to $24,999 | 258 | 13.7% |
| $25,000 to $34,999 | 123 | 6.5% |
| $35,000 to $49,999 | 190 | 10.1% |
| $50,000 to $74,999 | 358 | 19.0% |
| $75,000 to $99,999 | 392 | 20.8% |
| $100,000 to $149,999 | 275 | 14.6% |
| $150,000 to $199,999 | 121 | 6.4% |
| $200,000+ | 49 | 2.6% |
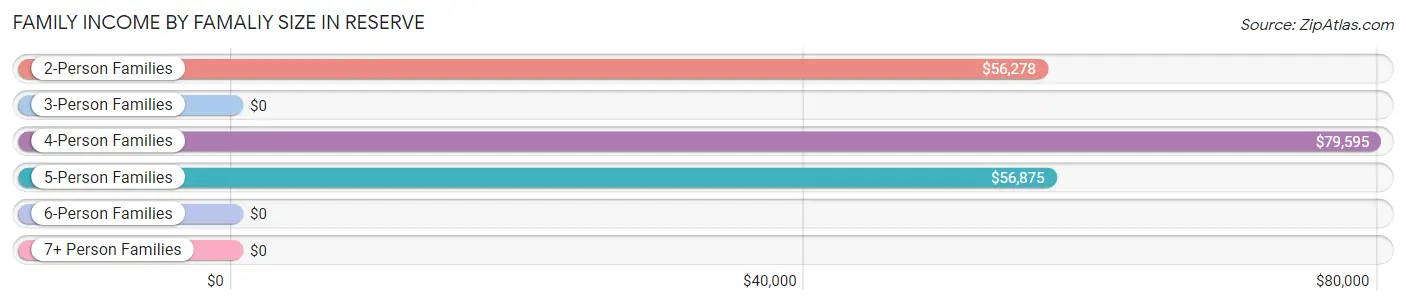
Family Income by Famaliy Size in Reserve
4-person families (434 | 23.0%) account for the highest median family income in Reserve with $79,595 per family, while 2-person families (734 | 38.9%) have the highest median income of $28,139 per family member.
| Income Bracket | # Families | Median Income |
| 2-Person Families | 734 (38.9%) | $56,278 |
| 3-Person Families | 565 (30.0%) | $0 |
| 4-Person Families | 434 (23.0%) | $79,595 |
| 5-Person Families | 102 (5.4%) | $56,875 |
| 6-Person Families | 12 (0.6%) | $0 |
| 7+ Person Families | 38 (2.0%) | $0 |
| Total | 1,885 (100.0%) | $72,426 |
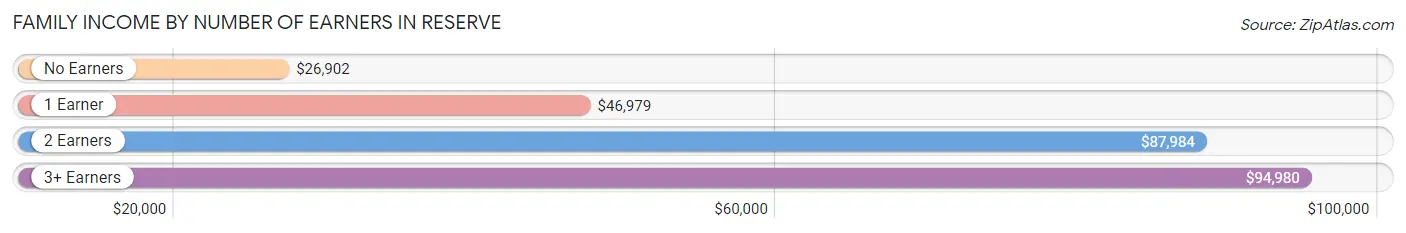
Family Income by Number of Earners in Reserve
The median family income in Reserve is $72,426, with families comprising 3+ earners (385) having the highest median family income of $94,980, while families with no earners (440) have the lowest median family income of $26,902, accounting for 20.4% and 23.3% of families, respectively.
| Number of Earners | # Families | Median Income |
| No Earners | 440 (23.3%) | $26,902 |
| 1 Earner | 624 (33.1%) | $46,979 |
| 2 Earners | 436 (23.1%) | $87,984 |
| 3+ Earners | 385 (20.4%) | $94,980 |
| Total | 1,885 (100.0%) | $72,426 |
Household Income in Reserve
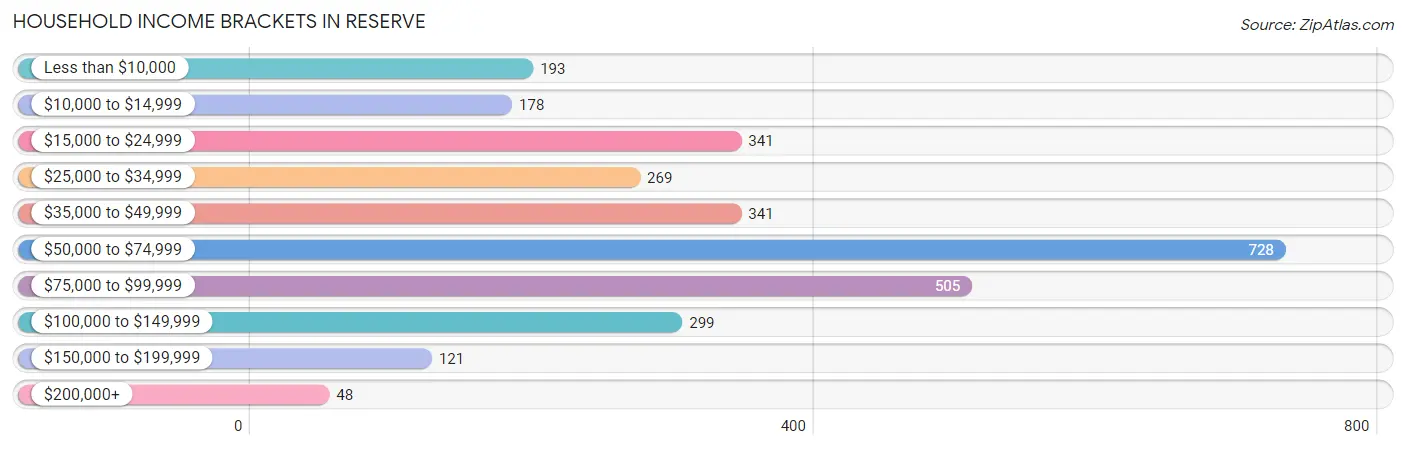
Household Income Brackets in Reserve
With 728 households falling in the category, the $50,000 to $74,999 income range is the most frequent in Reserve, accounting for 24.1% of all households. In contrast, only 48 households (1.6%) fall into the $200,000+ income bracket, making it the least populous group.
| Income Bracket | # Households | % Households |
| Less than $10,000 | 193 | 6.4% |
| $10,000 to $14,999 | 178 | 5.9% |
| $15,000 to $24,999 | 341 | 11.3% |
| $25,000 to $34,999 | 269 | 8.9% |
| $35,000 to $49,999 | 341 | 11.3% |
| $50,000 to $74,999 | 728 | 24.1% |
| $75,000 to $99,999 | 505 | 16.7% |
| $100,000 to $149,999 | 299 | 9.9% |
| $150,000 to $199,999 | 121 | 4.0% |
| $200,000+ | 48 | 1.6% |
Household Income by Householder Age in Reserve
The median household income in Reserve is $55,183, with the highest median household income of $76,333 found in the 25 to 44 years age bracket for the primary householder. A total of 726 households (24.0%) fall into this category. Meanwhile, the 15 to 24 years age bracket for the primary householder has the lowest median household income of $0, with 83 households (2.8%) in this group.
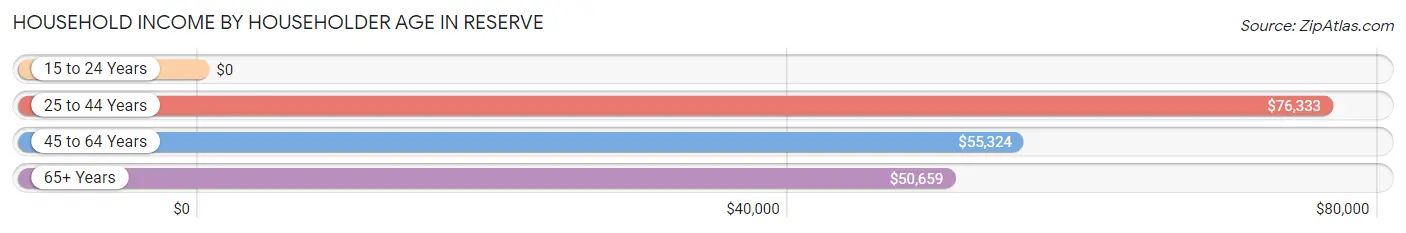
| Income Bracket | # Households | Median Income |
| 15 to 24 Years | 83 (2.8%) | $0 |
| 25 to 44 Years | 726 (24.0%) | $76,333 |
| 45 to 64 Years | 1,355 (44.9%) | $55,324 |
| 65+ Years | 857 (28.4%) | $50,659 |
| Total | 3,021 (100.0%) | $55,183 |
Poverty in Reserve
Income Below Poverty by Sex and Age in Reserve
With 18.9% poverty level for males and 21.1% for females among the residents of Reserve, 16 and 17 year old males and under 5 year old females are the most vulnerable to poverty, with 33 males (52.4%) and 206 females (75.7%) in their respective age groups living below the poverty level.
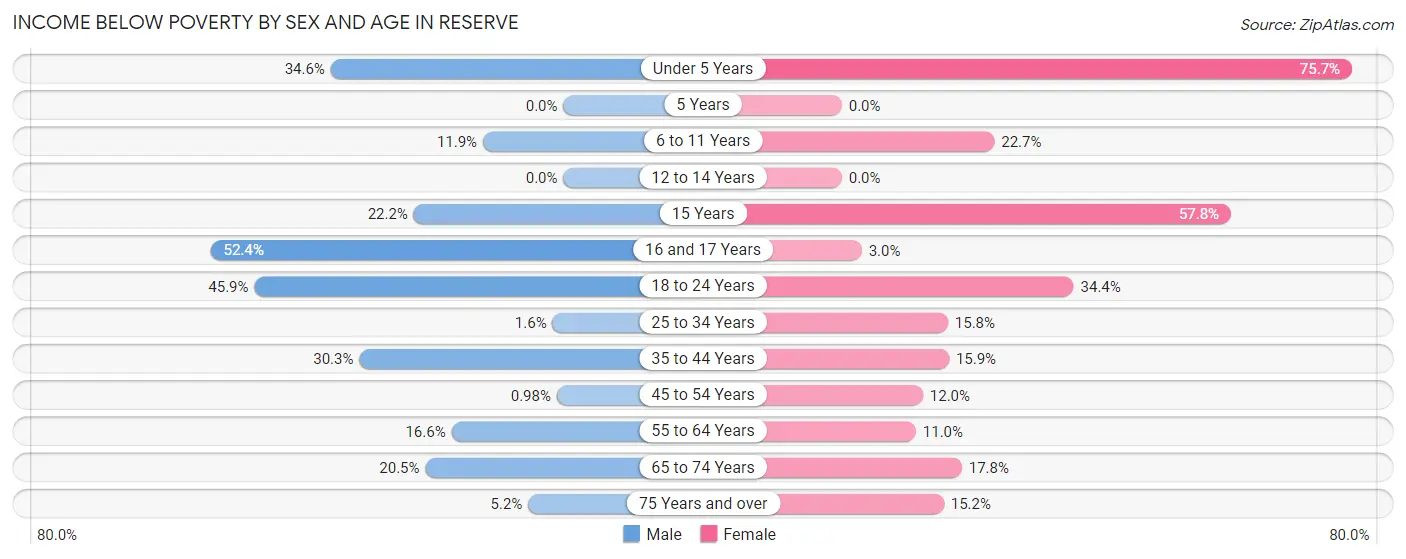
| Age Bracket | Male | Female |
| Under 5 Years | 76 (34.5%) | 206 (75.7%) |
| 5 Years | 0 (0.0%) | 0 (0.0%) |
| 6 to 11 Years | 51 (11.9%) | 41 (22.7%) |
| 12 to 14 Years | 0 (0.0%) | 0 (0.0%) |
| 15 Years | 4 (22.2%) | 26 (57.8%) |
| 16 and 17 Years | 33 (52.4%) | 4 (3.0%) |
| 18 to 24 Years | 295 (45.9%) | 127 (34.4%) |
| 25 to 34 Years | 10 (1.6%) | 77 (15.8%) |
| 35 to 44 Years | 140 (30.3%) | 84 (15.9%) |
| 45 to 54 Years | 5 (1.0%) | 81 (12.0%) |
| 55 to 64 Years | 95 (16.6%) | 33 (11.0%) |
| 65 to 74 Years | 76 (20.5%) | 80 (17.8%) |
| 75 Years and over | 7 (5.2%) | 30 (15.1%) |
| Total | 792 (18.9%) | 789 (21.1%) |
Income Above Poverty by Sex and Age in Reserve
According to the poverty statistics in Reserve, males aged 12 to 14 years and females aged 5 years are the age groups that are most secure financially, with 100.0% of males and 100.0% of females in these age groups living above the poverty line.
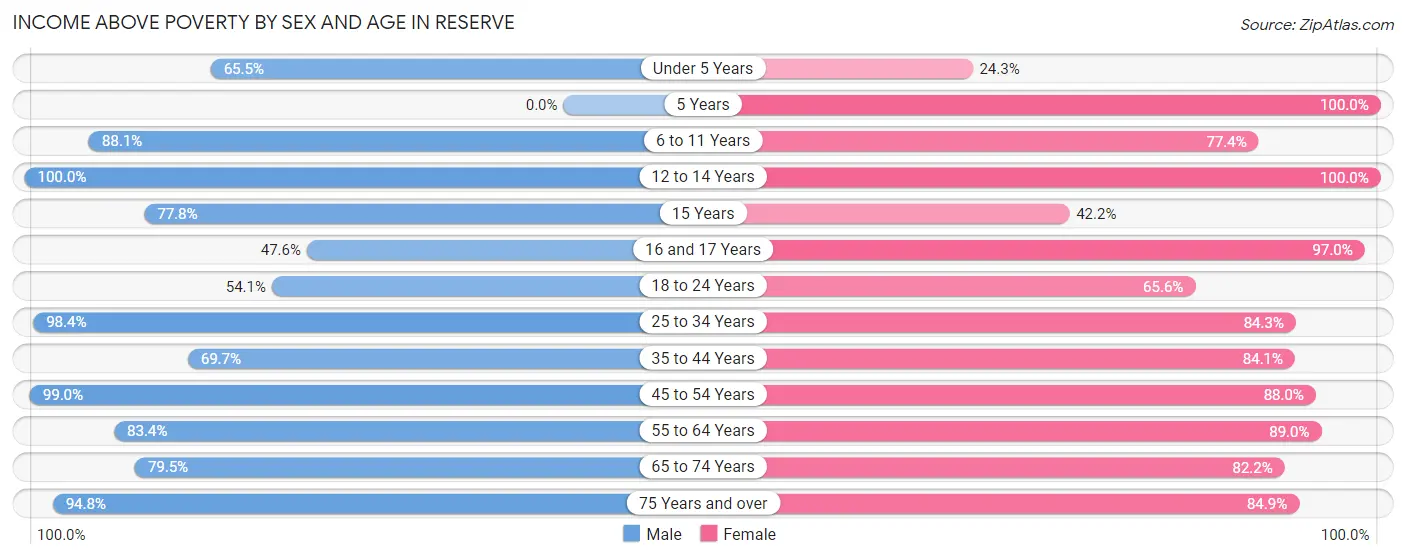
| Age Bracket | Male | Female |
| Under 5 Years | 144 (65.4%) | 66 (24.3%) |
| 5 Years | 0 (0.0%) | 58 (100.0%) |
| 6 to 11 Years | 376 (88.1%) | 140 (77.3%) |
| 12 to 14 Years | 149 (100.0%) | 34 (100.0%) |
| 15 Years | 14 (77.8%) | 19 (42.2%) |
| 16 and 17 Years | 30 (47.6%) | 131 (97.0%) |
| 18 to 24 Years | 348 (54.1%) | 242 (65.6%) |
| 25 to 34 Years | 613 (98.4%) | 412 (84.3%) |
| 35 to 44 Years | 322 (69.7%) | 444 (84.1%) |
| 45 to 54 Years | 507 (99.0%) | 592 (88.0%) |
| 55 to 64 Years | 477 (83.4%) | 267 (89.0%) |
| 65 to 74 Years | 295 (79.5%) | 369 (82.2%) |
| 75 Years and over | 127 (94.8%) | 168 (84.9%) |
| Total | 3,402 (81.1%) | 2,942 (78.8%) |
Income Below Poverty Among Married-Couple Families in Reserve
The poverty statistics for married-couple families in Reserve show that 0.9% or 9 of the total 999 families live below the poverty line. Families with no children have the highest poverty rate of 1.2%, comprising of 9 families. On the other hand, families with 1 or 2 children have the lowest poverty rate of 0.0%, which includes 0 families.
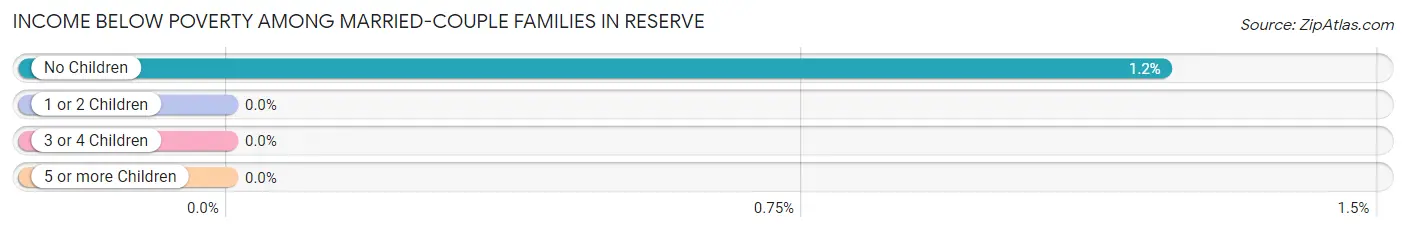
| Children | Above Poverty | Below Poverty |
| No Children | 729 (98.8%) | 9 (1.2%) |
| 1 or 2 Children | 229 (100.0%) | 0 (0.0%) |
| 3 or 4 Children | 32 (100.0%) | 0 (0.0%) |
| 5 or more Children | 0 (0.0%) | 0 (0.0%) |
| Total | 990 (99.1%) | 9 (0.9%) |
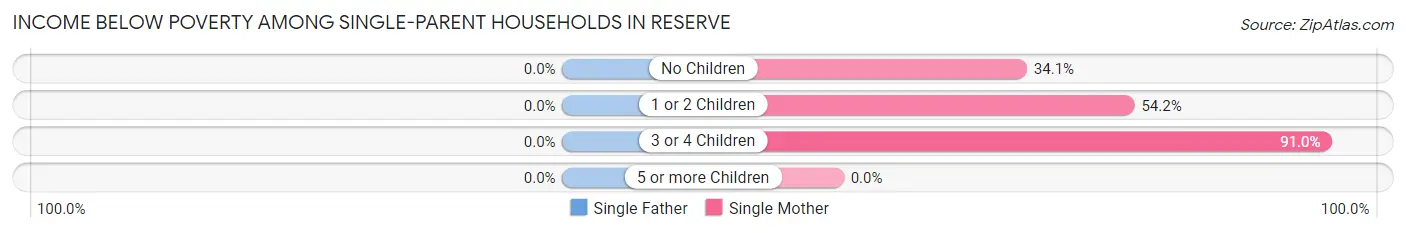
Income Below Poverty Among Single-Parent Households in Reserve
| Children | Single Father | Single Mother |
| No Children | 0 (0.0%) | 100 (34.1%) |
| 1 or 2 Children | 0 (0.0%) | 117 (54.2%) |
| 3 or 4 Children | 0 (0.0%) | 81 (91.0%) |
| 5 or more Children | 0 (0.0%) | 0 (0.0%) |
| Total | 0 (0.0%) | 298 (49.8%) |
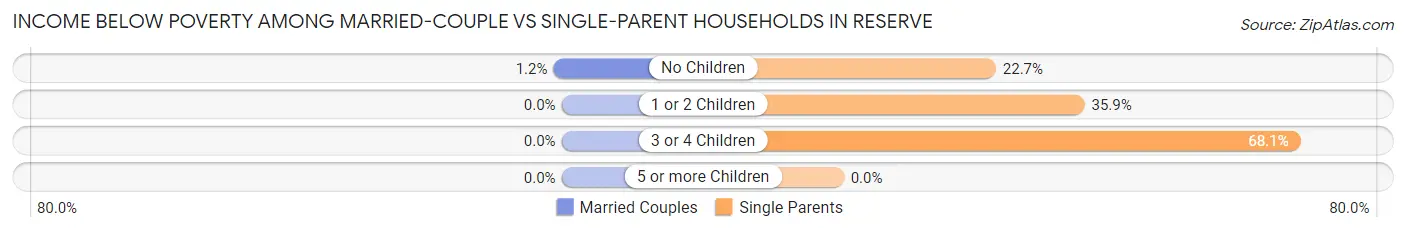
Income Below Poverty Among Married-Couple vs Single-Parent Households in Reserve
The poverty data for Reserve shows that 9 of the married-couple family households (0.9%) and 298 of the single-parent households (33.6%) are living below the poverty level. Within the married-couple family households, those with no children have the highest poverty rate, with 9 households (1.2%) falling below the poverty line. Among the single-parent households, those with 3 or 4 children have the highest poverty rate, with 81 household (68.1%) living below poverty.
| Children | Married-Couple Families | Single-Parent Households |
| No Children | 9 (1.2%) | 100 (22.7%) |
| 1 or 2 Children | 0 (0.0%) | 117 (35.9%) |
| 3 or 4 Children | 0 (0.0%) | 81 (68.1%) |
| 5 or more Children | 0 (0.0%) | 0 (0.0%) |
| Total | 9 (0.9%) | 298 (33.6%) |
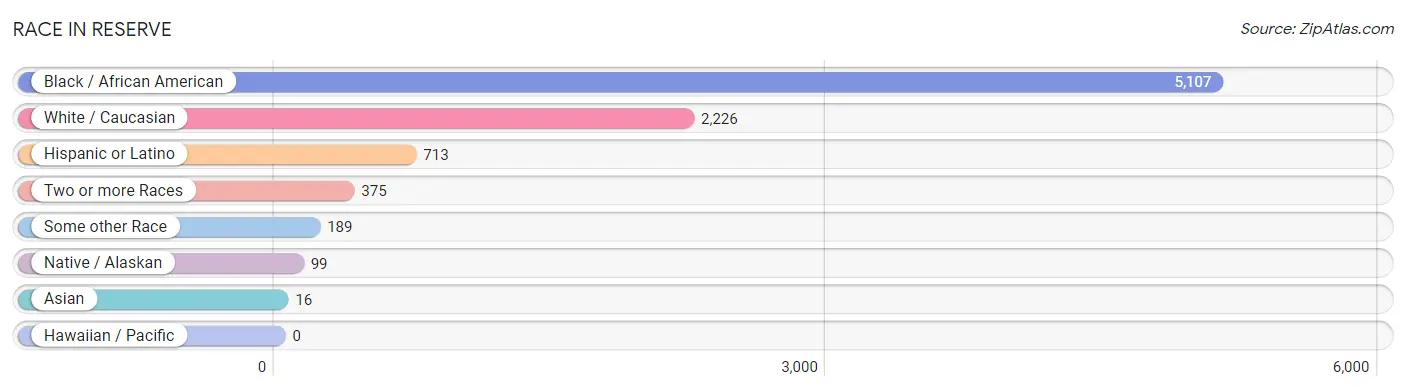
Race in Reserve
The most populous races in Reserve are Black / African American (5,107 | 63.7%), White / Caucasian (2,226 | 27.8%), and Hispanic or Latino (713 | 8.9%).
| Race | # Population | % Population |
| Asian | 16 | 0.2% |
| Black / African American | 5,107 | 63.7% |
| Hawaiian / Pacific | 0 | 0.0% |
| Hispanic or Latino | 713 | 8.9% |
| Native / Alaskan | 99 | 1.2% |
| White / Caucasian | 2,226 | 27.8% |
| Two or more Races | 375 | 4.7% |
| Some other Race | 189 | 2.4% |
| Total | 8,012 | 100.0% |
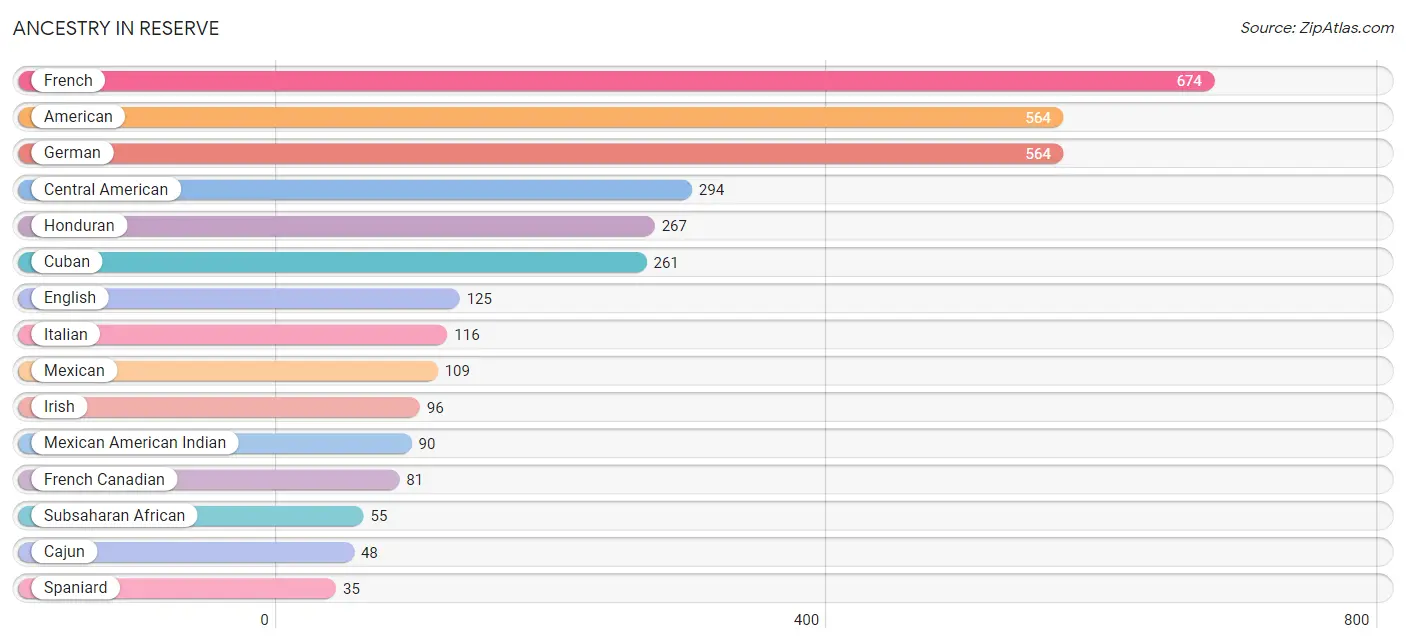
Ancestry in Reserve
The most populous ancestries reported in Reserve are French (674 | 8.4%), American (564 | 7.0%), German (564 | 7.0%), Central American (294 | 3.7%), and Honduran (267 | 3.3%), together accounting for 29.5% of all Reserve residents.
| Ancestry | # Population | % Population |
| African | 24 | 0.3% |
| American | 564 | 7.0% |
| Bhutanese | 9 | 0.1% |
| Cajun | 48 | 0.6% |
| Celtic | 14 | 0.2% |
| Central American | 294 | 3.7% |
| Cuban | 261 | 3.3% |
| English | 125 | 1.6% |
| French | 674 | 8.4% |
| French Canadian | 81 | 1.0% |
| German | 564 | 7.0% |
| Honduran | 267 | 3.3% |
| Indian (Asian) | 16 | 0.2% |
| Irish | 96 | 1.2% |
| Italian | 116 | 1.5% |
| Mexican | 109 | 1.4% |
| Mexican American Indian | 90 | 1.1% |
| Navajo | 9 | 0.1% |
| Panamanian | 27 | 0.3% |
| Romanian | 23 | 0.3% |
| Scotch-Irish | 18 | 0.2% |
| Spaniard | 35 | 0.4% |
| Spanish | 14 | 0.2% |
| Subsaharan African | 55 | 0.7% | View All 24 Rows |
Immigrants in Reserve
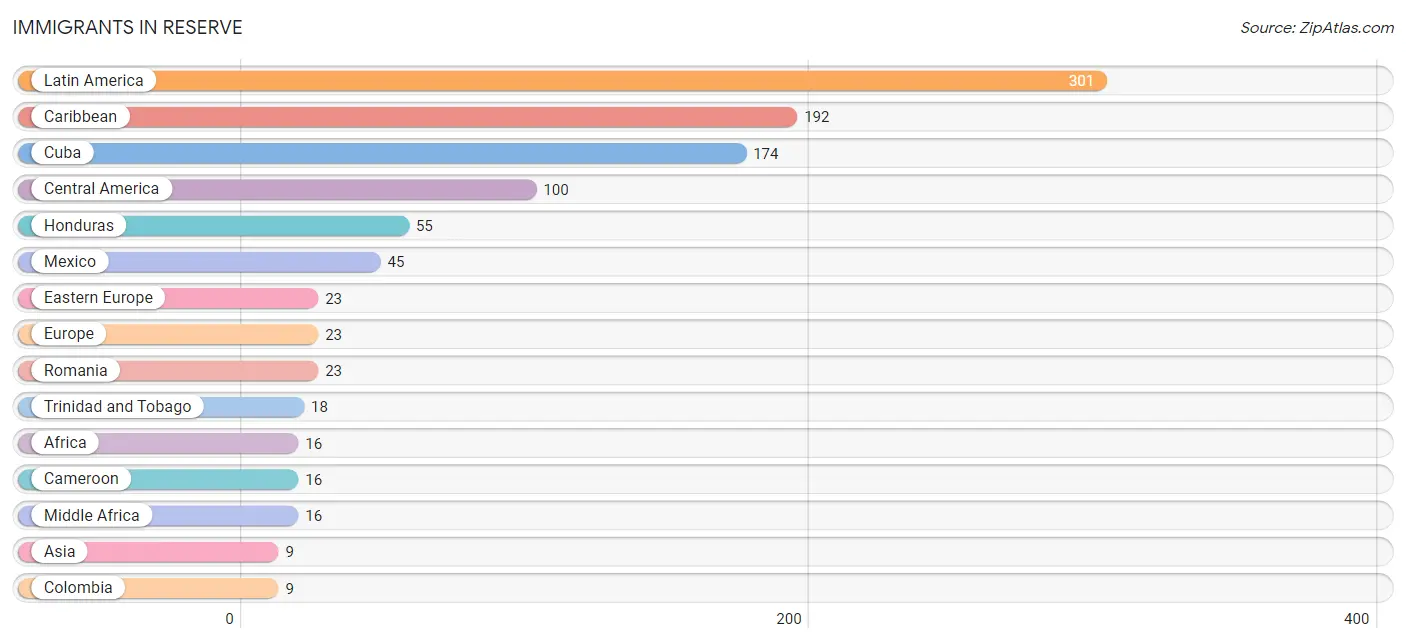
The most numerous immigrant groups reported in Reserve came from Latin America (301 | 3.8%), Caribbean (192 | 2.4%), Cuba (174 | 2.2%), Central America (100 | 1.3%), and Honduras (55 | 0.7%), together accounting for 10.3% of all Reserve residents.
| Immigration Origin | # Population | % Population |
| Africa | 16 | 0.2% |
| Asia | 9 | 0.1% |
| Cameroon | 16 | 0.2% |
| Caribbean | 192 | 2.4% |
| Central America | 100 | 1.3% |
| Colombia | 9 | 0.1% |
| Cuba | 174 | 2.2% |
| Eastern Asia | 9 | 0.1% |
| Eastern Europe | 23 | 0.3% |
| Europe | 23 | 0.3% |
| Honduras | 55 | 0.7% |
| Japan | 9 | 0.1% |
| Latin America | 301 | 3.8% |
| Mexico | 45 | 0.6% |
| Middle Africa | 16 | 0.2% |
| Romania | 23 | 0.3% |
| South America | 9 | 0.1% |
| Trinidad and Tobago | 18 | 0.2% | View All 18 Rows |
Sex and Age in Reserve
Sex and Age in Reserve
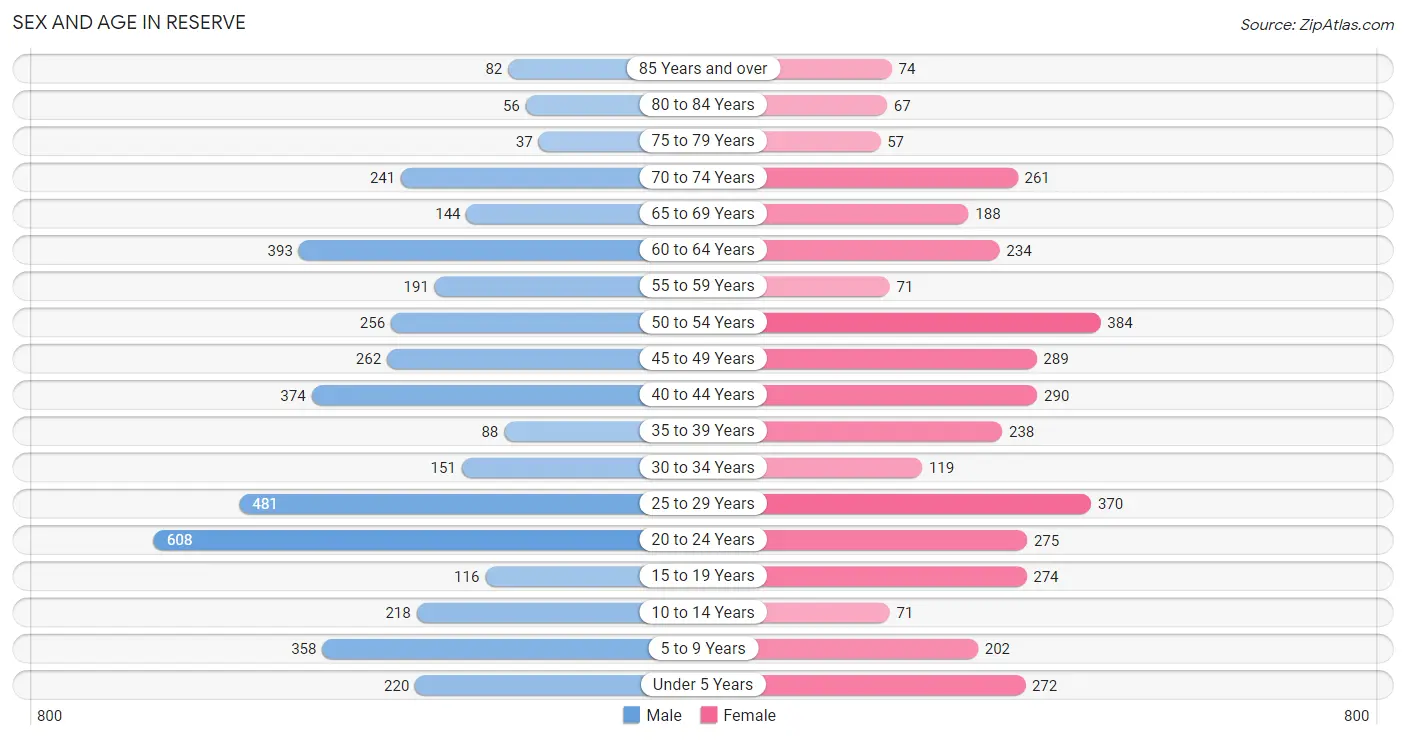
The most populous age groups in Reserve are 20 to 24 Years (608 | 14.2%) for men and 50 to 54 Years (384 | 10.3%) for women.
| Age Bracket | Male | Female |
| Under 5 Years | 220 (5.1%) | 272 (7.3%) |
| 5 to 9 Years | 358 (8.4%) | 202 (5.4%) |
| 10 to 14 Years | 218 (5.1%) | 71 (1.9%) |
| 15 to 19 Years | 116 (2.7%) | 274 (7.3%) |
| 20 to 24 Years | 608 (14.2%) | 275 (7.4%) |
| 25 to 29 Years | 481 (11.3%) | 370 (9.9%) |
| 30 to 34 Years | 151 (3.5%) | 119 (3.2%) |
| 35 to 39 Years | 88 (2.1%) | 238 (6.4%) |
| 40 to 44 Years | 374 (8.7%) | 290 (7.8%) |
| 45 to 49 Years | 262 (6.1%) | 289 (7.7%) |
| 50 to 54 Years | 256 (6.0%) | 384 (10.3%) |
| 55 to 59 Years | 191 (4.5%) | 71 (1.9%) |
| 60 to 64 Years | 393 (9.2%) | 234 (6.3%) |
| 65 to 69 Years | 144 (3.4%) | 188 (5.0%) |
| 70 to 74 Years | 241 (5.6%) | 261 (7.0%) |
| 75 to 79 Years | 37 (0.9%) | 57 (1.5%) |
| 80 to 84 Years | 56 (1.3%) | 67 (1.8%) |
| 85 Years and over | 82 (1.9%) | 74 (2.0%) |
| Total | 4,276 (100.0%) | 3,736 (100.0%) |
Families and Households in Reserve
Median Family Size in Reserve
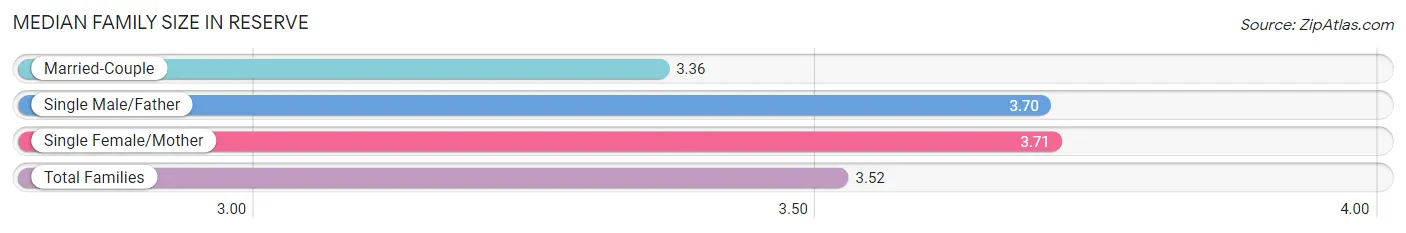
The median family size in Reserve is 3.52 persons per family, with single female/mother families (598 | 31.7%) accounting for the largest median family size of 3.71 persons per family. On the other hand, married-couple families (999 | 53.0%) represent the smallest median family size with 3.36 persons per family.
| Family Type | # Families | Family Size |
| Married-Couple | 999 (53.0%) | 3.36 |
| Single Male/Father | 288 (15.3%) | 3.70 |
| Single Female/Mother | 598 (31.7%) | 3.71 |
| Total Families | 1,885 (100.0%) | 3.52 |
Median Household Size in Reserve
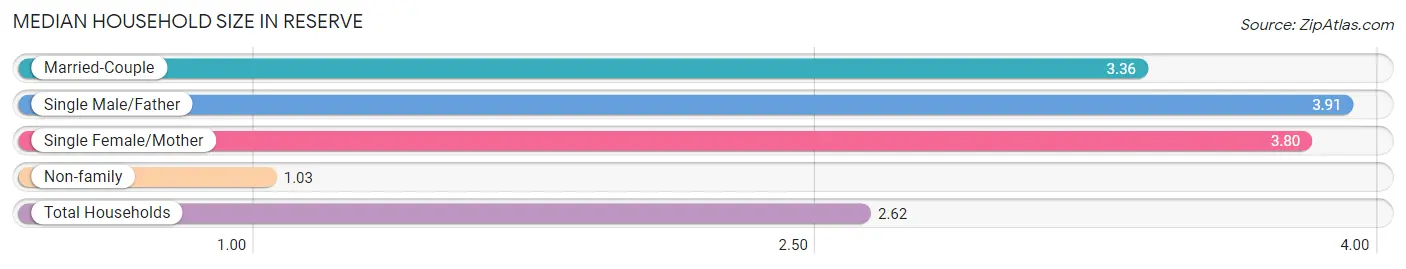
The median household size in Reserve is 2.62 persons per household, with single male/father households (288 | 9.5%) accounting for the largest median household size of 3.91 persons per household. non-family households (1,136 | 37.6%) represent the smallest median household size with 1.03 persons per household.
| Household Type | # Households | Household Size |
| Married-Couple | 999 (33.1%) | 3.36 |
| Single Male/Father | 288 (9.5%) | 3.91 |
| Single Female/Mother | 598 (19.8%) | 3.80 |
| Non-family | 1,136 (37.6%) | 1.03 |
| Total Households | 3,021 (100.0%) | 2.62 |
Household Size by Marriage Status in Reserve
Out of a total of 3,021 households in Reserve, 1,885 (62.4%) are family households, while 1,136 (37.6%) are nonfamily households. The most numerous type of family households are 2-person households, comprising 724, and the most common type of nonfamily households are 1-person households, comprising 1,123.
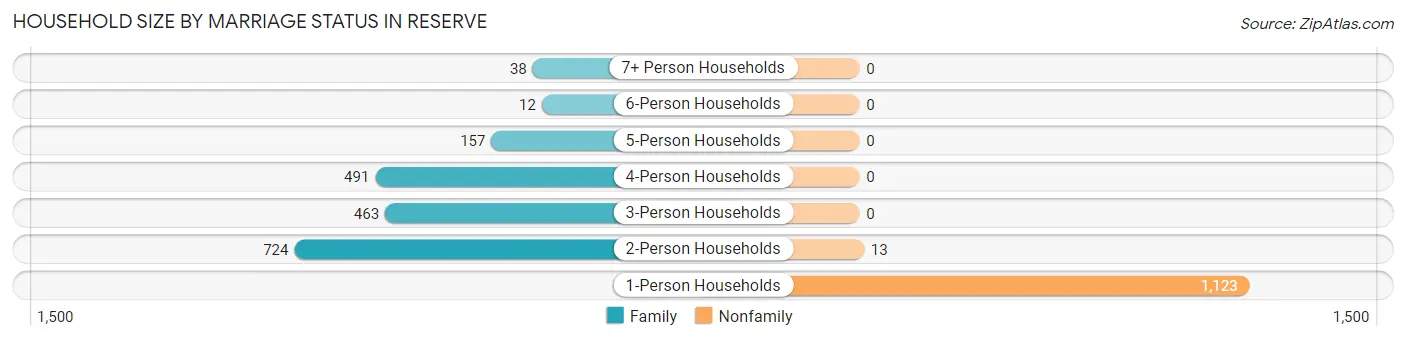
| Household Size | Family Households | Nonfamily Households |
| 1-Person Households | - | 1,123 (37.2%) |
| 2-Person Households | 724 (24.0%) | 13 (0.4%) |
| 3-Person Households | 463 (15.3%) | 0 (0.0%) |
| 4-Person Households | 491 (16.3%) | 0 (0.0%) |
| 5-Person Households | 157 (5.2%) | 0 (0.0%) |
| 6-Person Households | 12 (0.4%) | 0 (0.0%) |
| 7+ Person Households | 38 (1.3%) | 0 (0.0%) |
| Total | 1,885 (62.4%) | 1,136 (37.6%) |
Female Fertility in Reserve
Fertility by Age in Reserve
Average fertility rate in Reserve is 41.0 births per 1,000 women. Women in the age bracket of 20 to 34 years have the highest fertility rate with 103.0 births per 1,000 women. Women in the age bracket of 20 to 34 years acount for 100.0% of all women with births.
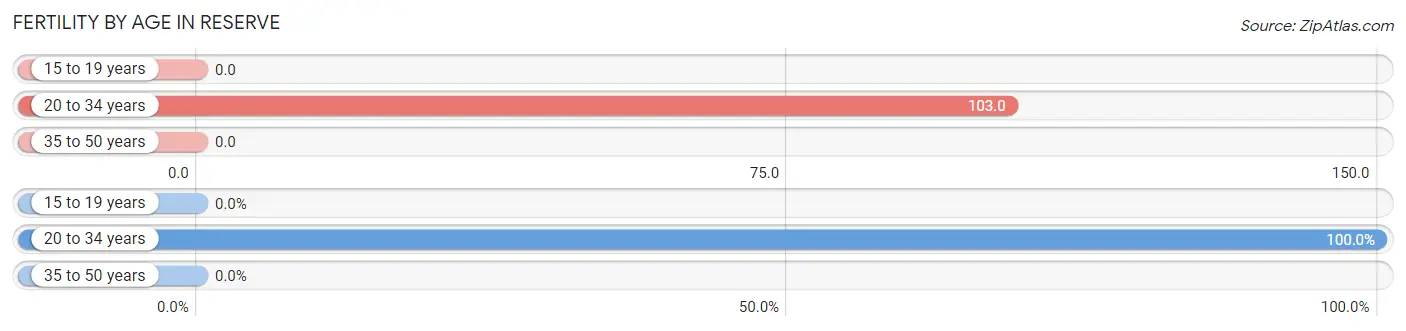
| Age Bracket | Women with Births | Births / 1,000 Women |
| 15 to 19 years | 0 (0.0%) | 0.0 |
| 20 to 34 years | 79 (100.0%) | 103.0 |
| 35 to 50 years | 0 (0.0%) | 0.0 |
| Total | 79 (100.0%) | 41.0 |
Fertility by Age by Marriage Status in Reserve
30.4% of women with births (79) in Reserve are married. The highest percentage of unmarried women with births falls into 20 to 34 years age bracket with 69.6% of them unmarried at the time of birth, while the lowest percentage of unmarried women with births belong to 20 to 34 years age bracket with 69.6% of them unmarried.
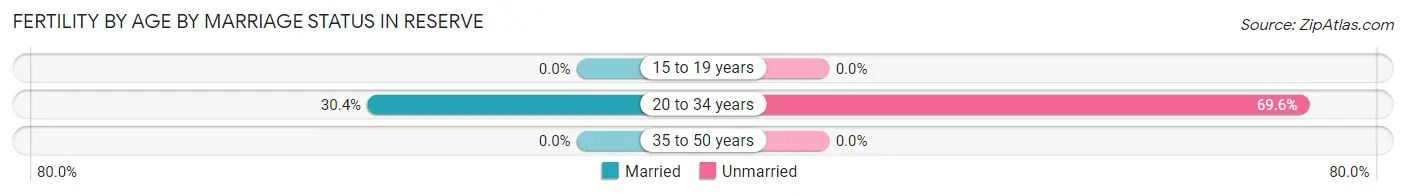
| Age Bracket | Married | Unmarried |
| 15 to 19 years | 0 (0.0%) | 0 (0.0%) |
| 20 to 34 years | 24 (30.4%) | 55 (69.6%) |
| 35 to 50 years | 0 (0.0%) | 0 (0.0%) |
| Total | 24 (30.4%) | 55 (69.6%) |
Fertility by Education in Reserve
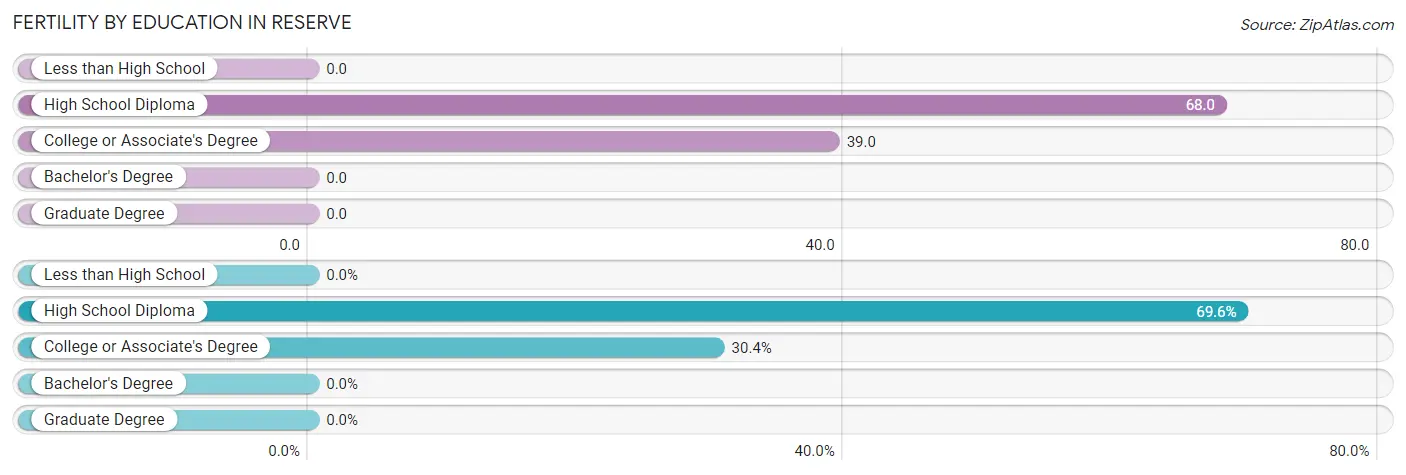
| Educational Attainment | Women with Births | Births / 1,000 Women |
| Less than High School | 0 (0.0%) | 0.0 |
| High School Diploma | 55 (69.6%) | 68.0 |
| College or Associate's Degree | 24 (30.4%) | 39.0 |
| Bachelor's Degree | 0 (0.0%) | 0.0 |
| Graduate Degree | 0 (0.0%) | 0.0 |
| Total | 79 (100.0%) | 41.0 |
Fertility by Education by Marriage Status in Reserve
69.6% of women with births in Reserve are unmarried. Women with the educational attainment of college or associate's degree are most likely to be married with 100.0% of them married at childbirth, while women with the educational attainment of high school diploma are least likely to be married with 100.0% of them unmarried at childbirth.
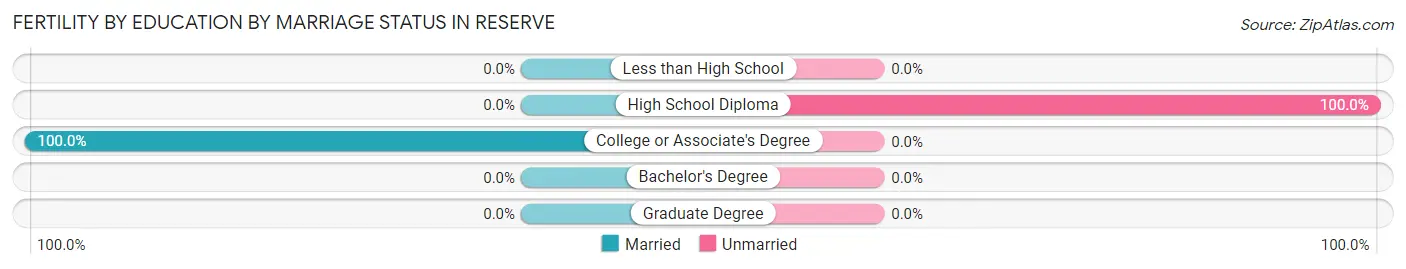
| Educational Attainment | Married | Unmarried |
| Less than High School | 0 (0.0%) | 0 (0.0%) |
| High School Diploma | 0 (0.0%) | 55 (100.0%) |
| College or Associate's Degree | 24 (100.0%) | 0 (0.0%) |
| Bachelor's Degree | 0 (0.0%) | 0 (0.0%) |
| Graduate Degree | 0 (0.0%) | 0 (0.0%) |
| Total | 24 (30.4%) | 55 (69.6%) |
Employment Characteristics in Reserve
Employment by Class of Employer in Reserve
Among the 3,325 employed individuals in Reserve, private company employees (2,368 | 71.2%), local government employees (278 | 8.4%), and self-employed (not incorporated) (173 | 5.2%) make up the most common classes of employment.
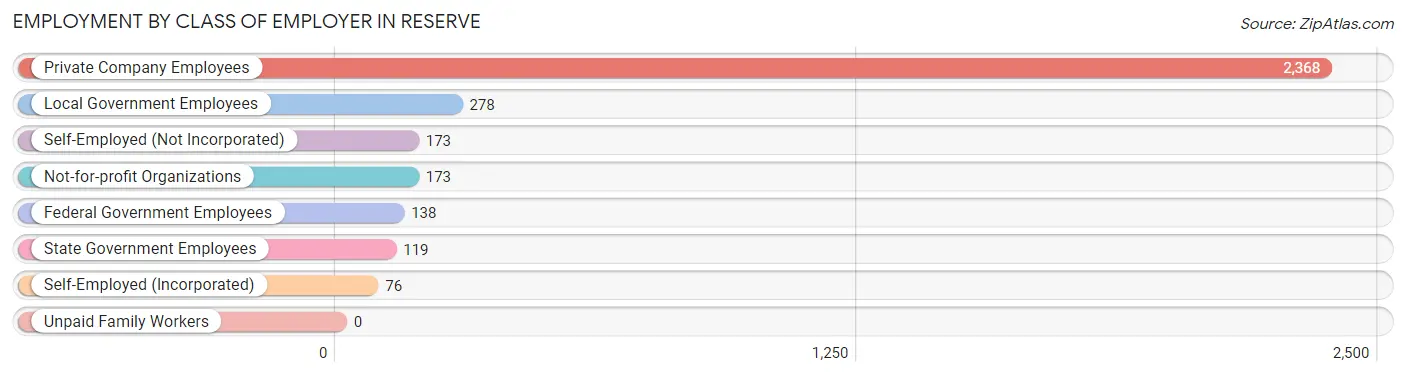
| Employer Class | # Employees | % Employees |
| Private Company Employees | 2,368 | 71.2% |
| Self-Employed (Incorporated) | 76 | 2.3% |
| Self-Employed (Not Incorporated) | 173 | 5.2% |
| Not-for-profit Organizations | 173 | 5.2% |
| Local Government Employees | 278 | 8.4% |
| State Government Employees | 119 | 3.6% |
| Federal Government Employees | 138 | 4.2% |
| Unpaid Family Workers | 0 | 0.0% |
| Total | 3,325 | 100.0% |
Employment Status by Age in Reserve
According to the labor force statistics for Reserve, out of the total population over 16 years of age (6,608), 58.5% or 3,866 individuals are in the labor force, with 13.5% or 522 of them unemployed. The age group with the highest labor force participation rate is 30 to 34 years, with 91.1% or 246 individuals in the labor force. Within the labor force, the 20 to 24 years age range has the highest percentage of unemployed individuals, with 34.0% or 250 of them being unemployed.
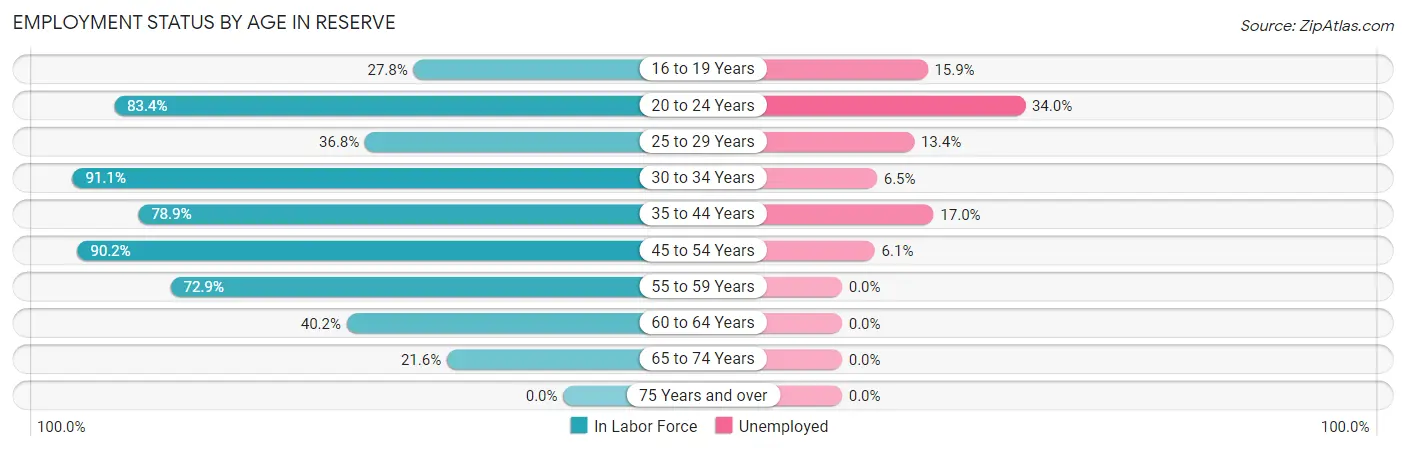
| Age Bracket | In Labor Force | Unemployed |
| 16 to 19 Years | 91 (27.8%) | 14 (15.9%) |
| 20 to 24 Years | 736 (83.4%) | 250 (34.0%) |
| 25 to 29 Years | 313 (36.8%) | 42 (13.4%) |
| 30 to 34 Years | 246 (91.1%) | 16 (6.5%) |
| 35 to 44 Years | 781 (78.9%) | 133 (17.0%) |
| 45 to 54 Years | 1,074 (90.2%) | 66 (6.1%) |
| 55 to 59 Years | 191 (72.9%) | 0 (0.0%) |
| 60 to 64 Years | 252 (40.2%) | 0 (0.0%) |
| 65 to 74 Years | 180 (21.6%) | 0 (0.0%) |
| 75 Years and over | 0 (0.0%) | 0 (0.0%) |
| Total | 3,866 (58.5%) | 522 (13.5%) |
Employment Status by Educational Attainment in Reserve
According to labor force statistics for Reserve, 68.2% of individuals (2,858) out of the total population between 25 and 64 years of age (4,191) are in the labor force, with 9.0% or 257 of them being unemployed. The group with the highest labor force participation rate are those with the educational attainment of college / associate degree, with 83.8% or 897 individuals in the labor force. Within the labor force, individuals with less than high school education have the highest percentage of unemployment, with 45.5% or 157 of them being unemployed.
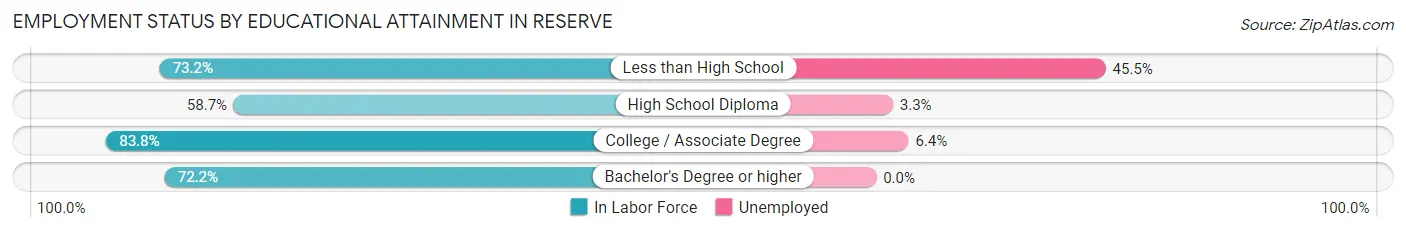
| Educational Attainment | In Labor Force | Unemployed |
| Less than High School | 345 (73.2%) | 214 (45.5%) |
| High School Diploma | 1,289 (58.7%) | 72 (3.3%) |
| College / Associate Degree | 897 (83.8%) | 69 (6.4%) |
| Bachelor's Degree or higher | 327 (72.2%) | 0 (0.0%) |
| Total | 2,858 (68.2%) | 377 (9.0%) |
Employment Occupations by Sex in Reserve
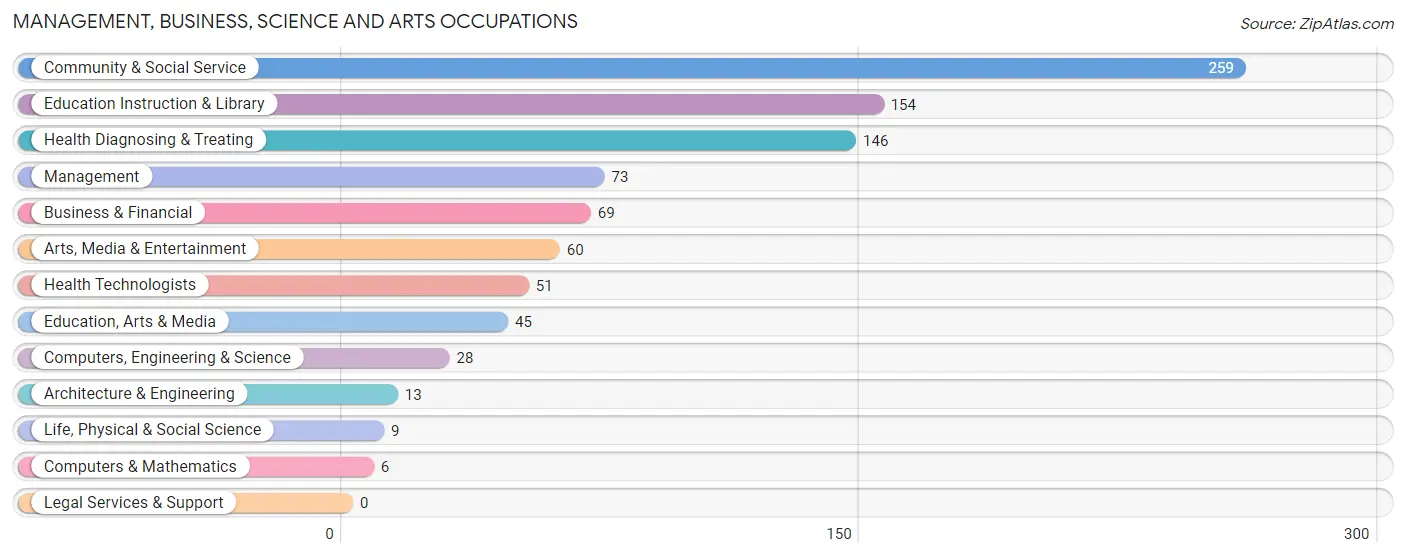
Management, Business, Science and Arts Occupations
The most common Management, Business, Science and Arts occupations in Reserve are Community & Social Service (259 | 7.8%), Education Instruction & Library (154 | 4.6%), Health Diagnosing & Treating (146 | 4.4%), Management (73 | 2.2%), and Business & Financial (69 | 2.1%).
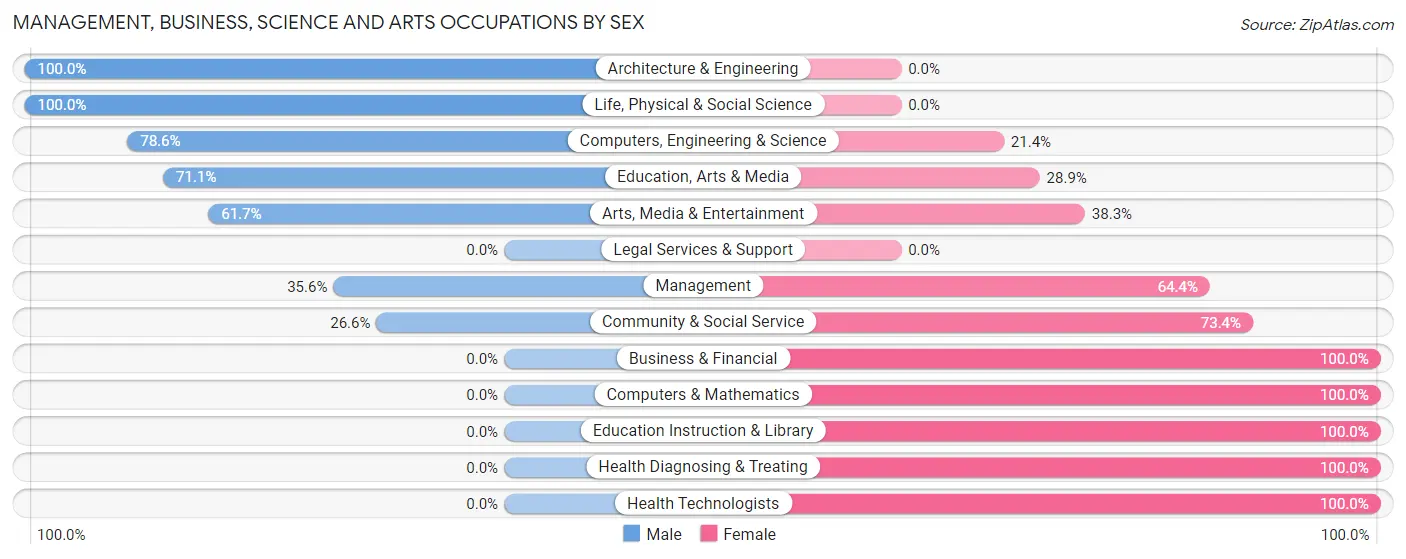
Management, Business, Science and Arts Occupations by Sex
Within the Management, Business, Science and Arts occupations in Reserve, the most male-oriented occupations are Architecture & Engineering (100.0%), Life, Physical & Social Science (100.0%), and Computers, Engineering & Science (78.6%), while the most female-oriented occupations are Business & Financial (100.0%), Computers & Mathematics (100.0%), and Education Instruction & Library (100.0%).
| Occupation | Male | Female |
| Management | 26 (35.6%) | 47 (64.4%) |
| Business & Financial | 0 (0.0%) | 69 (100.0%) |
| Computers, Engineering & Science | 22 (78.6%) | 6 (21.4%) |
| Computers & Mathematics | 0 (0.0%) | 6 (100.0%) |
| Architecture & Engineering | 13 (100.0%) | 0 (0.0%) |
| Life, Physical & Social Science | 9 (100.0%) | 0 (0.0%) |
| Community & Social Service | 69 (26.6%) | 190 (73.4%) |
| Education, Arts & Media | 32 (71.1%) | 13 (28.9%) |
| Legal Services & Support | 0 (0.0%) | 0 (0.0%) |
| Education Instruction & Library | 0 (0.0%) | 154 (100.0%) |
| Arts, Media & Entertainment | 37 (61.7%) | 23 (38.3%) |
| Health Diagnosing & Treating | 0 (0.0%) | 146 (100.0%) |
| Health Technologists | 0 (0.0%) | 51 (100.0%) |
| Total (Category) | 117 (20.3%) | 458 (79.6%) |
| Total (Overall) | 1,607 (48.2%) | 1,728 (51.8%) |
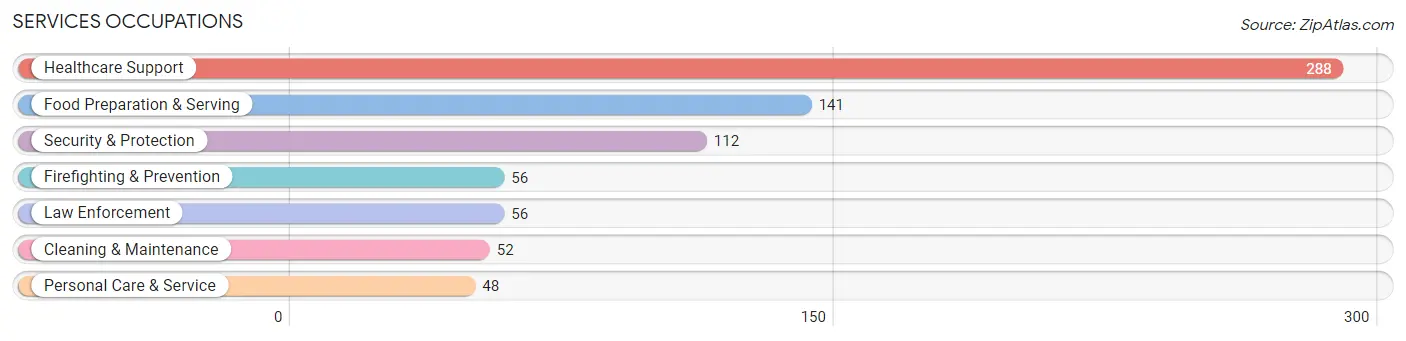
Services Occupations
The most common Services occupations in Reserve are Healthcare Support (288 | 8.6%), Food Preparation & Serving (141 | 4.2%), Security & Protection (112 | 3.4%), Firefighting & Prevention (56 | 1.7%), and Law Enforcement (56 | 1.7%).
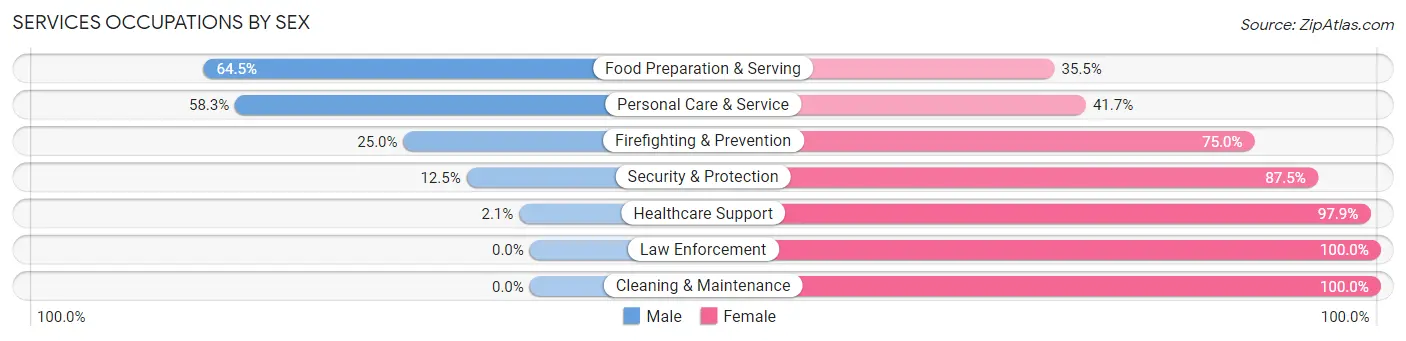
Services Occupations by Sex
Within the Services occupations in Reserve, the most male-oriented occupations are Food Preparation & Serving (64.5%), Personal Care & Service (58.3%), and Firefighting & Prevention (25.0%), while the most female-oriented occupations are Law Enforcement (100.0%), Cleaning & Maintenance (100.0%), and Healthcare Support (97.9%).
| Occupation | Male | Female |
| Healthcare Support | 6 (2.1%) | 282 (97.9%) |
| Security & Protection | 14 (12.5%) | 98 (87.5%) |
| Firefighting & Prevention | 14 (25.0%) | 42 (75.0%) |
| Law Enforcement | 0 (0.0%) | 56 (100.0%) |
| Food Preparation & Serving | 91 (64.5%) | 50 (35.5%) |
| Cleaning & Maintenance | 0 (0.0%) | 52 (100.0%) |
| Personal Care & Service | 28 (58.3%) | 20 (41.7%) |
| Total (Category) | 139 (21.7%) | 502 (78.3%) |
| Total (Overall) | 1,607 (48.2%) | 1,728 (51.8%) |
Sales and Office Occupations
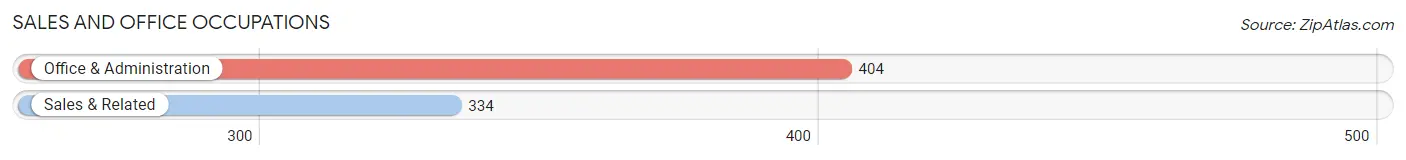
The most common Sales and Office occupations in Reserve are Office & Administration (404 | 12.1%), and Sales & Related (334 | 10.0%).
Sales and Office Occupations by Sex
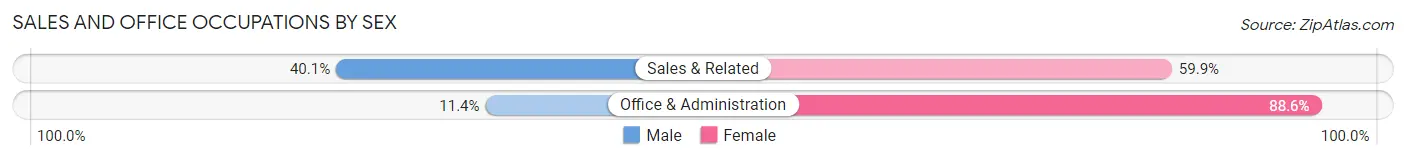
| Occupation | Male | Female |
| Sales & Related | 134 (40.1%) | 200 (59.9%) |
| Office & Administration | 46 (11.4%) | 358 (88.6%) |
| Total (Category) | 180 (24.4%) | 558 (75.6%) |
| Total (Overall) | 1,607 (48.2%) | 1,728 (51.8%) |
Natural Resources, Construction and Maintenance Occupations
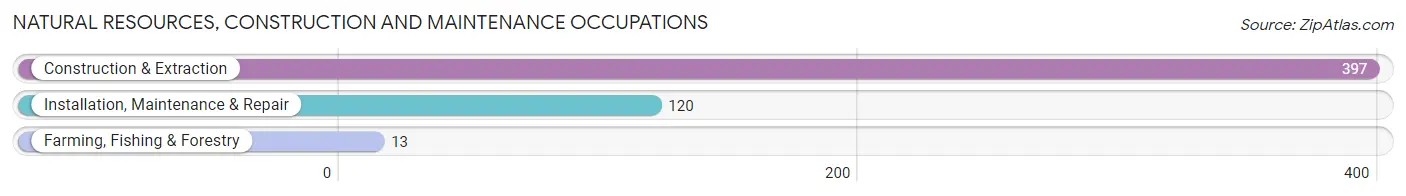
The most common Natural Resources, Construction and Maintenance occupations in Reserve are Construction & Extraction (397 | 11.9%), Installation, Maintenance & Repair (120 | 3.6%), and Farming, Fishing & Forestry (13 | 0.4%).
Natural Resources, Construction and Maintenance Occupations by Sex
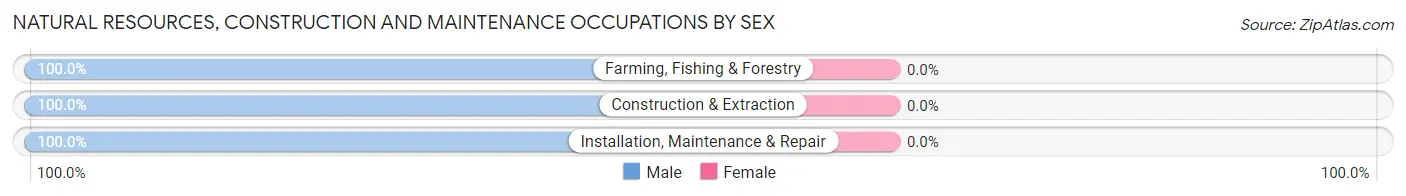
| Occupation | Male | Female |
| Farming, Fishing & Forestry | 13 (100.0%) | 0 (0.0%) |
| Construction & Extraction | 397 (100.0%) | 0 (0.0%) |
| Installation, Maintenance & Repair | 120 (100.0%) | 0 (0.0%) |
| Total (Category) | 530 (100.0%) | 0 (0.0%) |
| Total (Overall) | 1,607 (48.2%) | 1,728 (51.8%) |
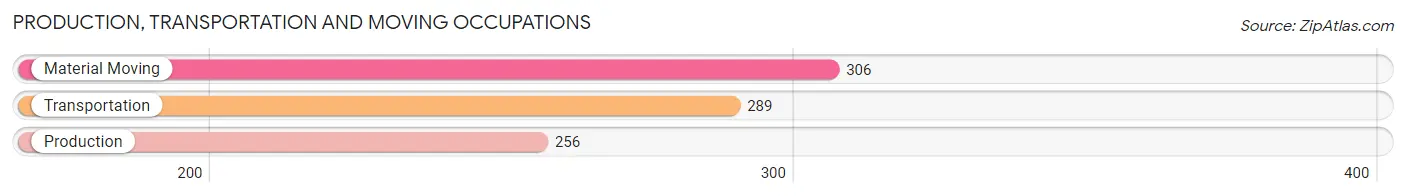
Production, Transportation and Moving Occupations
The most common Production, Transportation and Moving occupations in Reserve are Material Moving (306 | 9.2%), Transportation (289 | 8.7%), and Production (256 | 7.7%).
Production, Transportation and Moving Occupations by Sex
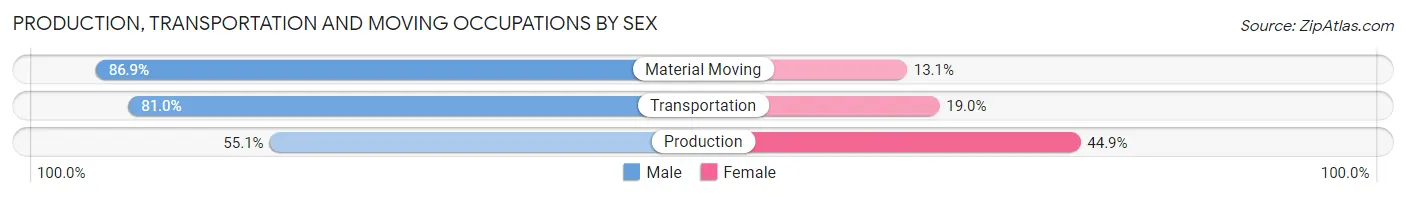
| Occupation | Male | Female |
| Production | 141 (55.1%) | 115 (44.9%) |
| Transportation | 234 (81.0%) | 55 (19.0%) |
| Material Moving | 266 (86.9%) | 40 (13.1%) |
| Total (Category) | 641 (75.3%) | 210 (24.7%) |
| Total (Overall) | 1,607 (48.2%) | 1,728 (51.8%) |
Employment Industries by Sex in Reserve
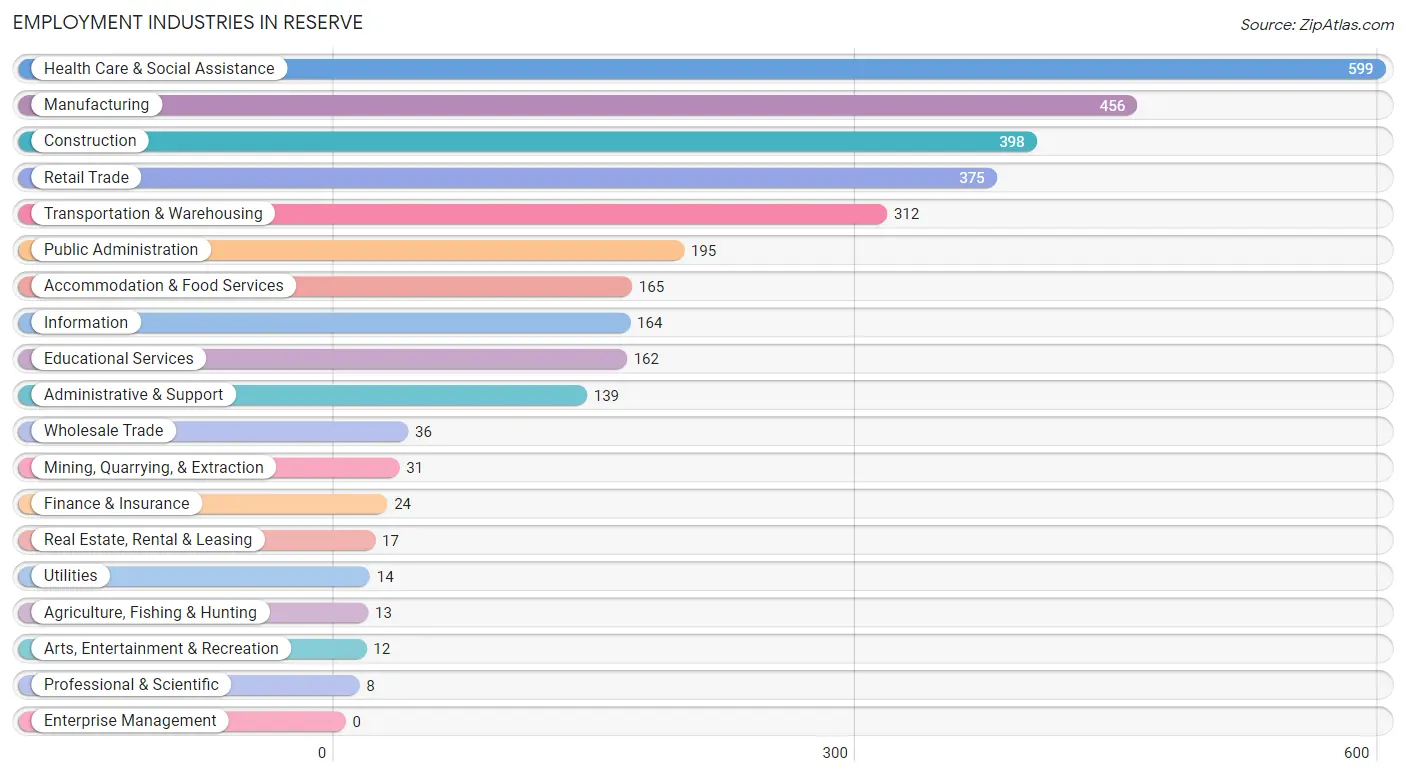
Employment Industries in Reserve
The major employment industries in Reserve include Health Care & Social Assistance (599 | 18.0%), Manufacturing (456 | 13.7%), Construction (398 | 11.9%), Retail Trade (375 | 11.2%), and Transportation & Warehousing (312 | 9.4%).
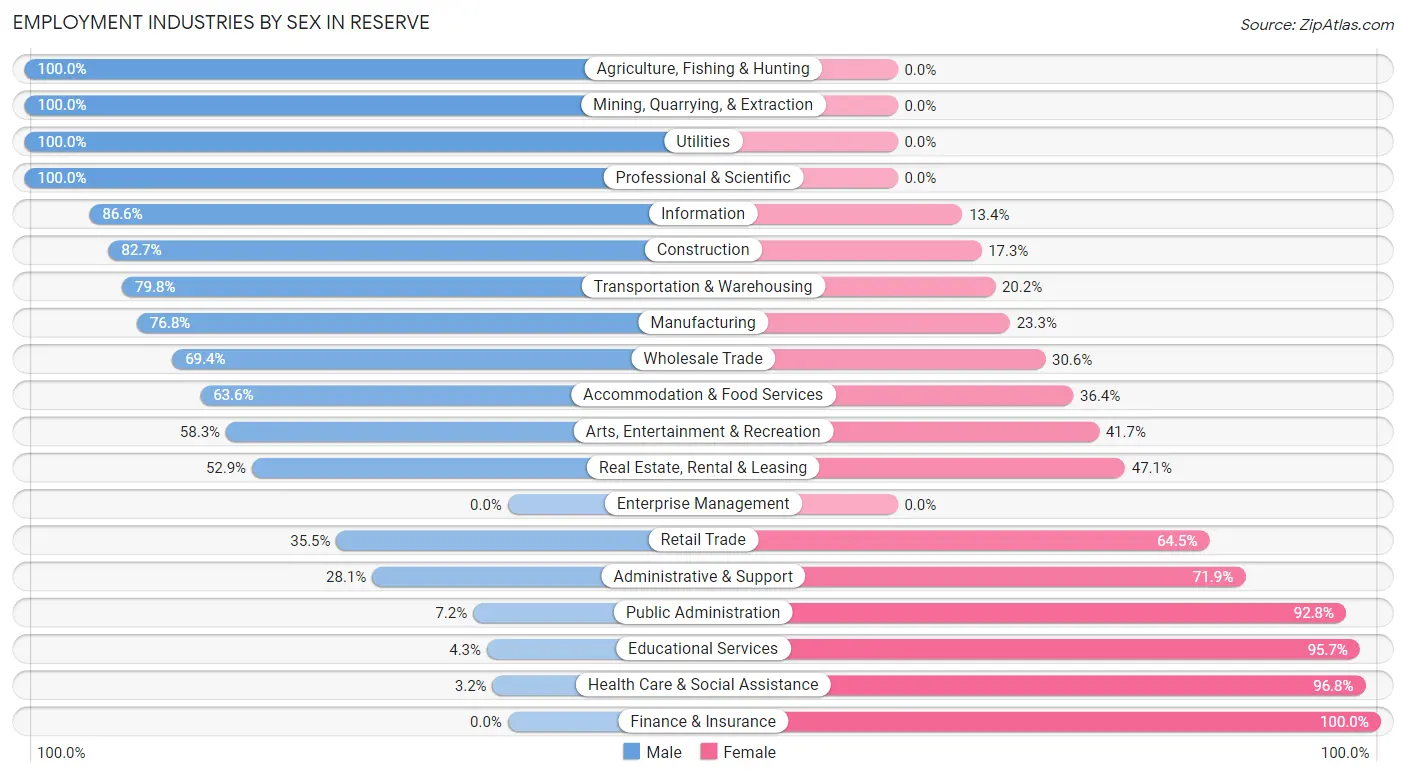
Employment Industries by Sex in Reserve
The Reserve industries that see more men than women are Agriculture, Fishing & Hunting (100.0%), Mining, Quarrying, & Extraction (100.0%), and Utilities (100.0%), whereas the industries that tend to have a higher number of women are Finance & Insurance (100.0%), Health Care & Social Assistance (96.8%), and Educational Services (95.7%).
| Industry | Male | Female |
| Agriculture, Fishing & Hunting | 13 (100.0%) | 0 (0.0%) |
| Mining, Quarrying, & Extraction | 31 (100.0%) | 0 (0.0%) |
| Construction | 329 (82.7%) | 69 (17.3%) |
| Manufacturing | 350 (76.7%) | 106 (23.3%) |
| Wholesale Trade | 25 (69.4%) | 11 (30.6%) |
| Retail Trade | 133 (35.5%) | 242 (64.5%) |
| Transportation & Warehousing | 249 (79.8%) | 63 (20.2%) |
| Utilities | 14 (100.0%) | 0 (0.0%) |
| Information | 142 (86.6%) | 22 (13.4%) |
| Finance & Insurance | 0 (0.0%) | 24 (100.0%) |
| Real Estate, Rental & Leasing | 9 (52.9%) | 8 (47.1%) |
| Professional & Scientific | 8 (100.0%) | 0 (0.0%) |
| Enterprise Management | 0 (0.0%) | 0 (0.0%) |
| Administrative & Support | 39 (28.1%) | 100 (71.9%) |
| Educational Services | 7 (4.3%) | 155 (95.7%) |
| Health Care & Social Assistance | 19 (3.2%) | 580 (96.8%) |
| Arts, Entertainment & Recreation | 7 (58.3%) | 5 (41.7%) |
| Accommodation & Food Services | 105 (63.6%) | 60 (36.4%) |
| Public Administration | 14 (7.2%) | 181 (92.8%) |
| Total | 1,607 (48.2%) | 1,728 (51.8%) |
Education in Reserve
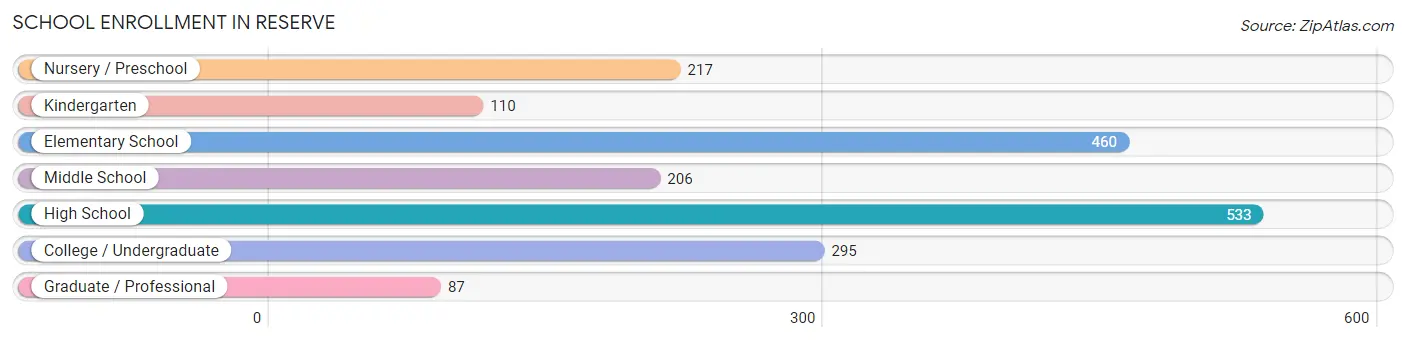
School Enrollment in Reserve
The most common levels of schooling among the 1,908 students in Reserve are high school (533 | 27.9%), elementary school (460 | 24.1%), and college / undergraduate (295 | 15.5%).
| School Level | # Students | % Students |
| Nursery / Preschool | 217 | 11.4% |
| Kindergarten | 110 | 5.8% |
| Elementary School | 460 | 24.1% |
| Middle School | 206 | 10.8% |
| High School | 533 | 27.9% |
| College / Undergraduate | 295 | 15.5% |
| Graduate / Professional | 87 | 4.6% |
| Total | 1,908 | 100.0% |
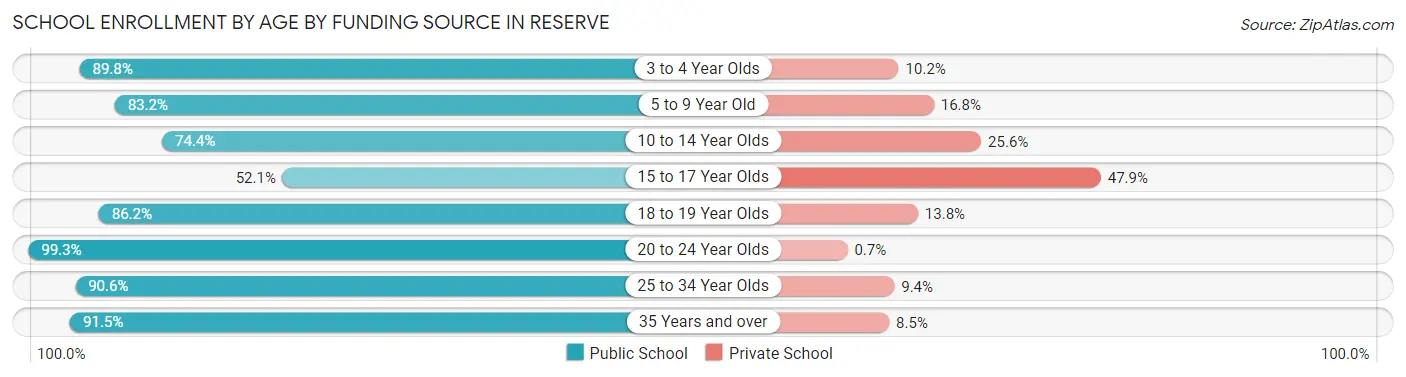
School Enrollment by Age by Funding Source in Reserve
Out of a total of 1,908 students who are enrolled in schools in Reserve, 336 (17.6%) attend a private institution, while the remaining 1,572 (82.4%) are enrolled in public schools. The age group of 15 to 17 year olds has the highest likelihood of being enrolled in private schools, with 125 (47.9% in the age bracket) enrolled. Conversely, the age group of 20 to 24 year olds has the lowest likelihood of being enrolled in a private school, with 423 (99.3% in the age bracket) attending a public institution.
| Age Bracket | Public School | Private School |
| 3 to 4 Year Olds | 149 (89.8%) | 17 (10.2%) |
| 5 to 9 Year Old | 466 (83.2%) | 94 (16.8%) |
| 10 to 14 Year Olds | 215 (74.4%) | 74 (25.6%) |
| 15 to 17 Year Olds | 136 (52.1%) | 125 (47.9%) |
| 18 to 19 Year Olds | 81 (86.2%) | 13 (13.8%) |
| 20 to 24 Year Olds | 423 (99.3%) | 3 (0.7%) |
| 25 to 34 Year Olds | 48 (90.6%) | 5 (9.4%) |
| 35 Years and over | 54 (91.5%) | 5 (8.5%) |
| Total | 1,572 (82.4%) | 336 (17.6%) |
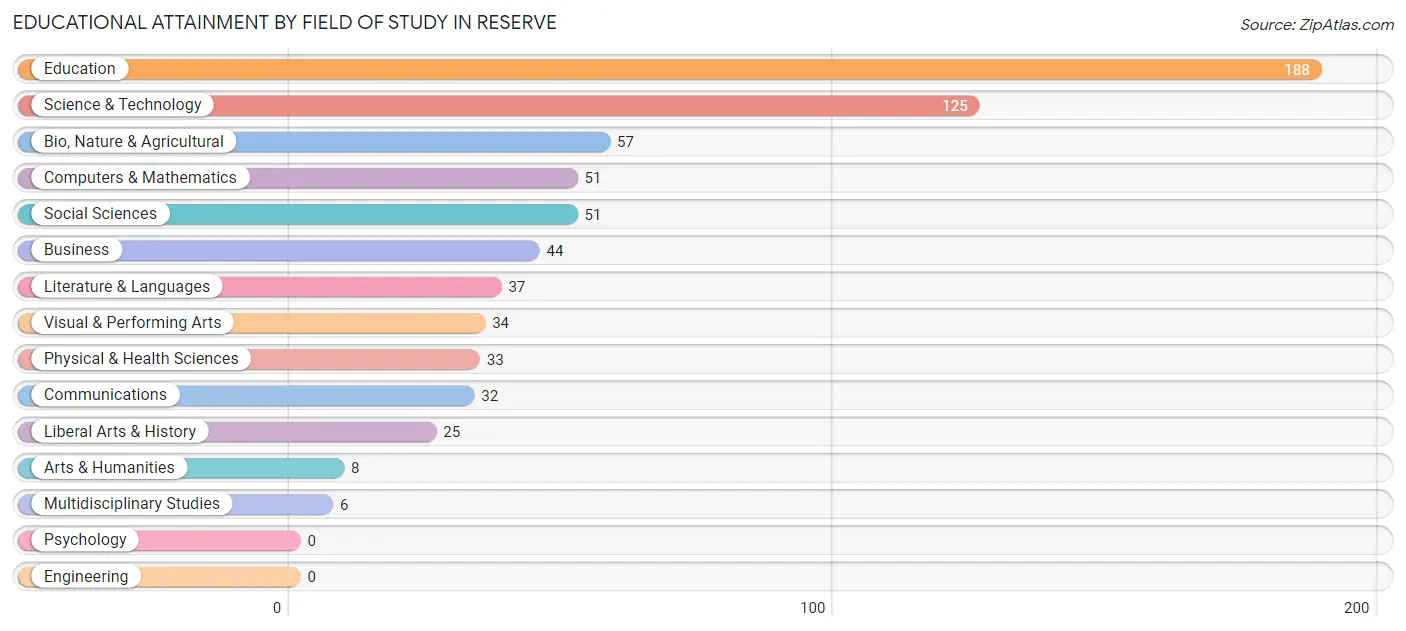
Educational Attainment by Field of Study in Reserve
Education (188 | 27.2%), science & technology (125 | 18.1%), bio, nature & agricultural (57 | 8.3%), computers & mathematics (51 | 7.4%), and social sciences (51 | 7.4%) are the most common fields of study among 691 individuals in Reserve who have obtained a bachelor's degree or higher.
| Field of Study | # Graduates | % Graduates |
| Computers & Mathematics | 51 | 7.4% |
| Bio, Nature & Agricultural | 57 | 8.3% |
| Physical & Health Sciences | 33 | 4.8% |
| Psychology | 0 | 0.0% |
| Social Sciences | 51 | 7.4% |
| Engineering | 0 | 0.0% |
| Multidisciplinary Studies | 6 | 0.9% |
| Science & Technology | 125 | 18.1% |
| Business | 44 | 6.4% |
| Education | 188 | 27.2% |
| Literature & Languages | 37 | 5.3% |
| Liberal Arts & History | 25 | 3.6% |
| Visual & Performing Arts | 34 | 4.9% |
| Communications | 32 | 4.6% |
| Arts & Humanities | 8 | 1.2% |
| Total | 691 | 100.0% |
Transportation & Commute in Reserve
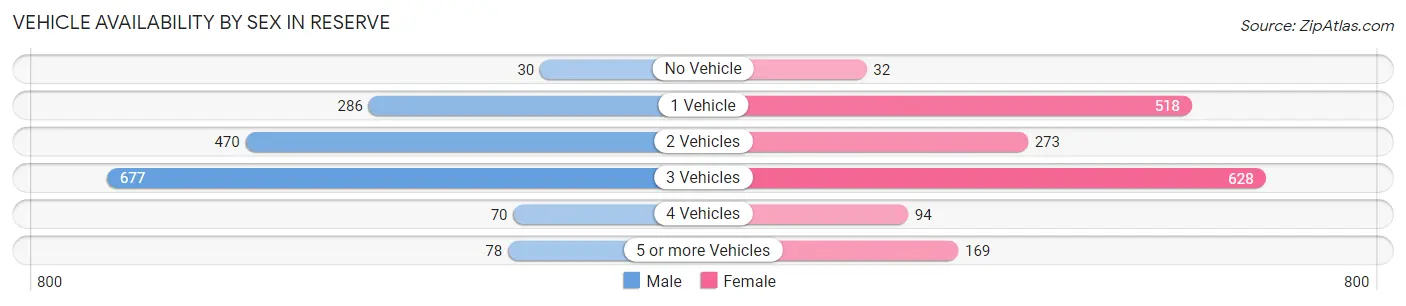
Vehicle Availability by Sex in Reserve
The most prevalent vehicle ownership categories in Reserve are males with 3 vehicles (677, accounting for 42.0%) and females with 3 vehicles (628, making up 39.5%).
| Vehicles Available | Male | Female |
| No Vehicle | 30 (1.9%) | 32 (1.9%) |
| 1 Vehicle | 286 (17.7%) | 518 (30.2%) |
| 2 Vehicles | 470 (29.2%) | 273 (15.9%) |
| 3 Vehicles | 677 (42.0%) | 628 (36.6%) |
| 4 Vehicles | 70 (4.3%) | 94 (5.5%) |
| 5 or more Vehicles | 78 (4.8%) | 169 (9.9%) |
| Total | 1,611 (100.0%) | 1,714 (100.0%) |
Commute Time in Reserve
The most frequently occuring commute durations in Reserve are 10 to 14 minutes (767 commuters, 23.2%), 5 to 9 minutes (522 commuters, 15.8%), and 30 to 34 minutes (382 commuters, 11.6%).
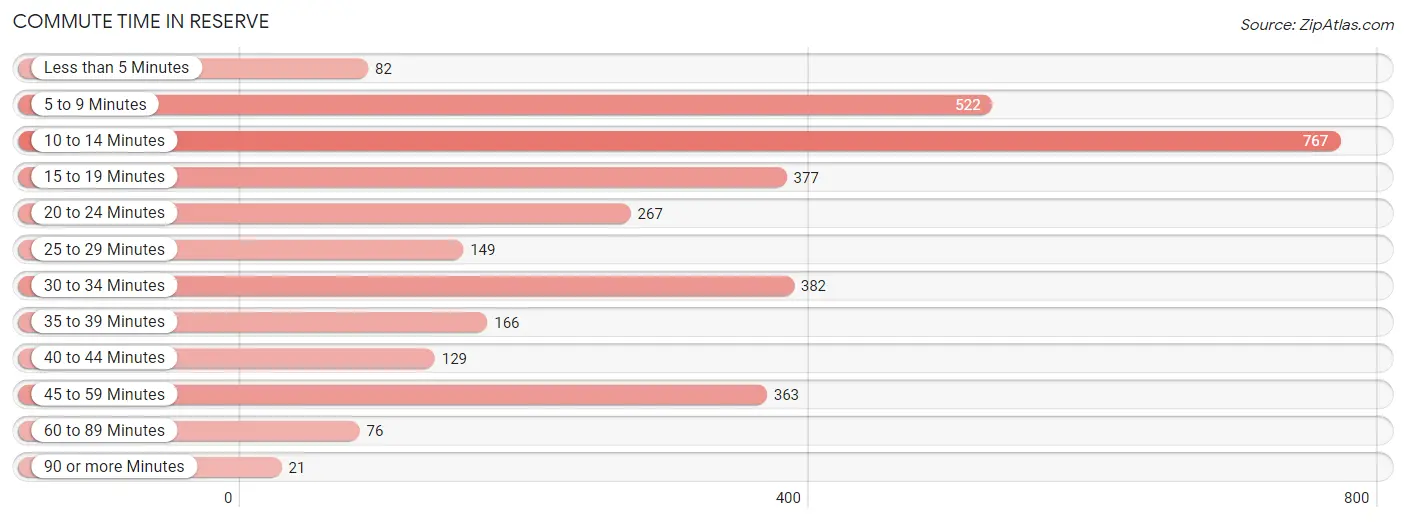
| Commute Time | # Commuters | % Commuters |
| Less than 5 Minutes | 82 | 2.5% |
| 5 to 9 Minutes | 522 | 15.8% |
| 10 to 14 Minutes | 767 | 23.2% |
| 15 to 19 Minutes | 377 | 11.4% |
| 20 to 24 Minutes | 267 | 8.1% |
| 25 to 29 Minutes | 149 | 4.5% |
| 30 to 34 Minutes | 382 | 11.6% |
| 35 to 39 Minutes | 166 | 5.0% |
| 40 to 44 Minutes | 129 | 3.9% |
| 45 to 59 Minutes | 363 | 11.0% |
| 60 to 89 Minutes | 76 | 2.3% |
| 90 or more Minutes | 21 | 0.6% |
Commute Time by Sex in Reserve
The most common commute times in Reserve are 10 to 14 minutes (469 commuters, 29.1%) for males and 5 to 9 minutes (411 commuters, 24.3%) for females.
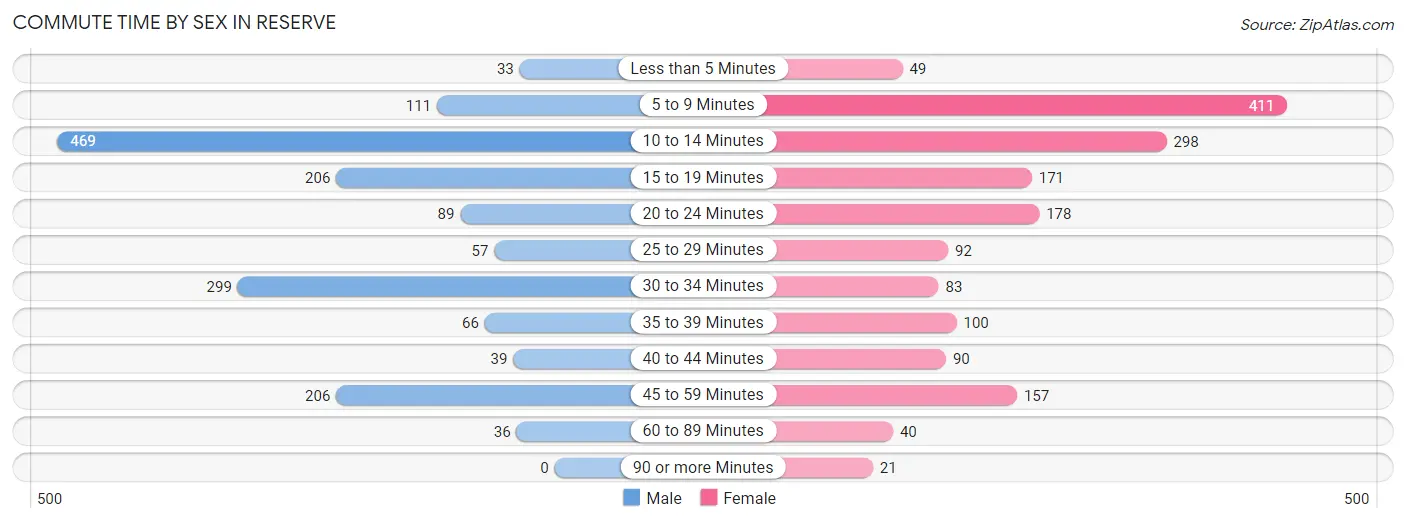
| Commute Time | Male | Female |
| Less than 5 Minutes | 33 (2.1%) | 49 (2.9%) |
| 5 to 9 Minutes | 111 (6.9%) | 411 (24.3%) |
| 10 to 14 Minutes | 469 (29.1%) | 298 (17.6%) |
| 15 to 19 Minutes | 206 (12.8%) | 171 (10.1%) |
| 20 to 24 Minutes | 89 (5.5%) | 178 (10.5%) |
| 25 to 29 Minutes | 57 (3.5%) | 92 (5.4%) |
| 30 to 34 Minutes | 299 (18.6%) | 83 (4.9%) |
| 35 to 39 Minutes | 66 (4.1%) | 100 (5.9%) |
| 40 to 44 Minutes | 39 (2.4%) | 90 (5.3%) |
| 45 to 59 Minutes | 206 (12.8%) | 157 (9.3%) |
| 60 to 89 Minutes | 36 (2.2%) | 40 (2.4%) |
| 90 or more Minutes | 0 (0.0%) | 21 (1.2%) |
Time of Departure to Work by Sex in Reserve
The most frequent times of departure to work in Reserve are 12:00 AM to 4:59 AM (250, 15.5%) for males and 12:00 AM to 4:59 AM (375, 22.2%) for females.
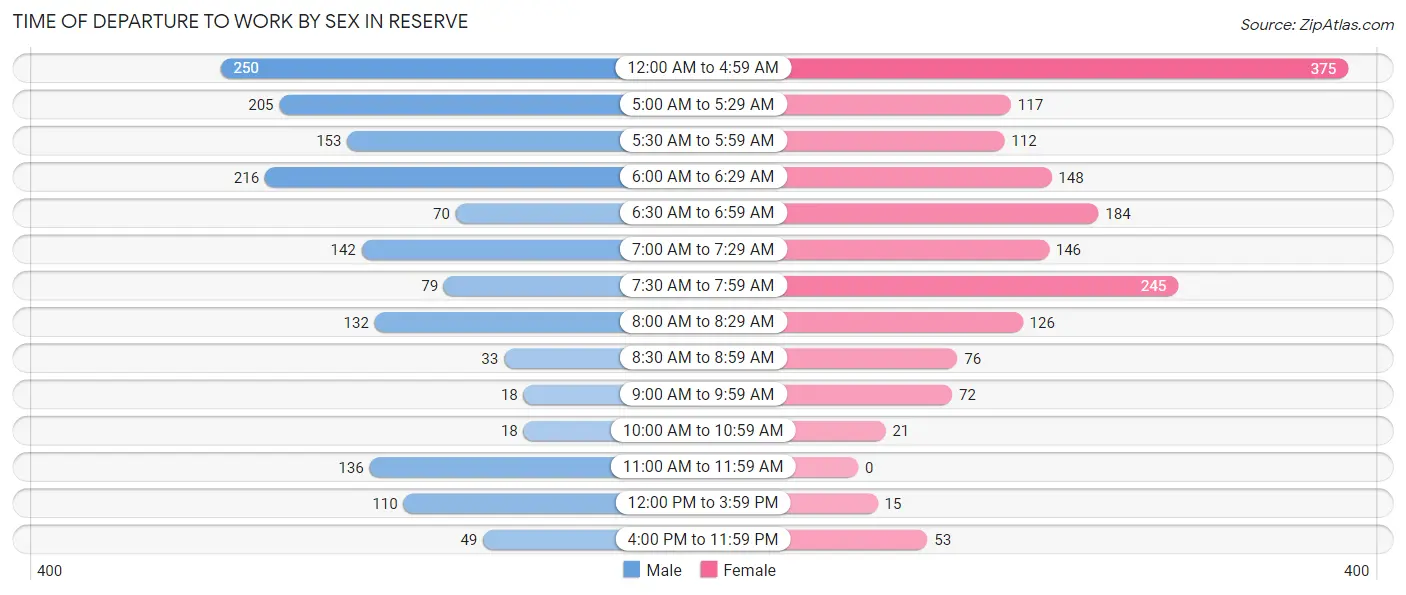
| Time of Departure | Male | Female |
| 12:00 AM to 4:59 AM | 250 (15.5%) | 375 (22.2%) |
| 5:00 AM to 5:29 AM | 205 (12.7%) | 117 (6.9%) |
| 5:30 AM to 5:59 AM | 153 (9.5%) | 112 (6.6%) |
| 6:00 AM to 6:29 AM | 216 (13.4%) | 148 (8.8%) |
| 6:30 AM to 6:59 AM | 70 (4.3%) | 184 (10.9%) |
| 7:00 AM to 7:29 AM | 142 (8.8%) | 146 (8.6%) |
| 7:30 AM to 7:59 AM | 79 (4.9%) | 245 (14.5%) |
| 8:00 AM to 8:29 AM | 132 (8.2%) | 126 (7.5%) |
| 8:30 AM to 8:59 AM | 33 (2.1%) | 76 (4.5%) |
| 9:00 AM to 9:59 AM | 18 (1.1%) | 72 (4.3%) |
| 10:00 AM to 10:59 AM | 18 (1.1%) | 21 (1.2%) |
| 11:00 AM to 11:59 AM | 136 (8.4%) | 0 (0.0%) |
| 12:00 PM to 3:59 PM | 110 (6.8%) | 15 (0.9%) |
| 4:00 PM to 11:59 PM | 49 (3.0%) | 53 (3.1%) |
| Total | 1,611 (100.0%) | 1,690 (100.0%) |
Housing Occupancy in Reserve
Occupancy by Ownership in Reserve
Of the total 3,021 dwellings in Reserve, owner-occupied units account for 2,210 (73.2%), while renter-occupied units make up 811 (26.9%).
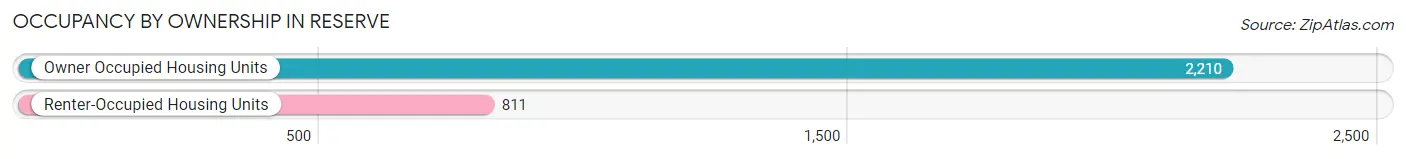
| Occupancy | # Housing Units | % Housing Units |
| Owner Occupied Housing Units | 2,210 | 73.2% |
| Renter-Occupied Housing Units | 811 | 26.9% |
| Total Occupied Housing Units | 3,021 | 100.0% |
Occupancy by Household Size in Reserve
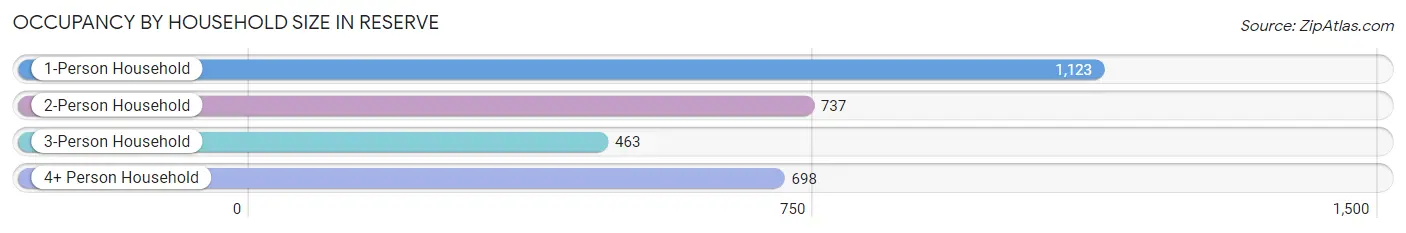
| Household Size | # Housing Units | % Housing Units |
| 1-Person Household | 1,123 | 37.2% |
| 2-Person Household | 737 | 24.4% |
| 3-Person Household | 463 | 15.3% |
| 4+ Person Household | 698 | 23.1% |
| Total Housing Units | 3,021 | 100.0% |
Occupancy by Ownership by Household Size in Reserve
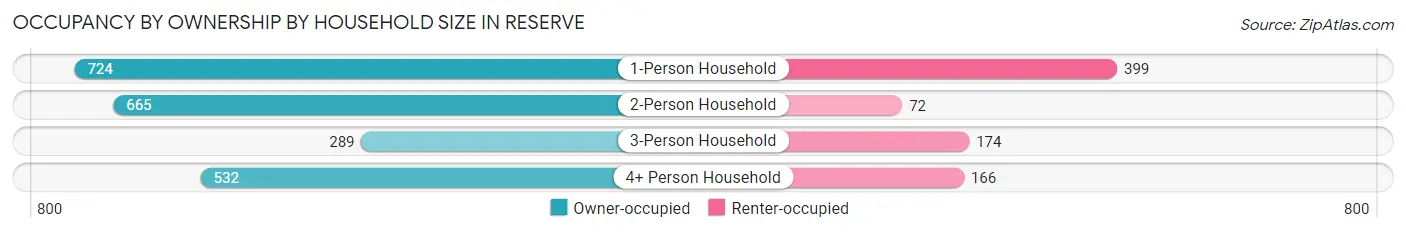
| Household Size | Owner-occupied | Renter-occupied |
| 1-Person Household | 724 (64.5%) | 399 (35.5%) |
| 2-Person Household | 665 (90.2%) | 72 (9.8%) |
| 3-Person Household | 289 (62.4%) | 174 (37.6%) |
| 4+ Person Household | 532 (76.2%) | 166 (23.8%) |
| Total Housing Units | 2,210 (73.2%) | 811 (26.9%) |
Occupancy by Educational Attainment in Reserve
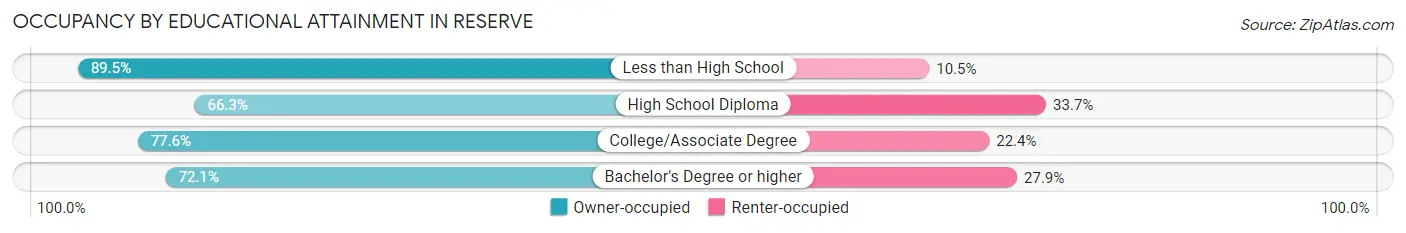
| Household Size | Owner-occupied | Renter-occupied |
| Less than High School | 399 (89.5%) | 47 (10.5%) |
| High School Diploma | 956 (66.3%) | 486 (33.7%) |
| College/Associate Degree | 543 (77.6%) | 157 (22.4%) |
| Bachelor's Degree or higher | 312 (72.1%) | 121 (27.9%) |
Occupancy by Age of Householder in Reserve
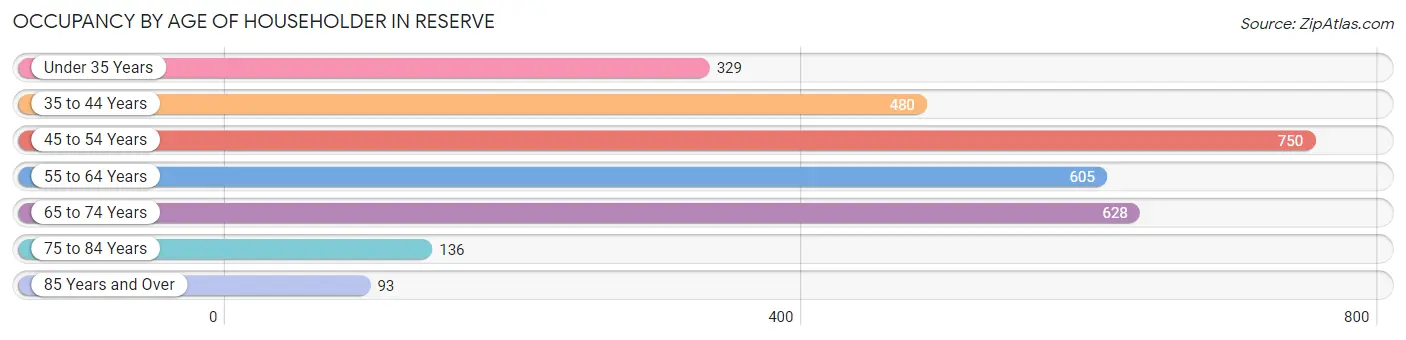
| Age Bracket | # Households | % Households |
| Under 35 Years | 329 | 10.9% |
| 35 to 44 Years | 480 | 15.9% |
| 45 to 54 Years | 750 | 24.8% |
| 55 to 64 Years | 605 | 20.0% |
| 65 to 74 Years | 628 | 20.8% |
| 75 to 84 Years | 136 | 4.5% |
| 85 Years and Over | 93 | 3.1% |
| Total | 3,021 | 100.0% |
Housing Finances in Reserve
Median Income by Occupancy in Reserve
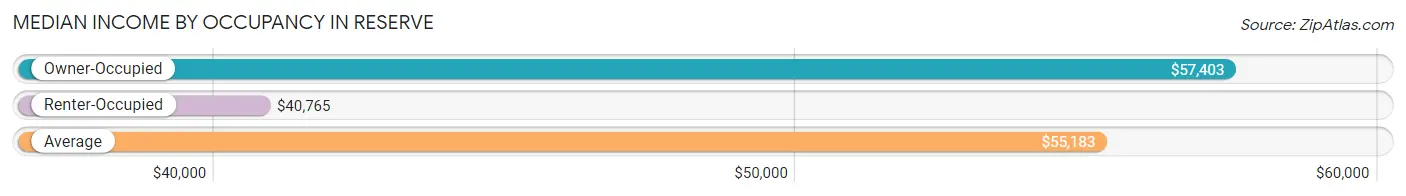
| Occupancy Type | # Households | Median Income |
| Owner-Occupied | 2,210 (73.2%) | $57,403 |
| Renter-Occupied | 811 (26.9%) | $40,765 |
| Average | 3,021 (100.0%) | $55,183 |
Occupancy by Householder Income Bracket in Reserve
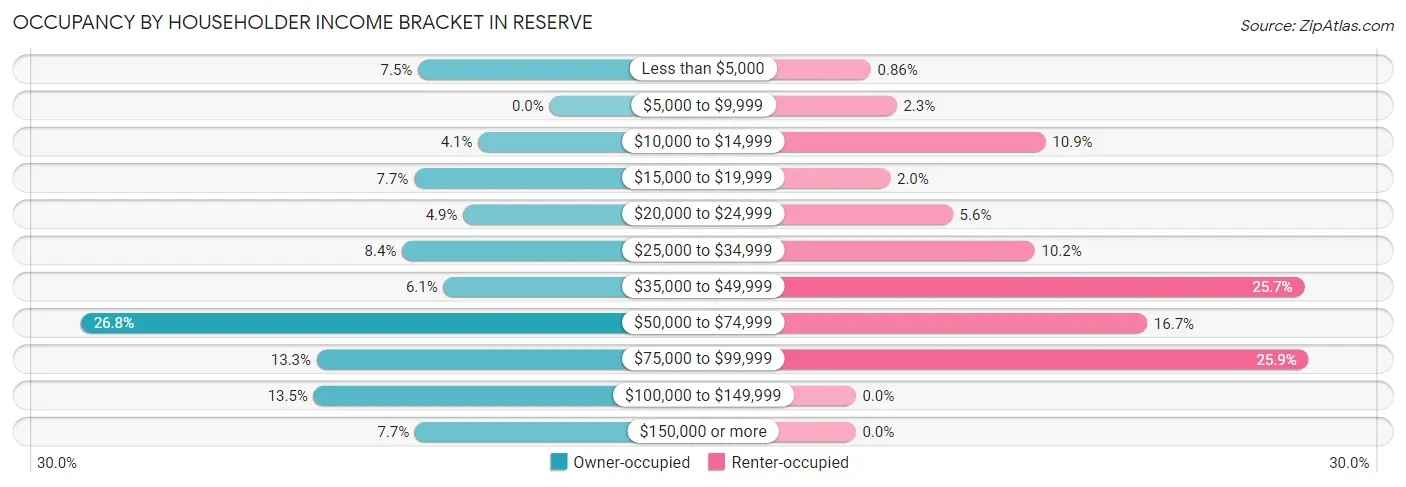
| Income Bracket | Owner-occupied | Renter-occupied |
| Less than $5,000 | 166 (7.5%) | 7 (0.9%) |
| $5,000 to $9,999 | 0 (0.0%) | 19 (2.3%) |
| $10,000 to $14,999 | 90 (4.1%) | 88 (10.8%) |
| $15,000 to $19,999 | 171 (7.7%) | 16 (2.0%) |
| $20,000 to $24,999 | 109 (4.9%) | 45 (5.6%) |
| $25,000 to $34,999 | 186 (8.4%) | 83 (10.2%) |
| $35,000 to $49,999 | 134 (6.1%) | 208 (25.7%) |
| $50,000 to $74,999 | 592 (26.8%) | 135 (16.7%) |
| $75,000 to $99,999 | 294 (13.3%) | 210 (25.9%) |
| $100,000 to $149,999 | 298 (13.5%) | 0 (0.0%) |
| $150,000 or more | 170 (7.7%) | 0 (0.0%) |
| Total | 2,210 (100.0%) | 811 (100.0%) |
Monthly Housing Cost Tiers in Reserve
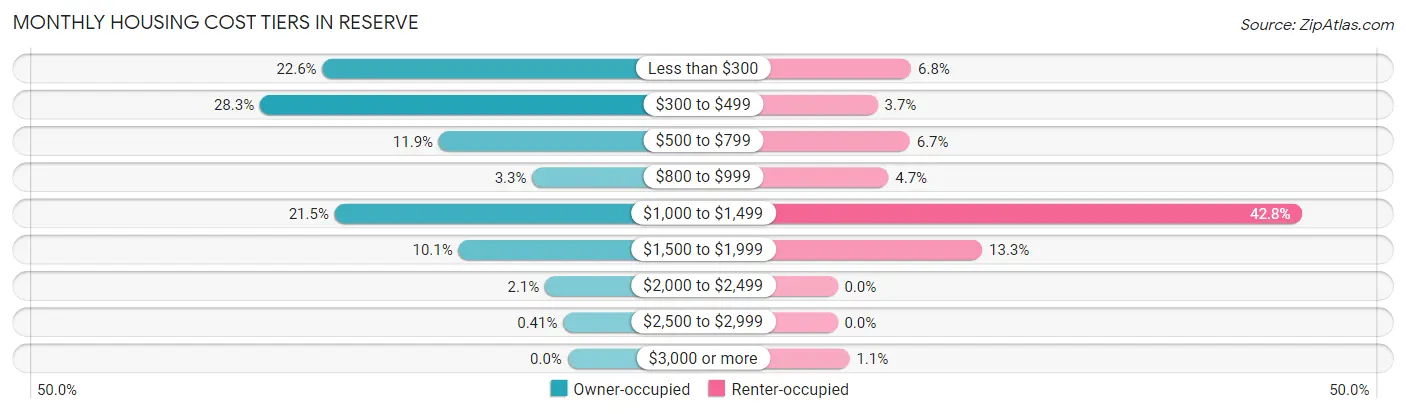
| Monthly Cost | Owner-occupied | Renter-occupied |
| Less than $300 | 499 (22.6%) | 55 (6.8%) |
| $300 to $499 | 626 (28.3%) | 30 (3.7%) |
| $500 to $799 | 262 (11.9%) | 54 (6.7%) |
| $800 to $999 | 72 (3.3%) | 38 (4.7%) |
| $1,000 to $1,499 | 474 (21.4%) | 347 (42.8%) |
| $1,500 to $1,999 | 222 (10.1%) | 108 (13.3%) |
| $2,000 to $2,499 | 46 (2.1%) | 0 (0.0%) |
| $2,500 to $2,999 | 9 (0.4%) | 0 (0.0%) |
| $3,000 or more | 0 (0.0%) | 9 (1.1%) |
| Total | 2,210 (100.0%) | 811 (100.0%) |
Physical Housing Characteristics in Reserve
Housing Structures in Reserve
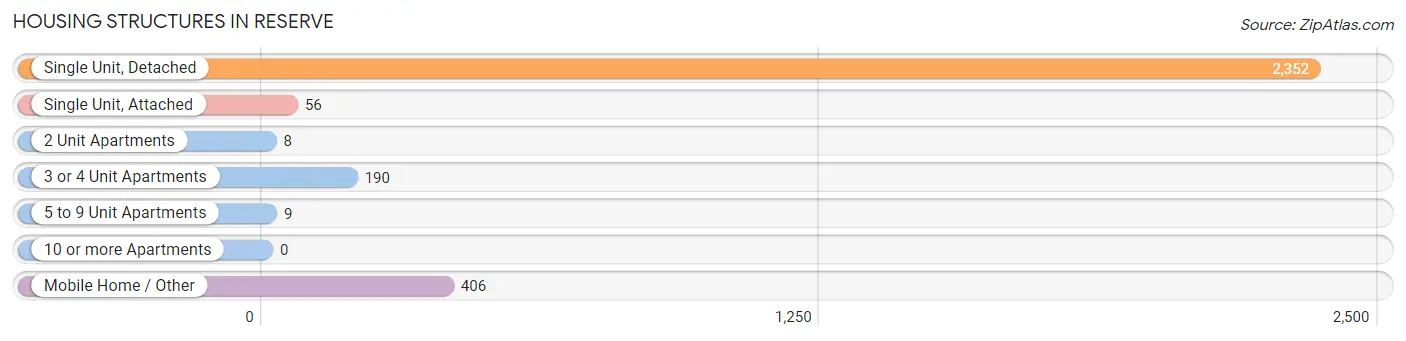
| Structure Type | # Housing Units | % Housing Units |
| Single Unit, Detached | 2,352 | 77.9% |
| Single Unit, Attached | 56 | 1.8% |
| 2 Unit Apartments | 8 | 0.3% |
| 3 or 4 Unit Apartments | 190 | 6.3% |
| 5 to 9 Unit Apartments | 9 | 0.3% |
| 10 or more Apartments | 0 | 0.0% |
| Mobile Home / Other | 406 | 13.4% |
| Total | 3,021 | 100.0% |
Housing Structures by Occupancy in Reserve
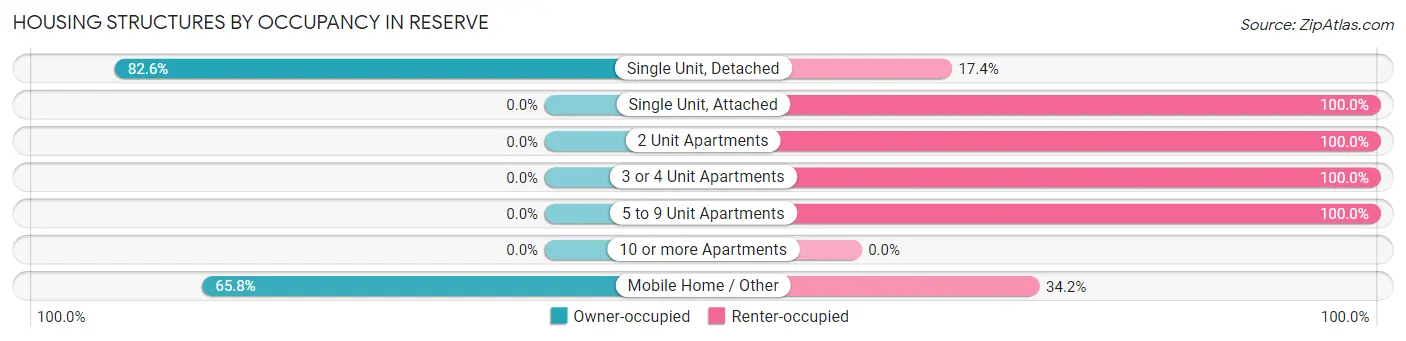
| Structure Type | Owner-occupied | Renter-occupied |
| Single Unit, Detached | 1,943 (82.6%) | 409 (17.4%) |
| Single Unit, Attached | 0 (0.0%) | 56 (100.0%) |
| 2 Unit Apartments | 0 (0.0%) | 8 (100.0%) |
| 3 or 4 Unit Apartments | 0 (0.0%) | 190 (100.0%) |
| 5 to 9 Unit Apartments | 0 (0.0%) | 9 (100.0%) |
| 10 or more Apartments | 0 (0.0%) | 0 (0.0%) |
| Mobile Home / Other | 267 (65.8%) | 139 (34.2%) |
| Total | 2,210 (73.2%) | 811 (26.9%) |
Housing Structures by Number of Rooms in Reserve
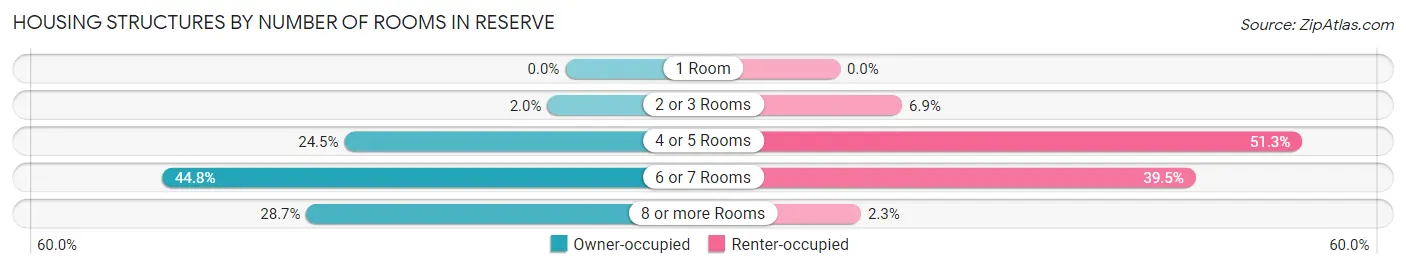
| Number of Rooms | Owner-occupied | Renter-occupied |
| 1 Room | 0 (0.0%) | 0 (0.0%) |
| 2 or 3 Rooms | 44 (2.0%) | 56 (6.9%) |
| 4 or 5 Rooms | 542 (24.5%) | 416 (51.3%) |
| 6 or 7 Rooms | 989 (44.8%) | 320 (39.5%) |
| 8 or more Rooms | 635 (28.7%) | 19 (2.3%) |
| Total | 2,210 (100.0%) | 811 (100.0%) |
Housing Structure by Heating Type in Reserve
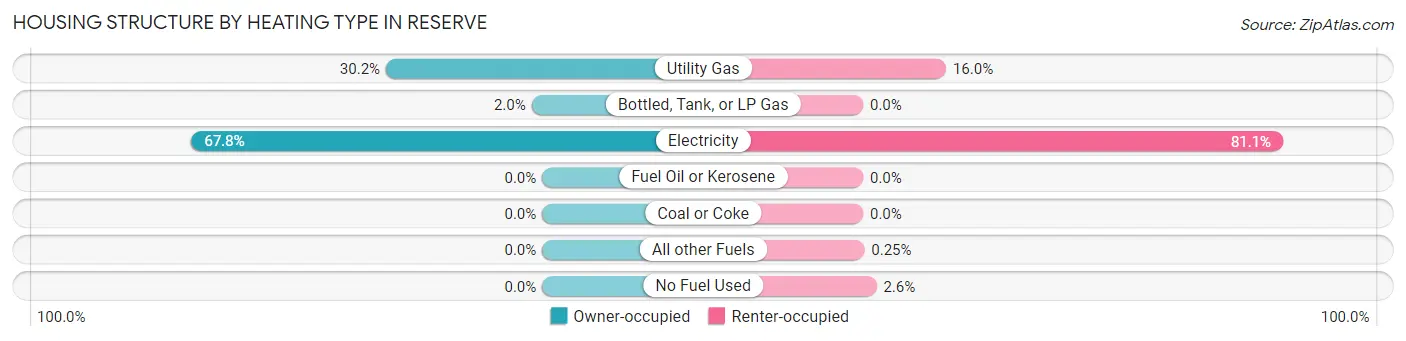
| Heating Type | Owner-occupied | Renter-occupied |
| Utility Gas | 667 (30.2%) | 130 (16.0%) |
| Bottled, Tank, or LP Gas | 45 (2.0%) | 0 (0.0%) |
| Electricity | 1,498 (67.8%) | 658 (81.1%) |
| Fuel Oil or Kerosene | 0 (0.0%) | 0 (0.0%) |
| Coal or Coke | 0 (0.0%) | 0 (0.0%) |
| All other Fuels | 0 (0.0%) | 2 (0.3%) |
| No Fuel Used | 0 (0.0%) | 21 (2.6%) |
| Total | 2,210 (100.0%) | 811 (100.0%) |
Household Vehicle Usage in Reserve
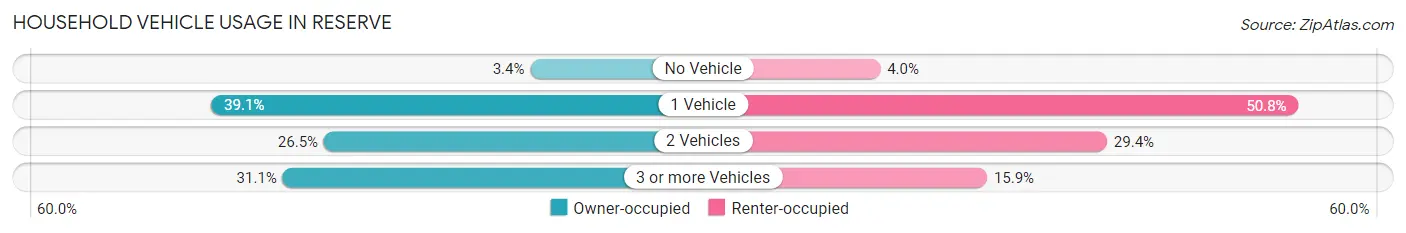
| Vehicles per Household | Owner-occupied | Renter-occupied |
| No Vehicle | 74 (3.4%) | 32 (4.0%) |
| 1 Vehicle | 864 (39.1%) | 412 (50.8%) |
| 2 Vehicles | 585 (26.5%) | 238 (29.3%) |
| 3 or more Vehicles | 687 (31.1%) | 129 (15.9%) |
| Total | 2,210 (100.0%) | 811 (100.0%) |
Real Estate & Mortgages in Reserve
Real Estate and Mortgage Overview in Reserve
| Characteristic | Without Mortgage | With Mortgage |
| Housing Units | 1,358 | 852 |
| Median Property Value | $140,700 | $162,100 |
| Median Household Income | $51,111 | $106 |
| Monthly Housing Costs | $340 | $0 |
| Real Estate Taxes | $355 | $238 |
Property Value by Mortgage Status in Reserve
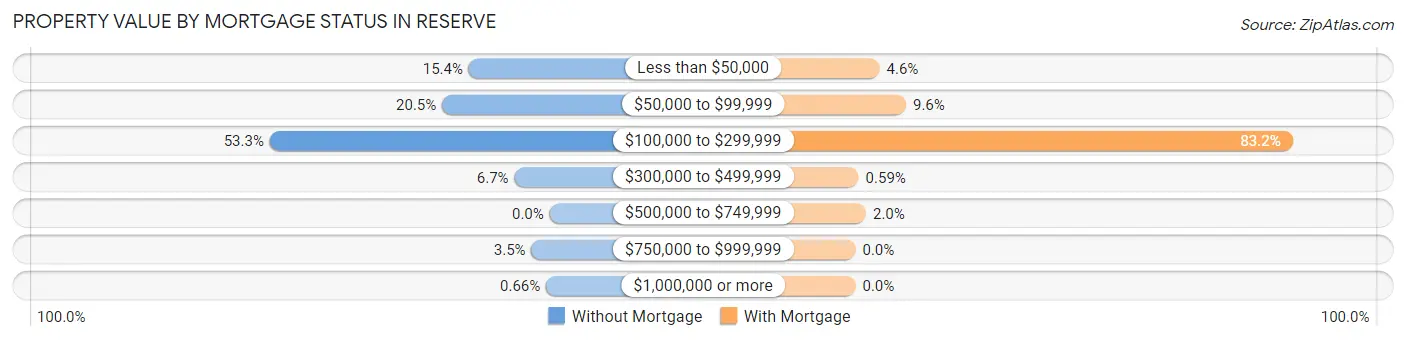
| Property Value | Without Mortgage | With Mortgage |
| Less than $50,000 | 209 (15.4%) | 39 (4.6%) |
| $50,000 to $99,999 | 278 (20.5%) | 82 (9.6%) |
| $100,000 to $299,999 | 724 (53.3%) | 709 (83.2%) |
| $300,000 to $499,999 | 91 (6.7%) | 5 (0.6%) |
| $500,000 to $749,999 | 0 (0.0%) | 17 (2.0%) |
| $750,000 to $999,999 | 47 (3.5%) | 0 (0.0%) |
| $1,000,000 or more | 9 (0.7%) | 0 (0.0%) |
| Total | 1,358 (100.0%) | 852 (100.0%) |
Household Income by Mortgage Status in Reserve
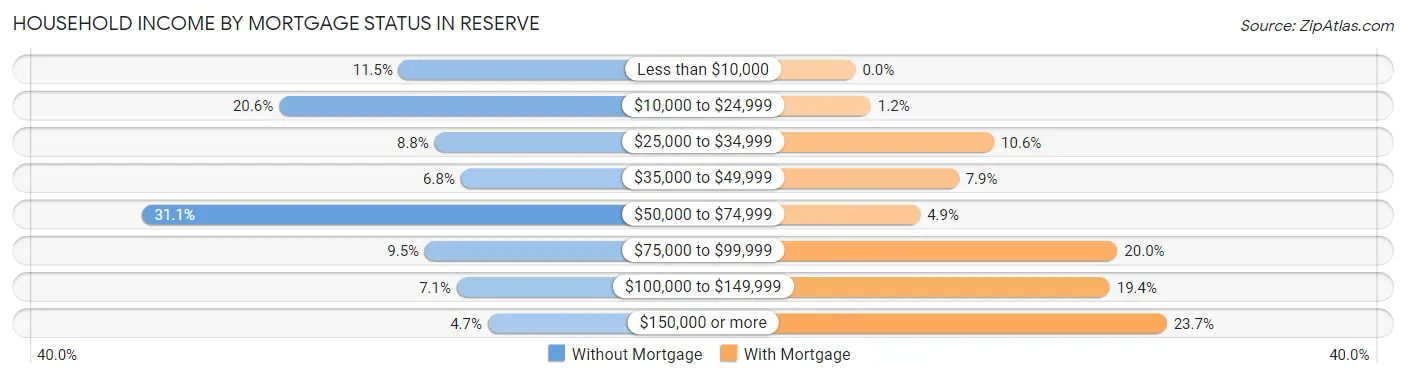
| Household Income | Without Mortgage | With Mortgage |
| Less than $10,000 | 156 (11.5%) | 0 (0.0%) |
| $10,000 to $24,999 | 280 (20.6%) | 10 (1.2%) |
| $25,000 to $34,999 | 119 (8.8%) | 90 (10.6%) |
| $35,000 to $49,999 | 92 (6.8%) | 67 (7.9%) |
| $50,000 to $74,999 | 422 (31.1%) | 42 (4.9%) |
| $75,000 to $99,999 | 129 (9.5%) | 170 (20.0%) |
| $100,000 to $149,999 | 96 (7.1%) | 165 (19.4%) |
| $150,000 or more | 64 (4.7%) | 202 (23.7%) |
| Total | 1,358 (100.0%) | 852 (100.0%) |
Property Value to Household Income Ratio in Reserve
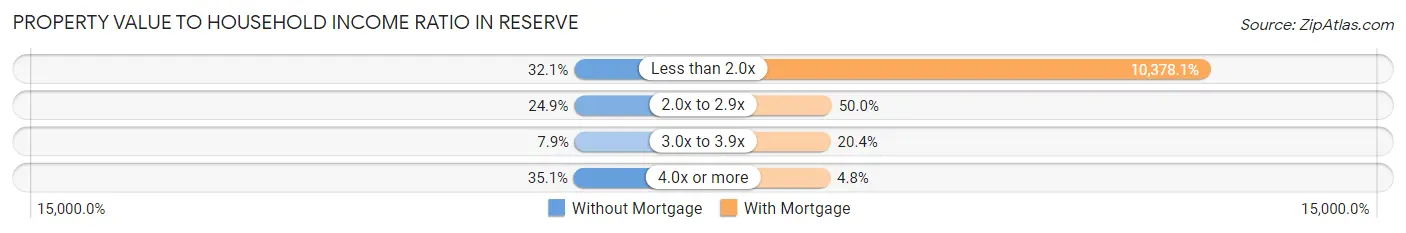
| Value-to-Income Ratio | Without Mortgage | With Mortgage |
| Less than 2.0x | 436 (32.1%) | 88,421 (10,378.1%) |
| 2.0x to 2.9x | 338 (24.9%) | 426 (50.0%) |
| 3.0x to 3.9x | 107 (7.9%) | 174 (20.4%) |
| 4.0x or more | 477 (35.1%) | 41 (4.8%) |
| Total | 1,358 (100.0%) | 852 (100.0%) |
Real Estate Taxes by Mortgage Status in Reserve
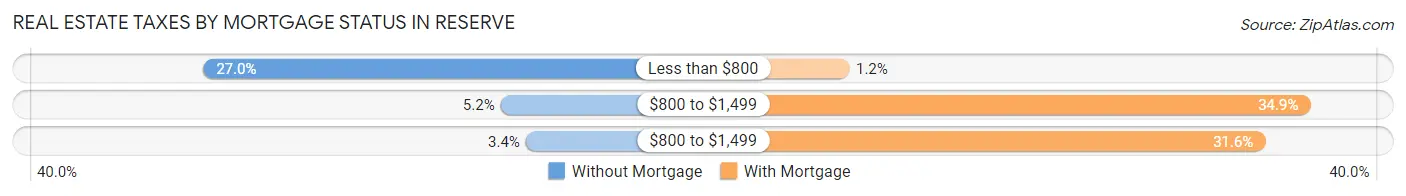
| Property Taxes | Without Mortgage | With Mortgage |
| Less than $800 | 366 (27.0%) | 10 (1.2%) |
| $800 to $1,499 | 71 (5.2%) | 297 (34.9%) |
| $800 to $1,499 | 46 (3.4%) | 269 (31.6%) |
| Total | 1,358 (100.0%) | 852 (100.0%) |
Health & Disability in Reserve
Health Insurance Coverage by Age in Reserve
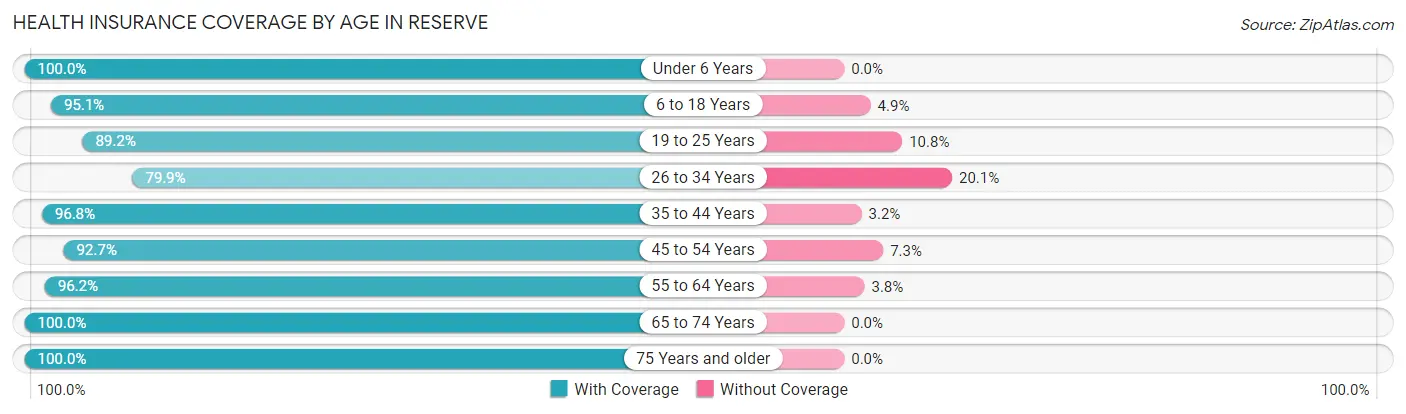
| Age Bracket | With Coverage | Without Coverage |
| Under 6 Years | 550 (100.0%) | 0 (0.0%) |
| 6 to 18 Years | 1,044 (95.1%) | 54 (4.9%) |
| 19 to 25 Years | 958 (89.2%) | 116 (10.8%) |
| 26 to 34 Years | 795 (79.9%) | 200 (20.1%) |
| 35 to 44 Years | 958 (96.8%) | 32 (3.2%) |
| 45 to 54 Years | 1,099 (92.7%) | 86 (7.3%) |
| 55 to 64 Years | 839 (96.2%) | 33 (3.8%) |
| 65 to 74 Years | 820 (100.0%) | 0 (0.0%) |
| 75 Years and older | 332 (100.0%) | 0 (0.0%) |
| Total | 7,395 (93.4%) | 521 (6.6%) |
Health Insurance Coverage by Citizenship Status in Reserve
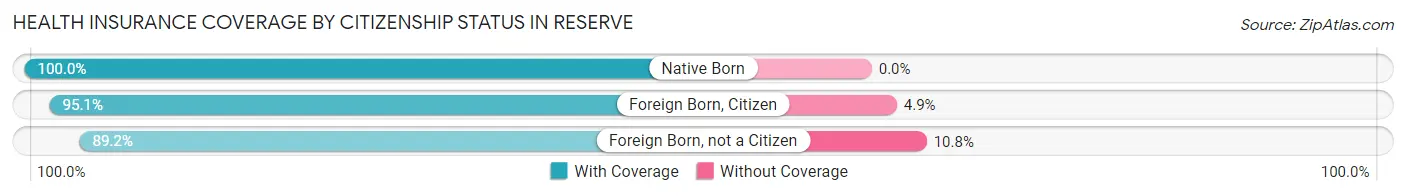
| Citizenship Status | With Coverage | Without Coverage |
| Native Born | 550 (100.0%) | 0 (0.0%) |
| Foreign Born, Citizen | 1,044 (95.1%) | 54 (4.9%) |
| Foreign Born, not a Citizen | 958 (89.2%) | 116 (10.8%) |
Health Insurance Coverage by Household Income in Reserve
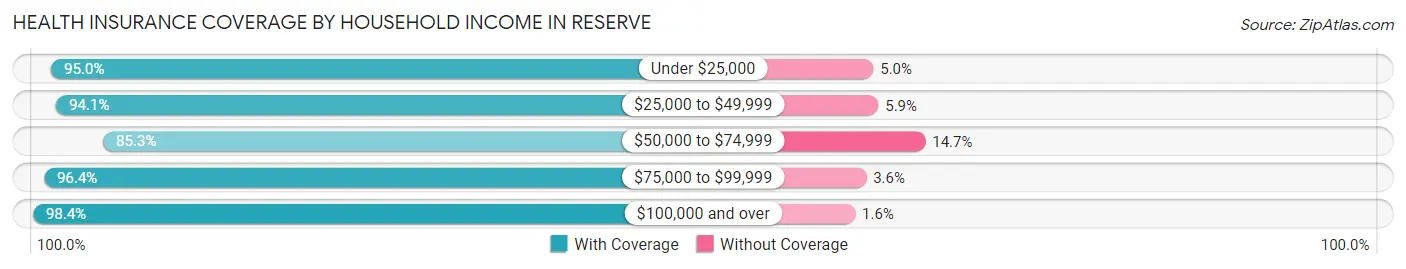
| Household Income | With Coverage | Without Coverage |
| Under $25,000 | 1,571 (95.0%) | 82 (5.0%) |
| $25,000 to $49,999 | 1,068 (94.1%) | 67 (5.9%) |
| $50,000 to $74,999 | 1,670 (85.3%) | 288 (14.7%) |
| $75,000 to $99,999 | 1,567 (96.4%) | 59 (3.6%) |
| $100,000 and over | 1,517 (98.4%) | 24 (1.6%) |
Public vs Private Health Insurance Coverage by Age in Reserve
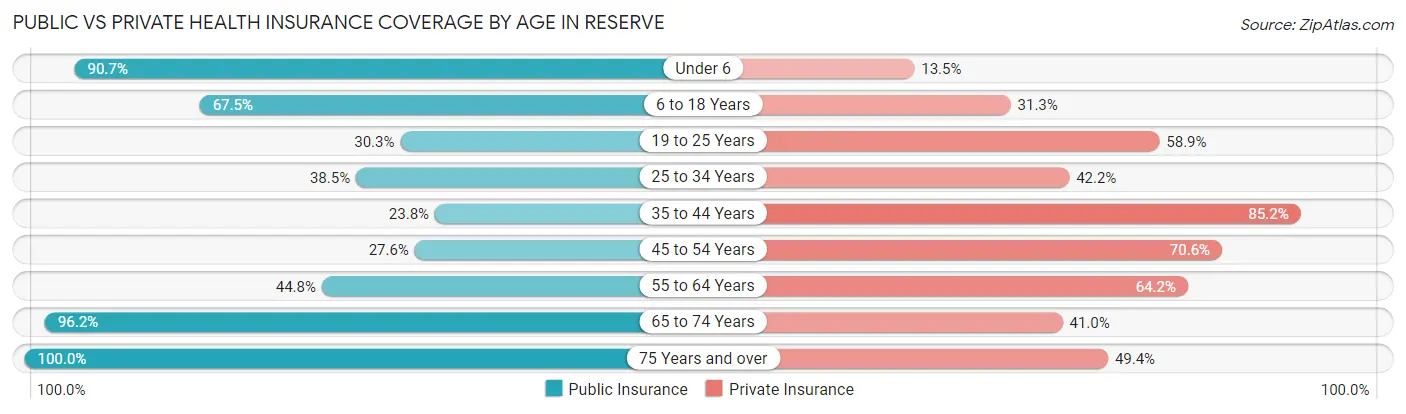
| Age Bracket | Public Insurance | Private Insurance |
| Under 6 | 499 (90.7%) | 74 (13.5%) |
| 6 to 18 Years | 741 (67.5%) | 344 (31.3%) |
| 19 to 25 Years | 325 (30.3%) | 633 (58.9%) |
| 25 to 34 Years | 383 (38.5%) | 420 (42.2%) |
| 35 to 44 Years | 236 (23.8%) | 843 (85.2%) |
| 45 to 54 Years | 327 (27.6%) | 836 (70.6%) |
| 55 to 64 Years | 391 (44.8%) | 560 (64.2%) |
| 65 to 74 Years | 789 (96.2%) | 336 (41.0%) |
| 75 Years and over | 332 (100.0%) | 164 (49.4%) |
| Total | 4,023 (50.8%) | 4,210 (53.2%) |
Disability Status by Sex by Age in Reserve
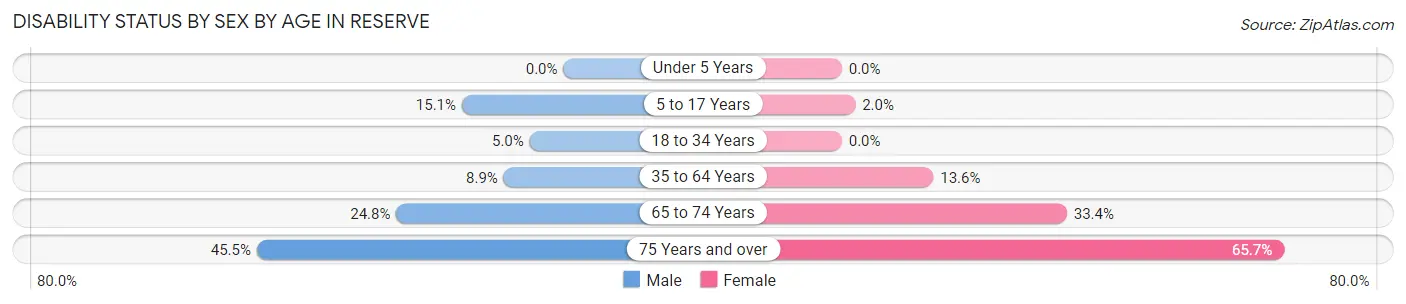
| Age Bracket | Male | Female |
| Under 5 Years | 0 (0.0%) | 0 (0.0%) |
| 5 to 17 Years | 99 (15.1%) | 9 (2.0%) |
| 18 to 34 Years | 63 (5.0%) | 0 (0.0%) |
| 35 to 64 Years | 137 (8.9%) | 204 (13.6%) |
| 65 to 74 Years | 92 (24.8%) | 150 (33.4%) |
| 75 Years and over | 61 (45.5%) | 130 (65.7%) |
Disability Class by Sex by Age in Reserve
Disability Class: Hearing Difficulty
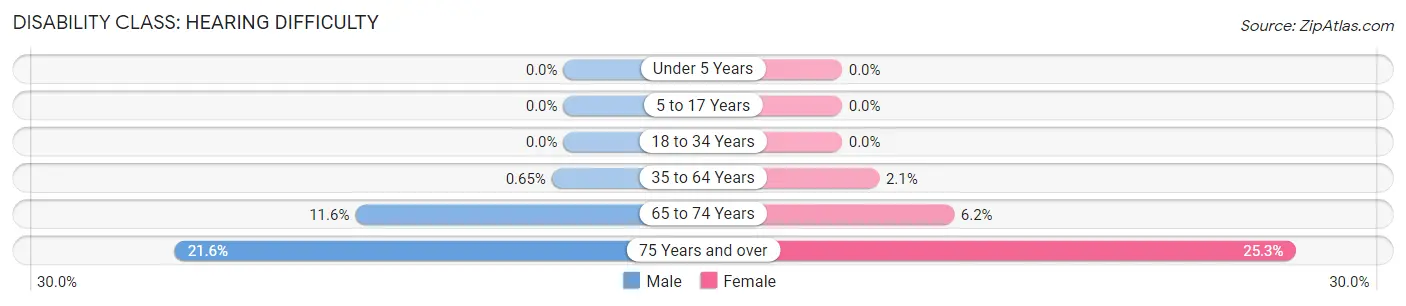
| Age Bracket | Male | Female |
| Under 5 Years | 0 (0.0%) | 0 (0.0%) |
| 5 to 17 Years | 0 (0.0%) | 0 (0.0%) |
| 18 to 34 Years | 0 (0.0%) | 0 (0.0%) |
| 35 to 64 Years | 10 (0.6%) | 31 (2.1%) |
| 65 to 74 Years | 43 (11.6%) | 28 (6.2%) |
| 75 Years and over | 29 (21.6%) | 50 (25.3%) |
Disability Class: Vision Difficulty
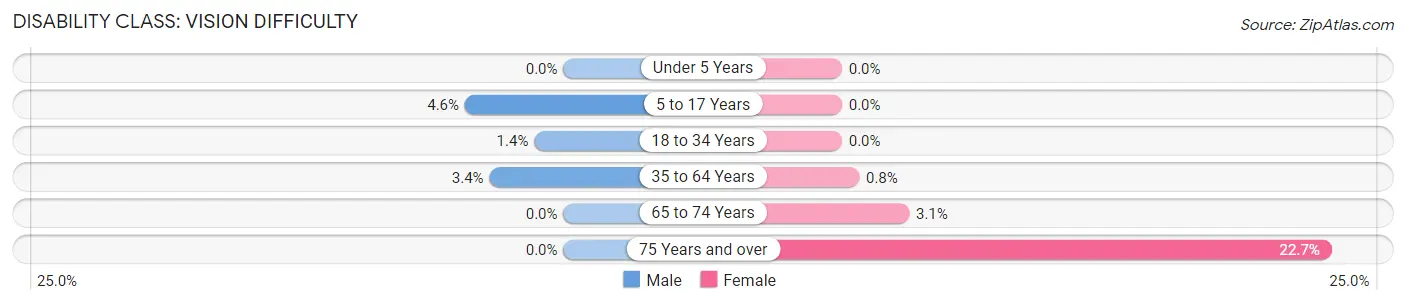
| Age Bracket | Male | Female |
| Under 5 Years | 0 (0.0%) | 0 (0.0%) |
| 5 to 17 Years | 30 (4.6%) | 0 (0.0%) |
| 18 to 34 Years | 17 (1.3%) | 0 (0.0%) |
| 35 to 64 Years | 53 (3.4%) | 12 (0.8%) |
| 65 to 74 Years | 0 (0.0%) | 14 (3.1%) |
| 75 Years and over | 0 (0.0%) | 45 (22.7%) |
Disability Class: Cognitive Difficulty
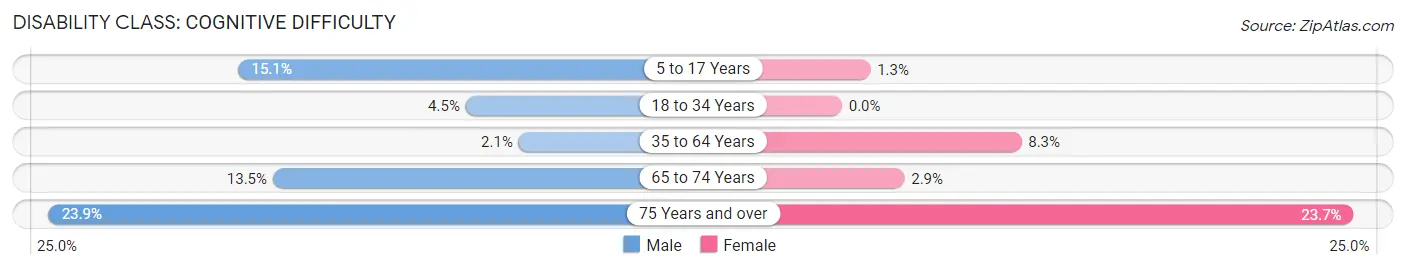
| Age Bracket | Male | Female |
| 5 to 17 Years | 99 (15.1%) | 6 (1.3%) |
| 18 to 34 Years | 57 (4.5%) | 0 (0.0%) |
| 35 to 64 Years | 32 (2.1%) | 125 (8.3%) |
| 65 to 74 Years | 50 (13.5%) | 13 (2.9%) |
| 75 Years and over | 32 (23.9%) | 47 (23.7%) |
Disability Class: Ambulatory Difficulty
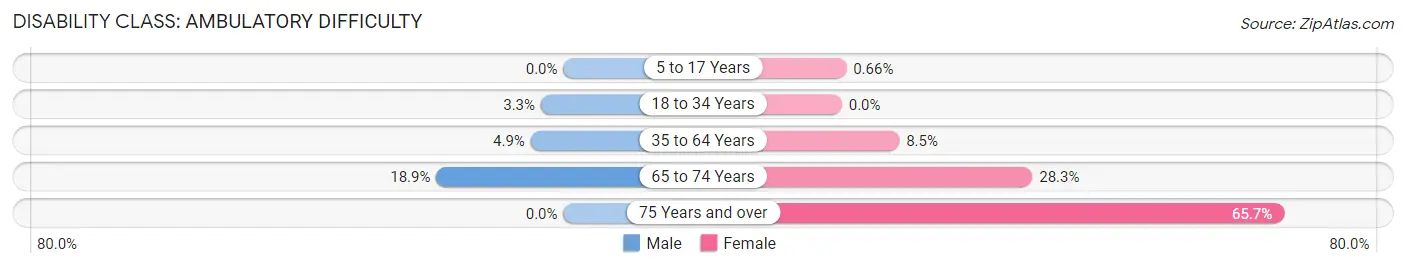
| Age Bracket | Male | Female |
| 5 to 17 Years | 0 (0.0%) | 3 (0.7%) |
| 18 to 34 Years | 42 (3.3%) | 0 (0.0%) |
| 35 to 64 Years | 75 (4.9%) | 128 (8.5%) |
| 65 to 74 Years | 70 (18.9%) | 127 (28.3%) |
| 75 Years and over | 0 (0.0%) | 130 (65.7%) |
Disability Class: Self-Care Difficulty
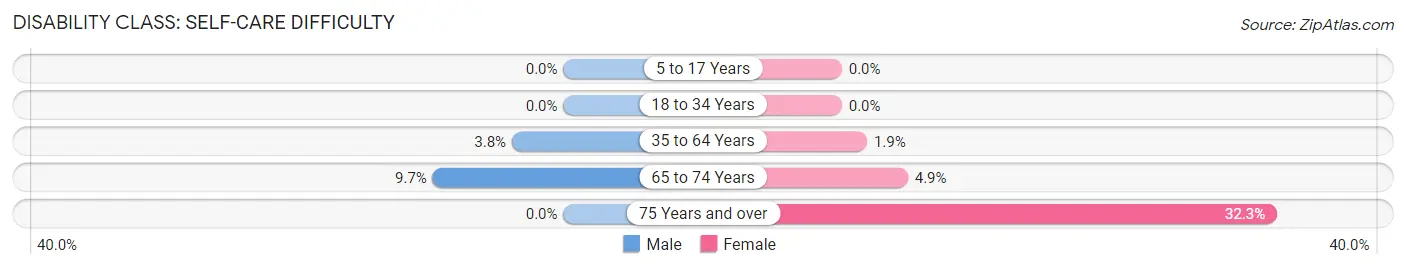
| Age Bracket | Male | Female |
| 5 to 17 Years | 0 (0.0%) | 0 (0.0%) |
| 18 to 34 Years | 0 (0.0%) | 0 (0.0%) |
| 35 to 64 Years | 59 (3.8%) | 28 (1.9%) |
| 65 to 74 Years | 36 (9.7%) | 22 (4.9%) |
| 75 Years and over | 0 (0.0%) | 64 (32.3%) |
Technology Access in Reserve
Computing Device Access in Reserve
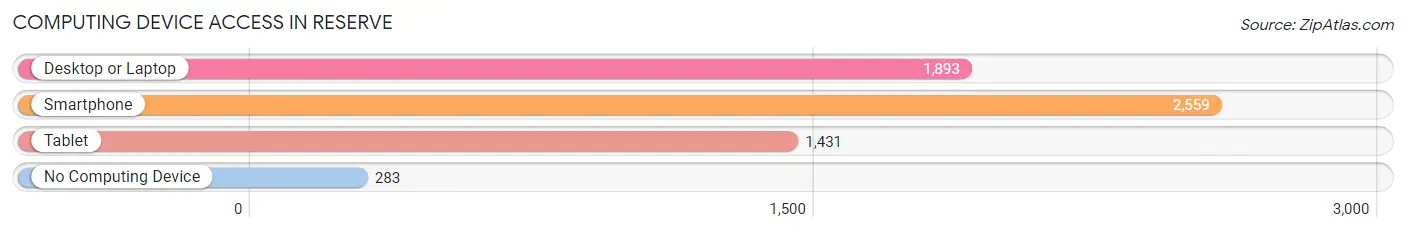
| Device Type | # Households | % Households |
| Desktop or Laptop | 1,893 | 62.7% |
| Smartphone | 2,559 | 84.7% |
| Tablet | 1,431 | 47.4% |
| No Computing Device | 283 | 9.4% |
| Total | 3,021 | 100.0% |
Internet Access in Reserve
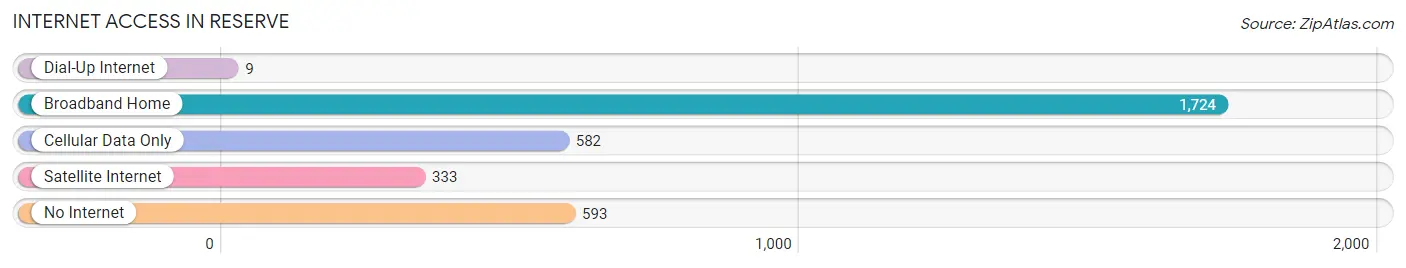
| Internet Type | # Households | % Households |
| Dial-Up Internet | 9 | 0.3% |
| Broadband Home | 1,724 | 57.1% |
| Cellular Data Only | 582 | 19.3% |
| Satellite Internet | 333 | 11.0% |
| No Internet | 593 | 19.6% |
| Total | 3,021 | 100.0% |
Reserve Summary
Reserve is a small town located in St. John the Baptist Parish, Louisiana. It is situated on the east bank of the Mississippi River, about 25 miles west of New Orleans. The town has a population of approximately 8,000 people and is part of the Greater New Orleans Metropolitan Area.
History
The area that is now Reserve was first settled by French colonists in the late 1700s. The town was originally known as La Reserve, which translates to “the reserve” in English. The name was chosen to reflect the fact that the area was set aside as a reserve for the French colonists.
In 1810, the town was incorporated as Reserve. The town was named after the nearby Reserve Canal, which was built to provide a navigable waterway between the Mississippi River and Lake Pontchartrain.
In the early 1900s, the town experienced a period of growth and development. The Reserve Canal was widened and deepened, and a railroad line was built to connect the town to New Orleans. The town also became a center for the sugar cane industry, with several sugar mills located in the area.
Geography
Reserve is located in southeastern Louisiana, on the east bank of the Mississippi River. The town is situated in St. John the Baptist Parish, about 25 miles west of New Orleans. The town is bordered by the Reserve Canal to the north, the Mississippi River to the east, and the town of LaPlace to the south.
The town has a total area of 4.2 square miles, all of which is land. The terrain is mostly flat, with some low hills in the northern part of the town. The climate is humid subtropical, with hot, humid summers and mild winters.
Economy
The economy of Reserve is largely based on agriculture and manufacturing. The town is home to several sugar mills, which process sugar cane grown in the area. The town is also home to several chemical plants, which produce a variety of products, including fertilizers, plastics, and rubber.
In addition to these industries, Reserve is also home to several retail stores, restaurants, and other businesses. The town is also home to a number of small businesses, including auto repair shops, beauty salons, and other services.
Demographics
As of the 2010 census, the population of Reserve was 8,099. The racial makeup of the town was 79.3% White, 17.2% African American, 0.5% Native American, 0.7% Asian, 0.1% Pacific Islander, and 1.2% from other races. Hispanic or Latino of any race were 2.3% of the population.
The median household income in Reserve was $37,941, and the median family income was $45,941. The per capita income was $18,941. About 17.2% of families and 20.3% of the population were below the poverty line, including 28.2% of those under age 18 and 11.2% of those age 65 or over.
Common Questions
What is Per Capita Income in Reserve?
Per Capita income in Reserve is $23,827.
What is the Median Family Income in Reserve?
Median Family Income in Reserve is $72,426.
What is the Median Household income in Reserve?
Median Household Income in Reserve is $55,183.
What is Income or Wage Gap in Reserve?
Income or Wage Gap in Reserve is 27.2%.
Women in Reserve earn 72.8 cents for every dollar earned by a man.
What is Inequality or Gini Index in Reserve?
Inequality or Gini Index in Reserve is 0.40.
What is the Total Population of Reserve?
Total Population of Reserve is 8,012.
What is the Total Male Population of Reserve?
Total Male Population of Reserve is 4,276.
What is the Total Female Population of Reserve?
Total Female Population of Reserve is 3,736.
What is the Ratio of Males per 100 Females in Reserve?
There are 114.45 Males per 100 Females in Reserve.
What is the Ratio of Females per 100 Males in Reserve?
There are 87.37 Females per 100 Males in Reserve.
What is the Median Population Age in Reserve?
Median Population Age in Reserve is 39.3 Years.
What is the Average Family Size in Reserve
Average Family Size in Reserve is 3.5 People.
What is the Average Household Size in Reserve
Average Household Size in Reserve is 2.6 People.
How Large is the Labor Force in Reserve?
There are 3,866 People in the Labor Forcein in Reserve.
What is the Percentage of People in the Labor Force in Reserve?
58.5% of People are in the Labor Force in Reserve.
What is the Unemployment Rate in Reserve?
Unemployment Rate in Reserve is 13.5%.