Severy, KS Map & Demographics
Severy Map
Severy Overview
$30,362
PER CAPITA INCOME
$71,250
AVG FAMILY INCOME
$34,375
AVG HOUSEHOLD INCOME
0.47
INEQUALITY / GINI INDEX
212
TOTAL POPULATION
125
MALE POPULATION
87
FEMALE POPULATION
143.68
MALES / 100 FEMALES
69.60
FEMALES / 100 MALES
55.8
MEDIAN AGE
2.5
AVG FAMILY SIZE
1.8
AVG HOUSEHOLD SIZE
117
LABOR FORCE [ PEOPLE ]
60.0%
PERCENT IN LABOR FORCE
Severy Zip Codes
Severy Area Codes
Income in Severy
Income Overview in Severy
Per Capita Income in Severy is $30,362, while median incomes of families and households are $71,250 and $34,375 respectively.
| Characteristic | Number | Measure |
| Per Capita Income | 212 | $30,362 |
| Median Family Income | 56 | $71,250 |
| Mean Family Income | 56 | $76,266 |
| Median Household Income | 121 | $34,375 |
| Mean Household Income | 121 | $52,338 |
| Income Deficit | 56 | $0 |
| Wage / Income Gap (%) | 212 | 0.00% |
| Wage / Income Gap ($) | 212 | 100.00¢ per $1 |
| Gini / Inequality Index | 212 | 0.47 |
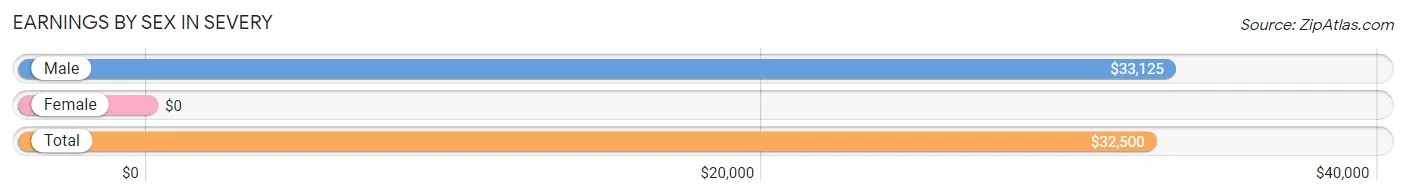
Earnings by Sex in Severy
| Sex | Number | Average Earnings |
| Male | 81 (66.4%) | $33,125 |
| Female | 41 (33.6%) | $0 |
| Total | 122 (100.0%) | $32,500 |
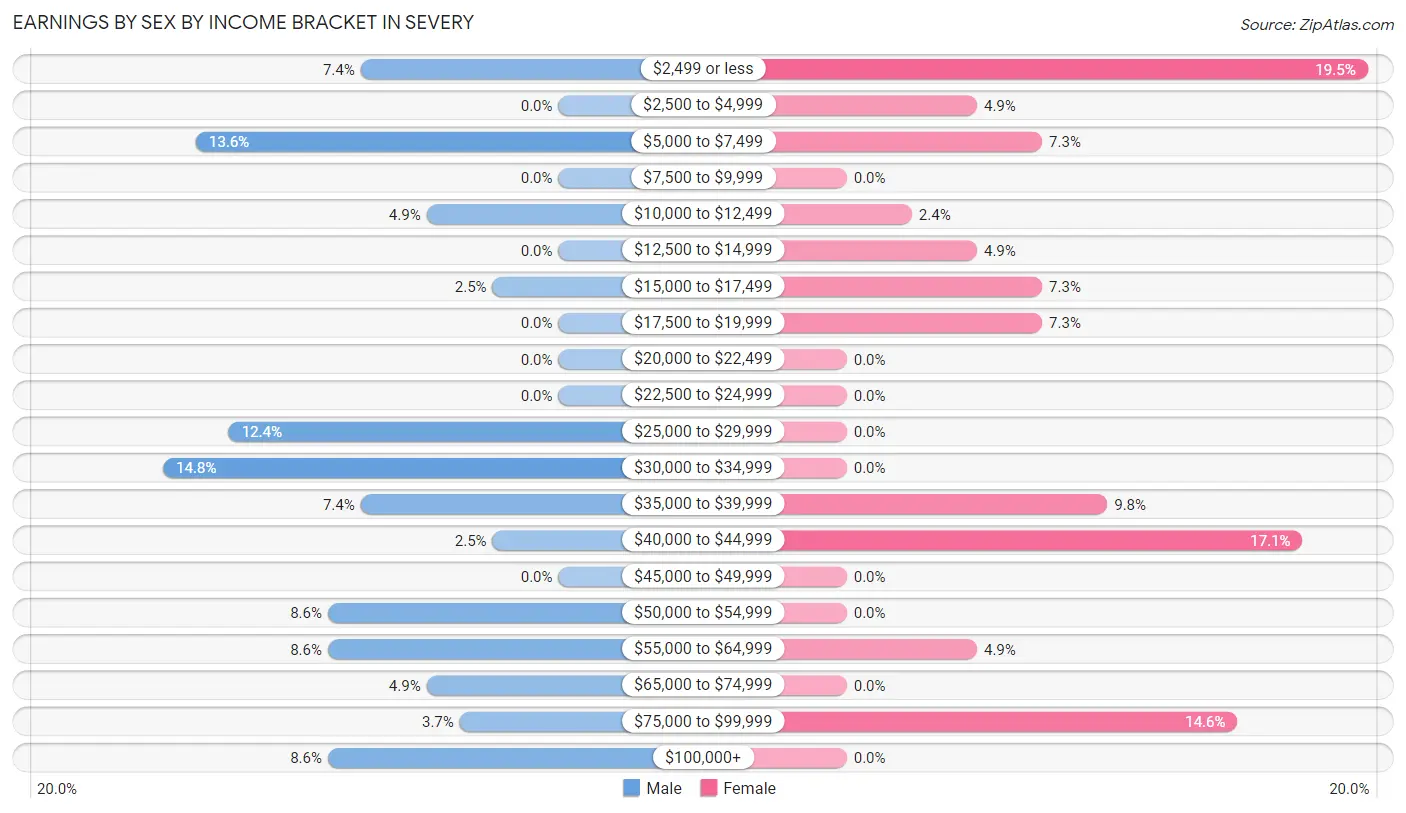
Earnings by Sex by Income Bracket in Severy
The most common earnings brackets in Severy are $30,000 to $34,999 for men (12 | 14.8%) and $2,499 or less for women (8 | 19.5%).
| Income | Male | Female |
| $2,499 or less | 6 (7.4%) | 8 (19.5%) |
| $2,500 to $4,999 | 0 (0.0%) | 2 (4.9%) |
| $5,000 to $7,499 | 11 (13.6%) | 3 (7.3%) |
| $7,500 to $9,999 | 0 (0.0%) | 0 (0.0%) |
| $10,000 to $12,499 | 4 (4.9%) | 1 (2.4%) |
| $12,500 to $14,999 | 0 (0.0%) | 2 (4.9%) |
| $15,000 to $17,499 | 2 (2.5%) | 3 (7.3%) |
| $17,500 to $19,999 | 0 (0.0%) | 3 (7.3%) |
| $20,000 to $22,499 | 0 (0.0%) | 0 (0.0%) |
| $22,500 to $24,999 | 0 (0.0%) | 0 (0.0%) |
| $25,000 to $29,999 | 10 (12.3%) | 0 (0.0%) |
| $30,000 to $34,999 | 12 (14.8%) | 0 (0.0%) |
| $35,000 to $39,999 | 6 (7.4%) | 4 (9.8%) |
| $40,000 to $44,999 | 2 (2.5%) | 7 (17.1%) |
| $45,000 to $49,999 | 0 (0.0%) | 0 (0.0%) |
| $50,000 to $54,999 | 7 (8.6%) | 0 (0.0%) |
| $55,000 to $64,999 | 7 (8.6%) | 2 (4.9%) |
| $65,000 to $74,999 | 4 (4.9%) | 0 (0.0%) |
| $75,000 to $99,999 | 3 (3.7%) | 6 (14.6%) |
| $100,000+ | 7 (8.6%) | 0 (0.0%) |
| Total | 81 (100.0%) | 41 (100.0%) |
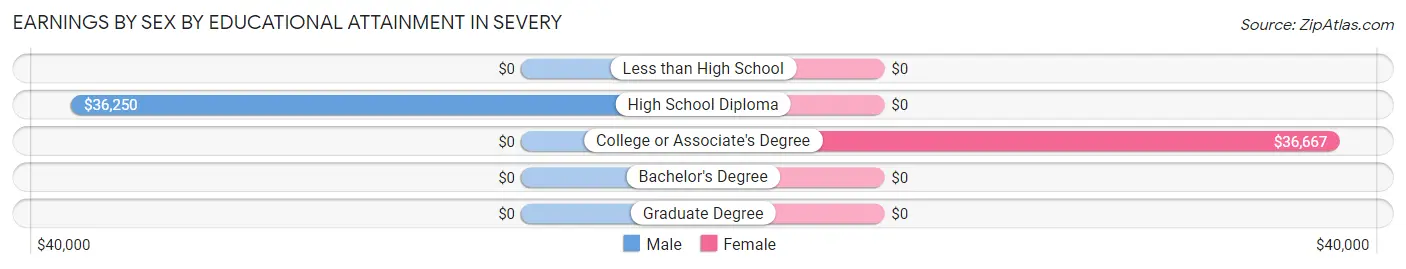
Earnings by Sex by Educational Attainment in Severy
| Educational Attainment | Male Income | Female Income |
| Less than High School | - | - |
| High School Diploma | $36,250 | $0 |
| College or Associate's Degree | - | - |
| Bachelor's Degree | - | - |
| Graduate Degree | - | - |
| Total | $34,375 | $0 |
Family Income in Severy
Family Income Brackets in Severy
According to the Severy family income data, there are 17 families falling into the $35,000 to $49,999 income range, which is the most common income bracket and makes up 30.4% of all families.
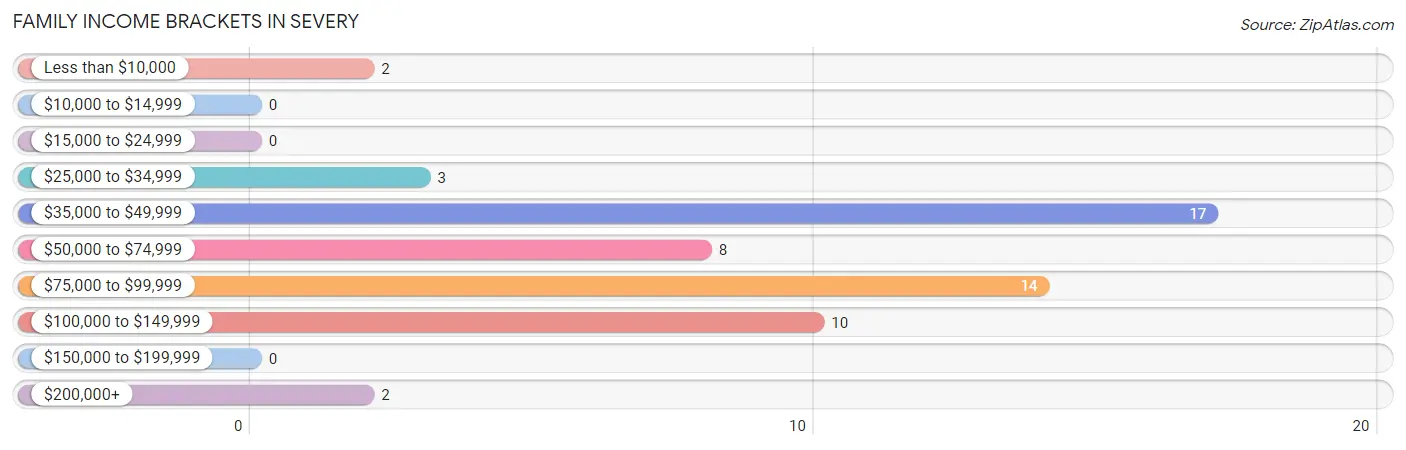
| Income Bracket | # Families | % Families |
| Less than $10,000 | 2 | 3.6% |
| $10,000 to $14,999 | 0 | 0.0% |
| $15,000 to $24,999 | 0 | 0.0% |
| $25,000 to $34,999 | 3 | 5.4% |
| $35,000 to $49,999 | 17 | 30.4% |
| $50,000 to $74,999 | 8 | 14.3% |
| $75,000 to $99,999 | 14 | 25.0% |
| $100,000 to $149,999 | 10 | 17.9% |
| $150,000 to $199,999 | 0 | 0.0% |
| $200,000+ | 2 | 3.6% |
Family Income by Famaliy Size in Severy
3-person families (8 | 14.3%) account for the highest median family income in Severy with $73,750 per family, while 2-person families (44 | 78.6%) have the highest median income of $26,875 per family member.
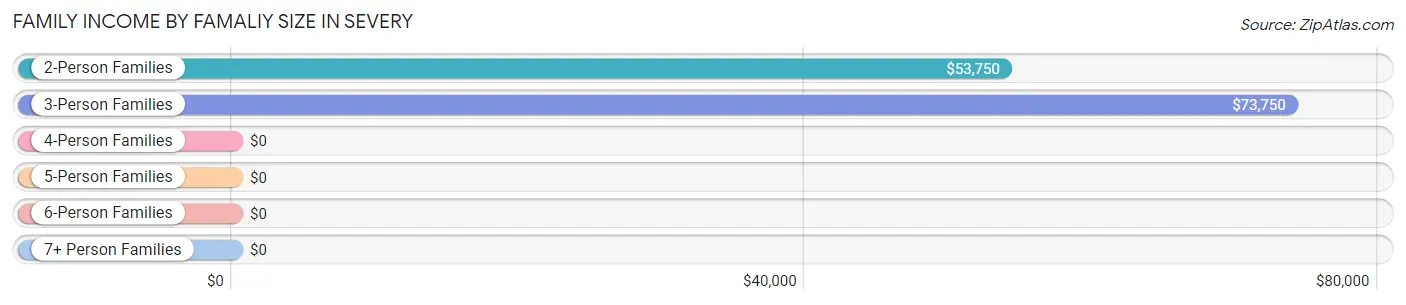
| Income Bracket | # Families | Median Income |
| 2-Person Families | 44 (78.6%) | $53,750 |
| 3-Person Families | 8 (14.3%) | $73,750 |
| 4-Person Families | 2 (3.6%) | $0 |
| 5-Person Families | 0 (0.0%) | $0 |
| 6-Person Families | 0 (0.0%) | $0 |
| 7+ Person Families | 2 (3.6%) | $0 |
| Total | 56 (100.0%) | $71,250 |
Family Income by Number of Earners in Severy
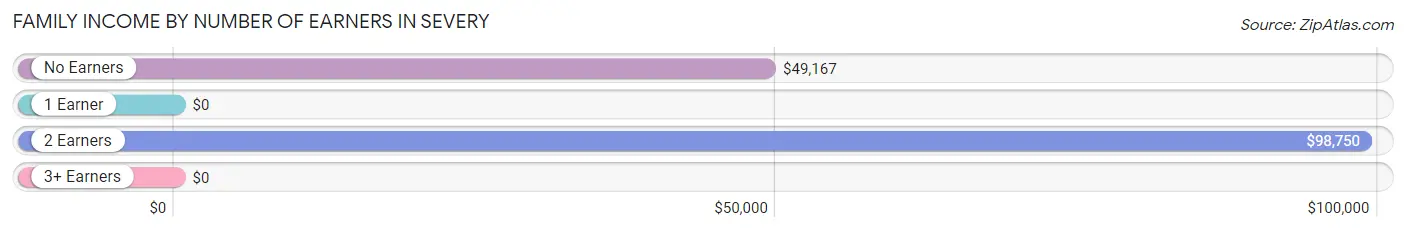
| Number of Earners | # Families | Median Income |
| No Earners | 14 (25.0%) | $49,167 |
| 1 Earner | 15 (26.8%) | $0 |
| 2 Earners | 22 (39.3%) | $98,750 |
| 3+ Earners | 5 (8.9%) | $0 |
| Total | 56 (100.0%) | $71,250 |
Household Income in Severy
Household Income Brackets in Severy
With 21 households falling in the category, the $25,000 to $34,999 income range is the most frequent in Severy, accounting for 17.4% of all households.
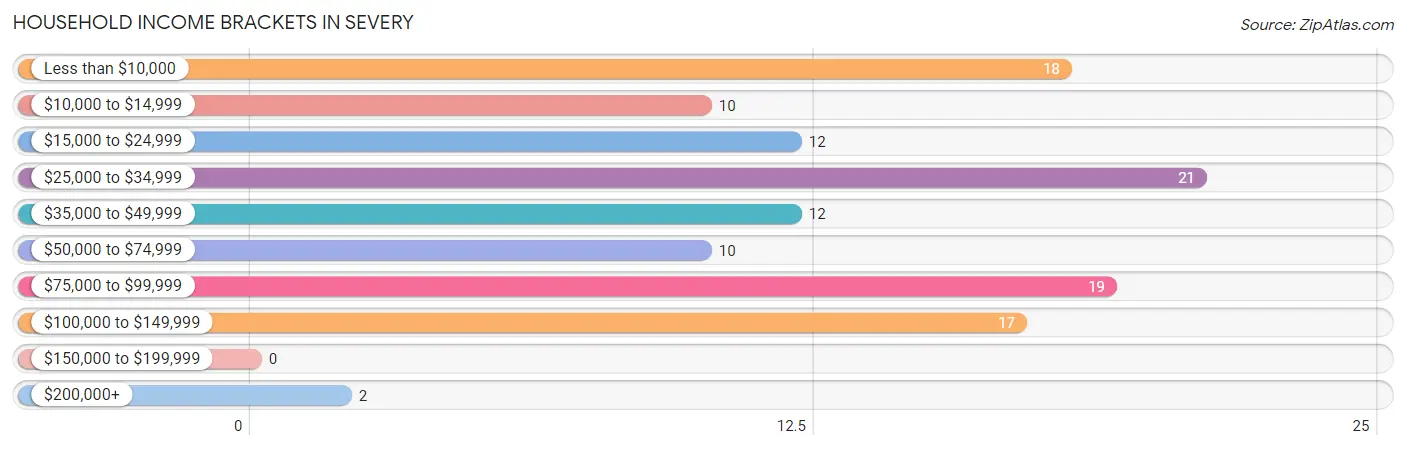
| Income Bracket | # Households | % Households |
| Less than $10,000 | 18 | 14.9% |
| $10,000 to $14,999 | 10 | 8.3% |
| $15,000 to $24,999 | 12 | 9.9% |
| $25,000 to $34,999 | 21 | 17.4% |
| $35,000 to $49,999 | 12 | 9.9% |
| $50,000 to $74,999 | 10 | 8.3% |
| $75,000 to $99,999 | 19 | 15.7% |
| $100,000 to $149,999 | 17 | 14.0% |
| $150,000 to $199,999 | 0 | 0.0% |
| $200,000+ | 2 | 1.7% |
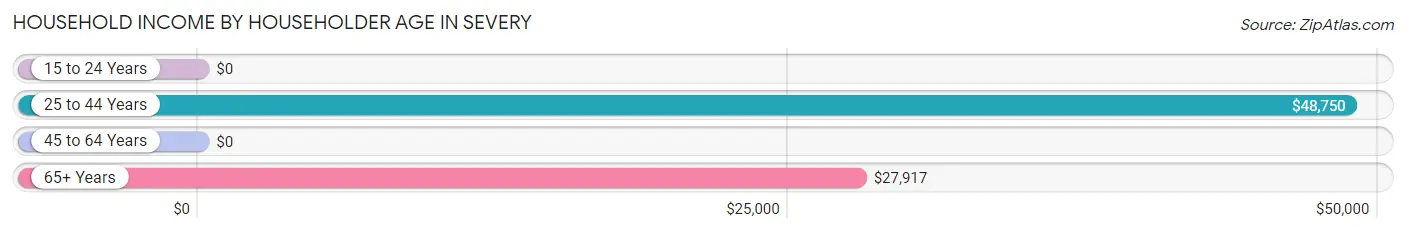
Household Income by Householder Age in Severy
The median household income in Severy is $34,375, with the highest median household income of $48,750 found in the 25 to 44 years age bracket for the primary householder. A total of 8 households (6.6%) fall into this category.
| Income Bracket | # Households | Median Income |
| 15 to 24 Years | 0 (0.0%) | $0 |
| 25 to 44 Years | 8 (6.6%) | $48,750 |
| 45 to 64 Years | 66 (54.5%) | $0 |
| 65+ Years | 47 (38.8%) | $27,917 |
| Total | 121 (100.0%) | $34,375 |
Poverty in Severy
Income Below Poverty by Sex and Age in Severy
With 18.4% poverty level for males and 14.9% for females among the residents of Severy, 45 to 54 year old males and 35 to 44 year old females are the most vulnerable to poverty, with 11 males (28.9%) and 2 females (50.0%) in their respective age groups living below the poverty level.
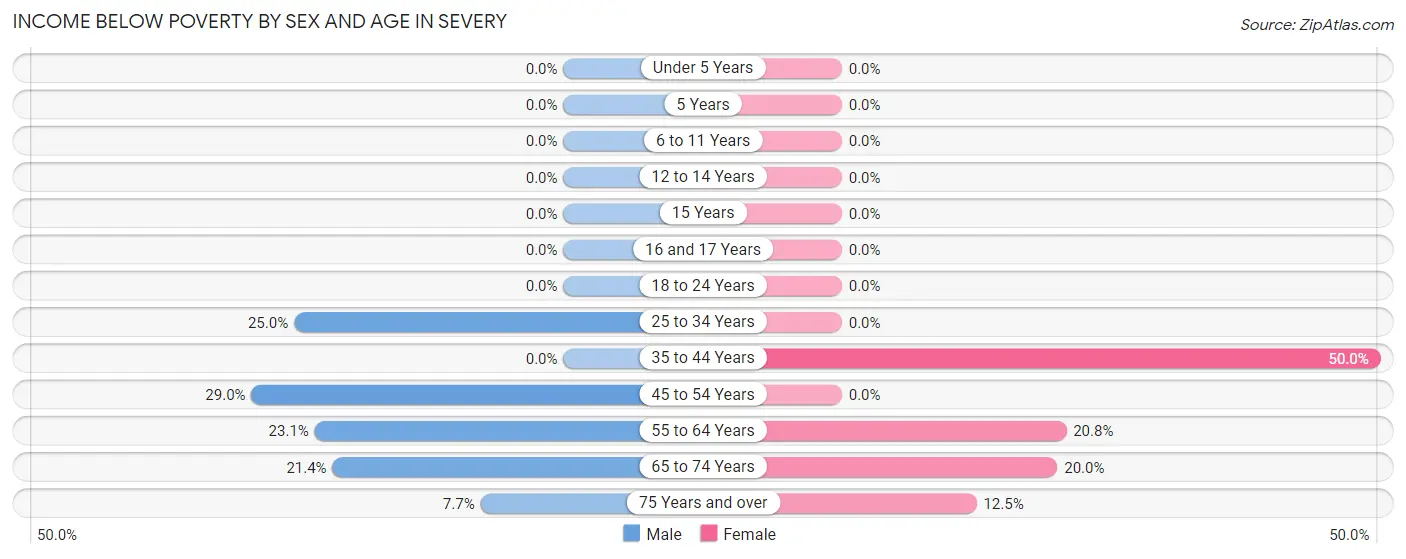
| Age Bracket | Male | Female |
| Under 5 Years | 0 (0.0%) | 0 (0.0%) |
| 5 Years | 0 (0.0%) | 0 (0.0%) |
| 6 to 11 Years | 0 (0.0%) | 0 (0.0%) |
| 12 to 14 Years | 0 (0.0%) | 0 (0.0%) |
| 15 Years | 0 (0.0%) | 0 (0.0%) |
| 16 and 17 Years | 0 (0.0%) | 0 (0.0%) |
| 18 to 24 Years | 0 (0.0%) | 0 (0.0%) |
| 25 to 34 Years | 2 (25.0%) | 0 (0.0%) |
| 35 to 44 Years | 0 (0.0%) | 2 (50.0%) |
| 45 to 54 Years | 11 (28.9%) | 0 (0.0%) |
| 55 to 64 Years | 6 (23.1%) | 5 (20.8%) |
| 65 to 74 Years | 3 (21.4%) | 4 (20.0%) |
| 75 Years and over | 1 (7.7%) | 2 (12.5%) |
| Total | 23 (18.4%) | 13 (14.9%) |
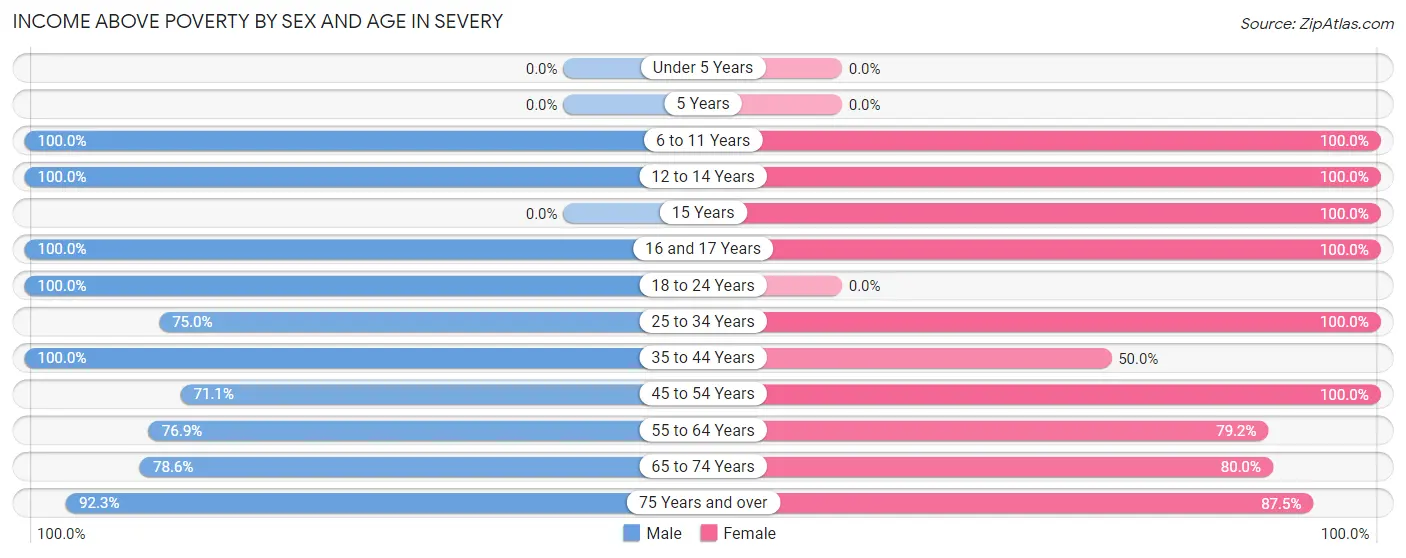
Income Above Poverty by Sex and Age in Severy
According to the poverty statistics in Severy, males aged 6 to 11 years and females aged 6 to 11 years are the age groups that are most secure financially, with 100.0% of males and 100.0% of females in these age groups living above the poverty line.
| Age Bracket | Male | Female |
| Under 5 Years | 0 (0.0%) | 0 (0.0%) |
| 5 Years | 0 (0.0%) | 0 (0.0%) |
| 6 to 11 Years | 6 (100.0%) | 2 (100.0%) |
| 12 to 14 Years | 6 (100.0%) | 1 (100.0%) |
| 15 Years | 0 (0.0%) | 2 (100.0%) |
| 16 and 17 Years | 1 (100.0%) | 2 (100.0%) |
| 18 to 24 Years | 6 (100.0%) | 0 (0.0%) |
| 25 to 34 Years | 6 (75.0%) | 2 (100.0%) |
| 35 to 44 Years | 7 (100.0%) | 2 (50.0%) |
| 45 to 54 Years | 27 (71.1%) | 14 (100.0%) |
| 55 to 64 Years | 20 (76.9%) | 19 (79.2%) |
| 65 to 74 Years | 11 (78.6%) | 16 (80.0%) |
| 75 Years and over | 12 (92.3%) | 14 (87.5%) |
| Total | 102 (81.6%) | 74 (85.1%) |
Income Below Poverty Among Married-Couple Families in Severy
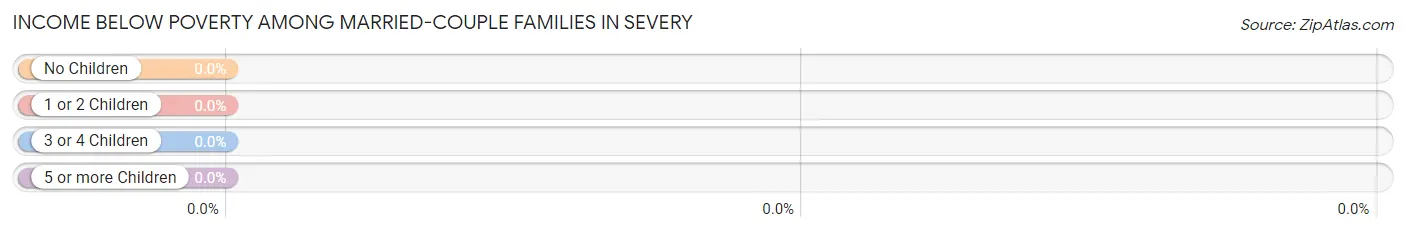
| Children | Above Poverty | Below Poverty |
| No Children | 38 (100.0%) | 0 (0.0%) |
| 1 or 2 Children | 5 (100.0%) | 0 (0.0%) |
| 3 or 4 Children | 0 (0.0%) | 0 (0.0%) |
| 5 or more Children | 2 (100.0%) | 0 (0.0%) |
| Total | 45 (100.0%) | 0 (0.0%) |
Income Below Poverty Among Single-Parent Households in Severy
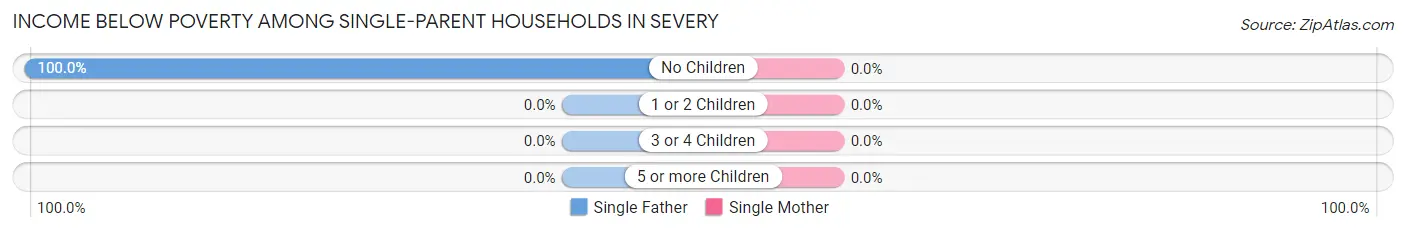
| Children | Single Father | Single Mother |
| No Children | 2 (100.0%) | 0 (0.0%) |
| 1 or 2 Children | 0 (0.0%) | 0 (0.0%) |
| 3 or 4 Children | 0 (0.0%) | 0 (0.0%) |
| 5 or more Children | 0 (0.0%) | 0 (0.0%) |
| Total | 2 (100.0%) | 0 (0.0%) |
Income Below Poverty Among Married-Couple vs Single-Parent Households in Severy
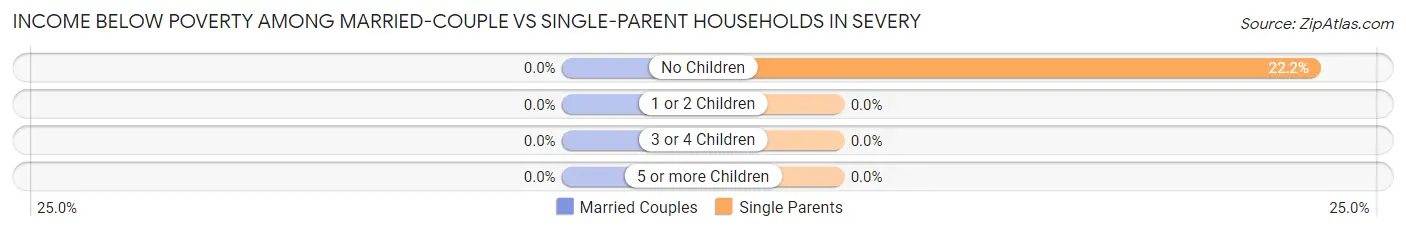
| Children | Married-Couple Families | Single-Parent Households |
| No Children | 0 (0.0%) | 2 (22.2%) |
| 1 or 2 Children | 0 (0.0%) | 0 (0.0%) |
| 3 or 4 Children | 0 (0.0%) | 0 (0.0%) |
| 5 or more Children | 0 (0.0%) | 0 (0.0%) |
| Total | 0 (0.0%) | 2 (18.2%) |
Race in Severy
The most populous races in Severy are White / Caucasian (196 | 92.4%), Two or more Races (12 | 5.7%), and Native / Alaskan (4 | 1.9%).
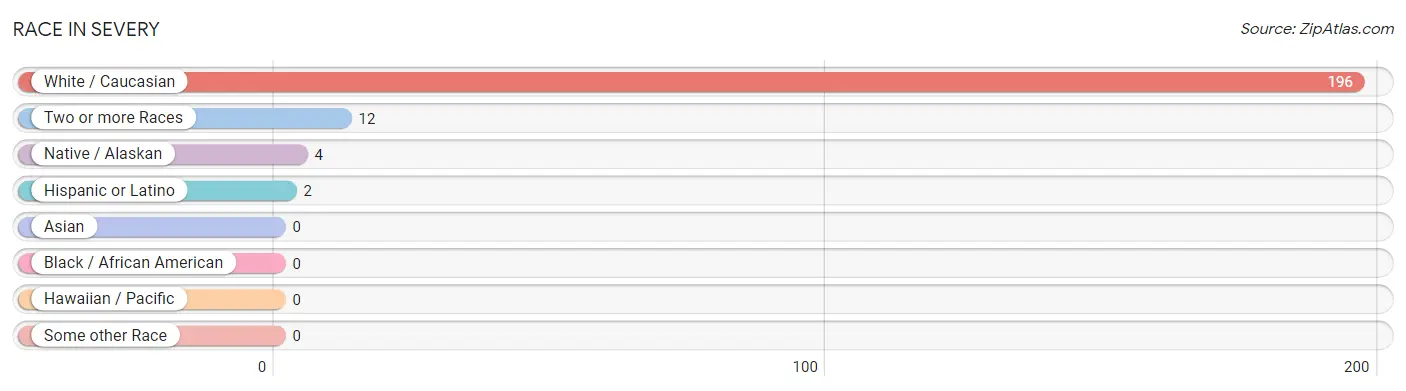
| Race | # Population | % Population |
| Asian | 0 | 0.0% |
| Black / African American | 0 | 0.0% |
| Hawaiian / Pacific | 0 | 0.0% |
| Hispanic or Latino | 2 | 0.9% |
| Native / Alaskan | 4 | 1.9% |
| White / Caucasian | 196 | 92.4% |
| Two or more Races | 12 | 5.7% |
| Some other Race | 0 | 0.0% |
| Total | 212 | 100.0% |
Ancestry in Severy
The most populous ancestries reported in Severy are German (64 | 30.2%), English (31 | 14.6%), Irish (16 | 7.5%), American (11 | 5.2%), and French (11 | 5.2%), together accounting for 62.7% of all Severy residents.
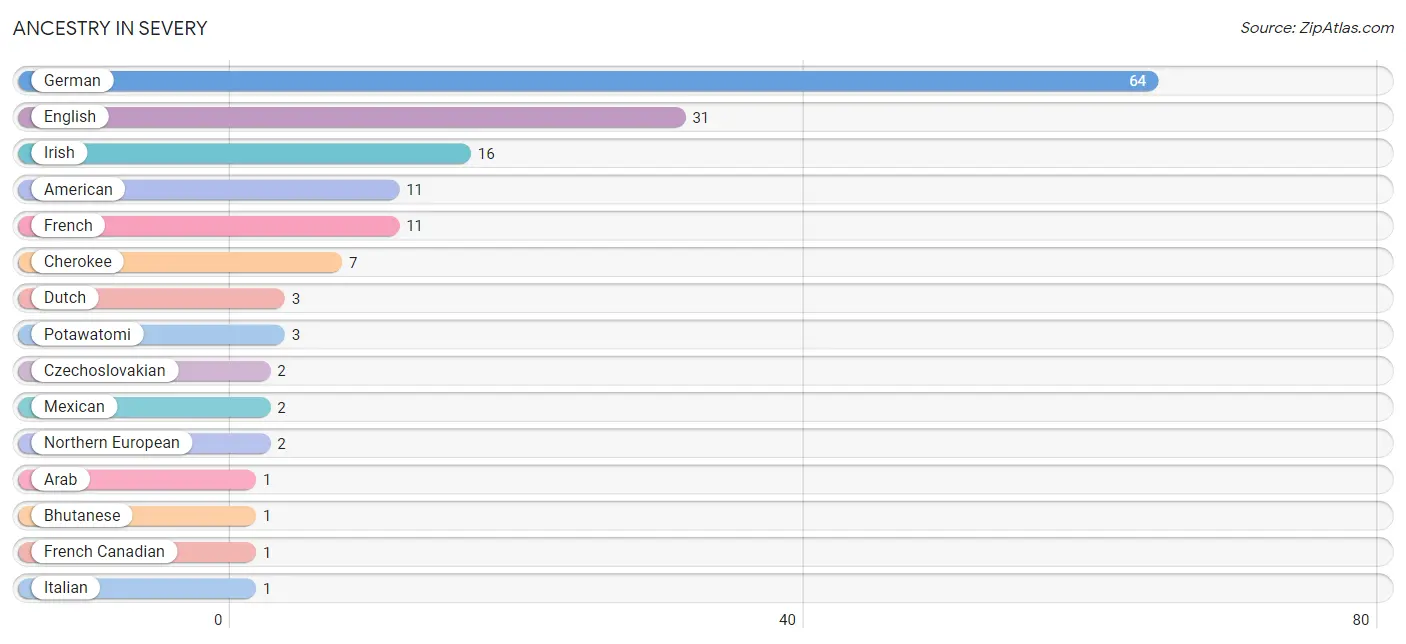
| Ancestry | # Population | % Population |
| American | 11 | 5.2% |
| Arab | 1 | 0.5% |
| Bhutanese | 1 | 0.5% |
| Cherokee | 7 | 3.3% |
| Czechoslovakian | 2 | 0.9% |
| Dutch | 3 | 1.4% |
| English | 31 | 14.6% |
| French | 11 | 5.2% |
| French Canadian | 1 | 0.5% |
| German | 64 | 30.2% |
| Irish | 16 | 7.5% |
| Italian | 1 | 0.5% |
| Mexican | 2 | 0.9% |
| Northern European | 2 | 0.9% |
| Potawatomi | 3 | 1.4% |
| Scottish | 1 | 0.5% |
| Syrian | 1 | 0.5% | View All 17 Rows |
Immigrants in Severy
The most numerous immigrant groups reported in Severy came from , and Canada (1 | 0.5%), together accounting for 0.5% of all Severy residents.

| Immigration Origin | # Population | % Population |
| Canada | 1 | 0.5% | View All 1 Rows |
Sex and Age in Severy
Sex and Age in Severy
The most populous age groups in Severy are 45 to 49 Years (25 | 20.0%) for men and 65 to 69 Years (17 | 19.5%) for women.
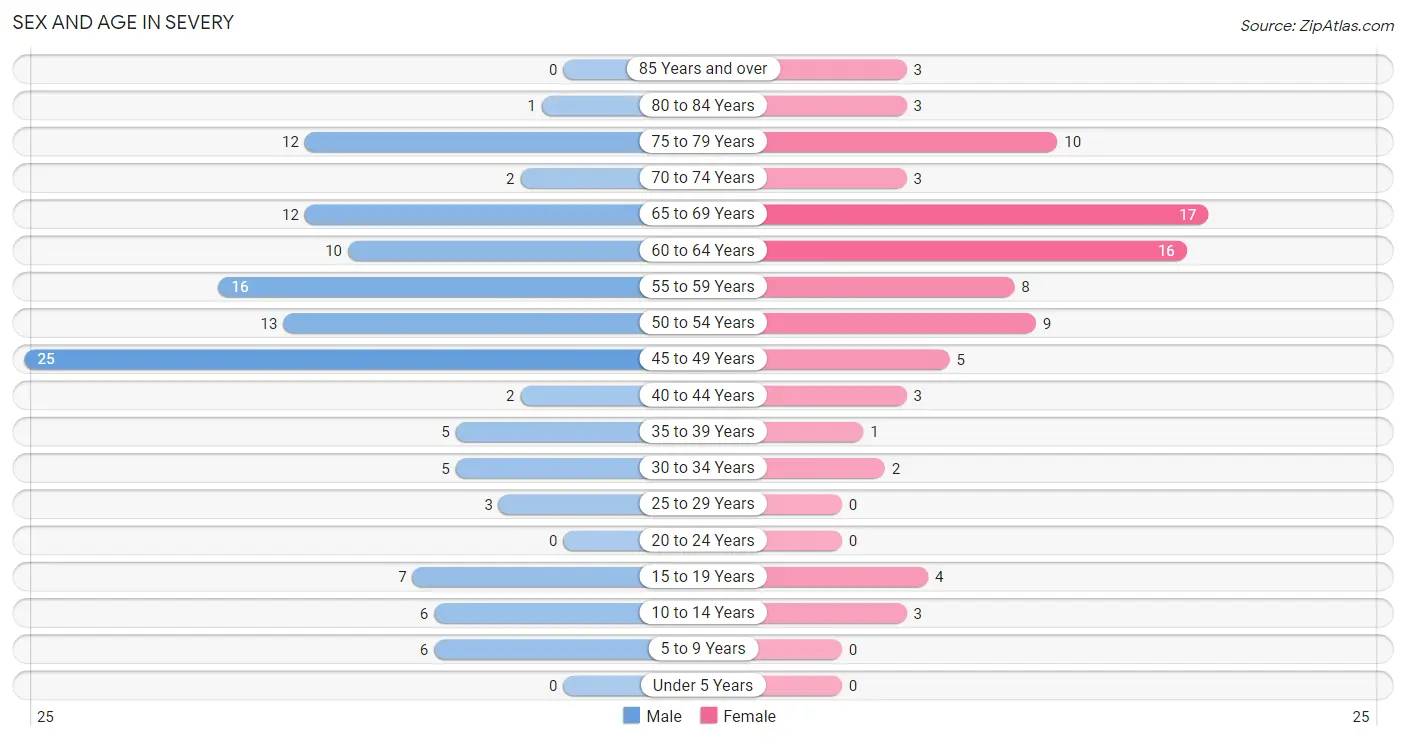
| Age Bracket | Male | Female |
| Under 5 Years | 0 (0.0%) | 0 (0.0%) |
| 5 to 9 Years | 6 (4.8%) | 0 (0.0%) |
| 10 to 14 Years | 6 (4.8%) | 3 (3.5%) |
| 15 to 19 Years | 7 (5.6%) | 4 (4.6%) |
| 20 to 24 Years | 0 (0.0%) | 0 (0.0%) |
| 25 to 29 Years | 3 (2.4%) | 0 (0.0%) |
| 30 to 34 Years | 5 (4.0%) | 2 (2.3%) |
| 35 to 39 Years | 5 (4.0%) | 1 (1.1%) |
| 40 to 44 Years | 2 (1.6%) | 3 (3.5%) |
| 45 to 49 Years | 25 (20.0%) | 5 (5.8%) |
| 50 to 54 Years | 13 (10.4%) | 9 (10.3%) |
| 55 to 59 Years | 16 (12.8%) | 8 (9.2%) |
| 60 to 64 Years | 10 (8.0%) | 16 (18.4%) |
| 65 to 69 Years | 12 (9.6%) | 17 (19.5%) |
| 70 to 74 Years | 2 (1.6%) | 3 (3.5%) |
| 75 to 79 Years | 12 (9.6%) | 10 (11.5%) |
| 80 to 84 Years | 1 (0.8%) | 3 (3.5%) |
| 85 Years and over | 0 (0.0%) | 3 (3.5%) |
| Total | 125 (100.0%) | 87 (100.0%) |
Families and Households in Severy
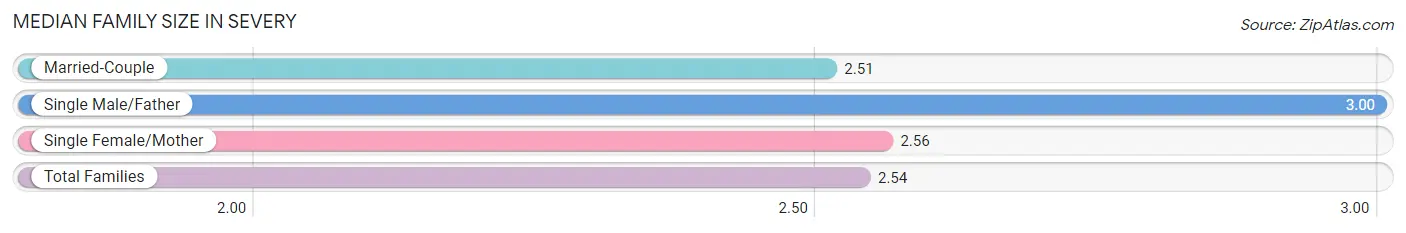
Median Family Size in Severy
The median family size in Severy is 2.54 persons per family, with single male/father families (2 | 3.6%) accounting for the largest median family size of 3 persons per family. On the other hand, married-couple families (45 | 80.4%) represent the smallest median family size with 2.51 persons per family.
| Family Type | # Families | Family Size |
| Married-Couple | 45 (80.4%) | 2.51 |
| Single Male/Father | 2 (3.6%) | 3.00 |
| Single Female/Mother | 9 (16.1%) | 2.56 |
| Total Families | 56 (100.0%) | 2.54 |
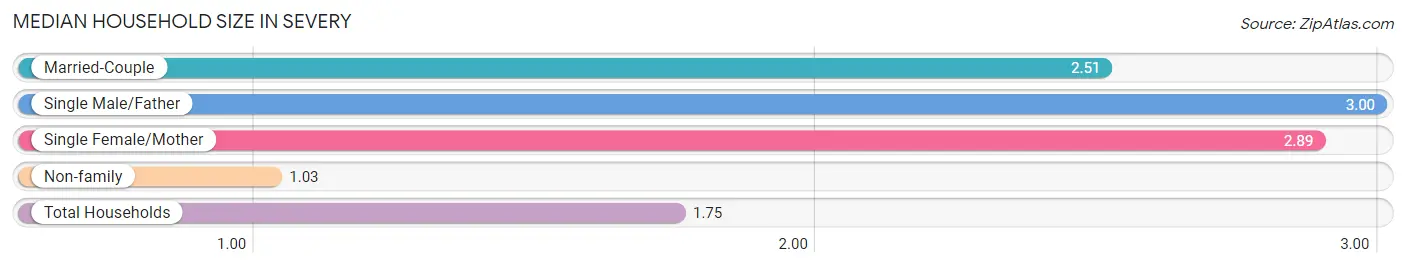
Median Household Size in Severy
The median household size in Severy is 1.75 persons per household, with single male/father households (2 | 1.7%) accounting for the largest median household size of 3 persons per household. non-family households (65 | 53.7%) represent the smallest median household size with 1.03 persons per household.
| Household Type | # Households | Household Size |
| Married-Couple | 45 (37.2%) | 2.51 |
| Single Male/Father | 2 (1.7%) | 3.00 |
| Single Female/Mother | 9 (7.4%) | 2.89 |
| Non-family | 65 (53.7%) | 1.03 |
| Total Households | 121 (100.0%) | 1.75 |
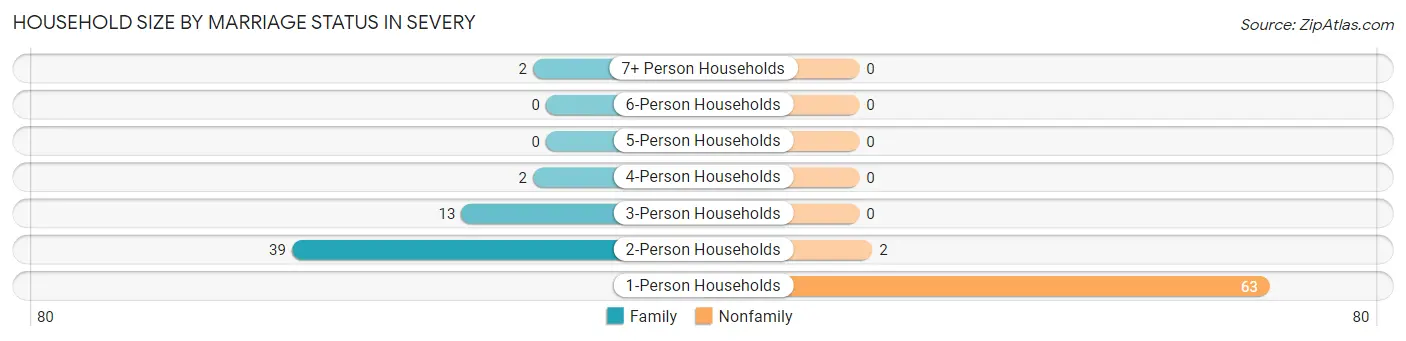
Household Size by Marriage Status in Severy
Out of a total of 121 households in Severy, 56 (46.3%) are family households, while 65 (53.7%) are nonfamily households. The most numerous type of family households are 2-person households, comprising 39, and the most common type of nonfamily households are 1-person households, comprising 63.
| Household Size | Family Households | Nonfamily Households |
| 1-Person Households | - | 63 (52.1%) |
| 2-Person Households | 39 (32.2%) | 2 (1.7%) |
| 3-Person Households | 13 (10.7%) | 0 (0.0%) |
| 4-Person Households | 2 (1.7%) | 0 (0.0%) |
| 5-Person Households | 0 (0.0%) | 0 (0.0%) |
| 6-Person Households | 0 (0.0%) | 0 (0.0%) |
| 7+ Person Households | 2 (1.7%) | 0 (0.0%) |
| Total | 56 (46.3%) | 65 (53.7%) |
Female Fertility in Severy
Fertility by Age in Severy
| Age Bracket | Women with Births | Births / 1,000 Women |
| 15 to 19 years | 0 (0.0%) | 0.0 |
| 20 to 34 years | 0 (0.0%) | 0.0 |
| 35 to 50 years | 0 (0.0%) | 0.0 |
| Total | 0 (0.0%) | 0.0 |
Fertility by Age by Marriage Status in Severy
| Age Bracket | Married | Unmarried |
| 15 to 19 years | 0 (0.0%) | 0 (0.0%) |
| 20 to 34 years | 0 (0.0%) | 0 (0.0%) |
| 35 to 50 years | 0 (0.0%) | 0 (0.0%) |
| Total | 0 (0.0%) | 0 (0.0%) |
Fertility by Education in Severy
| Educational Attainment | Women with Births | Births / 1,000 Women |
| Less than High School | 0 (0.0%) | 0.0 |
| High School Diploma | 0 (0.0%) | 0.0 |
| College or Associate's Degree | 0 (0.0%) | 0.0 |
| Bachelor's Degree | 0 (0.0%) | 0.0 |
| Graduate Degree | 0 (0.0%) | 0.0 |
| Total | 0 (0.0%) | 0.0 |
Fertility by Education by Marriage Status in Severy
| Educational Attainment | Married | Unmarried |
| Less than High School | 0 (0.0%) | 0 (0.0%) |
| High School Diploma | 0 (0.0%) | 0 (0.0%) |
| College or Associate's Degree | 0 (0.0%) | 0 (0.0%) |
| Bachelor's Degree | 0 (0.0%) | 0 (0.0%) |
| Graduate Degree | 0 (0.0%) | 0 (0.0%) |
| Total | 0 (0.0%) | 0 (0.0%) |
Employment Characteristics in Severy
Employment by Class of Employer in Severy
Among the 115 employed individuals in Severy, private company employees (66 | 57.4%), local government employees (23 | 20.0%), and unpaid family workers (6 | 5.2%) make up the most common classes of employment.
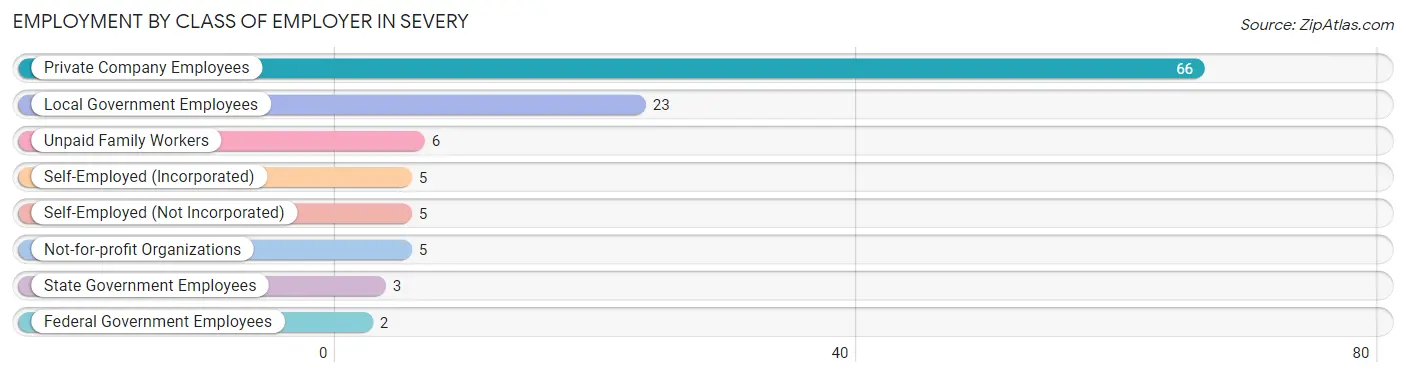
| Employer Class | # Employees | % Employees |
| Private Company Employees | 66 | 57.4% |
| Self-Employed (Incorporated) | 5 | 4.3% |
| Self-Employed (Not Incorporated) | 5 | 4.3% |
| Not-for-profit Organizations | 5 | 4.3% |
| Local Government Employees | 23 | 20.0% |
| State Government Employees | 3 | 2.6% |
| Federal Government Employees | 2 | 1.7% |
| Unpaid Family Workers | 6 | 5.2% |
| Total | 115 | 100.0% |
Employment Status by Age in Severy
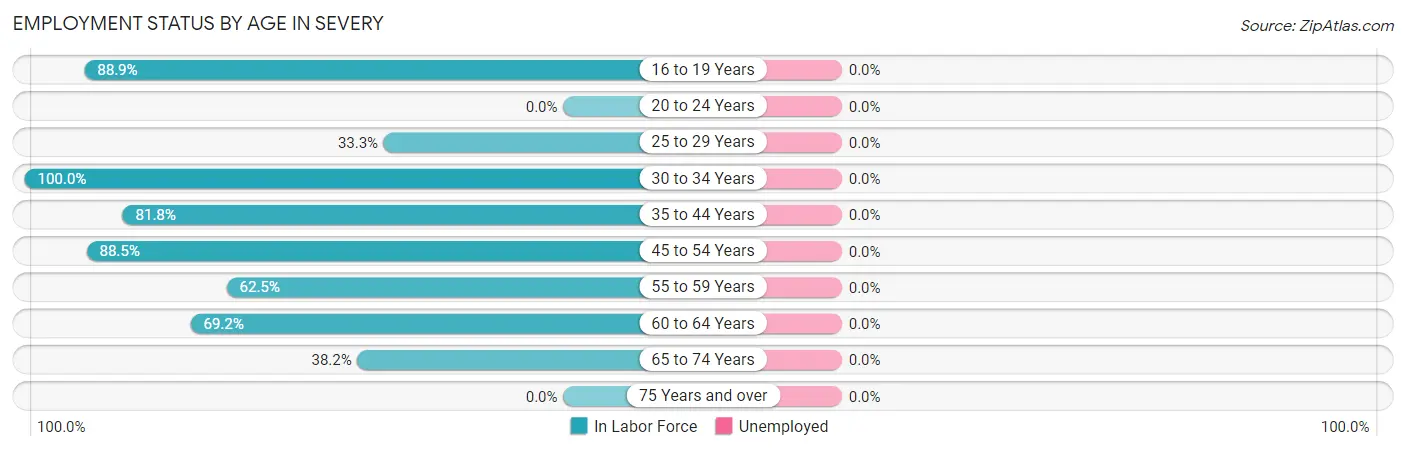
| Age Bracket | In Labor Force | Unemployed |
| 16 to 19 Years | 8 (88.9%) | 0 (0.0%) |
| 20 to 24 Years | 0 (0.0%) | 0 (0.0%) |
| 25 to 29 Years | 1 (33.3%) | 0 (0.0%) |
| 30 to 34 Years | 7 (100.0%) | 0 (0.0%) |
| 35 to 44 Years | 9 (81.8%) | 0 (0.0%) |
| 45 to 54 Years | 46 (88.5%) | 0 (0.0%) |
| 55 to 59 Years | 15 (62.5%) | 0 (0.0%) |
| 60 to 64 Years | 18 (69.2%) | 0 (0.0%) |
| 65 to 74 Years | 13 (38.2%) | 0 (0.0%) |
| 75 Years and over | 0 (0.0%) | 0 (0.0%) |
| Total | 117 (60.0%) | 0 (0.0%) |
Employment Status by Educational Attainment in Severy
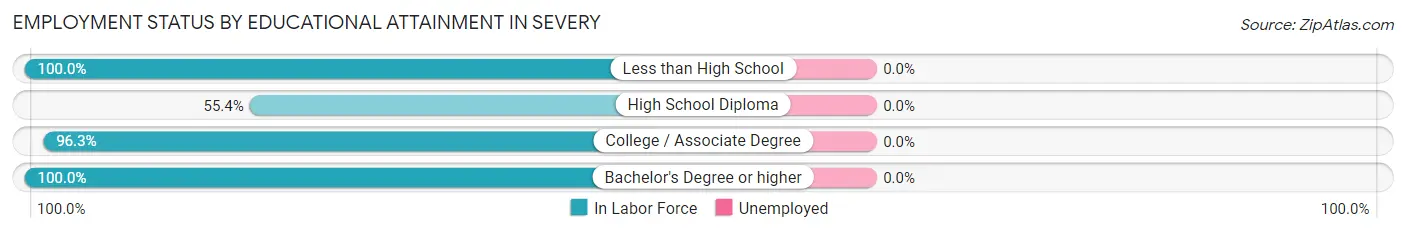
| Educational Attainment | In Labor Force | Unemployed |
| Less than High School | 9 (100.0%) | 0 (0.0%) |
| High School Diploma | 31 (55.4%) | 0 (0.0%) |
| College / Associate Degree | 52 (96.3%) | 0 (0.0%) |
| Bachelor's Degree or higher | 4 (100.0%) | 0 (0.0%) |
| Total | 96 (78.0%) | 0 (0.0%) |
Employment Occupations by Sex in Severy
Management, Business, Science and Arts Occupations
The most common Management, Business, Science and Arts occupations in Severy are Community & Social Service (8 | 6.8%), Health Diagnosing & Treating (6 | 5.1%), Management (5 | 4.3%), Arts, Media & Entertainment (5 | 4.3%), and Health Technologists (4 | 3.4%).
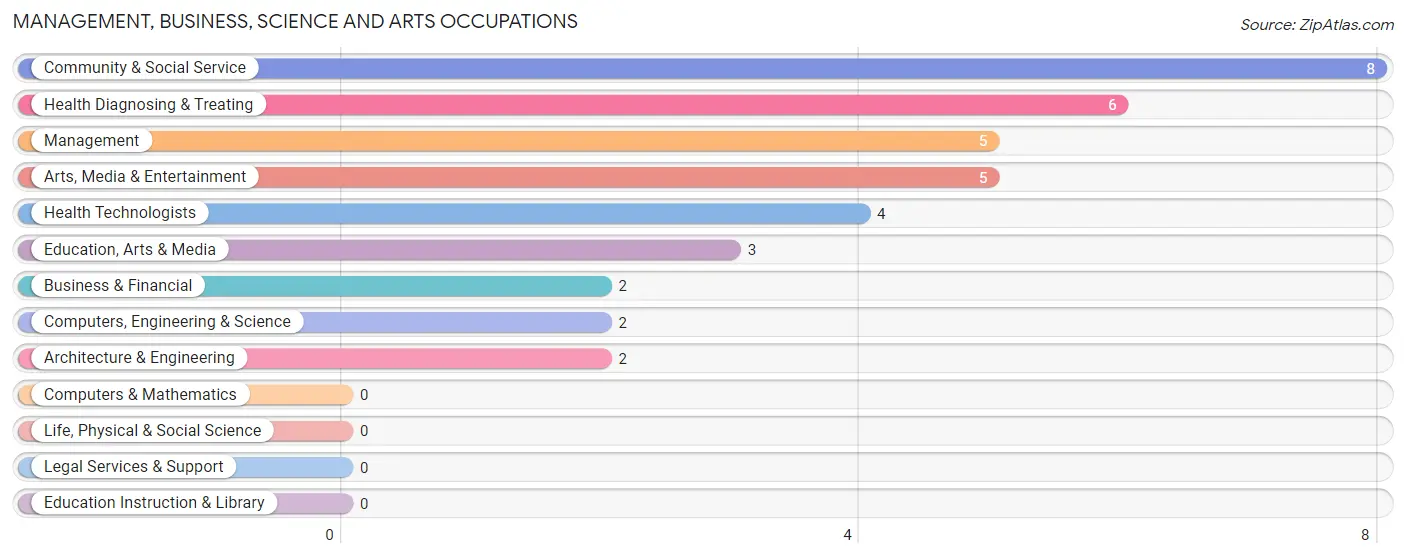
Management, Business, Science and Arts Occupations by Sex
Within the Management, Business, Science and Arts occupations in Severy, the most male-oriented occupations are Management (100.0%), Computers, Engineering & Science (100.0%), and Architecture & Engineering (100.0%), while the most female-oriented occupations are Business & Financial (100.0%), Health Diagnosing & Treating (100.0%), and Health Technologists (100.0%).
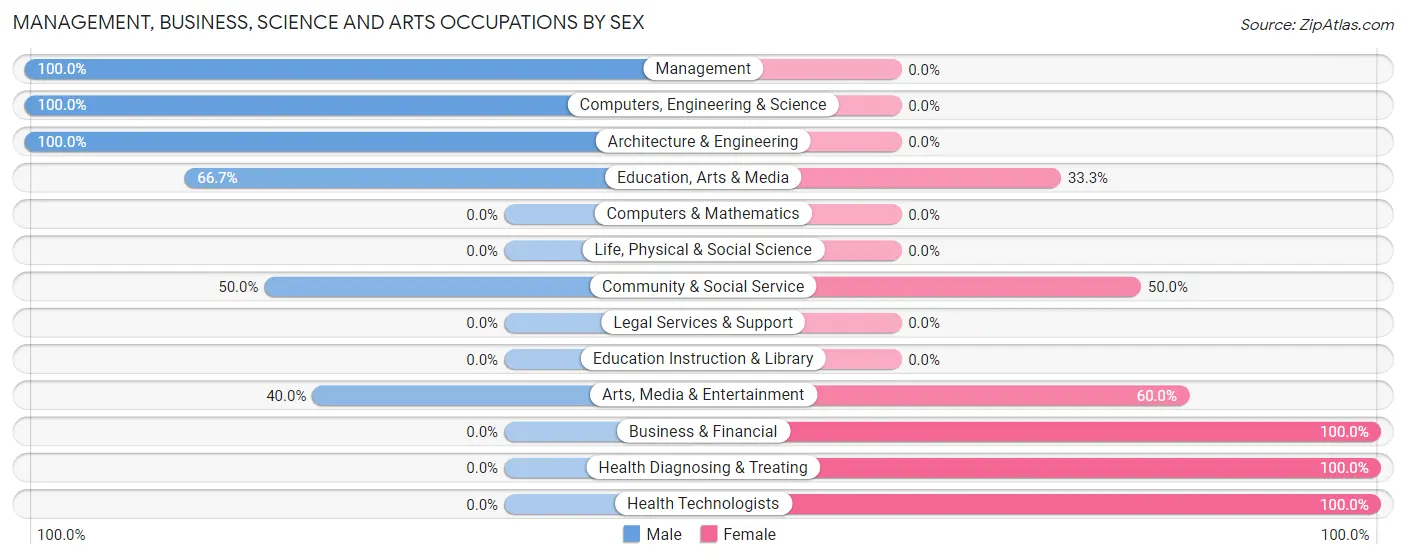
| Occupation | Male | Female |
| Management | 5 (100.0%) | 0 (0.0%) |
| Business & Financial | 0 (0.0%) | 2 (100.0%) |
| Computers, Engineering & Science | 2 (100.0%) | 0 (0.0%) |
| Computers & Mathematics | 0 (0.0%) | 0 (0.0%) |
| Architecture & Engineering | 2 (100.0%) | 0 (0.0%) |
| Life, Physical & Social Science | 0 (0.0%) | 0 (0.0%) |
| Community & Social Service | 4 (50.0%) | 4 (50.0%) |
| Education, Arts & Media | 2 (66.7%) | 1 (33.3%) |
| Legal Services & Support | 0 (0.0%) | 0 (0.0%) |
| Education Instruction & Library | 0 (0.0%) | 0 (0.0%) |
| Arts, Media & Entertainment | 2 (40.0%) | 3 (60.0%) |
| Health Diagnosing & Treating | 0 (0.0%) | 6 (100.0%) |
| Health Technologists | 0 (0.0%) | 4 (100.0%) |
| Total (Category) | 11 (47.8%) | 12 (52.2%) |
| Total (Overall) | 80 (68.4%) | 37 (31.6%) |
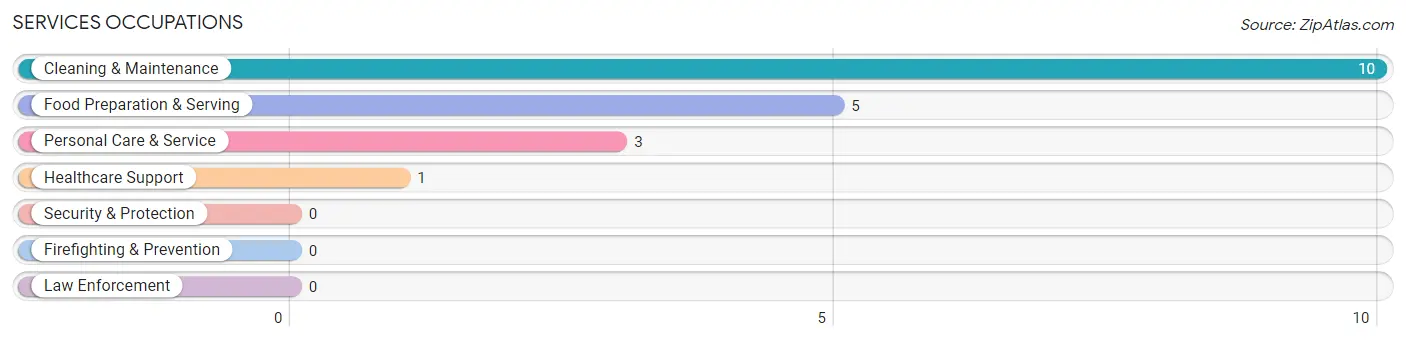
Services Occupations
The most common Services occupations in Severy are Cleaning & Maintenance (10 | 8.6%), Food Preparation & Serving (5 | 4.3%), Personal Care & Service (3 | 2.6%), and Healthcare Support (1 | 0.9%).
Services Occupations by Sex
Within the Services occupations in Severy, the most male-oriented occupations are Food Preparation & Serving (100.0%), and Cleaning & Maintenance (80.0%), while the most female-oriented occupations are Healthcare Support (100.0%), Personal Care & Service (100.0%), and Cleaning & Maintenance (20.0%).
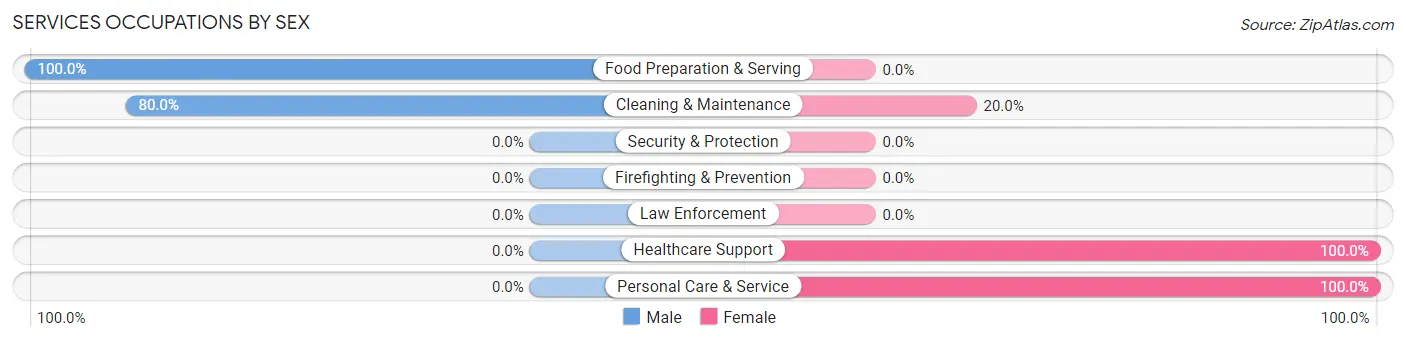
| Occupation | Male | Female |
| Healthcare Support | 0 (0.0%) | 1 (100.0%) |
| Security & Protection | 0 (0.0%) | 0 (0.0%) |
| Firefighting & Prevention | 0 (0.0%) | 0 (0.0%) |
| Law Enforcement | 0 (0.0%) | 0 (0.0%) |
| Food Preparation & Serving | 5 (100.0%) | 0 (0.0%) |
| Cleaning & Maintenance | 8 (80.0%) | 2 (20.0%) |
| Personal Care & Service | 0 (0.0%) | 3 (100.0%) |
| Total (Category) | 13 (68.4%) | 6 (31.6%) |
| Total (Overall) | 80 (68.4%) | 37 (31.6%) |
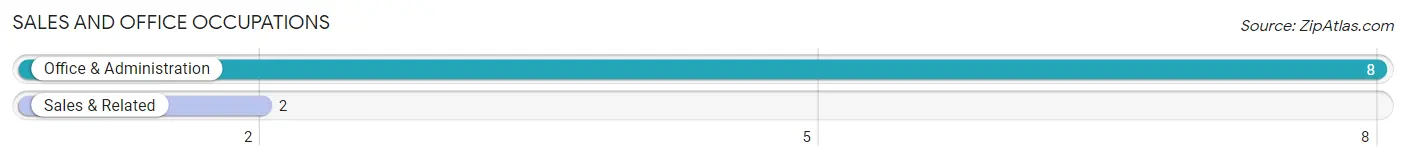
Sales and Office Occupations
The most common Sales and Office occupations in Severy are Office & Administration (8 | 6.8%), and Sales & Related (2 | 1.7%).
Sales and Office Occupations by Sex
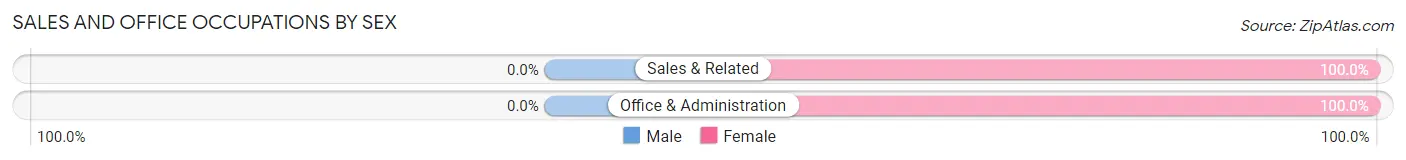
| Occupation | Male | Female |
| Sales & Related | 0 (0.0%) | 2 (100.0%) |
| Office & Administration | 0 (0.0%) | 8 (100.0%) |
| Total (Category) | 0 (0.0%) | 10 (100.0%) |
| Total (Overall) | 80 (68.4%) | 37 (31.6%) |
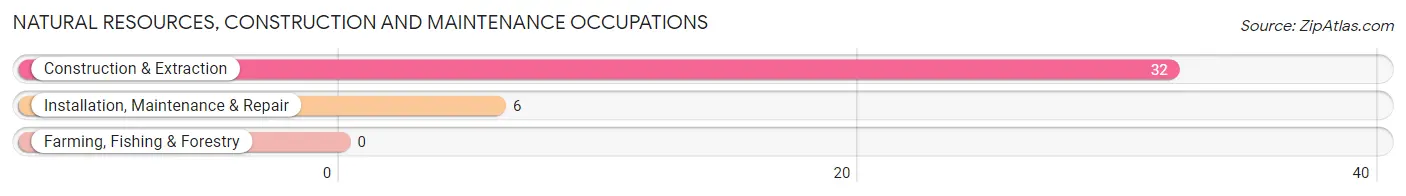
Natural Resources, Construction and Maintenance Occupations
The most common Natural Resources, Construction and Maintenance occupations in Severy are Construction & Extraction (32 | 27.4%), and Installation, Maintenance & Repair (6 | 5.1%).
Natural Resources, Construction and Maintenance Occupations by Sex
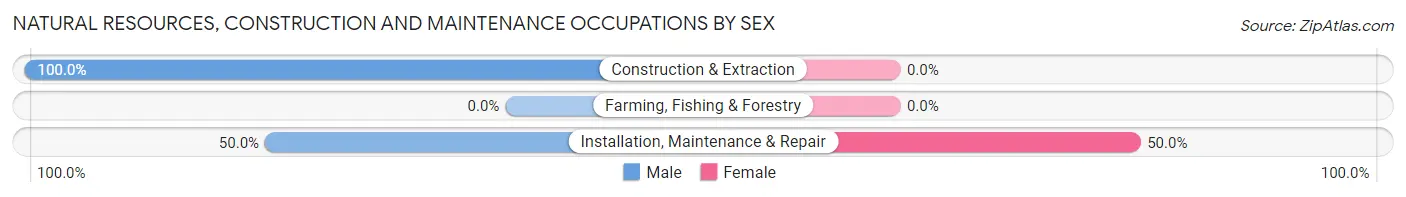
| Occupation | Male | Female |
| Farming, Fishing & Forestry | 0 (0.0%) | 0 (0.0%) |
| Construction & Extraction | 32 (100.0%) | 0 (0.0%) |
| Installation, Maintenance & Repair | 3 (50.0%) | 3 (50.0%) |
| Total (Category) | 35 (92.1%) | 3 (7.9%) |
| Total (Overall) | 80 (68.4%) | 37 (31.6%) |
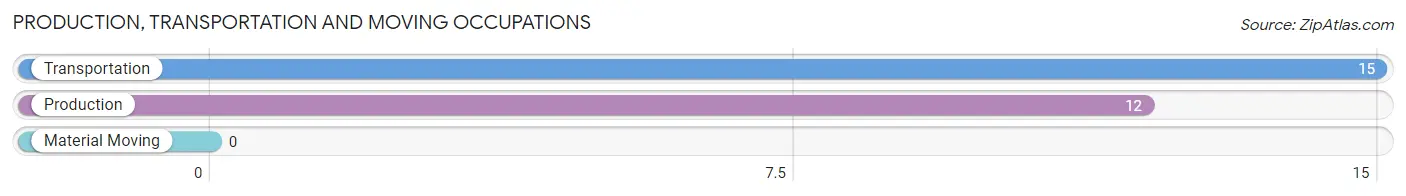
Production, Transportation and Moving Occupations
The most common Production, Transportation and Moving occupations in Severy are Transportation (15 | 12.8%), and Production (12 | 10.3%).
Production, Transportation and Moving Occupations by Sex
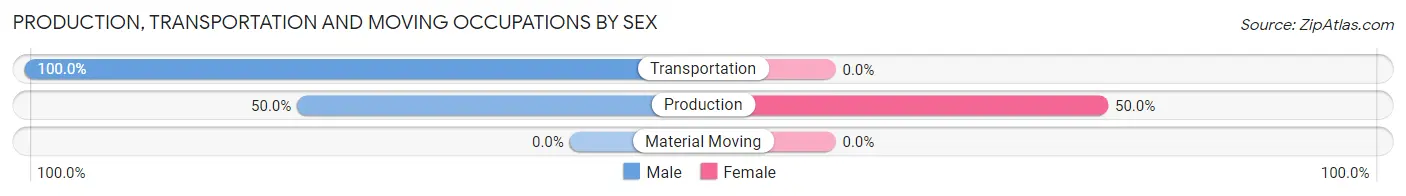
| Occupation | Male | Female |
| Production | 6 (50.0%) | 6 (50.0%) |
| Transportation | 15 (100.0%) | 0 (0.0%) |
| Material Moving | 0 (0.0%) | 0 (0.0%) |
| Total (Category) | 21 (77.8%) | 6 (22.2%) |
| Total (Overall) | 80 (68.4%) | 37 (31.6%) |
Employment Industries by Sex in Severy
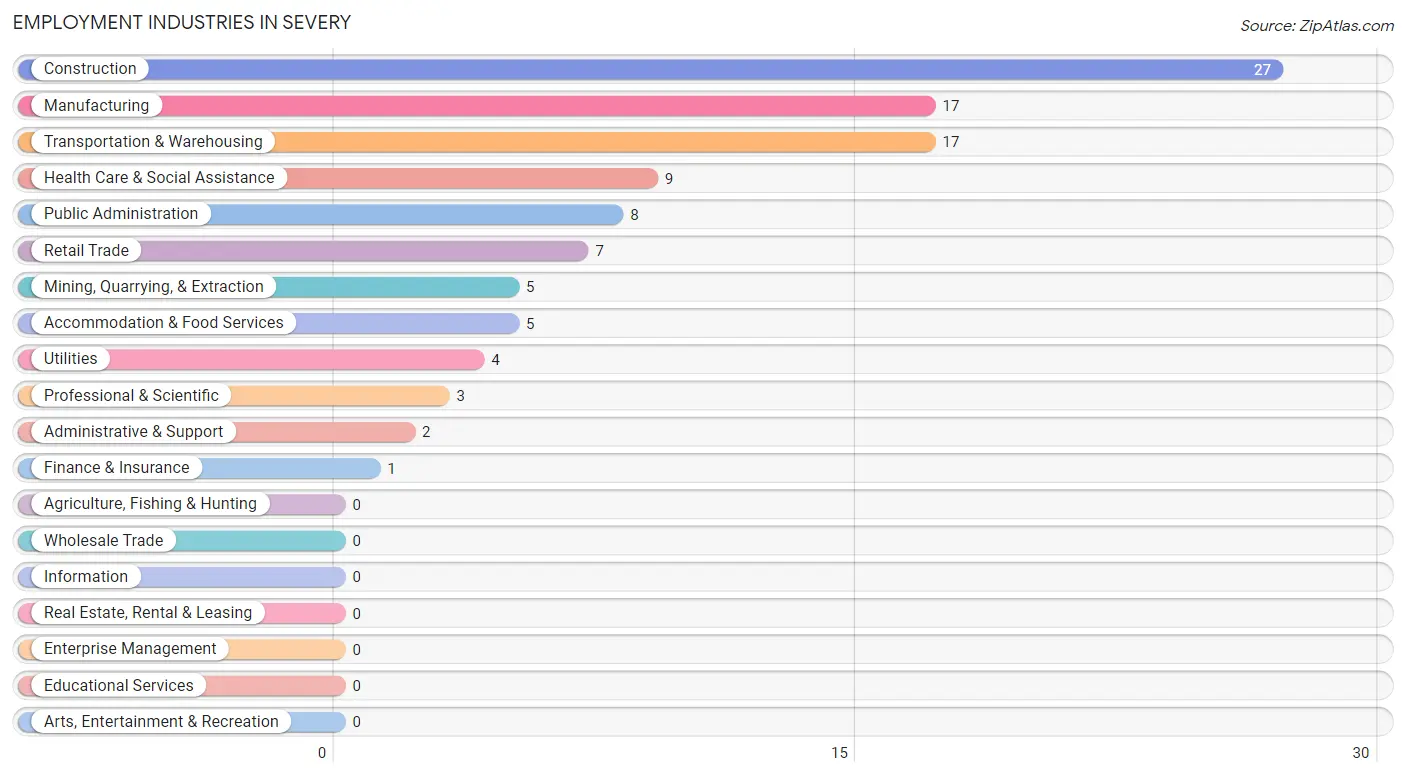
Employment Industries in Severy
The major employment industries in Severy include Construction (27 | 23.1%), Manufacturing (17 | 14.5%), Transportation & Warehousing (17 | 14.5%), Health Care & Social Assistance (9 | 7.7%), and Public Administration (8 | 6.8%).
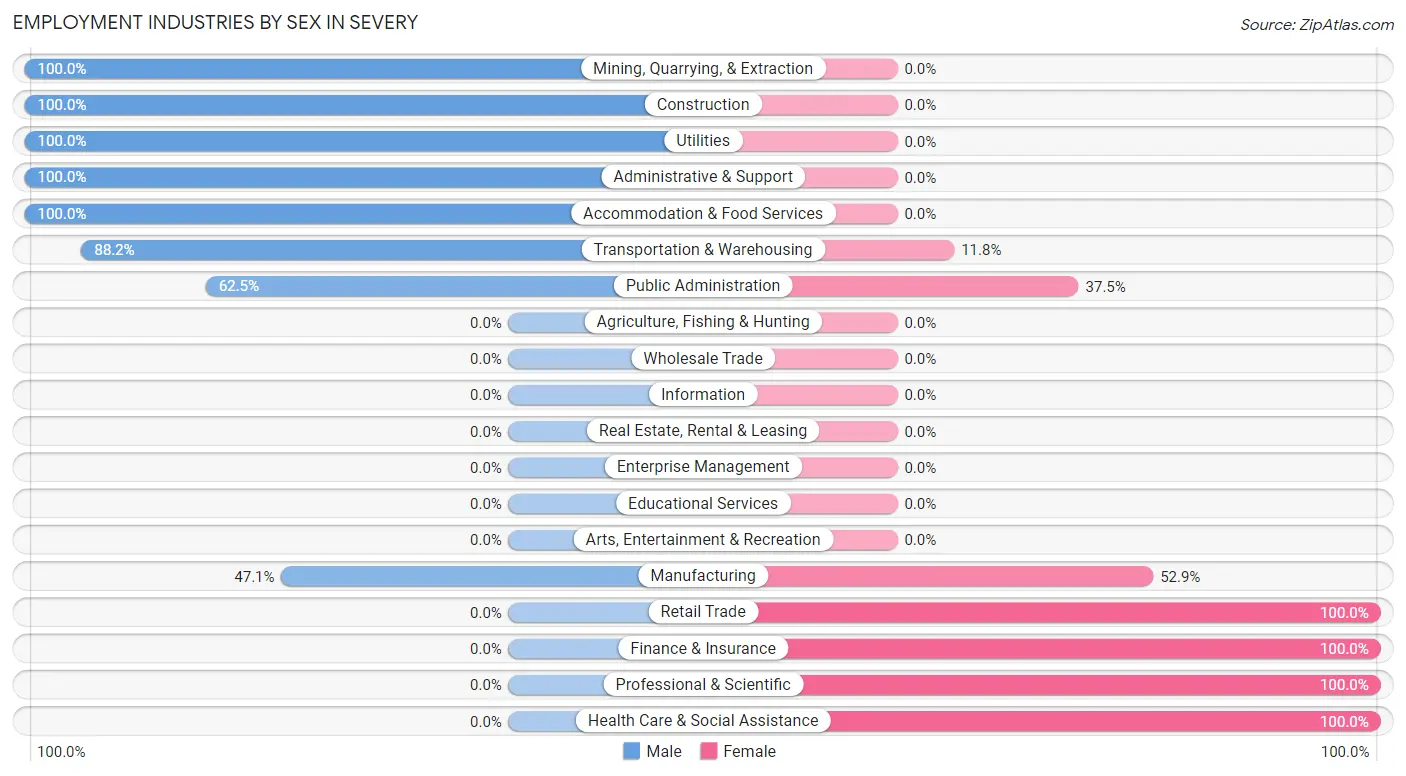
Employment Industries by Sex in Severy
The Severy industries that see more men than women are Mining, Quarrying, & Extraction (100.0%), Construction (100.0%), and Utilities (100.0%), whereas the industries that tend to have a higher number of women are Retail Trade (100.0%), Finance & Insurance (100.0%), and Professional & Scientific (100.0%).
| Industry | Male | Female |
| Agriculture, Fishing & Hunting | 0 (0.0%) | 0 (0.0%) |
| Mining, Quarrying, & Extraction | 5 (100.0%) | 0 (0.0%) |
| Construction | 27 (100.0%) | 0 (0.0%) |
| Manufacturing | 8 (47.1%) | 9 (52.9%) |
| Wholesale Trade | 0 (0.0%) | 0 (0.0%) |
| Retail Trade | 0 (0.0%) | 7 (100.0%) |
| Transportation & Warehousing | 15 (88.2%) | 2 (11.8%) |
| Utilities | 4 (100.0%) | 0 (0.0%) |
| Information | 0 (0.0%) | 0 (0.0%) |
| Finance & Insurance | 0 (0.0%) | 1 (100.0%) |
| Real Estate, Rental & Leasing | 0 (0.0%) | 0 (0.0%) |
| Professional & Scientific | 0 (0.0%) | 3 (100.0%) |
| Enterprise Management | 0 (0.0%) | 0 (0.0%) |
| Administrative & Support | 2 (100.0%) | 0 (0.0%) |
| Educational Services | 0 (0.0%) | 0 (0.0%) |
| Health Care & Social Assistance | 0 (0.0%) | 9 (100.0%) |
| Arts, Entertainment & Recreation | 0 (0.0%) | 0 (0.0%) |
| Accommodation & Food Services | 5 (100.0%) | 0 (0.0%) |
| Public Administration | 5 (62.5%) | 3 (37.5%) |
| Total | 80 (68.4%) | 37 (31.6%) |
Education in Severy
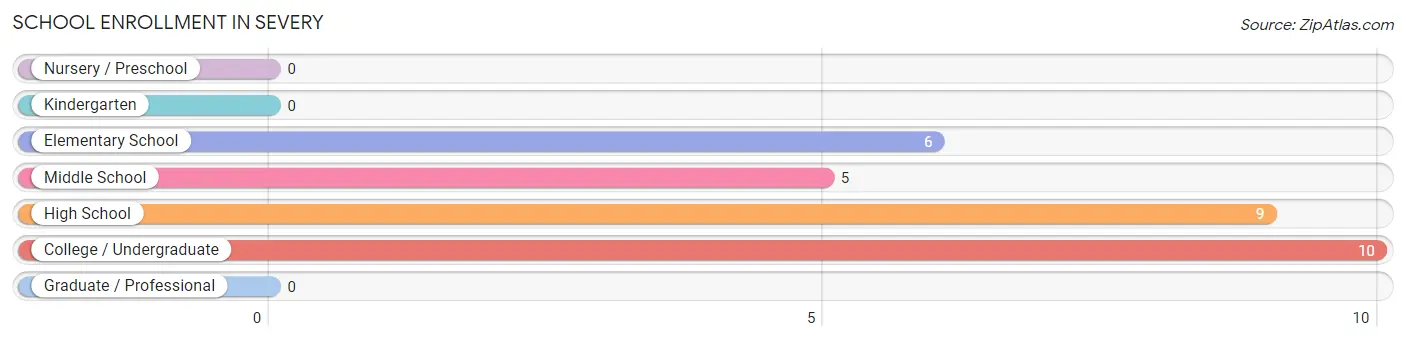
School Enrollment in Severy
The most common levels of schooling among the 30 students in Severy are college / undergraduate (10 | 33.3%), high school (9 | 30.0%), and elementary school (6 | 20.0%).
| School Level | # Students | % Students |
| Nursery / Preschool | 0 | 0.0% |
| Kindergarten | 0 | 0.0% |
| Elementary School | 6 | 20.0% |
| Middle School | 5 | 16.7% |
| High School | 9 | 30.0% |
| College / Undergraduate | 10 | 33.3% |
| Graduate / Professional | 0 | 0.0% |
| Total | 30 | 100.0% |
School Enrollment by Age by Funding Source in Severy
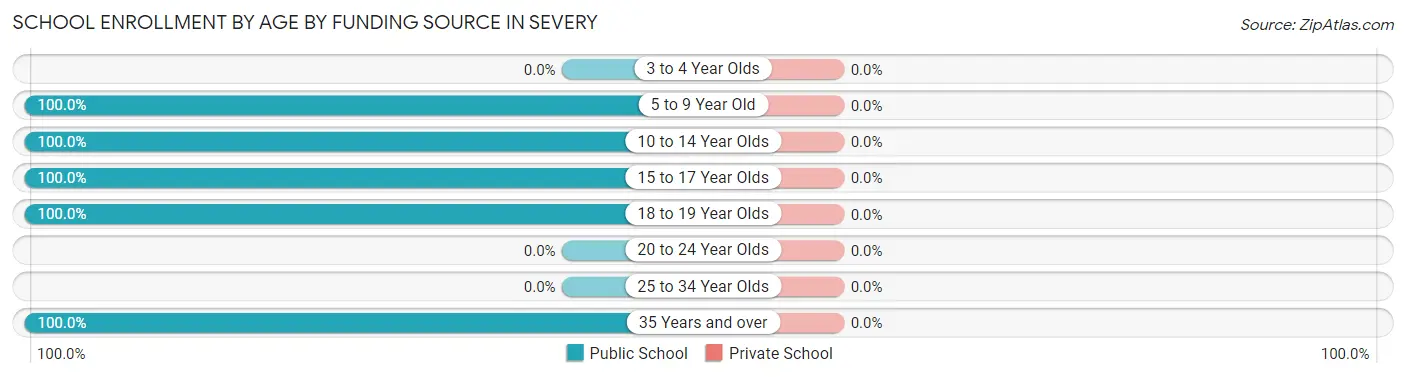
| Age Bracket | Public School | Private School |
| 3 to 4 Year Olds | 0 (0.0%) | 0 (0.0%) |
| 5 to 9 Year Old | 6 (100.0%) | 0 (0.0%) |
| 10 to 14 Year Olds | 9 (100.0%) | 0 (0.0%) |
| 15 to 17 Year Olds | 5 (100.0%) | 0 (0.0%) |
| 18 to 19 Year Olds | 6 (100.0%) | 0 (0.0%) |
| 20 to 24 Year Olds | 0 (0.0%) | 0 (0.0%) |
| 25 to 34 Year Olds | 0 (0.0%) | 0 (0.0%) |
| 35 Years and over | 4 (100.0%) | 0 (0.0%) |
| Total | 30 (100.0%) | 0 (0.0%) |
Educational Attainment by Field of Study in Severy
Bio, nature & agricultural (7 | 58.3%), social sciences (2 | 16.7%), education (2 | 16.7%), and arts & humanities (1 | 8.3%) are the most common fields of study among 12 individuals in Severy who have obtained a bachelor's degree or higher.
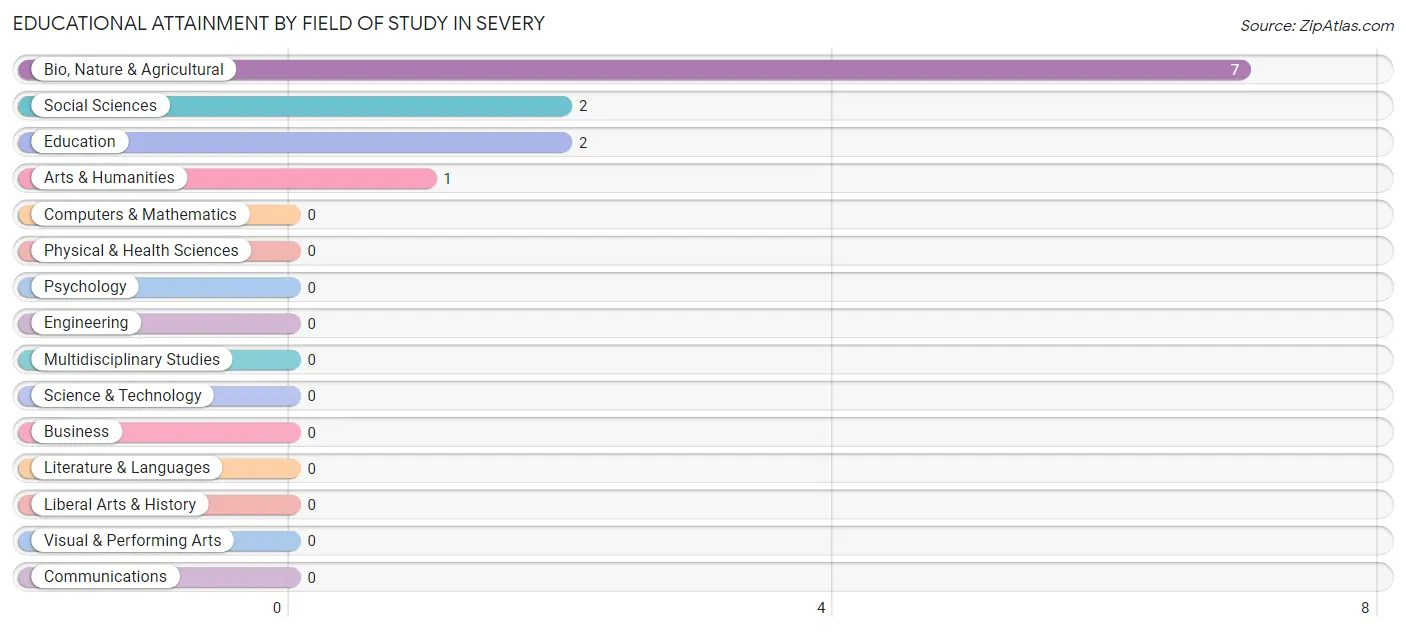
| Field of Study | # Graduates | % Graduates |
| Computers & Mathematics | 0 | 0.0% |
| Bio, Nature & Agricultural | 7 | 58.3% |
| Physical & Health Sciences | 0 | 0.0% |
| Psychology | 0 | 0.0% |
| Social Sciences | 2 | 16.7% |
| Engineering | 0 | 0.0% |
| Multidisciplinary Studies | 0 | 0.0% |
| Science & Technology | 0 | 0.0% |
| Business | 0 | 0.0% |
| Education | 2 | 16.7% |
| Literature & Languages | 0 | 0.0% |
| Liberal Arts & History | 0 | 0.0% |
| Visual & Performing Arts | 0 | 0.0% |
| Communications | 0 | 0.0% |
| Arts & Humanities | 1 | 8.3% |
| Total | 12 | 100.0% |
Transportation & Commute in Severy
Vehicle Availability by Sex in Severy
The most prevalent vehicle ownership categories in Severy are males with 4 vehicles (22, accounting for 28.2%) and females with 4 vehicles (8, making up 59.5%).
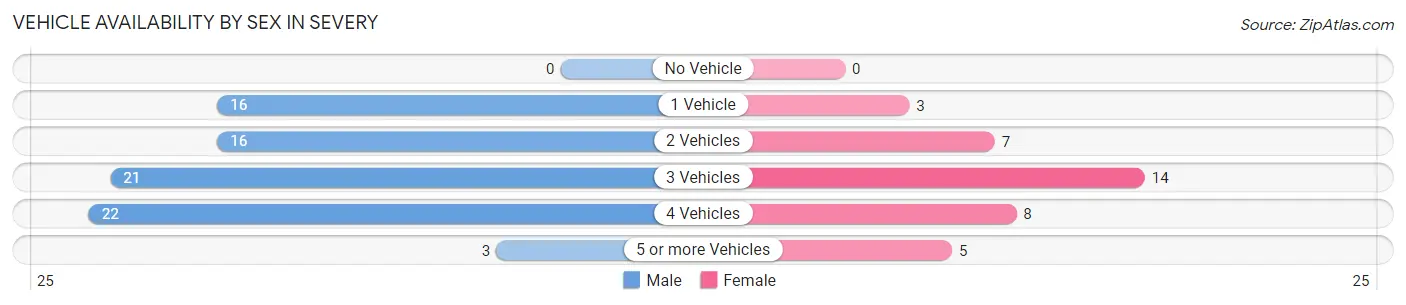
| Vehicles Available | Male | Female |
| No Vehicle | 0 (0.0%) | 0 (0.0%) |
| 1 Vehicle | 16 (20.5%) | 3 (8.1%) |
| 2 Vehicles | 16 (20.5%) | 7 (18.9%) |
| 3 Vehicles | 21 (26.9%) | 14 (37.8%) |
| 4 Vehicles | 22 (28.2%) | 8 (21.6%) |
| 5 or more Vehicles | 3 (3.8%) | 5 (13.5%) |
| Total | 78 (100.0%) | 37 (100.0%) |
Commute Time in Severy
The most frequently occuring commute durations in Severy are 60 to 89 minutes (24 commuters, 20.9%), 45 to 59 minutes (20 commuters, 17.4%), and less than 5 minutes (19 commuters, 16.5%).
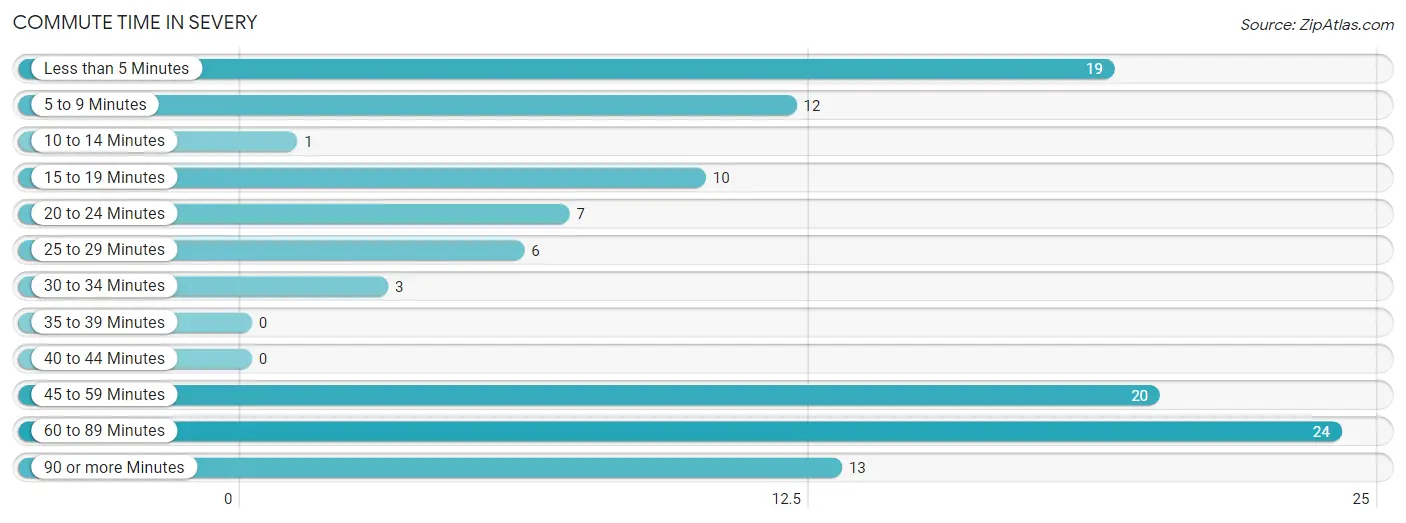
| Commute Time | # Commuters | % Commuters |
| Less than 5 Minutes | 19 | 16.5% |
| 5 to 9 Minutes | 12 | 10.4% |
| 10 to 14 Minutes | 1 | 0.9% |
| 15 to 19 Minutes | 10 | 8.7% |
| 20 to 24 Minutes | 7 | 6.1% |
| 25 to 29 Minutes | 6 | 5.2% |
| 30 to 34 Minutes | 3 | 2.6% |
| 35 to 39 Minutes | 0 | 0.0% |
| 40 to 44 Minutes | 0 | 0.0% |
| 45 to 59 Minutes | 20 | 17.4% |
| 60 to 89 Minutes | 24 | 20.9% |
| 90 or more Minutes | 13 | 11.3% |
Commute Time by Sex in Severy
The most common commute times in Severy are 60 to 89 minutes (18 commuters, 23.1%) for males and 20 to 24 minutes (7 commuters, 18.9%) for females.
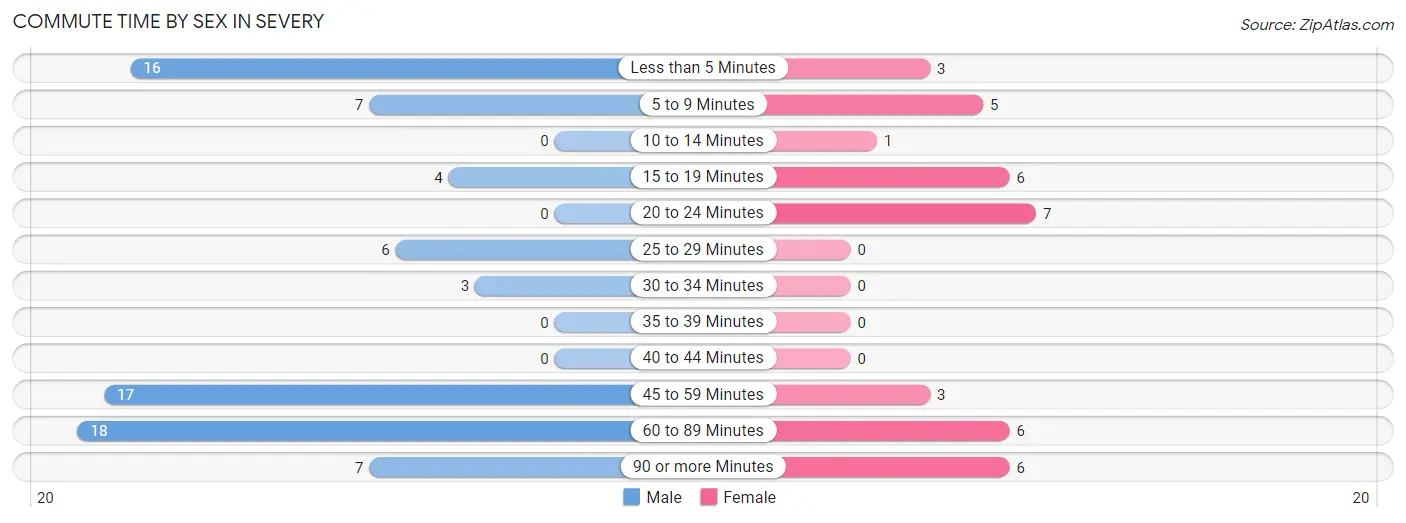
| Commute Time | Male | Female |
| Less than 5 Minutes | 16 (20.5%) | 3 (8.1%) |
| 5 to 9 Minutes | 7 (9.0%) | 5 (13.5%) |
| 10 to 14 Minutes | 0 (0.0%) | 1 (2.7%) |
| 15 to 19 Minutes | 4 (5.1%) | 6 (16.2%) |
| 20 to 24 Minutes | 0 (0.0%) | 7 (18.9%) |
| 25 to 29 Minutes | 6 (7.7%) | 0 (0.0%) |
| 30 to 34 Minutes | 3 (3.8%) | 0 (0.0%) |
| 35 to 39 Minutes | 0 (0.0%) | 0 (0.0%) |
| 40 to 44 Minutes | 0 (0.0%) | 0 (0.0%) |
| 45 to 59 Minutes | 17 (21.8%) | 3 (8.1%) |
| 60 to 89 Minutes | 18 (23.1%) | 6 (16.2%) |
| 90 or more Minutes | 7 (9.0%) | 6 (16.2%) |
Time of Departure to Work by Sex in Severy
The most frequent times of departure to work in Severy are 6:00 AM to 6:29 AM (18, 23.1%) for males and 12:00 AM to 4:59 AM (9, 24.3%) for females.
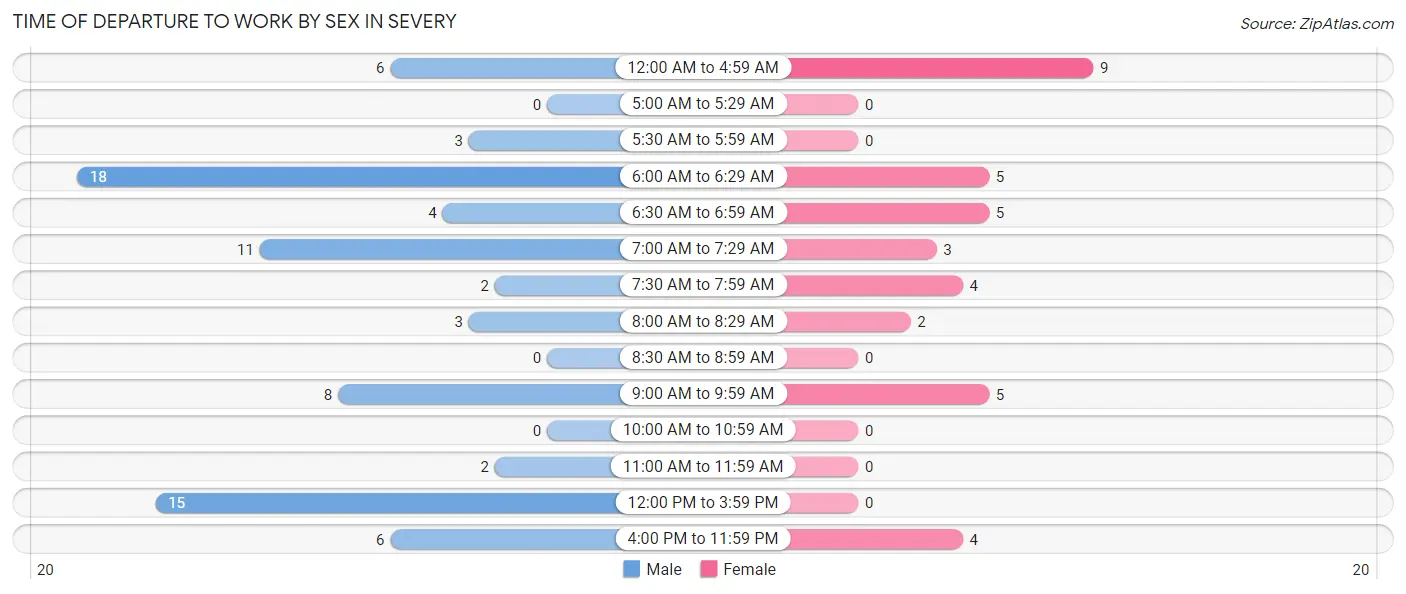
| Time of Departure | Male | Female |
| 12:00 AM to 4:59 AM | 6 (7.7%) | 9 (24.3%) |
| 5:00 AM to 5:29 AM | 0 (0.0%) | 0 (0.0%) |
| 5:30 AM to 5:59 AM | 3 (3.8%) | 0 (0.0%) |
| 6:00 AM to 6:29 AM | 18 (23.1%) | 5 (13.5%) |
| 6:30 AM to 6:59 AM | 4 (5.1%) | 5 (13.5%) |
| 7:00 AM to 7:29 AM | 11 (14.1%) | 3 (8.1%) |
| 7:30 AM to 7:59 AM | 2 (2.6%) | 4 (10.8%) |
| 8:00 AM to 8:29 AM | 3 (3.8%) | 2 (5.4%) |
| 8:30 AM to 8:59 AM | 0 (0.0%) | 0 (0.0%) |
| 9:00 AM to 9:59 AM | 8 (10.3%) | 5 (13.5%) |
| 10:00 AM to 10:59 AM | 0 (0.0%) | 0 (0.0%) |
| 11:00 AM to 11:59 AM | 2 (2.6%) | 0 (0.0%) |
| 12:00 PM to 3:59 PM | 15 (19.2%) | 0 (0.0%) |
| 4:00 PM to 11:59 PM | 6 (7.7%) | 4 (10.8%) |
| Total | 78 (100.0%) | 37 (100.0%) |
Housing Occupancy in Severy
Occupancy by Ownership in Severy
Of the total 121 dwellings in Severy, owner-occupied units account for 114 (94.2%), while renter-occupied units make up 7 (5.8%).
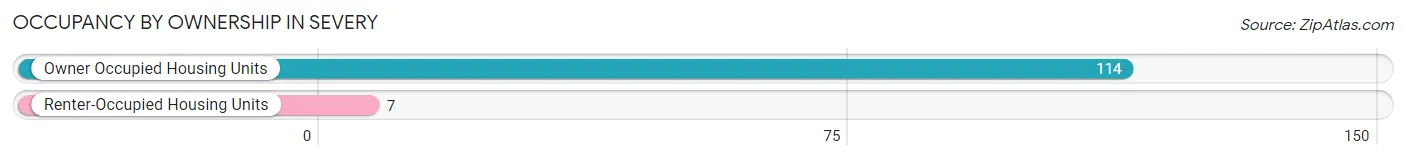
| Occupancy | # Housing Units | % Housing Units |
| Owner Occupied Housing Units | 114 | 94.2% |
| Renter-Occupied Housing Units | 7 | 5.8% |
| Total Occupied Housing Units | 121 | 100.0% |
Occupancy by Household Size in Severy
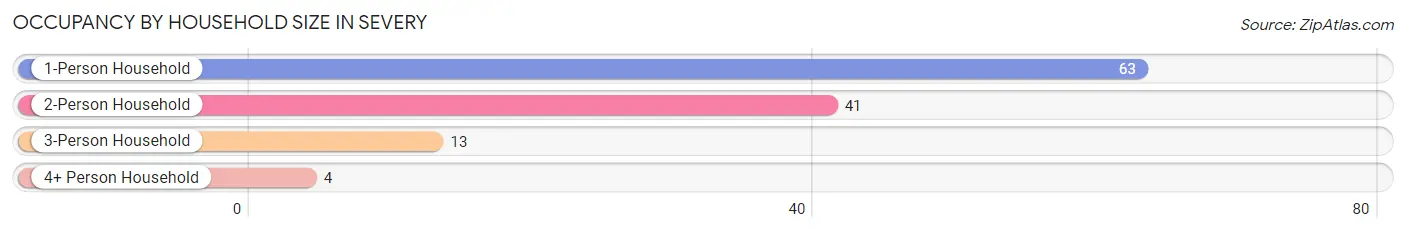
| Household Size | # Housing Units | % Housing Units |
| 1-Person Household | 63 | 52.1% |
| 2-Person Household | 41 | 33.9% |
| 3-Person Household | 13 | 10.7% |
| 4+ Person Household | 4 | 3.3% |
| Total Housing Units | 121 | 100.0% |
Occupancy by Ownership by Household Size in Severy
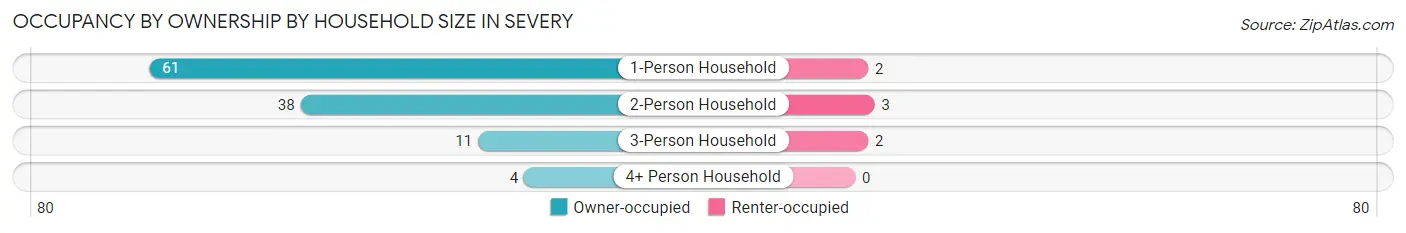
| Household Size | Owner-occupied | Renter-occupied |
| 1-Person Household | 61 (96.8%) | 2 (3.2%) |
| 2-Person Household | 38 (92.7%) | 3 (7.3%) |
| 3-Person Household | 11 (84.6%) | 2 (15.4%) |
| 4+ Person Household | 4 (100.0%) | 0 (0.0%) |
| Total Housing Units | 114 (94.2%) | 7 (5.8%) |
Occupancy by Educational Attainment in Severy
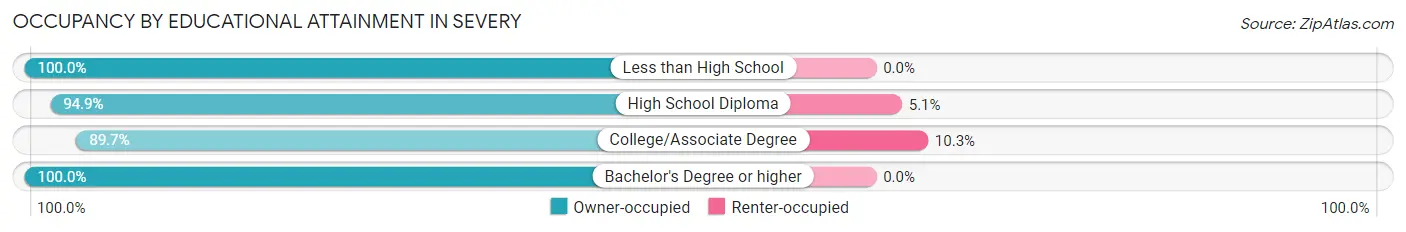
| Household Size | Owner-occupied | Renter-occupied |
| Less than High School | 14 (100.0%) | 0 (0.0%) |
| High School Diploma | 56 (94.9%) | 3 (5.1%) |
| College/Associate Degree | 35 (89.7%) | 4 (10.3%) |
| Bachelor's Degree or higher | 9 (100.0%) | 0 (0.0%) |
Occupancy by Age of Householder in Severy
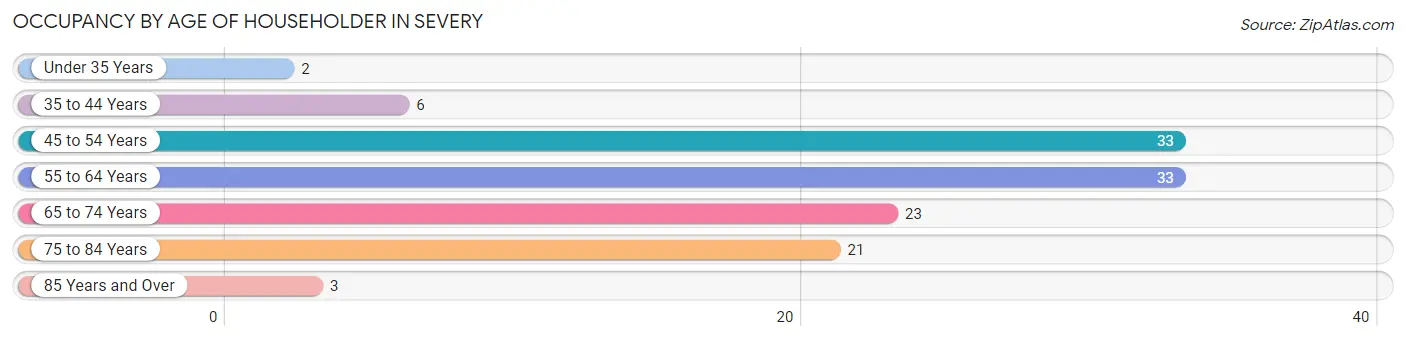
| Age Bracket | # Households | % Households |
| Under 35 Years | 2 | 1.7% |
| 35 to 44 Years | 6 | 5.0% |
| 45 to 54 Years | 33 | 27.3% |
| 55 to 64 Years | 33 | 27.3% |
| 65 to 74 Years | 23 | 19.0% |
| 75 to 84 Years | 21 | 17.4% |
| 85 Years and Over | 3 | 2.5% |
| Total | 121 | 100.0% |
Housing Finances in Severy
Median Income by Occupancy in Severy
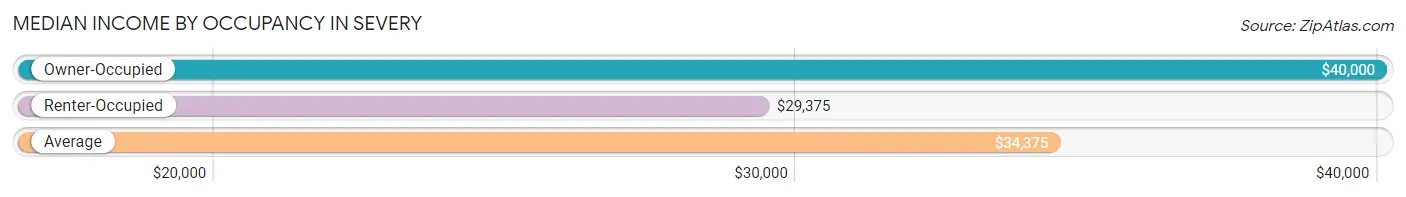
| Occupancy Type | # Households | Median Income |
| Owner-Occupied | 114 (94.2%) | $40,000 |
| Renter-Occupied | 7 (5.8%) | $29,375 |
| Average | 121 (100.0%) | $34,375 |
Occupancy by Householder Income Bracket in Severy
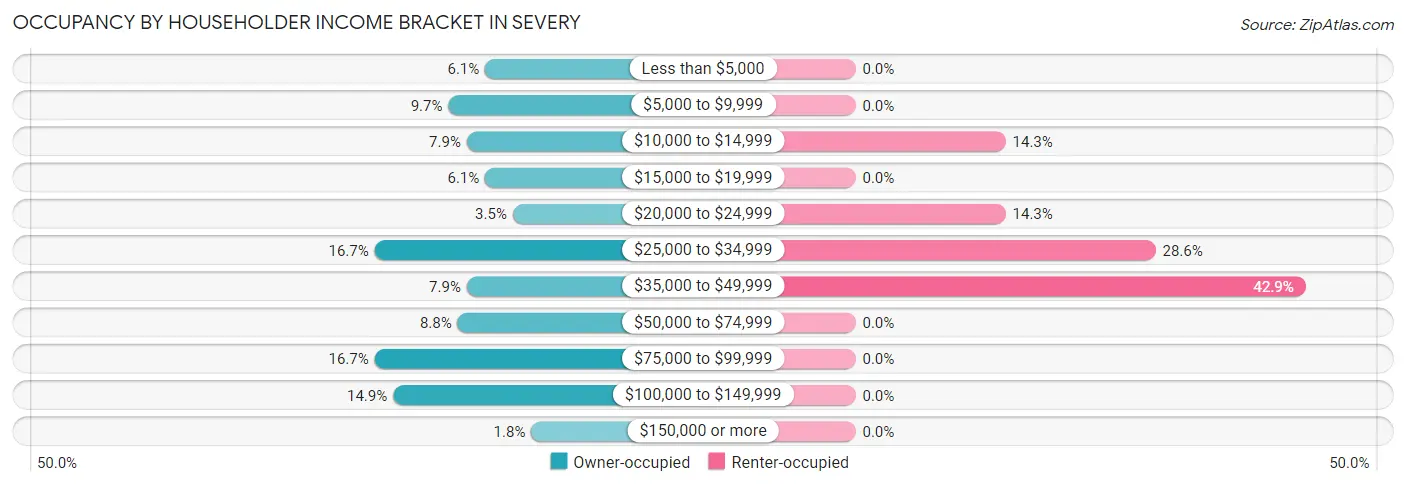
| Income Bracket | Owner-occupied | Renter-occupied |
| Less than $5,000 | 7 (6.1%) | 0 (0.0%) |
| $5,000 to $9,999 | 11 (9.7%) | 0 (0.0%) |
| $10,000 to $14,999 | 9 (7.9%) | 1 (14.3%) |
| $15,000 to $19,999 | 7 (6.1%) | 0 (0.0%) |
| $20,000 to $24,999 | 4 (3.5%) | 1 (14.3%) |
| $25,000 to $34,999 | 19 (16.7%) | 2 (28.6%) |
| $35,000 to $49,999 | 9 (7.9%) | 3 (42.9%) |
| $50,000 to $74,999 | 10 (8.8%) | 0 (0.0%) |
| $75,000 to $99,999 | 19 (16.7%) | 0 (0.0%) |
| $100,000 to $149,999 | 17 (14.9%) | 0 (0.0%) |
| $150,000 or more | 2 (1.8%) | 0 (0.0%) |
| Total | 114 (100.0%) | 7 (100.0%) |
Monthly Housing Cost Tiers in Severy
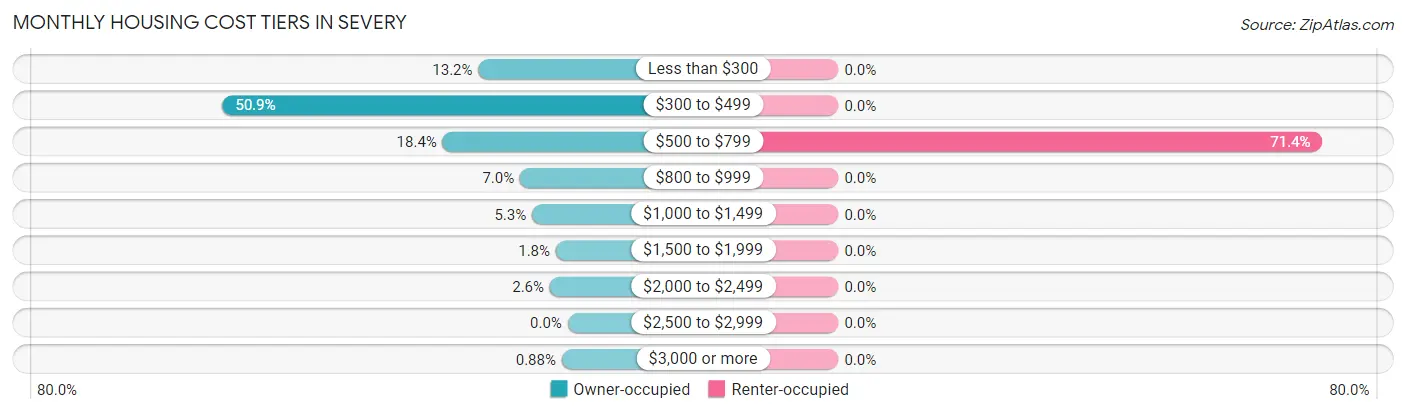
| Monthly Cost | Owner-occupied | Renter-occupied |
| Less than $300 | 15 (13.2%) | 0 (0.0%) |
| $300 to $499 | 58 (50.9%) | 0 (0.0%) |
| $500 to $799 | 21 (18.4%) | 5 (71.4%) |
| $800 to $999 | 8 (7.0%) | 0 (0.0%) |
| $1,000 to $1,499 | 6 (5.3%) | 0 (0.0%) |
| $1,500 to $1,999 | 2 (1.8%) | 0 (0.0%) |
| $2,000 to $2,499 | 3 (2.6%) | 0 (0.0%) |
| $2,500 to $2,999 | 0 (0.0%) | 0 (0.0%) |
| $3,000 or more | 1 (0.9%) | 0 (0.0%) |
| Total | 114 (100.0%) | 7 (100.0%) |
Physical Housing Characteristics in Severy
Housing Structures in Severy
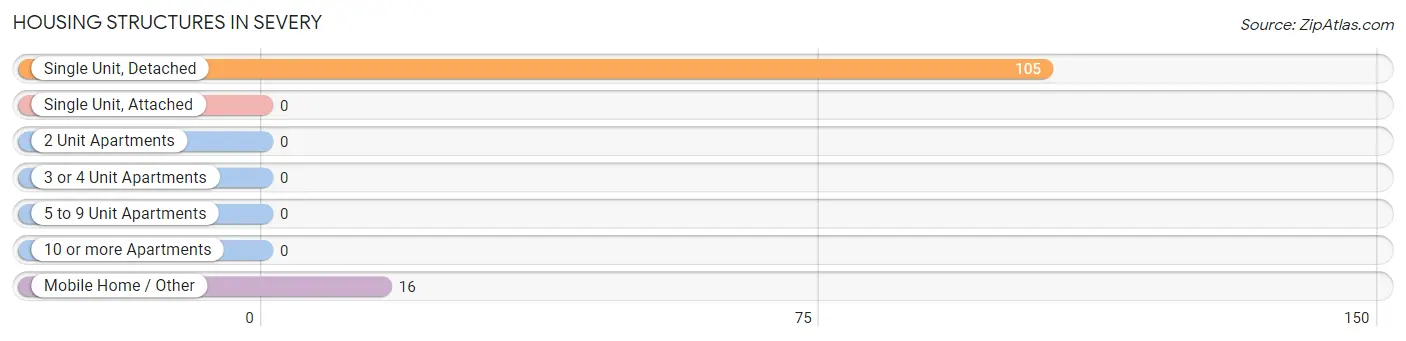
| Structure Type | # Housing Units | % Housing Units |
| Single Unit, Detached | 105 | 86.8% |
| Single Unit, Attached | 0 | 0.0% |
| 2 Unit Apartments | 0 | 0.0% |
| 3 or 4 Unit Apartments | 0 | 0.0% |
| 5 to 9 Unit Apartments | 0 | 0.0% |
| 10 or more Apartments | 0 | 0.0% |
| Mobile Home / Other | 16 | 13.2% |
| Total | 121 | 100.0% |
Housing Structures by Occupancy in Severy
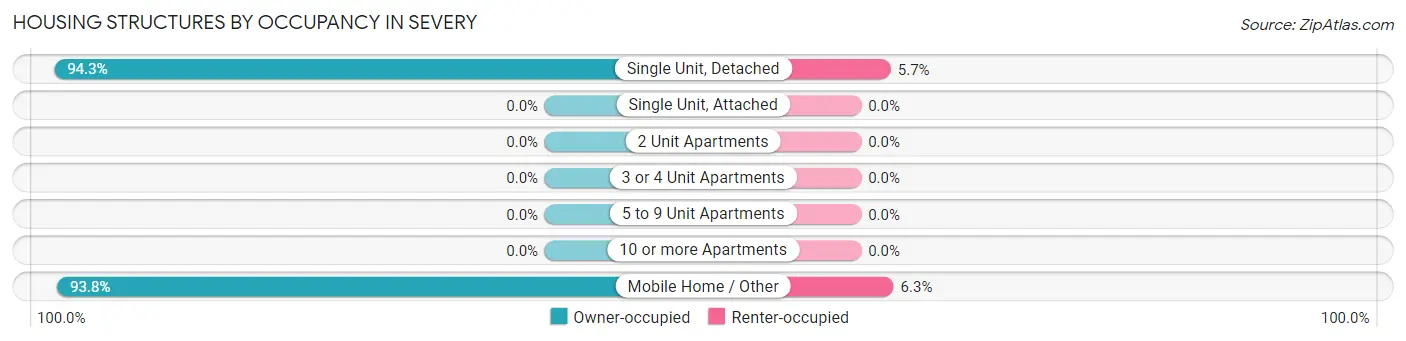
| Structure Type | Owner-occupied | Renter-occupied |
| Single Unit, Detached | 99 (94.3%) | 6 (5.7%) |
| Single Unit, Attached | 0 (0.0%) | 0 (0.0%) |
| 2 Unit Apartments | 0 (0.0%) | 0 (0.0%) |
| 3 or 4 Unit Apartments | 0 (0.0%) | 0 (0.0%) |
| 5 to 9 Unit Apartments | 0 (0.0%) | 0 (0.0%) |
| 10 or more Apartments | 0 (0.0%) | 0 (0.0%) |
| Mobile Home / Other | 15 (93.8%) | 1 (6.2%) |
| Total | 114 (94.2%) | 7 (5.8%) |
Housing Structures by Number of Rooms in Severy
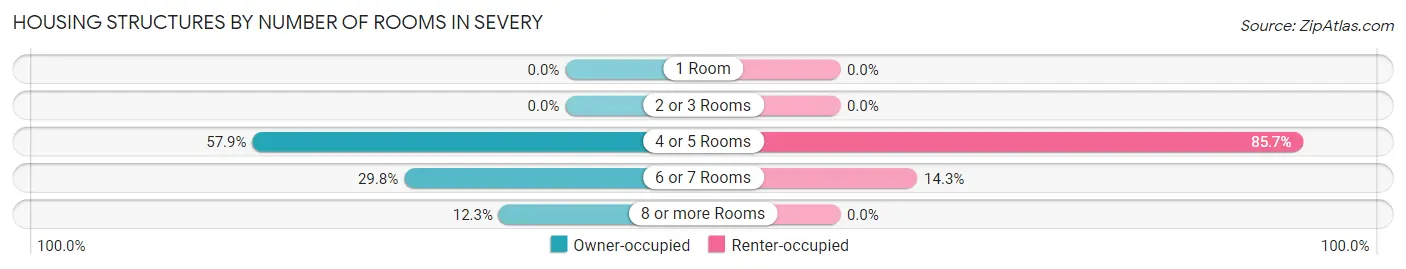
| Number of Rooms | Owner-occupied | Renter-occupied |
| 1 Room | 0 (0.0%) | 0 (0.0%) |
| 2 or 3 Rooms | 0 (0.0%) | 0 (0.0%) |
| 4 or 5 Rooms | 66 (57.9%) | 6 (85.7%) |
| 6 or 7 Rooms | 34 (29.8%) | 1 (14.3%) |
| 8 or more Rooms | 14 (12.3%) | 0 (0.0%) |
| Total | 114 (100.0%) | 7 (100.0%) |
Housing Structure by Heating Type in Severy
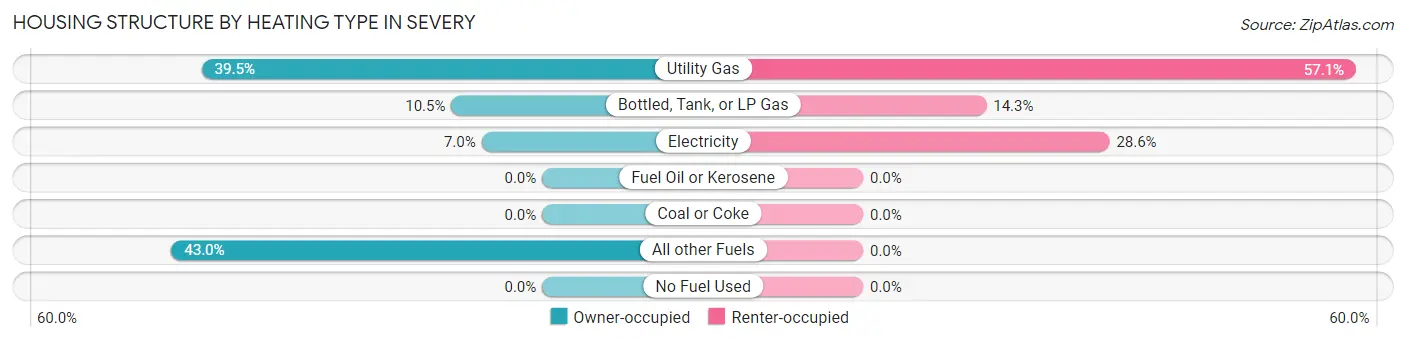
| Heating Type | Owner-occupied | Renter-occupied |
| Utility Gas | 45 (39.5%) | 4 (57.1%) |
| Bottled, Tank, or LP Gas | 12 (10.5%) | 1 (14.3%) |
| Electricity | 8 (7.0%) | 2 (28.6%) |
| Fuel Oil or Kerosene | 0 (0.0%) | 0 (0.0%) |
| Coal or Coke | 0 (0.0%) | 0 (0.0%) |
| All other Fuels | 49 (43.0%) | 0 (0.0%) |
| No Fuel Used | 0 (0.0%) | 0 (0.0%) |
| Total | 114 (100.0%) | 7 (100.0%) |
Household Vehicle Usage in Severy
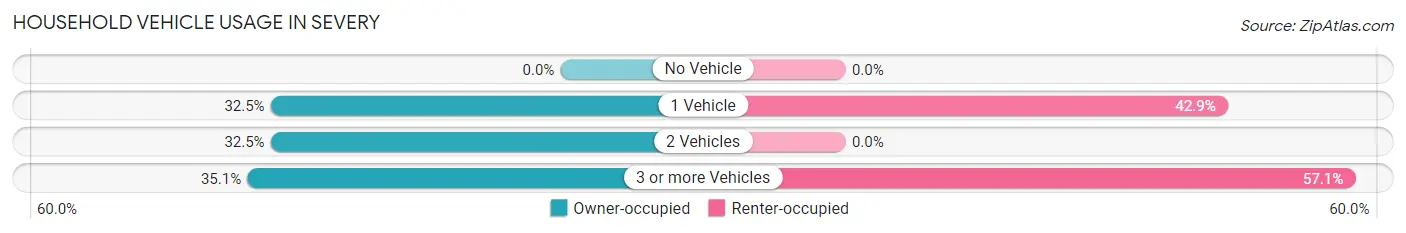
| Vehicles per Household | Owner-occupied | Renter-occupied |
| No Vehicle | 0 (0.0%) | 0 (0.0%) |
| 1 Vehicle | 37 (32.5%) | 3 (42.9%) |
| 2 Vehicles | 37 (32.5%) | 0 (0.0%) |
| 3 or more Vehicles | 40 (35.1%) | 4 (57.1%) |
| Total | 114 (100.0%) | 7 (100.0%) |
Real Estate & Mortgages in Severy
Real Estate and Mortgage Overview in Severy
| Characteristic | Without Mortgage | With Mortgage |
| Housing Units | 99 | 15 |
| Median Property Value | $25,800 | $0 |
| Median Household Income | $28,750 | $0 |
| Monthly Housing Costs | $388 | $0 |
| Real Estate Taxes | $665 | $0 |
Property Value by Mortgage Status in Severy
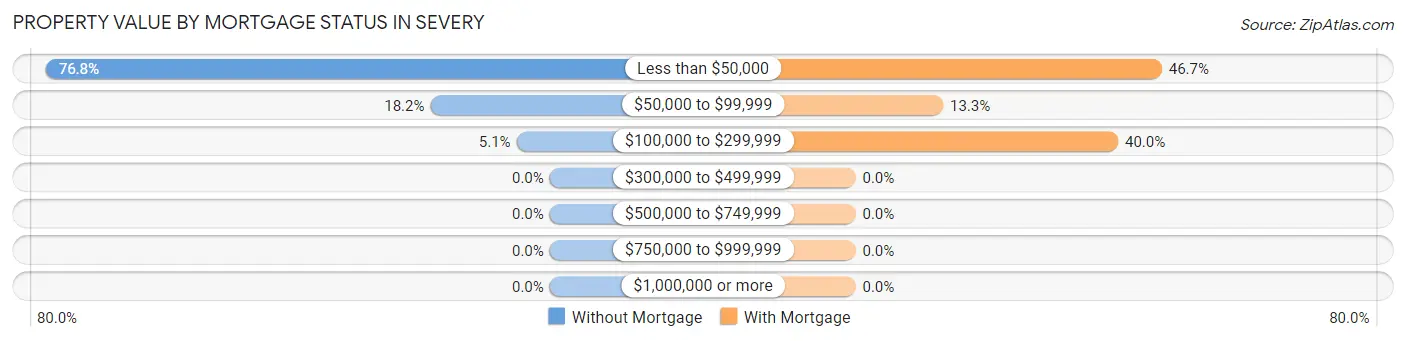
| Property Value | Without Mortgage | With Mortgage |
| Less than $50,000 | 76 (76.8%) | 7 (46.7%) |
| $50,000 to $99,999 | 18 (18.2%) | 2 (13.3%) |
| $100,000 to $299,999 | 5 (5.1%) | 6 (40.0%) |
| $300,000 to $499,999 | 0 (0.0%) | 0 (0.0%) |
| $500,000 to $749,999 | 0 (0.0%) | 0 (0.0%) |
| $750,000 to $999,999 | 0 (0.0%) | 0 (0.0%) |
| $1,000,000 or more | 0 (0.0%) | 0 (0.0%) |
| Total | 99 (100.0%) | 15 (100.0%) |
Household Income by Mortgage Status in Severy
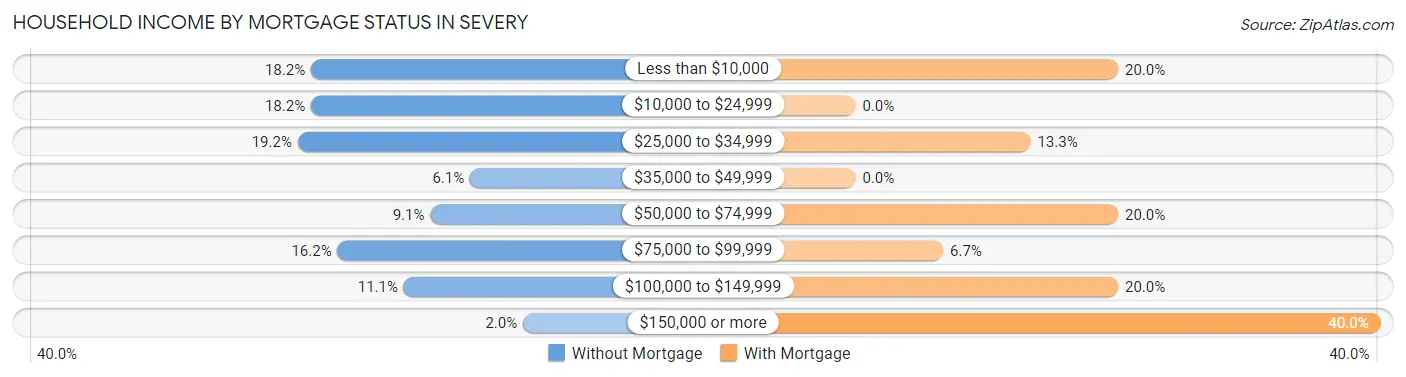
| Household Income | Without Mortgage | With Mortgage |
| Less than $10,000 | 18 (18.2%) | 3 (20.0%) |
| $10,000 to $24,999 | 18 (18.2%) | 0 (0.0%) |
| $25,000 to $34,999 | 19 (19.2%) | 2 (13.3%) |
| $35,000 to $49,999 | 6 (6.1%) | 0 (0.0%) |
| $50,000 to $74,999 | 9 (9.1%) | 3 (20.0%) |
| $75,000 to $99,999 | 16 (16.2%) | 1 (6.7%) |
| $100,000 to $149,999 | 11 (11.1%) | 3 (20.0%) |
| $150,000 or more | 2 (2.0%) | 6 (40.0%) |
| Total | 99 (100.0%) | 15 (100.0%) |
Property Value to Household Income Ratio in Severy
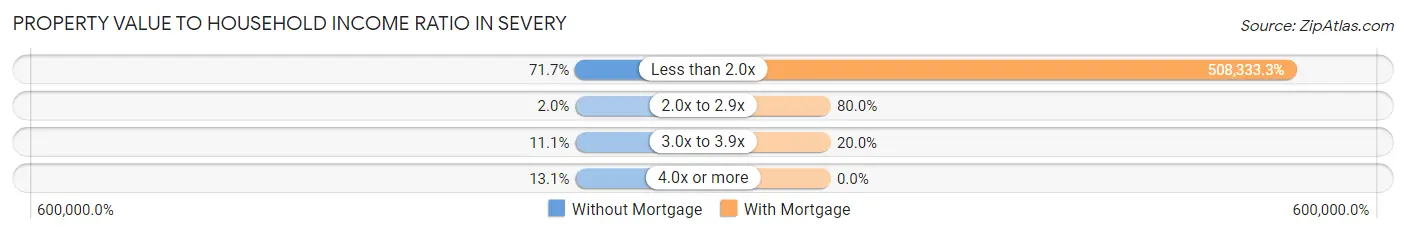
| Value-to-Income Ratio | Without Mortgage | With Mortgage |
| Less than 2.0x | 71 (71.7%) | 76,250 (508,333.3%) |
| 2.0x to 2.9x | 2 (2.0%) | 12 (80.0%) |
| 3.0x to 3.9x | 11 (11.1%) | 3 (20.0%) |
| 4.0x or more | 13 (13.1%) | 0 (0.0%) |
| Total | 99 (100.0%) | 15 (100.0%) |
Real Estate Taxes by Mortgage Status in Severy
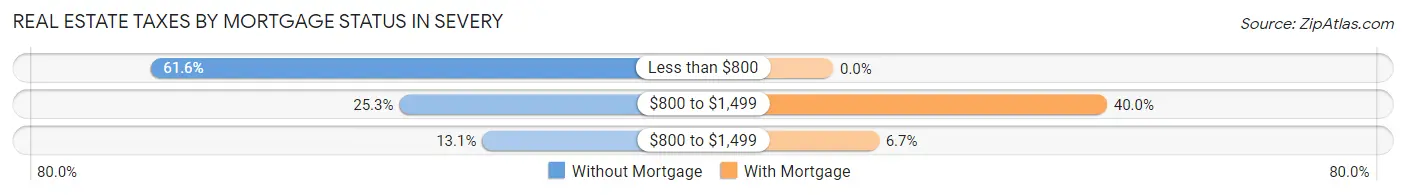
| Property Taxes | Without Mortgage | With Mortgage |
| Less than $800 | 61 (61.6%) | 0 (0.0%) |
| $800 to $1,499 | 25 (25.3%) | 6 (40.0%) |
| $800 to $1,499 | 13 (13.1%) | 1 (6.7%) |
| Total | 99 (100.0%) | 15 (100.0%) |
Health & Disability in Severy
Health Insurance Coverage by Age in Severy
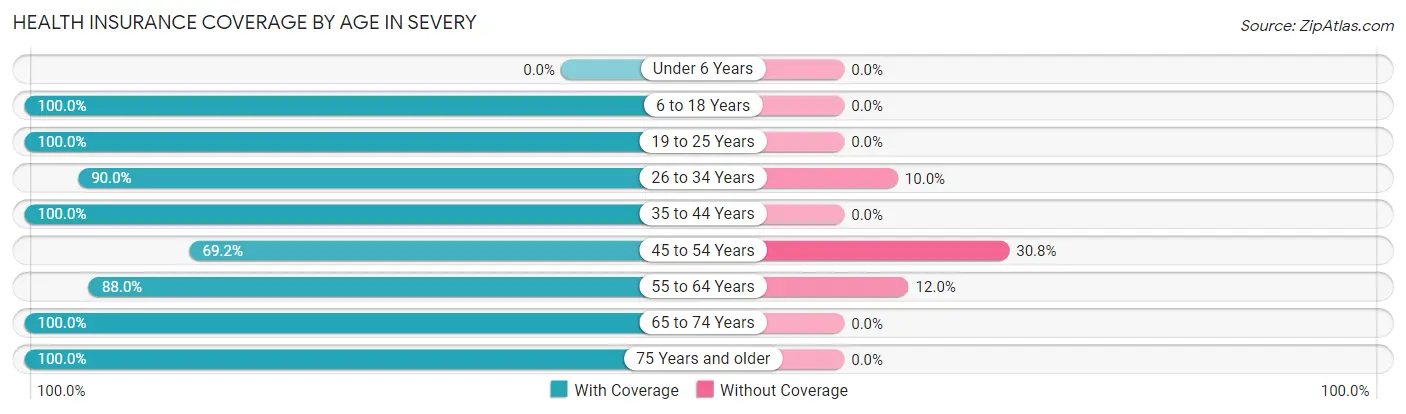
| Age Bracket | With Coverage | Without Coverage |
| Under 6 Years | 0 (0.0%) | 0 (0.0%) |
| 6 to 18 Years | 20 (100.0%) | 0 (0.0%) |
| 19 to 25 Years | 6 (100.0%) | 0 (0.0%) |
| 26 to 34 Years | 9 (90.0%) | 1 (10.0%) |
| 35 to 44 Years | 11 (100.0%) | 0 (0.0%) |
| 45 to 54 Years | 36 (69.2%) | 16 (30.8%) |
| 55 to 64 Years | 44 (88.0%) | 6 (12.0%) |
| 65 to 74 Years | 34 (100.0%) | 0 (0.0%) |
| 75 Years and older | 29 (100.0%) | 0 (0.0%) |
| Total | 189 (89.1%) | 23 (10.8%) |
Health Insurance Coverage by Citizenship Status in Severy
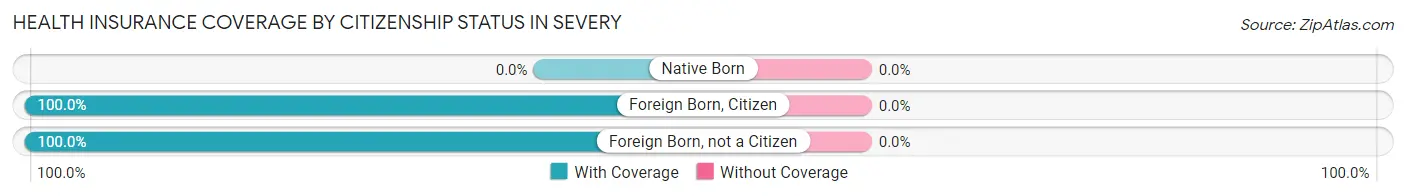
| Citizenship Status | With Coverage | Without Coverage |
| Native Born | 0 (0.0%) | 0 (0.0%) |
| Foreign Born, Citizen | 20 (100.0%) | 0 (0.0%) |
| Foreign Born, not a Citizen | 6 (100.0%) | 0 (0.0%) |
Health Insurance Coverage by Household Income in Severy
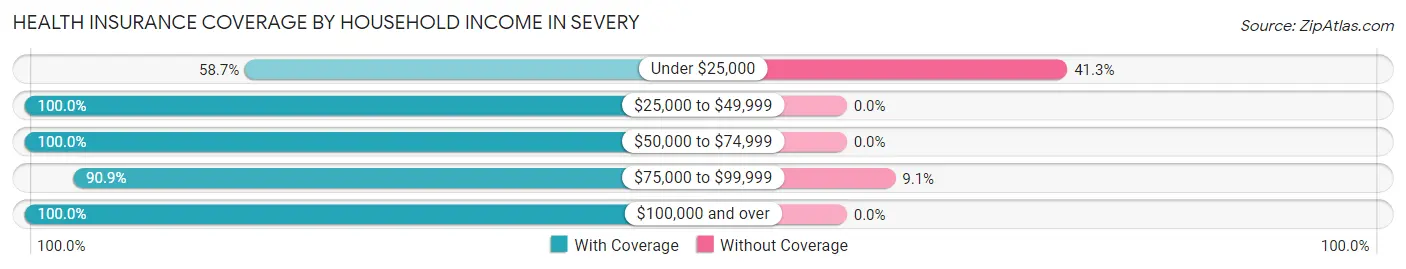
| Household Income | With Coverage | Without Coverage |
| Under $25,000 | 27 (58.7%) | 19 (41.3%) |
| $25,000 to $49,999 | 55 (100.0%) | 0 (0.0%) |
| $50,000 to $74,999 | 23 (100.0%) | 0 (0.0%) |
| $75,000 to $99,999 | 40 (90.9%) | 4 (9.1%) |
| $100,000 and over | 44 (100.0%) | 0 (0.0%) |
Public vs Private Health Insurance Coverage by Age in Severy
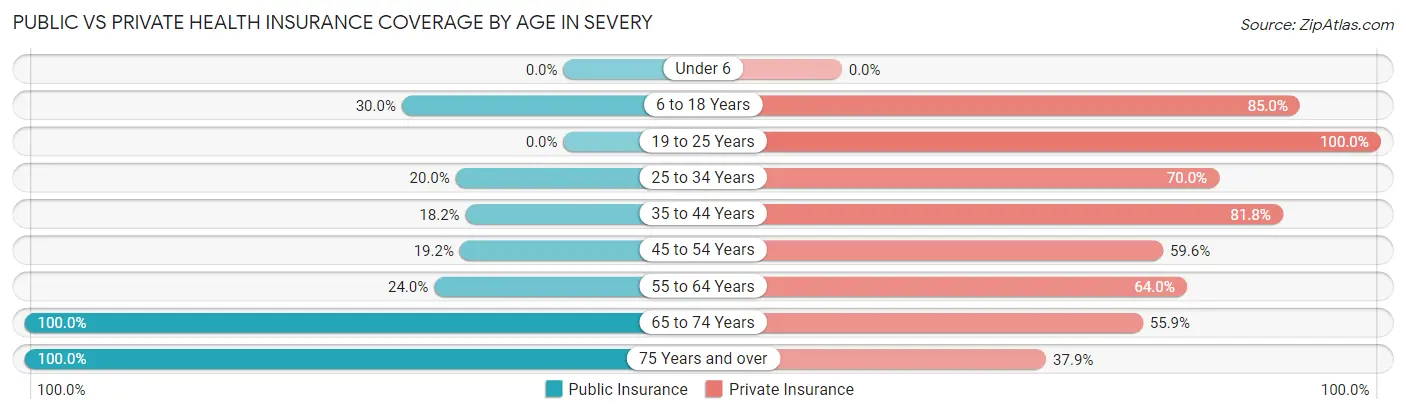
| Age Bracket | Public Insurance | Private Insurance |
| Under 6 | 0 (0.0%) | 0 (0.0%) |
| 6 to 18 Years | 6 (30.0%) | 17 (85.0%) |
| 19 to 25 Years | 0 (0.0%) | 6 (100.0%) |
| 25 to 34 Years | 2 (20.0%) | 7 (70.0%) |
| 35 to 44 Years | 2 (18.2%) | 9 (81.8%) |
| 45 to 54 Years | 10 (19.2%) | 31 (59.6%) |
| 55 to 64 Years | 12 (24.0%) | 32 (64.0%) |
| 65 to 74 Years | 34 (100.0%) | 19 (55.9%) |
| 75 Years and over | 29 (100.0%) | 11 (37.9%) |
| Total | 95 (44.8%) | 132 (62.3%) |
Disability Status by Sex by Age in Severy
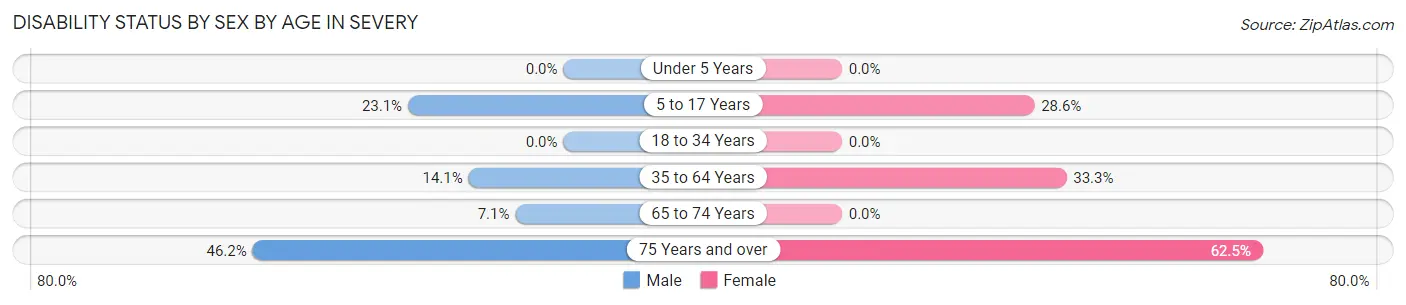
| Age Bracket | Male | Female |
| Under 5 Years | 0 (0.0%) | 0 (0.0%) |
| 5 to 17 Years | 3 (23.1%) | 2 (28.6%) |
| 18 to 34 Years | 0 (0.0%) | 0 (0.0%) |
| 35 to 64 Years | 10 (14.1%) | 14 (33.3%) |
| 65 to 74 Years | 1 (7.1%) | 0 (0.0%) |
| 75 Years and over | 6 (46.2%) | 10 (62.5%) |
Disability Class by Sex by Age in Severy
Disability Class: Hearing Difficulty
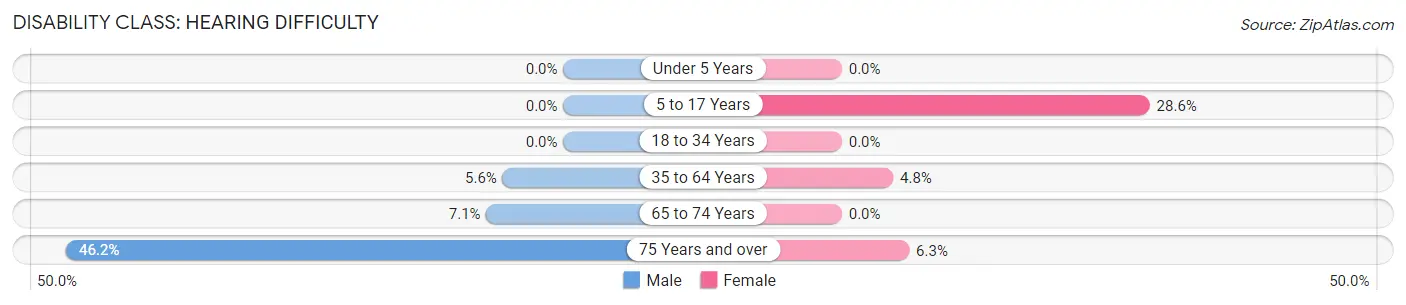
| Age Bracket | Male | Female |
| Under 5 Years | 0 (0.0%) | 0 (0.0%) |
| 5 to 17 Years | 0 (0.0%) | 2 (28.6%) |
| 18 to 34 Years | 0 (0.0%) | 0 (0.0%) |
| 35 to 64 Years | 4 (5.6%) | 2 (4.8%) |
| 65 to 74 Years | 1 (7.1%) | 0 (0.0%) |
| 75 Years and over | 6 (46.2%) | 1 (6.2%) |
Disability Class: Vision Difficulty
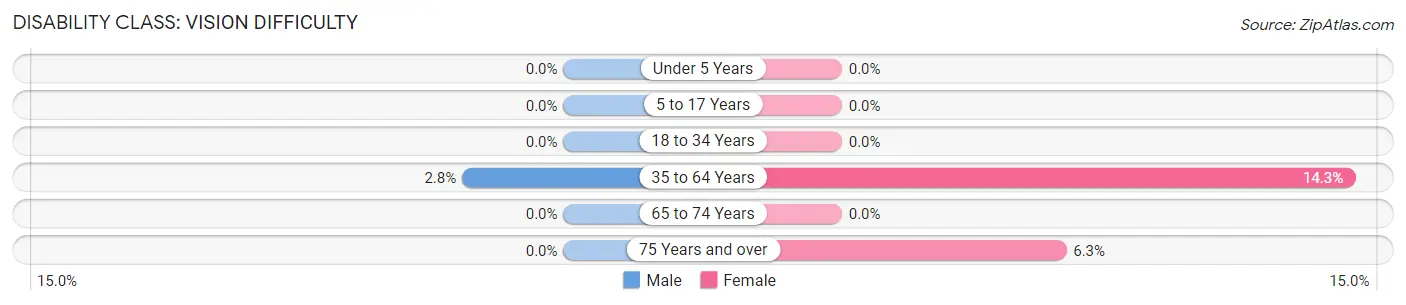
| Age Bracket | Male | Female |
| Under 5 Years | 0 (0.0%) | 0 (0.0%) |
| 5 to 17 Years | 0 (0.0%) | 0 (0.0%) |
| 18 to 34 Years | 0 (0.0%) | 0 (0.0%) |
| 35 to 64 Years | 2 (2.8%) | 6 (14.3%) |
| 65 to 74 Years | 0 (0.0%) | 0 (0.0%) |
| 75 Years and over | 0 (0.0%) | 1 (6.2%) |
Disability Class: Cognitive Difficulty
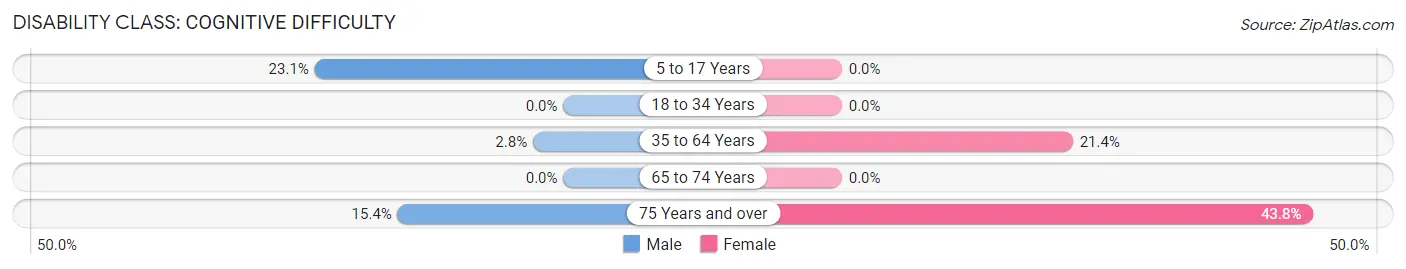
| Age Bracket | Male | Female |
| 5 to 17 Years | 3 (23.1%) | 0 (0.0%) |
| 18 to 34 Years | 0 (0.0%) | 0 (0.0%) |
| 35 to 64 Years | 2 (2.8%) | 9 (21.4%) |
| 65 to 74 Years | 0 (0.0%) | 0 (0.0%) |
| 75 Years and over | 2 (15.4%) | 7 (43.8%) |
Disability Class: Ambulatory Difficulty
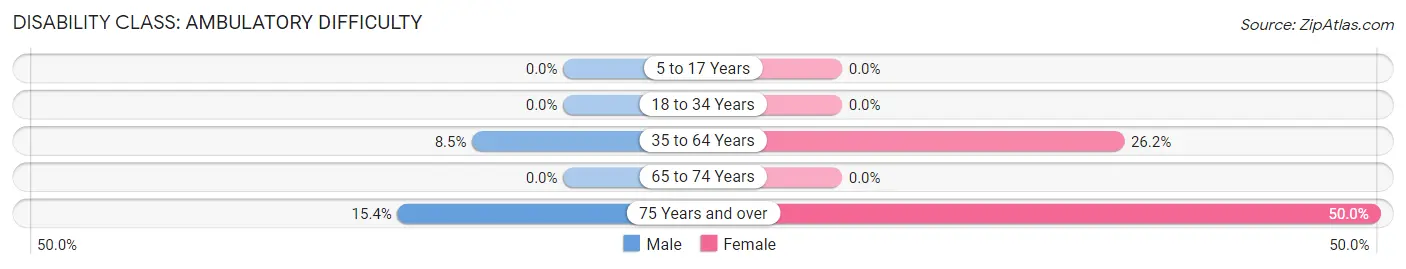
| Age Bracket | Male | Female |
| 5 to 17 Years | 0 (0.0%) | 0 (0.0%) |
| 18 to 34 Years | 0 (0.0%) | 0 (0.0%) |
| 35 to 64 Years | 6 (8.5%) | 11 (26.2%) |
| 65 to 74 Years | 0 (0.0%) | 0 (0.0%) |
| 75 Years and over | 2 (15.4%) | 8 (50.0%) |
Disability Class: Self-Care Difficulty
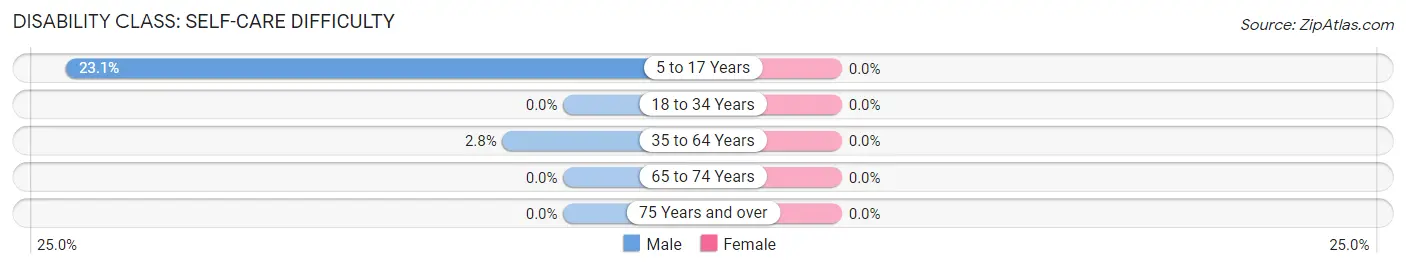
| Age Bracket | Male | Female |
| 5 to 17 Years | 3 (23.1%) | 0 (0.0%) |
| 18 to 34 Years | 0 (0.0%) | 0 (0.0%) |
| 35 to 64 Years | 2 (2.8%) | 0 (0.0%) |
| 65 to 74 Years | 0 (0.0%) | 0 (0.0%) |
| 75 Years and over | 0 (0.0%) | 0 (0.0%) |
Technology Access in Severy
Computing Device Access in Severy
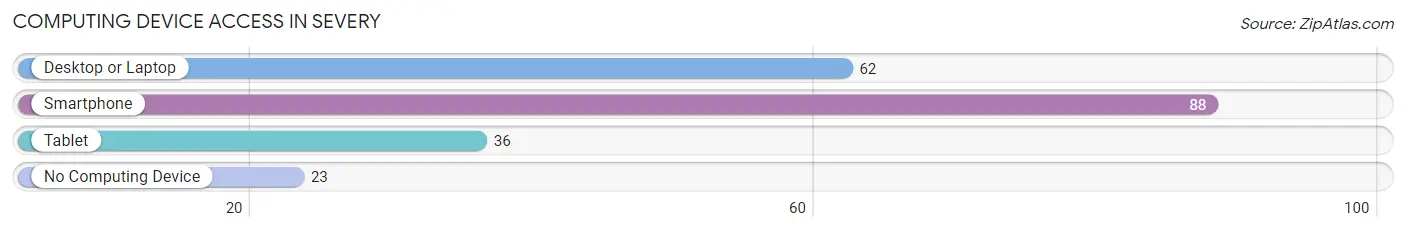
| Device Type | # Households | % Households |
| Desktop or Laptop | 62 | 51.2% |
| Smartphone | 88 | 72.7% |
| Tablet | 36 | 29.7% |
| No Computing Device | 23 | 19.0% |
| Total | 121 | 100.0% |
Internet Access in Severy
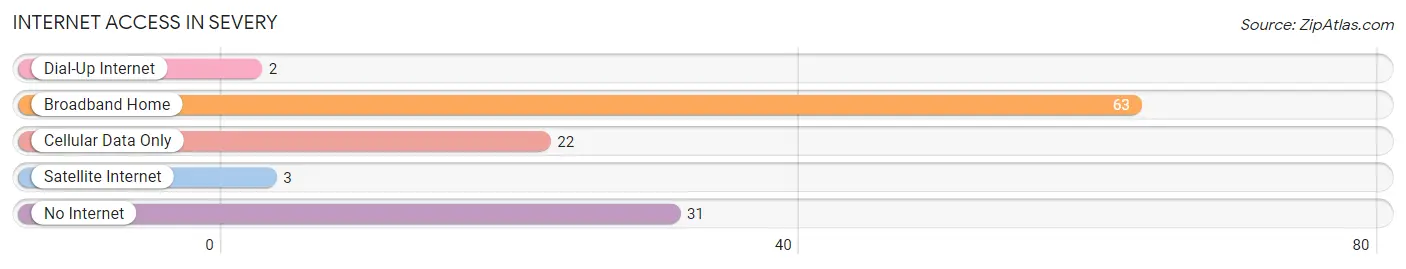
| Internet Type | # Households | % Households |
| Dial-Up Internet | 2 | 1.7% |
| Broadband Home | 63 | 52.1% |
| Cellular Data Only | 22 | 18.2% |
| Satellite Internet | 3 | 2.5% |
| No Internet | 31 | 25.6% |
| Total | 121 | 100.0% |
Severy Summary
Severy is a small town located in Greenwood County, Kansas, United States. The population was 545 at the 2010 census. Severy is located in the Flint Hills region of Kansas, and is known for its rolling hills and prairie grasses.
History
Severy was founded in 1871 by a group of settlers from Ohio. The town was named after Severy, Ohio, the hometown of the settlers. The first post office was established in 1872.
In 1887, the Severy and Southwestern Railroad was built, connecting Severy to nearby towns. This allowed for the growth of the town, and by 1900, the population had grown to over 500.
In the early 1900s, Severy was a thriving agricultural community. The town had several grain elevators, a flour mill, a creamery, and a lumber yard. The town also had a hotel, a bank, and several stores.
Geography
Severy is located at 37°45'25" North, 96°14'17" West (37.756944, -96.238056). According to the United States Census Bureau, the town has a total area of 0.6 square miles (1.6 km2), all of it land.
Economy
Severy's economy is largely based on agriculture. The town is home to several grain elevators, a flour mill, and a creamery. The town also has several stores, a bank, and a hotel.
Demographics
As of the census of 2010, there were 545 people, 221 households, and 149 families residing in the town. The population density was 891.7 people per square mile (344.7/km2). There were 246 housing units at an average density of 407.5 per square mile (157.3/km2). The racial makeup of the town was 97.3% White, 0.2% African American, 0.2% Native American, 0.2% Asian, 0.4% from other races, and 1.5% from two or more races. Hispanic or Latino of any race were 1.3% of the population.
There were 221 households, out of which 28.4% had children under the age of 18 living with them, 54.0% were married couples living together, 8.6% had a female householder with no husband present, and 33.5% were non-families. 29.9% of all households were made up of individuals, and 15.4% had someone living alone who was 65 years of age or older. The average household size was 2.46 and the average family size was 3.06.
In the town, the population was spread out, with 25.7% under the age of 18, 6.7% from 18 to 24, 24.2% from 25 to 44, 24.2% from 45 to 64, and 19.2% who were 65 years of age or older. The median age was 40 years. For every 100 females, there were 94.2 males. For every 100 females age 18 and over, there were 88.2 males.
The median income for a household in the town was $35,000, and the median income for a family was $41,250. Males had a median income of $30,000 versus $20,000 for females. The per capita income for the town was $17,845. About 8.3% of families and 10.2% of the population were below the poverty line, including 14.3% of those under age 18 and 8.3% of those age 65 or over.
Common Questions
What is Per Capita Income in Severy?
Per Capita income in Severy is $30,362.
What is the Median Family Income in Severy?
Median Family Income in Severy is $71,250.
What is the Median Household income in Severy?
Median Household Income in Severy is $34,375.
What is Inequality or Gini Index in Severy?
Inequality or Gini Index in Severy is 0.47.
What is the Total Population of Severy?
Total Population of Severy is 212.
What is the Total Male Population of Severy?
Total Male Population of Severy is 125.
What is the Total Female Population of Severy?
Total Female Population of Severy is 87.
What is the Ratio of Males per 100 Females in Severy?
There are 143.68 Males per 100 Females in Severy.
What is the Ratio of Females per 100 Males in Severy?
There are 69.60 Females per 100 Males in Severy.
What is the Median Population Age in Severy?
Median Population Age in Severy is 55.8 Years.
What is the Average Family Size in Severy
Average Family Size in Severy is 2.5 People.
What is the Average Household Size in Severy
Average Household Size in Severy is 1.8 People.
How Large is the Labor Force in Severy?
There are 117 People in the Labor Forcein in Severy.
What is the Percentage of People in the Labor Force in Severy?
60.0% of People are in the Labor Force in Severy.