Zip Codes with the Highest Poverty Level Among Single Mothers in Idaho
RELATED REPORTS & OPTIONS
Highest Poverty | Single Mother
Idaho
Compare Zip Codes
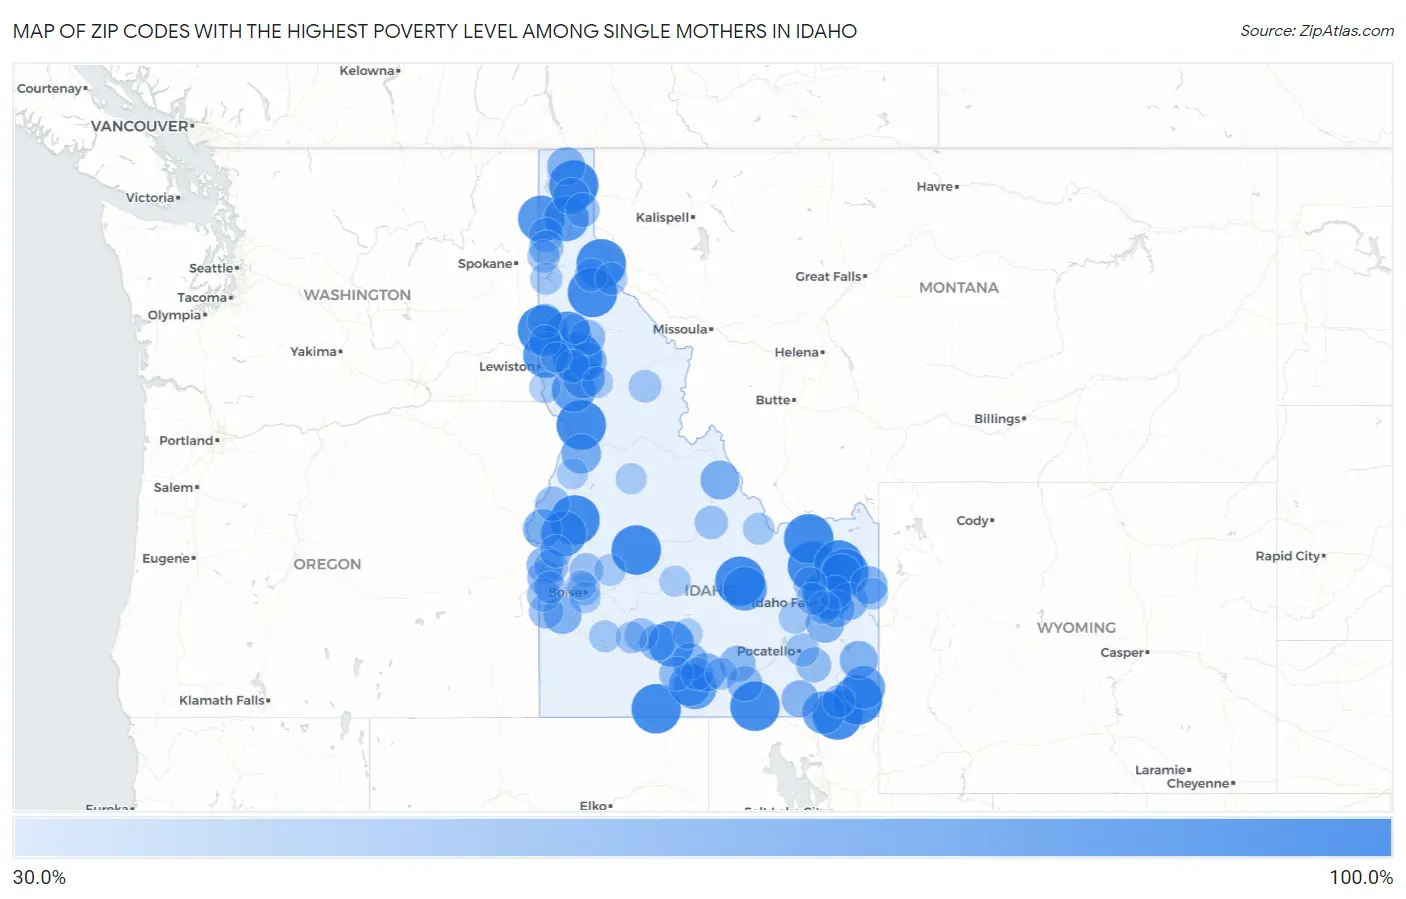
Map of Zip Codes with the Highest Poverty Level Among Single Mothers in Idaho
30.0%
100.0%
Zip Codes with the Highest Poverty Level Among Single Mothers in Idaho
| Zip Code | Single Mother Poverty | vs State | vs National | |
| 1. | 83873 | 100.0% | 31.7%(+68.3)#1 | 33.1%(+66.9)#195 |
| 2. | 83847 | 100.0% | 31.7%(+68.3)#2 | 33.1%(+66.9)#247 |
| 3. | 83342 | 100.0% | 31.7%(+68.3)#3 | 33.1%(+66.9)#303 |
| 4. | 83237 | 100.0% | 31.7%(+68.3)#4 | 33.1%(+66.9)#317 |
| 5. | 83255 | 100.0% | 31.7%(+68.3)#5 | 33.1%(+66.9)#412 |
| 6. | 83872 | 100.0% | 31.7%(+68.3)#6 | 33.1%(+66.9)#636 |
| 7. | 83261 | 100.0% | 31.7%(+68.3)#7 | 33.1%(+66.9)#645 |
| 8. | 83425 | 100.0% | 31.7%(+68.3)#8 | 33.1%(+66.9)#648 |
| 9. | 83423 | 100.0% | 31.7%(+68.3)#9 | 33.1%(+66.9)#705 |
| 10. | 83632 | 100.0% | 31.7%(+68.3)#10 | 33.1%(+66.9)#813 |
| 11. | 83454 | 100.0% | 31.7%(+68.3)#11 | 33.1%(+66.9)#1,056 |
| 12. | 83438 | 100.0% | 31.7%(+68.3)#12 | 33.1%(+66.9)#1,069 |
| 13. | 83554 | 100.0% | 31.7%(+68.3)#13 | 33.1%(+66.9)#1,096 |
| 14. | 83302 | 100.0% | 31.7%(+68.3)#14 | 33.1%(+66.9)#1,117 |
| 15. | 83520 | 100.0% | 31.7%(+68.3)#15 | 33.1%(+66.9)#1,149 |
| 16. | 83637 | 100.0% | 31.7%(+68.3)#16 | 33.1%(+66.9)#1,218 |
| 17. | 83808 | 100.0% | 31.7%(+68.3)#17 | 33.1%(+66.9)#1,412 |
| 18. | 83451 | 92.9% | 31.7%(+61.1)#18 | 33.1%(+59.7)#1,617 |
| 19. | 83823 | 90.9% | 31.7%(+59.2)#19 | 33.1%(+57.8)#1,668 |
| 20. | 83822 | 88.7% | 31.7%(+57.0)#20 | 33.1%(+55.6)#1,754 |
| 21. | 83832 | 88.2% | 31.7%(+56.5)#21 | 33.1%(+55.1)#1,765 |
| 22. | 83330 | 86.3% | 31.7%(+54.6)#22 | 33.1%(+53.2)#1,860 |
| 23. | 83645 | 85.7% | 31.7%(+54.0)#23 | 33.1%(+52.6)#1,900 |
| 24. | 83860 | 83.5% | 31.7%(+51.8)#24 | 33.1%(+50.3)#1,999 |
| 25. | 83213 | 80.0% | 31.7%(+48.3)#25 | 33.1%(+46.9)#2,227 |
| 26. | 83526 | 80.0% | 31.7%(+48.3)#26 | 33.1%(+46.9)#2,257 |
| 27. | 83334 | 78.7% | 31.7%(+47.0)#27 | 33.1%(+45.6)#2,328 |
| 28. | 83254 | 76.1% | 31.7%(+44.4)#28 | 33.1%(+43.0)#2,518 |
| 29. | 83286 | 75.0% | 31.7%(+43.3)#29 | 33.1%(+41.9)#2,601 |
| 30. | 83341 | 74.1% | 31.7%(+42.4)#30 | 33.1%(+41.0)#2,701 |
| 31. | 83543 | 73.3% | 31.7%(+41.6)#31 | 33.1%(+40.2)#2,767 |
| 32. | 83448 | 66.7% | 31.7%(+34.9)#32 | 33.1%(+33.5)#3,423 |
| 33. | 83549 | 64.7% | 31.7%(+33.0)#33 | 33.1%(+31.6)#3,756 |
| 34. | 83467 | 63.0% | 31.7%(+31.3)#34 | 33.1%(+29.9)#3,981 |
| 35. | 83672 | 62.2% | 31.7%(+30.4)#35 | 33.1%(+29.0)#4,121 |
| 36. | 83335 | 60.7% | 31.7%(+29.0)#36 | 33.1%(+27.6)#4,329 |
| 37. | 83544 | 60.0% | 31.7%(+28.3)#37 | 33.1%(+26.9)#4,417 |
| 38. | 83236 | 60.0% | 31.7%(+28.3)#38 | 33.1%(+26.9)#4,437 |
| 39. | 83276 | 59.5% | 31.7%(+27.7)#39 | 33.1%(+26.3)#4,575 |
| 40. | 83805 | 59.3% | 31.7%(+27.6)#40 | 33.1%(+26.2)#4,592 |
| 41. | 83641 | 59.3% | 31.7%(+27.5)#41 | 33.1%(+26.1)#4,600 |
| 42. | 83443 | 58.3% | 31.7%(+26.6)#42 | 33.1%(+25.2)#4,768 |
| 43. | 83422 | 58.3% | 31.7%(+26.5)#43 | 33.1%(+25.1)#4,792 |
| 44. | 83427 | 56.8% | 31.7%(+25.0)#44 | 33.1%(+23.6)#5,094 |
| 45. | 83864 | 56.2% | 31.7%(+24.5)#45 | 33.1%(+23.1)#5,206 |
| 46. | 83252 | 56.0% | 31.7%(+24.3)#46 | 33.1%(+22.9)#5,245 |
| 47. | 83619 | 54.8% | 31.7%(+23.1)#47 | 33.1%(+21.6)#5,513 |
| 48. | 83338 | 53.5% | 31.7%(+21.8)#48 | 33.1%(+20.4)#5,779 |
| 49. | 83314 | 53.3% | 31.7%(+21.6)#49 | 33.1%(+20.2)#5,821 |
| 50. | 83350 | 52.9% | 31.7%(+21.2)#50 | 33.1%(+19.8)#5,901 |
| 51. | 83660 | 50.6% | 31.7%(+18.9)#51 | 33.1%(+17.5)#6,419 |
| 52. | 83323 | 50.0% | 31.7%(+18.3)#52 | 33.1%(+16.9)#6,590 |
| 53. | 83827 | 50.0% | 31.7%(+18.3)#53 | 33.1%(+16.9)#6,790 |
| 54. | 83855 | 48.8% | 31.7%(+17.1)#54 | 33.1%(+15.7)#7,034 |
| 55. | 83250 | 48.4% | 31.7%(+16.7)#55 | 33.1%(+15.3)#7,149 |
| 56. | 83610 | 47.4% | 31.7%(+15.7)#56 | 33.1%(+14.2)#7,434 |
| 57. | 83869 | 47.3% | 31.7%(+15.5)#57 | 33.1%(+14.1)#7,464 |
| 58. | 83639 | 46.9% | 31.7%(+15.2)#58 | 33.1%(+13.8)#7,558 |
| 59. | 83836 | 46.2% | 31.7%(+14.4)#59 | 33.1%(+13.0)#7,831 |
| 60. | 83858 | 46.1% | 31.7%(+14.4)#60 | 33.1%(+13.0)#7,844 |
| 61. | 83328 | 46.0% | 31.7%(+14.3)#61 | 33.1%(+12.9)#7,872 |
| 62. | 83655 | 45.9% | 31.7%(+14.2)#62 | 33.1%(+12.7)#7,902 |
| 63. | 83442 | 45.2% | 31.7%(+13.5)#63 | 33.1%(+12.1)#8,094 |
| 64. | 83633 | 44.4% | 31.7%(+12.7)#64 | 33.1%(+11.3)#8,341 |
| 65. | 83628 | 44.4% | 31.7%(+12.6)#65 | 33.1%(+11.2)#8,365 |
| 66. | 83629 | 44.2% | 31.7%(+12.5)#66 | 33.1%(+11.1)#8,412 |
| 67. | 83226 | 42.9% | 31.7%(+11.1)#67 | 33.1%(+9.72)#8,786 |
| 68. | 83444 | 42.9% | 31.7%(+11.1)#68 | 33.1%(+9.72)#8,807 |
| 69. | 83545 | 42.9% | 31.7%(+11.1)#69 | 33.1%(+9.72)#8,834 |
| 70. | 83201 | 42.8% | 31.7%(+11.1)#70 | 33.1%(+9.68)#8,852 |
| 71. | 83837 | 42.5% | 31.7%(+10.8)#71 | 33.1%(+9.39)#8,917 |
| 72. | 83404 | 42.1% | 31.7%(+10.4)#72 | 33.1%(+8.94)#9,065 |
| 73. | 83703 | 41.7% | 31.7%(+10.0)#73 | 33.1%(+8.58)#9,144 |
| 74. | 83325 | 41.7% | 31.7%(+9.95)#74 | 33.1%(+8.53)#9,182 |
| 75. | 83661 | 41.6% | 31.7%(+9.89)#75 | 33.1%(+8.47)#9,207 |
| 76. | 83539 | 40.7% | 31.7%(+9.02)#76 | 33.1%(+7.61)#9,500 |
| 77. | 83854 | 40.7% | 31.7%(+8.98)#77 | 33.1%(+7.56)#9,512 |
| 78. | 83263 | 40.6% | 31.7%(+8.92)#78 | 33.1%(+7.51)#9,525 |
| 79. | 83626 | 40.0% | 31.7%(+8.28)#79 | 33.1%(+6.86)#9,765 |
| 80. | 83846 | 40.0% | 31.7%(+8.28)#80 | 33.1%(+6.86)#9,800 |
| 81. | 83221 | 39.9% | 31.7%(+8.21)#81 | 33.1%(+6.79)#9,846 |
| 82. | 83402 | 39.6% | 31.7%(+7.90)#82 | 33.1%(+6.48)#9,951 |
| 83. | 83336 | 39.4% | 31.7%(+7.64)#83 | 33.1%(+6.23)#10,034 |
| 84. | 83843 | 39.3% | 31.7%(+7.57)#84 | 33.1%(+6.15)#10,062 |
| 85. | 83876 | 39.2% | 31.7%(+7.50)#85 | 33.1%(+6.08)#10,087 |
| 86. | 83455 | 37.6% | 31.7%(+5.93)#86 | 33.1%(+4.51)#10,621 |
| 87. | 83648 | 37.5% | 31.7%(+5.78)#87 | 33.1%(+4.36)#10,667 |
| 88. | 83623 | 37.5% | 31.7%(+5.78)#88 | 33.1%(+4.36)#10,676 |
| 89. | 83464 | 37.5% | 31.7%(+5.78)#89 | 33.1%(+4.36)#10,726 |
| 90. | 83631 | 37.0% | 31.7%(+5.32)#90 | 33.1%(+3.90)#10,876 |
| 91. | 83501 | 36.9% | 31.7%(+5.14)#91 | 33.1%(+3.72)#10,936 |
| 92. | 83705 | 36.3% | 31.7%(+4.59)#92 | 33.1%(+3.17)#11,181 |
| 93. | 83340 | 35.6% | 31.7%(+3.90)#93 | 33.1%(+2.48)#11,443 |
| 94. | 83611 | 35.0% | 31.7%(+3.28)#94 | 33.1%(+1.86)#11,656 |
| 95. | 83654 | 35.0% | 31.7%(+3.28)#95 | 33.1%(+1.86)#11,661 |
| 96. | 83536 | 34.8% | 31.7%(+3.07)#96 | 33.1%(+1.65)#11,733 |
| 97. | 83535 | 33.3% | 31.7%(+1.62)#97 | 33.1%(+0.198)#12,339 |
| 98. | 83806 | 33.3% | 31.7%(+1.62)#98 | 33.1%(+0.198)#12,434 |
| 99. | 83352 | 32.9% | 31.7%(+1.22)#99 | 33.1%(-0.194)#12,556 |
| 100. | 83714 | 32.7% | 31.7%(+0.972)#100 | 33.1%(-0.447)#12,648 |
Common Questions
What are the Top 10 Zip Codes with the Highest Poverty Level Among Single Mothers in Idaho?
Top 10 Zip Codes with the Highest Poverty Level Among Single Mothers in Idaho are:
What zip code has the Highest Poverty Level Among Single Mothers in Idaho?
83873 has the Highest Poverty Level Among Single Mothers in Idaho with 100.0%.
What is the Poverty Level Among Single Mothers in the State of Idaho?
Poverty Level Among Single Mothers in Idaho is 31.7%.
What is the Poverty Level Among Single Mothers in the United States?
Poverty Level Among Single Mothers in the United States is 33.1%.