Marathon, FL Map & Demographics
Marathon Map
Marathon Overview
$47,806
PER CAPITA INCOME
$90,042
AVG FAMILY INCOME
$70,313
AVG HOUSEHOLD INCOME
23.5%
WAGE / INCOME GAP [ % ]
76.5¢/ $1
WAGE / INCOME GAP [ $ ]
$8,380
FAMILY INCOME DEFICIT
0.51
INEQUALITY / GINI INDEX
9,789
TOTAL POPULATION
5,131
MALE POPULATION
4,658
FEMALE POPULATION
110.15
MALES / 100 FEMALES
90.78
FEMALES / 100 MALES
47.2
MEDIAN AGE
3.0
AVG FAMILY SIZE
2.5
AVG HOUSEHOLD SIZE
5,669
LABOR FORCE [ PEOPLE ]
68.9%
PERCENT IN LABOR FORCE
6.0%
UNEMPLOYMENT RATE
Marathon Zip Codes
Marathon Area Codes
Income in Marathon
Income Overview in Marathon
Per Capita Income in Marathon is $47,806, while median incomes of families and households are $90,042 and $70,313 respectively.
| Characteristic | Number | Measure |
| Per Capita Income | 9,789 | $47,806 |
| Median Family Income | 2,339 | $90,042 |
| Mean Family Income | 2,339 | $140,778 |
| Median Household Income | 3,956 | $70,313 |
| Mean Household Income | 3,956 | $114,216 |
| Income Deficit | 2,339 | $8,380 |
| Wage / Income Gap (%) | 9,789 | 23.49% |
| Wage / Income Gap ($) | 9,789 | 76.51¢ per $1 |
| Gini / Inequality Index | 9,789 | 0.51 |
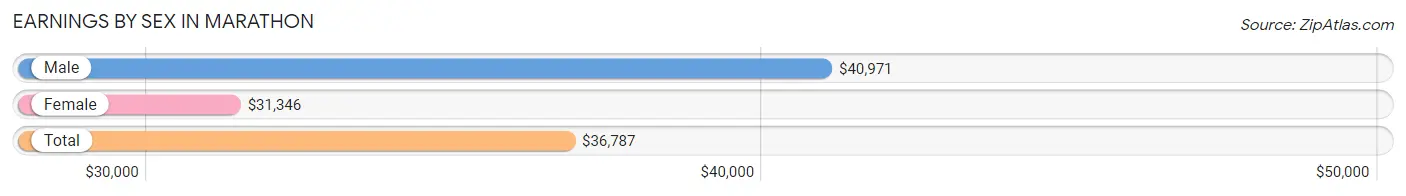
Earnings by Sex in Marathon
Average Earnings in Marathon are $36,787, $40,971 for men and $31,346 for women, a difference of 23.5%.
| Sex | Number | Average Earnings |
| Male | 3,097 (53.2%) | $40,971 |
| Female | 2,720 (46.8%) | $31,346 |
| Total | 5,817 (100.0%) | $36,787 |
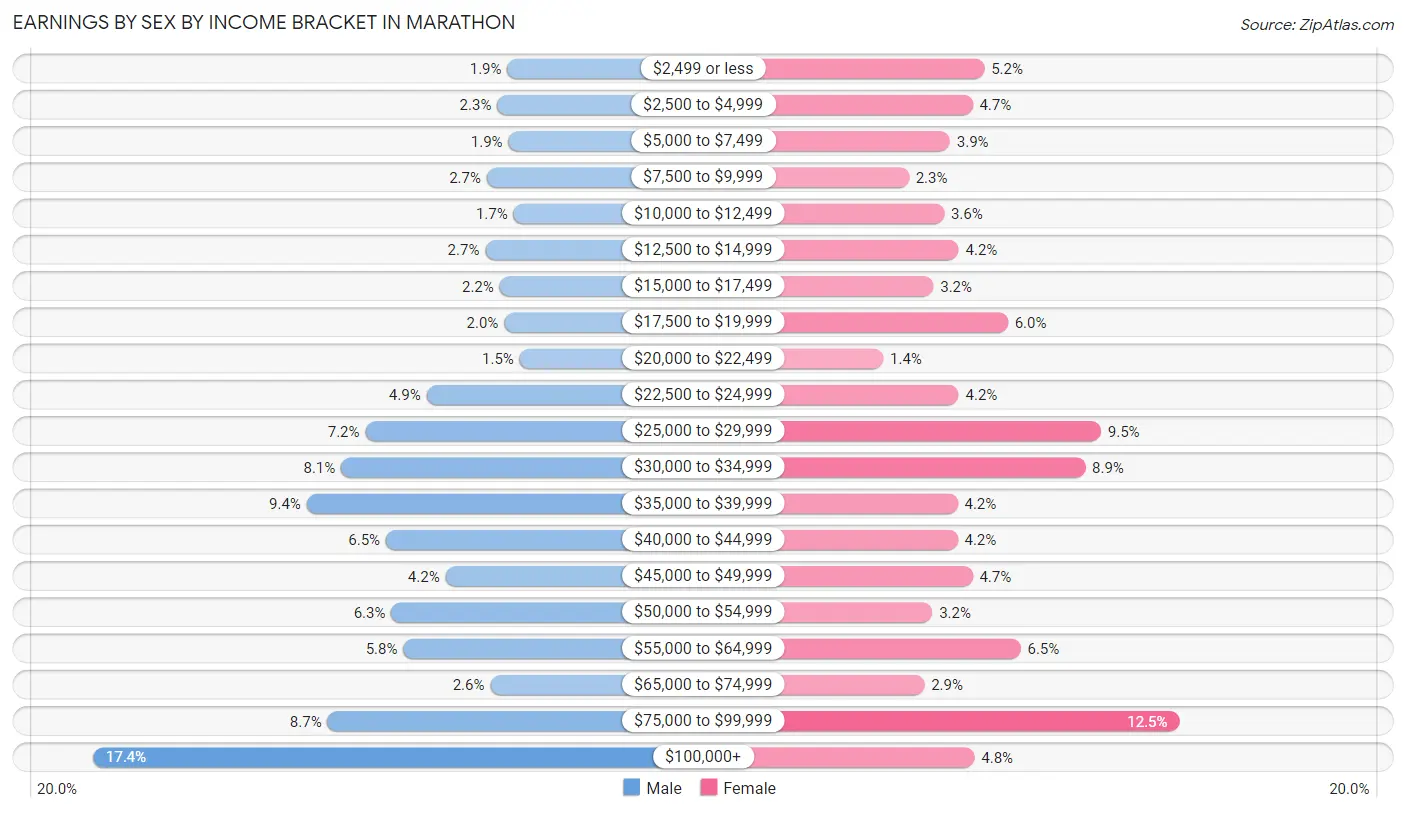
Earnings by Sex by Income Bracket in Marathon
The most common earnings brackets in Marathon are $100,000+ for men (540 | 17.4%) and $75,000 to $99,999 for women (339 | 12.5%).
| Income | Male | Female |
| $2,499 or less | 59 (1.9%) | 140 (5.1%) |
| $2,500 to $4,999 | 71 (2.3%) | 128 (4.7%) |
| $5,000 to $7,499 | 58 (1.9%) | 105 (3.9%) |
| $7,500 to $9,999 | 83 (2.7%) | 63 (2.3%) |
| $10,000 to $12,499 | 52 (1.7%) | 99 (3.6%) |
| $12,500 to $14,999 | 85 (2.7%) | 114 (4.2%) |
| $15,000 to $17,499 | 68 (2.2%) | 88 (3.2%) |
| $17,500 to $19,999 | 63 (2.0%) | 164 (6.0%) |
| $20,000 to $22,499 | 45 (1.5%) | 37 (1.4%) |
| $22,500 to $24,999 | 153 (4.9%) | 114 (4.2%) |
| $25,000 to $29,999 | 224 (7.2%) | 259 (9.5%) |
| $30,000 to $34,999 | 252 (8.1%) | 243 (8.9%) |
| $35,000 to $39,999 | 292 (9.4%) | 113 (4.2%) |
| $40,000 to $44,999 | 200 (6.5%) | 113 (4.2%) |
| $45,000 to $49,999 | 131 (4.2%) | 128 (4.7%) |
| $50,000 to $54,999 | 194 (6.3%) | 87 (3.2%) |
| $55,000 to $64,999 | 180 (5.8%) | 177 (6.5%) |
| $65,000 to $74,999 | 79 (2.5%) | 79 (2.9%) |
| $75,000 to $99,999 | 268 (8.6%) | 339 (12.5%) |
| $100,000+ | 540 (17.4%) | 130 (4.8%) |
| Total | 3,097 (100.0%) | 2,720 (100.0%) |
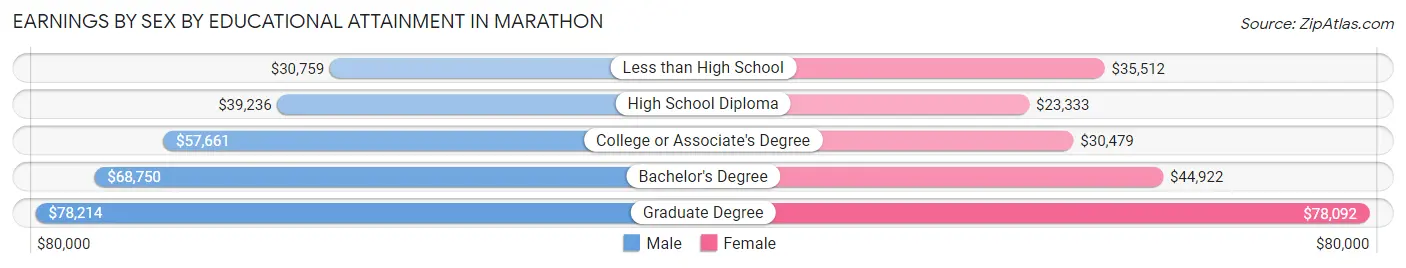
Earnings by Sex by Educational Attainment in Marathon
Average earnings in Marathon are $45,945 for men and $33,776 for women, a difference of 26.5%. Men with an educational attainment of graduate degree enjoy the highest average annual earnings of $78,214, while those with less than high school education earn the least with $30,759. Women with an educational attainment of graduate degree earn the most with the average annual earnings of $78,092, while those with high school diploma education have the smallest earnings of $23,333.
| Educational Attainment | Male Income | Female Income |
| Less than High School | $30,759 | $35,512 |
| High School Diploma | $39,236 | $23,333 |
| College or Associate's Degree | $57,661 | $30,479 |
| Bachelor's Degree | $68,750 | $44,922 |
| Graduate Degree | $78,214 | $78,092 |
| Total | $45,945 | $33,776 |
Family Income in Marathon
Family Income Brackets in Marathon
According to the Marathon family income data, there are 407 families falling into the $75,000 to $99,999 income range, which is the most common income bracket and makes up 17.4% of all families. Conversely, the $10,000 to $14,999 income bracket is the least frequent group with only 21 families (0.9%) belonging to this category.
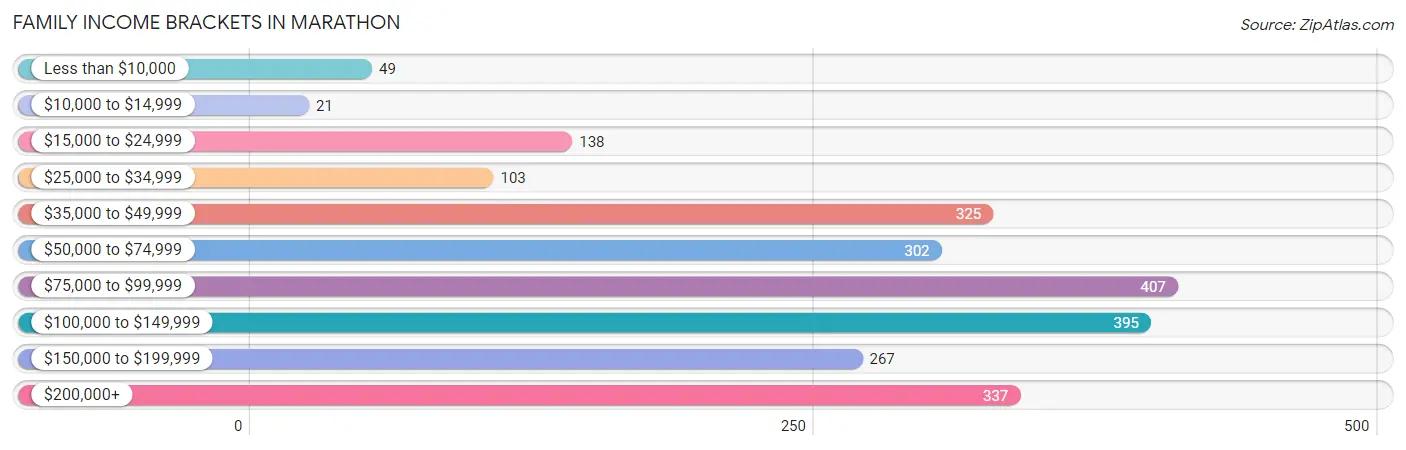
| Income Bracket | # Families | % Families |
| Less than $10,000 | 49 | 2.1% |
| $10,000 to $14,999 | 21 | 0.9% |
| $15,000 to $24,999 | 138 | 5.9% |
| $25,000 to $34,999 | 103 | 4.4% |
| $35,000 to $49,999 | 325 | 13.9% |
| $50,000 to $74,999 | 302 | 12.9% |
| $75,000 to $99,999 | 407 | 17.4% |
| $100,000 to $149,999 | 395 | 16.9% |
| $150,000 to $199,999 | 267 | 11.4% |
| $200,000+ | 337 | 14.4% |
Family Income by Famaliy Size in Marathon
6-person families (38 | 1.6%) account for the highest median family income in Marathon with $134,615 per family, while 2-person families (1,360 | 58.1%) have the highest median income of $40,920 per family member.
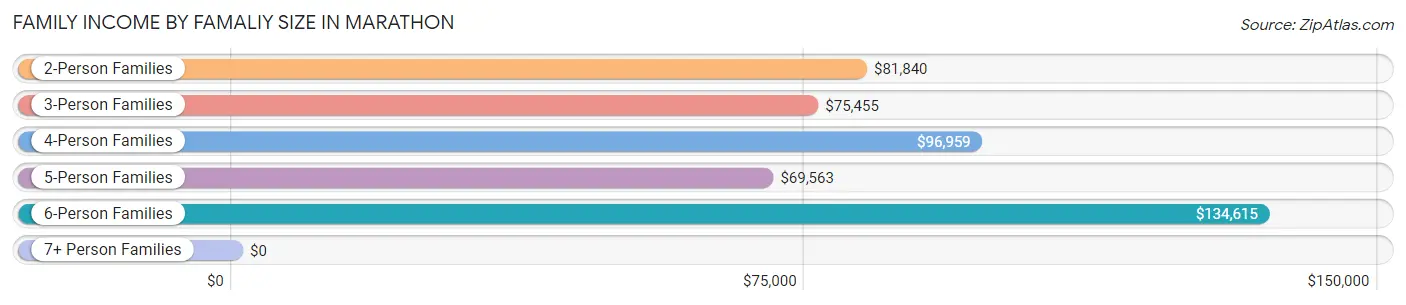
| Income Bracket | # Families | Median Income |
| 2-Person Families | 1,360 (58.1%) | $81,840 |
| 3-Person Families | 452 (19.3%) | $75,455 |
| 4-Person Families | 397 (17.0%) | $96,959 |
| 5-Person Families | 92 (3.9%) | $69,563 |
| 6-Person Families | 38 (1.6%) | $134,615 |
| 7+ Person Families | 0 (0.0%) | $0 |
| Total | 2,339 (100.0%) | $90,042 |
Family Income by Number of Earners in Marathon
The median family income in Marathon is $90,042, with families comprising 2 earners (865) having the highest median family income of $116,250, while families with no earners (254) have the lowest median family income of $50,000, accounting for 37.0% and 10.9% of families, respectively.
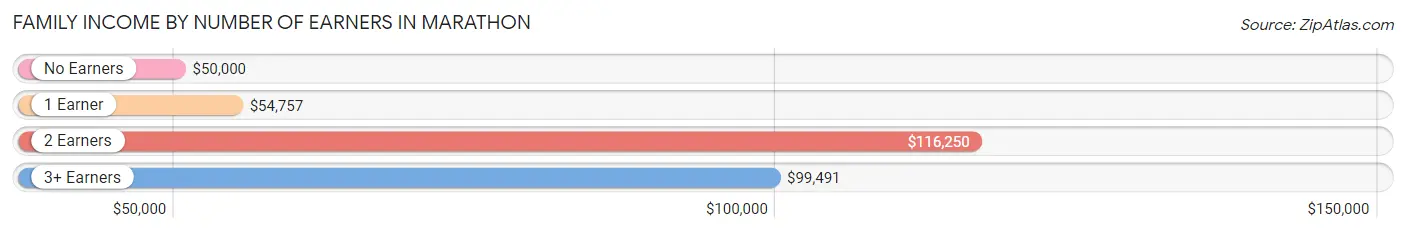
| Number of Earners | # Families | Median Income |
| No Earners | 254 (10.9%) | $50,000 |
| 1 Earner | 905 (38.7%) | $54,757 |
| 2 Earners | 865 (37.0%) | $116,250 |
| 3+ Earners | 315 (13.5%) | $99,491 |
| Total | 2,339 (100.0%) | $90,042 |
Household Income in Marathon
Household Income Brackets in Marathon
With 732 households falling in the category, the $50,000 to $74,999 income range is the most frequent in Marathon, accounting for 18.5% of all households. In contrast, only 87 households (2.2%) fall into the $10,000 to $14,999 income bracket, making it the least populous group.
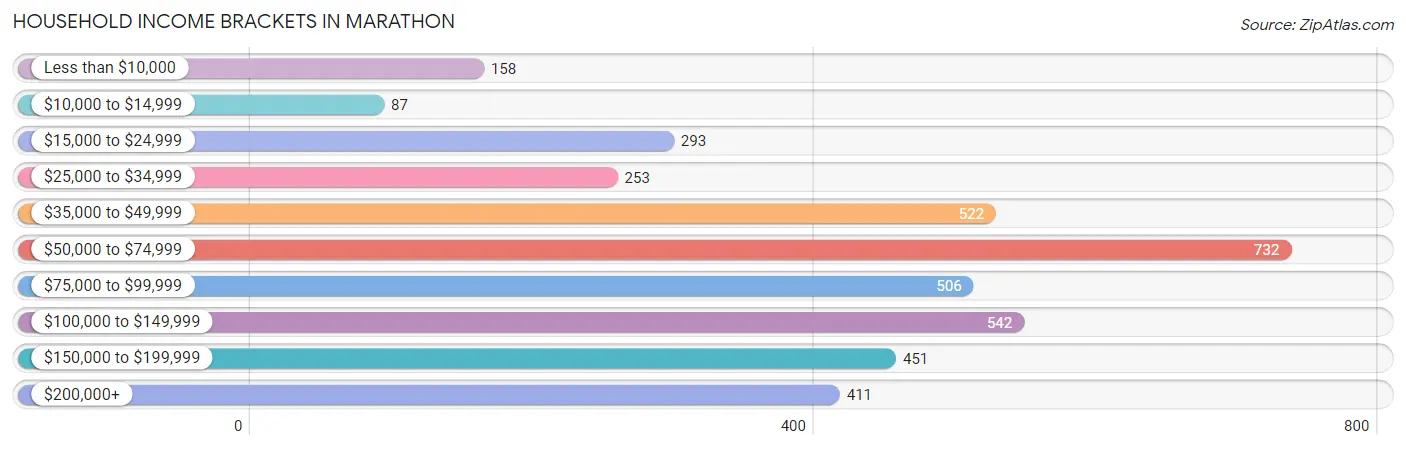
| Income Bracket | # Households | % Households |
| Less than $10,000 | 158 | 4.0% |
| $10,000 to $14,999 | 87 | 2.2% |
| $15,000 to $24,999 | 293 | 7.4% |
| $25,000 to $34,999 | 253 | 6.4% |
| $35,000 to $49,999 | 522 | 13.2% |
| $50,000 to $74,999 | 732 | 18.5% |
| $75,000 to $99,999 | 506 | 12.8% |
| $100,000 to $149,999 | 542 | 13.7% |
| $150,000 to $199,999 | 451 | 11.4% |
| $200,000+ | 411 | 10.4% |
Household Income by Householder Age in Marathon
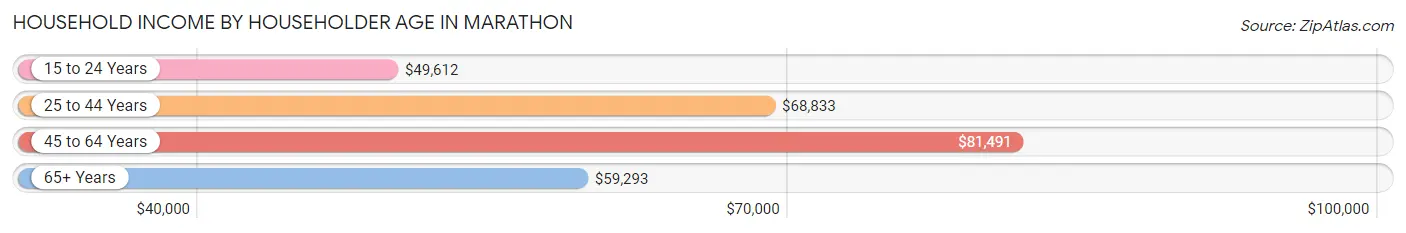
The median household income in Marathon is $70,313, with the highest median household income of $81,491 found in the 45 to 64 years age bracket for the primary householder. A total of 1,628 households (41.1%) fall into this category. Meanwhile, the 15 to 24 years age bracket for the primary householder has the lowest median household income of $49,612, with 83 households (2.1%) in this group.
| Income Bracket | # Households | Median Income |
| 15 to 24 Years | 83 (2.1%) | $49,612 |
| 25 to 44 Years | 892 (22.6%) | $68,833 |
| 45 to 64 Years | 1,628 (41.1%) | $81,491 |
| 65+ Years | 1,353 (34.2%) | $59,293 |
| Total | 3,956 (100.0%) | $70,313 |
Poverty in Marathon
Income Below Poverty by Sex and Age in Marathon
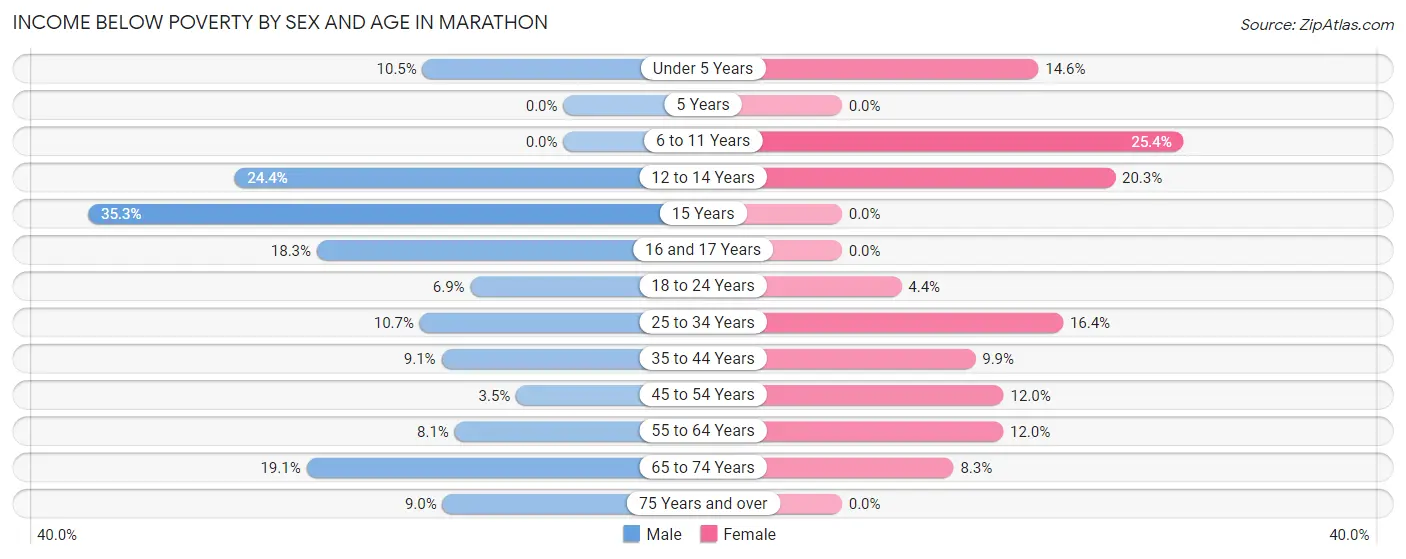
With 10.7% poverty level for males and 11.3% for females among the residents of Marathon, 15 year old males and 6 to 11 year old females are the most vulnerable to poverty, with 54 males (35.3%) and 68 females (25.4%) in their respective age groups living below the poverty level.
| Age Bracket | Male | Female |
| Under 5 Years | 23 (10.4%) | 34 (14.6%) |
| 5 Years | 0 (0.0%) | 0 (0.0%) |
| 6 to 11 Years | 0 (0.0%) | 68 (25.4%) |
| 12 to 14 Years | 53 (24.4%) | 28 (20.3%) |
| 15 Years | 54 (35.3%) | 0 (0.0%) |
| 16 and 17 Years | 28 (18.3%) | 0 (0.0%) |
| 18 to 24 Years | 24 (6.9%) | 11 (4.4%) |
| 25 to 34 Years | 52 (10.7%) | 88 (16.4%) |
| 35 to 44 Years | 45 (9.0%) | 68 (9.9%) |
| 45 to 54 Years | 30 (3.5%) | 88 (12.0%) |
| 55 to 64 Years | 57 (8.1%) | 87 (12.0%) |
| 65 to 74 Years | 136 (19.1%) | 51 (8.3%) |
| 75 Years and over | 42 (9.0%) | 0 (0.0%) |
| Total | 544 (10.7%) | 523 (11.3%) |
Income Above Poverty by Sex and Age in Marathon
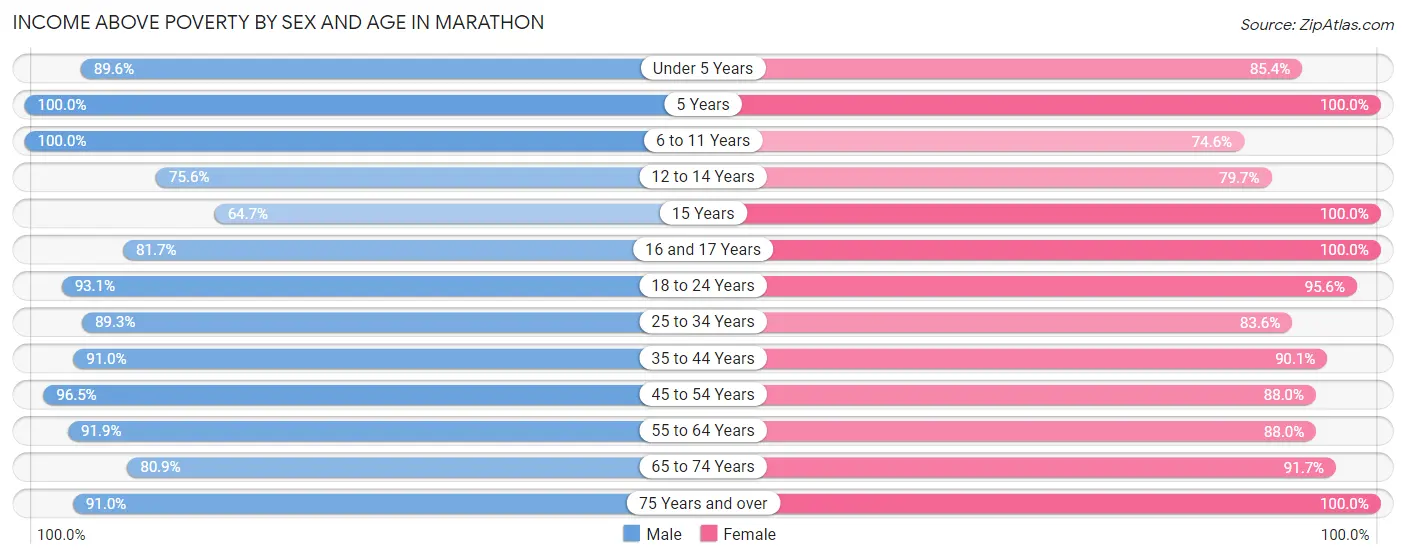
According to the poverty statistics in Marathon, males aged 5 years and females aged 5 years are the age groups that are most secure financially, with 100.0% of males and 100.0% of females in these age groups living above the poverty line.
| Age Bracket | Male | Female |
| Under 5 Years | 197 (89.5%) | 199 (85.4%) |
| 5 Years | 4 (100.0%) | 17 (100.0%) |
| 6 to 11 Years | 263 (100.0%) | 200 (74.6%) |
| 12 to 14 Years | 164 (75.6%) | 110 (79.7%) |
| 15 Years | 99 (64.7%) | 9 (100.0%) |
| 16 and 17 Years | 125 (81.7%) | 150 (100.0%) |
| 18 to 24 Years | 324 (93.1%) | 238 (95.6%) |
| 25 to 34 Years | 436 (89.3%) | 448 (83.6%) |
| 35 to 44 Years | 452 (90.9%) | 618 (90.1%) |
| 45 to 54 Years | 828 (96.5%) | 645 (88.0%) |
| 55 to 64 Years | 649 (91.9%) | 640 (88.0%) |
| 65 to 74 Years | 577 (80.9%) | 564 (91.7%) |
| 75 Years and over | 426 (91.0%) | 274 (100.0%) |
| Total | 4,544 (89.3%) | 4,112 (88.7%) |
Income Below Poverty Among Married-Couple Families in Marathon
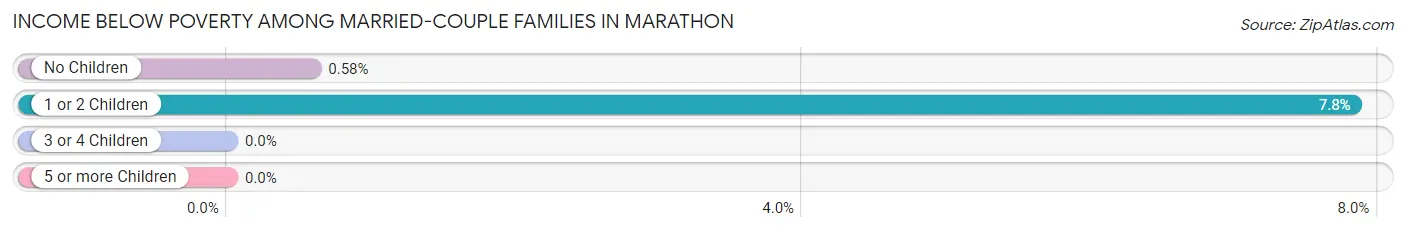
The poverty statistics for married-couple families in Marathon show that 2.6% or 47 of the total 1,785 families live below the poverty line. Families with 1 or 2 children have the highest poverty rate of 7.8%, comprising of 40 families. On the other hand, families with 3 or 4 children have the lowest poverty rate of 0.0%, which includes 0 families.
| Children | Above Poverty | Below Poverty |
| No Children | 1,193 (99.4%) | 7 (0.6%) |
| 1 or 2 Children | 471 (92.2%) | 40 (7.8%) |
| 3 or 4 Children | 74 (100.0%) | 0 (0.0%) |
| 5 or more Children | 0 (0.0%) | 0 (0.0%) |
| Total | 1,738 (97.4%) | 47 (2.6%) |
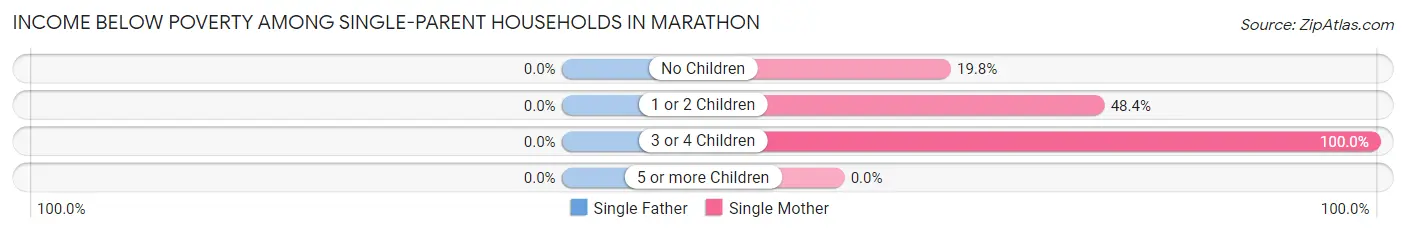
Income Below Poverty Among Single-Parent Households in Marathon
| Children | Single Father | Single Mother |
| No Children | 0 (0.0%) | 21 (19.8%) |
| 1 or 2 Children | 0 (0.0%) | 62 (48.4%) |
| 3 or 4 Children | 0 (0.0%) | 20 (100.0%) |
| 5 or more Children | 0 (0.0%) | 0 (0.0%) |
| Total | 0 (0.0%) | 103 (40.6%) |
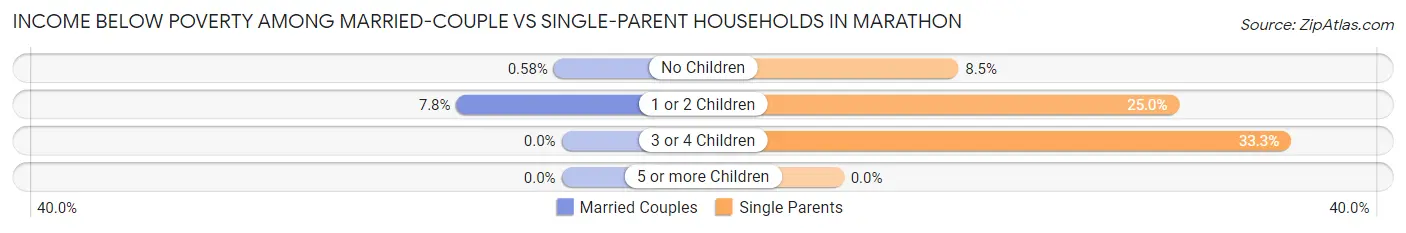
Income Below Poverty Among Married-Couple vs Single-Parent Households in Marathon
The poverty data for Marathon shows that 47 of the married-couple family households (2.6%) and 103 of the single-parent households (18.6%) are living below the poverty level. Within the married-couple family households, those with 1 or 2 children have the highest poverty rate, with 40 households (7.8%) falling below the poverty line. Among the single-parent households, those with 3 or 4 children have the highest poverty rate, with 20 household (33.3%) living below poverty.
| Children | Married-Couple Families | Single-Parent Households |
| No Children | 7 (0.6%) | 21 (8.5%) |
| 1 or 2 Children | 40 (7.8%) | 62 (25.0%) |
| 3 or 4 Children | 0 (0.0%) | 20 (33.3%) |
| 5 or more Children | 0 (0.0%) | 0 (0.0%) |
| Total | 47 (2.6%) | 103 (18.6%) |
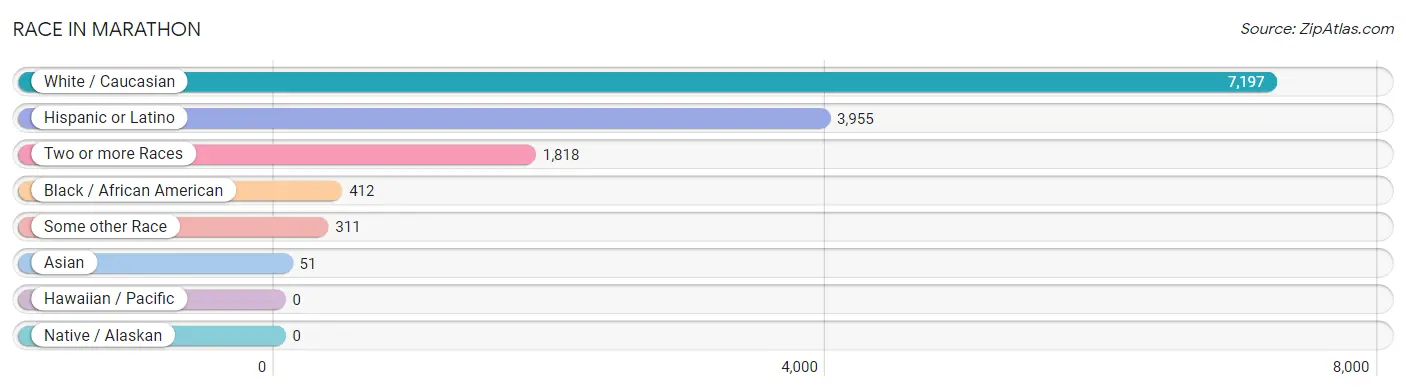
Race in Marathon
The most populous races in Marathon are White / Caucasian (7,197 | 73.5%), Hispanic or Latino (3,955 | 40.4%), and Two or more Races (1,818 | 18.6%).
| Race | # Population | % Population |
| Asian | 51 | 0.5% |
| Black / African American | 412 | 4.2% |
| Hawaiian / Pacific | 0 | 0.0% |
| Hispanic or Latino | 3,955 | 40.4% |
| Native / Alaskan | 0 | 0.0% |
| White / Caucasian | 7,197 | 73.5% |
| Two or more Races | 1,818 | 18.6% |
| Some other Race | 311 | 3.2% |
| Total | 9,789 | 100.0% |
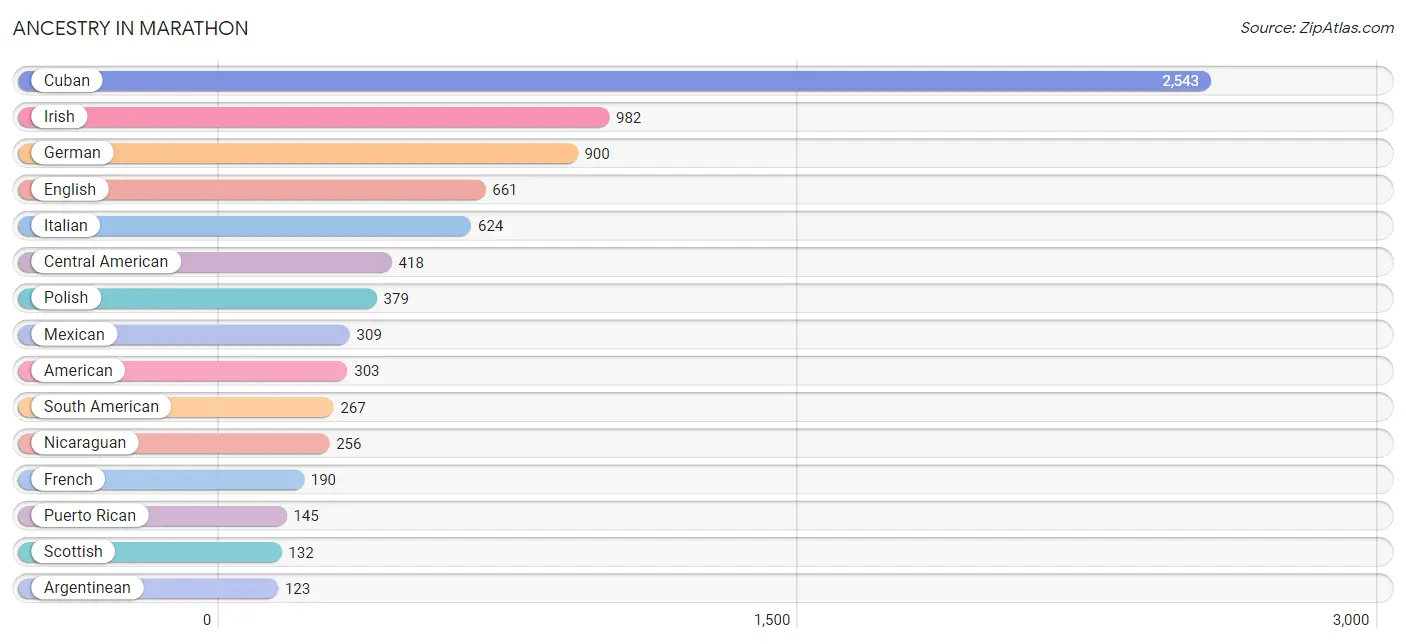
Ancestry in Marathon
The most populous ancestries reported in Marathon are Cuban (2,543 | 26.0%), Irish (982 | 10.0%), German (900 | 9.2%), English (661 | 6.8%), and Italian (624 | 6.4%), together accounting for 58.3% of all Marathon residents.
| Ancestry | # Population | % Population |
| African | 67 | 0.7% |
| American | 303 | 3.1% |
| Arab | 22 | 0.2% |
| Argentinean | 123 | 1.3% |
| Austrian | 34 | 0.4% |
| Belgian | 15 | 0.2% |
| Bhutanese | 4 | 0.0% |
| Brazilian | 7 | 0.1% |
| British | 36 | 0.4% |
| Canadian | 24 | 0.3% |
| Central American | 418 | 4.3% |
| Colombian | 50 | 0.5% |
| Costa Rican | 42 | 0.4% |
| Croatian | 7 | 0.1% |
| Cuban | 2,543 | 26.0% |
| Czech | 26 | 0.3% |
| Czechoslovakian | 18 | 0.2% |
| Danish | 19 | 0.2% |
| Dominican | 106 | 1.1% |
| Dutch | 66 | 0.7% |
| Eastern European | 35 | 0.4% |
| English | 661 | 6.8% |
| European | 72 | 0.7% |
| French | 190 | 1.9% |
| French Canadian | 37 | 0.4% |
| German | 900 | 9.2% |
| Greek | 34 | 0.4% |
| Guatemalan | 86 | 0.9% |
| Haitian | 83 | 0.9% |
| Honduran | 8 | 0.1% |
| Hungarian | 27 | 0.3% |
| Irish | 982 | 10.0% |
| Italian | 624 | 6.4% |
| Korean | 72 | 0.7% |
| Latvian | 1 | 0.0% |
| Lebanese | 8 | 0.1% |
| Mexican | 309 | 3.2% |
| Native Hawaiian | 10 | 0.1% |
| Nicaraguan | 256 | 2.6% |
| Norwegian | 43 | 0.4% |
| Peruvian | 15 | 0.2% |
| Polish | 379 | 3.9% |
| Portuguese | 10 | 0.1% |
| Puerto Rican | 145 | 1.5% |
| Russian | 30 | 0.3% |
| Salvadoran | 26 | 0.3% |
| Scandinavian | 12 | 0.1% |
| Scotch-Irish | 22 | 0.2% |
| Scottish | 132 | 1.3% |
| Slavic | 40 | 0.4% |
| Slovak | 4 | 0.0% |
| South African | 5 | 0.1% |
| South American | 267 | 2.7% |
| Spanish | 51 | 0.5% |
| Sri Lankan | 33 | 0.3% |
| Subsaharan African | 72 | 0.7% |
| Swedish | 118 | 1.2% |
| Swiss | 34 | 0.4% |
| Syrian | 14 | 0.1% |
| Thai | 13 | 0.1% |
| Ukrainian | 10 | 0.1% |
| Venezuelan | 79 | 0.8% |
| Welsh | 80 | 0.8% | View All 63 Rows |
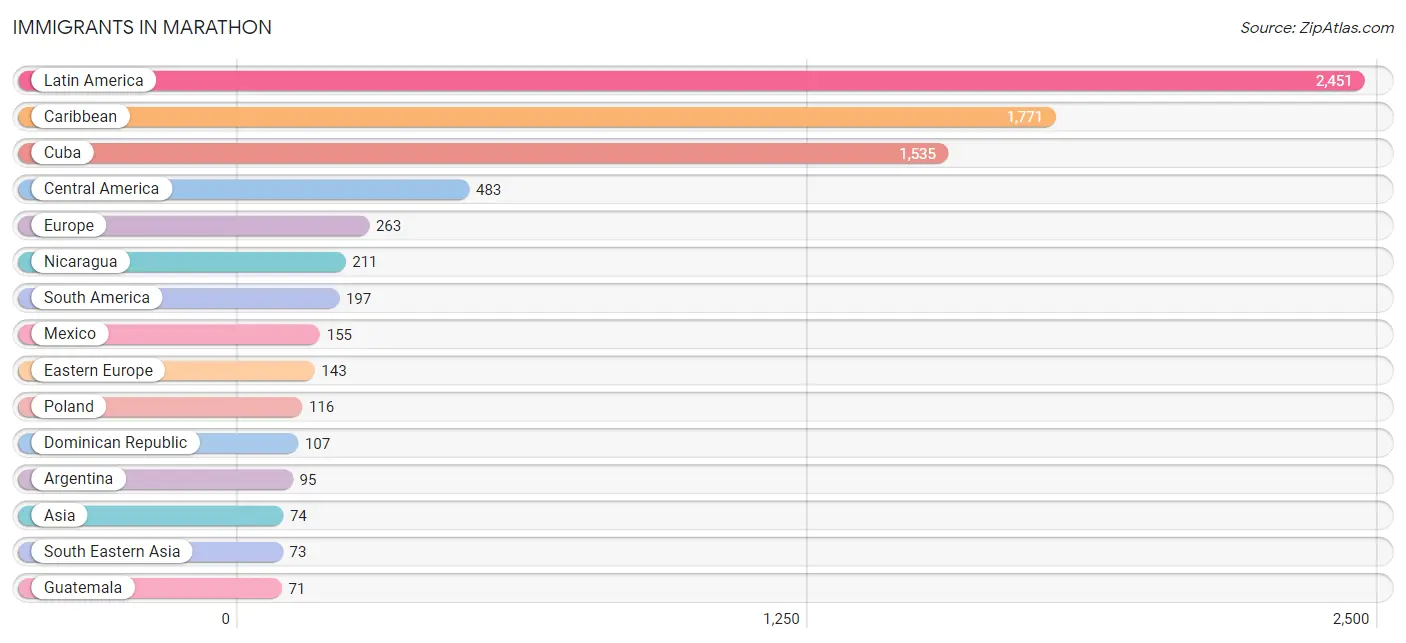
Immigrants in Marathon
The most numerous immigrant groups reported in Marathon came from Latin America (2,451 | 25.0%), Caribbean (1,771 | 18.1%), Cuba (1,535 | 15.7%), Central America (483 | 4.9%), and Europe (263 | 2.7%), together accounting for 66.4% of all Marathon residents.
| Immigration Origin | # Population | % Population |
| Africa | 5 | 0.1% |
| Argentina | 95 | 1.0% |
| Asia | 74 | 0.8% |
| Belgium | 10 | 0.1% |
| Canada | 52 | 0.5% |
| Caribbean | 1,771 | 18.1% |
| Central America | 483 | 4.9% |
| Colombia | 38 | 0.4% |
| Costa Rica | 14 | 0.1% |
| Cuba | 1,535 | 15.7% |
| Czechoslovakia | 21 | 0.2% |
| Dominican Republic | 107 | 1.1% |
| Eastern Asia | 1 | 0.0% |
| Eastern Europe | 143 | 1.5% |
| El Salvador | 2 | 0.0% |
| England | 6 | 0.1% |
| Europe | 263 | 2.7% |
| France | 10 | 0.1% |
| Germany | 26 | 0.3% |
| Guatemala | 71 | 0.7% |
| Haiti | 64 | 0.6% |
| Honduras | 30 | 0.3% |
| Hungary | 6 | 0.1% |
| Italy | 25 | 0.3% |
| Jamaica | 65 | 0.7% |
| Japan | 1 | 0.0% |
| Latin America | 2,451 | 25.0% |
| Mexico | 155 | 1.6% |
| Netherlands | 8 | 0.1% |
| Nicaragua | 211 | 2.2% |
| Northern Europe | 17 | 0.2% |
| Peru | 15 | 0.2% |
| Philippines | 62 | 0.6% |
| Poland | 116 | 1.2% |
| Scotland | 6 | 0.1% |
| South Africa | 5 | 0.1% |
| South America | 197 | 2.0% |
| South Eastern Asia | 73 | 0.7% |
| Southern Europe | 49 | 0.5% |
| Spain | 24 | 0.3% |
| Venezuela | 49 | 0.5% |
| Vietnam | 11 | 0.1% |
| Western Europe | 54 | 0.5% | View All 43 Rows |
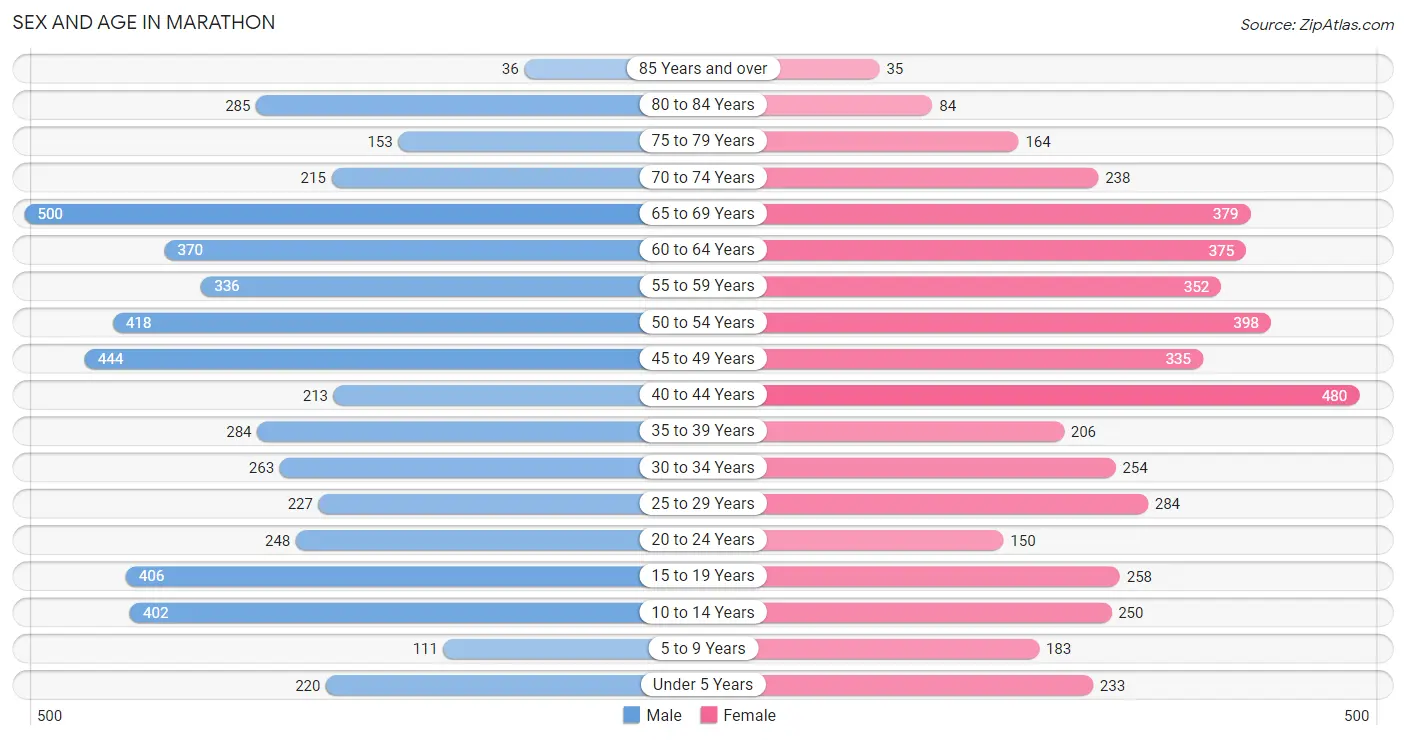
Sex and Age in Marathon
Sex and Age in Marathon
The most populous age groups in Marathon are 65 to 69 Years (500 | 9.7%) for men and 40 to 44 Years (480 | 10.3%) for women.
| Age Bracket | Male | Female |
| Under 5 Years | 220 (4.3%) | 233 (5.0%) |
| 5 to 9 Years | 111 (2.2%) | 183 (3.9%) |
| 10 to 14 Years | 402 (7.8%) | 250 (5.4%) |
| 15 to 19 Years | 406 (7.9%) | 258 (5.5%) |
| 20 to 24 Years | 248 (4.8%) | 150 (3.2%) |
| 25 to 29 Years | 227 (4.4%) | 284 (6.1%) |
| 30 to 34 Years | 263 (5.1%) | 254 (5.4%) |
| 35 to 39 Years | 284 (5.5%) | 206 (4.4%) |
| 40 to 44 Years | 213 (4.2%) | 480 (10.3%) |
| 45 to 49 Years | 444 (8.6%) | 335 (7.2%) |
| 50 to 54 Years | 418 (8.2%) | 398 (8.5%) |
| 55 to 59 Years | 336 (6.6%) | 352 (7.6%) |
| 60 to 64 Years | 370 (7.2%) | 375 (8.1%) |
| 65 to 69 Years | 500 (9.7%) | 379 (8.1%) |
| 70 to 74 Years | 215 (4.2%) | 238 (5.1%) |
| 75 to 79 Years | 153 (3.0%) | 164 (3.5%) |
| 80 to 84 Years | 285 (5.6%) | 84 (1.8%) |
| 85 Years and over | 36 (0.7%) | 35 (0.7%) |
| Total | 5,131 (100.0%) | 4,658 (100.0%) |
Families and Households in Marathon
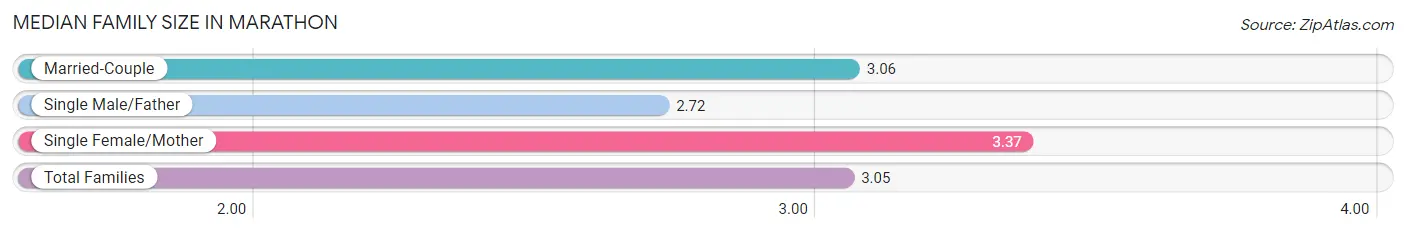
Median Family Size in Marathon
The median family size in Marathon is 3.05 persons per family, with single female/mother families (254 | 10.9%) accounting for the largest median family size of 3.37 persons per family. On the other hand, single male/father families (300 | 12.8%) represent the smallest median family size with 2.72 persons per family.
| Family Type | # Families | Family Size |
| Married-Couple | 1,785 (76.3%) | 3.06 |
| Single Male/Father | 300 (12.8%) | 2.72 |
| Single Female/Mother | 254 (10.9%) | 3.37 |
| Total Families | 2,339 (100.0%) | 3.05 |
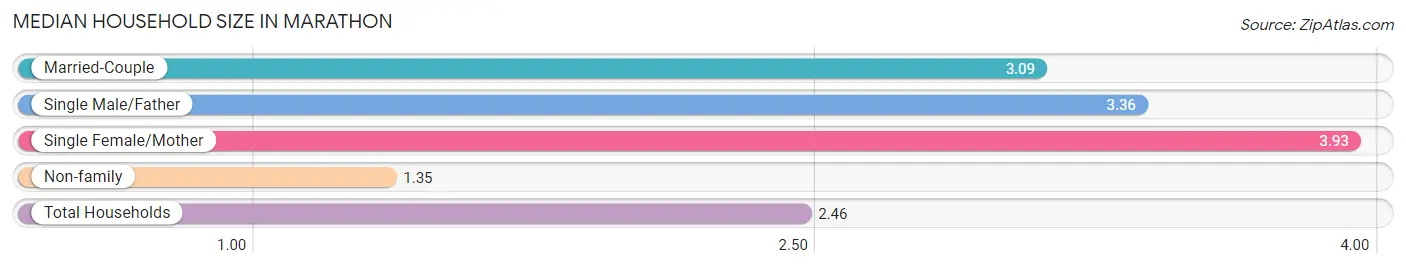
Median Household Size in Marathon
The median household size in Marathon is 2.46 persons per household, with single female/mother households (254 | 6.4%) accounting for the largest median household size of 3.93 persons per household. non-family households (1,617 | 40.9%) represent the smallest median household size with 1.35 persons per household.
| Household Type | # Households | Household Size |
| Married-Couple | 1,785 (45.1%) | 3.09 |
| Single Male/Father | 300 (7.6%) | 3.36 |
| Single Female/Mother | 254 (6.4%) | 3.93 |
| Non-family | 1,617 (40.9%) | 1.35 |
| Total Households | 3,956 (100.0%) | 2.46 |
Household Size by Marriage Status in Marathon
Out of a total of 3,956 households in Marathon, 2,339 (59.1%) are family households, while 1,617 (40.9%) are nonfamily households. The most numerous type of family households are 2-person households, comprising 1,228, and the most common type of nonfamily households are 1-person households, comprising 1,156.
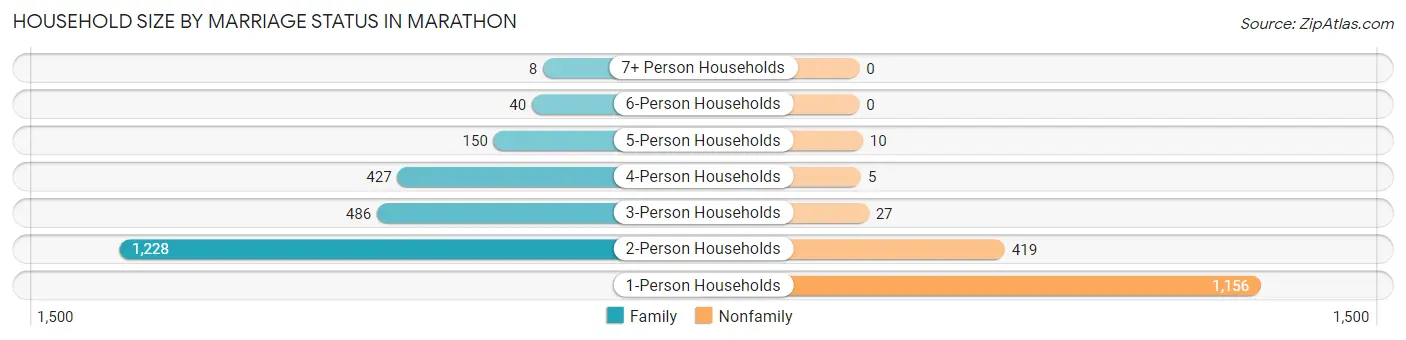
| Household Size | Family Households | Nonfamily Households |
| 1-Person Households | - | 1,156 (29.2%) |
| 2-Person Households | 1,228 (31.0%) | 419 (10.6%) |
| 3-Person Households | 486 (12.3%) | 27 (0.7%) |
| 4-Person Households | 427 (10.8%) | 5 (0.1%) |
| 5-Person Households | 150 (3.8%) | 10 (0.3%) |
| 6-Person Households | 40 (1.0%) | 0 (0.0%) |
| 7+ Person Households | 8 (0.2%) | 0 (0.0%) |
| Total | 2,339 (59.1%) | 1,617 (40.9%) |
Female Fertility in Marathon
Fertility by Age in Marathon
Average fertility rate in Marathon is 84.0 births per 1,000 women. Women in the age bracket of 20 to 34 years have the highest fertility rate with 233.0 births per 1,000 women. Women in the age bracket of 20 to 34 years acount for 94.1% of all women with births.
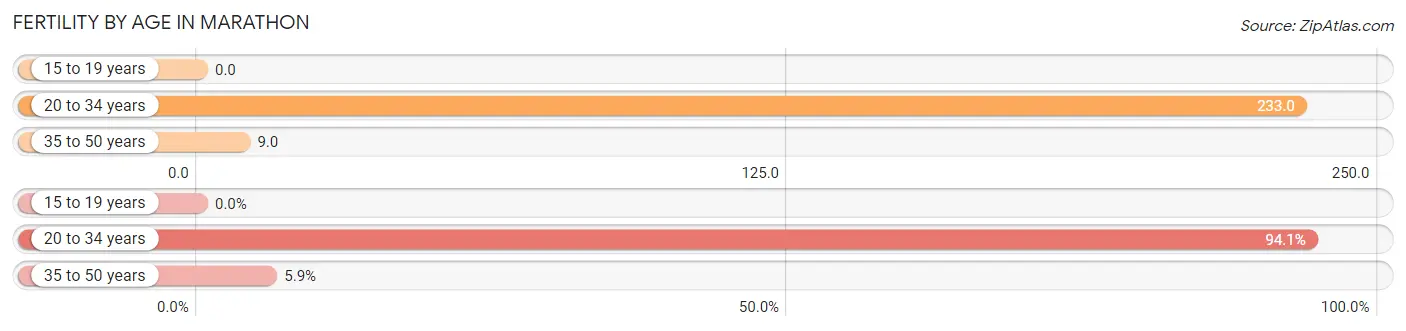
| Age Bracket | Women with Births | Births / 1,000 Women |
| 15 to 19 years | 0 (0.0%) | 0.0 |
| 20 to 34 years | 160 (94.1%) | 233.0 |
| 35 to 50 years | 10 (5.9%) | 9.0 |
| Total | 170 (100.0%) | 84.0 |
Fertility by Age by Marriage Status in Marathon
34.1% of women with births (170) in Marathon are married. The highest percentage of unmarried women with births falls into 35 to 50 years age bracket with 100.0% of them unmarried at the time of birth, while the lowest percentage of unmarried women with births belong to 20 to 34 years age bracket with 63.7% of them unmarried.
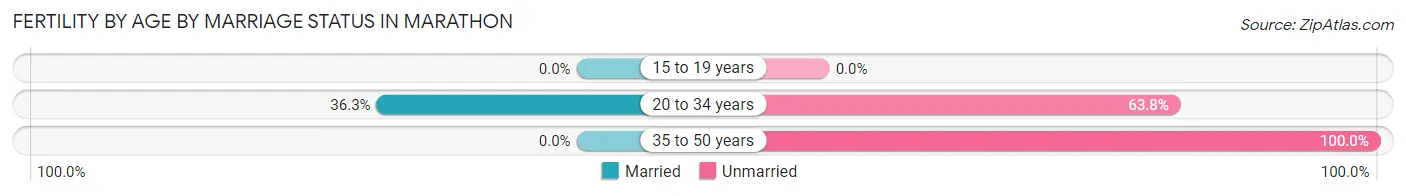
| Age Bracket | Married | Unmarried |
| 15 to 19 years | 0 (0.0%) | 0 (0.0%) |
| 20 to 34 years | 58 (36.2%) | 102 (63.7%) |
| 35 to 50 years | 0 (0.0%) | 10 (100.0%) |
| Total | 58 (34.1%) | 112 (65.9%) |
Fertility by Education in Marathon
Average fertility rate in Marathon is 84.0 births per 1,000 women. Women with the education attainment of high school diploma have the highest fertility rate of 185.0 births per 1,000 women, while women with the education attainment of college or associate's degree have the lowest fertility at 29.0 births per 1,000 women. Women with the education attainment of high school diploma represent 51.8% of all women with births.
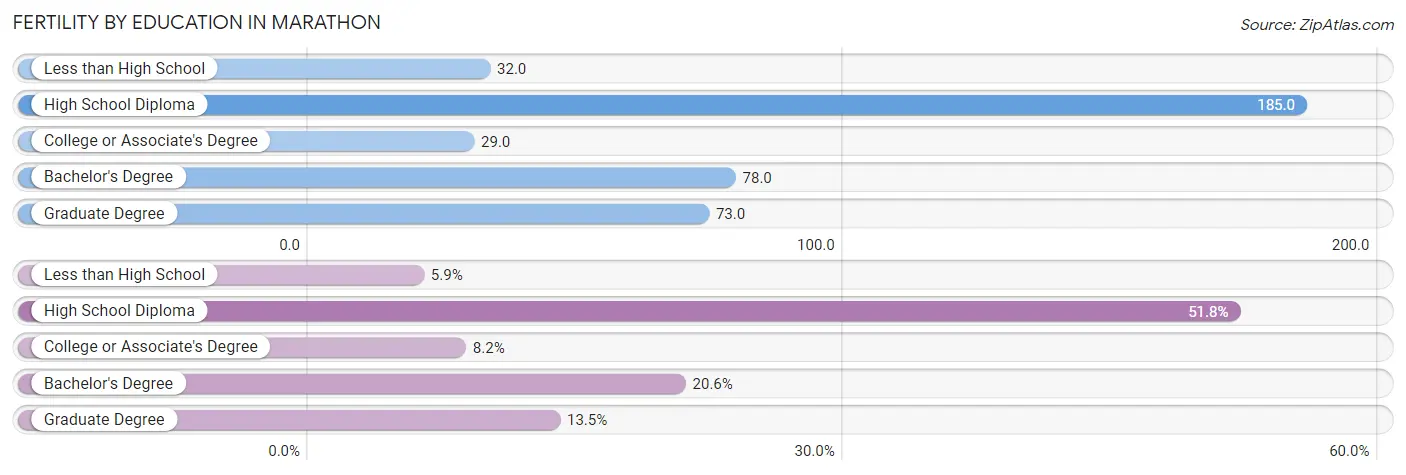
| Educational Attainment | Women with Births | Births / 1,000 Women |
| Less than High School | 10 (5.9%) | 32.0 |
| High School Diploma | 88 (51.8%) | 185.0 |
| College or Associate's Degree | 14 (8.2%) | 29.0 |
| Bachelor's Degree | 35 (20.6%) | 78.0 |
| Graduate Degree | 23 (13.5%) | 73.0 |
| Total | 170 (100.0%) | 84.0 |
Fertility by Education by Marriage Status in Marathon
65.9% of women with births in Marathon are unmarried. Women with the educational attainment of college or associate's degree are most likely to be married with 100.0% of them married at childbirth, while women with the educational attainment of less than high school are least likely to be married with 100.0% of them unmarried at childbirth.
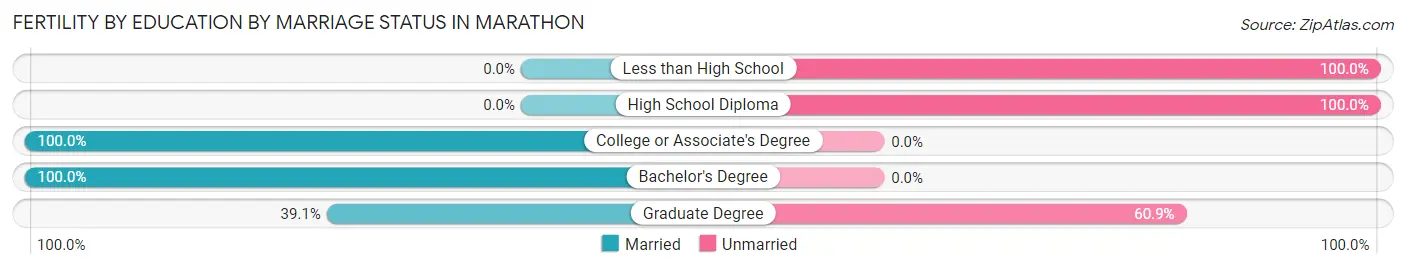
| Educational Attainment | Married | Unmarried |
| Less than High School | 0 (0.0%) | 10 (100.0%) |
| High School Diploma | 0 (0.0%) | 88 (100.0%) |
| College or Associate's Degree | 14 (100.0%) | 0 (0.0%) |
| Bachelor's Degree | 35 (100.0%) | 0 (0.0%) |
| Graduate Degree | 9 (39.1%) | 14 (60.9%) |
| Total | 58 (34.1%) | 112 (65.9%) |
Employment Characteristics in Marathon
Employment by Class of Employer in Marathon
Among the 5,151 employed individuals in Marathon, private company employees (2,810 | 54.5%), self-employed (incorporated) (730 | 14.2%), and self-employed (not incorporated) (609 | 11.8%) make up the most common classes of employment.
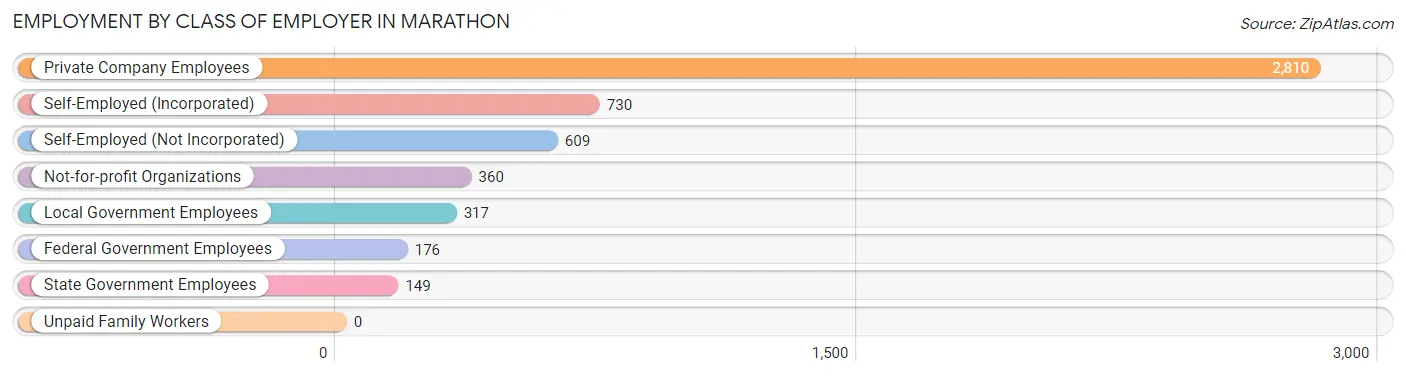
| Employer Class | # Employees | % Employees |
| Private Company Employees | 2,810 | 54.5% |
| Self-Employed (Incorporated) | 730 | 14.2% |
| Self-Employed (Not Incorporated) | 609 | 11.8% |
| Not-for-profit Organizations | 360 | 7.0% |
| Local Government Employees | 317 | 6.1% |
| State Government Employees | 149 | 2.9% |
| Federal Government Employees | 176 | 3.4% |
| Unpaid Family Workers | 0 | 0.0% |
| Total | 5,151 | 100.0% |
Employment Status by Age in Marathon
According to the labor force statistics for Marathon, out of the total population over 16 years of age (8,228), 68.9% or 5,669 individuals are in the labor force, with 6.0% or 340 of them unemployed. The age group with the highest labor force participation rate is 30 to 34 years, with 92.8% or 480 individuals in the labor force. Within the labor force, the 25 to 29 years age range has the highest percentage of unemployed individuals, with 12.6% or 57 of them being unemployed.
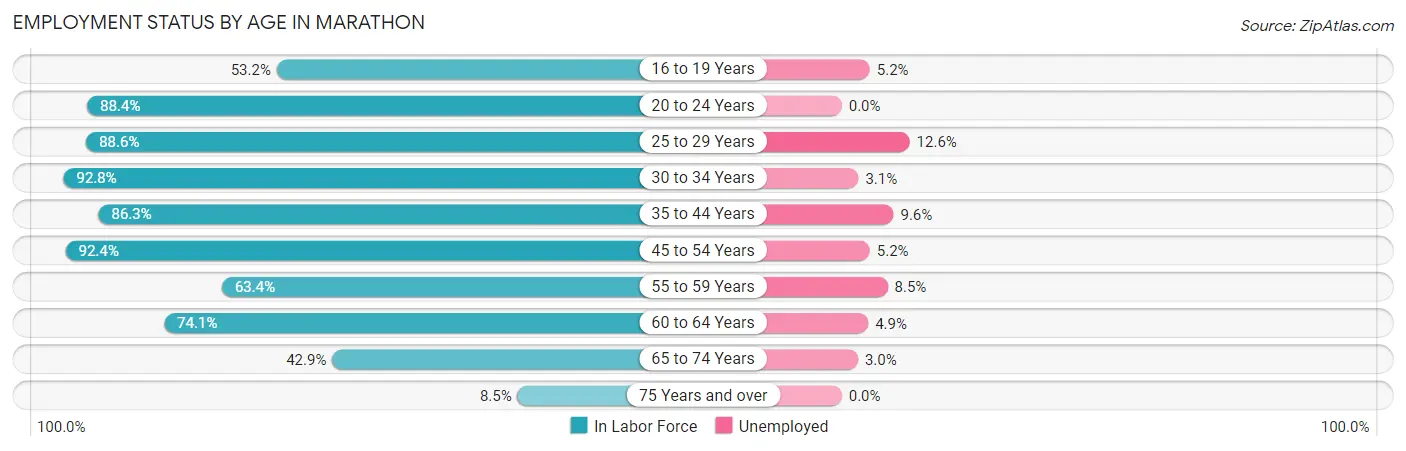
| Age Bracket | In Labor Force | Unemployed |
| 16 to 19 Years | 267 (53.2%) | 14 (5.2%) |
| 20 to 24 Years | 352 (88.4%) | 0 (0.0%) |
| 25 to 29 Years | 453 (88.6%) | 57 (12.6%) |
| 30 to 34 Years | 480 (92.8%) | 15 (3.1%) |
| 35 to 44 Years | 1,021 (86.3%) | 98 (9.6%) |
| 45 to 54 Years | 1,474 (92.4%) | 77 (5.2%) |
| 55 to 59 Years | 436 (63.4%) | 37 (8.5%) |
| 60 to 64 Years | 552 (74.1%) | 27 (4.9%) |
| 65 to 74 Years | 571 (42.9%) | 17 (3.0%) |
| 75 Years and over | 64 (8.5%) | 0 (0.0%) |
| Total | 5,669 (68.9%) | 340 (6.0%) |
Employment Status by Educational Attainment in Marathon
According to labor force statistics for Marathon, 84.3% of individuals (4,416) out of the total population between 25 and 64 years of age (5,239) are in the labor force, with 7.0% or 309 of them being unemployed. The group with the highest labor force participation rate are those with the educational attainment of less than high school, with 98.0% or 547 individuals in the labor force. Within the labor force, individuals with college / associate degree education have the highest percentage of unemployment, with 13.8% or 140 of them being unemployed.
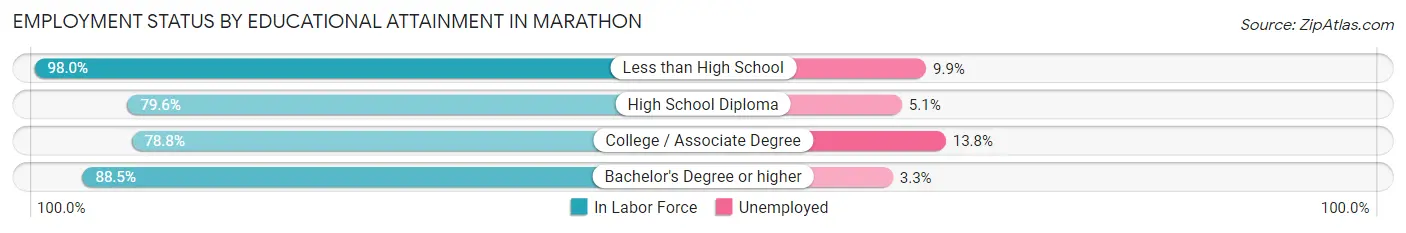
| Educational Attainment | In Labor Force | Unemployed |
| Less than High School | 547 (98.0%) | 55 (9.9%) |
| High School Diploma | 1,331 (79.6%) | 85 (5.1%) |
| College / Associate Degree | 1,018 (78.8%) | 178 (13.8%) |
| Bachelor's Degree or higher | 1,520 (88.5%) | 57 (3.3%) |
| Total | 4,416 (84.3%) | 367 (7.0%) |
Employment Occupations by Sex in Marathon
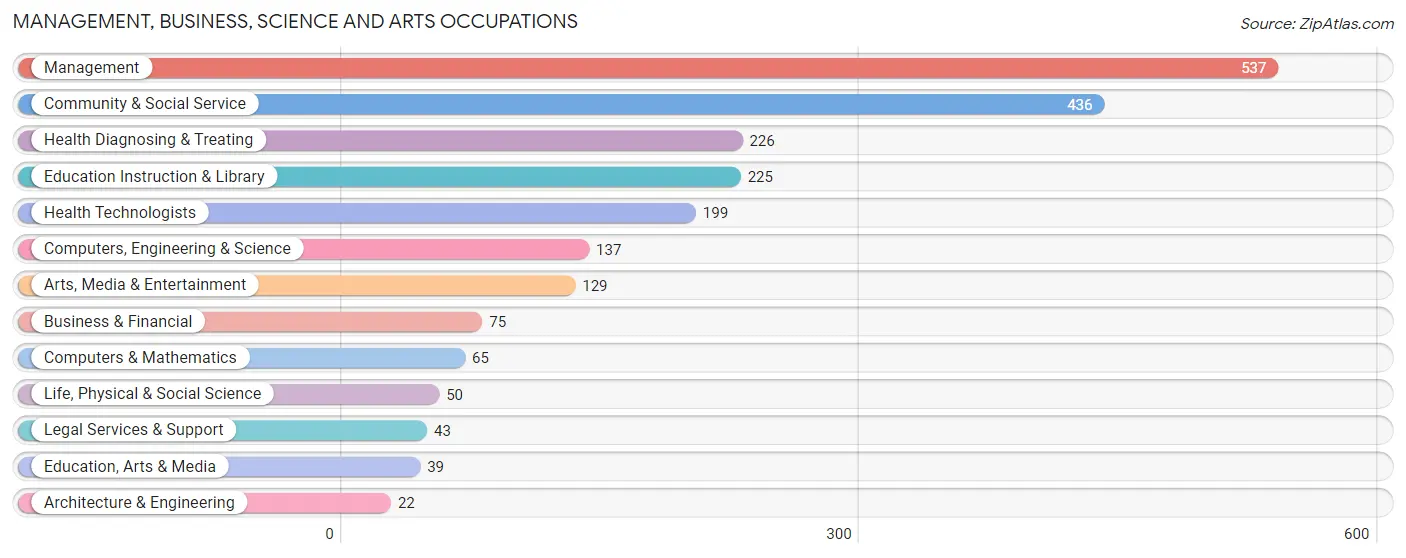
Management, Business, Science and Arts Occupations
The most common Management, Business, Science and Arts occupations in Marathon are Management (537 | 10.2%), Community & Social Service (436 | 8.3%), Health Diagnosing & Treating (226 | 4.3%), Education Instruction & Library (225 | 4.3%), and Health Technologists (199 | 3.8%).
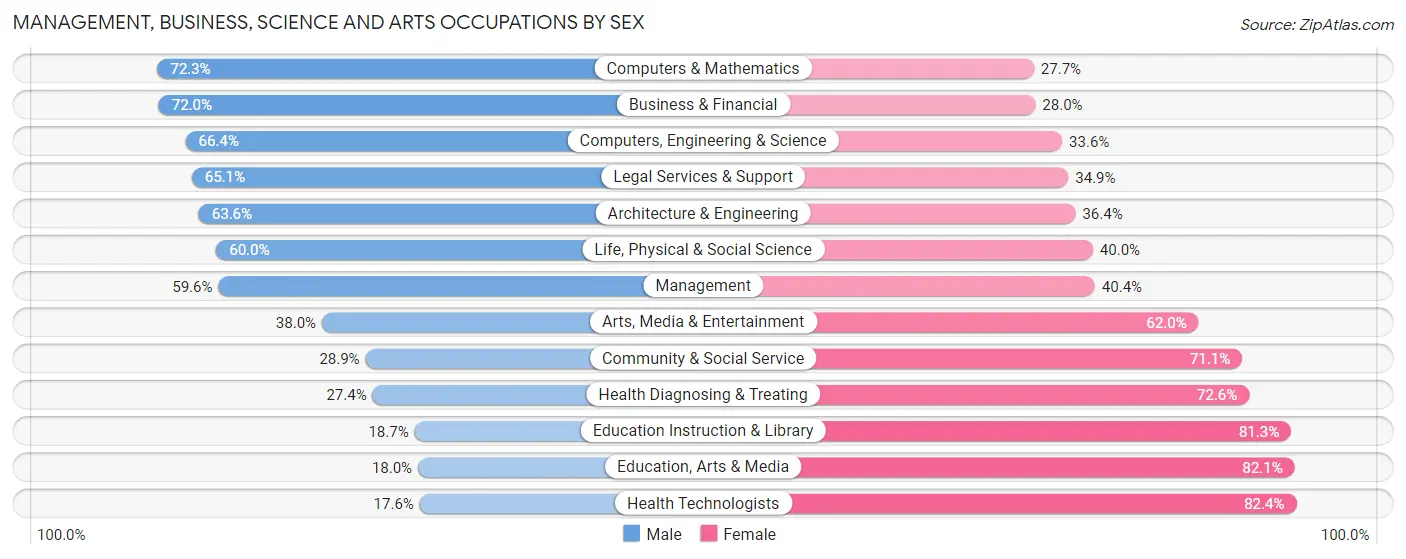
Management, Business, Science and Arts Occupations by Sex
Within the Management, Business, Science and Arts occupations in Marathon, the most male-oriented occupations are Computers & Mathematics (72.3%), Business & Financial (72.0%), and Computers, Engineering & Science (66.4%), while the most female-oriented occupations are Health Technologists (82.4%), Education, Arts & Media (82.1%), and Education Instruction & Library (81.3%).
| Occupation | Male | Female |
| Management | 320 (59.6%) | 217 (40.4%) |
| Business & Financial | 54 (72.0%) | 21 (28.0%) |
| Computers, Engineering & Science | 91 (66.4%) | 46 (33.6%) |
| Computers & Mathematics | 47 (72.3%) | 18 (27.7%) |
| Architecture & Engineering | 14 (63.6%) | 8 (36.4%) |
| Life, Physical & Social Science | 30 (60.0%) | 20 (40.0%) |
| Community & Social Service | 126 (28.9%) | 310 (71.1%) |
| Education, Arts & Media | 7 (17.9%) | 32 (82.1%) |
| Legal Services & Support | 28 (65.1%) | 15 (34.9%) |
| Education Instruction & Library | 42 (18.7%) | 183 (81.3%) |
| Arts, Media & Entertainment | 49 (38.0%) | 80 (62.0%) |
| Health Diagnosing & Treating | 62 (27.4%) | 164 (72.6%) |
| Health Technologists | 35 (17.6%) | 164 (82.4%) |
| Total (Category) | 653 (46.3%) | 758 (53.7%) |
| Total (Overall) | 2,881 (54.7%) | 2,387 (45.3%) |
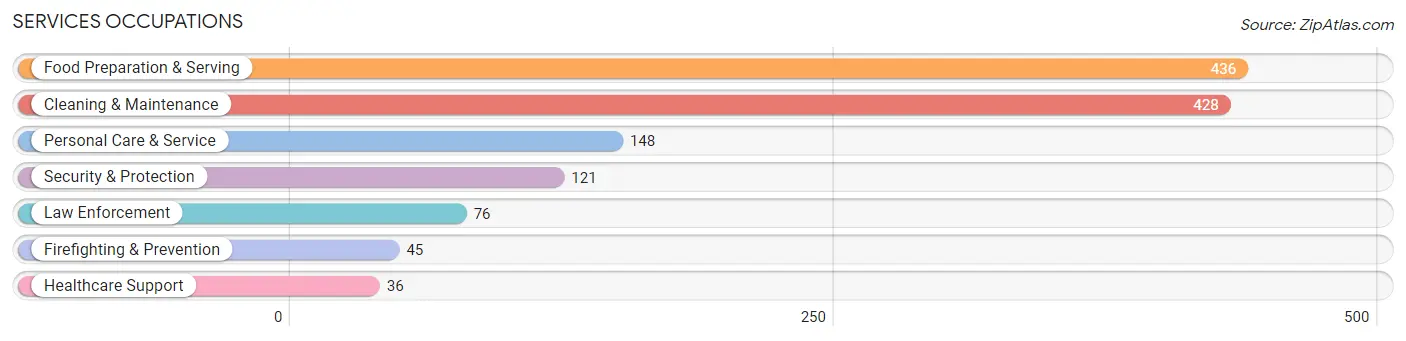
Services Occupations
The most common Services occupations in Marathon are Food Preparation & Serving (436 | 8.3%), Cleaning & Maintenance (428 | 8.1%), Personal Care & Service (148 | 2.8%), Security & Protection (121 | 2.3%), and Law Enforcement (76 | 1.4%).
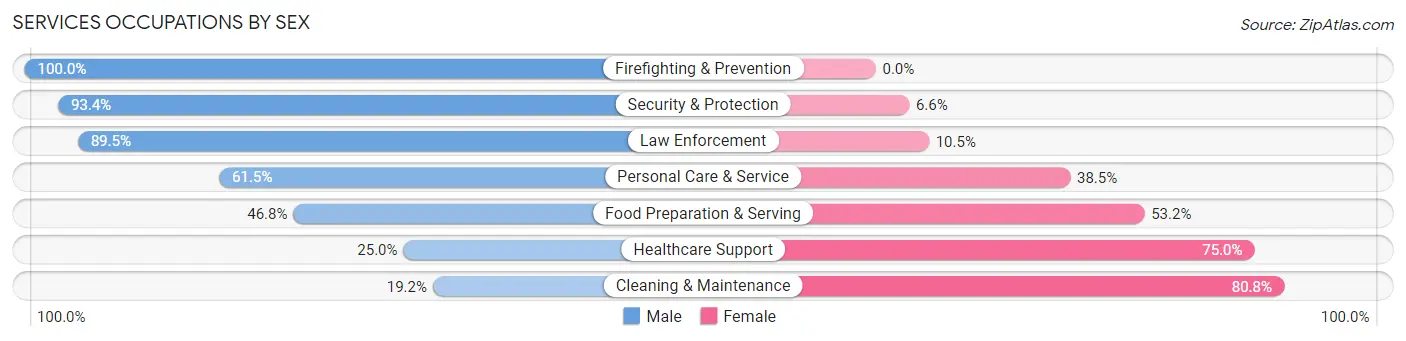
Services Occupations by Sex
Within the Services occupations in Marathon, the most male-oriented occupations are Firefighting & Prevention (100.0%), Security & Protection (93.4%), and Law Enforcement (89.5%), while the most female-oriented occupations are Cleaning & Maintenance (80.8%), Healthcare Support (75.0%), and Food Preparation & Serving (53.2%).
| Occupation | Male | Female |
| Healthcare Support | 9 (25.0%) | 27 (75.0%) |
| Security & Protection | 113 (93.4%) | 8 (6.6%) |
| Firefighting & Prevention | 45 (100.0%) | 0 (0.0%) |
| Law Enforcement | 68 (89.5%) | 8 (10.5%) |
| Food Preparation & Serving | 204 (46.8%) | 232 (53.2%) |
| Cleaning & Maintenance | 82 (19.2%) | 346 (80.8%) |
| Personal Care & Service | 91 (61.5%) | 57 (38.5%) |
| Total (Category) | 499 (42.7%) | 670 (57.3%) |
| Total (Overall) | 2,881 (54.7%) | 2,387 (45.3%) |
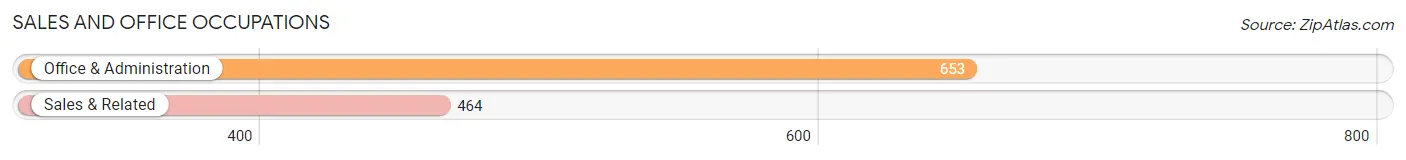
Sales and Office Occupations
The most common Sales and Office occupations in Marathon are Office & Administration (653 | 12.4%), and Sales & Related (464 | 8.8%).
Sales and Office Occupations by Sex
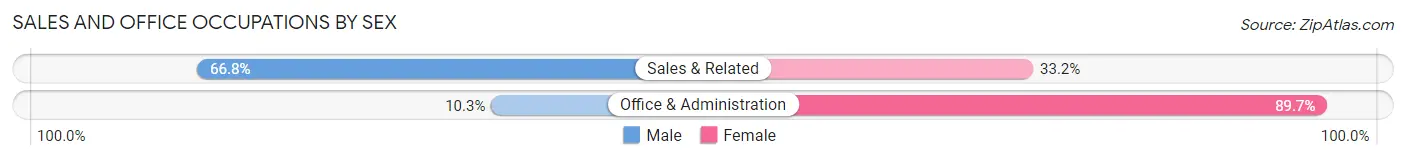
| Occupation | Male | Female |
| Sales & Related | 310 (66.8%) | 154 (33.2%) |
| Office & Administration | 67 (10.3%) | 586 (89.7%) |
| Total (Category) | 377 (33.8%) | 740 (66.2%) |
| Total (Overall) | 2,881 (54.7%) | 2,387 (45.3%) |
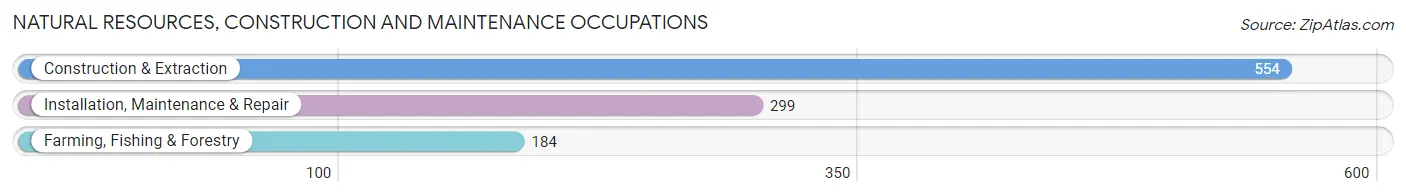
Natural Resources, Construction and Maintenance Occupations
The most common Natural Resources, Construction and Maintenance occupations in Marathon are Construction & Extraction (554 | 10.5%), Installation, Maintenance & Repair (299 | 5.7%), and Farming, Fishing & Forestry (184 | 3.5%).
Natural Resources, Construction and Maintenance Occupations by Sex
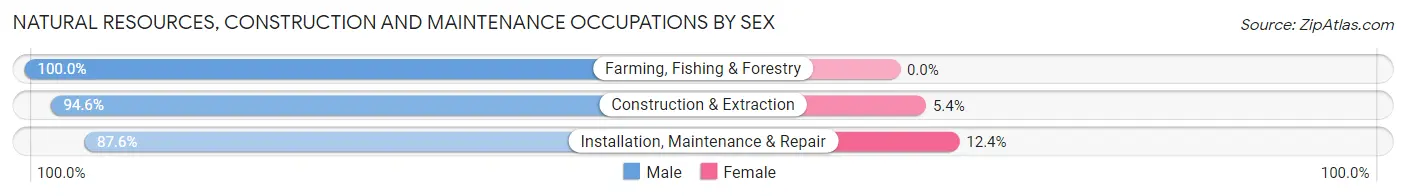
| Occupation | Male | Female |
| Farming, Fishing & Forestry | 184 (100.0%) | 0 (0.0%) |
| Construction & Extraction | 524 (94.6%) | 30 (5.4%) |
| Installation, Maintenance & Repair | 262 (87.6%) | 37 (12.4%) |
| Total (Category) | 970 (93.5%) | 67 (6.5%) |
| Total (Overall) | 2,881 (54.7%) | 2,387 (45.3%) |
Production, Transportation and Moving Occupations
The most common Production, Transportation and Moving occupations in Marathon are Transportation (216 | 4.1%), Material Moving (160 | 3.0%), and Production (158 | 3.0%).
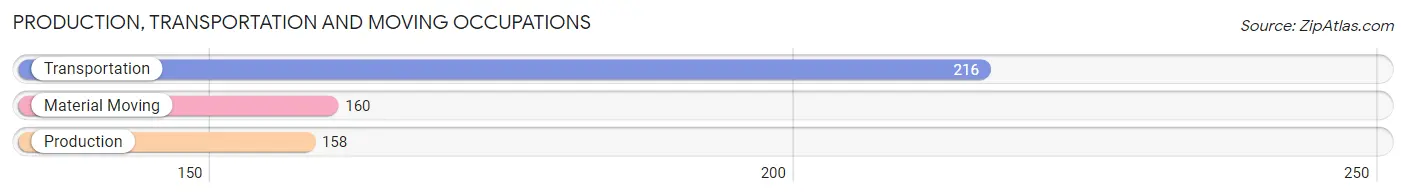
Production, Transportation and Moving Occupations by Sex
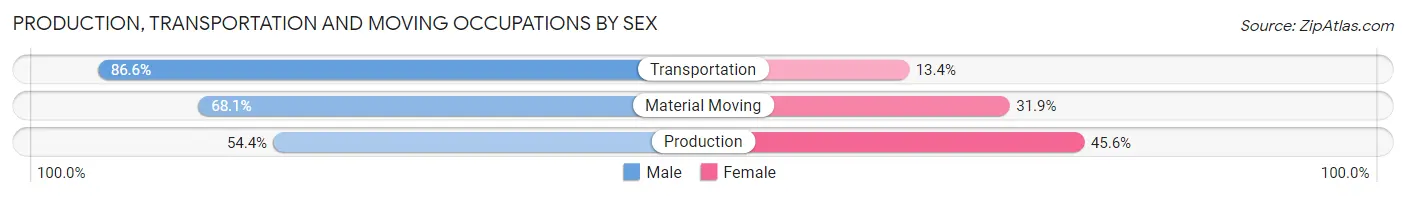
| Occupation | Male | Female |
| Production | 86 (54.4%) | 72 (45.6%) |
| Transportation | 187 (86.6%) | 29 (13.4%) |
| Material Moving | 109 (68.1%) | 51 (31.9%) |
| Total (Category) | 382 (71.5%) | 152 (28.5%) |
| Total (Overall) | 2,881 (54.7%) | 2,387 (45.3%) |
Employment Industries by Sex in Marathon
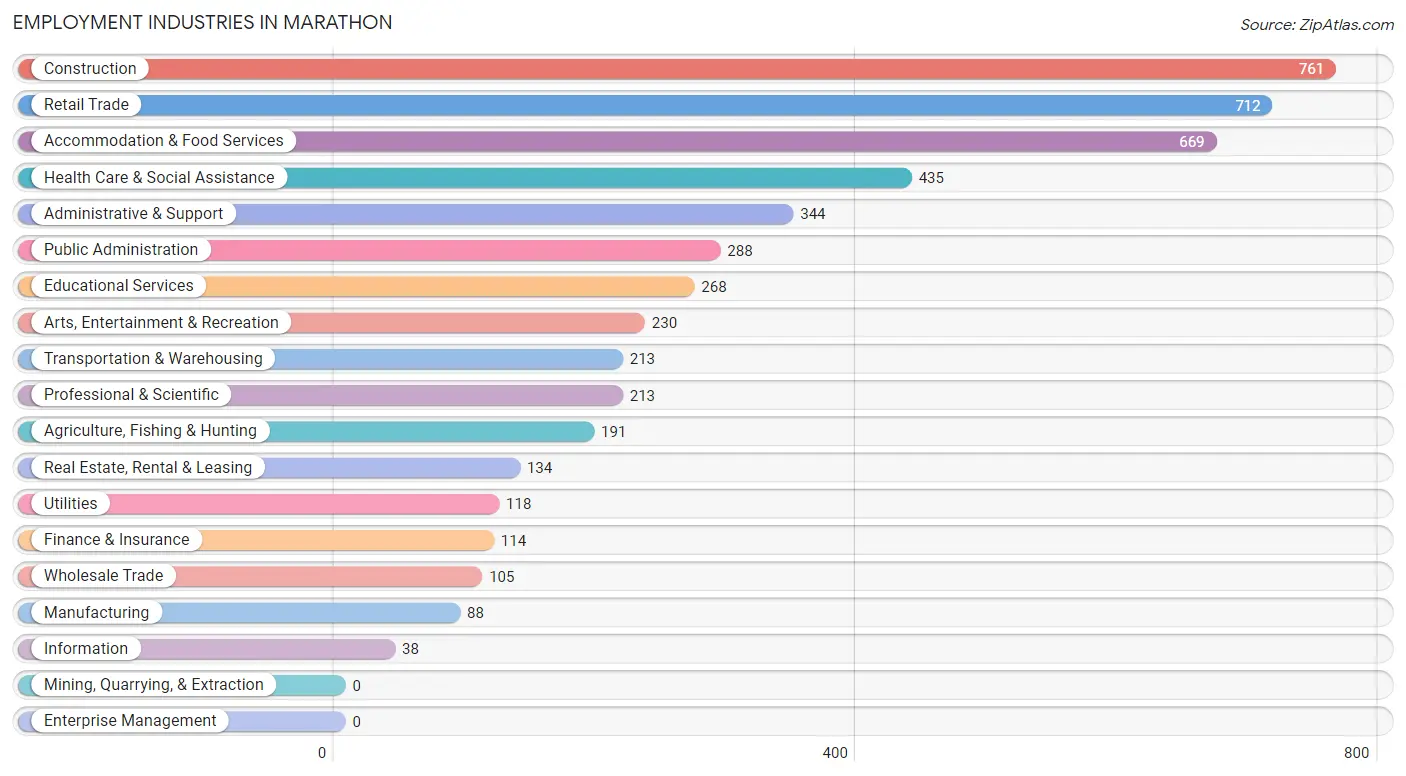
Employment Industries in Marathon
The major employment industries in Marathon include Construction (761 | 14.4%), Retail Trade (712 | 13.5%), Accommodation & Food Services (669 | 12.7%), Health Care & Social Assistance (435 | 8.3%), and Administrative & Support (344 | 6.5%).
Employment Industries by Sex in Marathon
The Marathon industries that see more men than women are Transportation & Warehousing (92.5%), Agriculture, Fishing & Hunting (84.3%), and Utilities (83.9%), whereas the industries that tend to have a higher number of women are Finance & Insurance (86.8%), Health Care & Social Assistance (85.5%), and Educational Services (75.7%).
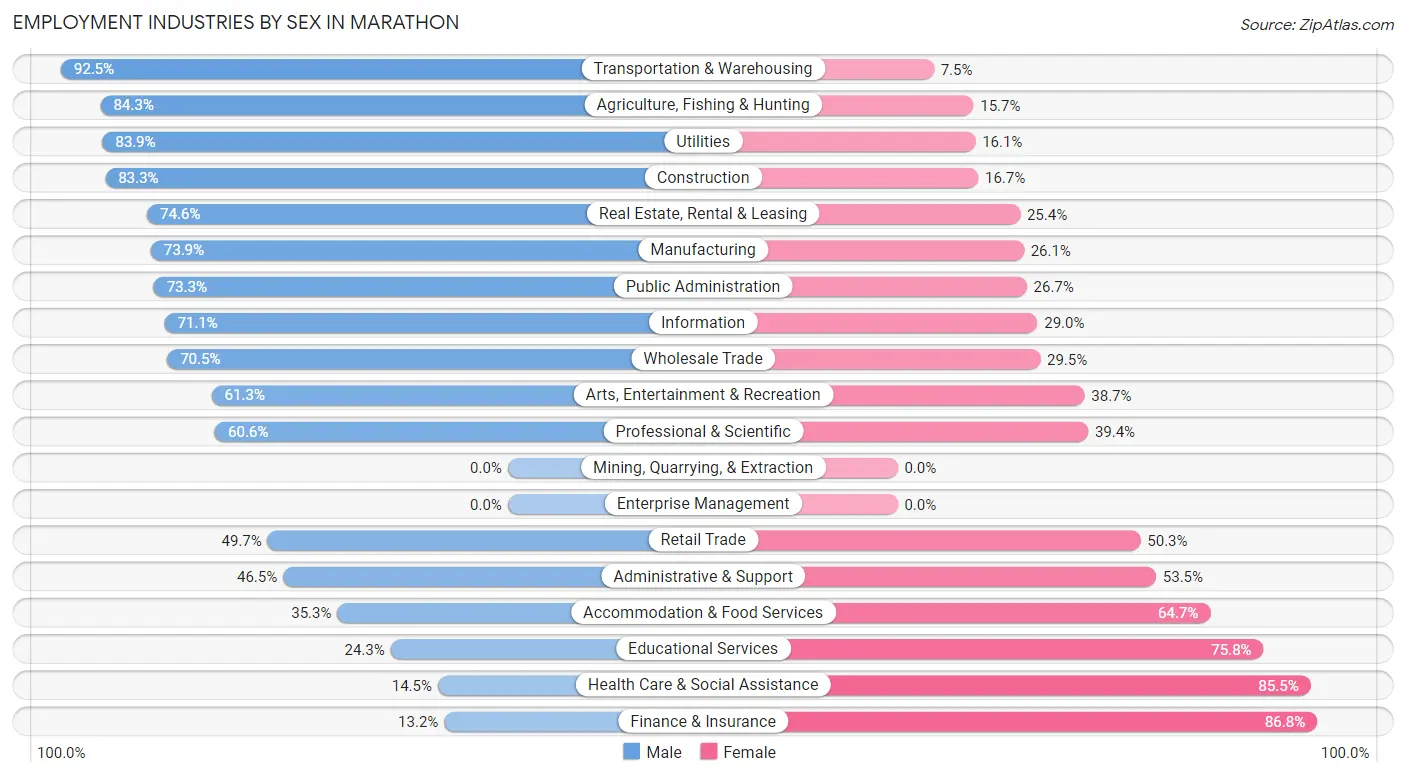
| Industry | Male | Female |
| Agriculture, Fishing & Hunting | 161 (84.3%) | 30 (15.7%) |
| Mining, Quarrying, & Extraction | 0 (0.0%) | 0 (0.0%) |
| Construction | 634 (83.3%) | 127 (16.7%) |
| Manufacturing | 65 (73.9%) | 23 (26.1%) |
| Wholesale Trade | 74 (70.5%) | 31 (29.5%) |
| Retail Trade | 354 (49.7%) | 358 (50.3%) |
| Transportation & Warehousing | 197 (92.5%) | 16 (7.5%) |
| Utilities | 99 (83.9%) | 19 (16.1%) |
| Information | 27 (71.1%) | 11 (28.9%) |
| Finance & Insurance | 15 (13.2%) | 99 (86.8%) |
| Real Estate, Rental & Leasing | 100 (74.6%) | 34 (25.4%) |
| Professional & Scientific | 129 (60.6%) | 84 (39.4%) |
| Enterprise Management | 0 (0.0%) | 0 (0.0%) |
| Administrative & Support | 160 (46.5%) | 184 (53.5%) |
| Educational Services | 65 (24.2%) | 203 (75.7%) |
| Health Care & Social Assistance | 63 (14.5%) | 372 (85.5%) |
| Arts, Entertainment & Recreation | 141 (61.3%) | 89 (38.7%) |
| Accommodation & Food Services | 236 (35.3%) | 433 (64.7%) |
| Public Administration | 211 (73.3%) | 77 (26.7%) |
| Total | 2,881 (54.7%) | 2,387 (45.3%) |
Education in Marathon
School Enrollment in Marathon
The most common levels of schooling among the 1,763 students in Marathon are high school (599 | 34.0%), middle school (521 | 29.5%), and elementary school (302 | 17.1%).
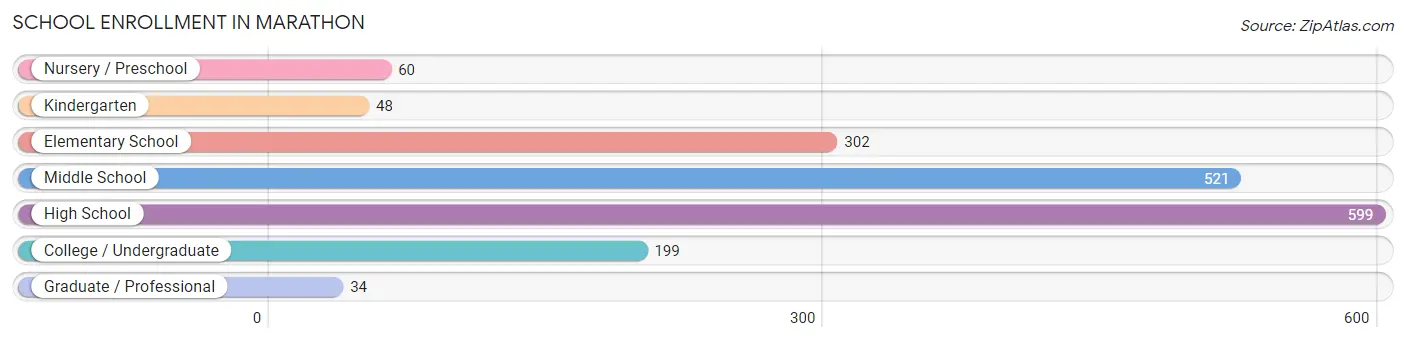
| School Level | # Students | % Students |
| Nursery / Preschool | 60 | 3.4% |
| Kindergarten | 48 | 2.7% |
| Elementary School | 302 | 17.1% |
| Middle School | 521 | 29.5% |
| High School | 599 | 34.0% |
| College / Undergraduate | 199 | 11.3% |
| Graduate / Professional | 34 | 1.9% |
| Total | 1,763 | 100.0% |
School Enrollment by Age by Funding Source in Marathon
Out of a total of 1,763 students who are enrolled in schools in Marathon, 229 (13.0%) attend a private institution, while the remaining 1,534 (87.0%) are enrolled in public schools. The age group of 3 to 4 year olds has the highest likelihood of being enrolled in private schools, with 36 (60.0% in the age bracket) enrolled. Conversely, the age group of 18 to 19 year olds has the lowest likelihood of being enrolled in a private school, with 133 (100.0% in the age bracket) attending a public institution.
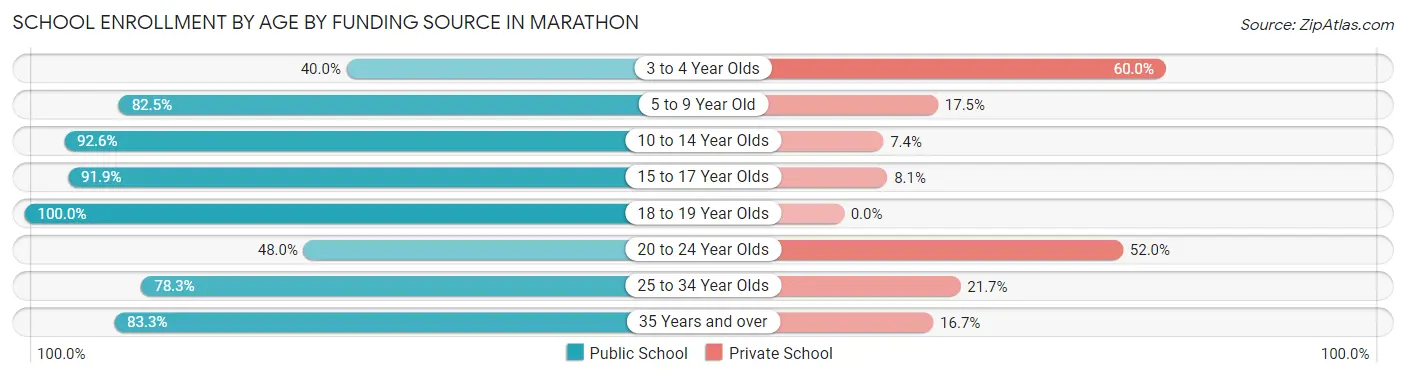
| Age Bracket | Public School | Private School |
| 3 to 4 Year Olds | 24 (40.0%) | 36 (60.0%) |
| 5 to 9 Year Old | 221 (82.5%) | 47 (17.5%) |
| 10 to 14 Year Olds | 604 (92.6%) | 48 (7.4%) |
| 15 to 17 Year Olds | 408 (91.9%) | 36 (8.1%) |
| 18 to 19 Year Olds | 133 (100.0%) | 0 (0.0%) |
| 20 to 24 Year Olds | 36 (48.0%) | 39 (52.0%) |
| 25 to 34 Year Olds | 18 (78.3%) | 5 (21.7%) |
| 35 Years and over | 90 (83.3%) | 18 (16.7%) |
| Total | 1,534 (87.0%) | 229 (13.0%) |
Educational Attainment by Field of Study in Marathon
Business (553 | 23.4%), literature & languages (240 | 10.1%), education (230 | 9.7%), bio, nature & agricultural (208 | 8.8%), and science & technology (203 | 8.6%) are the most common fields of study among 2,368 individuals in Marathon who have obtained a bachelor's degree or higher.
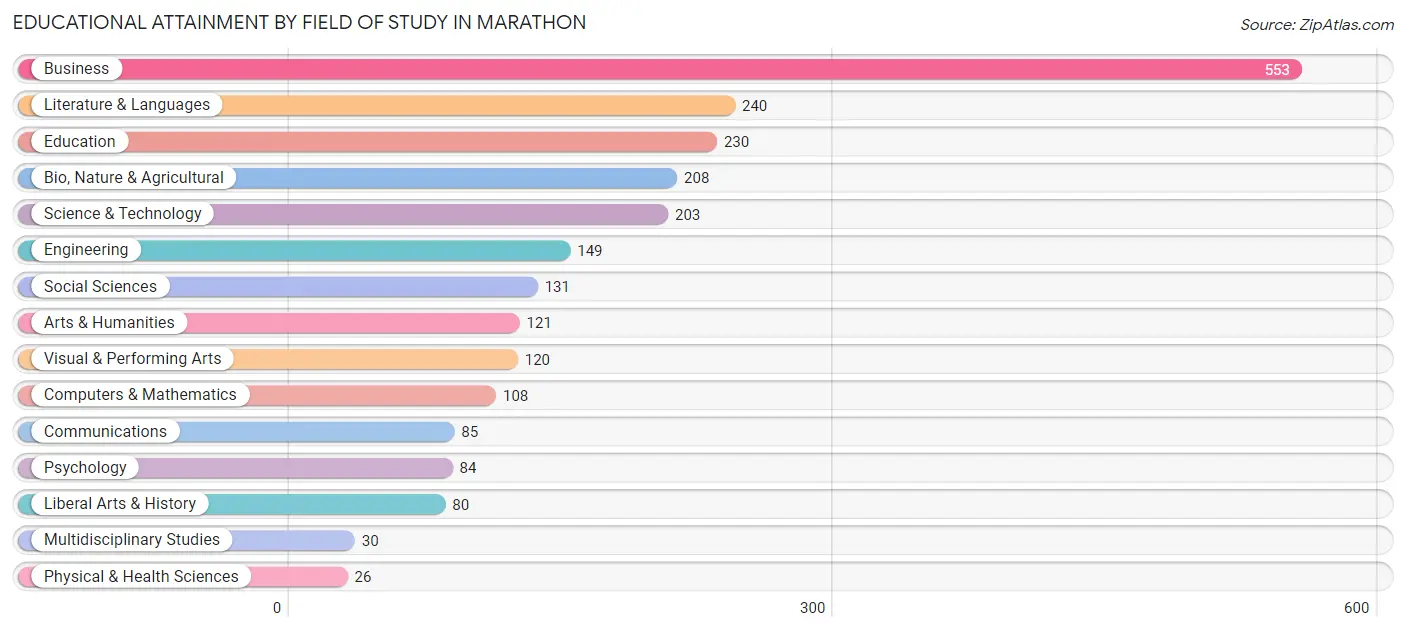
| Field of Study | # Graduates | % Graduates |
| Computers & Mathematics | 108 | 4.6% |
| Bio, Nature & Agricultural | 208 | 8.8% |
| Physical & Health Sciences | 26 | 1.1% |
| Psychology | 84 | 3.5% |
| Social Sciences | 131 | 5.5% |
| Engineering | 149 | 6.3% |
| Multidisciplinary Studies | 30 | 1.3% |
| Science & Technology | 203 | 8.6% |
| Business | 553 | 23.4% |
| Education | 230 | 9.7% |
| Literature & Languages | 240 | 10.1% |
| Liberal Arts & History | 80 | 3.4% |
| Visual & Performing Arts | 120 | 5.1% |
| Communications | 85 | 3.6% |
| Arts & Humanities | 121 | 5.1% |
| Total | 2,368 | 100.0% |
Transportation & Commute in Marathon
Vehicle Availability by Sex in Marathon
The most prevalent vehicle ownership categories in Marathon are males with 2 vehicles (1,347, accounting for 48.3%) and females with 2 vehicles (1,006, making up 57.1%).
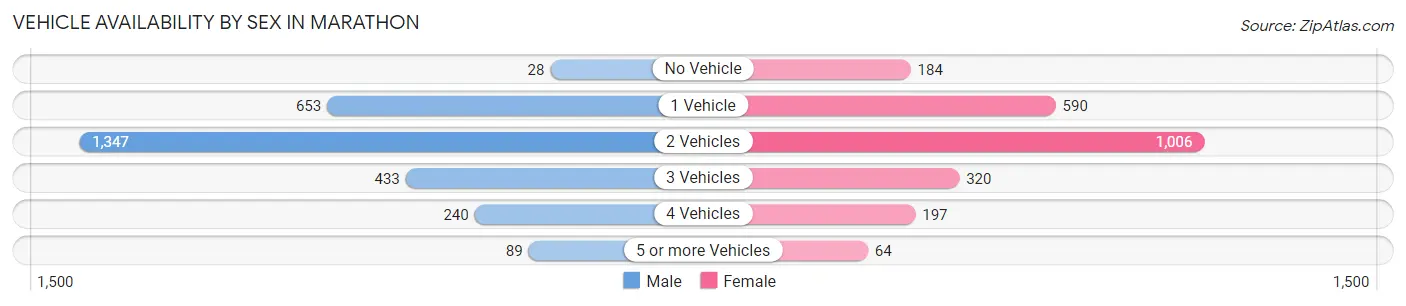
| Vehicles Available | Male | Female |
| No Vehicle | 28 (1.0%) | 184 (7.8%) |
| 1 Vehicle | 653 (23.4%) | 590 (25.0%) |
| 2 Vehicles | 1,347 (48.3%) | 1,006 (42.6%) |
| 3 Vehicles | 433 (15.5%) | 320 (13.6%) |
| 4 Vehicles | 240 (8.6%) | 197 (8.3%) |
| 5 or more Vehicles | 89 (3.2%) | 64 (2.7%) |
| Total | 2,790 (100.0%) | 2,361 (100.0%) |
Commute Time in Marathon
The most frequently occuring commute durations in Marathon are 5 to 9 minutes (1,480 commuters, 31.4%), 10 to 14 minutes (1,221 commuters, 25.9%), and 15 to 19 minutes (628 commuters, 13.3%).
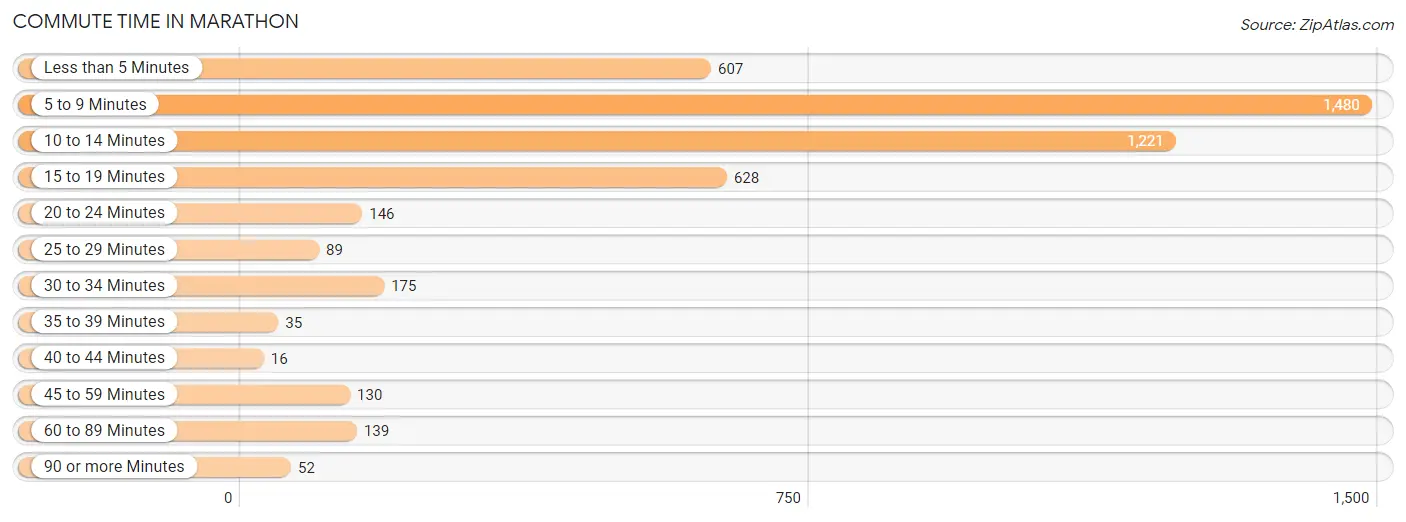
| Commute Time | # Commuters | % Commuters |
| Less than 5 Minutes | 607 | 12.9% |
| 5 to 9 Minutes | 1,480 | 31.4% |
| 10 to 14 Minutes | 1,221 | 25.9% |
| 15 to 19 Minutes | 628 | 13.3% |
| 20 to 24 Minutes | 146 | 3.1% |
| 25 to 29 Minutes | 89 | 1.9% |
| 30 to 34 Minutes | 175 | 3.7% |
| 35 to 39 Minutes | 35 | 0.7% |
| 40 to 44 Minutes | 16 | 0.3% |
| 45 to 59 Minutes | 130 | 2.8% |
| 60 to 89 Minutes | 139 | 2.9% |
| 90 or more Minutes | 52 | 1.1% |
Commute Time by Sex in Marathon
The most common commute times in Marathon are 5 to 9 minutes (718 commuters, 28.2%) for males and 5 to 9 minutes (762 commuters, 35.0%) for females.
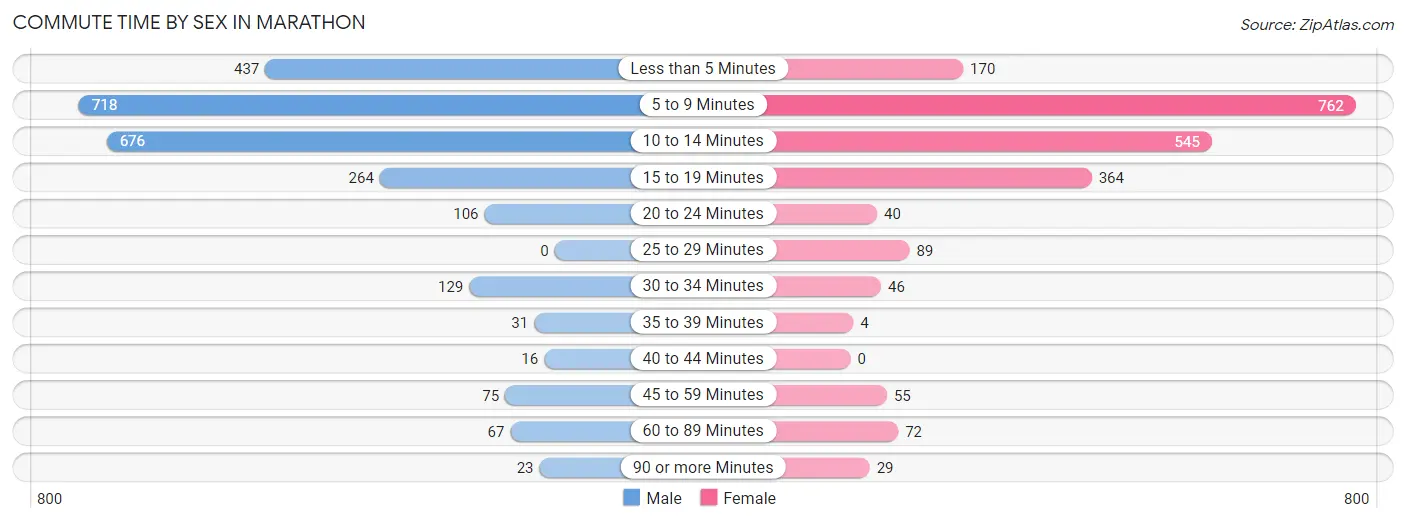
| Commute Time | Male | Female |
| Less than 5 Minutes | 437 (17.2%) | 170 (7.8%) |
| 5 to 9 Minutes | 718 (28.2%) | 762 (35.0%) |
| 10 to 14 Minutes | 676 (26.6%) | 545 (25.1%) |
| 15 to 19 Minutes | 264 (10.4%) | 364 (16.7%) |
| 20 to 24 Minutes | 106 (4.2%) | 40 (1.8%) |
| 25 to 29 Minutes | 0 (0.0%) | 89 (4.1%) |
| 30 to 34 Minutes | 129 (5.1%) | 46 (2.1%) |
| 35 to 39 Minutes | 31 (1.2%) | 4 (0.2%) |
| 40 to 44 Minutes | 16 (0.6%) | 0 (0.0%) |
| 45 to 59 Minutes | 75 (2.9%) | 55 (2.5%) |
| 60 to 89 Minutes | 67 (2.6%) | 72 (3.3%) |
| 90 or more Minutes | 23 (0.9%) | 29 (1.3%) |
Time of Departure to Work by Sex in Marathon
The most frequent times of departure to work in Marathon are 7:30 AM to 7:59 AM (603, 23.7%) for males and 7:30 AM to 7:59 AM (564, 25.9%) for females.
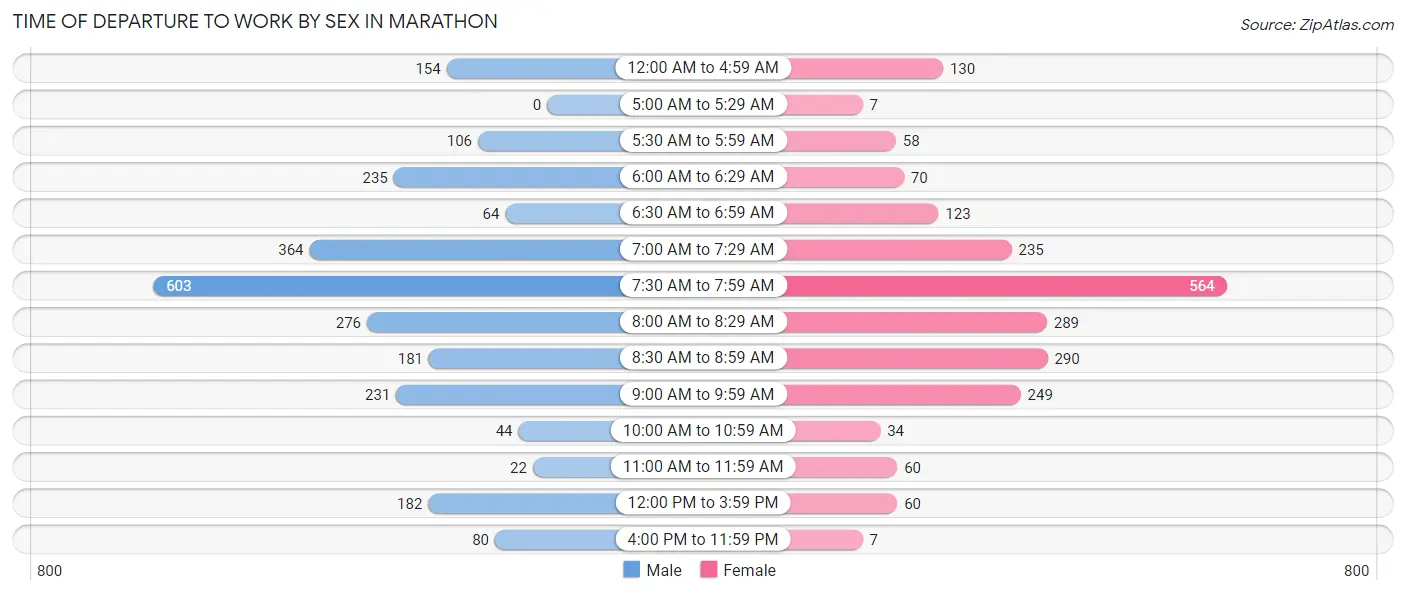
| Time of Departure | Male | Female |
| 12:00 AM to 4:59 AM | 154 (6.1%) | 130 (6.0%) |
| 5:00 AM to 5:29 AM | 0 (0.0%) | 7 (0.3%) |
| 5:30 AM to 5:59 AM | 106 (4.2%) | 58 (2.7%) |
| 6:00 AM to 6:29 AM | 235 (9.2%) | 70 (3.2%) |
| 6:30 AM to 6:59 AM | 64 (2.5%) | 123 (5.7%) |
| 7:00 AM to 7:29 AM | 364 (14.3%) | 235 (10.8%) |
| 7:30 AM to 7:59 AM | 603 (23.7%) | 564 (25.9%) |
| 8:00 AM to 8:29 AM | 276 (10.9%) | 289 (13.3%) |
| 8:30 AM to 8:59 AM | 181 (7.1%) | 290 (13.3%) |
| 9:00 AM to 9:59 AM | 231 (9.1%) | 249 (11.4%) |
| 10:00 AM to 10:59 AM | 44 (1.7%) | 34 (1.6%) |
| 11:00 AM to 11:59 AM | 22 (0.9%) | 60 (2.8%) |
| 12:00 PM to 3:59 PM | 182 (7.2%) | 60 (2.8%) |
| 4:00 PM to 11:59 PM | 80 (3.2%) | 7 (0.3%) |
| Total | 2,542 (100.0%) | 2,176 (100.0%) |
Housing Occupancy in Marathon
Occupancy by Ownership in Marathon
Of the total 3,956 dwellings in Marathon, owner-occupied units account for 2,053 (51.9%), while renter-occupied units make up 1,903 (48.1%).
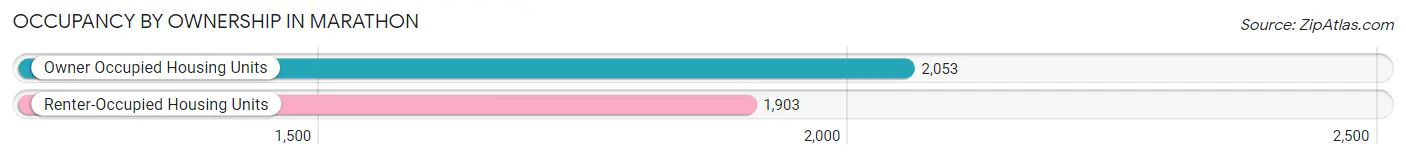
| Occupancy | # Housing Units | % Housing Units |
| Owner Occupied Housing Units | 2,053 | 51.9% |
| Renter-Occupied Housing Units | 1,903 | 48.1% |
| Total Occupied Housing Units | 3,956 | 100.0% |
Occupancy by Household Size in Marathon
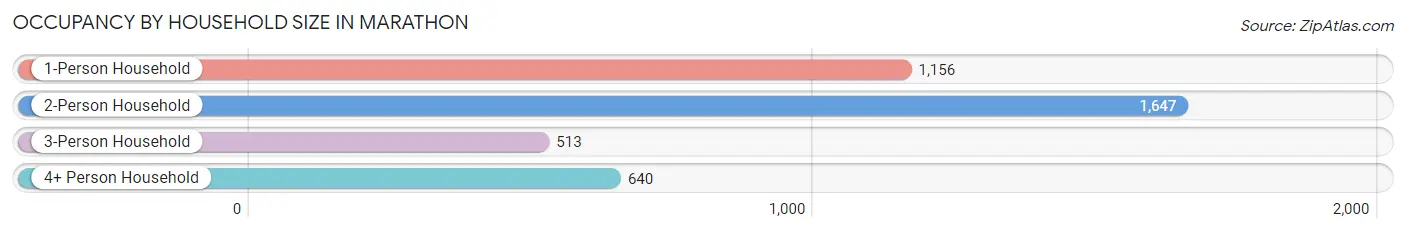
| Household Size | # Housing Units | % Housing Units |
| 1-Person Household | 1,156 | 29.2% |
| 2-Person Household | 1,647 | 41.6% |
| 3-Person Household | 513 | 13.0% |
| 4+ Person Household | 640 | 16.2% |
| Total Housing Units | 3,956 | 100.0% |
Occupancy by Ownership by Household Size in Marathon
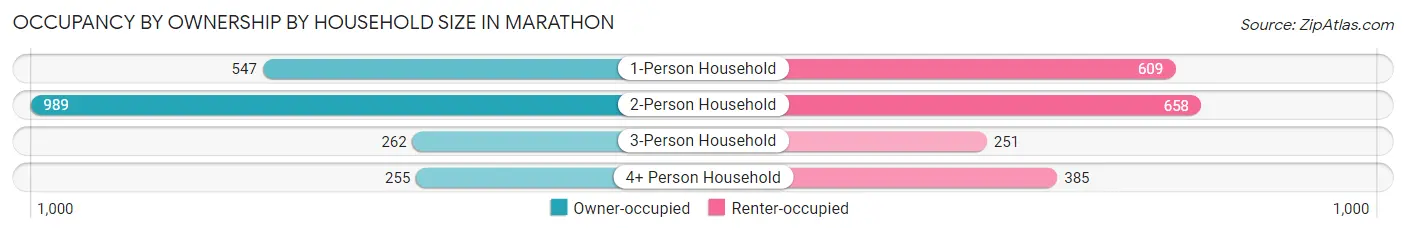
| Household Size | Owner-occupied | Renter-occupied |
| 1-Person Household | 547 (47.3%) | 609 (52.7%) |
| 2-Person Household | 989 (60.1%) | 658 (40.0%) |
| 3-Person Household | 262 (51.1%) | 251 (48.9%) |
| 4+ Person Household | 255 (39.8%) | 385 (60.2%) |
| Total Housing Units | 2,053 (51.9%) | 1,903 (48.1%) |
Occupancy by Educational Attainment in Marathon
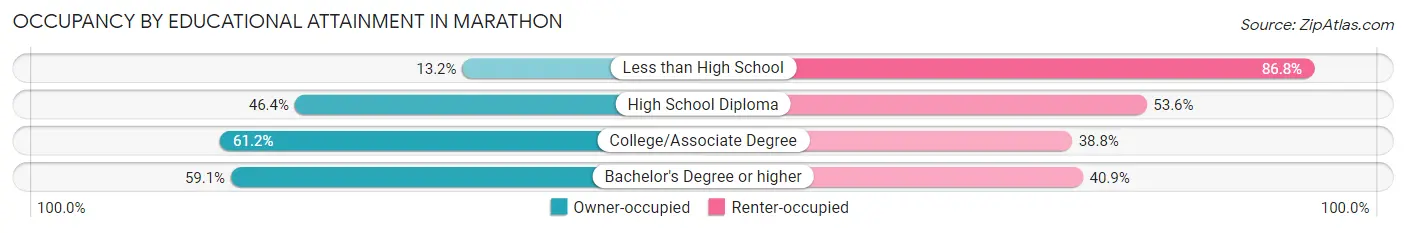
| Household Size | Owner-occupied | Renter-occupied |
| Less than High School | 49 (13.2%) | 322 (86.8%) |
| High School Diploma | 514 (46.4%) | 593 (53.6%) |
| College/Associate Degree | 739 (61.2%) | 468 (38.8%) |
| Bachelor's Degree or higher | 751 (59.1%) | 520 (40.9%) |
Occupancy by Age of Householder in Marathon
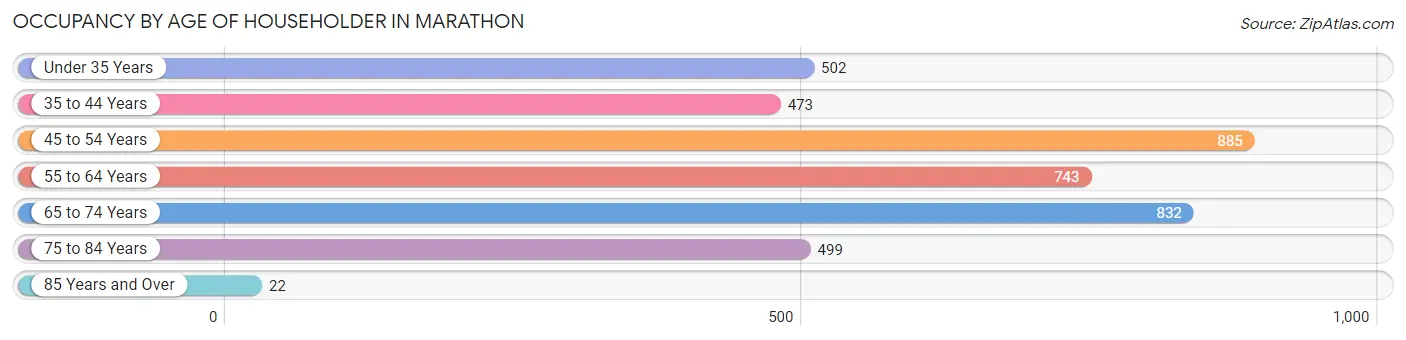
| Age Bracket | # Households | % Households |
| Under 35 Years | 502 | 12.7% |
| 35 to 44 Years | 473 | 12.0% |
| 45 to 54 Years | 885 | 22.4% |
| 55 to 64 Years | 743 | 18.8% |
| 65 to 74 Years | 832 | 21.0% |
| 75 to 84 Years | 499 | 12.6% |
| 85 Years and Over | 22 | 0.6% |
| Total | 3,956 | 100.0% |
Housing Finances in Marathon
Median Income by Occupancy in Marathon
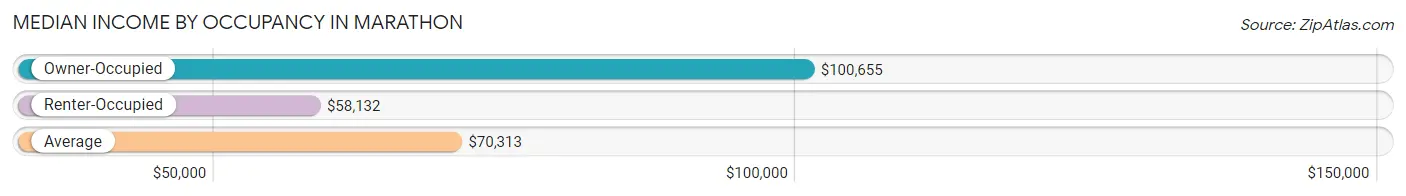
| Occupancy Type | # Households | Median Income |
| Owner-Occupied | 2,053 (51.9%) | $100,655 |
| Renter-Occupied | 1,903 (48.1%) | $58,132 |
| Average | 3,956 (100.0%) | $70,313 |
Occupancy by Householder Income Bracket in Marathon
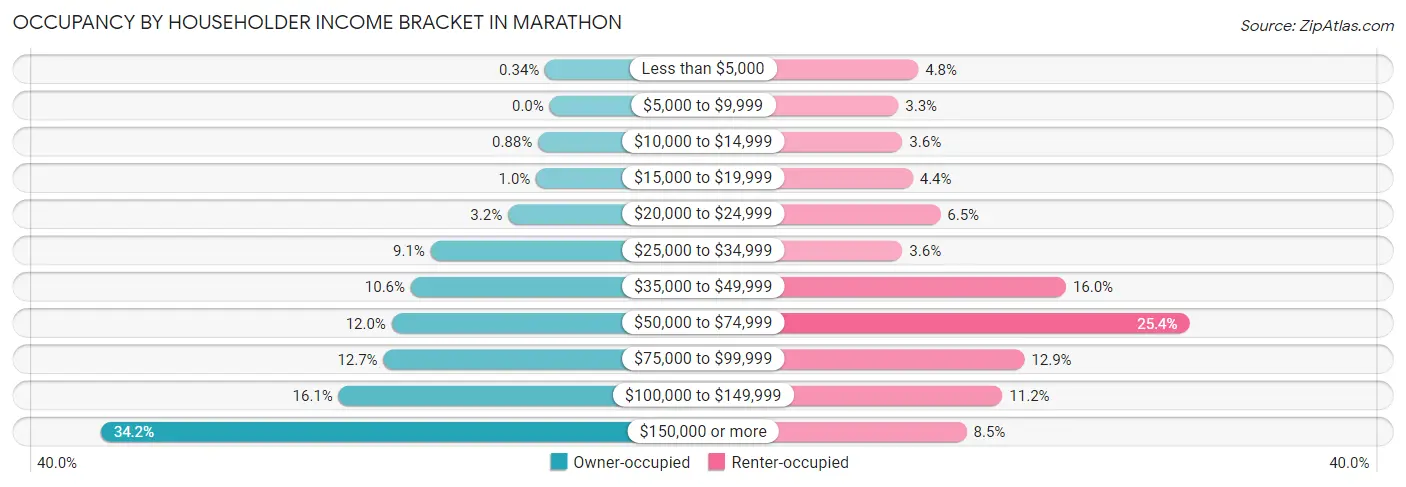
| Income Bracket | Owner-occupied | Renter-occupied |
| Less than $5,000 | 7 (0.3%) | 91 (4.8%) |
| $5,000 to $9,999 | 0 (0.0%) | 62 (3.3%) |
| $10,000 to $14,999 | 18 (0.9%) | 68 (3.6%) |
| $15,000 to $19,999 | 21 (1.0%) | 83 (4.4%) |
| $20,000 to $24,999 | 65 (3.2%) | 123 (6.5%) |
| $25,000 to $34,999 | 186 (9.1%) | 68 (3.6%) |
| $35,000 to $49,999 | 217 (10.6%) | 305 (16.0%) |
| $50,000 to $74,999 | 247 (12.0%) | 484 (25.4%) |
| $75,000 to $99,999 | 260 (12.7%) | 245 (12.9%) |
| $100,000 to $149,999 | 330 (16.1%) | 213 (11.2%) |
| $150,000 or more | 702 (34.2%) | 161 (8.5%) |
| Total | 2,053 (100.0%) | 1,903 (100.0%) |
Monthly Housing Cost Tiers in Marathon
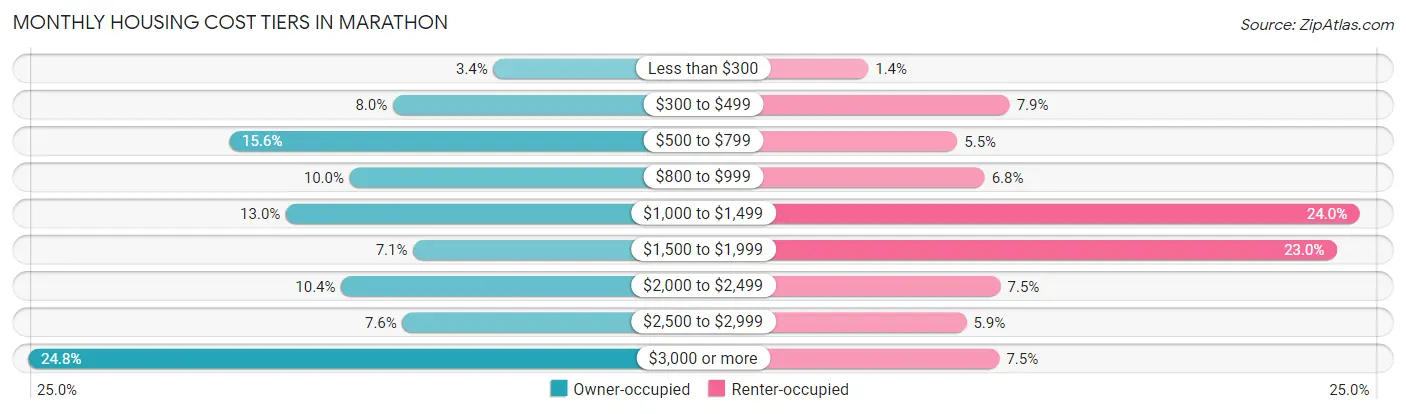
| Monthly Cost | Owner-occupied | Renter-occupied |
| Less than $300 | 70 (3.4%) | 27 (1.4%) |
| $300 to $499 | 165 (8.0%) | 151 (7.9%) |
| $500 to $799 | 320 (15.6%) | 105 (5.5%) |
| $800 to $999 | 206 (10.0%) | 129 (6.8%) |
| $1,000 to $1,499 | 266 (13.0%) | 457 (24.0%) |
| $1,500 to $1,999 | 146 (7.1%) | 437 (23.0%) |
| $2,000 to $2,499 | 214 (10.4%) | 143 (7.5%) |
| $2,500 to $2,999 | 156 (7.6%) | 113 (5.9%) |
| $3,000 or more | 510 (24.8%) | 142 (7.5%) |
| Total | 2,053 (100.0%) | 1,903 (100.0%) |
Physical Housing Characteristics in Marathon
Housing Structures in Marathon
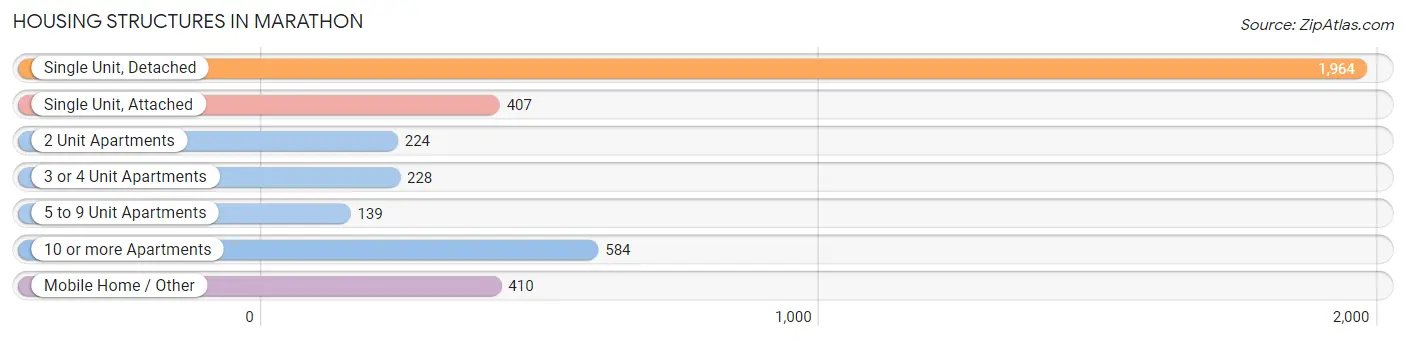
| Structure Type | # Housing Units | % Housing Units |
| Single Unit, Detached | 1,964 | 49.6% |
| Single Unit, Attached | 407 | 10.3% |
| 2 Unit Apartments | 224 | 5.7% |
| 3 or 4 Unit Apartments | 228 | 5.8% |
| 5 to 9 Unit Apartments | 139 | 3.5% |
| 10 or more Apartments | 584 | 14.8% |
| Mobile Home / Other | 410 | 10.4% |
| Total | 3,956 | 100.0% |
Housing Structures by Occupancy in Marathon
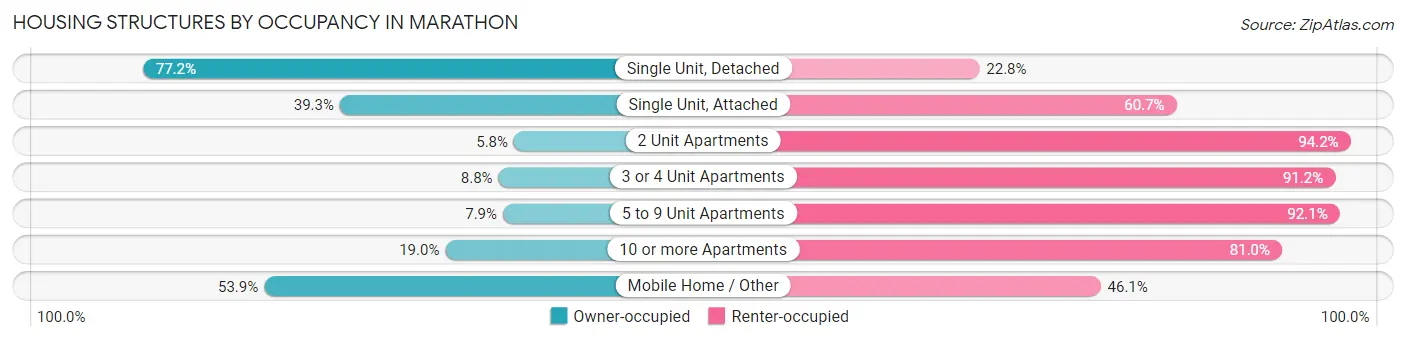
| Structure Type | Owner-occupied | Renter-occupied |
| Single Unit, Detached | 1,517 (77.2%) | 447 (22.8%) |
| Single Unit, Attached | 160 (39.3%) | 247 (60.7%) |
| 2 Unit Apartments | 13 (5.8%) | 211 (94.2%) |
| 3 or 4 Unit Apartments | 20 (8.8%) | 208 (91.2%) |
| 5 to 9 Unit Apartments | 11 (7.9%) | 128 (92.1%) |
| 10 or more Apartments | 111 (19.0%) | 473 (81.0%) |
| Mobile Home / Other | 221 (53.9%) | 189 (46.1%) |
| Total | 2,053 (51.9%) | 1,903 (48.1%) |
Housing Structures by Number of Rooms in Marathon
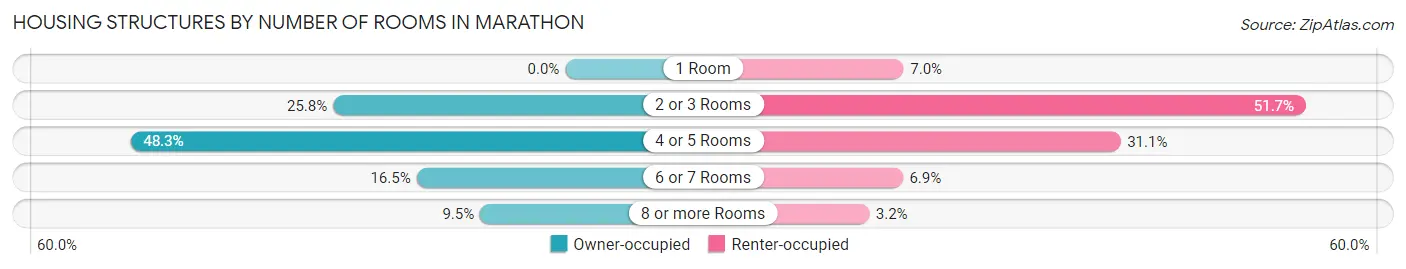
| Number of Rooms | Owner-occupied | Renter-occupied |
| 1 Room | 0 (0.0%) | 134 (7.0%) |
| 2 or 3 Rooms | 529 (25.8%) | 984 (51.7%) |
| 4 or 5 Rooms | 991 (48.3%) | 592 (31.1%) |
| 6 or 7 Rooms | 339 (16.5%) | 132 (6.9%) |
| 8 or more Rooms | 194 (9.5%) | 61 (3.2%) |
| Total | 2,053 (100.0%) | 1,903 (100.0%) |
Housing Structure by Heating Type in Marathon
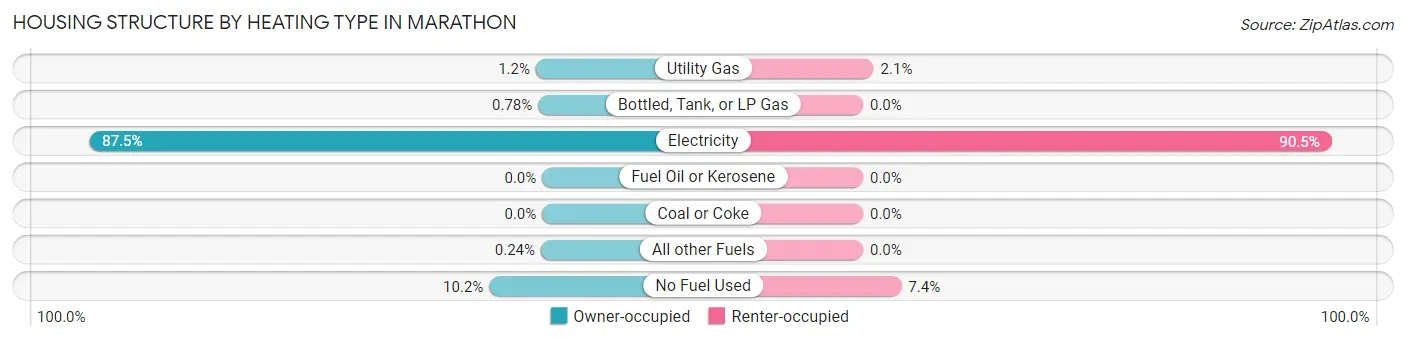
| Heating Type | Owner-occupied | Renter-occupied |
| Utility Gas | 25 (1.2%) | 39 (2.1%) |
| Bottled, Tank, or LP Gas | 16 (0.8%) | 0 (0.0%) |
| Electricity | 1,797 (87.5%) | 1,723 (90.5%) |
| Fuel Oil or Kerosene | 0 (0.0%) | 0 (0.0%) |
| Coal or Coke | 0 (0.0%) | 0 (0.0%) |
| All other Fuels | 5 (0.2%) | 0 (0.0%) |
| No Fuel Used | 210 (10.2%) | 141 (7.4%) |
| Total | 2,053 (100.0%) | 1,903 (100.0%) |
Household Vehicle Usage in Marathon
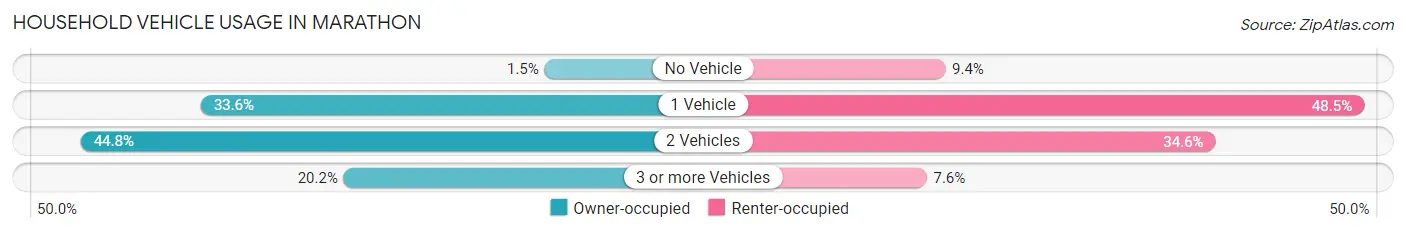
| Vehicles per Household | Owner-occupied | Renter-occupied |
| No Vehicle | 30 (1.5%) | 178 (9.3%) |
| 1 Vehicle | 689 (33.6%) | 922 (48.4%) |
| 2 Vehicles | 919 (44.8%) | 658 (34.6%) |
| 3 or more Vehicles | 415 (20.2%) | 145 (7.6%) |
| Total | 2,053 (100.0%) | 1,903 (100.0%) |
Real Estate & Mortgages in Marathon
Real Estate and Mortgage Overview in Marathon
| Characteristic | Without Mortgage | With Mortgage |
| Housing Units | 1,123 | 930 |
| Median Property Value | $642,700 | $646,700 |
| Median Household Income | $76,875 | $442 |
| Monthly Housing Costs | $808 | $482 |
| Real Estate Taxes | $3,435 | $19 |
Property Value by Mortgage Status in Marathon
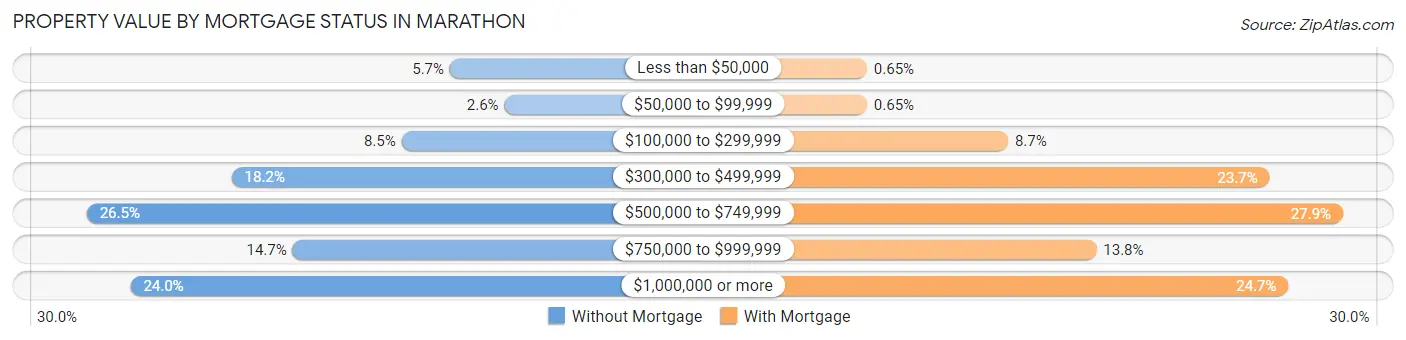
| Property Value | Without Mortgage | With Mortgage |
| Less than $50,000 | 64 (5.7%) | 6 (0.6%) |
| $50,000 to $99,999 | 29 (2.6%) | 6 (0.6%) |
| $100,000 to $299,999 | 95 (8.5%) | 81 (8.7%) |
| $300,000 to $499,999 | 204 (18.2%) | 220 (23.7%) |
| $500,000 to $749,999 | 297 (26.5%) | 259 (27.9%) |
| $750,000 to $999,999 | 165 (14.7%) | 128 (13.8%) |
| $1,000,000 or more | 269 (23.9%) | 230 (24.7%) |
| Total | 1,123 (100.0%) | 930 (100.0%) |
Household Income by Mortgage Status in Marathon
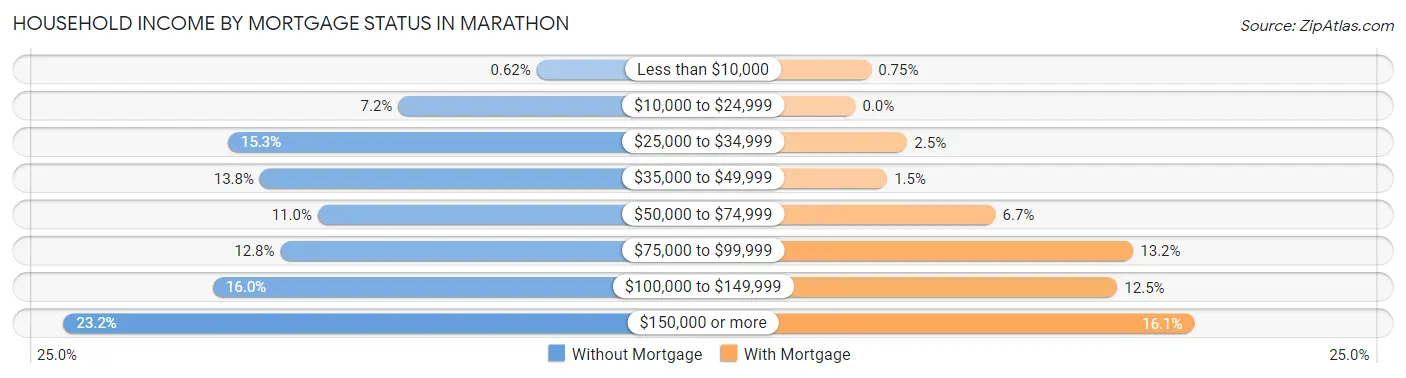
| Household Income | Without Mortgage | With Mortgage |
| Less than $10,000 | 7 (0.6%) | 7 (0.7%) |
| $10,000 to $24,999 | 81 (7.2%) | 0 (0.0%) |
| $25,000 to $34,999 | 172 (15.3%) | 23 (2.5%) |
| $35,000 to $49,999 | 155 (13.8%) | 14 (1.5%) |
| $50,000 to $74,999 | 124 (11.0%) | 62 (6.7%) |
| $75,000 to $99,999 | 144 (12.8%) | 123 (13.2%) |
| $100,000 to $149,999 | 180 (16.0%) | 116 (12.5%) |
| $150,000 or more | 260 (23.2%) | 150 (16.1%) |
| Total | 1,123 (100.0%) | 930 (100.0%) |
Property Value to Household Income Ratio in Marathon
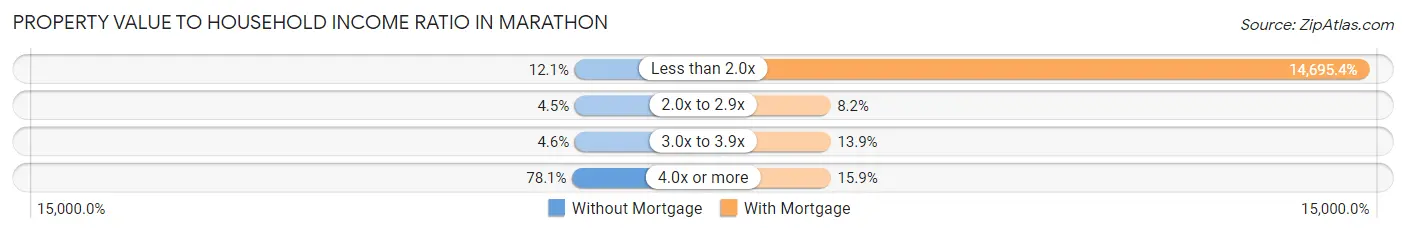
| Value-to-Income Ratio | Without Mortgage | With Mortgage |
| Less than 2.0x | 136 (12.1%) | 136,667 (14,695.4%) |
| 2.0x to 2.9x | 51 (4.5%) | 76 (8.2%) |
| 3.0x to 3.9x | 52 (4.6%) | 129 (13.9%) |
| 4.0x or more | 877 (78.1%) | 148 (15.9%) |
| Total | 1,123 (100.0%) | 930 (100.0%) |
Real Estate Taxes by Mortgage Status in Marathon
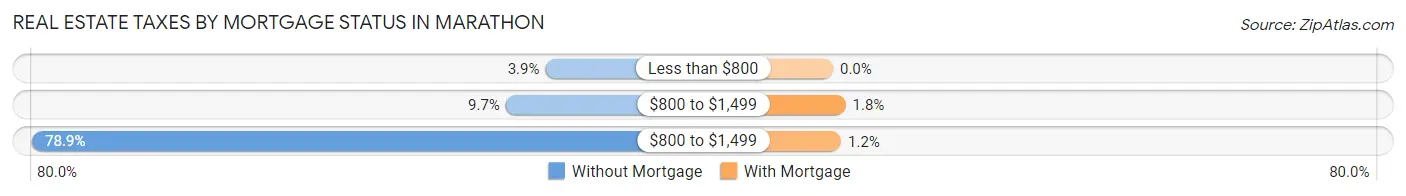
| Property Taxes | Without Mortgage | With Mortgage |
| Less than $800 | 44 (3.9%) | 0 (0.0%) |
| $800 to $1,499 | 109 (9.7%) | 17 (1.8%) |
| $800 to $1,499 | 886 (78.9%) | 11 (1.2%) |
| Total | 1,123 (100.0%) | 930 (100.0%) |
Health & Disability in Marathon
Health Insurance Coverage by Age in Marathon
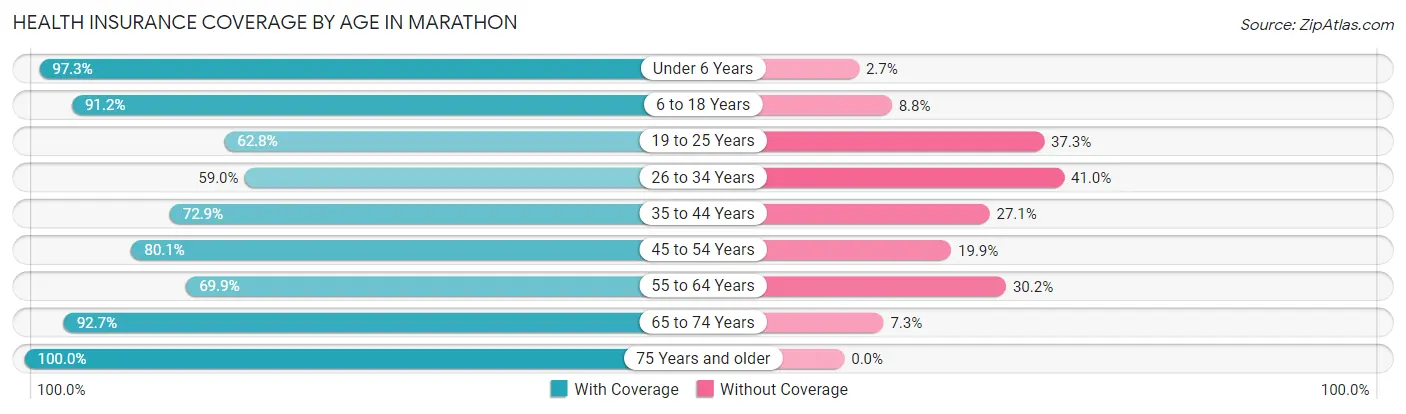
| Age Bracket | With Coverage | Without Coverage |
| Under 6 Years | 461 (97.3%) | 13 (2.7%) |
| 6 to 18 Years | 1,403 (91.2%) | 136 (8.8%) |
| 19 to 25 Years | 374 (62.7%) | 222 (37.2%) |
| 26 to 34 Years | 484 (59.0%) | 336 (41.0%) |
| 35 to 44 Years | 856 (72.9%) | 318 (27.1%) |
| 45 to 54 Years | 1,274 (80.1%) | 317 (19.9%) |
| 55 to 64 Years | 1,001 (69.9%) | 432 (30.1%) |
| 65 to 74 Years | 1,231 (92.7%) | 97 (7.3%) |
| 75 Years and older | 742 (100.0%) | 0 (0.0%) |
| Total | 7,826 (80.7%) | 1,871 (19.3%) |
Health Insurance Coverage by Citizenship Status in Marathon
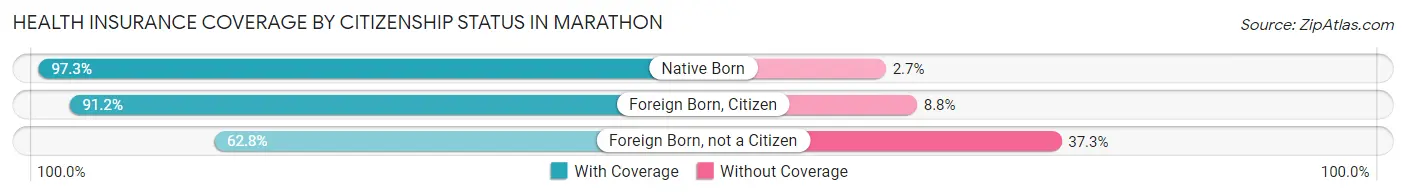
| Citizenship Status | With Coverage | Without Coverage |
| Native Born | 461 (97.3%) | 13 (2.7%) |
| Foreign Born, Citizen | 1,403 (91.2%) | 136 (8.8%) |
| Foreign Born, not a Citizen | 374 (62.7%) | 222 (37.2%) |
Health Insurance Coverage by Household Income in Marathon
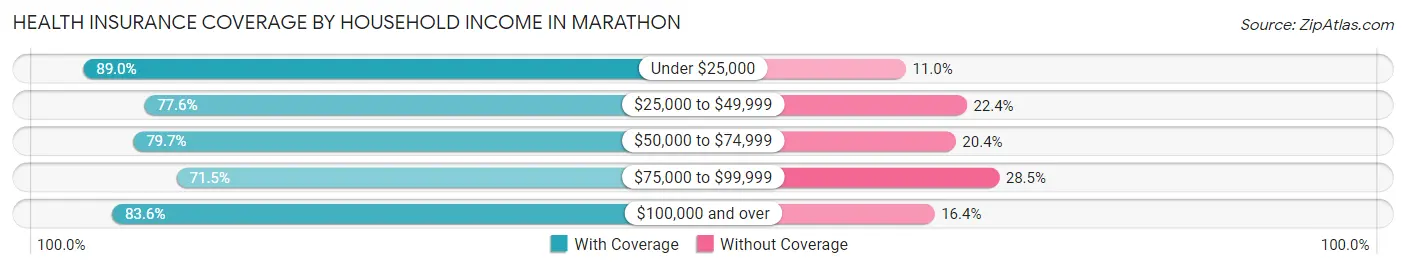
| Household Income | With Coverage | Without Coverage |
| Under $25,000 | 808 (89.0%) | 100 (11.0%) |
| $25,000 to $49,999 | 1,083 (77.6%) | 313 (22.4%) |
| $50,000 to $74,999 | 1,374 (79.6%) | 351 (20.3%) |
| $75,000 to $99,999 | 1,095 (71.5%) | 436 (28.5%) |
| $100,000 and over | 3,426 (83.6%) | 671 (16.4%) |
Public vs Private Health Insurance Coverage by Age in Marathon
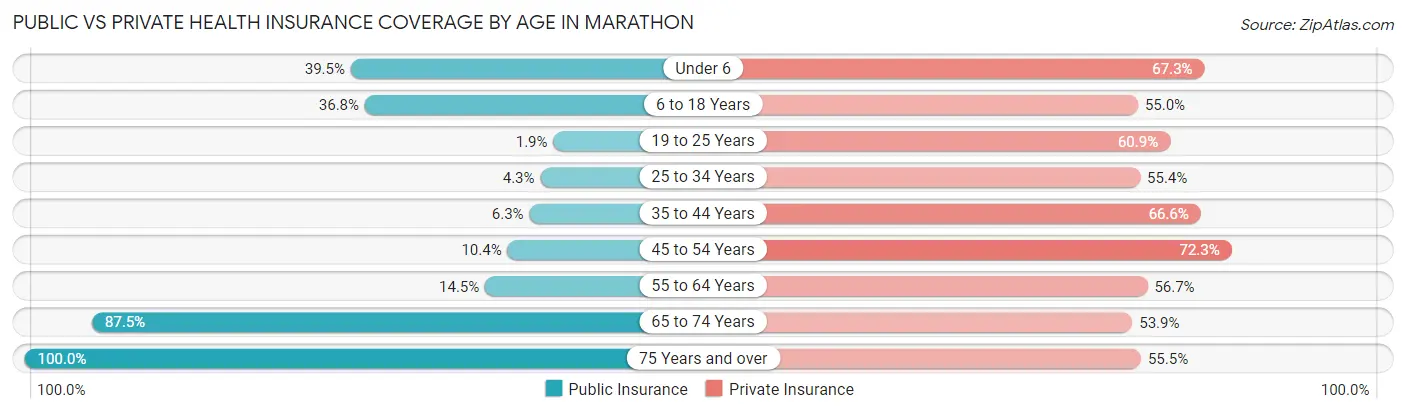
| Age Bracket | Public Insurance | Private Insurance |
| Under 6 | 187 (39.5%) | 319 (67.3%) |
| 6 to 18 Years | 567 (36.8%) | 846 (55.0%) |
| 19 to 25 Years | 11 (1.8%) | 363 (60.9%) |
| 25 to 34 Years | 35 (4.3%) | 454 (55.4%) |
| 35 to 44 Years | 74 (6.3%) | 782 (66.6%) |
| 45 to 54 Years | 165 (10.4%) | 1,151 (72.3%) |
| 55 to 64 Years | 208 (14.5%) | 813 (56.7%) |
| 65 to 74 Years | 1,162 (87.5%) | 716 (53.9%) |
| 75 Years and over | 742 (100.0%) | 412 (55.5%) |
| Total | 3,151 (32.5%) | 5,856 (60.4%) |
Disability Status by Sex by Age in Marathon
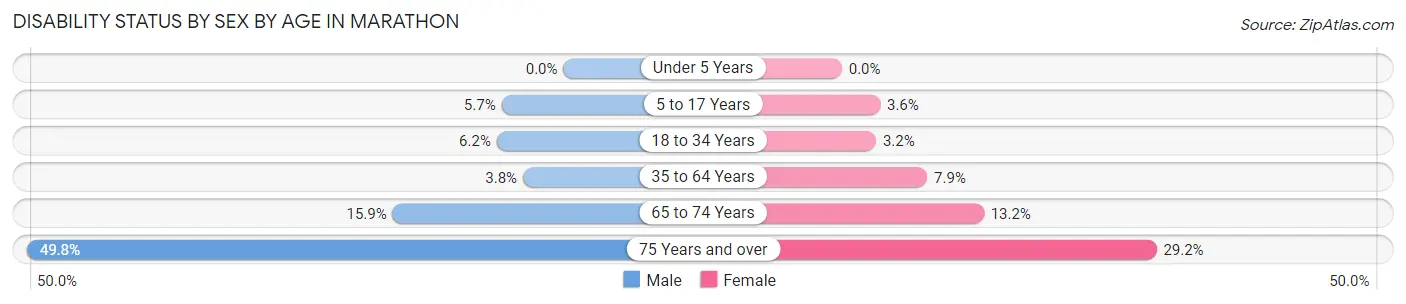
| Age Bracket | Male | Female |
| Under 5 Years | 0 (0.0%) | 0 (0.0%) |
| 5 to 17 Years | 47 (5.7%) | 21 (3.5%) |
| 18 to 34 Years | 50 (6.2%) | 24 (3.2%) |
| 35 to 64 Years | 77 (3.7%) | 170 (7.9%) |
| 65 to 74 Years | 113 (15.9%) | 81 (13.2%) |
| 75 Years and over | 233 (49.8%) | 80 (29.2%) |
Disability Class by Sex by Age in Marathon
Disability Class: Hearing Difficulty
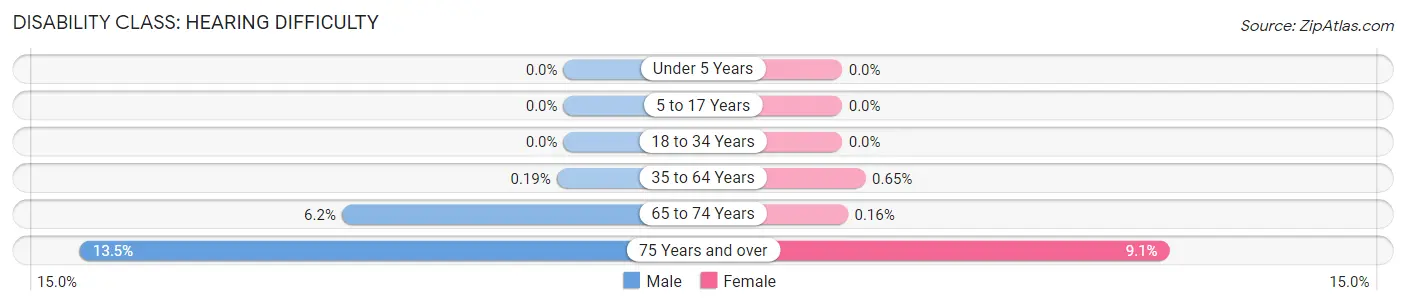
| Age Bracket | Male | Female |
| Under 5 Years | 0 (0.0%) | 0 (0.0%) |
| 5 to 17 Years | 0 (0.0%) | 0 (0.0%) |
| 18 to 34 Years | 0 (0.0%) | 0 (0.0%) |
| 35 to 64 Years | 4 (0.2%) | 14 (0.6%) |
| 65 to 74 Years | 44 (6.2%) | 1 (0.2%) |
| 75 Years and over | 63 (13.5%) | 25 (9.1%) |
Disability Class: Vision Difficulty
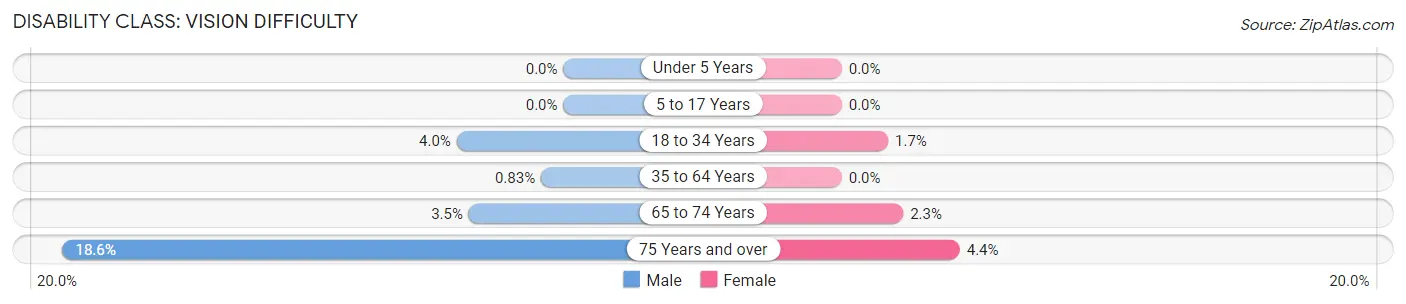
| Age Bracket | Male | Female |
| Under 5 Years | 0 (0.0%) | 0 (0.0%) |
| 5 to 17 Years | 0 (0.0%) | 0 (0.0%) |
| 18 to 34 Years | 32 (4.0%) | 13 (1.7%) |
| 35 to 64 Years | 17 (0.8%) | 0 (0.0%) |
| 65 to 74 Years | 25 (3.5%) | 14 (2.3%) |
| 75 Years and over | 87 (18.6%) | 12 (4.4%) |
Disability Class: Cognitive Difficulty
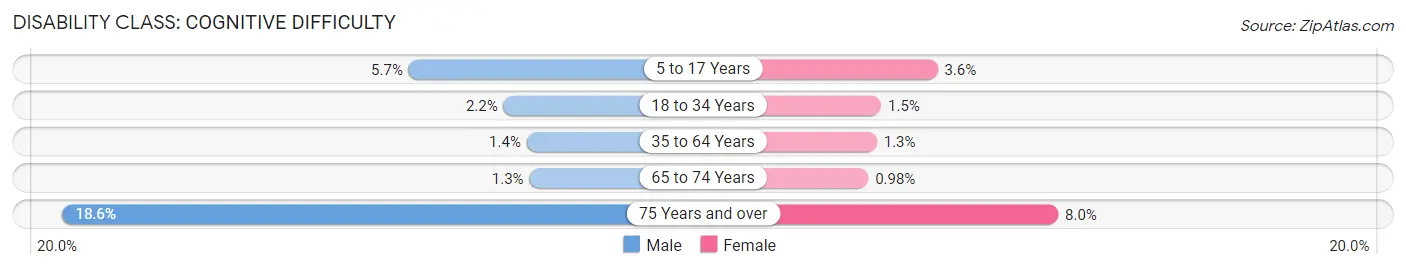
| Age Bracket | Male | Female |
| 5 to 17 Years | 47 (5.7%) | 21 (3.5%) |
| 18 to 34 Years | 18 (2.2%) | 11 (1.5%) |
| 35 to 64 Years | 28 (1.4%) | 28 (1.3%) |
| 65 to 74 Years | 9 (1.3%) | 6 (1.0%) |
| 75 Years and over | 87 (18.6%) | 22 (8.0%) |
Disability Class: Ambulatory Difficulty
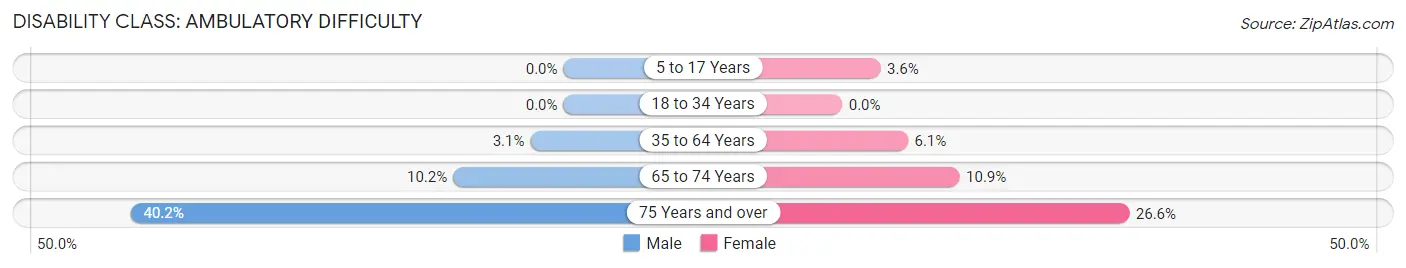
| Age Bracket | Male | Female |
| 5 to 17 Years | 0 (0.0%) | 21 (3.5%) |
| 18 to 34 Years | 0 (0.0%) | 0 (0.0%) |
| 35 to 64 Years | 63 (3.1%) | 131 (6.1%) |
| 65 to 74 Years | 73 (10.2%) | 67 (10.9%) |
| 75 Years and over | 188 (40.2%) | 73 (26.6%) |
Disability Class: Self-Care Difficulty
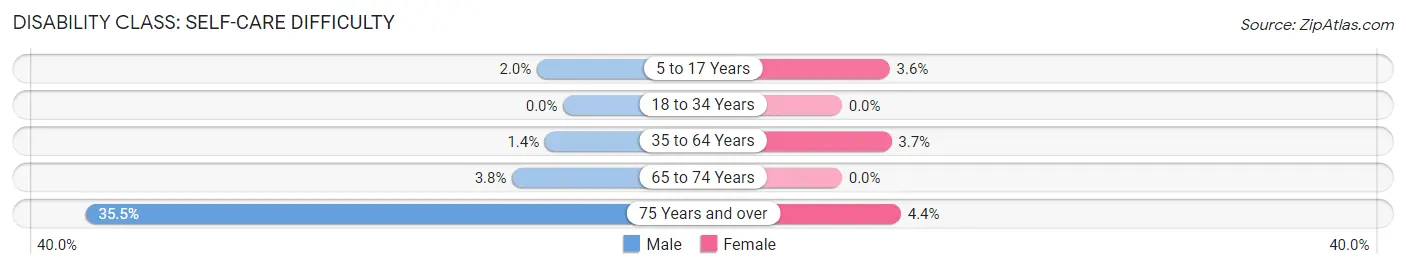
| Age Bracket | Male | Female |
| 5 to 17 Years | 16 (1.9%) | 21 (3.5%) |
| 18 to 34 Years | 0 (0.0%) | 0 (0.0%) |
| 35 to 64 Years | 28 (1.4%) | 79 (3.7%) |
| 65 to 74 Years | 27 (3.8%) | 0 (0.0%) |
| 75 Years and over | 166 (35.5%) | 12 (4.4%) |
Technology Access in Marathon
Computing Device Access in Marathon
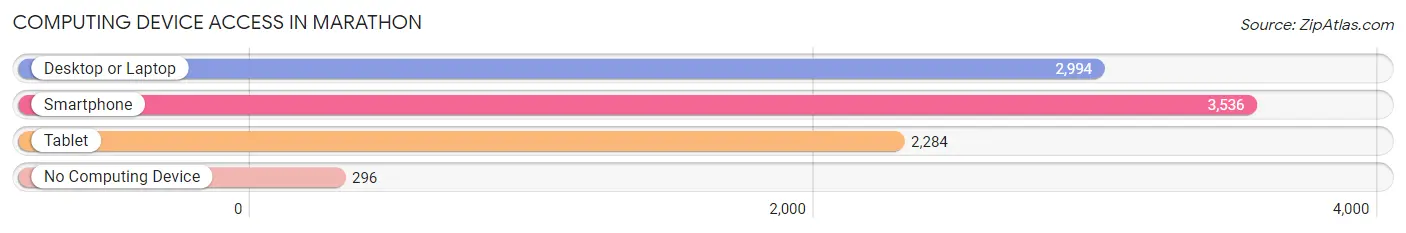
| Device Type | # Households | % Households |
| Desktop or Laptop | 2,994 | 75.7% |
| Smartphone | 3,536 | 89.4% |
| Tablet | 2,284 | 57.7% |
| No Computing Device | 296 | 7.5% |
| Total | 3,956 | 100.0% |
Internet Access in Marathon
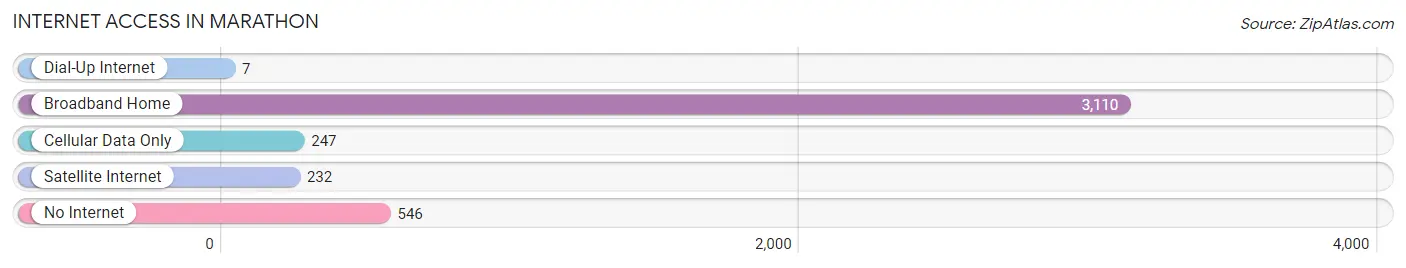
| Internet Type | # Households | % Households |
| Dial-Up Internet | 7 | 0.2% |
| Broadband Home | 3,110 | 78.6% |
| Cellular Data Only | 247 | 6.2% |
| Satellite Internet | 232 | 5.9% |
| No Internet | 546 | 13.8% |
| Total | 3,956 | 100.0% |
Marathon Summary
Marathon, Florida is a city located in Monroe County, Florida, United States. It is situated at the southern end of the Florida Keys, approximately 50 miles (80 km) east of Key West. The city encompasses an area of approximately 12.4 square miles (32 km2), and has a population of approximately 8,500 people as of the 2010 census.
History
Marathon was originally inhabited by the Calusa Indians, who were the first Native American inhabitants of the Florida Keys. The Calusa were a powerful tribe that controlled the area from the Florida mainland to the Dry Tortugas. The Calusa were known for their fishing and trading skills, and were also known for their elaborate shell mounds, which can still be seen in the area today.
In the early 1800s, the area was settled by Bahamian immigrants, who were attracted to the area by the abundance of fish and other marine life. The Bahamians established a fishing village, which they named “Marathon” after the Greek legend of the Battle of Marathon.
In the late 1800s, the area was developed by Henry Flagler, who built the Overseas Railroad, which connected the Florida Keys to the mainland. The railroad was destroyed by a hurricane in 1935, but the area continued to be developed, and in 1949, Marathon was incorporated as a city.
Geography
Marathon is located in the Florida Keys, at the southern end of the chain of islands. The city is situated on Vaca Key, which is connected to the mainland by the Overseas Highway. The city is bordered by the Atlantic Ocean to the east, and the Gulf of Mexico to the west.
The city has a tropical climate, with warm temperatures year-round. The average high temperature in the summer is around 90°F (32°C), and the average low temperature in the winter is around 70°F (21°C).
Economy
Marathon’s economy is largely based on tourism and fishing. The city is home to several resorts and hotels, as well as numerous restaurants and bars. The city is also home to several marinas, which provide access to the Gulf of Mexico and the Atlantic Ocean.
The city is also home to several commercial fishing operations, which provide a variety of seafood to local restaurants and markets. The city is also home to several boat manufacturers, which produce boats for both commercial and recreational use.
Demographics
As of the 2010 census, Marathon had a population of 8,500 people. The racial makeup of the city was 79.3% White, 11.2% African American, 0.7% Native American, 0.7% Asian, 0.1% Pacific Islander, and 6.9% from other races. Hispanic or Latino of any race were 16.2% of the population.
The median income for a household in the city was $41,944, and the median income for a family was $50,944. The per capita income for the city was $25,944. About 11.2% of families and 14.2% of the population were below the poverty line, including 19.2% of those under age 18 and 8.2% of those age 65 or over.
Marathon is a vibrant city with a rich history and a diverse population. The city is home to a variety of businesses and attractions, and is a popular destination for tourists and locals alike. The city’s economy is largely based on tourism and fishing, and the city is home to several resorts, marinas, and boat manufacturers. The city has a tropical climate, with warm temperatures year-round, and a population of approximately 8,500 people.
Common Questions
What is Per Capita Income in Marathon?
Per Capita income in Marathon is $47,806.
What is the Median Family Income in Marathon?
Median Family Income in Marathon is $90,042.
What is the Median Household income in Marathon?
Median Household Income in Marathon is $70,313.
What is Income or Wage Gap in Marathon?
Income or Wage Gap in Marathon is 23.5%.
Women in Marathon earn 76.5 cents for every dollar earned by a man.
What is Family Income Deficit in Marathon?
Family Income Deficit in Marathon is $8,380.
Families that are below poverty line in Marathon earn $8,380 less on average than the poverty threshold level.
What is Inequality or Gini Index in Marathon?
Inequality or Gini Index in Marathon is 0.51.
What is the Total Population of Marathon?
Total Population of Marathon is 9,789.
What is the Total Male Population of Marathon?
Total Male Population of Marathon is 5,131.
What is the Total Female Population of Marathon?
Total Female Population of Marathon is 4,658.
What is the Ratio of Males per 100 Females in Marathon?
There are 110.15 Males per 100 Females in Marathon.
What is the Ratio of Females per 100 Males in Marathon?
There are 90.78 Females per 100 Males in Marathon.
What is the Median Population Age in Marathon?
Median Population Age in Marathon is 47.2 Years.
What is the Average Family Size in Marathon
Average Family Size in Marathon is 3.0 People.
What is the Average Household Size in Marathon
Average Household Size in Marathon is 2.5 People.
How Large is the Labor Force in Marathon?
There are 5,669 People in the Labor Forcein in Marathon.
What is the Percentage of People in the Labor Force in Marathon?
68.9% of People are in the Labor Force in Marathon.
What is the Unemployment Rate in Marathon?
Unemployment Rate in Marathon is 6.0%.