Tamiami, FL Map & Demographics
Tamiami Map
Tamiami Overview
$32,756
PER CAPITA INCOME
$79,749
AVG FAMILY INCOME
$72,645
AVG HOUSEHOLD INCOME
15.6%
WAGE / INCOME GAP [ % ]
84.4¢/ $1
WAGE / INCOME GAP [ $ ]
0.46
INEQUALITY / GINI INDEX
52,851
TOTAL POPULATION
24,792
MALE POPULATION
28,059
FEMALE POPULATION
88.36
MALES / 100 FEMALES
113.18
FEMALES / 100 MALES
46.3
MEDIAN AGE
3.3
AVG FAMILY SIZE
3.0
AVG HOUSEHOLD SIZE
29,089
LABOR FORCE [ PEOPLE ]
63.5%
PERCENT IN LABOR FORCE
3.3%
UNEMPLOYMENT RATE
Income in Tamiami
Income Overview in Tamiami
Per Capita Income in Tamiami is $32,756, while median incomes of families and households are $79,749 and $72,645 respectively.
| Characteristic | Number | Measure |
| Per Capita Income | 52,851 | $32,756 |
| Median Family Income | 13,933 | $79,749 |
| Mean Family Income | 13,933 | $100,224 |
| Median Household Income | 17,774 | $72,645 |
| Mean Household Income | 17,774 | $93,009 |
| Income Deficit | 13,933 | $0 |
| Wage / Income Gap (%) | 52,851 | 15.57% |
| Wage / Income Gap ($) | 52,851 | 84.43¢ per $1 |
| Gini / Inequality Index | 52,851 | 0.46 |
Earnings by Sex in Tamiami
Average Earnings in Tamiami are $35,627, $38,649 for men and $32,633 for women, a difference of 15.6%.
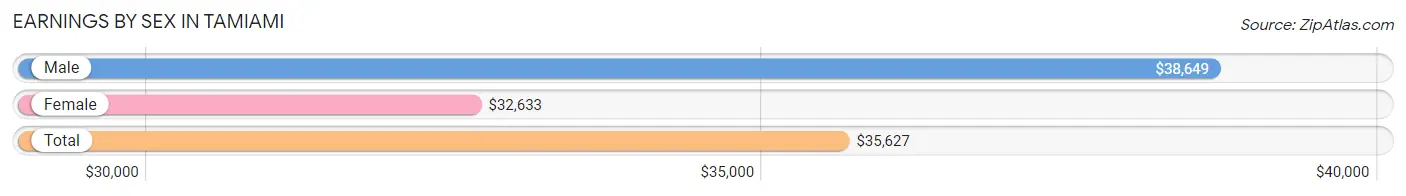
| Sex | Number | Average Earnings |
| Male | 15,448 (52.9%) | $38,649 |
| Female | 13,740 (47.1%) | $32,633 |
| Total | 29,188 (100.0%) | $35,627 |
Earnings by Sex by Income Bracket in Tamiami
The most common earnings brackets in Tamiami are $100,000+ for men (2,124 | 13.8%) and $25,000 to $29,999 for women (1,362 | 9.9%).
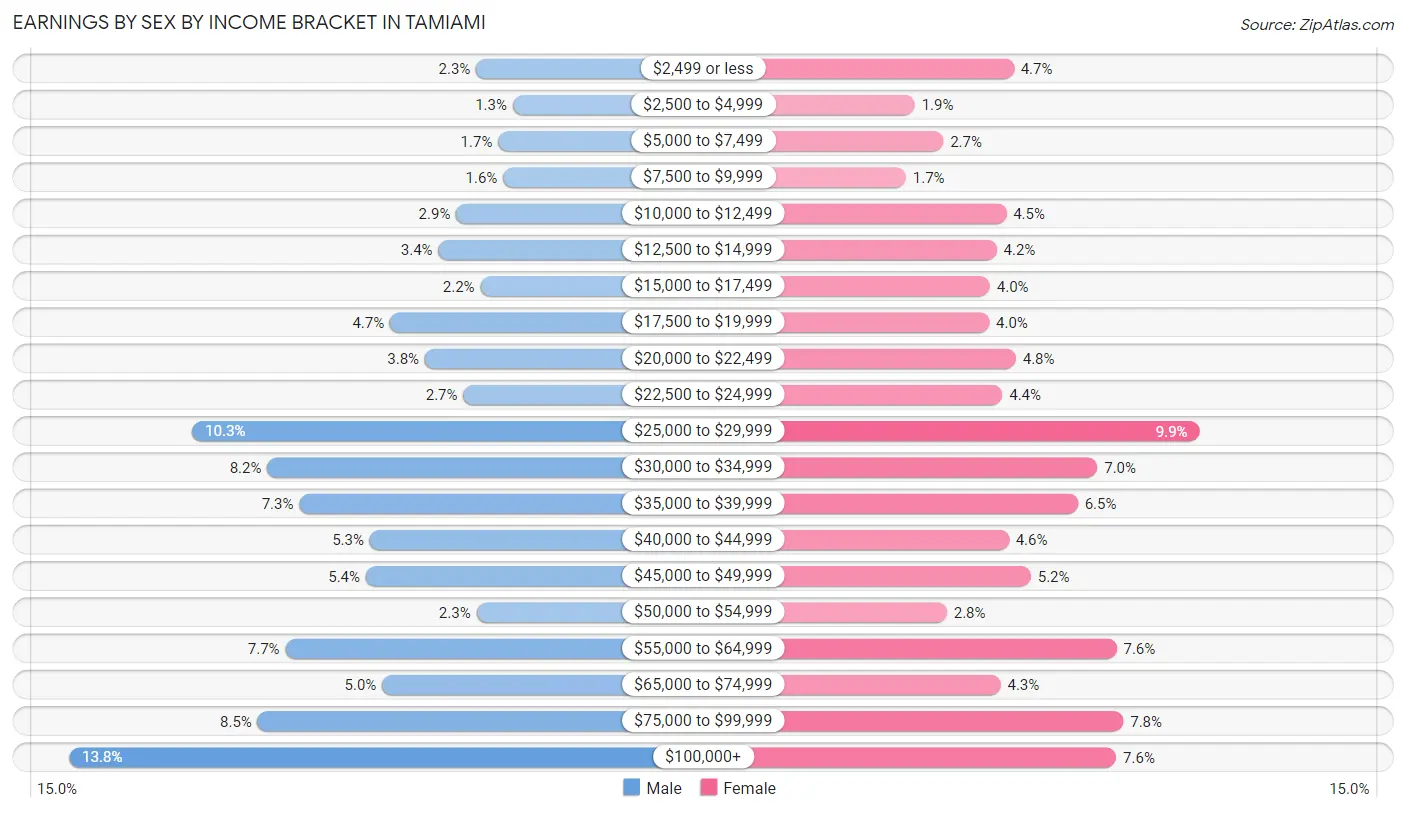
| Income | Male | Female |
| $2,499 or less | 357 (2.3%) | 644 (4.7%) |
| $2,500 to $4,999 | 198 (1.3%) | 262 (1.9%) |
| $5,000 to $7,499 | 261 (1.7%) | 373 (2.7%) |
| $7,500 to $9,999 | 239 (1.5%) | 228 (1.7%) |
| $10,000 to $12,499 | 444 (2.9%) | 616 (4.5%) |
| $12,500 to $14,999 | 521 (3.4%) | 579 (4.2%) |
| $15,000 to $17,499 | 339 (2.2%) | 552 (4.0%) |
| $17,500 to $19,999 | 731 (4.7%) | 549 (4.0%) |
| $20,000 to $22,499 | 579 (3.7%) | 652 (4.8%) |
| $22,500 to $24,999 | 412 (2.7%) | 601 (4.4%) |
| $25,000 to $29,999 | 1,590 (10.3%) | 1,362 (9.9%) |
| $30,000 to $34,999 | 1,263 (8.2%) | 967 (7.0%) |
| $35,000 to $39,999 | 1,125 (7.3%) | 892 (6.5%) |
| $40,000 to $44,999 | 818 (5.3%) | 625 (4.5%) |
| $45,000 to $49,999 | 835 (5.4%) | 711 (5.2%) |
| $50,000 to $54,999 | 356 (2.3%) | 386 (2.8%) |
| $55,000 to $64,999 | 1,185 (7.7%) | 1,041 (7.6%) |
| $65,000 to $74,999 | 765 (5.0%) | 593 (4.3%) |
| $75,000 to $99,999 | 1,306 (8.5%) | 1,067 (7.8%) |
| $100,000+ | 2,124 (13.8%) | 1,040 (7.6%) |
| Total | 15,448 (100.0%) | 13,740 (100.0%) |
Earnings by Sex by Educational Attainment in Tamiami
Average earnings in Tamiami are $42,955 for men and $34,914 for women, a difference of 18.7%. Men with an educational attainment of graduate degree enjoy the highest average annual earnings of $76,410, while those with high school diploma education earn the least with $34,093. Women with an educational attainment of graduate degree earn the most with the average annual earnings of $68,369, while those with less than high school education have the smallest earnings of $22,447.
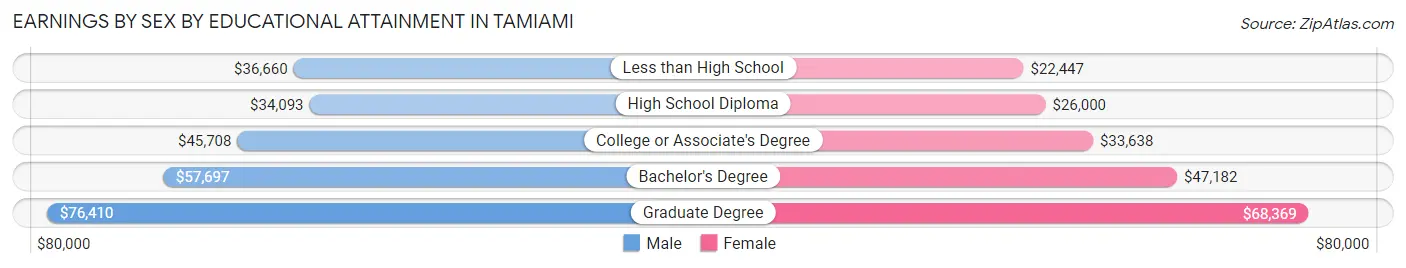
| Educational Attainment | Male Income | Female Income |
| Less than High School | $36,660 | $22,447 |
| High School Diploma | $34,093 | $26,000 |
| College or Associate's Degree | $45,708 | $33,638 |
| Bachelor's Degree | $57,697 | $47,182 |
| Graduate Degree | $76,410 | $68,369 |
| Total | $42,955 | $34,914 |
Family Income in Tamiami
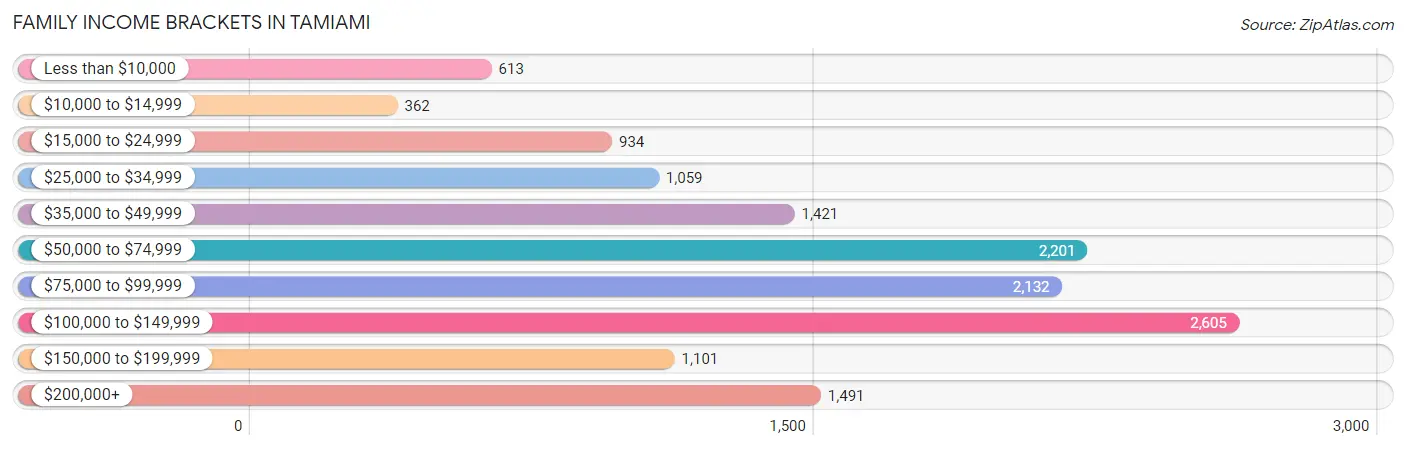
Family Income Brackets in Tamiami
According to the Tamiami family income data, there are 2,605 families falling into the $100,000 to $149,999 income range, which is the most common income bracket and makes up 18.7% of all families. Conversely, the $10,000 to $14,999 income bracket is the least frequent group with only 362 families (2.6%) belonging to this category.
| Income Bracket | # Families | % Families |
| Less than $10,000 | 613 | 4.4% |
| $10,000 to $14,999 | 362 | 2.6% |
| $15,000 to $24,999 | 934 | 6.7% |
| $25,000 to $34,999 | 1,059 | 7.6% |
| $35,000 to $49,999 | 1,421 | 10.2% |
| $50,000 to $74,999 | 2,201 | 15.8% |
| $75,000 to $99,999 | 2,132 | 15.3% |
| $100,000 to $149,999 | 2,605 | 18.7% |
| $150,000 to $199,999 | 1,101 | 7.9% |
| $200,000+ | 1,491 | 10.7% |
Family Income by Famaliy Size in Tamiami
7+ person families (219 | 1.6%) account for the highest median family income in Tamiami with $164,896 per family, while 4-person families (2,257 | 16.2%) have the highest median income of $27,920 per family member.
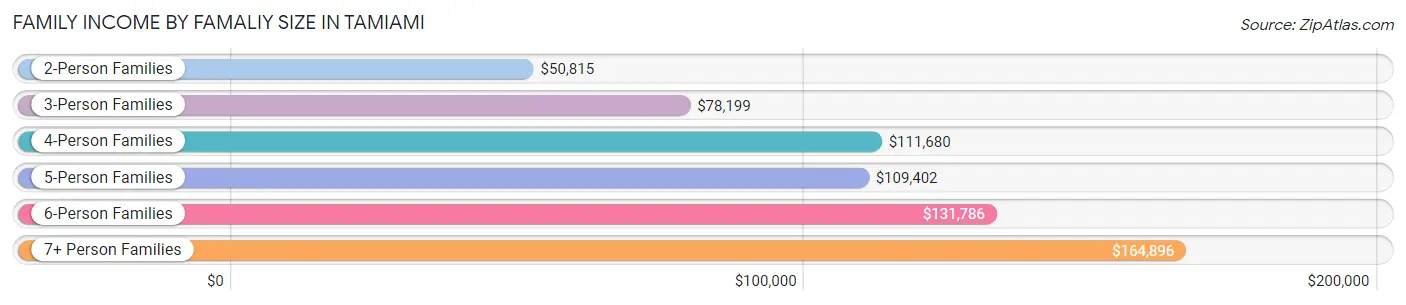
| Income Bracket | # Families | Median Income |
| 2-Person Families | 5,472 (39.3%) | $50,815 |
| 3-Person Families | 4,244 (30.5%) | $78,199 |
| 4-Person Families | 2,257 (16.2%) | $111,680 |
| 5-Person Families | 1,181 (8.5%) | $109,402 |
| 6-Person Families | 560 (4.0%) | $131,786 |
| 7+ Person Families | 219 (1.6%) | $164,896 |
| Total | 13,933 (100.0%) | $79,749 |
Family Income by Number of Earners in Tamiami
The median family income in Tamiami is $79,749, with families comprising 3+ earners (2,696) having the highest median family income of $130,641, while families with no earners (1,824) have the lowest median family income of $24,340, accounting for 19.4% and 13.1% of families, respectively.
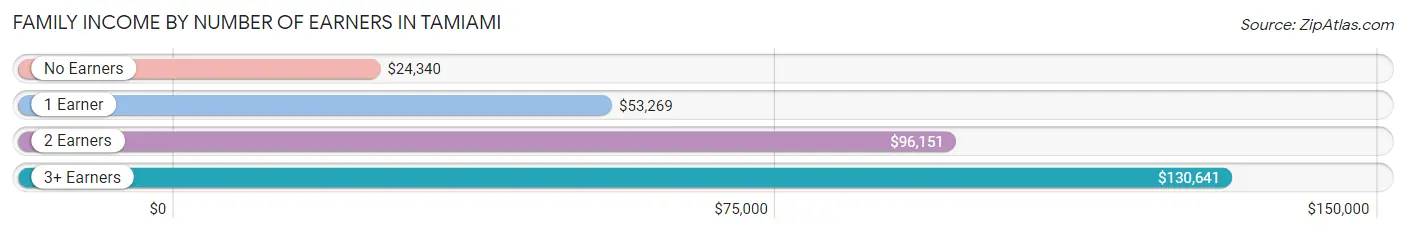
| Number of Earners | # Families | Median Income |
| No Earners | 1,824 (13.1%) | $24,340 |
| 1 Earner | 4,258 (30.6%) | $53,269 |
| 2 Earners | 5,155 (37.0%) | $96,151 |
| 3+ Earners | 2,696 (19.4%) | $130,641 |
| Total | 13,933 (100.0%) | $79,749 |
Household Income in Tamiami
Household Income Brackets in Tamiami
With 2,986 households falling in the category, the $100,000 to $149,999 income range is the most frequent in Tamiami, accounting for 16.8% of all households. In contrast, only 906 households (5.1%) fall into the less than $10,000 income bracket, making it the least populous group.
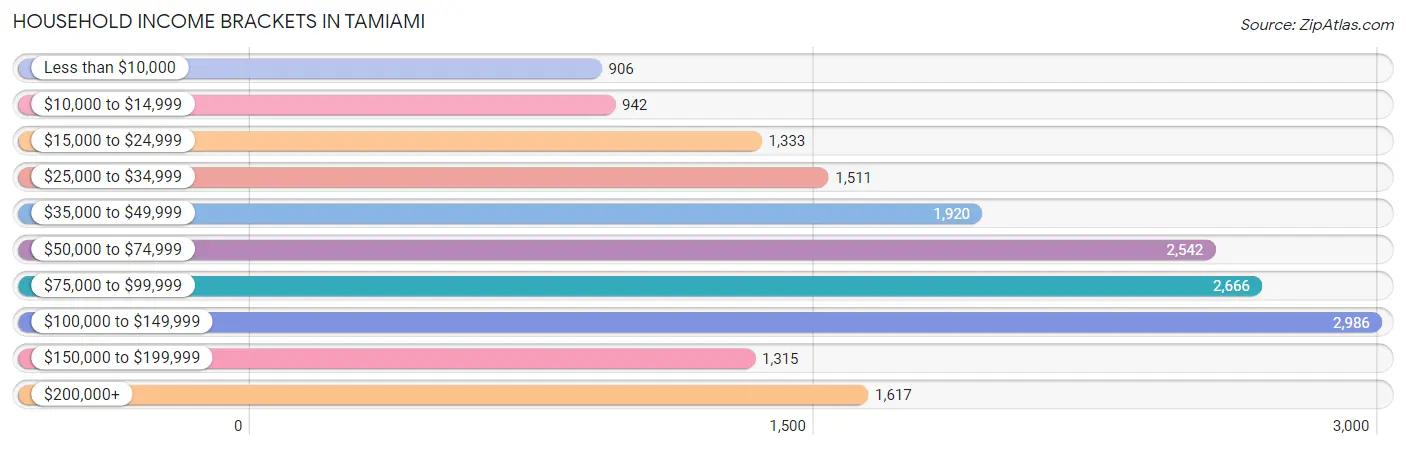
| Income Bracket | # Households | % Households |
| Less than $10,000 | 906 | 5.1% |
| $10,000 to $14,999 | 942 | 5.3% |
| $15,000 to $24,999 | 1,333 | 7.5% |
| $25,000 to $34,999 | 1,511 | 8.5% |
| $35,000 to $49,999 | 1,920 | 10.8% |
| $50,000 to $74,999 | 2,542 | 14.3% |
| $75,000 to $99,999 | 2,666 | 15.0% |
| $100,000 to $149,999 | 2,986 | 16.8% |
| $150,000 to $199,999 | 1,315 | 7.4% |
| $200,000+ | 1,617 | 9.1% |
Household Income by Householder Age in Tamiami
The median household income in Tamiami is $72,645, with the highest median household income of $89,364 found in the 45 to 64 years age bracket for the primary householder. A total of 7,786 households (43.8%) fall into this category. Meanwhile, the 15 to 24 years age bracket for the primary householder has the lowest median household income of $33,953, with 386 households (2.2%) in this group.
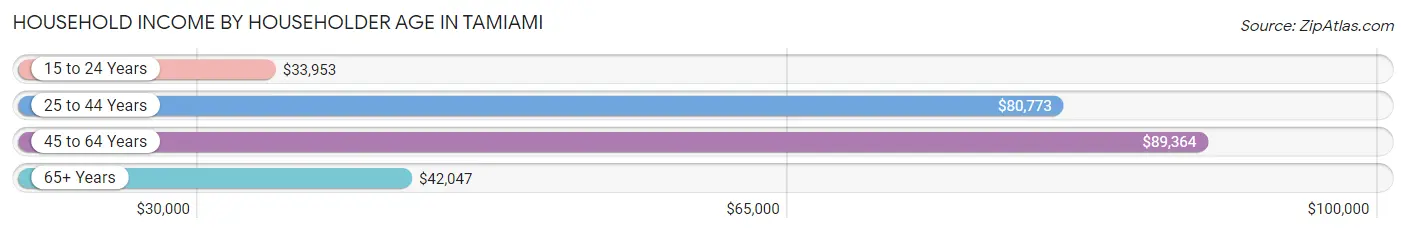
| Income Bracket | # Households | Median Income |
| 15 to 24 Years | 386 (2.2%) | $33,953 |
| 25 to 44 Years | 3,878 (21.8%) | $80,773 |
| 45 to 64 Years | 7,786 (43.8%) | $89,364 |
| 65+ Years | 5,724 (32.2%) | $42,047 |
| Total | 17,774 (100.0%) | $72,645 |
Poverty in Tamiami
Income Below Poverty by Sex and Age in Tamiami
With 9.2% poverty level for males and 15.0% for females among the residents of Tamiami, 5 year old males and 5 year old females are the most vulnerable to poverty, with 61 males (46.6%) and 191 females (86.8%) in their respective age groups living below the poverty level.
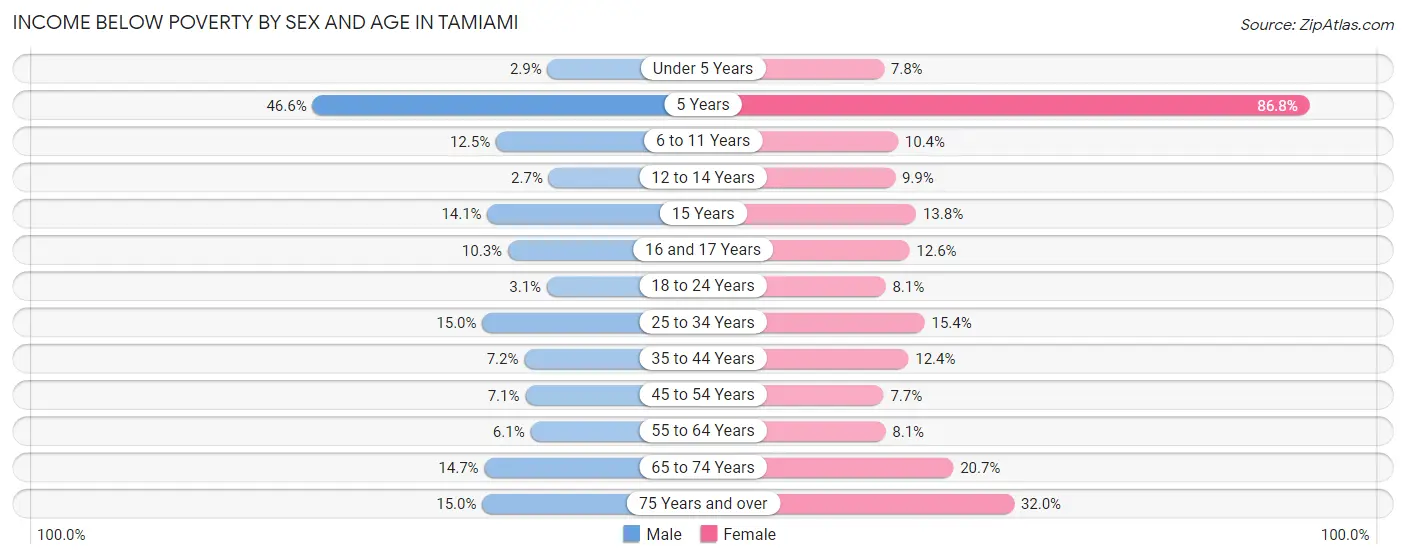
| Age Bracket | Male | Female |
| Under 5 Years | 27 (2.9%) | 90 (7.8%) |
| 5 Years | 61 (46.6%) | 191 (86.8%) |
| 6 to 11 Years | 131 (12.5%) | 138 (10.4%) |
| 12 to 14 Years | 21 (2.7%) | 78 (9.9%) |
| 15 Years | 61 (14.1%) | 23 (13.8%) |
| 16 and 17 Years | 60 (10.3%) | 67 (12.6%) |
| 18 to 24 Years | 73 (3.0%) | 164 (8.1%) |
| 25 to 34 Years | 447 (15.0%) | 494 (15.4%) |
| 35 to 44 Years | 213 (7.2%) | 404 (12.3%) |
| 45 to 54 Years | 313 (7.1%) | 296 (7.7%) |
| 55 to 64 Years | 227 (6.1%) | 357 (8.1%) |
| 65 to 74 Years | 397 (14.6%) | 652 (20.7%) |
| 75 Years and over | 252 (15.0%) | 1,230 (32.0%) |
| Total | 2,283 (9.2%) | 4,184 (15.0%) |
Income Above Poverty by Sex and Age in Tamiami
According to the poverty statistics in Tamiami, males aged 12 to 14 years and females aged 45 to 54 years are the age groups that are most secure financially, with 97.3% of males and 92.3% of females in these age groups living above the poverty line.
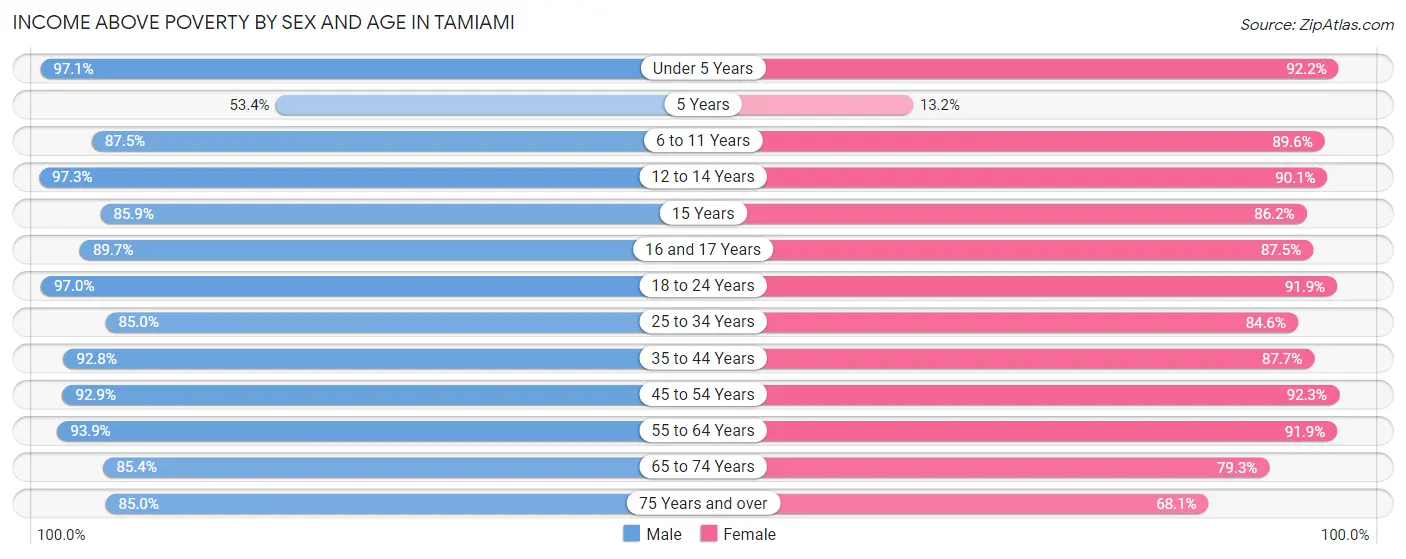
| Age Bracket | Male | Female |
| Under 5 Years | 895 (97.1%) | 1,063 (92.2%) |
| 5 Years | 70 (53.4%) | 29 (13.2%) |
| 6 to 11 Years | 917 (87.5%) | 1,188 (89.6%) |
| 12 to 14 Years | 753 (97.3%) | 712 (90.1%) |
| 15 Years | 372 (85.9%) | 144 (86.2%) |
| 16 and 17 Years | 523 (89.7%) | 467 (87.5%) |
| 18 to 24 Years | 2,323 (97.0%) | 1,861 (91.9%) |
| 25 to 34 Years | 2,528 (85.0%) | 2,723 (84.6%) |
| 35 to 44 Years | 2,730 (92.8%) | 2,867 (87.6%) |
| 45 to 54 Years | 4,118 (92.9%) | 3,526 (92.3%) |
| 55 to 64 Years | 3,493 (93.9%) | 4,060 (91.9%) |
| 65 to 74 Years | 2,312 (85.4%) | 2,501 (79.3%) |
| 75 Years and over | 1,424 (85.0%) | 2,620 (68.0%) |
| Total | 22,458 (90.8%) | 23,761 (85.0%) |
Income Below Poverty Among Married-Couple Families in Tamiami
The poverty statistics for married-couple families in Tamiami show that 10.5% or 960 of the total 9,182 families live below the poverty line. Families with no children have the highest poverty rate of 13.0%, comprising of 789 families. On the other hand, families with 1 or 2 children have the lowest poverty rate of 5.2%, which includes 142 families.
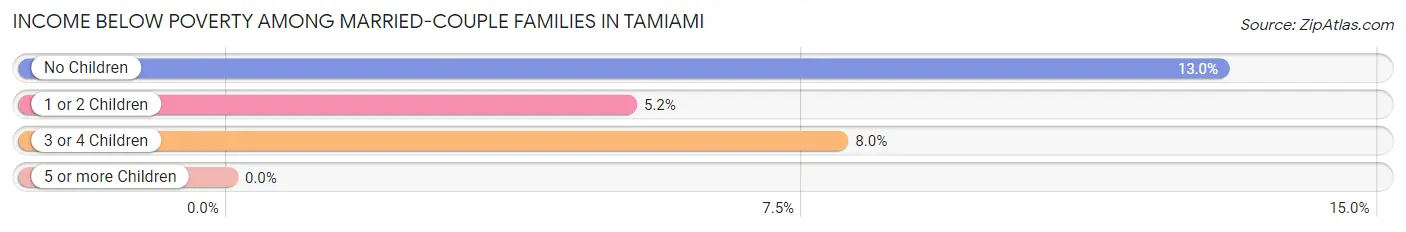
| Children | Above Poverty | Below Poverty |
| No Children | 5,306 (87.1%) | 789 (13.0%) |
| 1 or 2 Children | 2,581 (94.8%) | 142 (5.2%) |
| 3 or 4 Children | 335 (92.0%) | 29 (8.0%) |
| 5 or more Children | 0 (0.0%) | 0 (0.0%) |
| Total | 8,222 (89.5%) | 960 (10.5%) |
Income Below Poverty Among Single-Parent Households in Tamiami
According to the poverty data in Tamiami, 3.6% or 38 single-father households and 18.5% or 683 single-mother households are living below the poverty line. Among single-father households, those with 1 or 2 children have the highest poverty rate, with 9 households (3.9%) experiencing poverty. Likewise, among single-mother households, those with 1 or 2 children have the highest poverty rate, with 425 households (25.3%) falling below the poverty line.
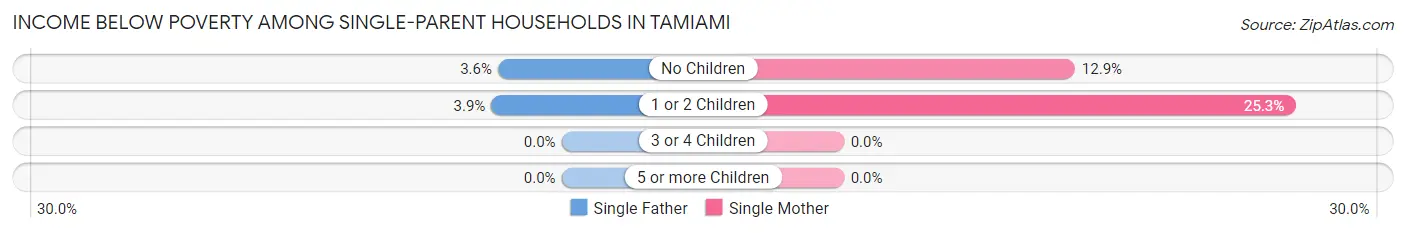
| Children | Single Father | Single Mother |
| No Children | 29 (3.6%) | 258 (12.9%) |
| 1 or 2 Children | 9 (3.9%) | 425 (25.3%) |
| 3 or 4 Children | 0 (0.0%) | 0 (0.0%) |
| 5 or more Children | 0 (0.0%) | 0 (0.0%) |
| Total | 38 (3.6%) | 683 (18.5%) |
Income Below Poverty Among Married-Couple vs Single-Parent Households in Tamiami
The poverty data for Tamiami shows that 960 of the married-couple family households (10.5%) and 721 of the single-parent households (15.2%) are living below the poverty level. Within the married-couple family households, those with no children have the highest poverty rate, with 789 households (13.0%) falling below the poverty line. Among the single-parent households, those with 1 or 2 children have the highest poverty rate, with 434 household (22.7%) living below poverty.
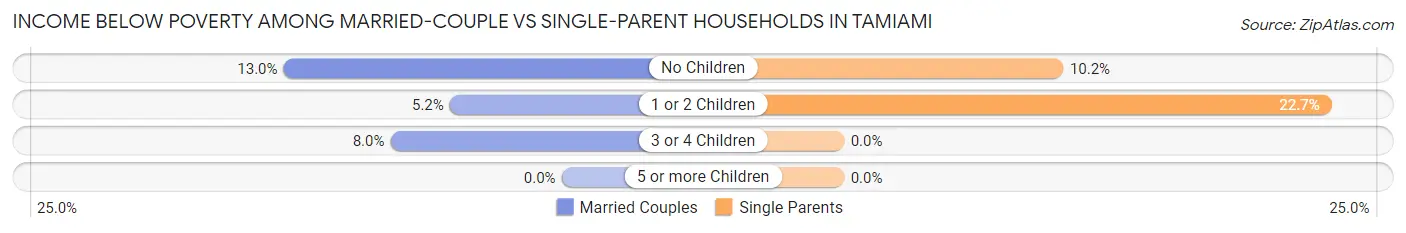
| Children | Married-Couple Families | Single-Parent Households |
| No Children | 789 (13.0%) | 287 (10.2%) |
| 1 or 2 Children | 142 (5.2%) | 434 (22.7%) |
| 3 or 4 Children | 29 (8.0%) | 0 (0.0%) |
| 5 or more Children | 0 (0.0%) | 0 (0.0%) |
| Total | 960 (10.5%) | 721 (15.2%) |
Race in Tamiami
The most populous races in Tamiami are Hispanic or Latino (48,649 | 92.0%), White / Caucasian (29,726 | 56.2%), and Two or more Races (20,408 | 38.6%).
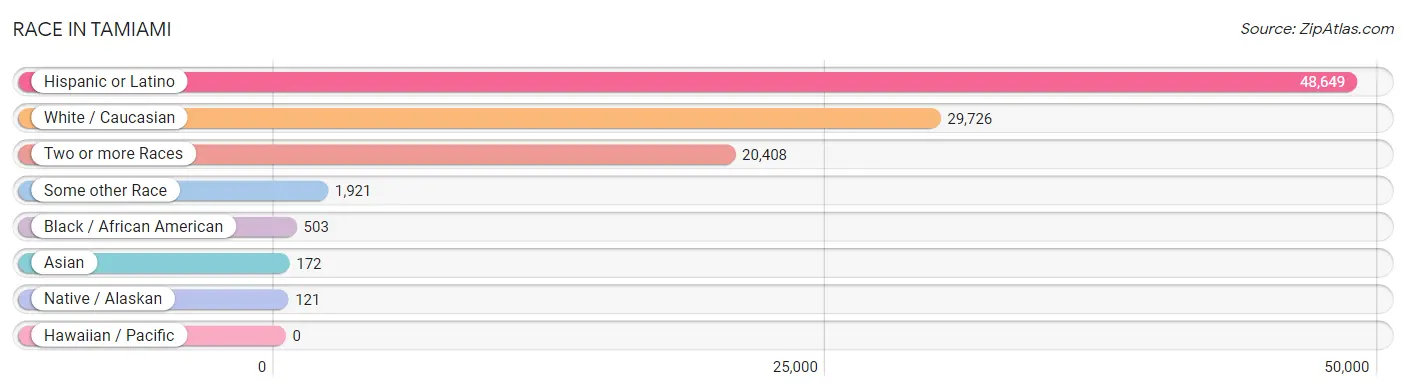
| Race | # Population | % Population |
| Asian | 172 | 0.3% |
| Black / African American | 503 | 0.9% |
| Hawaiian / Pacific | 0 | 0.0% |
| Hispanic or Latino | 48,649 | 92.0% |
| Native / Alaskan | 121 | 0.2% |
| White / Caucasian | 29,726 | 56.2% |
| Two or more Races | 20,408 | 38.6% |
| Some other Race | 1,921 | 3.6% |
| Total | 52,851 | 100.0% |
Ancestry in Tamiami
The most populous ancestries reported in Tamiami are Cuban (33,723 | 63.8%), South American (6,345 | 12.0%), Central American (4,493 | 8.5%), Nicaraguan (2,994 | 5.7%), and Puerto Rican (2,344 | 4.4%), together accounting for 94.4% of all Tamiami residents.
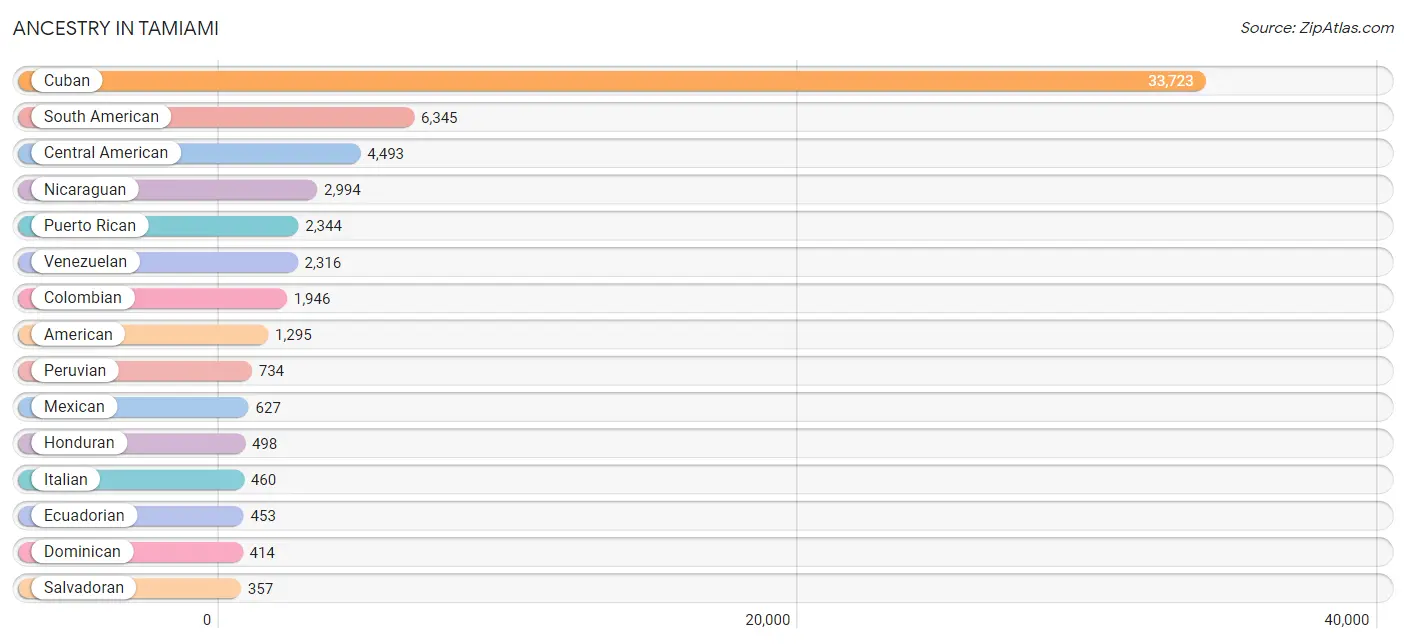
| Ancestry | # Population | % Population |
| African | 13 | 0.0% |
| American | 1,295 | 2.5% |
| Apache | 143 | 0.3% |
| Arab | 340 | 0.6% |
| Argentinean | 294 | 0.6% |
| Austrian | 38 | 0.1% |
| Basque | 4 | 0.0% |
| Belizean | 64 | 0.1% |
| Bhutanese | 10 | 0.0% |
| Bolivian | 150 | 0.3% |
| Brazilian | 327 | 0.6% |
| British | 93 | 0.2% |
| Burmese | 69 | 0.1% |
| Canadian | 2 | 0.0% |
| Central American | 4,493 | 8.5% |
| Central American Indian | 89 | 0.2% |
| Cherokee | 23 | 0.0% |
| Chilean | 241 | 0.5% |
| Colombian | 1,946 | 3.7% |
| Costa Rican | 219 | 0.4% |
| Creek | 57 | 0.1% |
| Cuban | 33,723 | 63.8% |
| Danish | 7 | 0.0% |
| Dominican | 414 | 0.8% |
| Dutch | 158 | 0.3% |
| Ecuadorian | 453 | 0.9% |
| Egyptian | 11 | 0.0% |
| English | 189 | 0.4% |
| European | 193 | 0.4% |
| French | 185 | 0.4% |
| French Canadian | 10 | 0.0% |
| German | 304 | 0.6% |
| Greek | 18 | 0.0% |
| Guatemalan | 272 | 0.5% |
| Haitian | 34 | 0.1% |
| Honduran | 498 | 0.9% |
| Indian (Asian) | 95 | 0.2% |
| Iranian | 8 | 0.0% |
| Irish | 131 | 0.3% |
| Israeli | 45 | 0.1% |
| Italian | 460 | 0.9% |
| Jamaican | 10 | 0.0% |
| Jordanian | 61 | 0.1% |
| Korean | 64 | 0.1% |
| Lebanese | 258 | 0.5% |
| Lithuanian | 13 | 0.0% |
| Mexican | 627 | 1.2% |
| Nicaraguan | 2,994 | 5.7% |
| Norwegian | 7 | 0.0% |
| Pakistani | 32 | 0.1% |
| Panamanian | 153 | 0.3% |
| Paraguayan | 25 | 0.1% |
| Peruvian | 734 | 1.4% |
| Polish | 29 | 0.1% |
| Portuguese | 127 | 0.2% |
| Puerto Rican | 2,344 | 4.4% |
| Romanian | 35 | 0.1% |
| Russian | 125 | 0.2% |
| Salvadoran | 357 | 0.7% |
| Scotch-Irish | 44 | 0.1% |
| Scottish | 31 | 0.1% |
| South American | 6,345 | 12.0% |
| Spaniard | 163 | 0.3% |
| Spanish | 166 | 0.3% |
| Sri Lankan | 25 | 0.1% |
| Subsaharan African | 15 | 0.0% |
| Swiss | 5 | 0.0% |
| Syrian | 10 | 0.0% |
| Trinidadian and Tobagonian | 57 | 0.1% |
| Ukrainian | 15 | 0.0% |
| Uruguayan | 186 | 0.4% |
| Venezuelan | 2,316 | 4.4% |
| West Indian | 6 | 0.0% | View All 73 Rows |
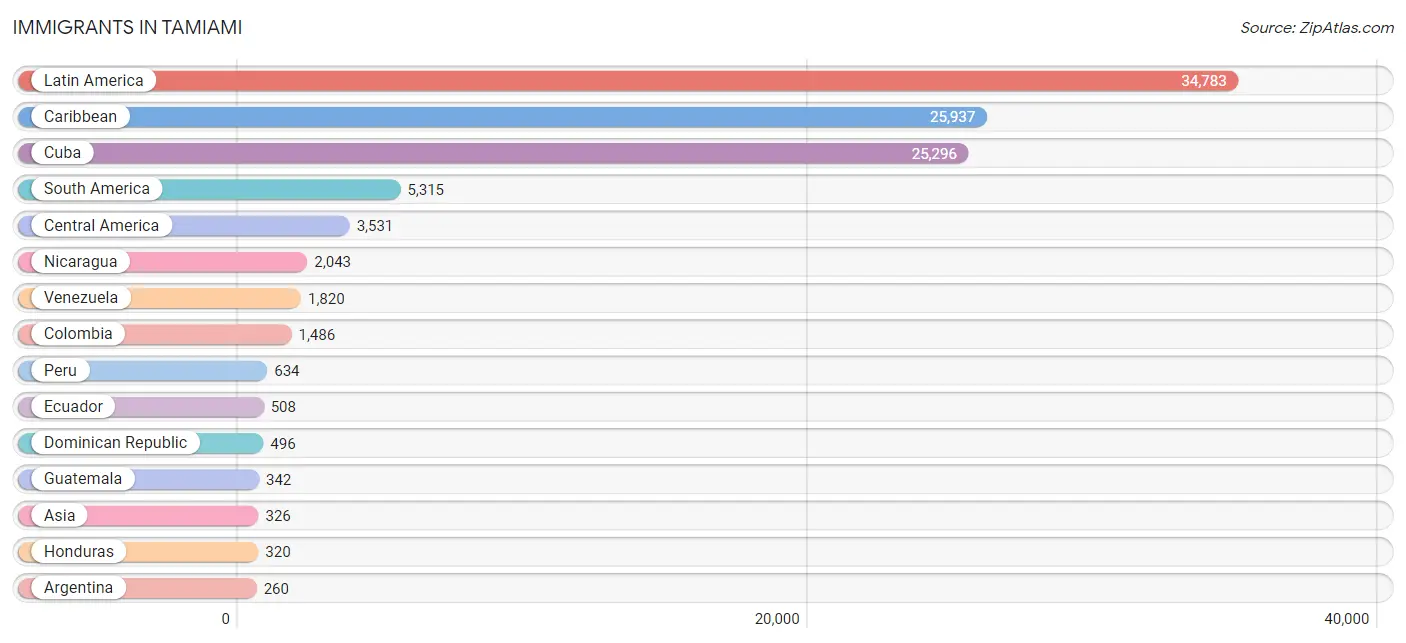
Immigrants in Tamiami
The most numerous immigrant groups reported in Tamiami came from Latin America (34,783 | 65.8%), Caribbean (25,937 | 49.1%), Cuba (25,296 | 47.9%), South America (5,315 | 10.1%), and Central America (3,531 | 6.7%), together accounting for 179.5% of all Tamiami residents.
| Immigration Origin | # Population | % Population |
| Africa | 16 | 0.0% |
| Argentina | 260 | 0.5% |
| Asia | 326 | 0.6% |
| Belize | 85 | 0.2% |
| Bolivia | 35 | 0.1% |
| Brazil | 130 | 0.3% |
| Canada | 27 | 0.1% |
| Caribbean | 25,937 | 49.1% |
| Central America | 3,531 | 6.7% |
| Chile | 171 | 0.3% |
| China | 27 | 0.1% |
| Colombia | 1,486 | 2.8% |
| Costa Rica | 143 | 0.3% |
| Cuba | 25,296 | 47.9% |
| Dominican Republic | 496 | 0.9% |
| Eastern Asia | 31 | 0.1% |
| Eastern Europe | 97 | 0.2% |
| Ecuador | 508 | 1.0% |
| Egypt | 16 | 0.0% |
| El Salvador | 238 | 0.4% |
| Europe | 212 | 0.4% |
| Guatemala | 342 | 0.6% |
| Haiti | 44 | 0.1% |
| Honduras | 320 | 0.6% |
| India | 15 | 0.0% |
| Iran | 25 | 0.1% |
| Israel | 11 | 0.0% |
| Italy | 20 | 0.0% |
| Jamaica | 32 | 0.1% |
| Japan | 4 | 0.0% |
| Jordan | 128 | 0.2% |
| Latin America | 34,783 | 65.8% |
| Mexico | 223 | 0.4% |
| Nicaragua | 2,043 | 3.9% |
| Northern Africa | 16 | 0.0% |
| Northern Europe | 24 | 0.1% |
| Pakistan | 9 | 0.0% |
| Panama | 137 | 0.3% |
| Peru | 634 | 1.2% |
| Philippines | 25 | 0.1% |
| Poland | 10 | 0.0% |
| Romania | 35 | 0.1% |
| Russia | 46 | 0.1% |
| South America | 5,315 | 10.1% |
| South Central Asia | 49 | 0.1% |
| South Eastern Asia | 107 | 0.2% |
| Southern Europe | 91 | 0.2% |
| Spain | 71 | 0.1% |
| Sweden | 24 | 0.1% |
| Trinidad and Tobago | 47 | 0.1% |
| Ukraine | 6 | 0.0% |
| Uruguay | 246 | 0.5% |
| Venezuela | 1,820 | 3.4% |
| Vietnam | 82 | 0.2% |
| Western Asia | 139 | 0.3% | View All 55 Rows |
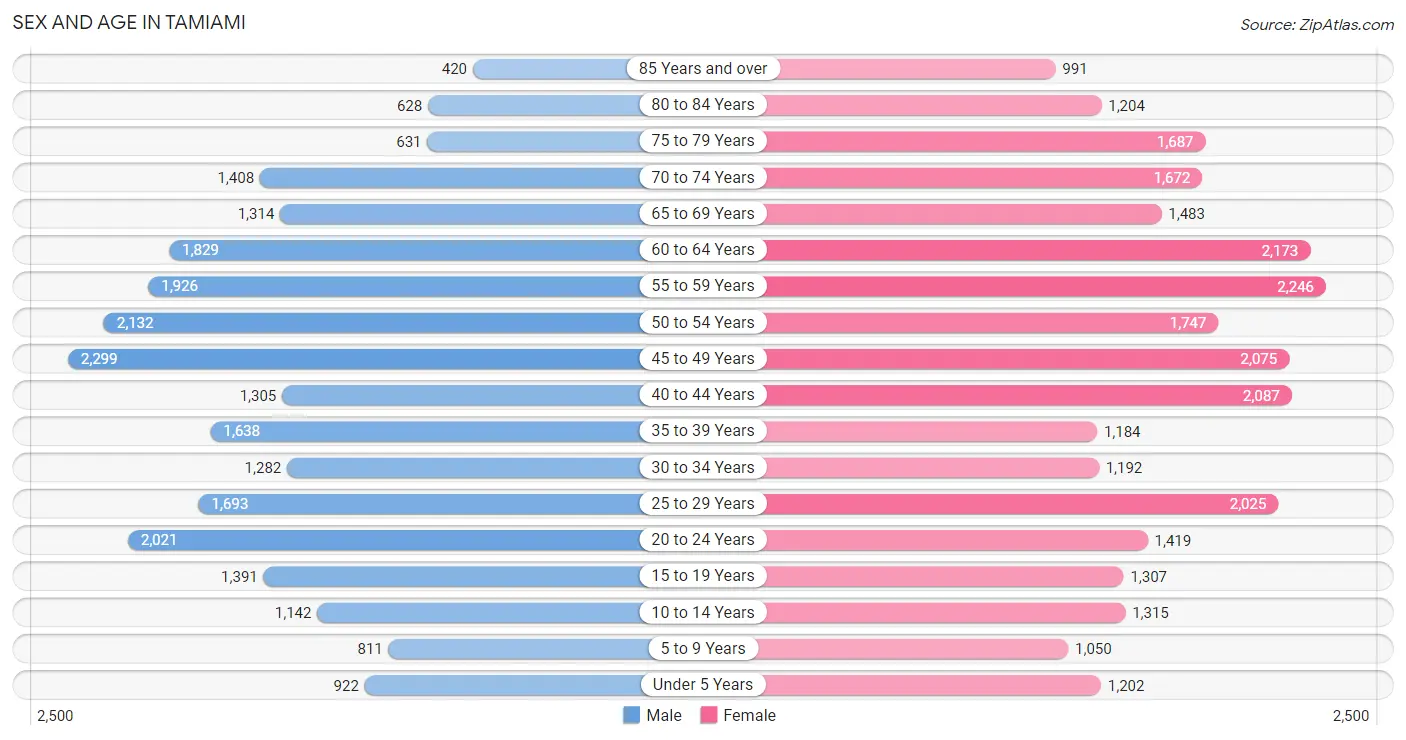
Sex and Age in Tamiami
Sex and Age in Tamiami
The most populous age groups in Tamiami are 45 to 49 Years (2,299 | 9.3%) for men and 55 to 59 Years (2,246 | 8.0%) for women.
| Age Bracket | Male | Female |
| Under 5 Years | 922 (3.7%) | 1,202 (4.3%) |
| 5 to 9 Years | 811 (3.3%) | 1,050 (3.7%) |
| 10 to 14 Years | 1,142 (4.6%) | 1,315 (4.7%) |
| 15 to 19 Years | 1,391 (5.6%) | 1,307 (4.7%) |
| 20 to 24 Years | 2,021 (8.2%) | 1,419 (5.1%) |
| 25 to 29 Years | 1,693 (6.8%) | 2,025 (7.2%) |
| 30 to 34 Years | 1,282 (5.2%) | 1,192 (4.3%) |
| 35 to 39 Years | 1,638 (6.6%) | 1,184 (4.2%) |
| 40 to 44 Years | 1,305 (5.3%) | 2,087 (7.4%) |
| 45 to 49 Years | 2,299 (9.3%) | 2,075 (7.4%) |
| 50 to 54 Years | 2,132 (8.6%) | 1,747 (6.2%) |
| 55 to 59 Years | 1,926 (7.8%) | 2,246 (8.0%) |
| 60 to 64 Years | 1,829 (7.4%) | 2,173 (7.7%) |
| 65 to 69 Years | 1,314 (5.3%) | 1,483 (5.3%) |
| 70 to 74 Years | 1,408 (5.7%) | 1,672 (6.0%) |
| 75 to 79 Years | 631 (2.5%) | 1,687 (6.0%) |
| 80 to 84 Years | 628 (2.5%) | 1,204 (4.3%) |
| 85 Years and over | 420 (1.7%) | 991 (3.5%) |
| Total | 24,792 (100.0%) | 28,059 (100.0%) |
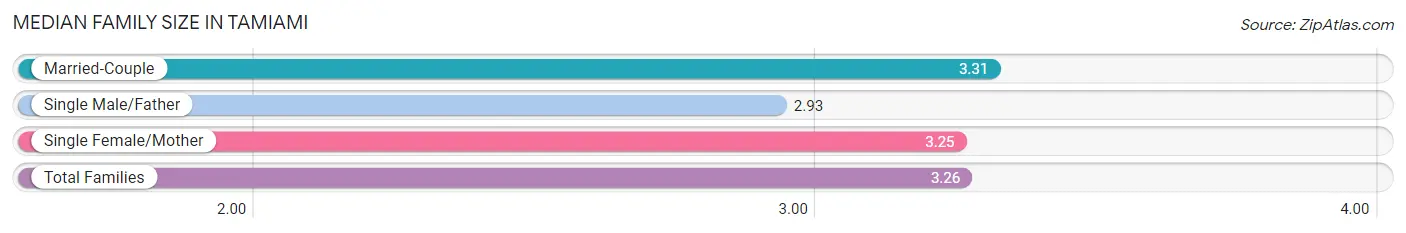
Families and Households in Tamiami
Median Family Size in Tamiami
The median family size in Tamiami is 3.26 persons per family, with married-couple families (9,182 | 65.9%) accounting for the largest median family size of 3.31 persons per family. On the other hand, single male/father families (1,055 | 7.6%) represent the smallest median family size with 2.93 persons per family.
| Family Type | # Families | Family Size |
| Married-Couple | 9,182 (65.9%) | 3.31 |
| Single Male/Father | 1,055 (7.6%) | 2.93 |
| Single Female/Mother | 3,696 (26.5%) | 3.25 |
| Total Families | 13,933 (100.0%) | 3.26 |
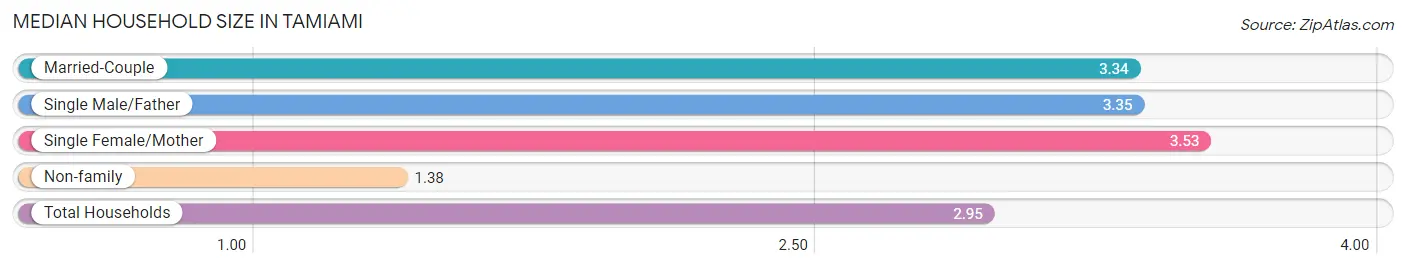
Median Household Size in Tamiami
The median household size in Tamiami is 2.95 persons per household, with single female/mother households (3,696 | 20.8%) accounting for the largest median household size of 3.53 persons per household. non-family households (3,841 | 21.6%) represent the smallest median household size with 1.38 persons per household.
| Household Type | # Households | Household Size |
| Married-Couple | 9,182 (51.7%) | 3.34 |
| Single Male/Father | 1,055 (5.9%) | 3.35 |
| Single Female/Mother | 3,696 (20.8%) | 3.53 |
| Non-family | 3,841 (21.6%) | 1.38 |
| Total Households | 17,774 (100.0%) | 2.95 |
Household Size by Marriage Status in Tamiami
Out of a total of 17,774 households in Tamiami, 13,933 (78.4%) are family households, while 3,841 (21.6%) are nonfamily households. The most numerous type of family households are 2-person households, comprising 5,036, and the most common type of nonfamily households are 1-person households, comprising 2,827.
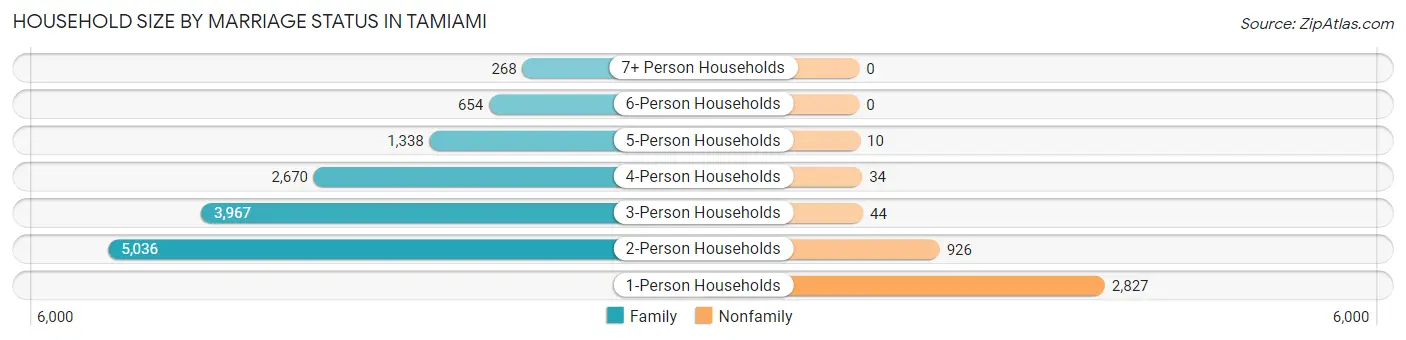
| Household Size | Family Households | Nonfamily Households |
| 1-Person Households | - | 2,827 (15.9%) |
| 2-Person Households | 5,036 (28.3%) | 926 (5.2%) |
| 3-Person Households | 3,967 (22.3%) | 44 (0.3%) |
| 4-Person Households | 2,670 (15.0%) | 34 (0.2%) |
| 5-Person Households | 1,338 (7.5%) | 10 (0.1%) |
| 6-Person Households | 654 (3.7%) | 0 (0.0%) |
| 7+ Person Households | 268 (1.5%) | 0 (0.0%) |
| Total | 13,933 (78.4%) | 3,841 (21.6%) |
Female Fertility in Tamiami
Fertility by Age in Tamiami
Average fertility rate in Tamiami is 44.0 births per 1,000 women. Women in the age bracket of 35 to 50 years have the highest fertility rate with 54.0 births per 1,000 women. Women in the age bracket of 35 to 50 years acount for 58.8% of all women with births.
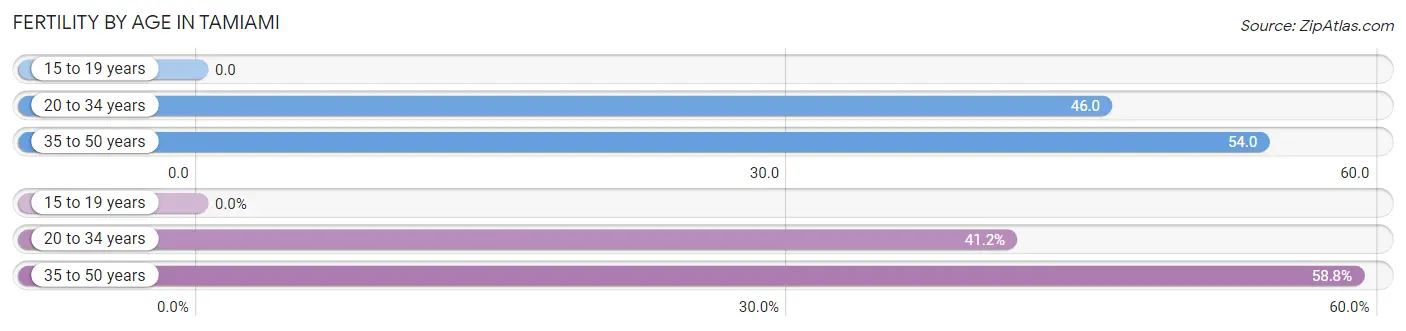
| Age Bracket | Women with Births | Births / 1,000 Women |
| 15 to 19 years | 0 (0.0%) | 0.0 |
| 20 to 34 years | 212 (41.2%) | 46.0 |
| 35 to 50 years | 303 (58.8%) | 54.0 |
| Total | 515 (100.0%) | 44.0 |
Fertility by Age by Marriage Status in Tamiami
57.5% of women with births (515) in Tamiami are married. The highest percentage of unmarried women with births falls into 35 to 50 years age bracket with 55.1% of them unmarried at the time of birth, while the lowest percentage of unmarried women with births belong to 20 to 34 years age bracket with 24.5% of them unmarried.
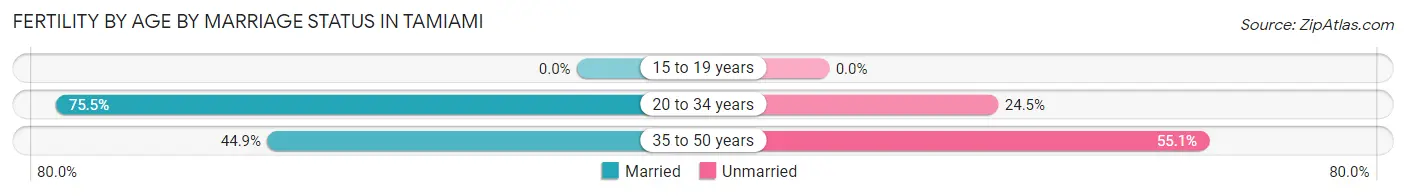
| Age Bracket | Married | Unmarried |
| 15 to 19 years | 0 (0.0%) | 0 (0.0%) |
| 20 to 34 years | 160 (75.5%) | 52 (24.5%) |
| 35 to 50 years | 136 (44.9%) | 167 (55.1%) |
| Total | 296 (57.5%) | 219 (42.5%) |
Fertility by Education in Tamiami
Average fertility rate in Tamiami is 44.0 births per 1,000 women. Women with the education attainment of graduate degree have the highest fertility rate of 132.0 births per 1,000 women, while women with the education attainment of less than high school have the lowest fertility at 10.0 births per 1,000 women. Women with the education attainment of graduate degree represent 32.2% of all women with births.
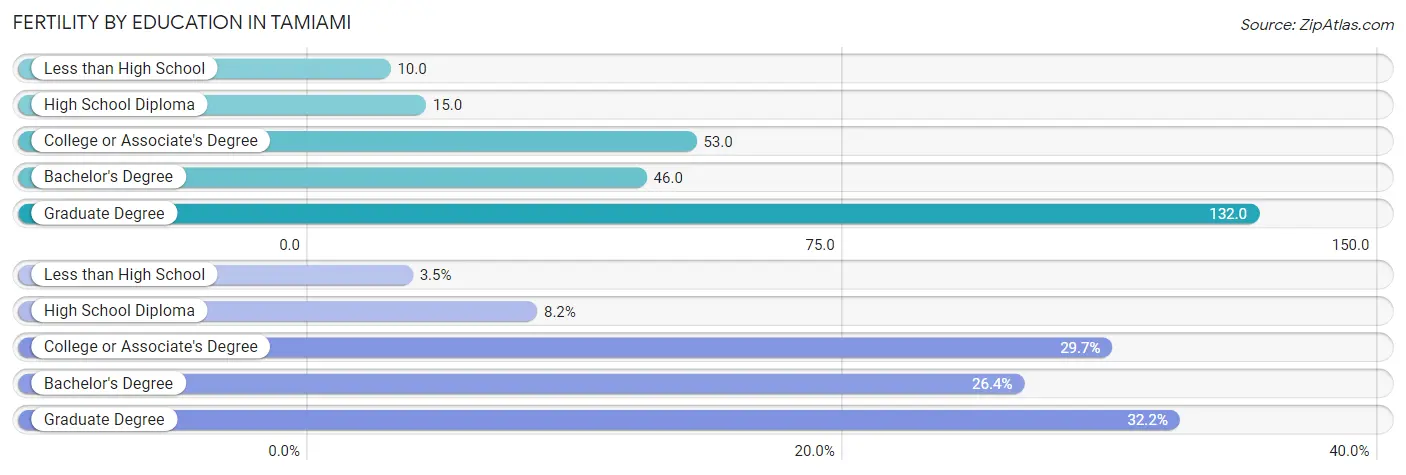
| Educational Attainment | Women with Births | Births / 1,000 Women |
| Less than High School | 18 (3.5%) | 10.0 |
| High School Diploma | 42 (8.2%) | 15.0 |
| College or Associate's Degree | 153 (29.7%) | 53.0 |
| Bachelor's Degree | 136 (26.4%) | 46.0 |
| Graduate Degree | 166 (32.2%) | 132.0 |
| Total | 515 (100.0%) | 44.0 |
Fertility by Education by Marriage Status in Tamiami
42.5% of women with births in Tamiami are unmarried. Women with the educational attainment of less than high school are most likely to be married with 100.0% of them married at childbirth, while women with the educational attainment of high school diploma are least likely to be married with 73.8% of them unmarried at childbirth.
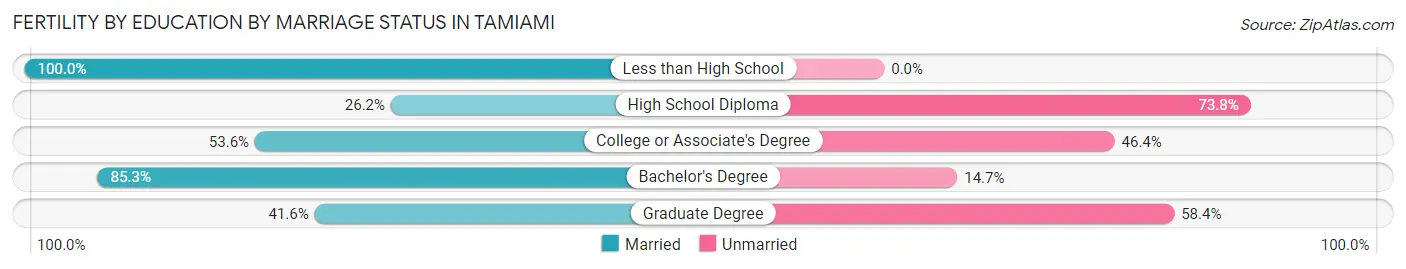
| Educational Attainment | Married | Unmarried |
| Less than High School | 18 (100.0%) | 0 (0.0%) |
| High School Diploma | 11 (26.2%) | 31 (73.8%) |
| College or Associate's Degree | 82 (53.6%) | 71 (46.4%) |
| Bachelor's Degree | 116 (85.3%) | 20 (14.7%) |
| Graduate Degree | 69 (41.6%) | 97 (58.4%) |
| Total | 296 (57.5%) | 219 (42.5%) |
Employment Characteristics in Tamiami
Employment by Class of Employer in Tamiami
Among the 27,277 employed individuals in Tamiami, private company employees (19,504 | 71.5%), self-employed (not incorporated) (2,036 | 7.5%), and local government employees (1,754 | 6.4%) make up the most common classes of employment.
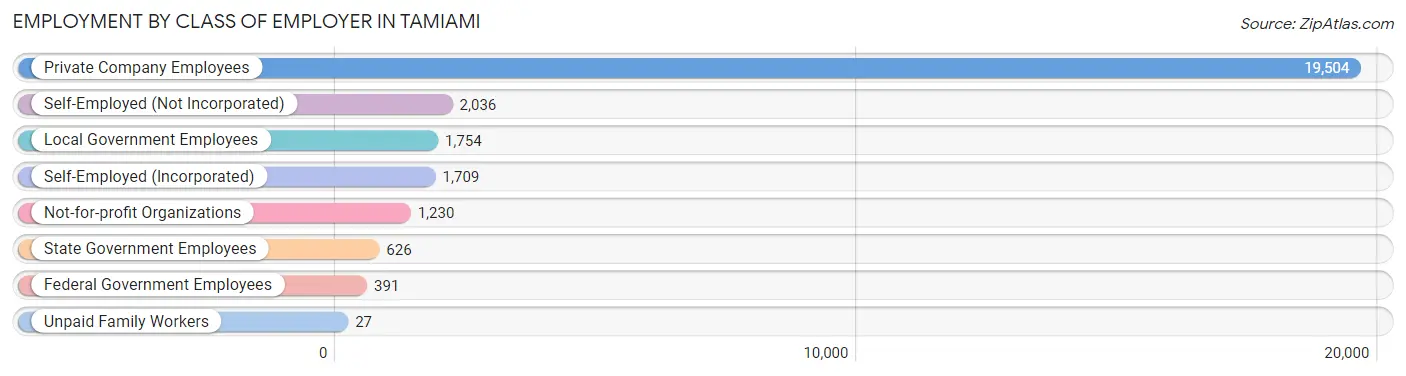
| Employer Class | # Employees | % Employees |
| Private Company Employees | 19,504 | 71.5% |
| Self-Employed (Incorporated) | 1,709 | 6.3% |
| Self-Employed (Not Incorporated) | 2,036 | 7.5% |
| Not-for-profit Organizations | 1,230 | 4.5% |
| Local Government Employees | 1,754 | 6.4% |
| State Government Employees | 626 | 2.3% |
| Federal Government Employees | 391 | 1.4% |
| Unpaid Family Workers | 27 | 0.1% |
| Total | 27,277 | 100.0% |
Employment Status by Age in Tamiami
According to the labor force statistics for Tamiami, out of the total population over 16 years of age (45,809), 63.5% or 29,089 individuals are in the labor force, with 3.3% or 960 of them unemployed. The age group with the highest labor force participation rate is 30 to 34 years, with 87.7% or 2,170 individuals in the labor force. Within the labor force, the 16 to 19 years age range has the highest percentage of unemployed individuals, with 12.7% or 68 of them being unemployed.
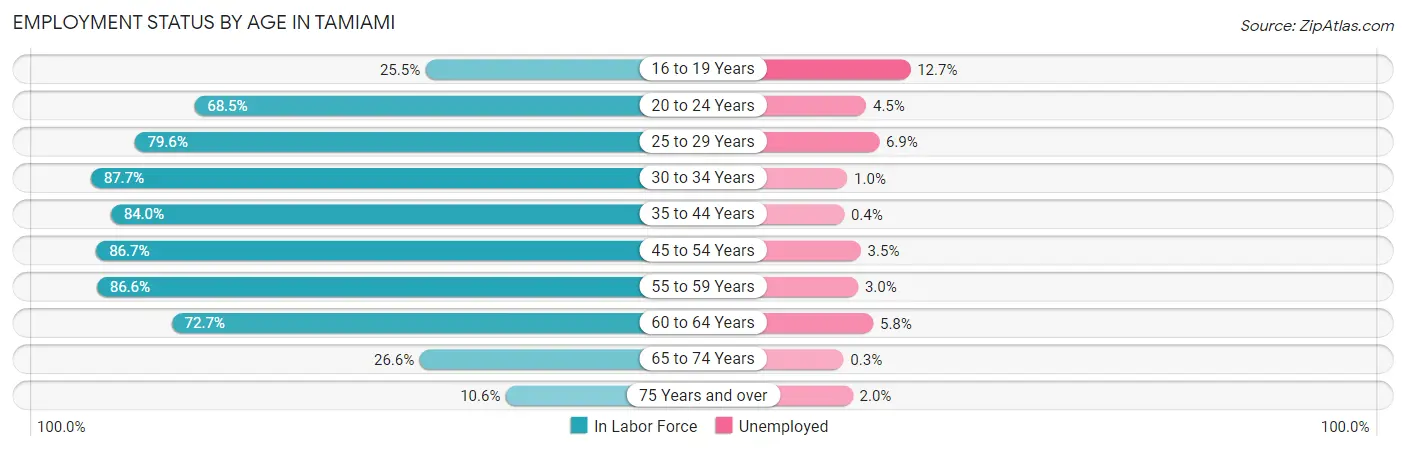
| Age Bracket | In Labor Force | Unemployed |
| 16 to 19 Years | 535 (25.5%) | 68 (12.7%) |
| 20 to 24 Years | 2,356 (68.5%) | 106 (4.5%) |
| 25 to 29 Years | 2,960 (79.6%) | 204 (6.9%) |
| 30 to 34 Years | 2,170 (87.7%) | 22 (1.0%) |
| 35 to 44 Years | 5,220 (84.0%) | 21 (0.4%) |
| 45 to 54 Years | 7,155 (86.7%) | 250 (3.5%) |
| 55 to 59 Years | 3,613 (86.6%) | 108 (3.0%) |
| 60 to 64 Years | 2,909 (72.7%) | 169 (5.8%) |
| 65 to 74 Years | 1,563 (26.6%) | 5 (0.3%) |
| 75 Years and over | 589 (10.6%) | 12 (2.0%) |
| Total | 29,089 (63.5%) | 960 (3.3%) |
Employment Status by Educational Attainment in Tamiami
According to labor force statistics for Tamiami, 83.3% of individuals (24,018) out of the total population between 25 and 64 years of age (28,833) are in the labor force, with 3.2% or 769 of them being unemployed. The group with the highest labor force participation rate are those with the educational attainment of bachelor's degree or higher, with 89.0% or 9,475 individuals in the labor force. Within the labor force, individuals with high school diploma education have the highest percentage of unemployment, with 3.9% or 237 of them being unemployed.
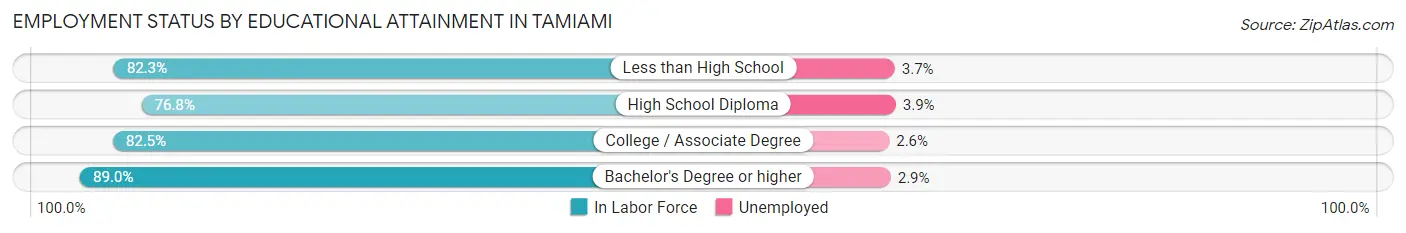
| Educational Attainment | In Labor Force | Unemployed |
| Less than High School | 3,446 (82.3%) | 155 (3.7%) |
| High School Diploma | 6,082 (76.8%) | 309 (3.9%) |
| College / Associate Degree | 5,017 (82.5%) | 158 (2.6%) |
| Bachelor's Degree or higher | 9,475 (89.0%) | 309 (2.9%) |
| Total | 24,018 (83.3%) | 923 (3.2%) |
Employment Occupations by Sex in Tamiami
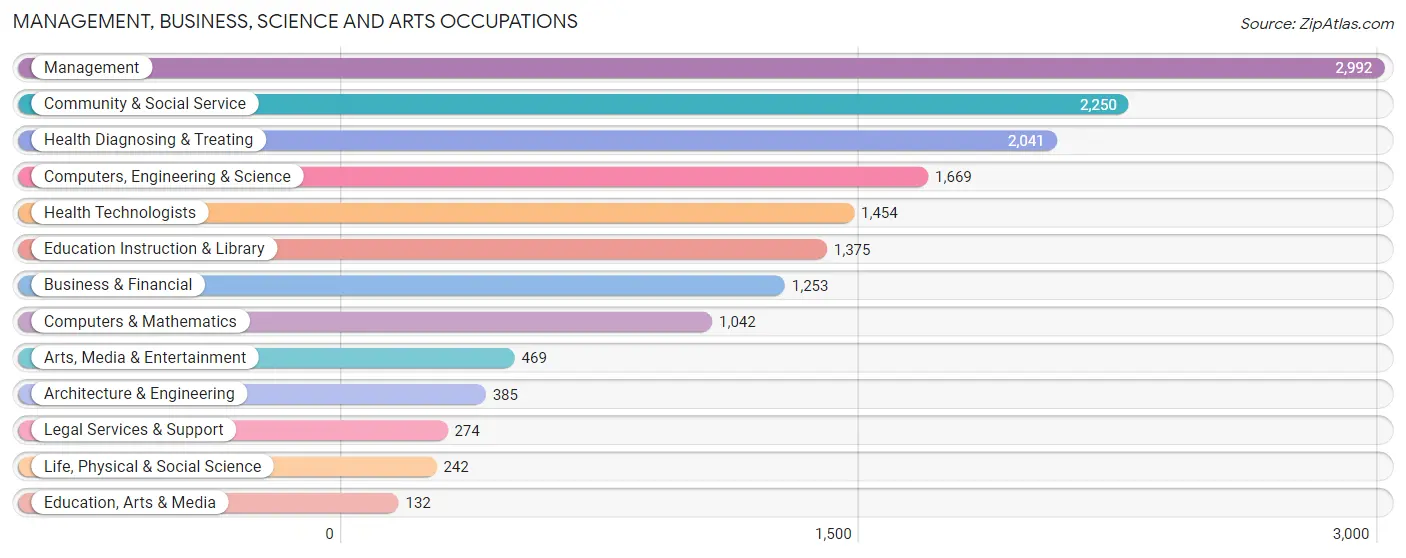
Management, Business, Science and Arts Occupations
The most common Management, Business, Science and Arts occupations in Tamiami are Management (2,992 | 10.6%), Community & Social Service (2,250 | 8.0%), Health Diagnosing & Treating (2,041 | 7.3%), Computers, Engineering & Science (1,669 | 5.9%), and Health Technologists (1,454 | 5.2%).
Management, Business, Science and Arts Occupations by Sex
Within the Management, Business, Science and Arts occupations in Tamiami, the most male-oriented occupations are Architecture & Engineering (84.9%), Computers & Mathematics (69.2%), and Computers, Engineering & Science (63.9%), while the most female-oriented occupations are Life, Physical & Social Science (92.6%), Education Instruction & Library (78.1%), and Community & Social Service (69.2%).
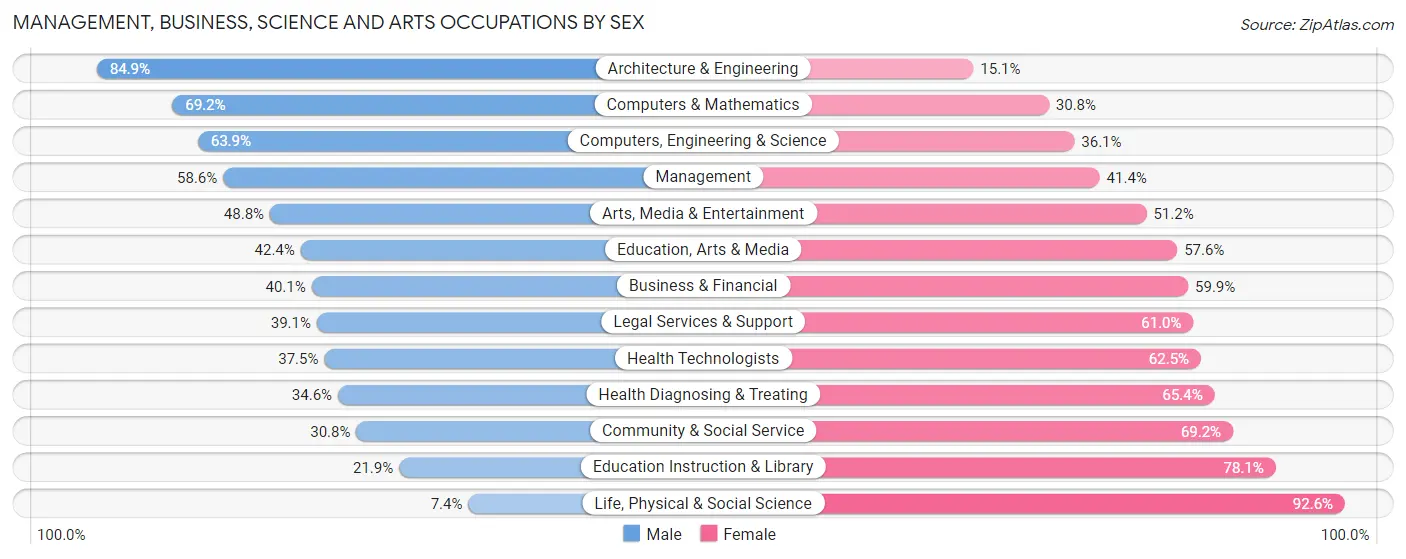
| Occupation | Male | Female |
| Management | 1,753 (58.6%) | 1,239 (41.4%) |
| Business & Financial | 503 (40.1%) | 750 (59.9%) |
| Computers, Engineering & Science | 1,066 (63.9%) | 603 (36.1%) |
| Computers & Mathematics | 721 (69.2%) | 321 (30.8%) |
| Architecture & Engineering | 327 (84.9%) | 58 (15.1%) |
| Life, Physical & Social Science | 18 (7.4%) | 224 (92.6%) |
| Community & Social Service | 693 (30.8%) | 1,557 (69.2%) |
| Education, Arts & Media | 56 (42.4%) | 76 (57.6%) |
| Legal Services & Support | 107 (39.1%) | 167 (61.0%) |
| Education Instruction & Library | 301 (21.9%) | 1,074 (78.1%) |
| Arts, Media & Entertainment | 229 (48.8%) | 240 (51.2%) |
| Health Diagnosing & Treating | 707 (34.6%) | 1,334 (65.4%) |
| Health Technologists | 545 (37.5%) | 909 (62.5%) |
| Total (Category) | 4,722 (46.3%) | 5,483 (53.7%) |
| Total (Overall) | 14,906 (53.0%) | 13,198 (47.0%) |
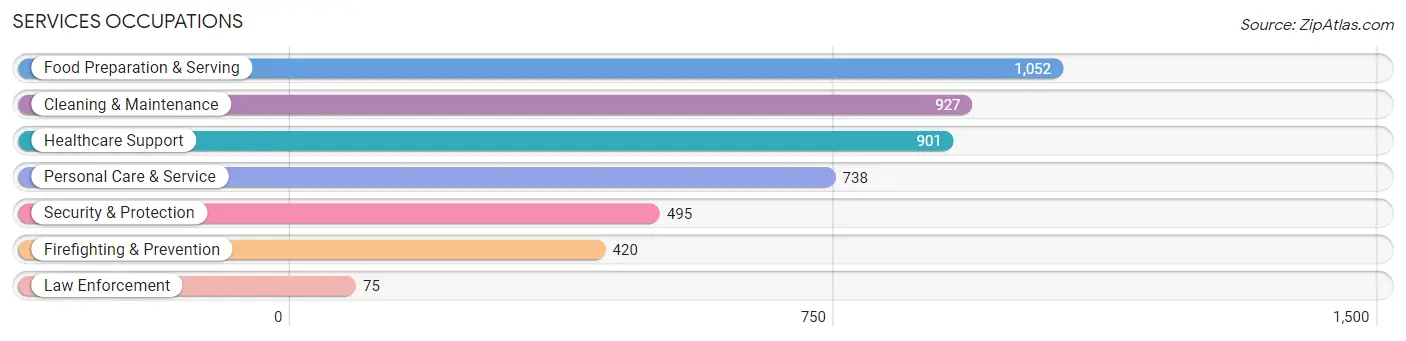
Services Occupations
The most common Services occupations in Tamiami are Food Preparation & Serving (1,052 | 3.7%), Cleaning & Maintenance (927 | 3.3%), Healthcare Support (901 | 3.2%), Personal Care & Service (738 | 2.6%), and Security & Protection (495 | 1.8%).
Services Occupations by Sex
Within the Services occupations in Tamiami, the most male-oriented occupations are Firefighting & Prevention (77.1%), Security & Protection (73.7%), and Law Enforcement (54.7%), while the most female-oriented occupations are Healthcare Support (79.8%), Personal Care & Service (79.5%), and Cleaning & Maintenance (54.6%).
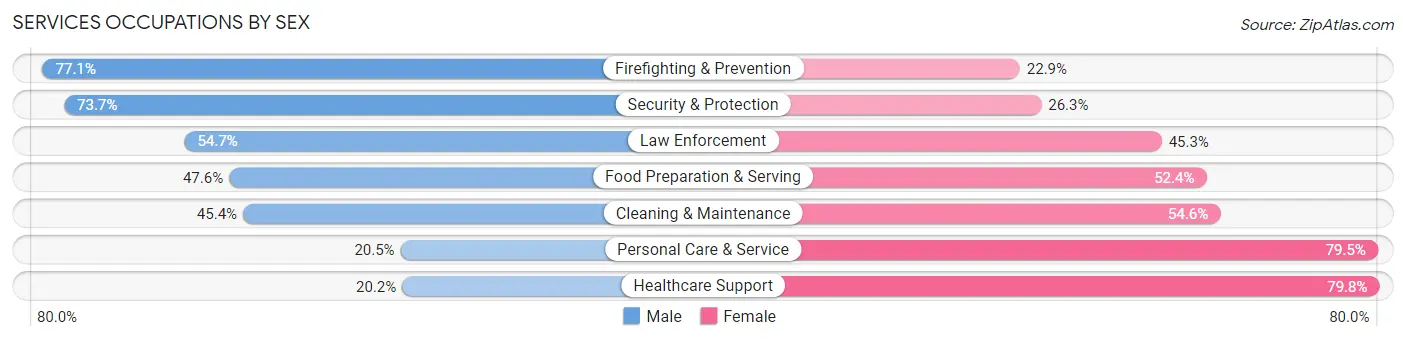
| Occupation | Male | Female |
| Healthcare Support | 182 (20.2%) | 719 (79.8%) |
| Security & Protection | 365 (73.7%) | 130 (26.3%) |
| Firefighting & Prevention | 324 (77.1%) | 96 (22.9%) |
| Law Enforcement | 41 (54.7%) | 34 (45.3%) |
| Food Preparation & Serving | 501 (47.6%) | 551 (52.4%) |
| Cleaning & Maintenance | 421 (45.4%) | 506 (54.6%) |
| Personal Care & Service | 151 (20.5%) | 587 (79.5%) |
| Total (Category) | 1,620 (39.4%) | 2,493 (60.6%) |
| Total (Overall) | 14,906 (53.0%) | 13,198 (47.0%) |
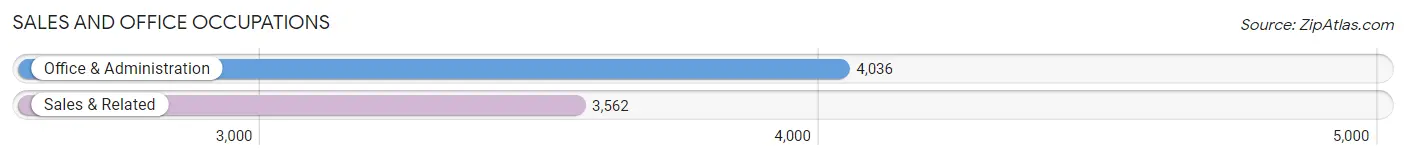
Sales and Office Occupations
The most common Sales and Office occupations in Tamiami are Office & Administration (4,036 | 14.4%), and Sales & Related (3,562 | 12.7%).
Sales and Office Occupations by Sex
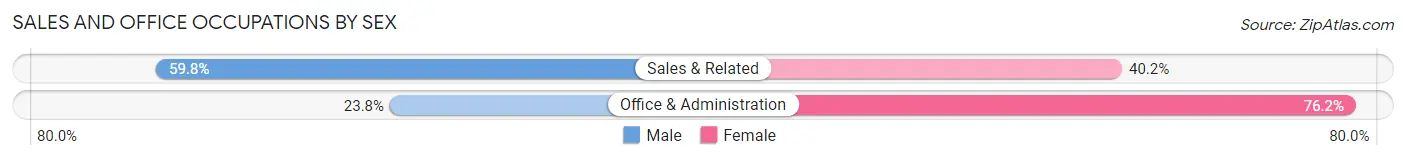
| Occupation | Male | Female |
| Sales & Related | 2,129 (59.8%) | 1,433 (40.2%) |
| Office & Administration | 961 (23.8%) | 3,075 (76.2%) |
| Total (Category) | 3,090 (40.7%) | 4,508 (59.3%) |
| Total (Overall) | 14,906 (53.0%) | 13,198 (47.0%) |
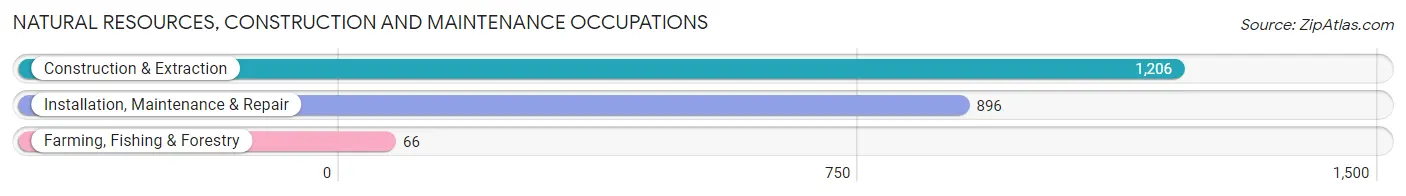
Natural Resources, Construction and Maintenance Occupations
The most common Natural Resources, Construction and Maintenance occupations in Tamiami are Construction & Extraction (1,206 | 4.3%), Installation, Maintenance & Repair (896 | 3.2%), and Farming, Fishing & Forestry (66 | 0.2%).
Natural Resources, Construction and Maintenance Occupations by Sex
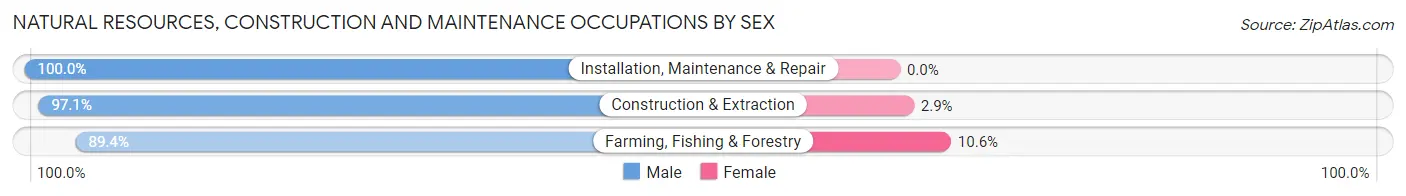
| Occupation | Male | Female |
| Farming, Fishing & Forestry | 59 (89.4%) | 7 (10.6%) |
| Construction & Extraction | 1,171 (97.1%) | 35 (2.9%) |
| Installation, Maintenance & Repair | 896 (100.0%) | 0 (0.0%) |
| Total (Category) | 2,126 (98.1%) | 42 (1.9%) |
| Total (Overall) | 14,906 (53.0%) | 13,198 (47.0%) |
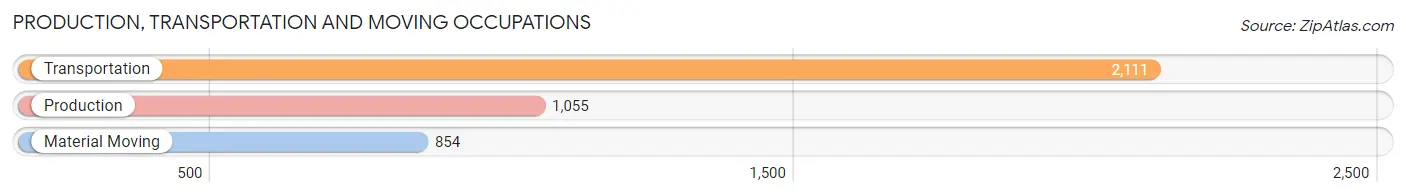
Production, Transportation and Moving Occupations
The most common Production, Transportation and Moving occupations in Tamiami are Transportation (2,111 | 7.5%), Production (1,055 | 3.7%), and Material Moving (854 | 3.0%).
Production, Transportation and Moving Occupations by Sex
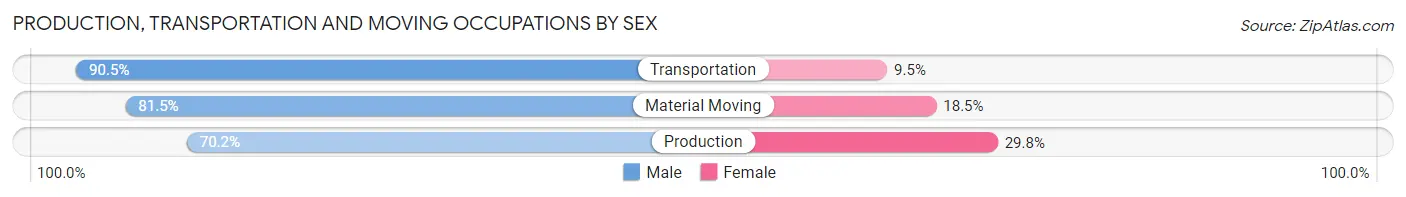
| Occupation | Male | Female |
| Production | 741 (70.2%) | 314 (29.8%) |
| Transportation | 1,911 (90.5%) | 200 (9.5%) |
| Material Moving | 696 (81.5%) | 158 (18.5%) |
| Total (Category) | 3,348 (83.3%) | 672 (16.7%) |
| Total (Overall) | 14,906 (53.0%) | 13,198 (47.0%) |
Employment Industries by Sex in Tamiami
Employment Industries in Tamiami
The major employment industries in Tamiami include Health Care & Social Assistance (4,406 | 15.7%), Retail Trade (3,740 | 13.3%), Transportation & Warehousing (2,930 | 10.4%), Educational Services (2,565 | 9.1%), and Construction (1,921 | 6.8%).
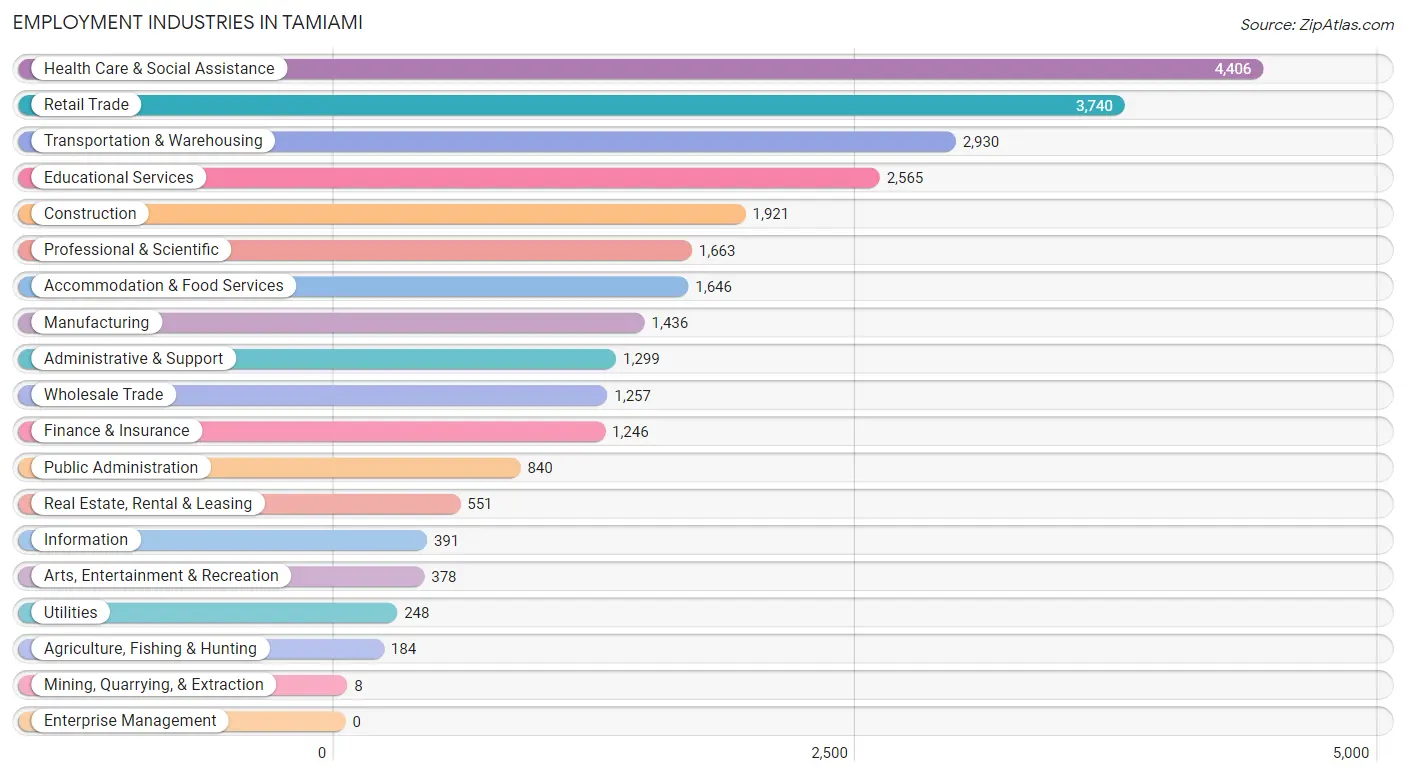
Employment Industries by Sex in Tamiami
The Tamiami industries that see more men than women are Mining, Quarrying, & Extraction (100.0%), Utilities (87.1%), and Construction (86.3%), whereas the industries that tend to have a higher number of women are Educational Services (71.8%), Arts, Entertainment & Recreation (67.2%), and Health Care & Social Assistance (64.5%).
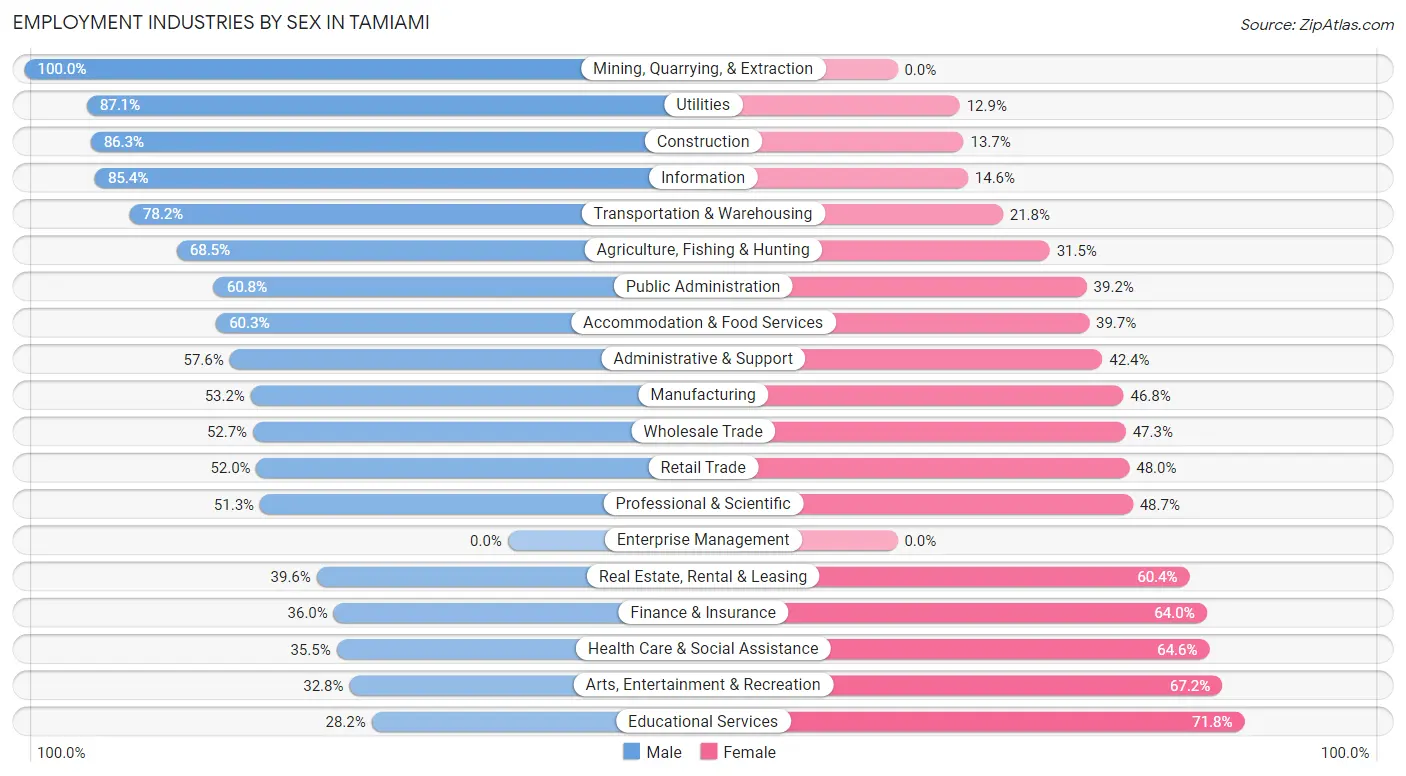
| Industry | Male | Female |
| Agriculture, Fishing & Hunting | 126 (68.5%) | 58 (31.5%) |
| Mining, Quarrying, & Extraction | 8 (100.0%) | 0 (0.0%) |
| Construction | 1,658 (86.3%) | 263 (13.7%) |
| Manufacturing | 764 (53.2%) | 672 (46.8%) |
| Wholesale Trade | 663 (52.7%) | 594 (47.3%) |
| Retail Trade | 1,945 (52.0%) | 1,795 (48.0%) |
| Transportation & Warehousing | 2,291 (78.2%) | 639 (21.8%) |
| Utilities | 216 (87.1%) | 32 (12.9%) |
| Information | 334 (85.4%) | 57 (14.6%) |
| Finance & Insurance | 449 (36.0%) | 797 (64.0%) |
| Real Estate, Rental & Leasing | 218 (39.6%) | 333 (60.4%) |
| Professional & Scientific | 853 (51.3%) | 810 (48.7%) |
| Enterprise Management | 0 (0.0%) | 0 (0.0%) |
| Administrative & Support | 748 (57.6%) | 551 (42.4%) |
| Educational Services | 723 (28.2%) | 1,842 (71.8%) |
| Health Care & Social Assistance | 1,562 (35.4%) | 2,844 (64.5%) |
| Arts, Entertainment & Recreation | 124 (32.8%) | 254 (67.2%) |
| Accommodation & Food Services | 993 (60.3%) | 653 (39.7%) |
| Public Administration | 511 (60.8%) | 329 (39.2%) |
| Total | 14,906 (53.0%) | 13,198 (47.0%) |
Education in Tamiami
School Enrollment in Tamiami
The most common levels of schooling among the 10,712 students in Tamiami are college / undergraduate (2,960 | 27.6%), high school (2,336 | 21.8%), and middle school (1,800 | 16.8%).
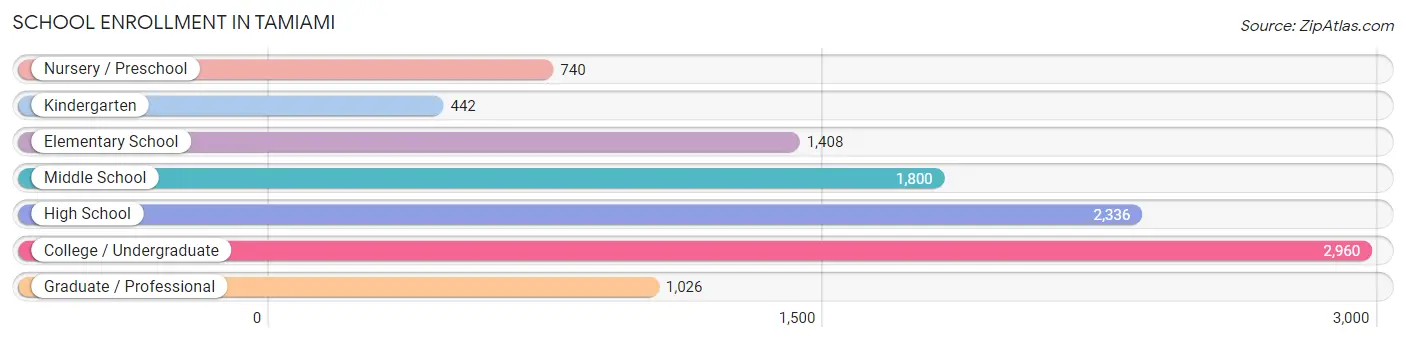
| School Level | # Students | % Students |
| Nursery / Preschool | 740 | 6.9% |
| Kindergarten | 442 | 4.1% |
| Elementary School | 1,408 | 13.1% |
| Middle School | 1,800 | 16.8% |
| High School | 2,336 | 21.8% |
| College / Undergraduate | 2,960 | 27.6% |
| Graduate / Professional | 1,026 | 9.6% |
| Total | 10,712 | 100.0% |
School Enrollment by Age by Funding Source in Tamiami
Out of a total of 10,712 students who are enrolled in schools in Tamiami, 2,207 (20.6%) attend a private institution, while the remaining 8,505 (79.4%) are enrolled in public schools. The age group of 35 years and over has the highest likelihood of being enrolled in private schools, with 248 (43.3% in the age bracket) enrolled. Conversely, the age group of 18 to 19 year olds has the lowest likelihood of being enrolled in a private school, with 800 (96.6% in the age bracket) attending a public institution.
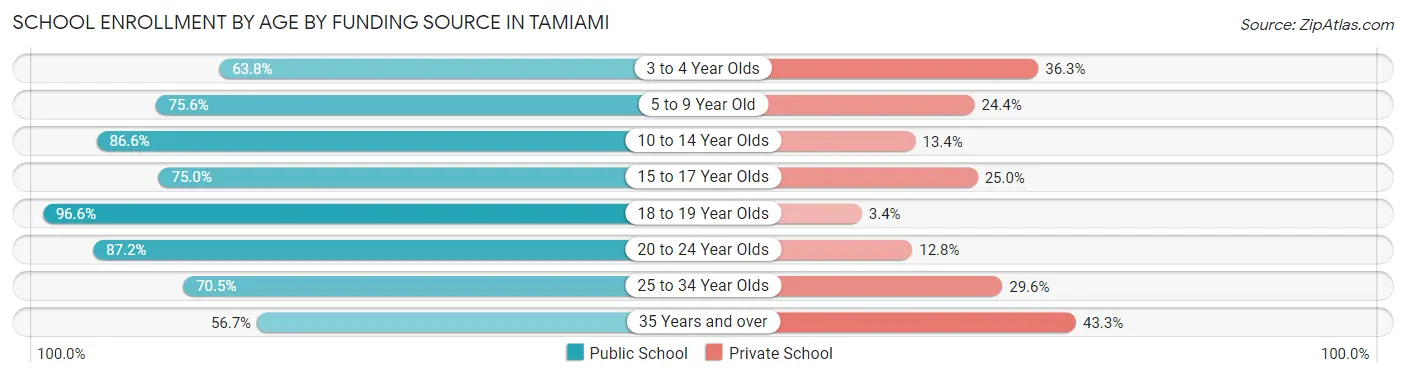
| Age Bracket | Public School | Private School |
| 3 to 4 Year Olds | 371 (63.7%) | 211 (36.2%) |
| 5 to 9 Year Old | 1,393 (75.6%) | 449 (24.4%) |
| 10 to 14 Year Olds | 1,986 (86.6%) | 307 (13.4%) |
| 15 to 17 Year Olds | 1,287 (75.0%) | 428 (25.0%) |
| 18 to 19 Year Olds | 800 (96.6%) | 28 (3.4%) |
| 20 to 24 Year Olds | 1,611 (87.2%) | 236 (12.8%) |
| 25 to 34 Year Olds | 727 (70.5%) | 305 (29.5%) |
| 35 Years and over | 325 (56.7%) | 248 (43.3%) |
| Total | 8,505 (79.4%) | 2,207 (20.6%) |
Educational Attainment by Field of Study in Tamiami
Business (3,550 | 24.9%), science & technology (2,272 | 16.0%), engineering (2,142 | 15.0%), education (1,631 | 11.5%), and arts & humanities (599 | 4.2%) are the most common fields of study among 14,247 individuals in Tamiami who have obtained a bachelor's degree or higher.
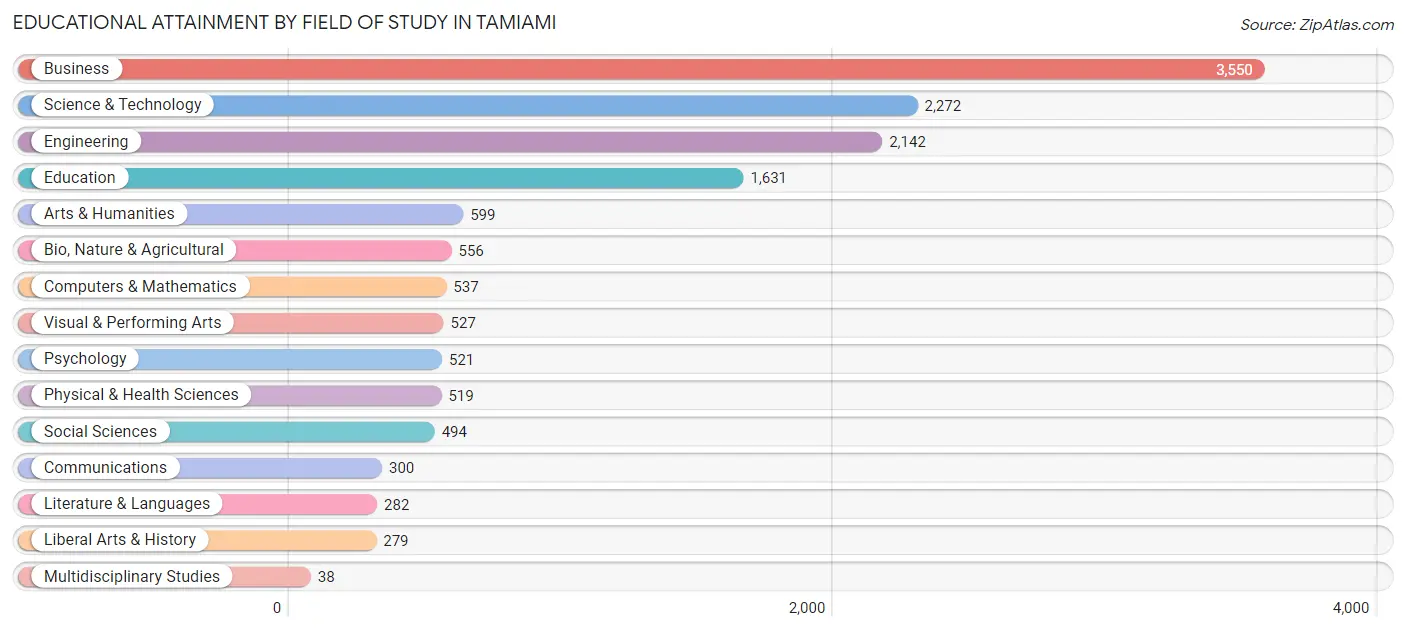
| Field of Study | # Graduates | % Graduates |
| Computers & Mathematics | 537 | 3.8% |
| Bio, Nature & Agricultural | 556 | 3.9% |
| Physical & Health Sciences | 519 | 3.6% |
| Psychology | 521 | 3.7% |
| Social Sciences | 494 | 3.5% |
| Engineering | 2,142 | 15.0% |
| Multidisciplinary Studies | 38 | 0.3% |
| Science & Technology | 2,272 | 16.0% |
| Business | 3,550 | 24.9% |
| Education | 1,631 | 11.5% |
| Literature & Languages | 282 | 2.0% |
| Liberal Arts & History | 279 | 2.0% |
| Visual & Performing Arts | 527 | 3.7% |
| Communications | 300 | 2.1% |
| Arts & Humanities | 599 | 4.2% |
| Total | 14,247 | 100.0% |
Transportation & Commute in Tamiami
Vehicle Availability by Sex in Tamiami
The most prevalent vehicle ownership categories in Tamiami are males with 2 vehicles (5,511, accounting for 38.3%) and females with 2 vehicles (4,591, making up 42.9%).
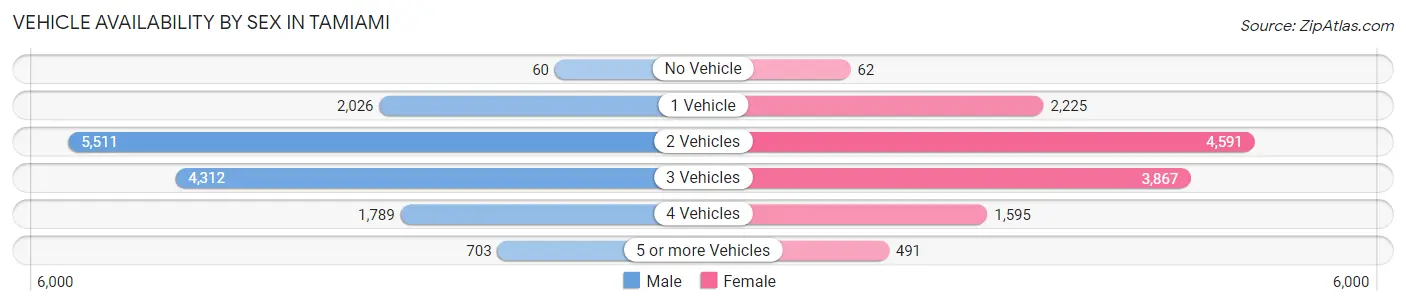
| Vehicles Available | Male | Female |
| No Vehicle | 60 (0.4%) | 62 (0.5%) |
| 1 Vehicle | 2,026 (14.1%) | 2,225 (17.3%) |
| 2 Vehicles | 5,511 (38.3%) | 4,591 (35.8%) |
| 3 Vehicles | 4,312 (29.9%) | 3,867 (30.1%) |
| 4 Vehicles | 1,789 (12.4%) | 1,595 (12.4%) |
| 5 or more Vehicles | 703 (4.9%) | 491 (3.8%) |
| Total | 14,401 (100.0%) | 12,831 (100.0%) |
Commute Time in Tamiami
The most frequently occuring commute durations in Tamiami are 30 to 34 minutes (5,653 commuters, 22.2%), 45 to 59 minutes (4,102 commuters, 16.1%), and 20 to 24 minutes (3,783 commuters, 14.8%).
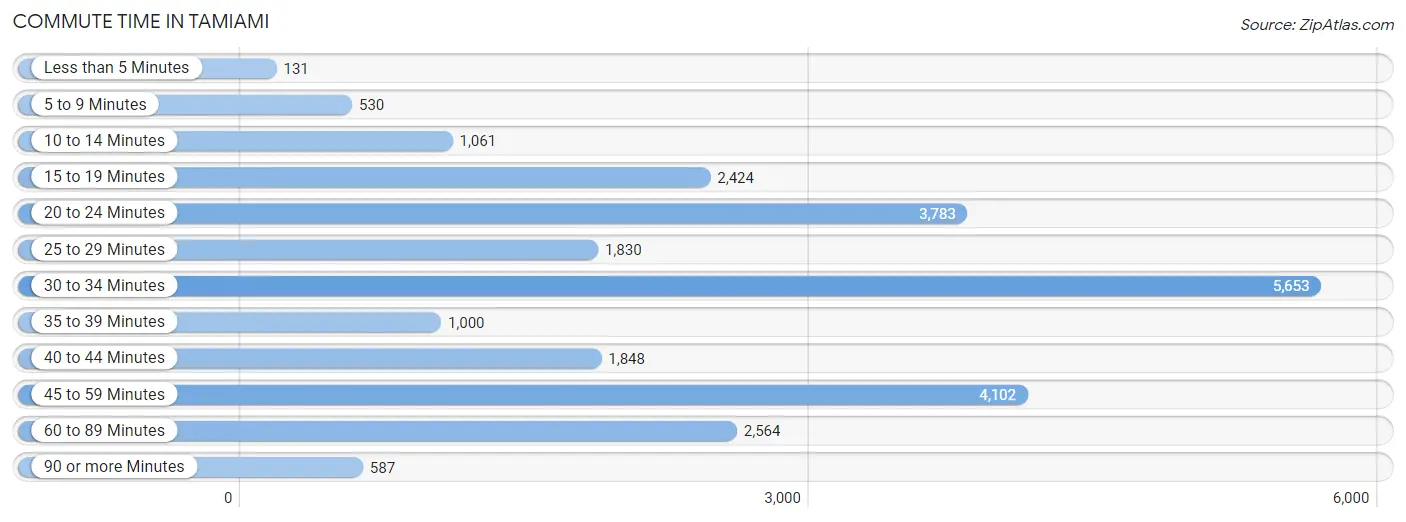
| Commute Time | # Commuters | % Commuters |
| Less than 5 Minutes | 131 | 0.5% |
| 5 to 9 Minutes | 530 | 2.1% |
| 10 to 14 Minutes | 1,061 | 4.2% |
| 15 to 19 Minutes | 2,424 | 9.5% |
| 20 to 24 Minutes | 3,783 | 14.8% |
| 25 to 29 Minutes | 1,830 | 7.2% |
| 30 to 34 Minutes | 5,653 | 22.2% |
| 35 to 39 Minutes | 1,000 | 3.9% |
| 40 to 44 Minutes | 1,848 | 7.2% |
| 45 to 59 Minutes | 4,102 | 16.1% |
| 60 to 89 Minutes | 2,564 | 10.1% |
| 90 or more Minutes | 587 | 2.3% |
Commute Time by Sex in Tamiami
The most common commute times in Tamiami are 30 to 34 minutes (3,036 commuters, 22.5%) for males and 30 to 34 minutes (2,617 commuters, 21.8%) for females.
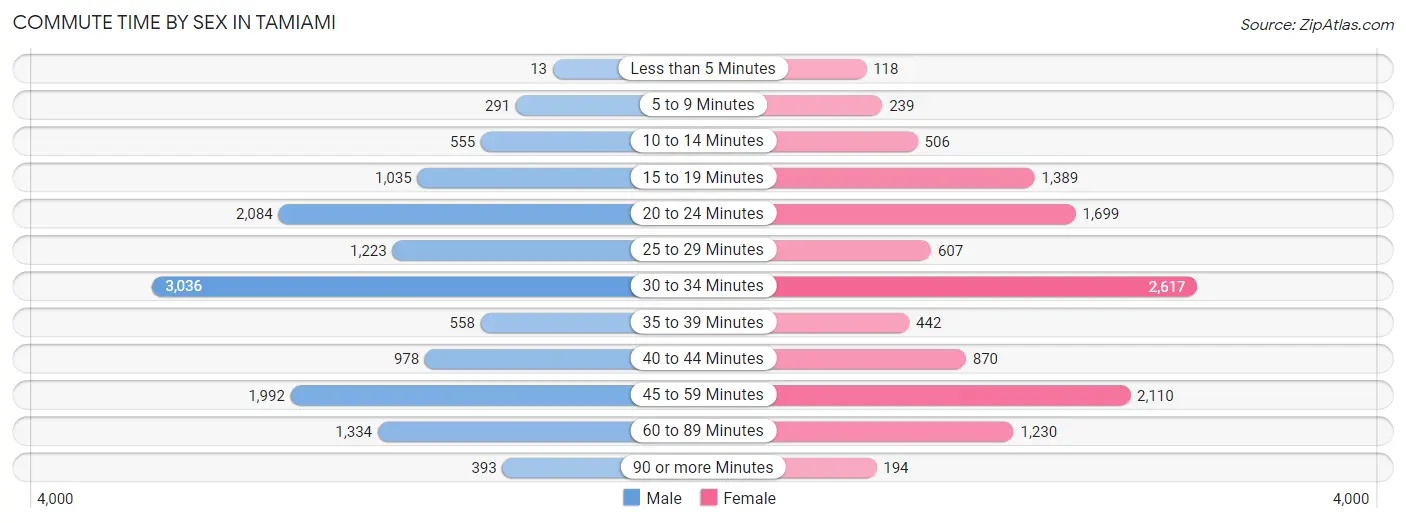
| Commute Time | Male | Female |
| Less than 5 Minutes | 13 (0.1%) | 118 (1.0%) |
| 5 to 9 Minutes | 291 (2.2%) | 239 (2.0%) |
| 10 to 14 Minutes | 555 (4.1%) | 506 (4.2%) |
| 15 to 19 Minutes | 1,035 (7.7%) | 1,389 (11.6%) |
| 20 to 24 Minutes | 2,084 (15.4%) | 1,699 (14.1%) |
| 25 to 29 Minutes | 1,223 (9.1%) | 607 (5.1%) |
| 30 to 34 Minutes | 3,036 (22.5%) | 2,617 (21.8%) |
| 35 to 39 Minutes | 558 (4.1%) | 442 (3.7%) |
| 40 to 44 Minutes | 978 (7.2%) | 870 (7.2%) |
| 45 to 59 Minutes | 1,992 (14.8%) | 2,110 (17.5%) |
| 60 to 89 Minutes | 1,334 (9.9%) | 1,230 (10.2%) |
| 90 or more Minutes | 393 (2.9%) | 194 (1.6%) |
Time of Departure to Work by Sex in Tamiami
The most frequent times of departure to work in Tamiami are 7:00 AM to 7:29 AM (2,530, 18.8%) for males and 8:00 AM to 8:29 AM (2,721, 22.6%) for females.
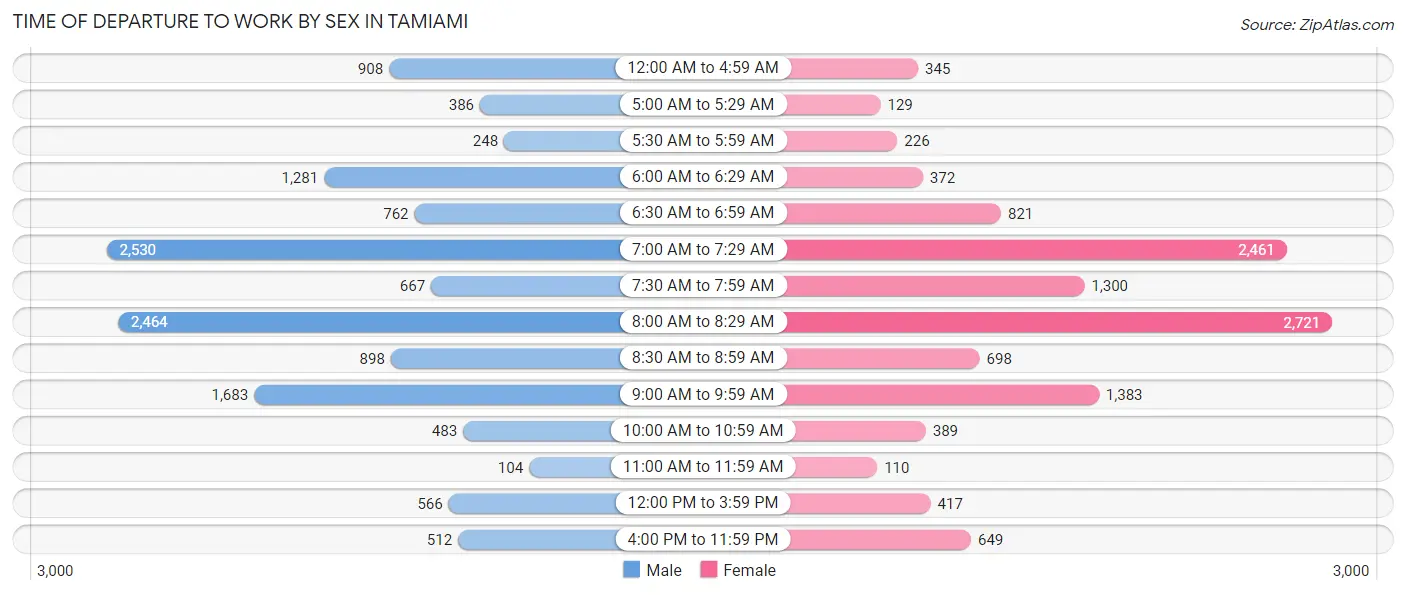
| Time of Departure | Male | Female |
| 12:00 AM to 4:59 AM | 908 (6.7%) | 345 (2.9%) |
| 5:00 AM to 5:29 AM | 386 (2.9%) | 129 (1.1%) |
| 5:30 AM to 5:59 AM | 248 (1.8%) | 226 (1.9%) |
| 6:00 AM to 6:29 AM | 1,281 (9.5%) | 372 (3.1%) |
| 6:30 AM to 6:59 AM | 762 (5.7%) | 821 (6.8%) |
| 7:00 AM to 7:29 AM | 2,530 (18.8%) | 2,461 (20.5%) |
| 7:30 AM to 7:59 AM | 667 (4.9%) | 1,300 (10.8%) |
| 8:00 AM to 8:29 AM | 2,464 (18.3%) | 2,721 (22.6%) |
| 8:30 AM to 8:59 AM | 898 (6.7%) | 698 (5.8%) |
| 9:00 AM to 9:59 AM | 1,683 (12.5%) | 1,383 (11.5%) |
| 10:00 AM to 10:59 AM | 483 (3.6%) | 389 (3.2%) |
| 11:00 AM to 11:59 AM | 104 (0.8%) | 110 (0.9%) |
| 12:00 PM to 3:59 PM | 566 (4.2%) | 417 (3.5%) |
| 4:00 PM to 11:59 PM | 512 (3.8%) | 649 (5.4%) |
| Total | 13,492 (100.0%) | 12,021 (100.0%) |
Housing Occupancy in Tamiami
Occupancy by Ownership in Tamiami
Of the total 17,774 dwellings in Tamiami, owner-occupied units account for 12,962 (72.9%), while renter-occupied units make up 4,812 (27.1%).
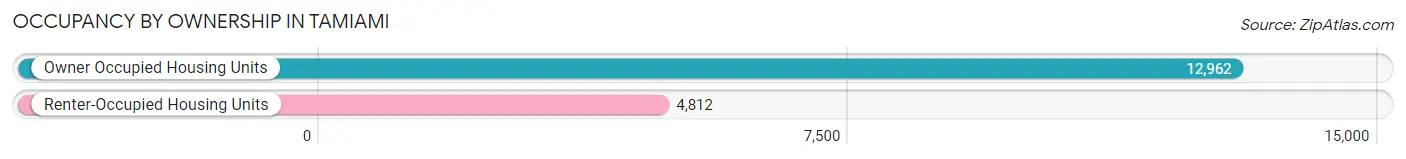
| Occupancy | # Housing Units | % Housing Units |
| Owner Occupied Housing Units | 12,962 | 72.9% |
| Renter-Occupied Housing Units | 4,812 | 27.1% |
| Total Occupied Housing Units | 17,774 | 100.0% |
Occupancy by Household Size in Tamiami
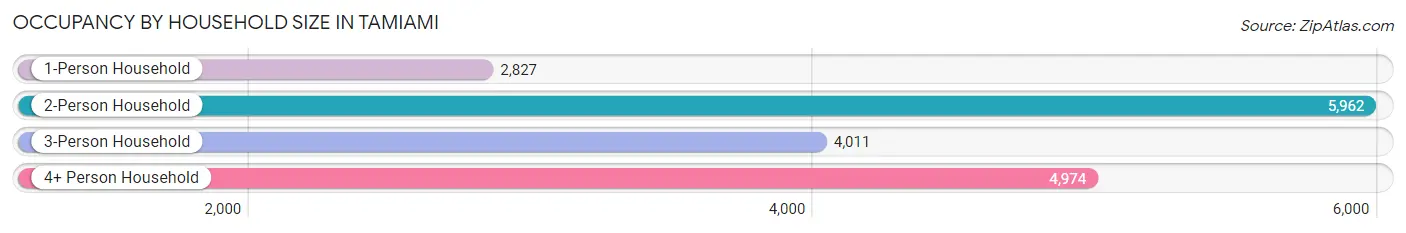
| Household Size | # Housing Units | % Housing Units |
| 1-Person Household | 2,827 | 15.9% |
| 2-Person Household | 5,962 | 33.5% |
| 3-Person Household | 4,011 | 22.6% |
| 4+ Person Household | 4,974 | 28.0% |
| Total Housing Units | 17,774 | 100.0% |
Occupancy by Ownership by Household Size in Tamiami
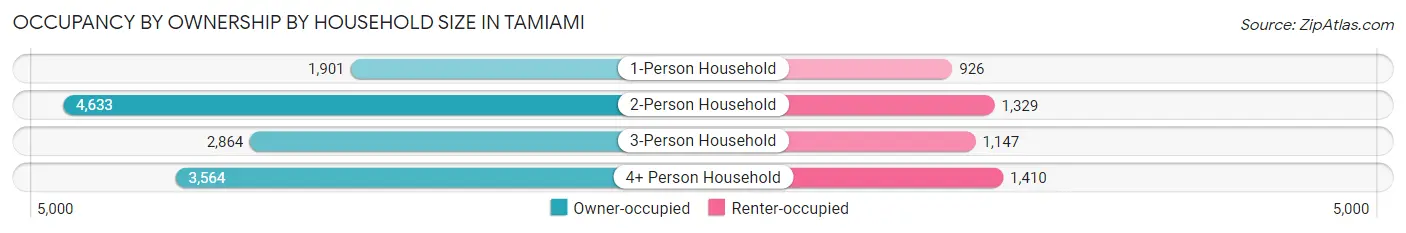
| Household Size | Owner-occupied | Renter-occupied |
| 1-Person Household | 1,901 (67.2%) | 926 (32.8%) |
| 2-Person Household | 4,633 (77.7%) | 1,329 (22.3%) |
| 3-Person Household | 2,864 (71.4%) | 1,147 (28.6%) |
| 4+ Person Household | 3,564 (71.7%) | 1,410 (28.3%) |
| Total Housing Units | 12,962 (72.9%) | 4,812 (27.1%) |
Occupancy by Educational Attainment in Tamiami
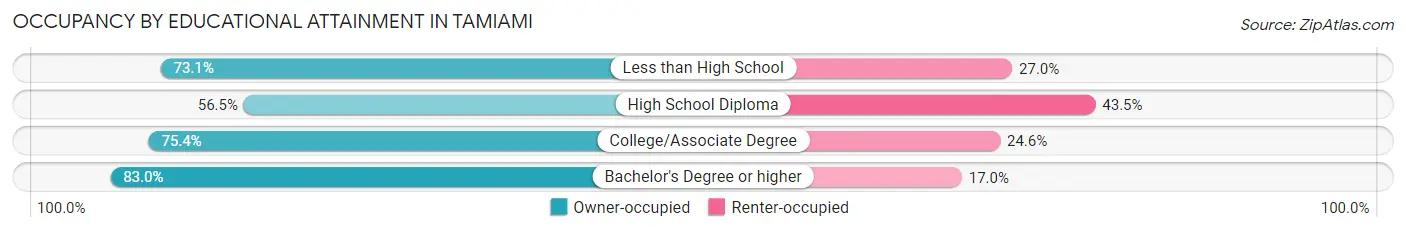
| Household Size | Owner-occupied | Renter-occupied |
| Less than High School | 2,158 (73.1%) | 796 (27.0%) |
| High School Diploma | 2,491 (56.5%) | 1,915 (43.5%) |
| College/Associate Degree | 3,308 (75.4%) | 1,077 (24.6%) |
| Bachelor's Degree or higher | 5,005 (83.0%) | 1,024 (17.0%) |
Occupancy by Age of Householder in Tamiami
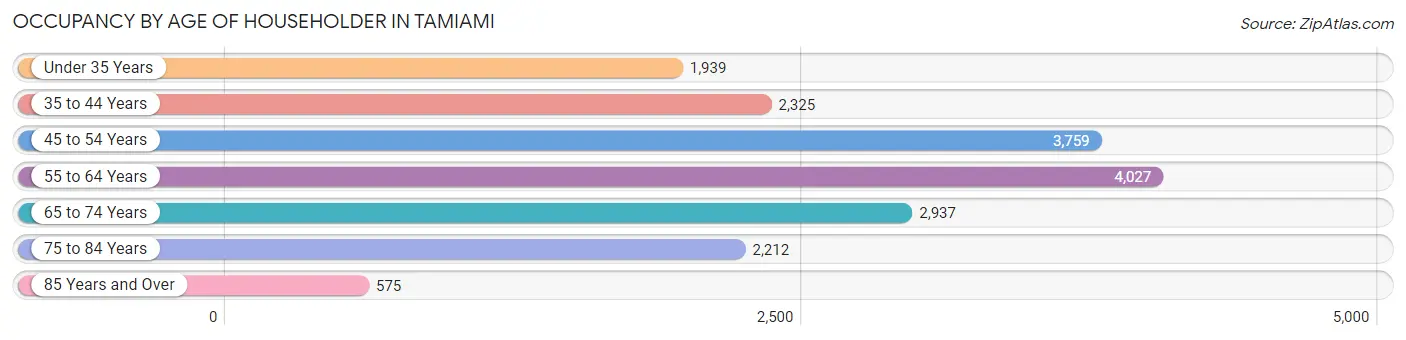
| Age Bracket | # Households | % Households |
| Under 35 Years | 1,939 | 10.9% |
| 35 to 44 Years | 2,325 | 13.1% |
| 45 to 54 Years | 3,759 | 21.1% |
| 55 to 64 Years | 4,027 | 22.7% |
| 65 to 74 Years | 2,937 | 16.5% |
| 75 to 84 Years | 2,212 | 12.4% |
| 85 Years and Over | 575 | 3.2% |
| Total | 17,774 | 100.0% |
Housing Finances in Tamiami
Median Income by Occupancy in Tamiami
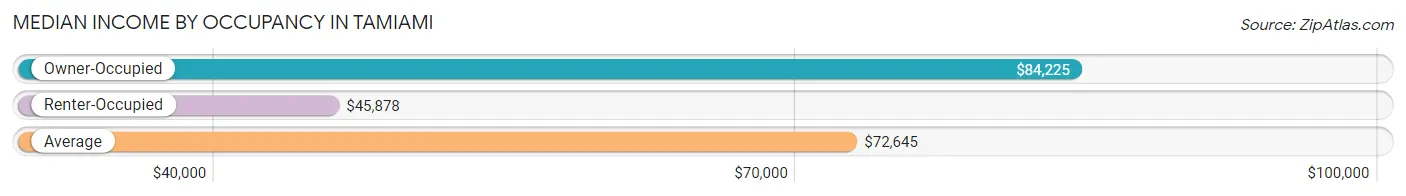
| Occupancy Type | # Households | Median Income |
| Owner-Occupied | 12,962 (72.9%) | $84,225 |
| Renter-Occupied | 4,812 (27.1%) | $45,878 |
| Average | 17,774 (100.0%) | $72,645 |
Occupancy by Householder Income Bracket in Tamiami
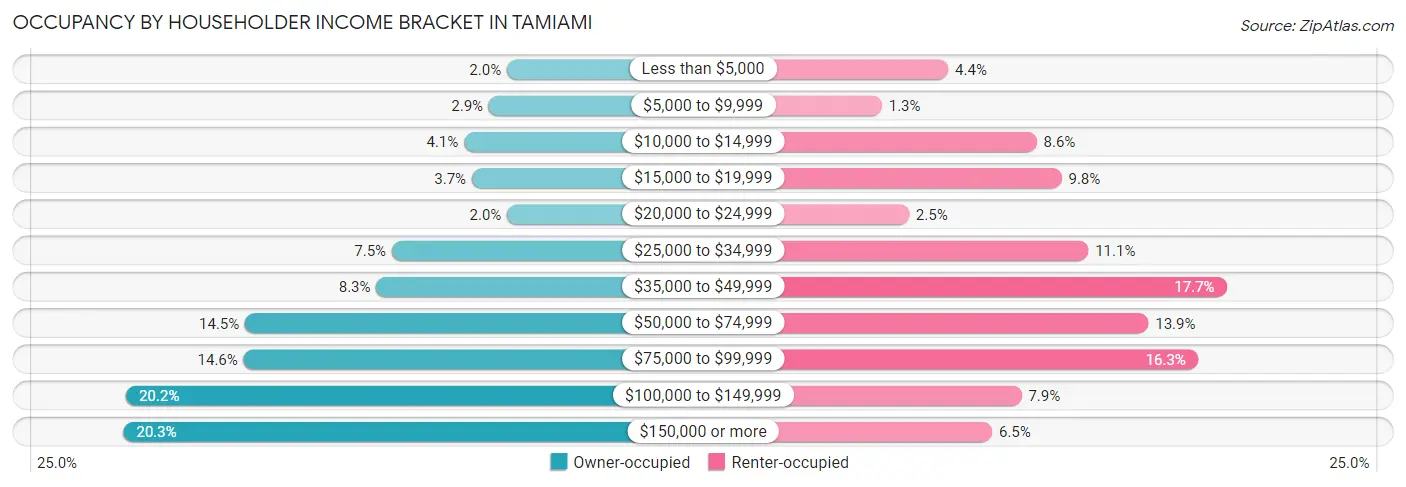
| Income Bracket | Owner-occupied | Renter-occupied |
| Less than $5,000 | 263 (2.0%) | 212 (4.4%) |
| $5,000 to $9,999 | 374 (2.9%) | 60 (1.3%) |
| $10,000 to $14,999 | 527 (4.1%) | 415 (8.6%) |
| $15,000 to $19,999 | 480 (3.7%) | 472 (9.8%) |
| $20,000 to $24,999 | 262 (2.0%) | 122 (2.5%) |
| $25,000 to $34,999 | 974 (7.5%) | 533 (11.1%) |
| $35,000 to $49,999 | 1,069 (8.3%) | 850 (17.7%) |
| $50,000 to $74,999 | 1,879 (14.5%) | 671 (13.9%) |
| $75,000 to $99,999 | 1,889 (14.6%) | 784 (16.3%) |
| $100,000 to $149,999 | 2,614 (20.2%) | 380 (7.9%) |
| $150,000 or more | 2,631 (20.3%) | 313 (6.5%) |
| Total | 12,962 (100.0%) | 4,812 (100.0%) |
Monthly Housing Cost Tiers in Tamiami
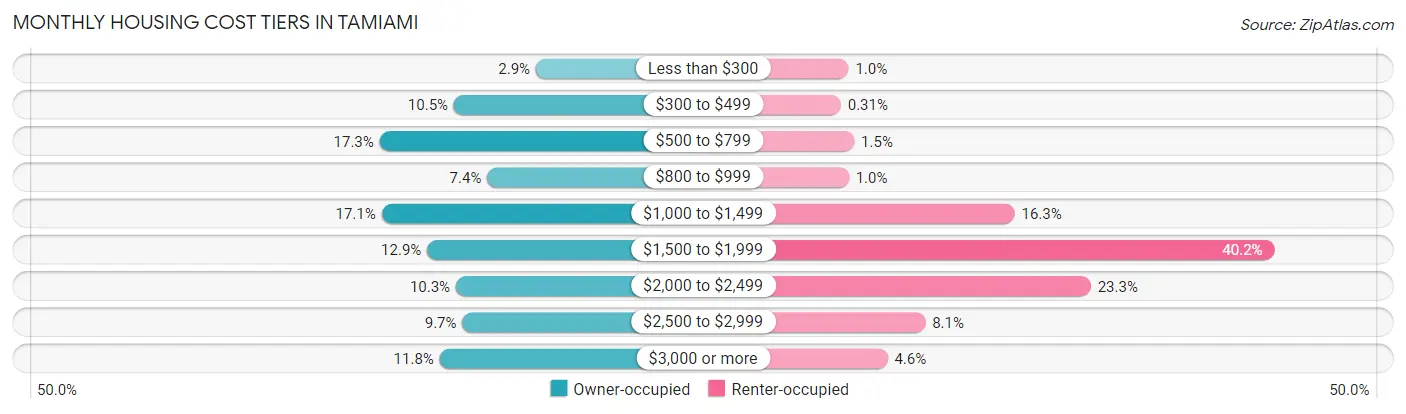
| Monthly Cost | Owner-occupied | Renter-occupied |
| Less than $300 | 380 (2.9%) | 49 (1.0%) |
| $300 to $499 | 1,358 (10.5%) | 15 (0.3%) |
| $500 to $799 | 2,245 (17.3%) | 74 (1.5%) |
| $800 to $999 | 961 (7.4%) | 50 (1.0%) |
| $1,000 to $1,499 | 2,222 (17.1%) | 785 (16.3%) |
| $1,500 to $1,999 | 1,677 (12.9%) | 1,936 (40.2%) |
| $2,000 to $2,499 | 1,334 (10.3%) | 1,122 (23.3%) |
| $2,500 to $2,999 | 1,257 (9.7%) | 389 (8.1%) |
| $3,000 or more | 1,528 (11.8%) | 222 (4.6%) |
| Total | 12,962 (100.0%) | 4,812 (100.0%) |
Physical Housing Characteristics in Tamiami
Housing Structures in Tamiami
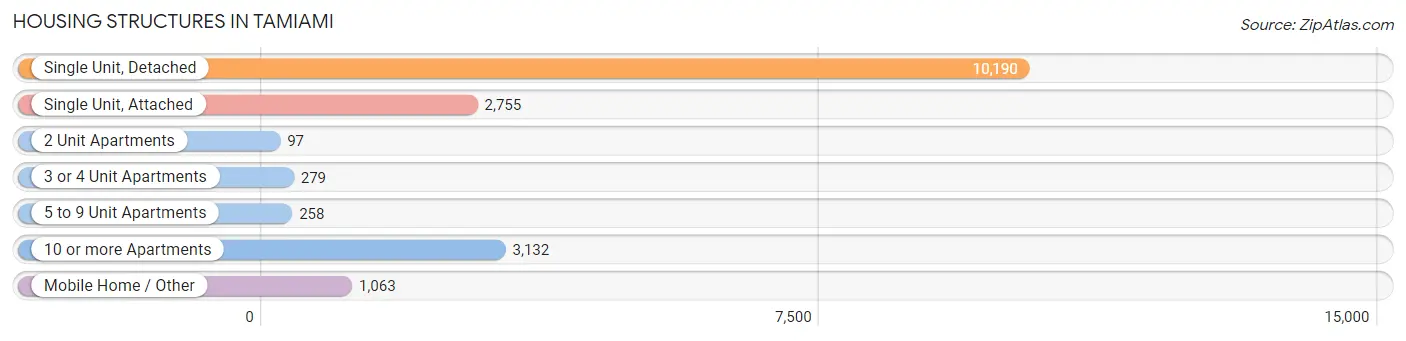
| Structure Type | # Housing Units | % Housing Units |
| Single Unit, Detached | 10,190 | 57.3% |
| Single Unit, Attached | 2,755 | 15.5% |
| 2 Unit Apartments | 97 | 0.5% |
| 3 or 4 Unit Apartments | 279 | 1.6% |
| 5 to 9 Unit Apartments | 258 | 1.5% |
| 10 or more Apartments | 3,132 | 17.6% |
| Mobile Home / Other | 1,063 | 6.0% |
| Total | 17,774 | 100.0% |
Housing Structures by Occupancy in Tamiami
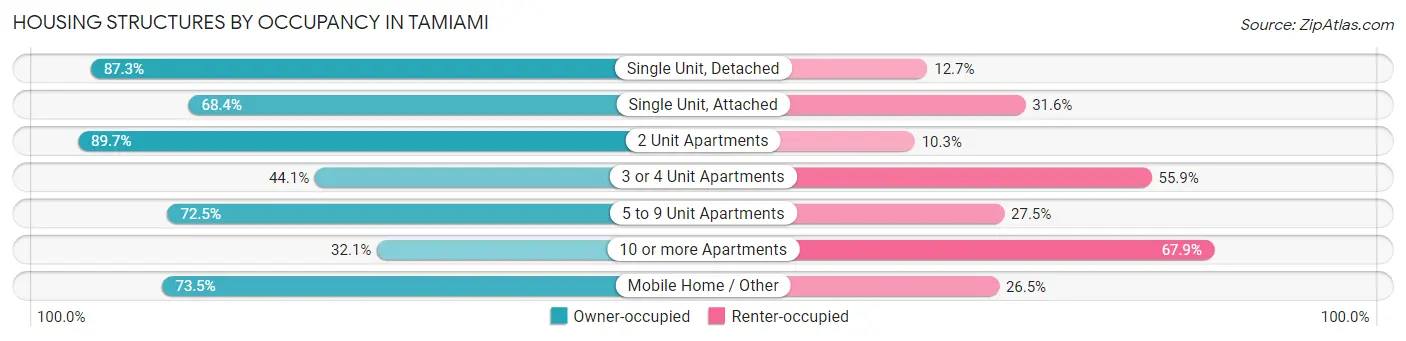
| Structure Type | Owner-occupied | Renter-occupied |
| Single Unit, Detached | 8,893 (87.3%) | 1,297 (12.7%) |
| Single Unit, Attached | 1,885 (68.4%) | 870 (31.6%) |
| 2 Unit Apartments | 87 (89.7%) | 10 (10.3%) |
| 3 or 4 Unit Apartments | 123 (44.1%) | 156 (55.9%) |
| 5 to 9 Unit Apartments | 187 (72.5%) | 71 (27.5%) |
| 10 or more Apartments | 1,006 (32.1%) | 2,126 (67.9%) |
| Mobile Home / Other | 781 (73.5%) | 282 (26.5%) |
| Total | 12,962 (72.9%) | 4,812 (27.1%) |
Housing Structures by Number of Rooms in Tamiami
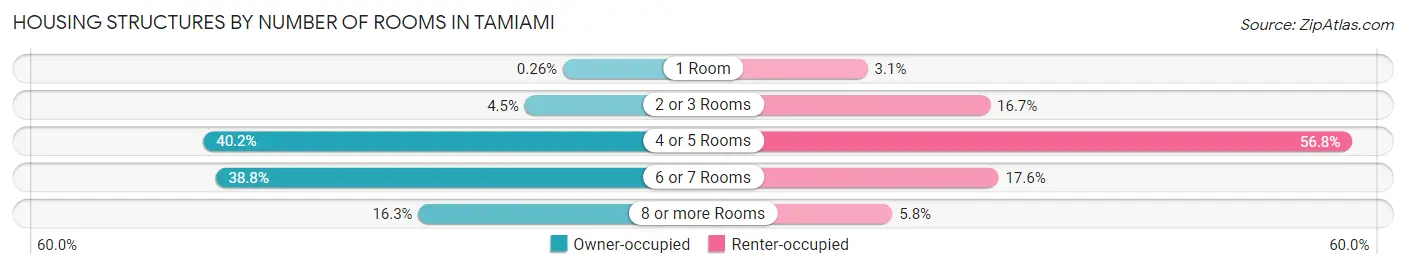
| Number of Rooms | Owner-occupied | Renter-occupied |
| 1 Room | 34 (0.3%) | 148 (3.1%) |
| 2 or 3 Rooms | 582 (4.5%) | 802 (16.7%) |
| 4 or 5 Rooms | 5,205 (40.2%) | 2,735 (56.8%) |
| 6 or 7 Rooms | 5,030 (38.8%) | 847 (17.6%) |
| 8 or more Rooms | 2,111 (16.3%) | 280 (5.8%) |
| Total | 12,962 (100.0%) | 4,812 (100.0%) |
Housing Structure by Heating Type in Tamiami
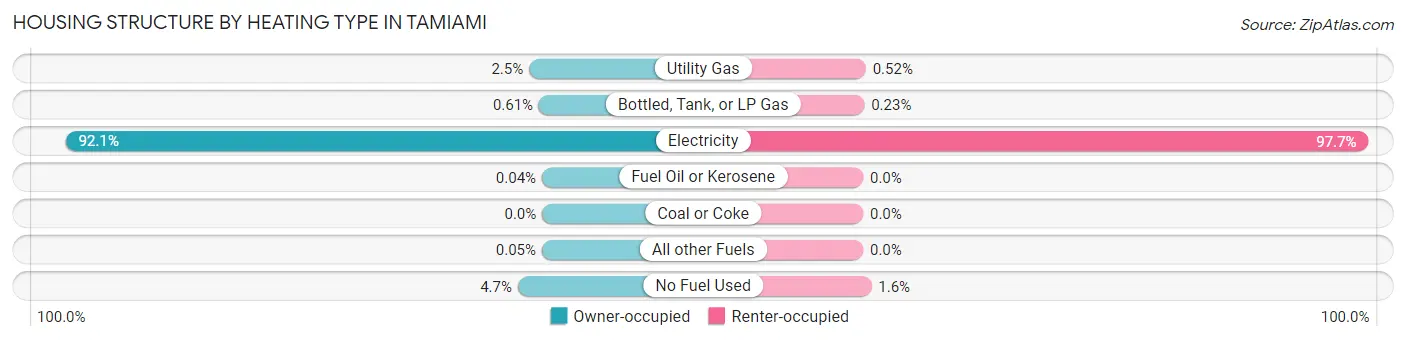
| Heating Type | Owner-occupied | Renter-occupied |
| Utility Gas | 326 (2.5%) | 25 (0.5%) |
| Bottled, Tank, or LP Gas | 79 (0.6%) | 11 (0.2%) |
| Electricity | 11,937 (92.1%) | 4,699 (97.7%) |
| Fuel Oil or Kerosene | 5 (0.0%) | 0 (0.0%) |
| Coal or Coke | 0 (0.0%) | 0 (0.0%) |
| All other Fuels | 7 (0.1%) | 0 (0.0%) |
| No Fuel Used | 608 (4.7%) | 77 (1.6%) |
| Total | 12,962 (100.0%) | 4,812 (100.0%) |
Household Vehicle Usage in Tamiami
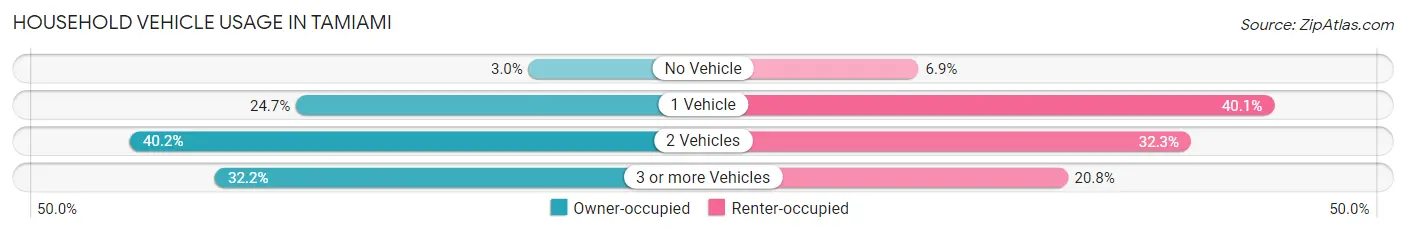
| Vehicles per Household | Owner-occupied | Renter-occupied |
| No Vehicle | 382 (2.9%) | 331 (6.9%) |
| 1 Vehicle | 3,197 (24.7%) | 1,927 (40.1%) |
| 2 Vehicles | 5,206 (40.2%) | 1,554 (32.3%) |
| 3 or more Vehicles | 4,177 (32.2%) | 1,000 (20.8%) |
| Total | 12,962 (100.0%) | 4,812 (100.0%) |
Real Estate & Mortgages in Tamiami
Real Estate and Mortgage Overview in Tamiami
| Characteristic | Without Mortgage | With Mortgage |
| Housing Units | 6,018 | 6,944 |
| Median Property Value | $380,100 | $432,200 |
| Median Household Income | $65,638 | $1,795 |
| Monthly Housing Costs | $668 | $1,528 |
| Real Estate Taxes | $2,622 | $46 |
Property Value by Mortgage Status in Tamiami
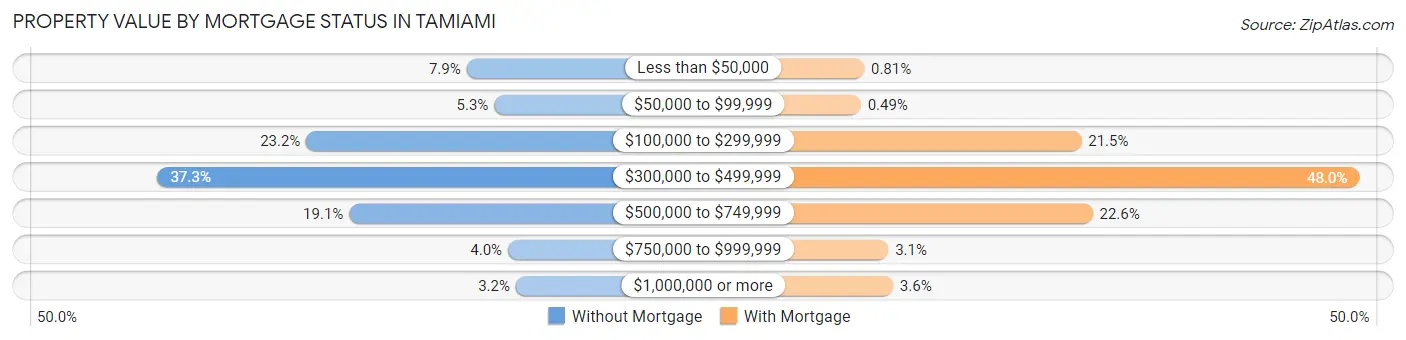
| Property Value | Without Mortgage | With Mortgage |
| Less than $50,000 | 476 (7.9%) | 56 (0.8%) |
| $50,000 to $99,999 | 318 (5.3%) | 34 (0.5%) |
| $100,000 to $299,999 | 1,395 (23.2%) | 1,493 (21.5%) |
| $300,000 to $499,999 | 2,247 (37.3%) | 3,331 (48.0%) |
| $500,000 to $749,999 | 1,149 (19.1%) | 1,567 (22.6%) |
| $750,000 to $999,999 | 239 (4.0%) | 216 (3.1%) |
| $1,000,000 or more | 194 (3.2%) | 247 (3.6%) |
| Total | 6,018 (100.0%) | 6,944 (100.0%) |
Household Income by Mortgage Status in Tamiami
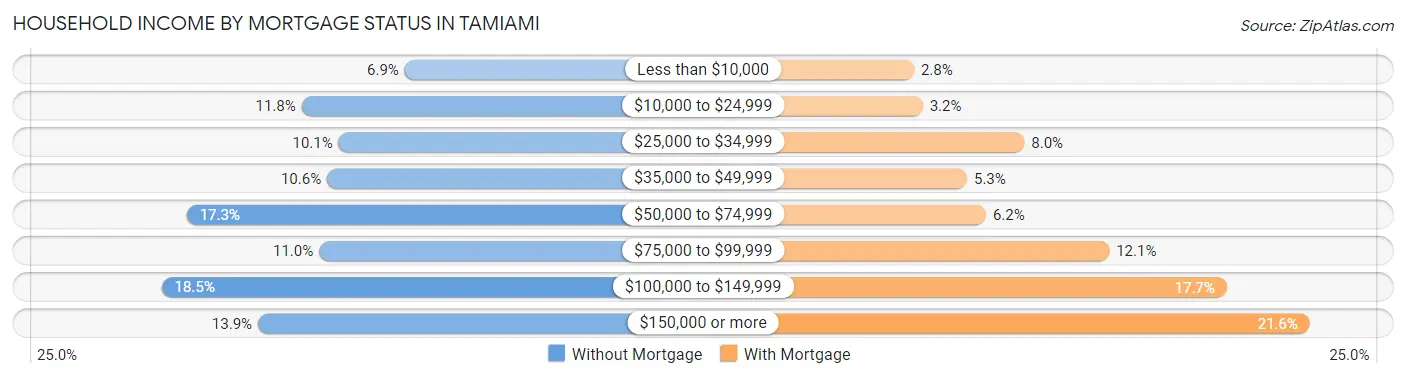
| Household Income | Without Mortgage | With Mortgage |
| Less than $10,000 | 415 (6.9%) | 193 (2.8%) |
| $10,000 to $24,999 | 711 (11.8%) | 222 (3.2%) |
| $25,000 to $34,999 | 605 (10.1%) | 558 (8.0%) |
| $35,000 to $49,999 | 638 (10.6%) | 369 (5.3%) |
| $50,000 to $74,999 | 1,040 (17.3%) | 431 (6.2%) |
| $75,000 to $99,999 | 661 (11.0%) | 839 (12.1%) |
| $100,000 to $149,999 | 1,112 (18.5%) | 1,228 (17.7%) |
| $150,000 or more | 836 (13.9%) | 1,502 (21.6%) |
| Total | 6,018 (100.0%) | 6,944 (100.0%) |
Property Value to Household Income Ratio in Tamiami
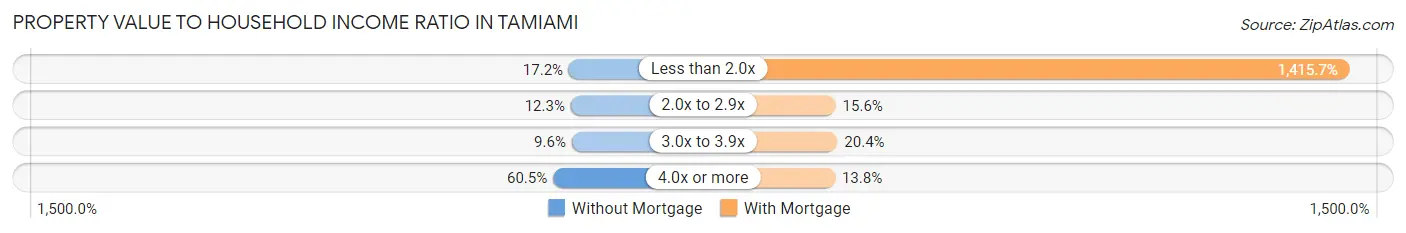
| Value-to-Income Ratio | Without Mortgage | With Mortgage |
| Less than 2.0x | 1,036 (17.2%) | 98,304 (1,415.7%) |
| 2.0x to 2.9x | 739 (12.3%) | 1,086 (15.6%) |
| 3.0x to 3.9x | 576 (9.6%) | 1,413 (20.3%) |
| 4.0x or more | 3,643 (60.5%) | 956 (13.8%) |
| Total | 6,018 (100.0%) | 6,944 (100.0%) |
Real Estate Taxes by Mortgage Status in Tamiami
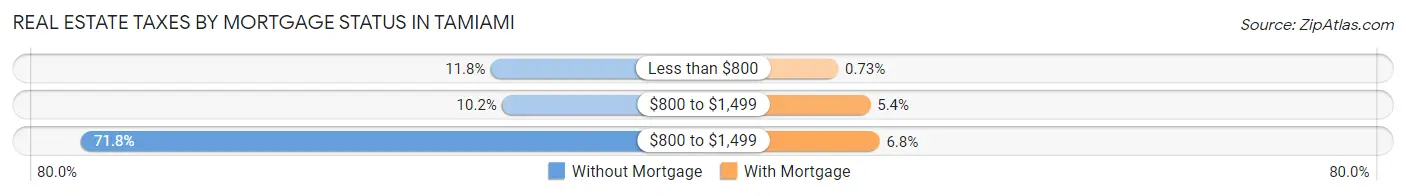
| Property Taxes | Without Mortgage | With Mortgage |
| Less than $800 | 711 (11.8%) | 51 (0.7%) |
| $800 to $1,499 | 611 (10.2%) | 378 (5.4%) |
| $800 to $1,499 | 4,318 (71.8%) | 471 (6.8%) |
| Total | 6,018 (100.0%) | 6,944 (100.0%) |
Health & Disability in Tamiami
Health Insurance Coverage by Age in Tamiami
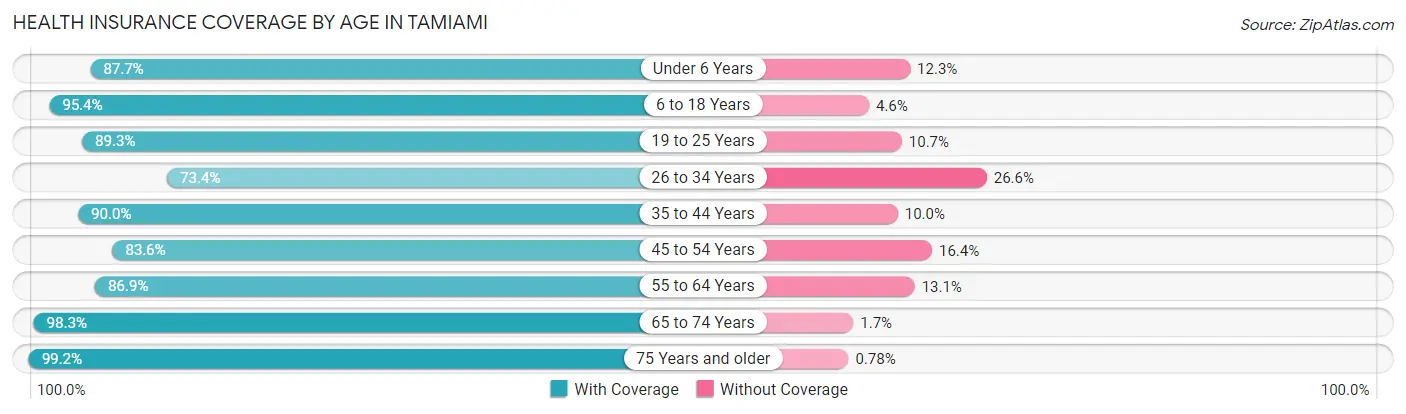
| Age Bracket | With Coverage | Without Coverage |
| Under 6 Years | 2,171 (87.7%) | 304 (12.3%) |
| 6 to 18 Years | 5,897 (95.4%) | 285 (4.6%) |
| 19 to 25 Years | 4,200 (89.3%) | 505 (10.7%) |
| 26 to 34 Years | 3,972 (73.4%) | 1,438 (26.6%) |
| 35 to 44 Years | 5,594 (90.0%) | 620 (10.0%) |
| 45 to 54 Years | 6,902 (83.6%) | 1,351 (16.4%) |
| 55 to 64 Years | 7,069 (86.9%) | 1,068 (13.1%) |
| 65 to 74 Years | 5,763 (98.3%) | 99 (1.7%) |
| 75 Years and older | 5,483 (99.2%) | 43 (0.8%) |
| Total | 47,051 (89.2%) | 5,713 (10.8%) |
Health Insurance Coverage by Citizenship Status in Tamiami
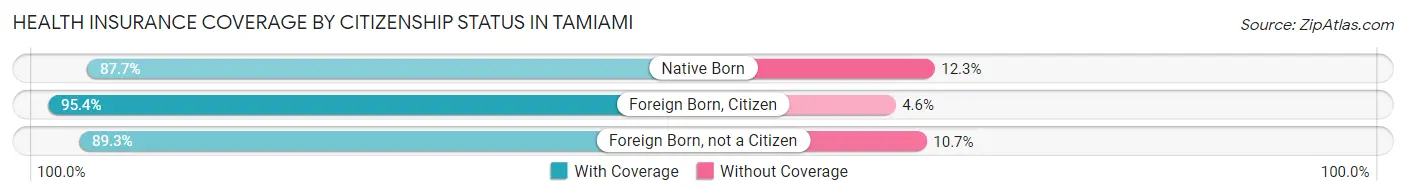
| Citizenship Status | With Coverage | Without Coverage |
| Native Born | 2,171 (87.7%) | 304 (12.3%) |
| Foreign Born, Citizen | 5,897 (95.4%) | 285 (4.6%) |
| Foreign Born, not a Citizen | 4,200 (89.3%) | 505 (10.7%) |
Health Insurance Coverage by Household Income in Tamiami
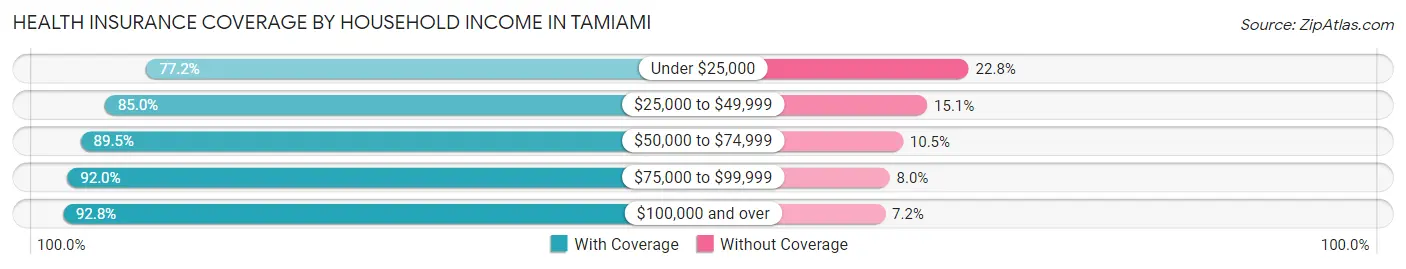
| Household Income | With Coverage | Without Coverage |
| Under $25,000 | 4,483 (77.2%) | 1,326 (22.8%) |
| $25,000 to $49,999 | 7,293 (85.0%) | 1,292 (15.0%) |
| $50,000 to $74,999 | 6,997 (89.5%) | 821 (10.5%) |
| $75,000 to $99,999 | 8,002 (92.0%) | 698 (8.0%) |
| $100,000 and over | 20,030 (92.8%) | 1,550 (7.2%) |
Public vs Private Health Insurance Coverage by Age in Tamiami
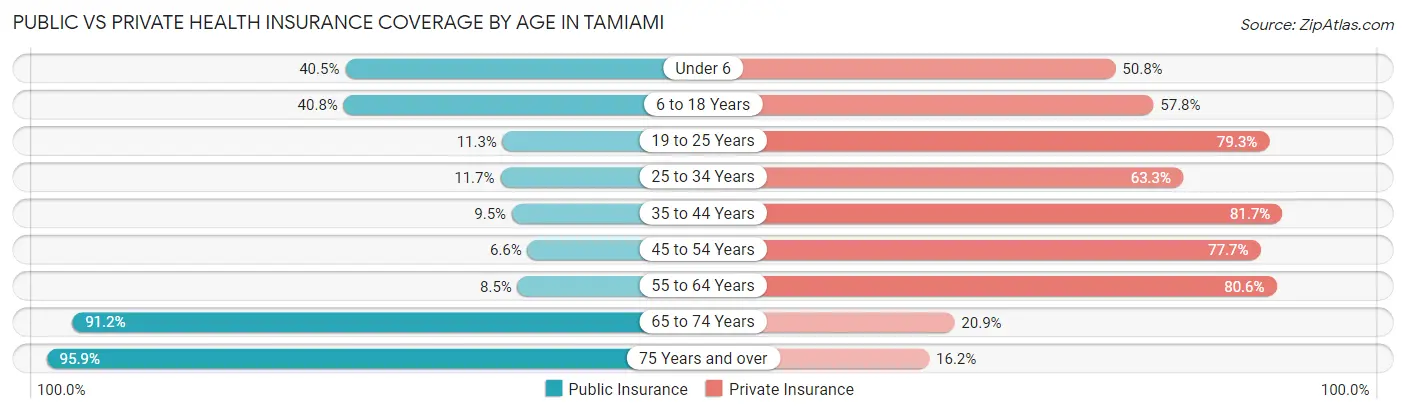
| Age Bracket | Public Insurance | Private Insurance |
| Under 6 | 1,002 (40.5%) | 1,257 (50.8%) |
| 6 to 18 Years | 2,521 (40.8%) | 3,575 (57.8%) |
| 19 to 25 Years | 530 (11.3%) | 3,732 (79.3%) |
| 25 to 34 Years | 633 (11.7%) | 3,424 (63.3%) |
| 35 to 44 Years | 593 (9.5%) | 5,079 (81.7%) |
| 45 to 54 Years | 547 (6.6%) | 6,411 (77.7%) |
| 55 to 64 Years | 690 (8.5%) | 6,562 (80.6%) |
| 65 to 74 Years | 5,343 (91.1%) | 1,225 (20.9%) |
| 75 Years and over | 5,300 (95.9%) | 896 (16.2%) |
| Total | 17,159 (32.5%) | 32,161 (61.0%) |
Disability Status by Sex by Age in Tamiami
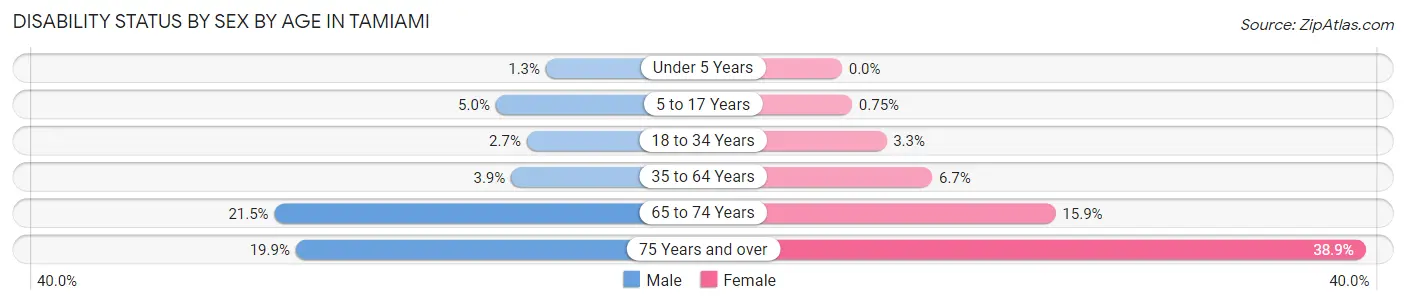
| Age Bracket | Male | Female |
| Under 5 Years | 12 (1.3%) | 0 (0.0%) |
| 5 to 17 Years | 149 (5.0%) | 23 (0.7%) |
| 18 to 34 Years | 146 (2.7%) | 173 (3.3%) |
| 35 to 64 Years | 430 (3.9%) | 771 (6.7%) |
| 65 to 74 Years | 581 (21.4%) | 500 (15.9%) |
| 75 Years and over | 333 (19.9%) | 1,497 (38.9%) |
Disability Class by Sex by Age in Tamiami
Disability Class: Hearing Difficulty
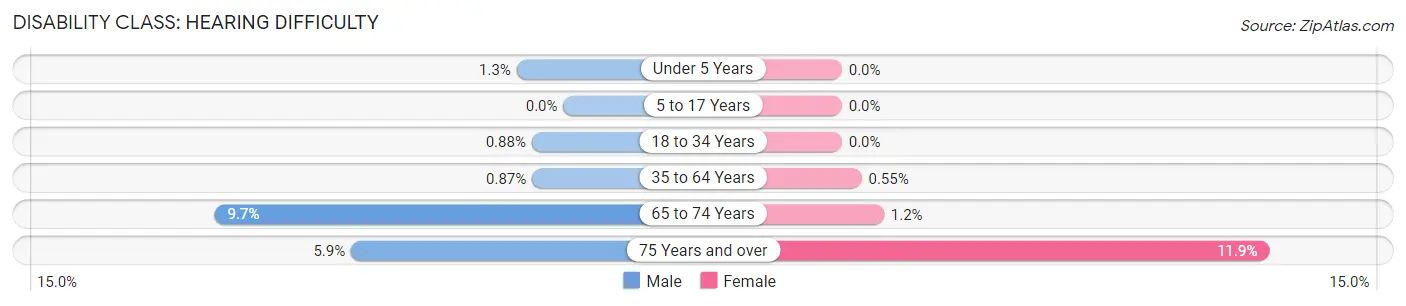
| Age Bracket | Male | Female |
| Under 5 Years | 12 (1.3%) | 0 (0.0%) |
| 5 to 17 Years | 0 (0.0%) | 0 (0.0%) |
| 18 to 34 Years | 47 (0.9%) | 0 (0.0%) |
| 35 to 64 Years | 96 (0.9%) | 63 (0.5%) |
| 65 to 74 Years | 263 (9.7%) | 37 (1.2%) |
| 75 Years and over | 99 (5.9%) | 458 (11.9%) |
Disability Class: Vision Difficulty
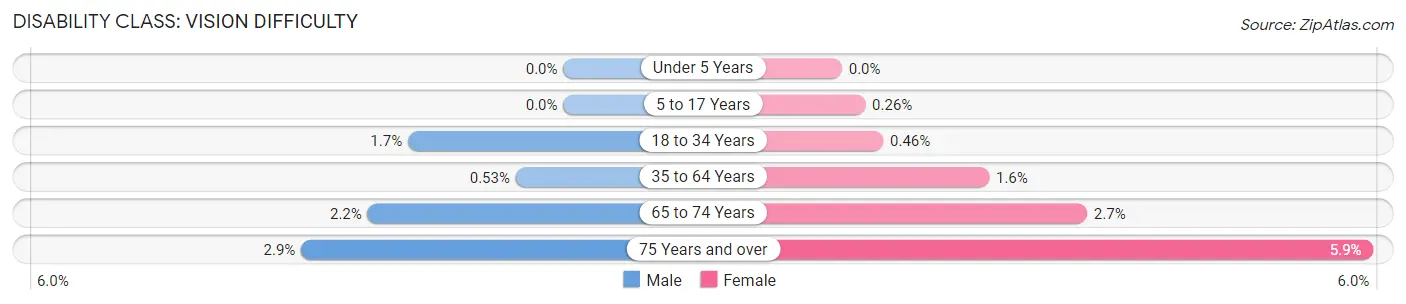
| Age Bracket | Male | Female |
| Under 5 Years | 0 (0.0%) | 0 (0.0%) |
| 5 to 17 Years | 0 (0.0%) | 8 (0.3%) |
| 18 to 34 Years | 93 (1.7%) | 24 (0.5%) |
| 35 to 64 Years | 59 (0.5%) | 189 (1.6%) |
| 65 to 74 Years | 59 (2.2%) | 86 (2.7%) |
| 75 Years and over | 49 (2.9%) | 228 (5.9%) |
Disability Class: Cognitive Difficulty
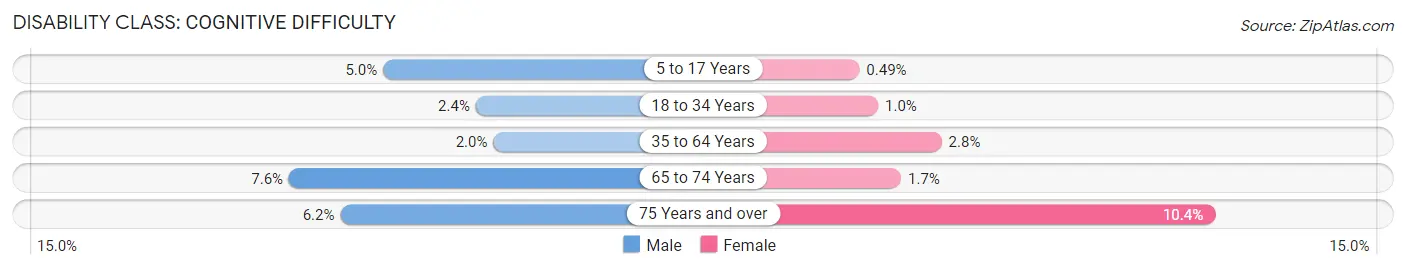
| Age Bracket | Male | Female |
| 5 to 17 Years | 149 (5.0%) | 15 (0.5%) |
| 18 to 34 Years | 131 (2.4%) | 53 (1.0%) |
| 35 to 64 Years | 216 (1.9%) | 320 (2.8%) |
| 65 to 74 Years | 207 (7.6%) | 52 (1.7%) |
| 75 Years and over | 104 (6.2%) | 400 (10.4%) |
Disability Class: Ambulatory Difficulty
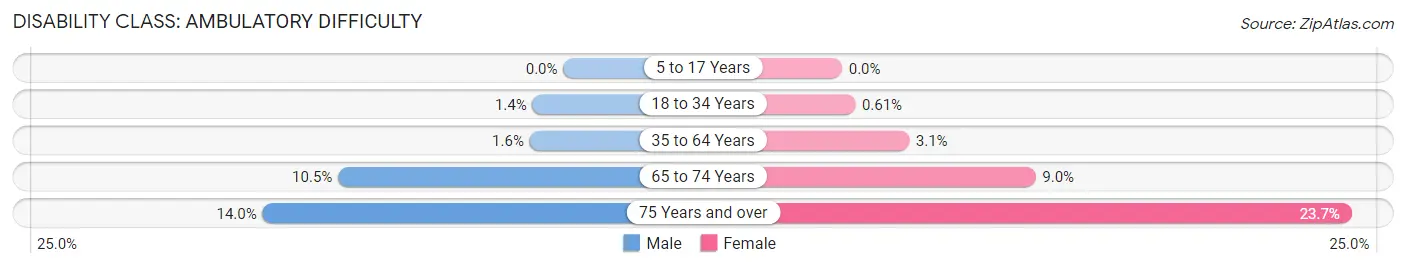
| Age Bracket | Male | Female |
| 5 to 17 Years | 0 (0.0%) | 0 (0.0%) |
| 18 to 34 Years | 77 (1.4%) | 32 (0.6%) |
| 35 to 64 Years | 173 (1.6%) | 358 (3.1%) |
| 65 to 74 Years | 283 (10.4%) | 283 (9.0%) |
| 75 Years and over | 234 (14.0%) | 911 (23.7%) |
Disability Class: Self-Care Difficulty
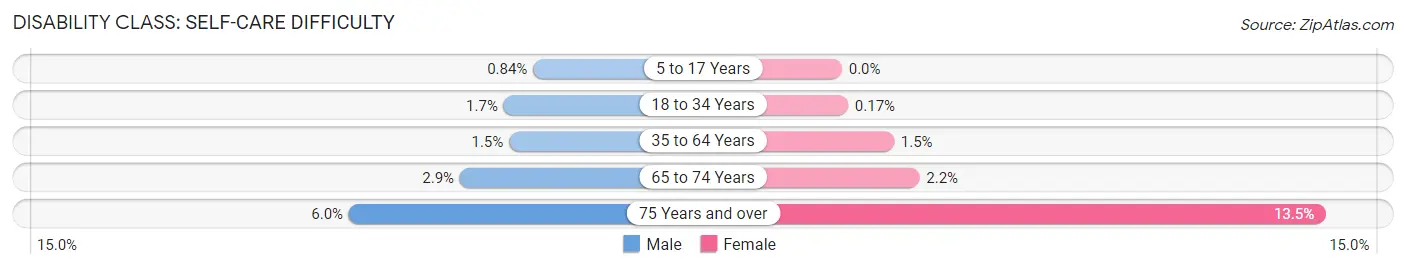
| Age Bracket | Male | Female |
| 5 to 17 Years | 25 (0.8%) | 0 (0.0%) |
| 18 to 34 Years | 89 (1.7%) | 9 (0.2%) |
| 35 to 64 Years | 168 (1.5%) | 167 (1.5%) |
| 65 to 74 Years | 78 (2.9%) | 68 (2.2%) |
| 75 Years and over | 100 (6.0%) | 519 (13.5%) |
Technology Access in Tamiami
Computing Device Access in Tamiami
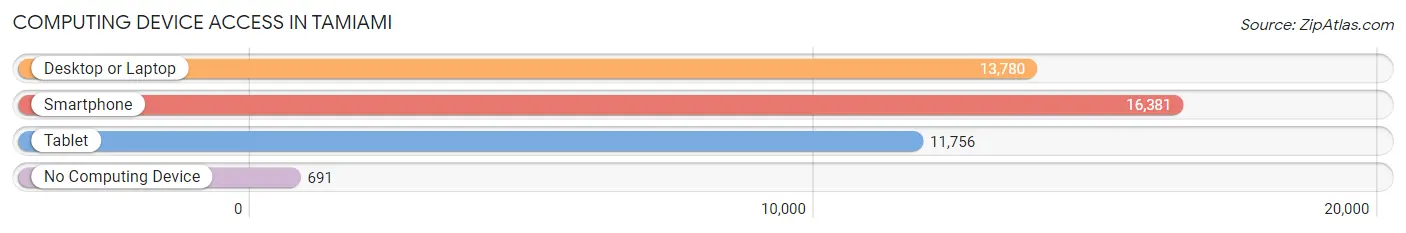
| Device Type | # Households | % Households |
| Desktop or Laptop | 13,780 | 77.5% |
| Smartphone | 16,381 | 92.2% |
| Tablet | 11,756 | 66.1% |
| No Computing Device | 691 | 3.9% |
| Total | 17,774 | 100.0% |
Internet Access in Tamiami
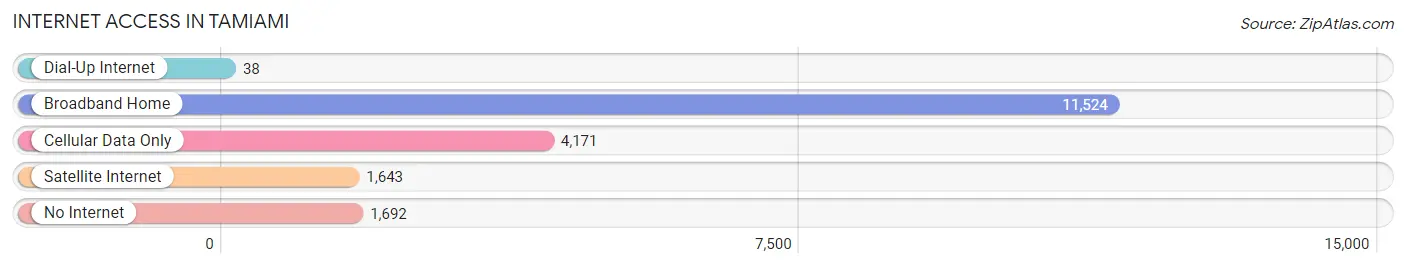
| Internet Type | # Households | % Households |
| Dial-Up Internet | 38 | 0.2% |
| Broadband Home | 11,524 | 64.8% |
| Cellular Data Only | 4,171 | 23.5% |
| Satellite Internet | 1,643 | 9.2% |
| No Internet | 1,692 | 9.5% |
| Total | 17,774 | 100.0% |
Tamiami Summary
Tamiami is a census-designated place (CDP) located in Miami-Dade County, Florida, United States. It is situated on the northern edge of the Everglades, along the Tamiami Trail, which is the main road connecting Miami to the Florida Keys. The population of Tamiami was 41,276 at the 2010 census.
History
The area that is now Tamiami was originally inhabited by the Tequesta Indians, who were the first Native American tribe to inhabit the area. The Tequesta were a peaceful tribe that lived off the land, fishing and hunting. They were eventually displaced by the Seminole Indians, who were forced to move to the area after being driven out of their original homelands in Georgia and Alabama.
The area was first settled by non-Native Americans in the late 19th century, when the first homesteaders arrived. The area was originally known as "Fowler's Hammock" after the first settler, William Fowler. In the early 20th century, the area was renamed "Tamiami" after the Tamiami Trail, which was built in 1915 to connect Miami to the Florida Keys.
Geography
Tamiami is located at 25°41'25" North, 80°20'45" West (25.690278, -80.345833). It is situated on the northern edge of the Everglades, along the Tamiami Trail, which is the main road connecting Miami to the Florida Keys. The area is mostly flat, with an average elevation of 6 feet (1.8 m) above sea level.
The climate in Tamiami is tropical, with hot and humid summers and mild winters. The average temperature in the summer is around 90°F (32°C), while in the winter it is around 70°F (21°C).
Economy
The economy of Tamiami is largely based on tourism and agriculture. The area is home to several tourist attractions, including the Everglades National Park, the Miami Seaquarium, and the Miami Metrozoo. The area is also home to several agricultural operations, including nurseries, farms, and ranches.
The median household income in Tamiami is $37,845, and the median family income is $41,945. The unemployment rate in Tamiami is 5.2%, which is lower than the national average of 5.7%.
Demographics
As of the 2010 census, there were 41,276 people, 14,945 households, and 10,845 families residing in Tamiami. The population density was 2,845.3 people per square mile (1,098.7/km2). The racial makeup of Tamiami was 64.2% White, 22.3% African American, 0.4% Native American, 2.2% Asian, 0.1% Pacific Islander, 8.2% from other races, and 2.7% from two or more races. Hispanic or Latino of any race were 33.2% of the population.
The median age in Tamiami was 38.2 years. 22.3% of residents were under the age of 18; 9.2% were between the ages of 18 and 24; 28.2% were from 25 to 44; 25.2% were from 45 to 64; and 15.1% were 65 years of age or older. The gender makeup of Tamiami was 48.2% male and 51.8% female.
Conclusion
Tamiami is a census-designated place located in Miami-Dade County, Florida. It is situated on the northern edge of the Everglades, along the Tamiami Trail, which is the main road connecting Miami to the Florida Keys. The population of Tamiami was 41,276 at the 2010 census. The economy of Tamiami is largely based on tourism and agriculture, and the median household income is $37,845. The racial makeup of Tamiami is 64.2% White, 22.3% African American, 0.4% Native American, 2.2% Asian, 0.1% Pacific Islander, 8.2% from other races, and 2.7% from two or more races. The median age in Tamiami is 38.2 years. Tamiami is a diverse and vibrant community with a rich history and culture.
Common Questions
What is Per Capita Income in Tamiami?
Per Capita income in Tamiami is $32,756.
What is the Median Family Income in Tamiami?
Median Family Income in Tamiami is $79,749.
What is the Median Household income in Tamiami?
Median Household Income in Tamiami is $72,645.
What is Income or Wage Gap in Tamiami?
Income or Wage Gap in Tamiami is 15.6%.
Women in Tamiami earn 84.4 cents for every dollar earned by a man.
What is Inequality or Gini Index in Tamiami?
Inequality or Gini Index in Tamiami is 0.46.
What is the Total Population of Tamiami?
Total Population of Tamiami is 52,851.
What is the Total Male Population of Tamiami?
Total Male Population of Tamiami is 24,792.
What is the Total Female Population of Tamiami?
Total Female Population of Tamiami is 28,059.
What is the Ratio of Males per 100 Females in Tamiami?
There are 88.36 Males per 100 Females in Tamiami.
What is the Ratio of Females per 100 Males in Tamiami?
There are 113.18 Females per 100 Males in Tamiami.
What is the Median Population Age in Tamiami?
Median Population Age in Tamiami is 46.3 Years.
What is the Average Family Size in Tamiami
Average Family Size in Tamiami is 3.3 People.
What is the Average Household Size in Tamiami
Average Household Size in Tamiami is 3.0 People.
How Large is the Labor Force in Tamiami?
There are 29,089 People in the Labor Forcein in Tamiami.
What is the Percentage of People in the Labor Force in Tamiami?
63.5% of People are in the Labor Force in Tamiami.
What is the Unemployment Rate in Tamiami?
Unemployment Rate in Tamiami is 3.3%.