Palmetto Estates, FL Map & Demographics
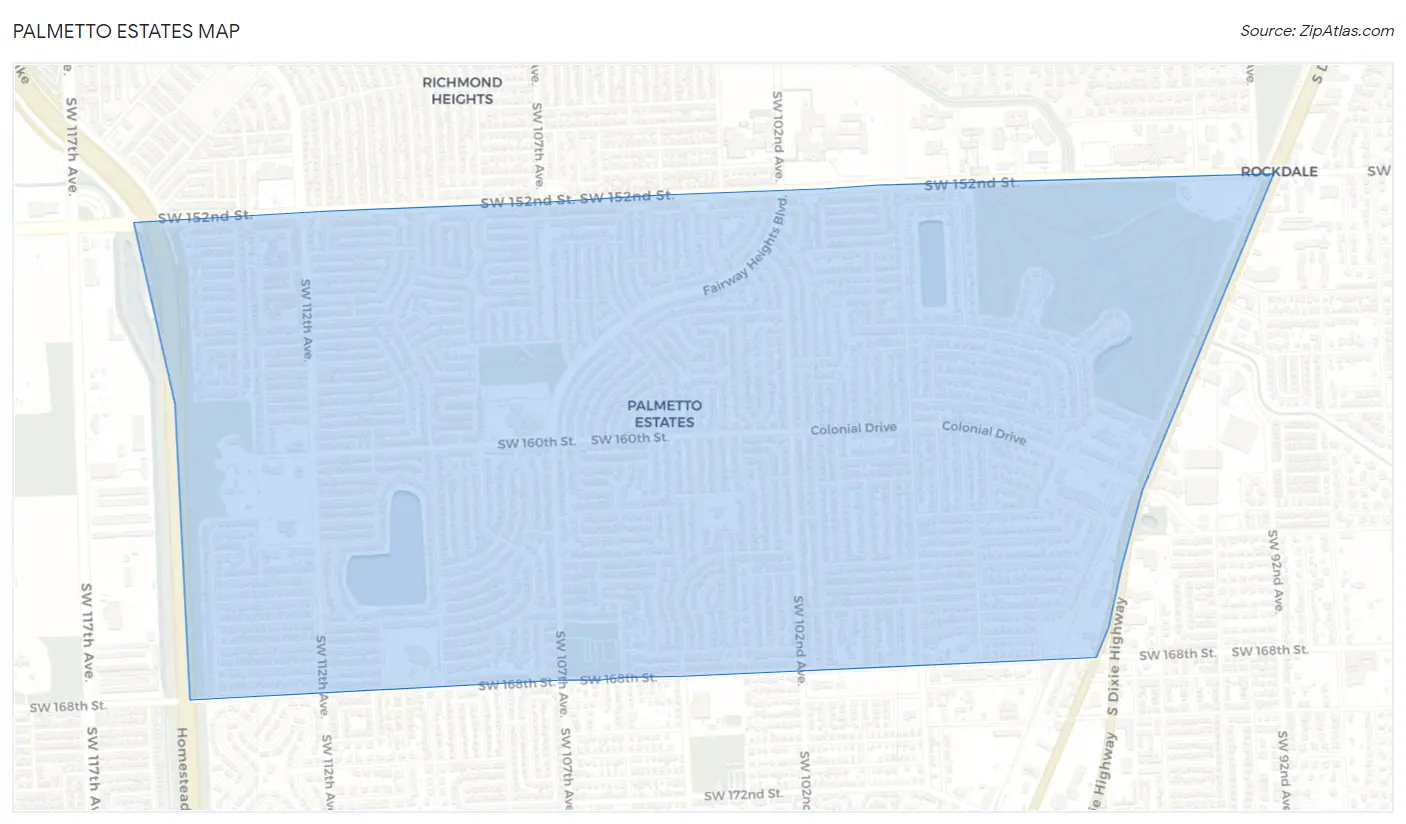
Palmetto Estates Map
Palmetto Estates Overview
$27,197
PER CAPITA INCOME
$80,069
AVG FAMILY INCOME
$79,096
AVG HOUSEHOLD INCOME
8.0%
WAGE / INCOME GAP [ % ]
92.0¢/ $1
WAGE / INCOME GAP [ $ ]
0.36
INEQUALITY / GINI INDEX
16,776
TOTAL POPULATION
8,253
MALE POPULATION
8,523
FEMALE POPULATION
96.83
MALES / 100 FEMALES
103.27
FEMALES / 100 MALES
40.4
MEDIAN AGE
4.2
AVG FAMILY SIZE
4.0
AVG HOUSEHOLD SIZE
8,616
LABOR FORCE [ PEOPLE ]
62.7%
PERCENT IN LABOR FORCE
3.8%
UNEMPLOYMENT RATE
Income in Palmetto Estates
Income Overview in Palmetto Estates
Per Capita Income in Palmetto Estates is $27,197, while median incomes of families and households are $80,069 and $79,096 respectively.
| Characteristic | Number | Measure |
| Per Capita Income | 16,776 | $27,197 |
| Median Family Income | 3,578 | $80,069 |
| Mean Family Income | 3,578 | $98,544 |
| Median Household Income | 4,175 | $79,096 |
| Mean Household Income | 4,175 | $100,844 |
| Income Deficit | 3,578 | $0 |
| Wage / Income Gap (%) | 16,776 | 7.97% |
| Wage / Income Gap ($) | 16,776 | 92.03¢ per $1 |
| Gini / Inequality Index | 16,776 | 0.36 |
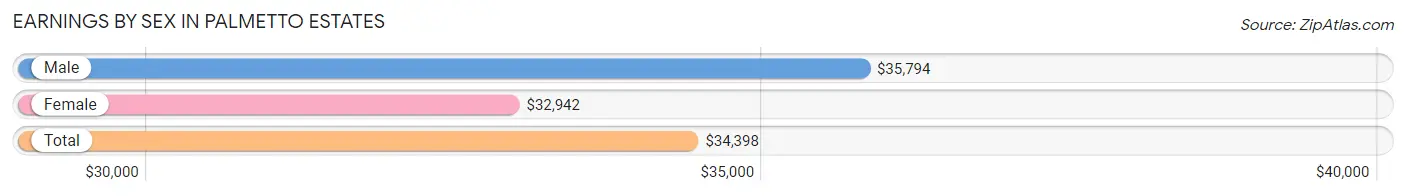
Earnings by Sex in Palmetto Estates
Average Earnings in Palmetto Estates are $34,398, $35,794 for men and $32,942 for women, a difference of 8.0%.
| Sex | Number | Average Earnings |
| Male | 4,775 (55.8%) | $35,794 |
| Female | 3,786 (44.2%) | $32,942 |
| Total | 8,561 (100.0%) | $34,398 |
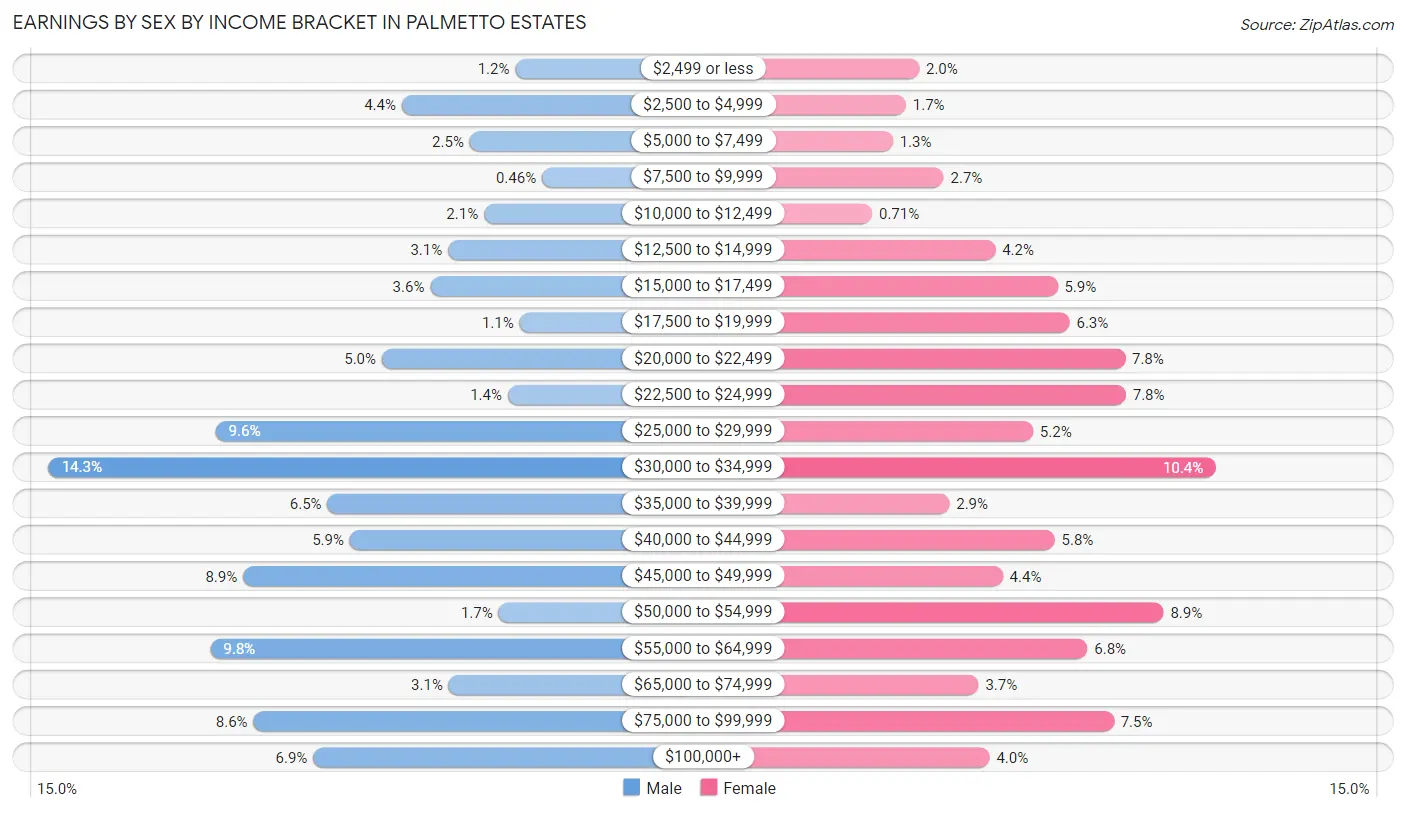
Earnings by Sex by Income Bracket in Palmetto Estates
The most common earnings brackets in Palmetto Estates are $30,000 to $34,999 for men (684 | 14.3%) and $30,000 to $34,999 for women (392 | 10.3%).
| Income | Male | Female |
| $2,499 or less | 58 (1.2%) | 77 (2.0%) |
| $2,500 to $4,999 | 210 (4.4%) | 63 (1.7%) |
| $5,000 to $7,499 | 119 (2.5%) | 49 (1.3%) |
| $7,500 to $9,999 | 22 (0.5%) | 103 (2.7%) |
| $10,000 to $12,499 | 100 (2.1%) | 27 (0.7%) |
| $12,500 to $14,999 | 148 (3.1%) | 158 (4.2%) |
| $15,000 to $17,499 | 172 (3.6%) | 224 (5.9%) |
| $17,500 to $19,999 | 52 (1.1%) | 237 (6.3%) |
| $20,000 to $22,499 | 237 (5.0%) | 296 (7.8%) |
| $22,500 to $24,999 | 68 (1.4%) | 297 (7.8%) |
| $25,000 to $29,999 | 460 (9.6%) | 198 (5.2%) |
| $30,000 to $34,999 | 684 (14.3%) | 392 (10.3%) |
| $35,000 to $39,999 | 310 (6.5%) | 109 (2.9%) |
| $40,000 to $44,999 | 280 (5.9%) | 221 (5.8%) |
| $45,000 to $49,999 | 423 (8.9%) | 166 (4.4%) |
| $50,000 to $54,999 | 80 (1.7%) | 337 (8.9%) |
| $55,000 to $64,999 | 467 (9.8%) | 256 (6.8%) |
| $65,000 to $74,999 | 147 (3.1%) | 140 (3.7%) |
| $75,000 to $99,999 | 409 (8.6%) | 284 (7.5%) |
| $100,000+ | 329 (6.9%) | 152 (4.0%) |
| Total | 4,775 (100.0%) | 3,786 (100.0%) |
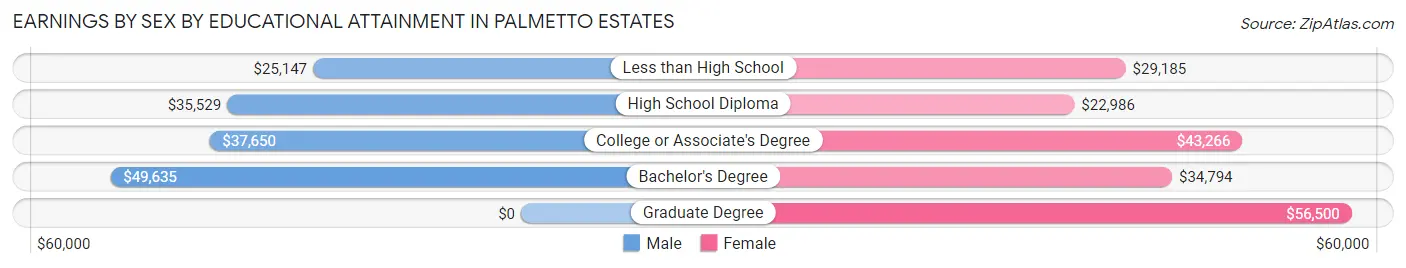
Earnings by Sex by Educational Attainment in Palmetto Estates
Average earnings in Palmetto Estates are $38,469 for men and $34,008 for women, a difference of 11.6%. Men with an educational attainment of bachelor's degree enjoy the highest average annual earnings of $49,635, while those with less than high school education earn the least with $25,147. Women with an educational attainment of graduate degree earn the most with the average annual earnings of $56,500, while those with high school diploma education have the smallest earnings of $22,986.
| Educational Attainment | Male Income | Female Income |
| Less than High School | $25,147 | $29,185 |
| High School Diploma | $35,529 | $22,986 |
| College or Associate's Degree | $37,650 | $43,266 |
| Bachelor's Degree | $49,635 | $34,794 |
| Graduate Degree | - | - |
| Total | $38,469 | $34,008 |
Family Income in Palmetto Estates
Family Income Brackets in Palmetto Estates
According to the Palmetto Estates family income data, there are 780 families falling into the $50,000 to $74,999 income range, which is the most common income bracket and makes up 21.8% of all families.
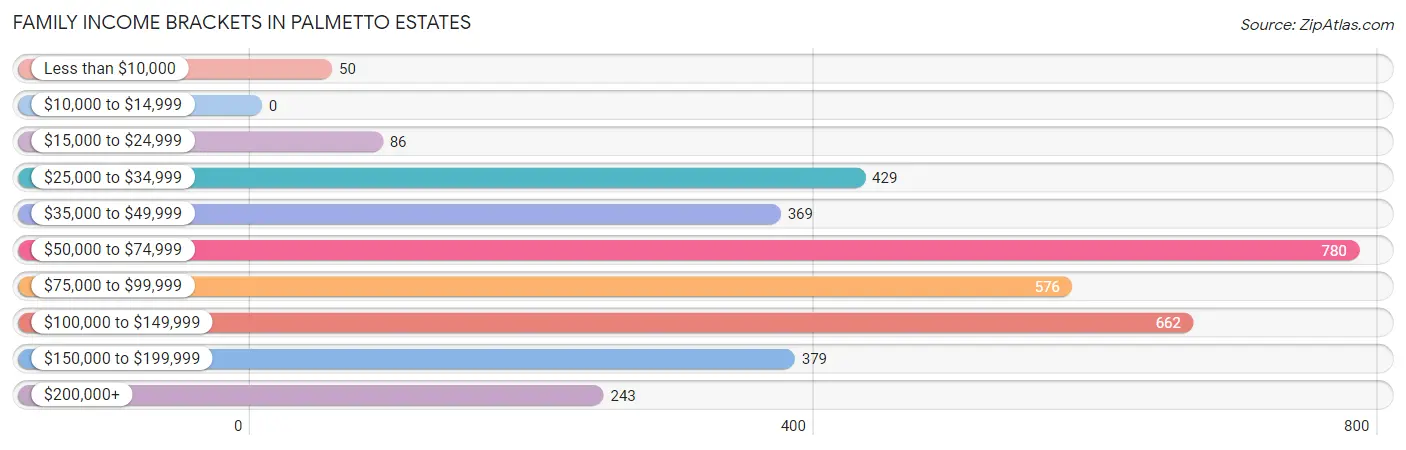
| Income Bracket | # Families | % Families |
| Less than $10,000 | 50 | 1.4% |
| $10,000 to $14,999 | 0 | 0.0% |
| $15,000 to $24,999 | 86 | 2.4% |
| $25,000 to $34,999 | 429 | 12.0% |
| $35,000 to $49,999 | 369 | 10.3% |
| $50,000 to $74,999 | 780 | 21.8% |
| $75,000 to $99,999 | 576 | 16.1% |
| $100,000 to $149,999 | 662 | 18.5% |
| $150,000 to $199,999 | 379 | 10.6% |
| $200,000+ | 243 | 6.8% |
Family Income by Famaliy Size in Palmetto Estates
6-person families (119 | 3.3%) account for the highest median family income in Palmetto Estates with $126,161 per family, while 4-person families (624 | 17.4%) have the highest median income of $29,036 per family member.
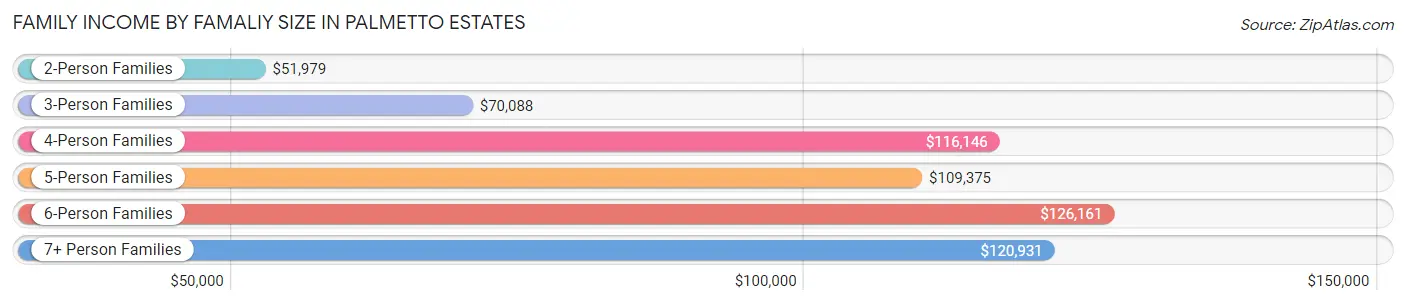
| Income Bracket | # Families | Median Income |
| 2-Person Families | 864 (24.1%) | $51,979 |
| 3-Person Families | 1,106 (30.9%) | $70,088 |
| 4-Person Families | 624 (17.4%) | $116,146 |
| 5-Person Families | 556 (15.5%) | $109,375 |
| 6-Person Families | 119 (3.3%) | $126,161 |
| 7+ Person Families | 309 (8.6%) | $120,931 |
| Total | 3,578 (100.0%) | $80,069 |
Family Income by Number of Earners in Palmetto Estates
The median family income in Palmetto Estates is $80,069, with families comprising 3+ earners (763) having the highest median family income of $122,261, while families with no earners (312) have the lowest median family income of $40,185, accounting for 21.3% and 8.7% of families, respectively.
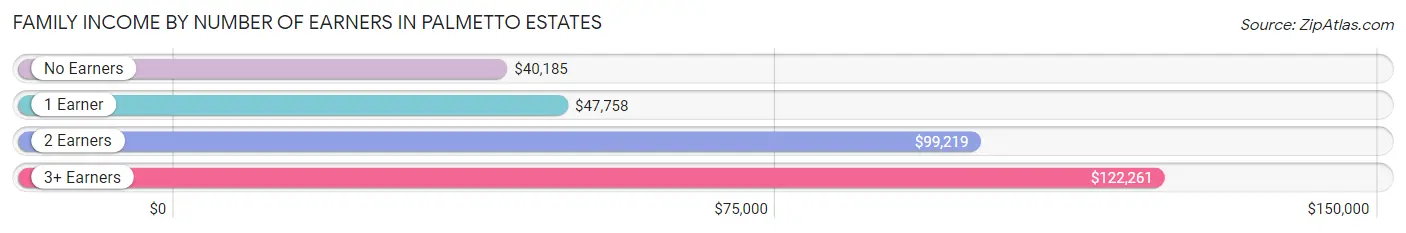
| Number of Earners | # Families | Median Income |
| No Earners | 312 (8.7%) | $40,185 |
| 1 Earner | 1,199 (33.5%) | $47,758 |
| 2 Earners | 1,304 (36.4%) | $99,219 |
| 3+ Earners | 763 (21.3%) | $122,261 |
| Total | 3,578 (100.0%) | $80,069 |
Household Income in Palmetto Estates
Household Income Brackets in Palmetto Estates
With 914 households falling in the category, the $75,000 to $99,999 income range is the most frequent in Palmetto Estates, accounting for 21.9% of all households. In contrast, only 67 households (1.6%) fall into the less than $10,000 income bracket, making it the least populous group.
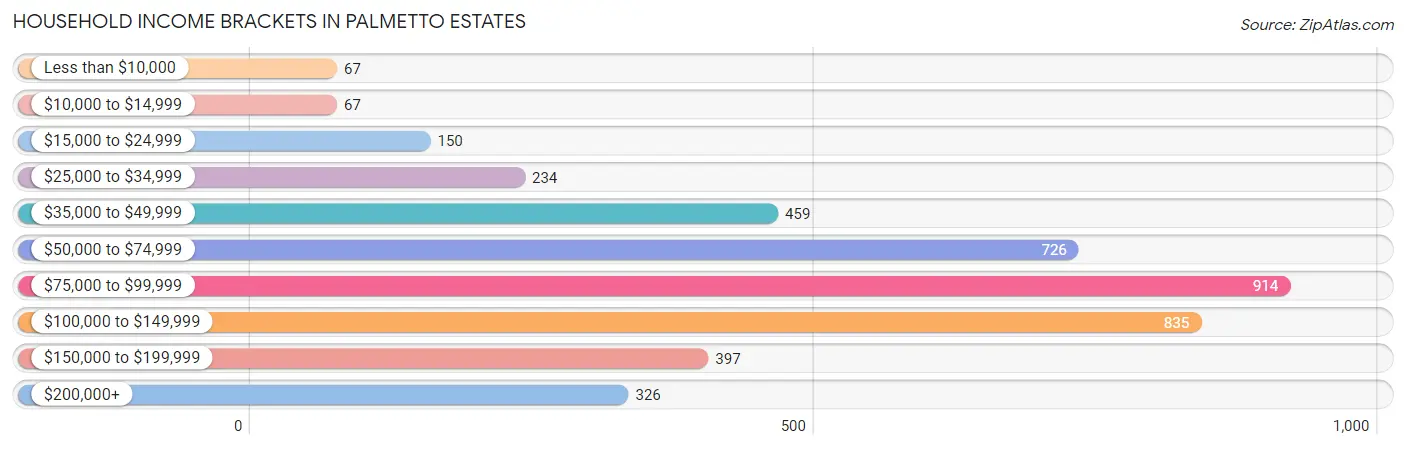
| Income Bracket | # Households | % Households |
| Less than $10,000 | 67 | 1.6% |
| $10,000 to $14,999 | 67 | 1.6% |
| $15,000 to $24,999 | 150 | 3.6% |
| $25,000 to $34,999 | 234 | 5.6% |
| $35,000 to $49,999 | 459 | 11.0% |
| $50,000 to $74,999 | 726 | 17.4% |
| $75,000 to $99,999 | 914 | 21.9% |
| $100,000 to $149,999 | 835 | 20.0% |
| $150,000 to $199,999 | 397 | 9.5% |
| $200,000+ | 326 | 7.8% |
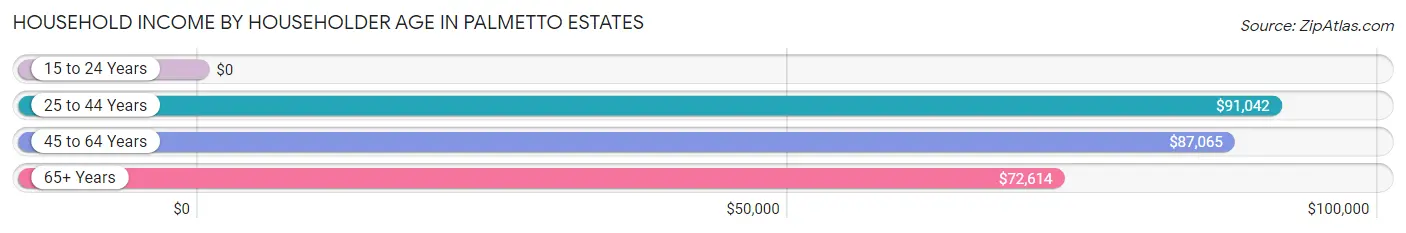
Household Income by Householder Age in Palmetto Estates
The median household income in Palmetto Estates is $79,096, with the highest median household income of $91,042 found in the 25 to 44 years age bracket for the primary householder. A total of 1,013 households (24.3%) fall into this category. Meanwhile, the 15 to 24 years age bracket for the primary householder has the lowest median household income of $0, with 37 households (0.9%) in this group.
| Income Bracket | # Households | Median Income |
| 15 to 24 Years | 37 (0.9%) | $0 |
| 25 to 44 Years | 1,013 (24.3%) | $91,042 |
| 45 to 64 Years | 2,058 (49.3%) | $87,065 |
| 65+ Years | 1,067 (25.6%) | $72,614 |
| Total | 4,175 (100.0%) | $79,096 |
Poverty in Palmetto Estates
Income Below Poverty by Sex and Age in Palmetto Estates
With 8.2% poverty level for males and 8.7% for females among the residents of Palmetto Estates, under 5 year old males and 18 to 24 year old females are the most vulnerable to poverty, with 169 males (34.9%) and 126 females (18.7%) in their respective age groups living below the poverty level.
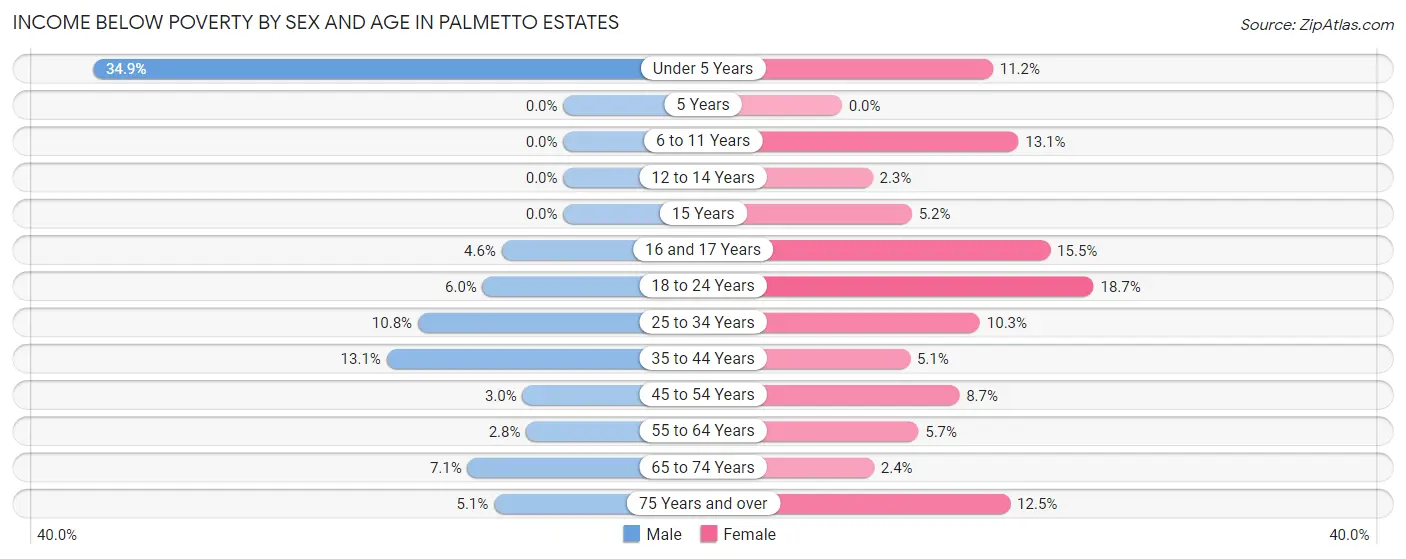
| Age Bracket | Male | Female |
| Under 5 Years | 169 (34.9%) | 63 (11.2%) |
| 5 Years | 0 (0.0%) | 0 (0.0%) |
| 6 to 11 Years | 0 (0.0%) | 62 (13.1%) |
| 12 to 14 Years | 0 (0.0%) | 12 (2.3%) |
| 15 Years | 0 (0.0%) | 12 (5.2%) |
| 16 and 17 Years | 6 (4.6%) | 54 (15.5%) |
| 18 to 24 Years | 53 (6.0%) | 126 (18.7%) |
| 25 to 34 Years | 149 (10.8%) | 87 (10.2%) |
| 35 to 44 Years | 164 (13.1%) | 51 (5.1%) |
| 45 to 54 Years | 46 (3.0%) | 101 (8.7%) |
| 55 to 64 Years | 23 (2.8%) | 64 (5.7%) |
| 65 to 74 Years | 53 (7.1%) | 19 (2.4%) |
| 75 Years and over | 15 (5.1%) | 91 (12.5%) |
| Total | 678 (8.2%) | 742 (8.7%) |
Income Above Poverty by Sex and Age in Palmetto Estates
According to the poverty statistics in Palmetto Estates, males aged 5 years and females aged 5 years are the age groups that are most secure financially, with 100.0% of males and 100.0% of females in these age groups living above the poverty line.
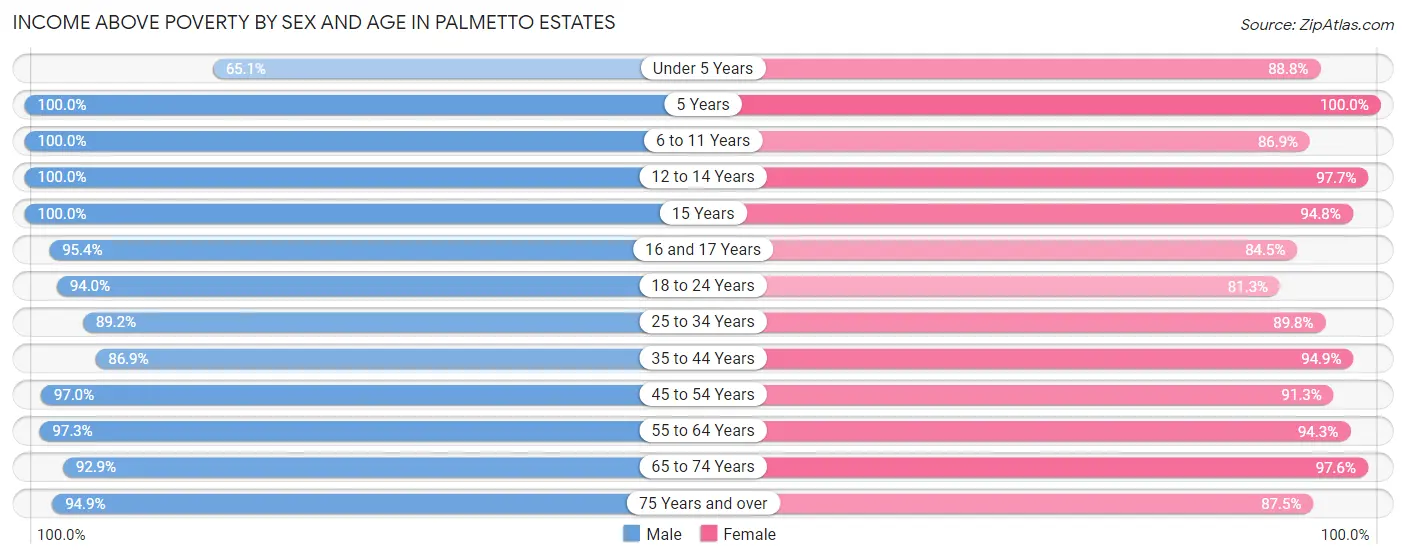
| Age Bracket | Male | Female |
| Under 5 Years | 315 (65.1%) | 499 (88.8%) |
| 5 Years | 134 (100.0%) | 7 (100.0%) |
| 6 to 11 Years | 433 (100.0%) | 411 (86.9%) |
| 12 to 14 Years | 98 (100.0%) | 514 (97.7%) |
| 15 Years | 62 (100.0%) | 219 (94.8%) |
| 16 and 17 Years | 125 (95.4%) | 295 (84.5%) |
| 18 to 24 Years | 832 (94.0%) | 548 (81.3%) |
| 25 to 34 Years | 1,230 (89.2%) | 762 (89.7%) |
| 35 to 44 Years | 1,086 (86.9%) | 957 (94.9%) |
| 45 to 54 Years | 1,470 (97.0%) | 1,057 (91.3%) |
| 55 to 64 Years | 813 (97.3%) | 1,062 (94.3%) |
| 65 to 74 Years | 692 (92.9%) | 780 (97.6%) |
| 75 Years and over | 277 (94.9%) | 637 (87.5%) |
| Total | 7,567 (91.8%) | 7,748 (91.3%) |
Income Below Poverty Among Married-Couple Families in Palmetto Estates
The poverty statistics for married-couple families in Palmetto Estates show that 4.7% or 95 of the total 2,040 families live below the poverty line. Families with 1 or 2 children have the highest poverty rate of 8.4%, comprising of 86 families. On the other hand, families with 3 or 4 children have the lowest poverty rate of 0.0%, which includes 0 families.
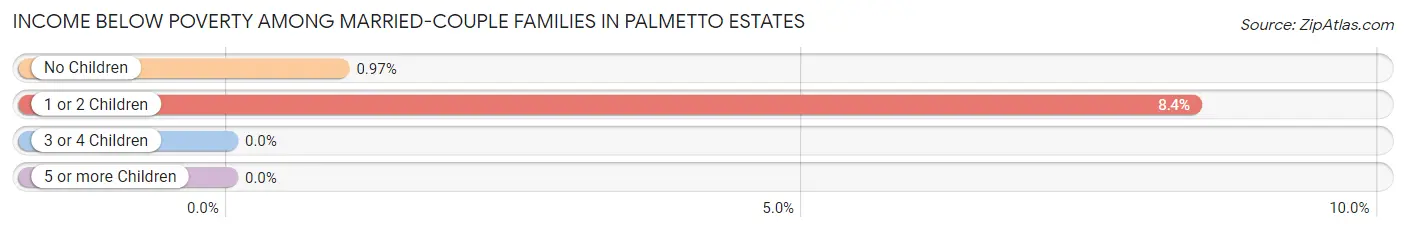
| Children | Above Poverty | Below Poverty |
| No Children | 919 (99.0%) | 9 (1.0%) |
| 1 or 2 Children | 939 (91.6%) | 86 (8.4%) |
| 3 or 4 Children | 79 (100.0%) | 0 (0.0%) |
| 5 or more Children | 8 (100.0%) | 0 (0.0%) |
| Total | 1,945 (95.3%) | 95 (4.7%) |
Income Below Poverty Among Single-Parent Households in Palmetto Estates
According to the poverty data in Palmetto Estates, 0.5% or 3 single-father households and 9.5% or 87 single-mother households are living below the poverty line. Among single-father households, those with no children have the highest poverty rate, with 3 households (1.5%) experiencing poverty. Likewise, among single-mother households, those with 5 or more children have the highest poverty rate, with 6 households (100.0%) falling below the poverty line.
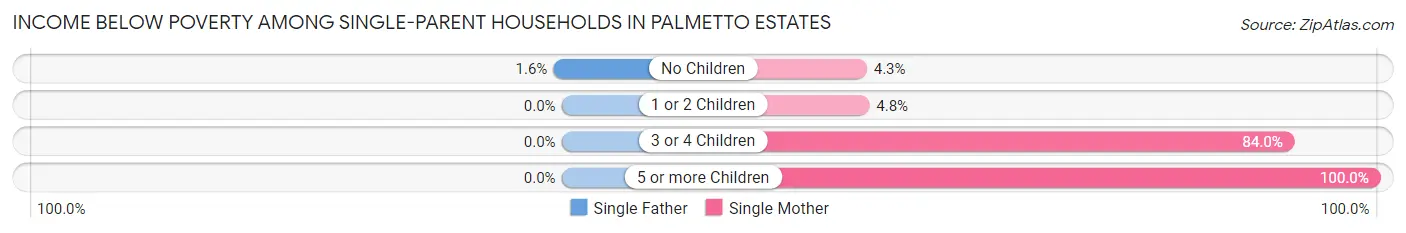
| Children | Single Father | Single Mother |
| No Children | 3 (1.5%) | 22 (4.3%) |
| 1 or 2 Children | 0 (0.0%) | 17 (4.8%) |
| 3 or 4 Children | 0 (0.0%) | 42 (84.0%) |
| 5 or more Children | 0 (0.0%) | 6 (100.0%) |
| Total | 3 (0.5%) | 87 (9.5%) |
Income Below Poverty Among Married-Couple vs Single-Parent Households in Palmetto Estates
The poverty data for Palmetto Estates shows that 95 of the married-couple family households (4.7%) and 90 of the single-parent households (5.9%) are living below the poverty level. Within the married-couple family households, those with 1 or 2 children have the highest poverty rate, with 86 households (8.4%) falling below the poverty line. Among the single-parent households, those with 5 or more children have the highest poverty rate, with 6 household (100.0%) living below poverty.
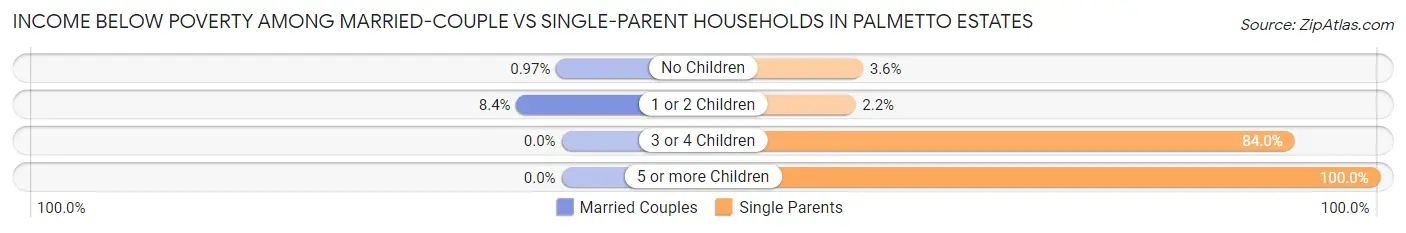
| Children | Married-Couple Families | Single-Parent Households |
| No Children | 9 (1.0%) | 25 (3.6%) |
| 1 or 2 Children | 86 (8.4%) | 17 (2.2%) |
| 3 or 4 Children | 0 (0.0%) | 42 (84.0%) |
| 5 or more Children | 0 (0.0%) | 6 (100.0%) |
| Total | 95 (4.7%) | 90 (5.9%) |
Race in Palmetto Estates
The most populous races in Palmetto Estates are Hispanic or Latino (9,575 | 57.1%), White / Caucasian (5,422 | 32.3%), and Black / African American (5,176 | 30.8%).
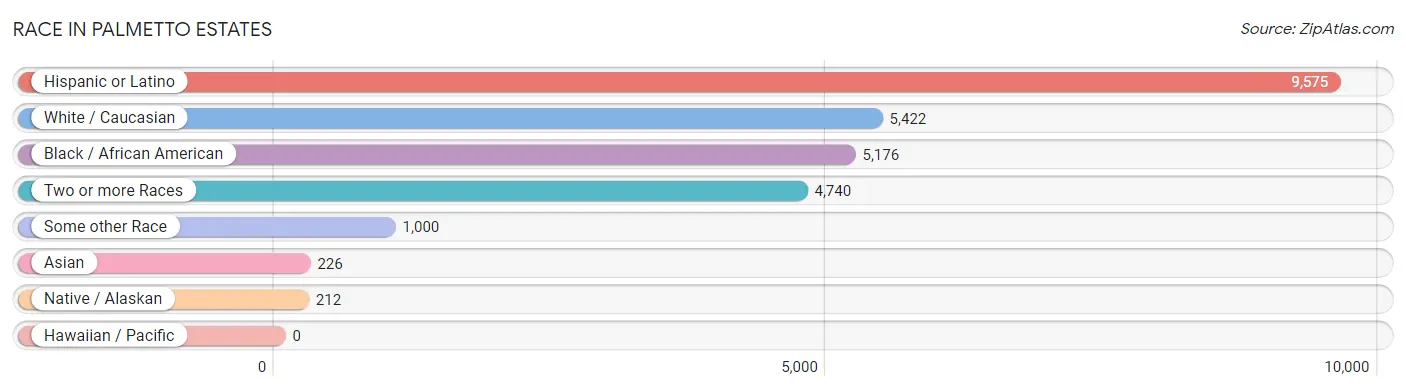
| Race | # Population | % Population |
| Asian | 226 | 1.3% |
| Black / African American | 5,176 | 30.8% |
| Hawaiian / Pacific | 0 | 0.0% |
| Hispanic or Latino | 9,575 | 57.1% |
| Native / Alaskan | 212 | 1.3% |
| White / Caucasian | 5,422 | 32.3% |
| Two or more Races | 4,740 | 28.2% |
| Some other Race | 1,000 | 6.0% |
| Total | 16,776 | 100.0% |
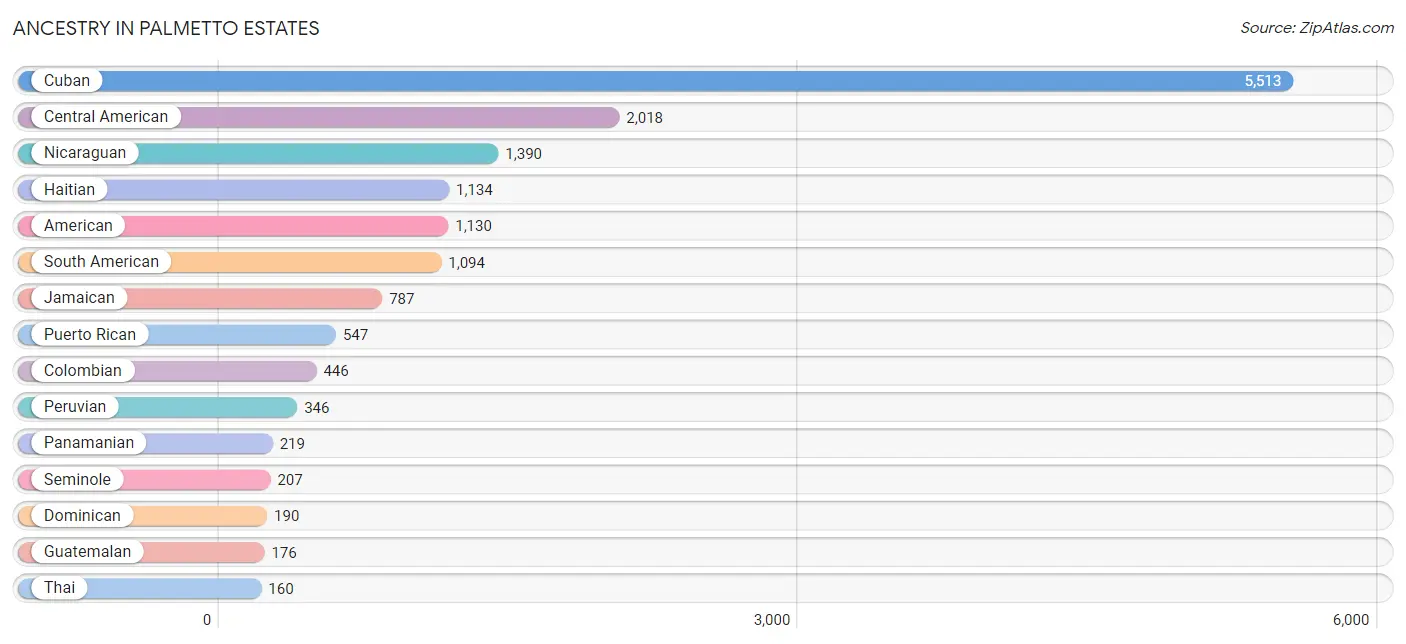
Ancestry in Palmetto Estates
The most populous ancestries reported in Palmetto Estates are Cuban (5,513 | 32.9%), Central American (2,018 | 12.0%), Nicaraguan (1,390 | 8.3%), Haitian (1,134 | 6.8%), and American (1,130 | 6.7%), together accounting for 66.7% of all Palmetto Estates residents.
| Ancestry | # Population | % Population |
| African | 24 | 0.1% |
| American | 1,130 | 6.7% |
| Arab | 24 | 0.1% |
| Argentinean | 102 | 0.6% |
| Bahamian | 4 | 0.0% |
| Barbadian | 25 | 0.2% |
| Bolivian | 40 | 0.2% |
| Brazilian | 48 | 0.3% |
| British West Indian | 68 | 0.4% |
| Central American | 2,018 | 12.0% |
| Central American Indian | 5 | 0.0% |
| Colombian | 446 | 2.7% |
| Costa Rican | 72 | 0.4% |
| Cuban | 5,513 | 32.9% |
| Czech | 8 | 0.1% |
| Dominican | 190 | 1.1% |
| Dutch | 20 | 0.1% |
| Ecuadorian | 41 | 0.2% |
| English | 76 | 0.4% |
| French | 19 | 0.1% |
| German | 114 | 0.7% |
| Guatemalan | 176 | 1.1% |
| Guyanese | 58 | 0.4% |
| Haitian | 1,134 | 6.8% |
| Honduran | 122 | 0.7% |
| Indian (Asian) | 106 | 0.6% |
| Indonesian | 47 | 0.3% |
| Iranian | 51 | 0.3% |
| Irish | 112 | 0.7% |
| Italian | 31 | 0.2% |
| Jamaican | 787 | 4.7% |
| Korean | 27 | 0.2% |
| Lebanese | 24 | 0.1% |
| Mexican | 70 | 0.4% |
| Nicaraguan | 1,390 | 8.3% |
| Panamanian | 219 | 1.3% |
| Peruvian | 346 | 2.1% |
| Polish | 11 | 0.1% |
| Puerto Rican | 547 | 3.3% |
| Salvadoran | 39 | 0.2% |
| Scandinavian | 11 | 0.1% |
| Scotch-Irish | 68 | 0.4% |
| Scottish | 68 | 0.4% |
| Seminole | 207 | 1.2% |
| South American | 1,094 | 6.5% |
| Spaniard | 3 | 0.0% |
| Subsaharan African | 82 | 0.5% |
| Swedish | 9 | 0.1% |
| Thai | 160 | 0.9% |
| Trinidadian and Tobagonian | 20 | 0.1% |
| Turkish | 11 | 0.1% |
| U.S. Virgin Islander | 9 | 0.1% |
| Ukrainian | 7 | 0.0% |
| Uruguayan | 107 | 0.6% |
| Venezuelan | 12 | 0.1% |
| West Indian | 107 | 0.6% | View All 56 Rows |
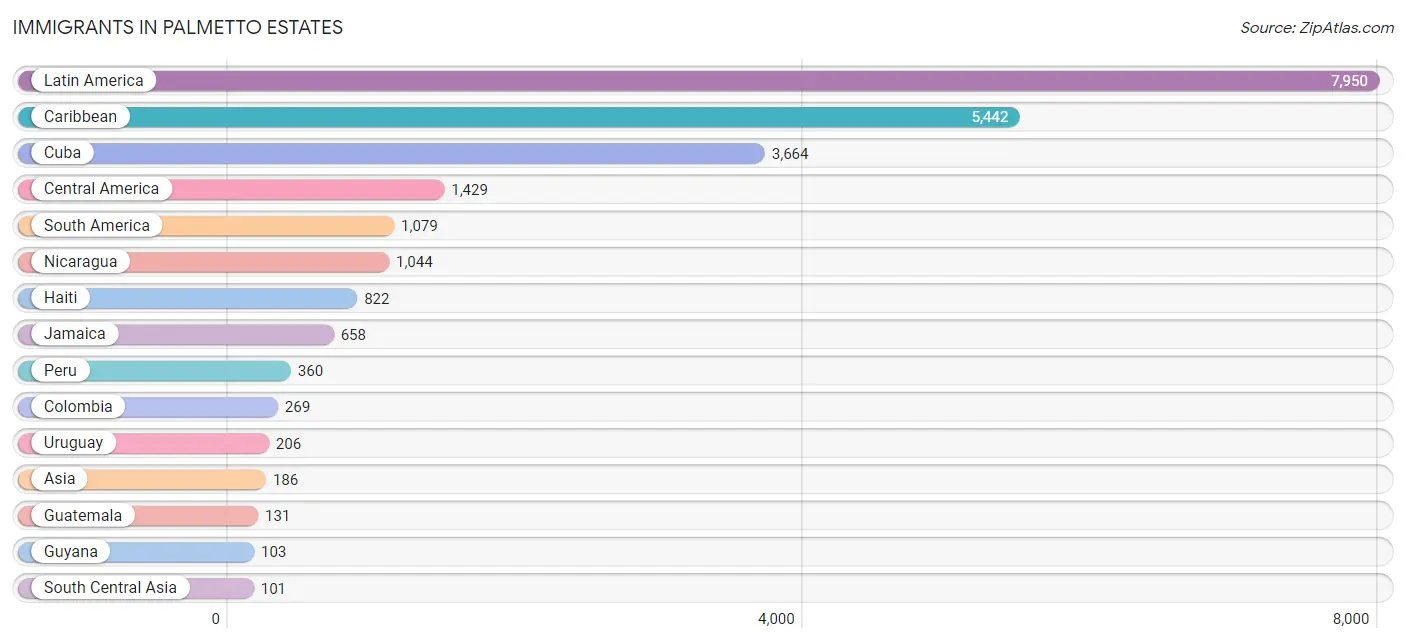
Immigrants in Palmetto Estates
The most numerous immigrant groups reported in Palmetto Estates came from Latin America (7,950 | 47.4%), Caribbean (5,442 | 32.4%), Cuba (3,664 | 21.8%), Central America (1,429 | 8.5%), and South America (1,079 | 6.4%), together accounting for 116.6% of all Palmetto Estates residents.
| Immigration Origin | # Population | % Population |
| Asia | 186 | 1.1% |
| Barbados | 25 | 0.2% |
| Bolivia | 42 | 0.3% |
| Brazil | 26 | 0.2% |
| Canada | 21 | 0.1% |
| Caribbean | 5,442 | 32.4% |
| Central America | 1,429 | 8.5% |
| Colombia | 269 | 1.6% |
| Costa Rica | 72 | 0.4% |
| Cuba | 3,664 | 21.8% |
| Dominican Republic | 99 | 0.6% |
| Ecuador | 41 | 0.2% |
| El Salvador | 41 | 0.2% |
| Europe | 21 | 0.1% |
| Germany | 18 | 0.1% |
| Guatemala | 131 | 0.8% |
| Guyana | 103 | 0.6% |
| Haiti | 822 | 4.9% |
| Honduras | 71 | 0.4% |
| India | 5 | 0.0% |
| Iran | 51 | 0.3% |
| Jamaica | 658 | 3.9% |
| Latin America | 7,950 | 47.4% |
| Mexico | 2 | 0.0% |
| Nicaragua | 1,044 | 6.2% |
| Pakistan | 45 | 0.3% |
| Panama | 68 | 0.4% |
| Peru | 360 | 2.1% |
| Philippines | 27 | 0.2% |
| South America | 1,079 | 6.4% |
| South Central Asia | 101 | 0.6% |
| South Eastern Asia | 74 | 0.4% |
| Southern Europe | 3 | 0.0% |
| Spain | 3 | 0.0% |
| Trinidad and Tobago | 30 | 0.2% |
| Turkey | 11 | 0.1% |
| Uruguay | 206 | 1.2% |
| Venezuela | 32 | 0.2% |
| West Indies | 27 | 0.2% |
| Western Asia | 11 | 0.1% |
| Western Europe | 18 | 0.1% | View All 41 Rows |
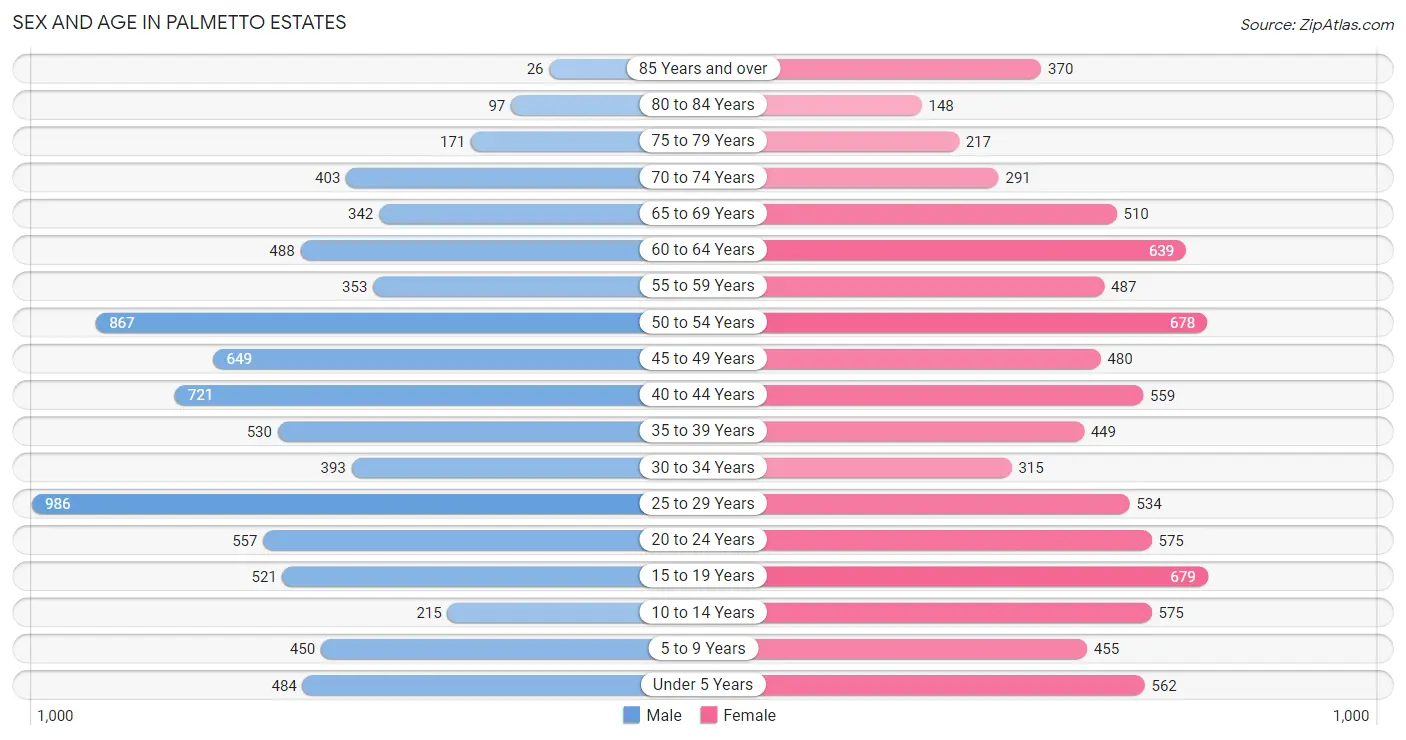
Sex and Age in Palmetto Estates
Sex and Age in Palmetto Estates
The most populous age groups in Palmetto Estates are 25 to 29 Years (986 | 11.9%) for men and 15 to 19 Years (679 | 8.0%) for women.
| Age Bracket | Male | Female |
| Under 5 Years | 484 (5.9%) | 562 (6.6%) |
| 5 to 9 Years | 450 (5.4%) | 455 (5.3%) |
| 10 to 14 Years | 215 (2.6%) | 575 (6.8%) |
| 15 to 19 Years | 521 (6.3%) | 679 (8.0%) |
| 20 to 24 Years | 557 (6.8%) | 575 (6.8%) |
| 25 to 29 Years | 986 (11.9%) | 534 (6.3%) |
| 30 to 34 Years | 393 (4.8%) | 315 (3.7%) |
| 35 to 39 Years | 530 (6.4%) | 449 (5.3%) |
| 40 to 44 Years | 721 (8.7%) | 559 (6.6%) |
| 45 to 49 Years | 649 (7.9%) | 480 (5.6%) |
| 50 to 54 Years | 867 (10.5%) | 678 (8.0%) |
| 55 to 59 Years | 353 (4.3%) | 487 (5.7%) |
| 60 to 64 Years | 488 (5.9%) | 639 (7.5%) |
| 65 to 69 Years | 342 (4.1%) | 510 (6.0%) |
| 70 to 74 Years | 403 (4.9%) | 291 (3.4%) |
| 75 to 79 Years | 171 (2.1%) | 217 (2.5%) |
| 80 to 84 Years | 97 (1.2%) | 148 (1.7%) |
| 85 Years and over | 26 (0.3%) | 370 (4.3%) |
| Total | 8,253 (100.0%) | 8,523 (100.0%) |
Families and Households in Palmetto Estates
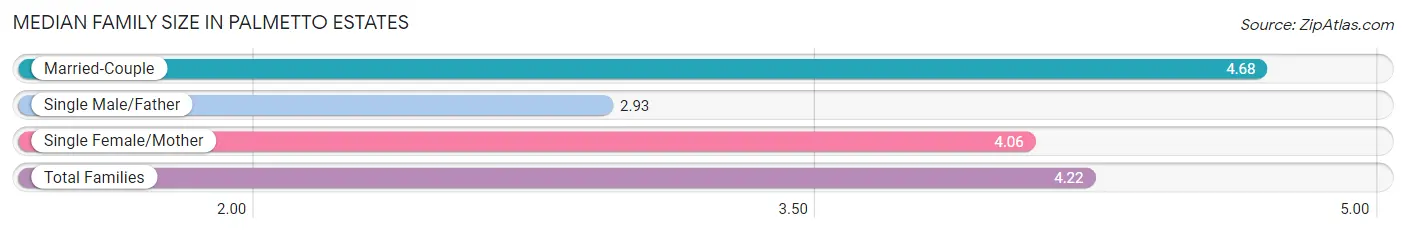
Median Family Size in Palmetto Estates
The median family size in Palmetto Estates is 4.22 persons per family, with married-couple families (2,040 | 57.0%) accounting for the largest median family size of 4.68 persons per family. On the other hand, single male/father families (617 | 17.2%) represent the smallest median family size with 2.93 persons per family.
| Family Type | # Families | Family Size |
| Married-Couple | 2,040 (57.0%) | 4.68 |
| Single Male/Father | 617 (17.2%) | 2.93 |
| Single Female/Mother | 921 (25.7%) | 4.06 |
| Total Families | 3,578 (100.0%) | 4.22 |
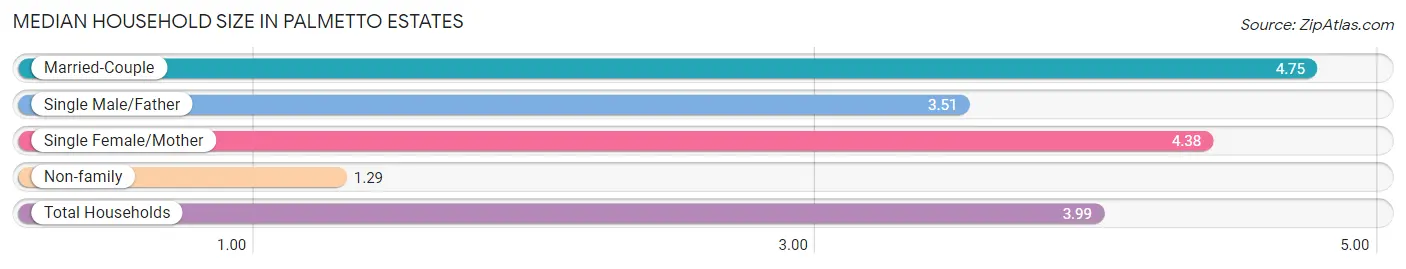
Median Household Size in Palmetto Estates
The median household size in Palmetto Estates is 3.99 persons per household, with married-couple households (2,040 | 48.9%) accounting for the largest median household size of 4.75 persons per household. non-family households (597 | 14.3%) represent the smallest median household size with 1.29 persons per household.
| Household Type | # Households | Household Size |
| Married-Couple | 2,040 (48.9%) | 4.75 |
| Single Male/Father | 617 (14.8%) | 3.51 |
| Single Female/Mother | 921 (22.1%) | 4.38 |
| Non-family | 597 (14.3%) | 1.29 |
| Total Households | 4,175 (100.0%) | 3.99 |
Household Size by Marriage Status in Palmetto Estates
Out of a total of 4,175 households in Palmetto Estates, 3,578 (85.7%) are family households, while 597 (14.3%) are nonfamily households. The most numerous type of family households are 3-person households, comprising 886, and the most common type of nonfamily households are 1-person households, comprising 466.
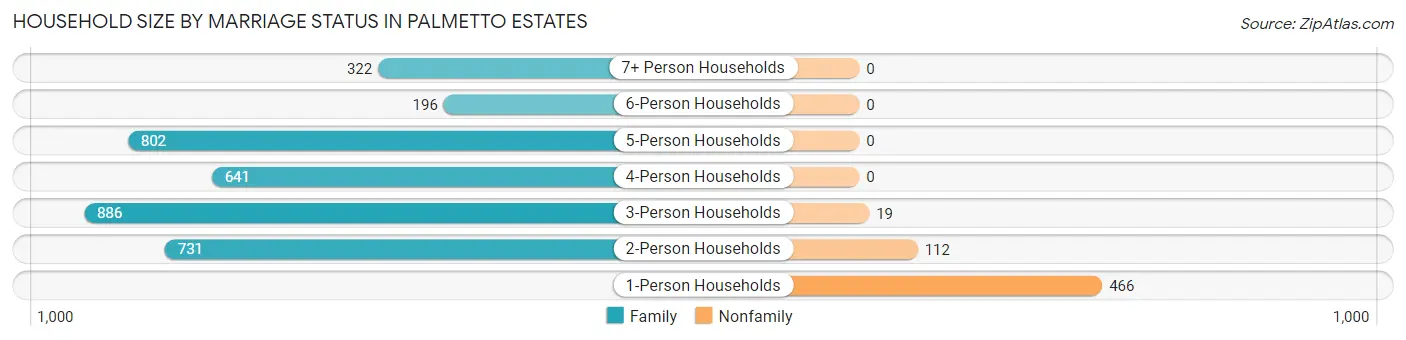
| Household Size | Family Households | Nonfamily Households |
| 1-Person Households | - | 466 (11.2%) |
| 2-Person Households | 731 (17.5%) | 112 (2.7%) |
| 3-Person Households | 886 (21.2%) | 19 (0.5%) |
| 4-Person Households | 641 (15.3%) | 0 (0.0%) |
| 5-Person Households | 802 (19.2%) | 0 (0.0%) |
| 6-Person Households | 196 (4.7%) | 0 (0.0%) |
| 7+ Person Households | 322 (7.7%) | 0 (0.0%) |
| Total | 3,578 (85.7%) | 597 (14.3%) |
Female Fertility in Palmetto Estates
Fertility by Age in Palmetto Estates
Average fertility rate in Palmetto Estates is 29.0 births per 1,000 women. Women in the age bracket of 20 to 34 years have the highest fertility rate with 60.0 births per 1,000 women. Women in the age bracket of 20 to 34 years acount for 78.9% of all women with births.
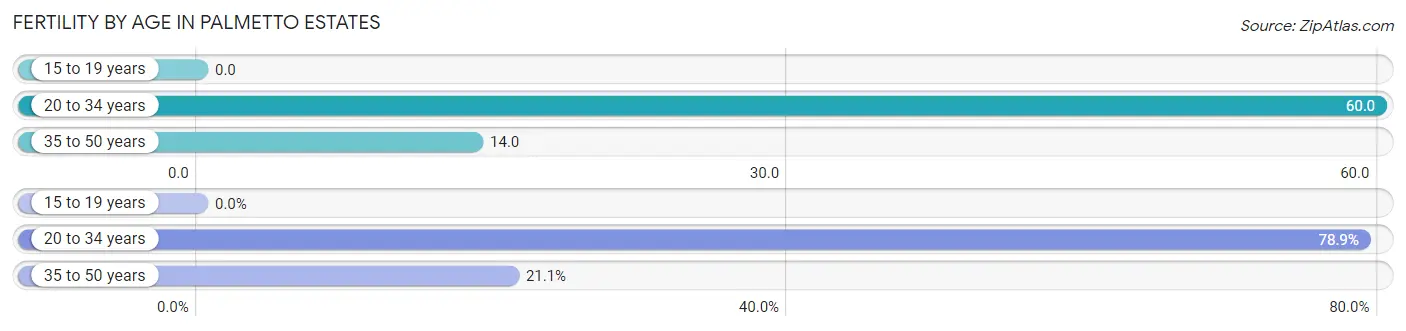
| Age Bracket | Women with Births | Births / 1,000 Women |
| 15 to 19 years | 0 (0.0%) | 0.0 |
| 20 to 34 years | 86 (78.9%) | 60.0 |
| 35 to 50 years | 23 (21.1%) | 14.0 |
| Total | 109 (100.0%) | 29.0 |
Fertility by Age by Marriage Status in Palmetto Estates
52.3% of women with births (109) in Palmetto Estates are married. The highest percentage of unmarried women with births falls into 20 to 34 years age bracket with 60.5% of them unmarried at the time of birth, while the lowest percentage of unmarried women with births belong to 35 to 50 years age bracket with 0.0% of them unmarried.
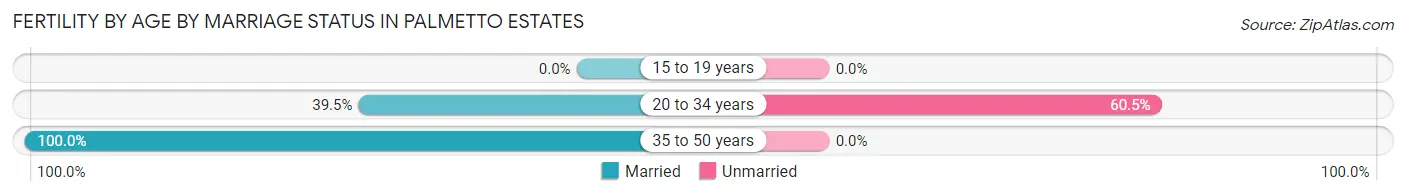
| Age Bracket | Married | Unmarried |
| 15 to 19 years | 0 (0.0%) | 0 (0.0%) |
| 20 to 34 years | 34 (39.5%) | 52 (60.5%) |
| 35 to 50 years | 23 (100.0%) | 0 (0.0%) |
| Total | 57 (52.3%) | 52 (47.7%) |
Fertility by Education in Palmetto Estates
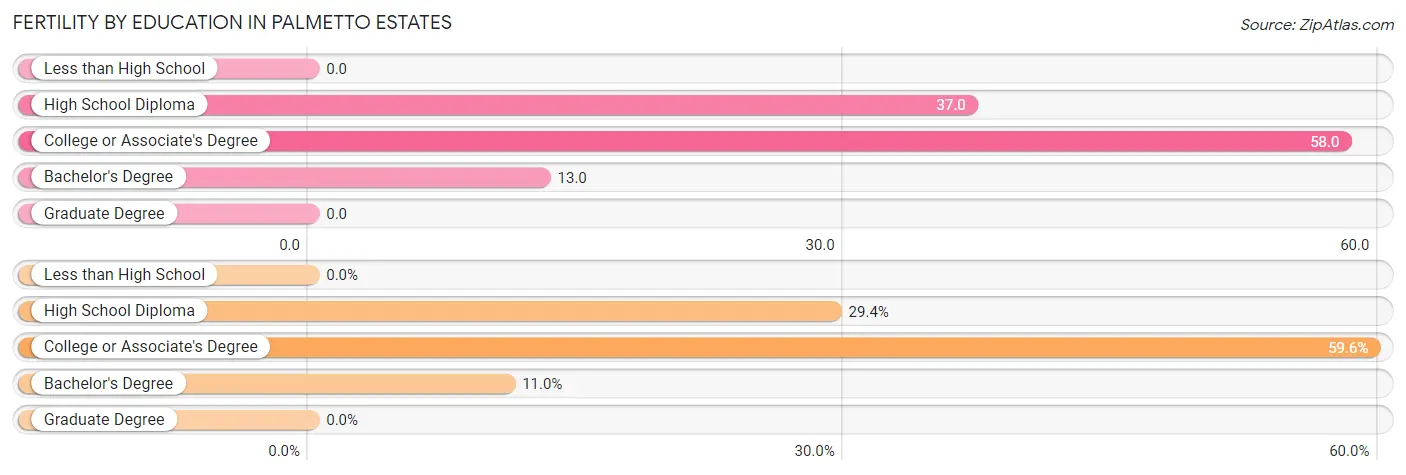
| Educational Attainment | Women with Births | Births / 1,000 Women |
| Less than High School | 0 (0.0%) | 0.0 |
| High School Diploma | 32 (29.4%) | 37.0 |
| College or Associate's Degree | 65 (59.6%) | 58.0 |
| Bachelor's Degree | 12 (11.0%) | 13.0 |
| Graduate Degree | 0 (0.0%) | 0.0 |
| Total | 109 (100.0%) | 29.0 |
Fertility by Education by Marriage Status in Palmetto Estates
47.7% of women with births in Palmetto Estates are unmarried. Women with the educational attainment of bachelor's degree are most likely to be married with 100.0% of them married at childbirth, while women with the educational attainment of college or associate's degree are least likely to be married with 64.6% of them unmarried at childbirth.
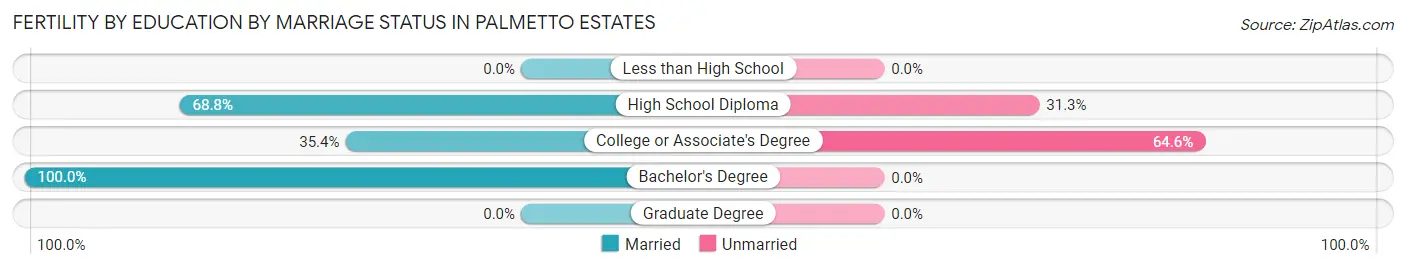
| Educational Attainment | Married | Unmarried |
| Less than High School | 0 (0.0%) | 0 (0.0%) |
| High School Diploma | 22 (68.8%) | 10 (31.2%) |
| College or Associate's Degree | 23 (35.4%) | 42 (64.6%) |
| Bachelor's Degree | 12 (100.0%) | 0 (0.0%) |
| Graduate Degree | 0 (0.0%) | 0 (0.0%) |
| Total | 57 (52.3%) | 52 (47.7%) |
Employment Characteristics in Palmetto Estates
Employment by Class of Employer in Palmetto Estates
Among the 8,095 employed individuals in Palmetto Estates, private company employees (5,786 | 71.5%), local government employees (533 | 6.6%), and not-for-profit organizations (416 | 5.1%) make up the most common classes of employment.
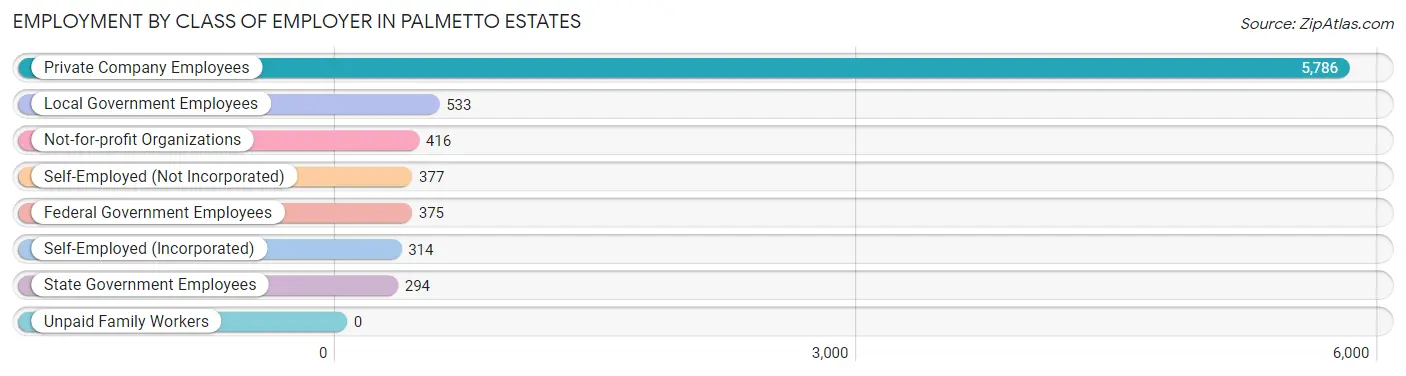
| Employer Class | # Employees | % Employees |
| Private Company Employees | 5,786 | 71.5% |
| Self-Employed (Incorporated) | 314 | 3.9% |
| Self-Employed (Not Incorporated) | 377 | 4.7% |
| Not-for-profit Organizations | 416 | 5.1% |
| Local Government Employees | 533 | 6.6% |
| State Government Employees | 294 | 3.6% |
| Federal Government Employees | 375 | 4.6% |
| Unpaid Family Workers | 0 | 0.0% |
| Total | 8,095 | 100.0% |
Employment Status by Age in Palmetto Estates
According to the labor force statistics for Palmetto Estates, out of the total population over 16 years of age (13,742), 62.7% or 8,616 individuals are in the labor force, with 3.8% or 327 of them unemployed. The age group with the highest labor force participation rate is 45 to 54 years, with 88.9% or 2,377 individuals in the labor force. Within the labor force, the 16 to 19 years age range has the highest percentage of unemployed individuals, with 32.6% or 45 of them being unemployed.
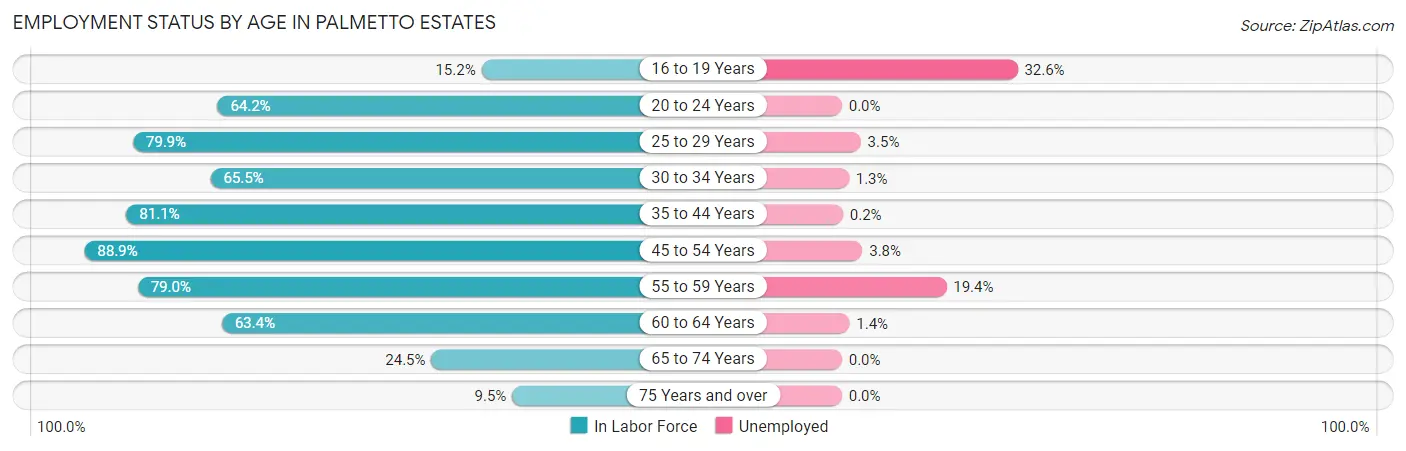
| Age Bracket | In Labor Force | Unemployed |
| 16 to 19 Years | 138 (15.2%) | 45 (32.6%) |
| 20 to 24 Years | 727 (64.2%) | 0 (0.0%) |
| 25 to 29 Years | 1,214 (79.9%) | 42 (3.5%) |
| 30 to 34 Years | 464 (65.5%) | 6 (1.3%) |
| 35 to 44 Years | 1,832 (81.1%) | 4 (0.2%) |
| 45 to 54 Years | 2,377 (88.9%) | 90 (3.8%) |
| 55 to 59 Years | 664 (79.0%) | 129 (19.4%) |
| 60 to 64 Years | 715 (63.4%) | 10 (1.4%) |
| 65 to 74 Years | 379 (24.5%) | 0 (0.0%) |
| 75 Years and over | 98 (9.5%) | 0 (0.0%) |
| Total | 8,616 (62.7%) | 327 (3.8%) |
Employment Status by Educational Attainment in Palmetto Estates
According to labor force statistics for Palmetto Estates, 79.6% of individuals (7,266) out of the total population between 25 and 64 years of age (9,128) are in the labor force, with 3.9% or 283 of them being unemployed. The group with the highest labor force participation rate are those with the educational attainment of bachelor's degree or higher, with 84.7% or 2,141 individuals in the labor force. Within the labor force, individuals with less than high school education have the highest percentage of unemployment, with 30.0% or 117 of them being unemployed.
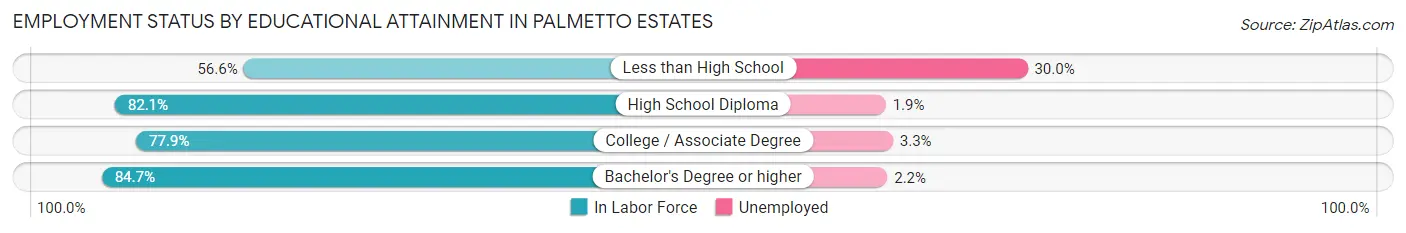
| Educational Attainment | In Labor Force | Unemployed |
| Less than High School | 390 (56.6%) | 207 (30.0%) |
| High School Diploma | 2,676 (82.1%) | 62 (1.9%) |
| College / Associate Degree | 2,065 (77.9%) | 87 (3.3%) |
| Bachelor's Degree or higher | 2,141 (84.7%) | 56 (2.2%) |
| Total | 7,266 (79.6%) | 356 (3.9%) |
Employment Occupations by Sex in Palmetto Estates
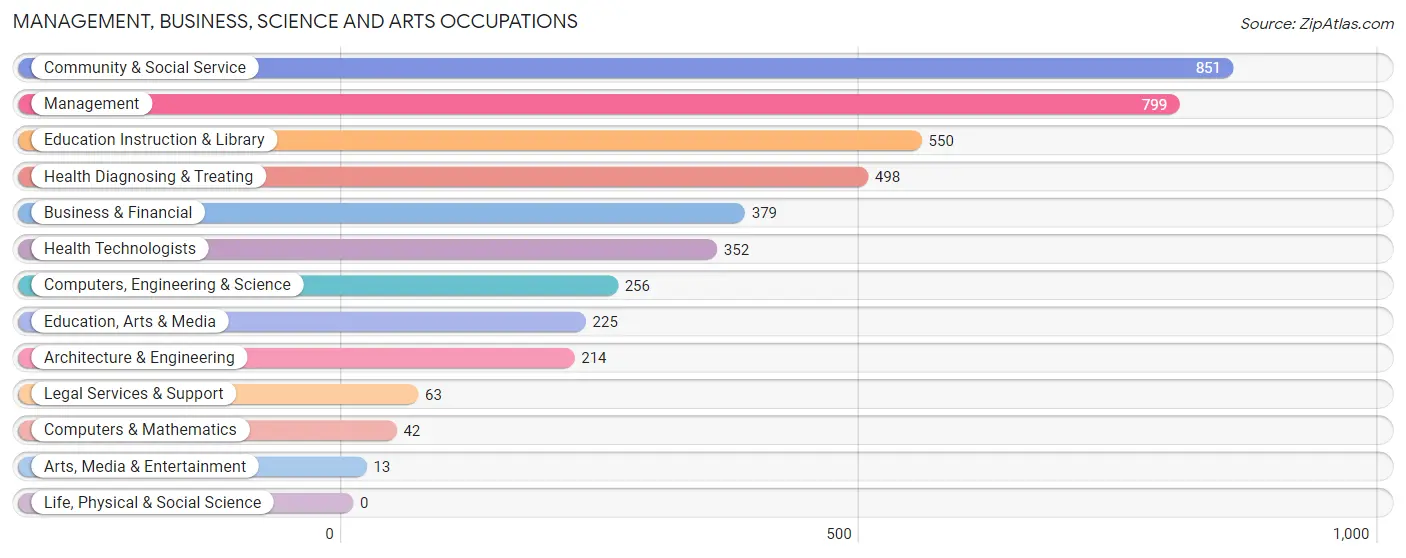
Management, Business, Science and Arts Occupations
The most common Management, Business, Science and Arts occupations in Palmetto Estates are Community & Social Service (851 | 10.3%), Management (799 | 9.7%), Education Instruction & Library (550 | 6.6%), Health Diagnosing & Treating (498 | 6.0%), and Business & Financial (379 | 4.6%).
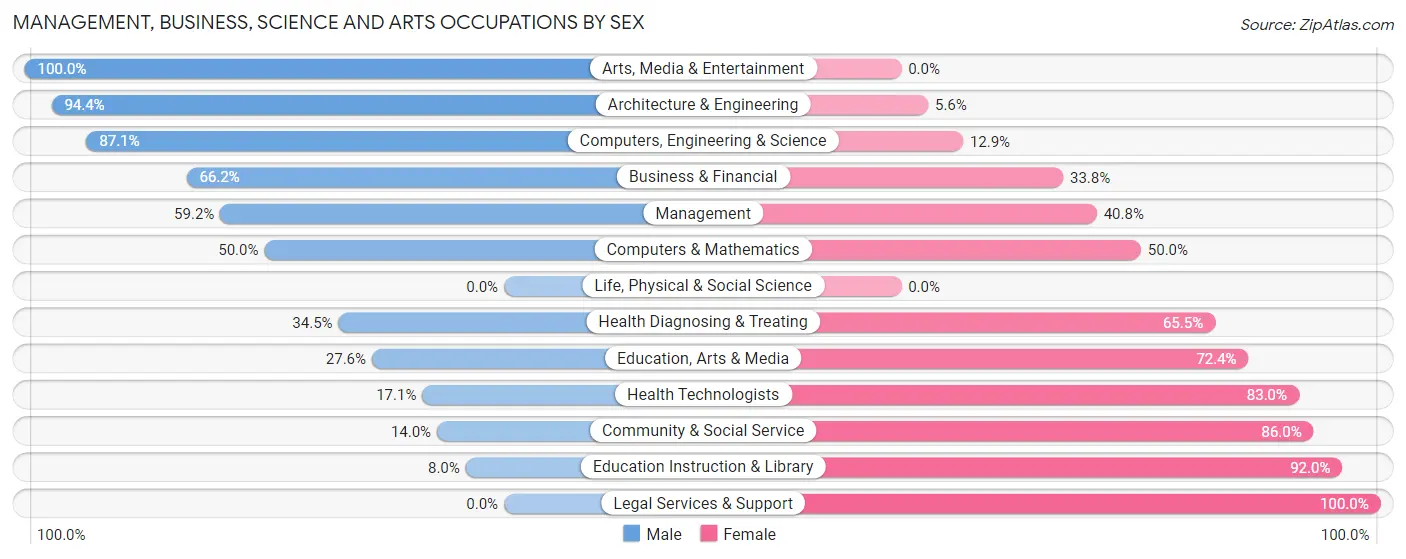
Management, Business, Science and Arts Occupations by Sex
Within the Management, Business, Science and Arts occupations in Palmetto Estates, the most male-oriented occupations are Arts, Media & Entertainment (100.0%), Architecture & Engineering (94.4%), and Computers, Engineering & Science (87.1%), while the most female-oriented occupations are Legal Services & Support (100.0%), Education Instruction & Library (92.0%), and Community & Social Service (86.0%).
| Occupation | Male | Female |
| Management | 473 (59.2%) | 326 (40.8%) |
| Business & Financial | 251 (66.2%) | 128 (33.8%) |
| Computers, Engineering & Science | 223 (87.1%) | 33 (12.9%) |
| Computers & Mathematics | 21 (50.0%) | 21 (50.0%) |
| Architecture & Engineering | 202 (94.4%) | 12 (5.6%) |
| Life, Physical & Social Science | 0 (0.0%) | 0 (0.0%) |
| Community & Social Service | 119 (14.0%) | 732 (86.0%) |
| Education, Arts & Media | 62 (27.6%) | 163 (72.4%) |
| Legal Services & Support | 0 (0.0%) | 63 (100.0%) |
| Education Instruction & Library | 44 (8.0%) | 506 (92.0%) |
| Arts, Media & Entertainment | 13 (100.0%) | 0 (0.0%) |
| Health Diagnosing & Treating | 172 (34.5%) | 326 (65.5%) |
| Health Technologists | 60 (17.1%) | 292 (83.0%) |
| Total (Category) | 1,238 (44.5%) | 1,545 (55.5%) |
| Total (Overall) | 4,661 (56.3%) | 3,617 (43.7%) |
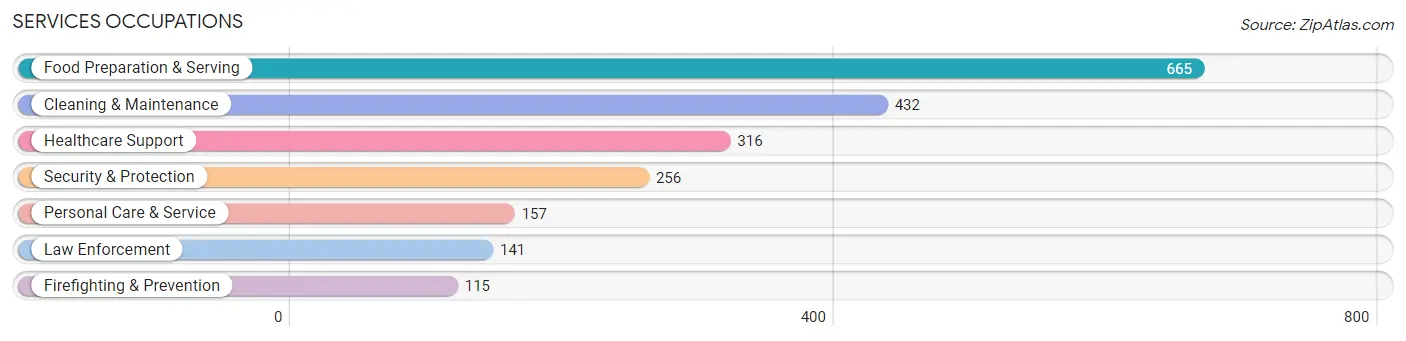
Services Occupations
The most common Services occupations in Palmetto Estates are Food Preparation & Serving (665 | 8.0%), Cleaning & Maintenance (432 | 5.2%), Healthcare Support (316 | 3.8%), Security & Protection (256 | 3.1%), and Personal Care & Service (157 | 1.9%).
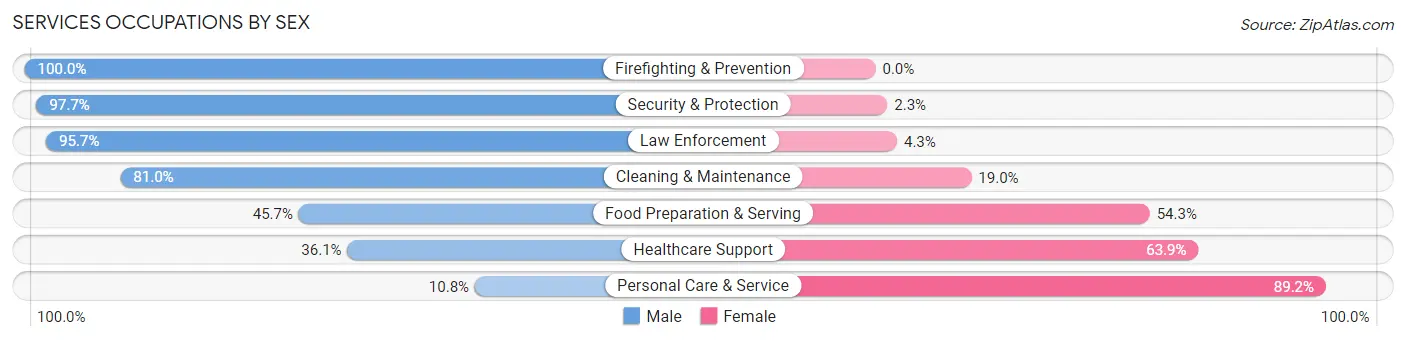
Services Occupations by Sex
Within the Services occupations in Palmetto Estates, the most male-oriented occupations are Firefighting & Prevention (100.0%), Security & Protection (97.7%), and Law Enforcement (95.7%), while the most female-oriented occupations are Personal Care & Service (89.2%), Healthcare Support (63.9%), and Food Preparation & Serving (54.3%).
| Occupation | Male | Female |
| Healthcare Support | 114 (36.1%) | 202 (63.9%) |
| Security & Protection | 250 (97.7%) | 6 (2.3%) |
| Firefighting & Prevention | 115 (100.0%) | 0 (0.0%) |
| Law Enforcement | 135 (95.7%) | 6 (4.3%) |
| Food Preparation & Serving | 304 (45.7%) | 361 (54.3%) |
| Cleaning & Maintenance | 350 (81.0%) | 82 (19.0%) |
| Personal Care & Service | 17 (10.8%) | 140 (89.2%) |
| Total (Category) | 1,035 (56.7%) | 791 (43.3%) |
| Total (Overall) | 4,661 (56.3%) | 3,617 (43.7%) |
Sales and Office Occupations
The most common Sales and Office occupations in Palmetto Estates are Office & Administration (1,086 | 13.1%), and Sales & Related (965 | 11.7%).

Sales and Office Occupations by Sex
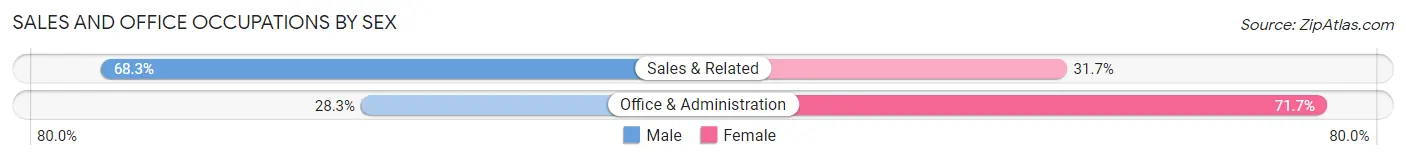
| Occupation | Male | Female |
| Sales & Related | 659 (68.3%) | 306 (31.7%) |
| Office & Administration | 307 (28.3%) | 779 (71.7%) |
| Total (Category) | 966 (47.1%) | 1,085 (52.9%) |
| Total (Overall) | 4,661 (56.3%) | 3,617 (43.7%) |
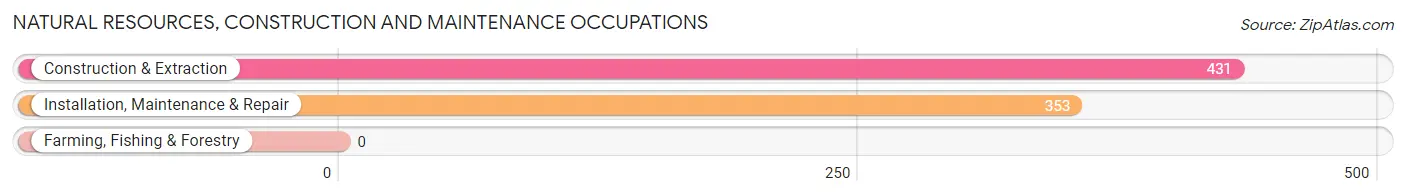
Natural Resources, Construction and Maintenance Occupations
The most common Natural Resources, Construction and Maintenance occupations in Palmetto Estates are Construction & Extraction (431 | 5.2%), and Installation, Maintenance & Repair (353 | 4.3%).
Natural Resources, Construction and Maintenance Occupations by Sex
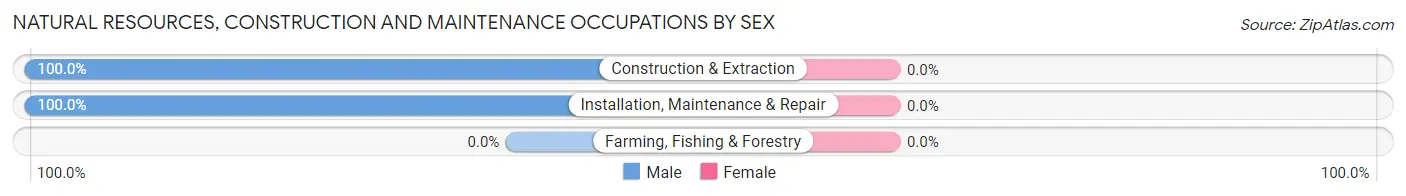
| Occupation | Male | Female |
| Farming, Fishing & Forestry | 0 (0.0%) | 0 (0.0%) |
| Construction & Extraction | 431 (100.0%) | 0 (0.0%) |
| Installation, Maintenance & Repair | 353 (100.0%) | 0 (0.0%) |
| Total (Category) | 784 (100.0%) | 0 (0.0%) |
| Total (Overall) | 4,661 (56.3%) | 3,617 (43.7%) |
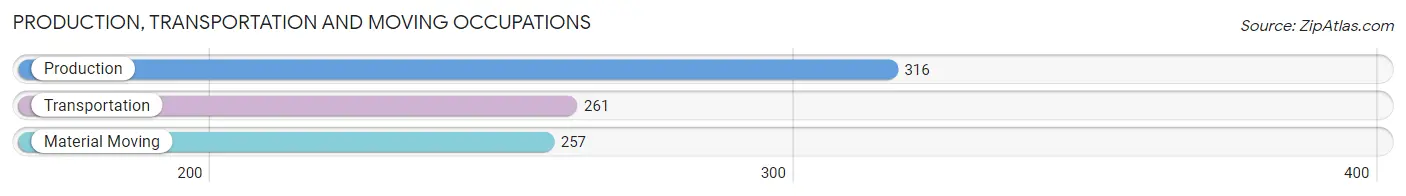
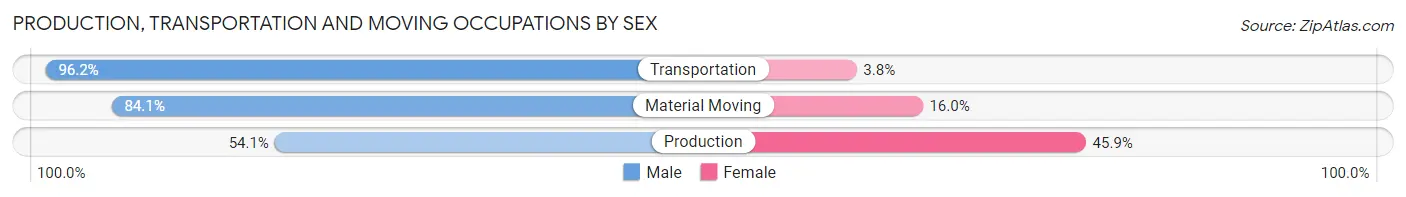
Production, Transportation and Moving Occupations
The most common Production, Transportation and Moving occupations in Palmetto Estates are Production (316 | 3.8%), Transportation (261 | 3.2%), and Material Moving (257 | 3.1%).
Production, Transportation and Moving Occupations by Sex
| Occupation | Male | Female |
| Production | 171 (54.1%) | 145 (45.9%) |
| Transportation | 251 (96.2%) | 10 (3.8%) |
| Material Moving | 216 (84.1%) | 41 (16.0%) |
| Total (Category) | 638 (76.5%) | 196 (23.5%) |
| Total (Overall) | 4,661 (56.3%) | 3,617 (43.7%) |
Employment Industries by Sex in Palmetto Estates
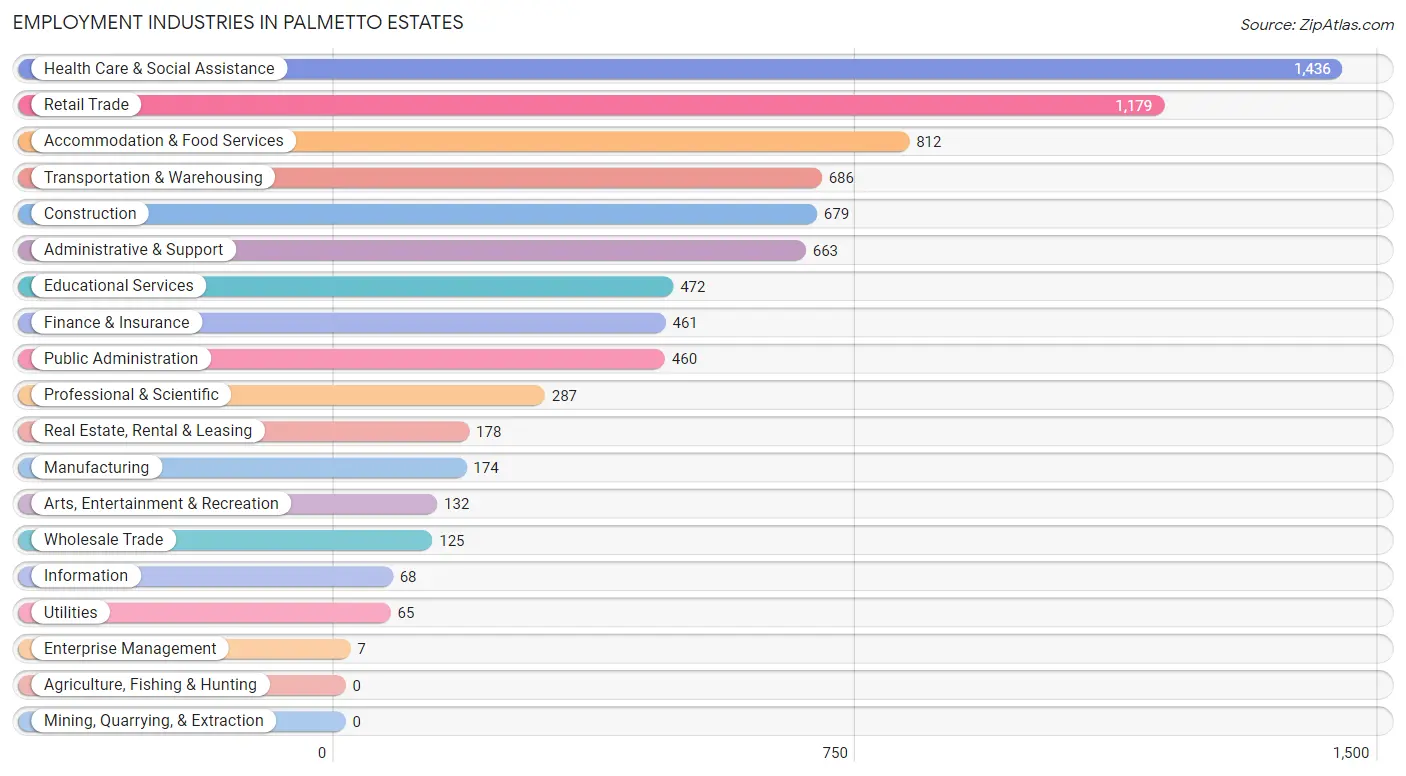
Employment Industries in Palmetto Estates
The major employment industries in Palmetto Estates include Health Care & Social Assistance (1,436 | 17.3%), Retail Trade (1,179 | 14.2%), Accommodation & Food Services (812 | 9.8%), Transportation & Warehousing (686 | 8.3%), and Construction (679 | 8.2%).
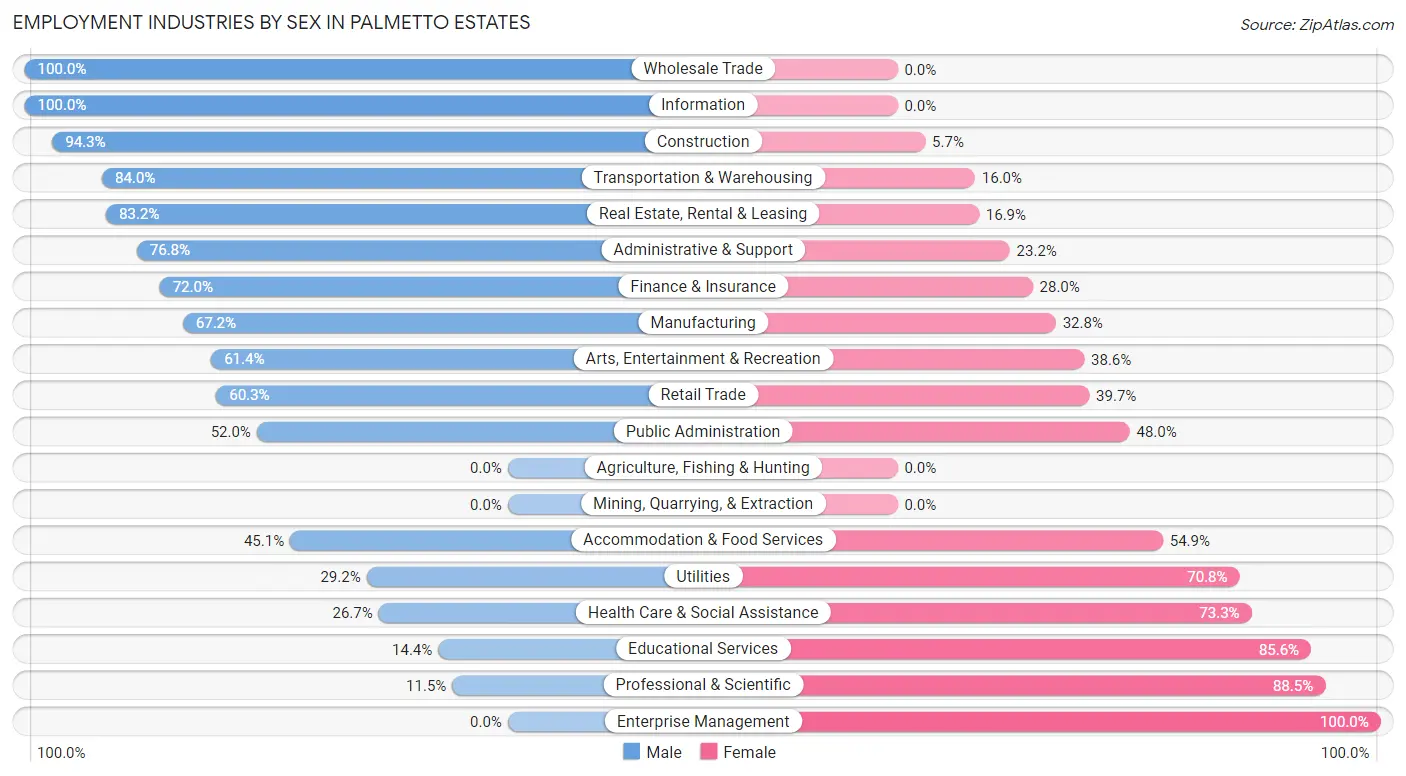
Employment Industries by Sex in Palmetto Estates
The Palmetto Estates industries that see more men than women are Wholesale Trade (100.0%), Information (100.0%), and Construction (94.3%), whereas the industries that tend to have a higher number of women are Enterprise Management (100.0%), Professional & Scientific (88.5%), and Educational Services (85.6%).
| Industry | Male | Female |
| Agriculture, Fishing & Hunting | 0 (0.0%) | 0 (0.0%) |
| Mining, Quarrying, & Extraction | 0 (0.0%) | 0 (0.0%) |
| Construction | 640 (94.3%) | 39 (5.7%) |
| Manufacturing | 117 (67.2%) | 57 (32.8%) |
| Wholesale Trade | 125 (100.0%) | 0 (0.0%) |
| Retail Trade | 711 (60.3%) | 468 (39.7%) |
| Transportation & Warehousing | 576 (84.0%) | 110 (16.0%) |
| Utilities | 19 (29.2%) | 46 (70.8%) |
| Information | 68 (100.0%) | 0 (0.0%) |
| Finance & Insurance | 332 (72.0%) | 129 (28.0%) |
| Real Estate, Rental & Leasing | 148 (83.2%) | 30 (16.9%) |
| Professional & Scientific | 33 (11.5%) | 254 (88.5%) |
| Enterprise Management | 0 (0.0%) | 7 (100.0%) |
| Administrative & Support | 509 (76.8%) | 154 (23.2%) |
| Educational Services | 68 (14.4%) | 404 (85.6%) |
| Health Care & Social Assistance | 384 (26.7%) | 1,052 (73.3%) |
| Arts, Entertainment & Recreation | 81 (61.4%) | 51 (38.6%) |
| Accommodation & Food Services | 366 (45.1%) | 446 (54.9%) |
| Public Administration | 239 (52.0%) | 221 (48.0%) |
| Total | 4,661 (56.3%) | 3,617 (43.7%) |
Education in Palmetto Estates
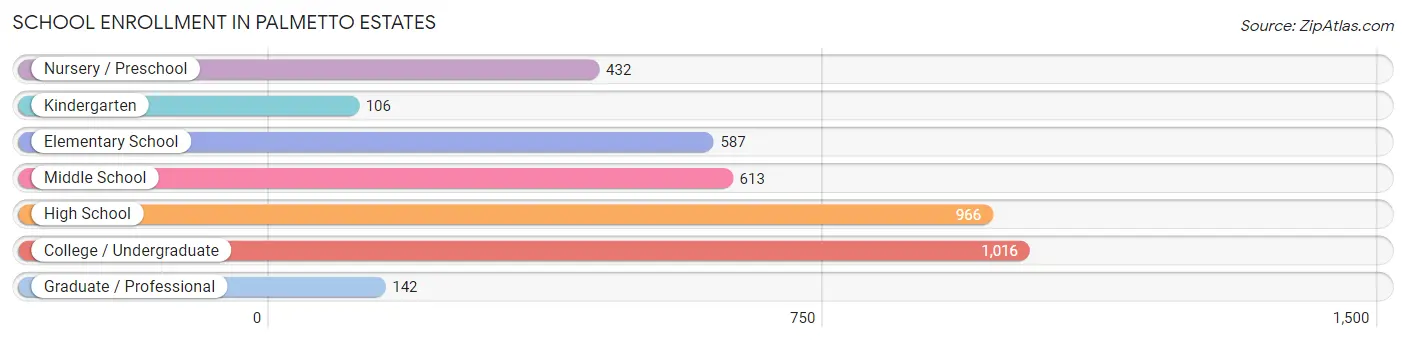
School Enrollment in Palmetto Estates
The most common levels of schooling among the 3,862 students in Palmetto Estates are college / undergraduate (1,016 | 26.3%), high school (966 | 25.0%), and middle school (613 | 15.9%).
| School Level | # Students | % Students |
| Nursery / Preschool | 432 | 11.2% |
| Kindergarten | 106 | 2.7% |
| Elementary School | 587 | 15.2% |
| Middle School | 613 | 15.9% |
| High School | 966 | 25.0% |
| College / Undergraduate | 1,016 | 26.3% |
| Graduate / Professional | 142 | 3.7% |
| Total | 3,862 | 100.0% |
School Enrollment by Age by Funding Source in Palmetto Estates
Out of a total of 3,862 students who are enrolled in schools in Palmetto Estates, 823 (21.3%) attend a private institution, while the remaining 3,039 (78.7%) are enrolled in public schools. The age group of 3 to 4 year olds has the highest likelihood of being enrolled in private schools, with 215 (67.2% in the age bracket) enrolled. Conversely, the age group of 15 to 17 year olds has the lowest likelihood of being enrolled in a private school, with 642 (97.3% in the age bracket) attending a public institution.
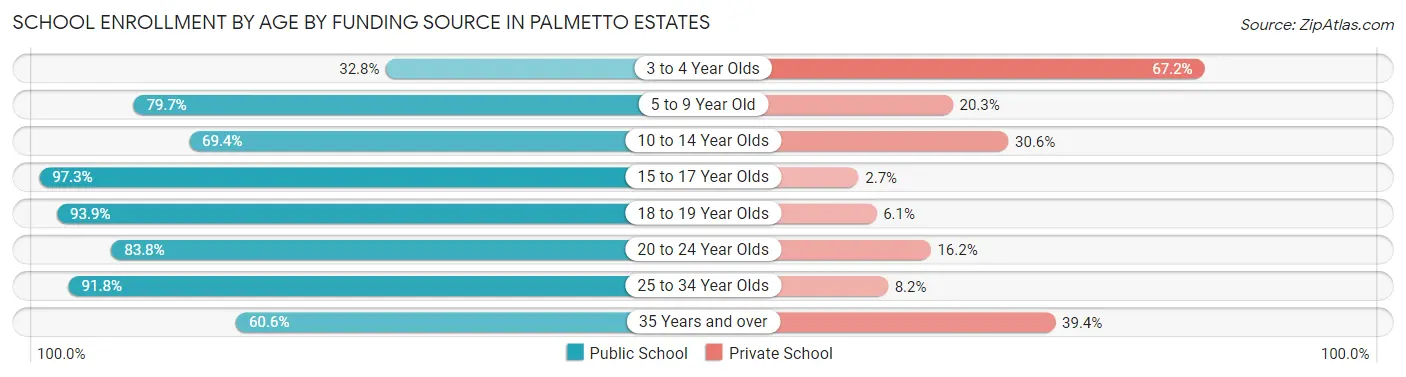
| Age Bracket | Public School | Private School |
| 3 to 4 Year Olds | 105 (32.8%) | 215 (67.2%) |
| 5 to 9 Year Old | 672 (79.7%) | 171 (20.3%) |
| 10 to 14 Year Olds | 548 (69.4%) | 242 (30.6%) |
| 15 to 17 Year Olds | 642 (97.3%) | 18 (2.7%) |
| 18 to 19 Year Olds | 279 (93.9%) | 18 (6.1%) |
| 20 to 24 Year Olds | 337 (83.8%) | 65 (16.2%) |
| 25 to 34 Year Olds | 358 (91.8%) | 32 (8.2%) |
| 35 Years and over | 97 (60.6%) | 63 (39.4%) |
| Total | 3,039 (78.7%) | 823 (21.3%) |
Educational Attainment by Field of Study in Palmetto Estates
Business (617 | 18.9%), science & technology (413 | 12.6%), education (410 | 12.5%), arts & humanities (390 | 11.9%), and social sciences (375 | 11.5%) are the most common fields of study among 3,272 individuals in Palmetto Estates who have obtained a bachelor's degree or higher.
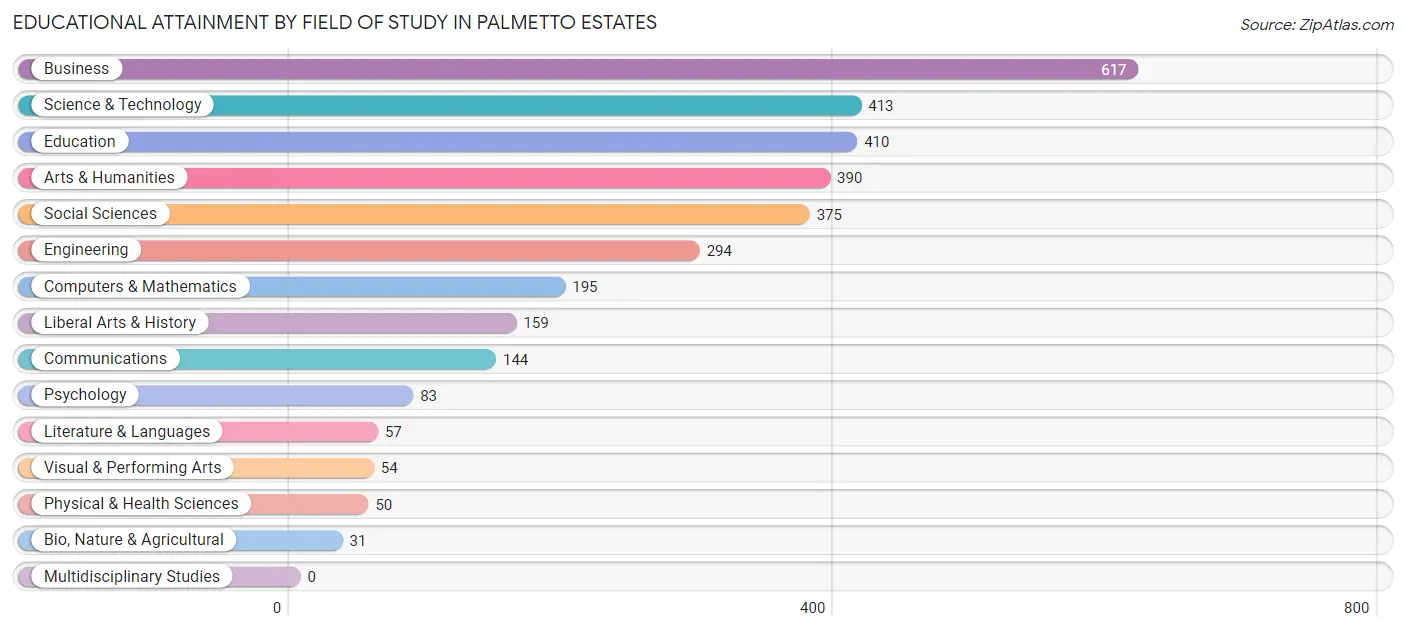
| Field of Study | # Graduates | % Graduates |
| Computers & Mathematics | 195 | 6.0% |
| Bio, Nature & Agricultural | 31 | 0.9% |
| Physical & Health Sciences | 50 | 1.5% |
| Psychology | 83 | 2.5% |
| Social Sciences | 375 | 11.5% |
| Engineering | 294 | 9.0% |
| Multidisciplinary Studies | 0 | 0.0% |
| Science & Technology | 413 | 12.6% |
| Business | 617 | 18.9% |
| Education | 410 | 12.5% |
| Literature & Languages | 57 | 1.7% |
| Liberal Arts & History | 159 | 4.9% |
| Visual & Performing Arts | 54 | 1.7% |
| Communications | 144 | 4.4% |
| Arts & Humanities | 390 | 11.9% |
| Total | 3,272 | 100.0% |
Transportation & Commute in Palmetto Estates
Vehicle Availability by Sex in Palmetto Estates
The most prevalent vehicle ownership categories in Palmetto Estates are males with 3 vehicles (1,444, accounting for 31.5%) and females with 3 vehicles (1,037, making up 41.2%).
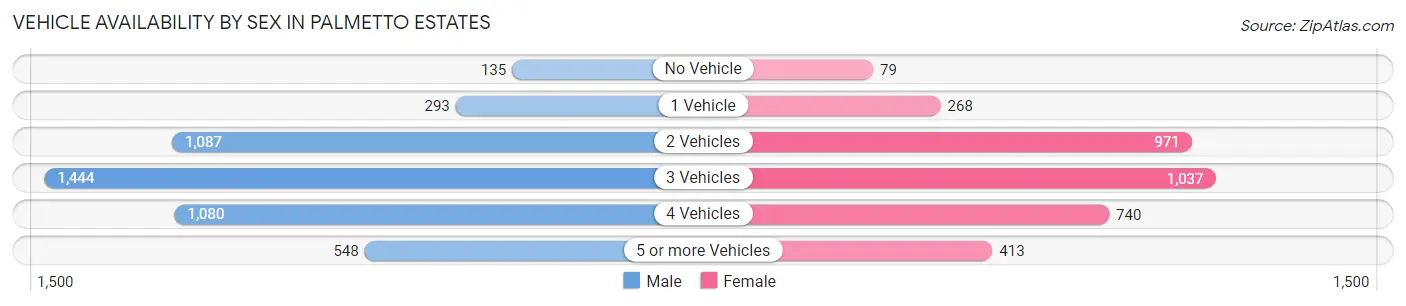
| Vehicles Available | Male | Female |
| No Vehicle | 135 (2.9%) | 79 (2.2%) |
| 1 Vehicle | 293 (6.4%) | 268 (7.6%) |
| 2 Vehicles | 1,087 (23.7%) | 971 (27.7%) |
| 3 Vehicles | 1,444 (31.5%) | 1,037 (29.6%) |
| 4 Vehicles | 1,080 (23.5%) | 740 (21.1%) |
| 5 or more Vehicles | 548 (11.9%) | 413 (11.8%) |
| Total | 4,587 (100.0%) | 3,508 (100.0%) |
Commute Time in Palmetto Estates
The most frequently occuring commute durations in Palmetto Estates are 30 to 34 minutes (1,415 commuters, 17.9%), 45 to 59 minutes (1,341 commuters, 17.0%), and 60 to 89 minutes (1,174 commuters, 14.9%).
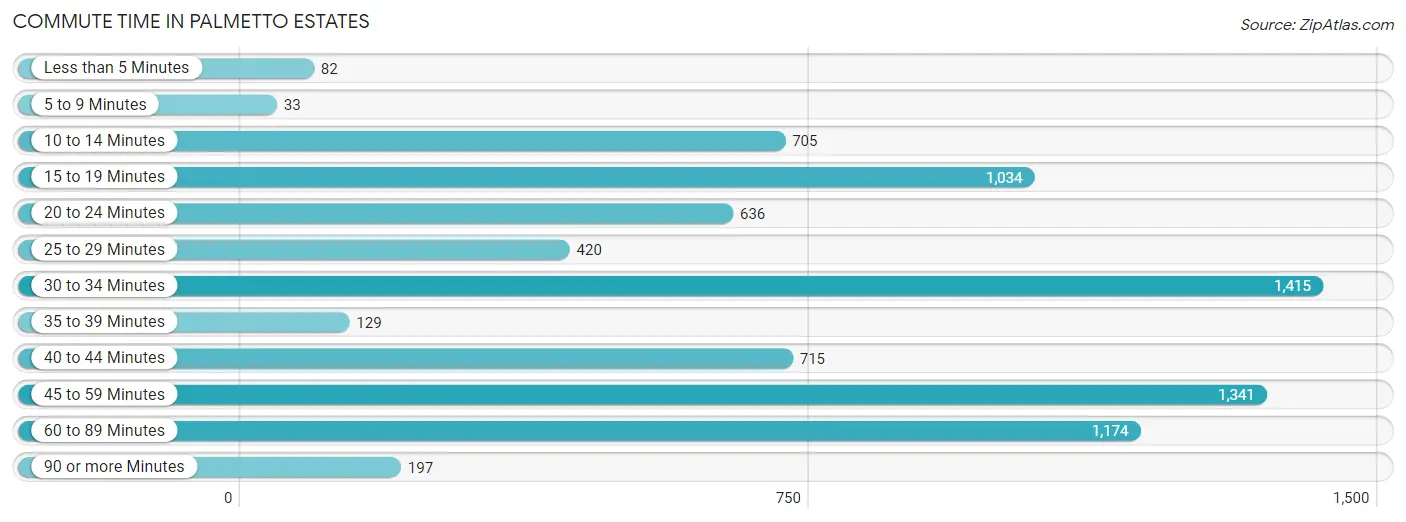
| Commute Time | # Commuters | % Commuters |
| Less than 5 Minutes | 82 | 1.0% |
| 5 to 9 Minutes | 33 | 0.4% |
| 10 to 14 Minutes | 705 | 8.9% |
| 15 to 19 Minutes | 1,034 | 13.1% |
| 20 to 24 Minutes | 636 | 8.1% |
| 25 to 29 Minutes | 420 | 5.3% |
| 30 to 34 Minutes | 1,415 | 17.9% |
| 35 to 39 Minutes | 129 | 1.6% |
| 40 to 44 Minutes | 715 | 9.1% |
| 45 to 59 Minutes | 1,341 | 17.0% |
| 60 to 89 Minutes | 1,174 | 14.9% |
| 90 or more Minutes | 197 | 2.5% |
Commute Time by Sex in Palmetto Estates
The most common commute times in Palmetto Estates are 30 to 34 minutes (894 commuters, 20.1%) for males and 45 to 59 minutes (575 commuters, 16.8%) for females.
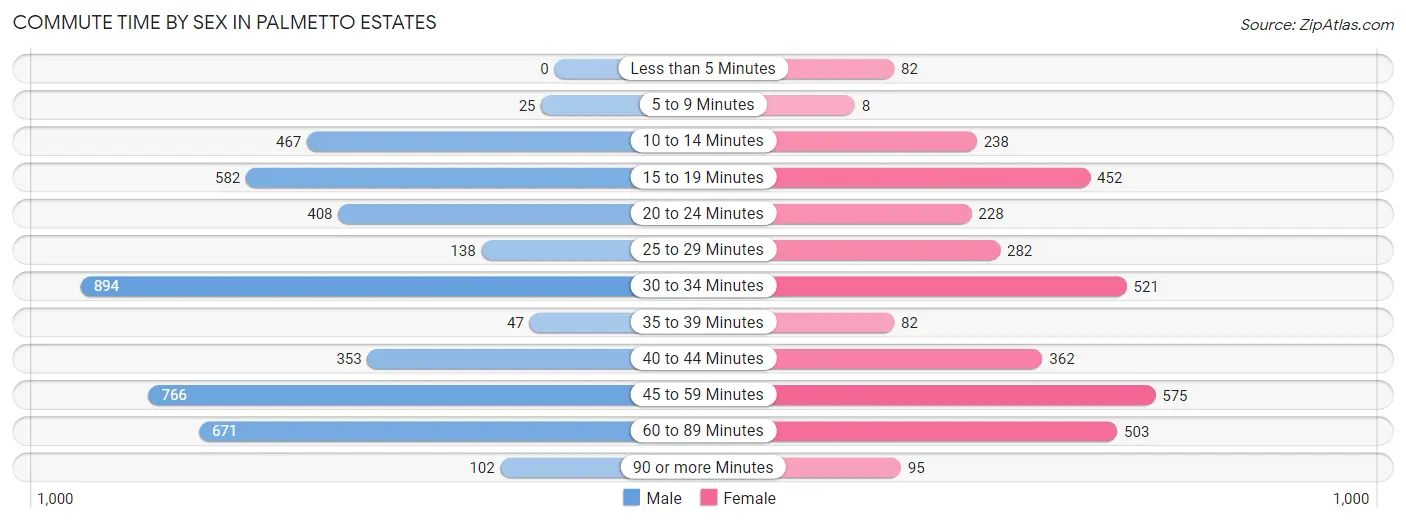
| Commute Time | Male | Female |
| Less than 5 Minutes | 0 (0.0%) | 82 (2.4%) |
| 5 to 9 Minutes | 25 (0.6%) | 8 (0.2%) |
| 10 to 14 Minutes | 467 (10.5%) | 238 (6.9%) |
| 15 to 19 Minutes | 582 (13.1%) | 452 (13.2%) |
| 20 to 24 Minutes | 408 (9.2%) | 228 (6.7%) |
| 25 to 29 Minutes | 138 (3.1%) | 282 (8.2%) |
| 30 to 34 Minutes | 894 (20.1%) | 521 (15.2%) |
| 35 to 39 Minutes | 47 (1.1%) | 82 (2.4%) |
| 40 to 44 Minutes | 353 (7.9%) | 362 (10.6%) |
| 45 to 59 Minutes | 766 (17.2%) | 575 (16.8%) |
| 60 to 89 Minutes | 671 (15.1%) | 503 (14.7%) |
| 90 or more Minutes | 102 (2.3%) | 95 (2.8%) |
Time of Departure to Work by Sex in Palmetto Estates
The most frequent times of departure to work in Palmetto Estates are 8:00 AM to 8:29 AM (875, 19.7%) for males and 8:00 AM to 8:29 AM (535, 15.6%) for females.
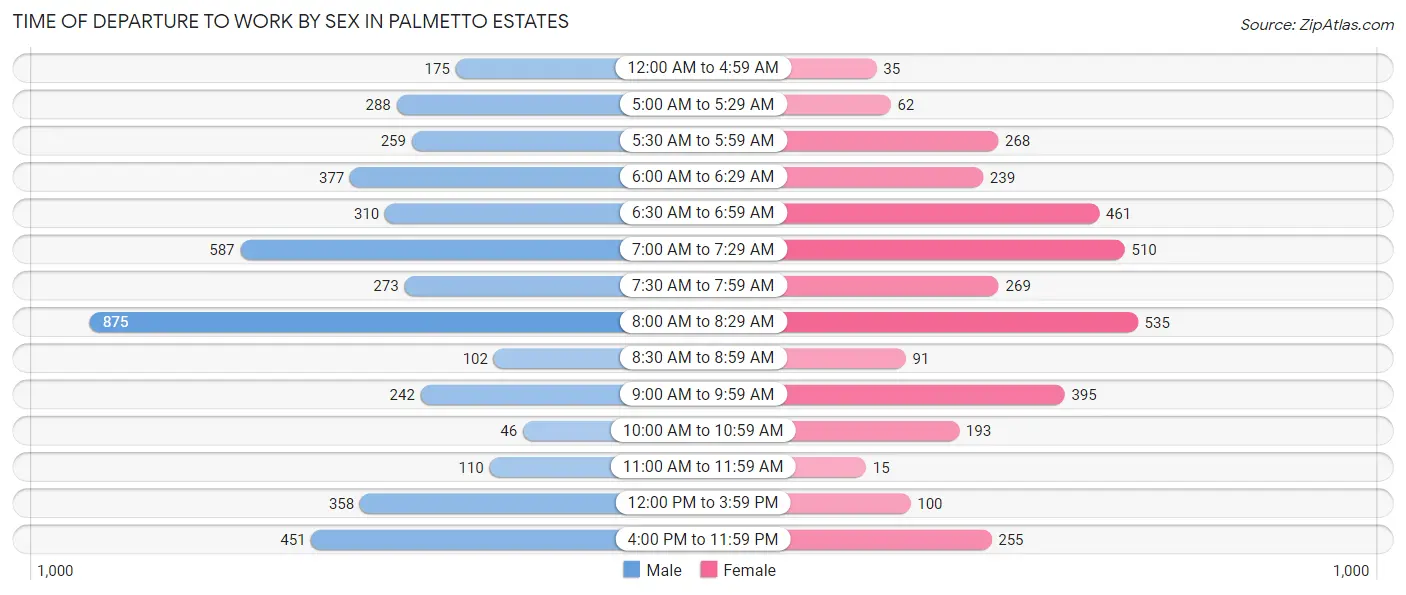
| Time of Departure | Male | Female |
| 12:00 AM to 4:59 AM | 175 (3.9%) | 35 (1.0%) |
| 5:00 AM to 5:29 AM | 288 (6.5%) | 62 (1.8%) |
| 5:30 AM to 5:59 AM | 259 (5.8%) | 268 (7.8%) |
| 6:00 AM to 6:29 AM | 377 (8.5%) | 239 (7.0%) |
| 6:30 AM to 6:59 AM | 310 (7.0%) | 461 (13.5%) |
| 7:00 AM to 7:29 AM | 587 (13.2%) | 510 (14.9%) |
| 7:30 AM to 7:59 AM | 273 (6.1%) | 269 (7.9%) |
| 8:00 AM to 8:29 AM | 875 (19.7%) | 535 (15.6%) |
| 8:30 AM to 8:59 AM | 102 (2.3%) | 91 (2.6%) |
| 9:00 AM to 9:59 AM | 242 (5.4%) | 395 (11.5%) |
| 10:00 AM to 10:59 AM | 46 (1.0%) | 193 (5.6%) |
| 11:00 AM to 11:59 AM | 110 (2.5%) | 15 (0.4%) |
| 12:00 PM to 3:59 PM | 358 (8.0%) | 100 (2.9%) |
| 4:00 PM to 11:59 PM | 451 (10.1%) | 255 (7.4%) |
| Total | 4,453 (100.0%) | 3,428 (100.0%) |
Housing Occupancy in Palmetto Estates
Occupancy by Ownership in Palmetto Estates
Of the total 4,175 dwellings in Palmetto Estates, owner-occupied units account for 3,613 (86.5%), while renter-occupied units make up 562 (13.5%).
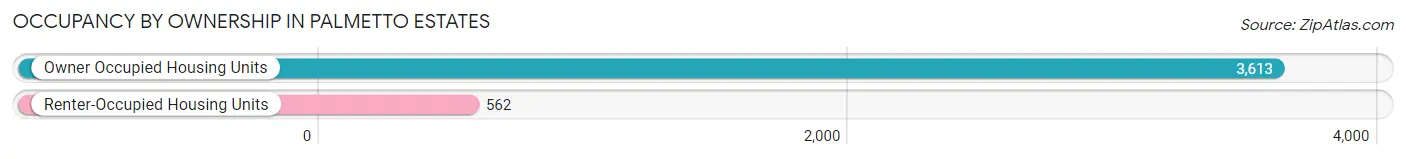
| Occupancy | # Housing Units | % Housing Units |
| Owner Occupied Housing Units | 3,613 | 86.5% |
| Renter-Occupied Housing Units | 562 | 13.5% |
| Total Occupied Housing Units | 4,175 | 100.0% |
Occupancy by Household Size in Palmetto Estates
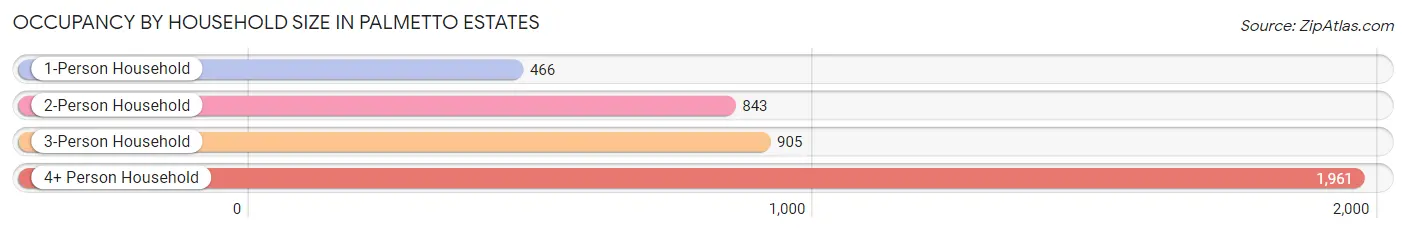
| Household Size | # Housing Units | % Housing Units |
| 1-Person Household | 466 | 11.2% |
| 2-Person Household | 843 | 20.2% |
| 3-Person Household | 905 | 21.7% |
| 4+ Person Household | 1,961 | 47.0% |
| Total Housing Units | 4,175 | 100.0% |
Occupancy by Ownership by Household Size in Palmetto Estates
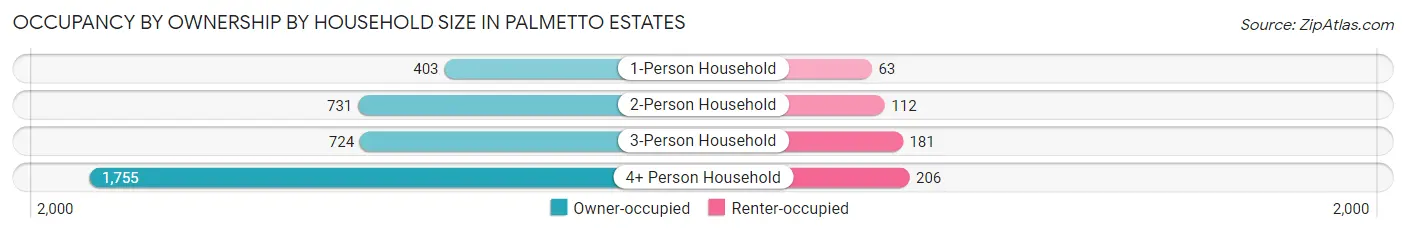
| Household Size | Owner-occupied | Renter-occupied |
| 1-Person Household | 403 (86.5%) | 63 (13.5%) |
| 2-Person Household | 731 (86.7%) | 112 (13.3%) |
| 3-Person Household | 724 (80.0%) | 181 (20.0%) |
| 4+ Person Household | 1,755 (89.5%) | 206 (10.5%) |
| Total Housing Units | 3,613 (86.5%) | 562 (13.5%) |
Occupancy by Educational Attainment in Palmetto Estates
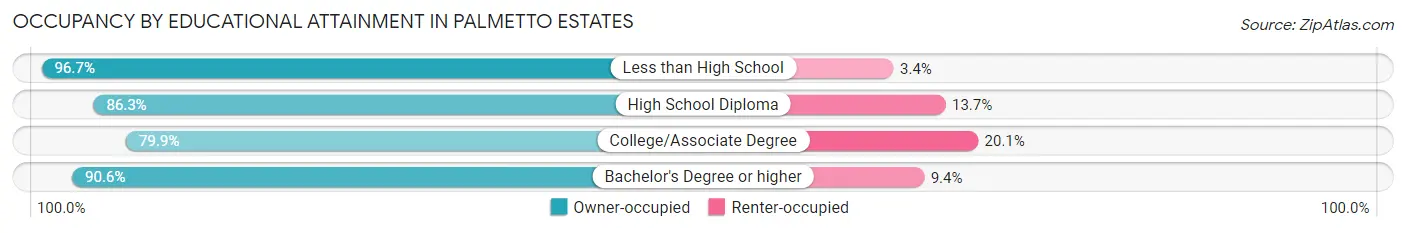
| Household Size | Owner-occupied | Renter-occupied |
| Less than High School | 346 (96.7%) | 12 (3.4%) |
| High School Diploma | 1,138 (86.3%) | 180 (13.7%) |
| College/Associate Degree | 1,005 (79.9%) | 253 (20.1%) |
| Bachelor's Degree or higher | 1,124 (90.6%) | 117 (9.4%) |
Occupancy by Age of Householder in Palmetto Estates
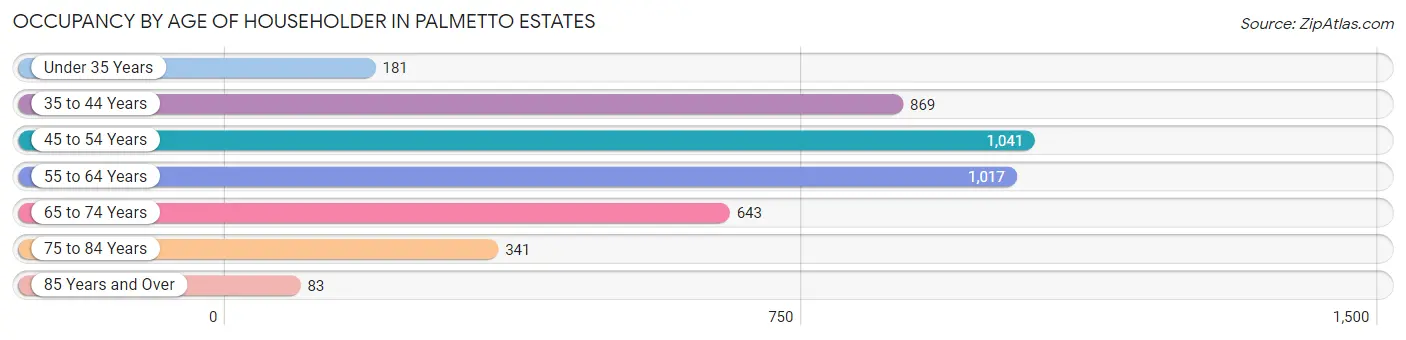
| Age Bracket | # Households | % Households |
| Under 35 Years | 181 | 4.3% |
| 35 to 44 Years | 869 | 20.8% |
| 45 to 54 Years | 1,041 | 24.9% |
| 55 to 64 Years | 1,017 | 24.4% |
| 65 to 74 Years | 643 | 15.4% |
| 75 to 84 Years | 341 | 8.2% |
| 85 Years and Over | 83 | 2.0% |
| Total | 4,175 | 100.0% |
Housing Finances in Palmetto Estates
Median Income by Occupancy in Palmetto Estates
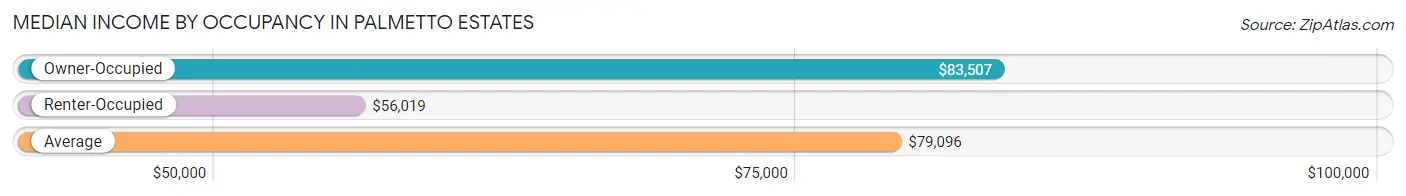
| Occupancy Type | # Households | Median Income |
| Owner-Occupied | 3,613 (86.5%) | $83,507 |
| Renter-Occupied | 562 (13.5%) | $56,019 |
| Average | 4,175 (100.0%) | $79,096 |
Occupancy by Householder Income Bracket in Palmetto Estates
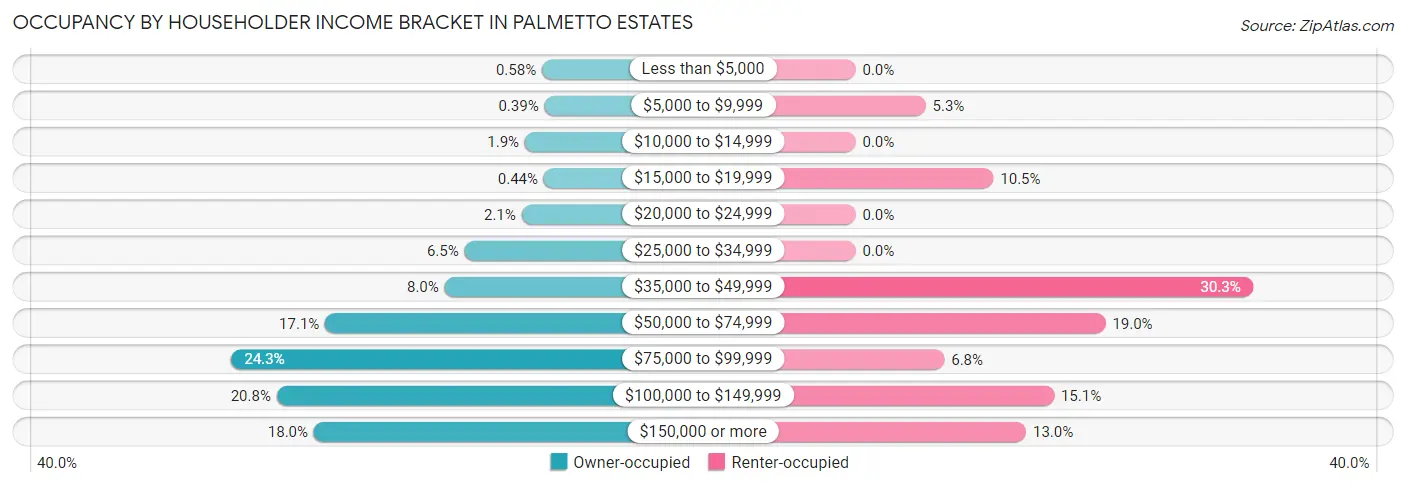
| Income Bracket | Owner-occupied | Renter-occupied |
| Less than $5,000 | 21 (0.6%) | 0 (0.0%) |
| $5,000 to $9,999 | 14 (0.4%) | 30 (5.3%) |
| $10,000 to $14,999 | 68 (1.9%) | 0 (0.0%) |
| $15,000 to $19,999 | 16 (0.4%) | 59 (10.5%) |
| $20,000 to $24,999 | 77 (2.1%) | 0 (0.0%) |
| $25,000 to $34,999 | 234 (6.5%) | 0 (0.0%) |
| $35,000 to $49,999 | 289 (8.0%) | 170 (30.2%) |
| $50,000 to $74,999 | 618 (17.1%) | 107 (19.0%) |
| $75,000 to $99,999 | 876 (24.2%) | 38 (6.8%) |
| $100,000 to $149,999 | 751 (20.8%) | 85 (15.1%) |
| $150,000 or more | 649 (18.0%) | 73 (13.0%) |
| Total | 3,613 (100.0%) | 562 (100.0%) |
Monthly Housing Cost Tiers in Palmetto Estates
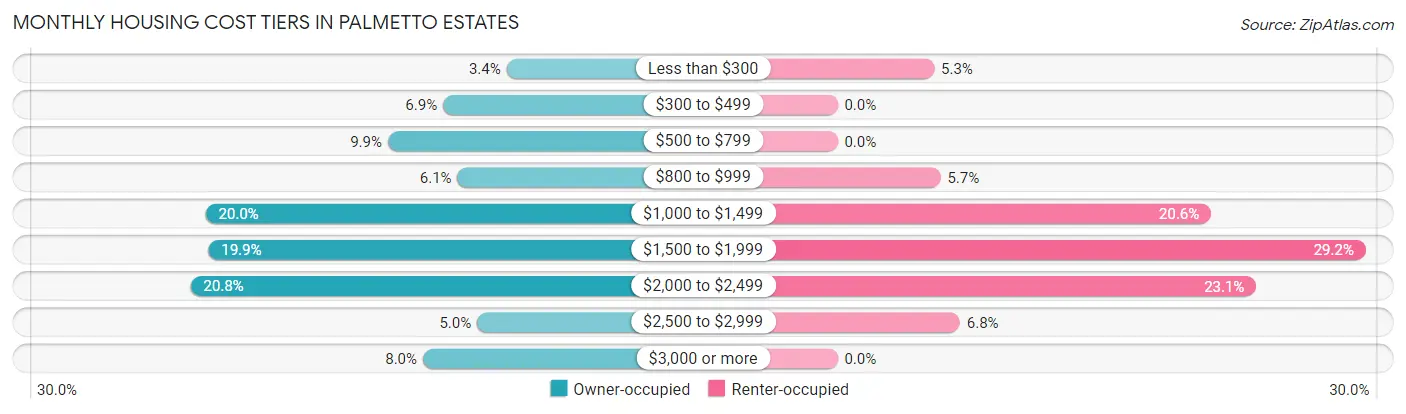
| Monthly Cost | Owner-occupied | Renter-occupied |
| Less than $300 | 122 (3.4%) | 30 (5.3%) |
| $300 to $499 | 249 (6.9%) | 0 (0.0%) |
| $500 to $799 | 359 (9.9%) | 0 (0.0%) |
| $800 to $999 | 220 (6.1%) | 32 (5.7%) |
| $1,000 to $1,499 | 723 (20.0%) | 116 (20.6%) |
| $1,500 to $1,999 | 717 (19.9%) | 164 (29.2%) |
| $2,000 to $2,499 | 753 (20.8%) | 130 (23.1%) |
| $2,500 to $2,999 | 181 (5.0%) | 38 (6.8%) |
| $3,000 or more | 289 (8.0%) | 0 (0.0%) |
| Total | 3,613 (100.0%) | 562 (100.0%) |
Physical Housing Characteristics in Palmetto Estates
Housing Structures in Palmetto Estates
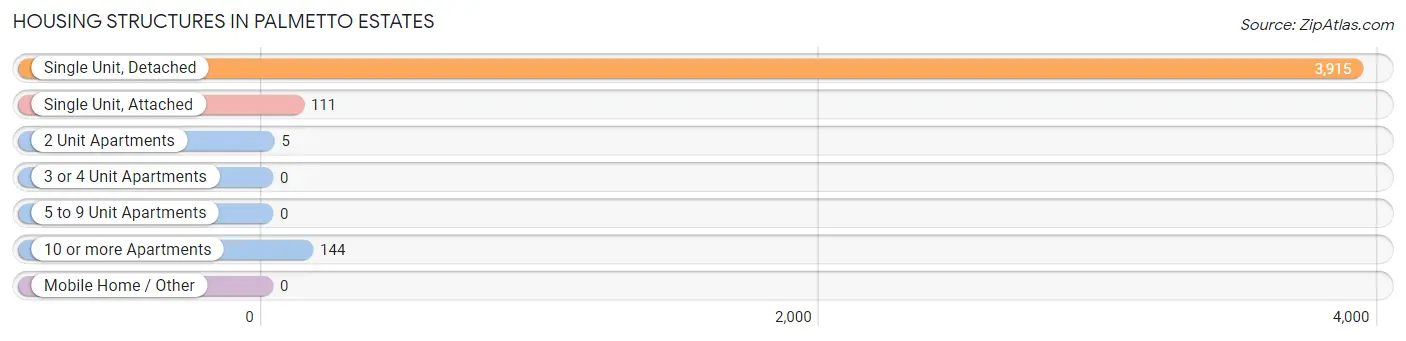
| Structure Type | # Housing Units | % Housing Units |
| Single Unit, Detached | 3,915 | 93.8% |
| Single Unit, Attached | 111 | 2.7% |
| 2 Unit Apartments | 5 | 0.1% |
| 3 or 4 Unit Apartments | 0 | 0.0% |
| 5 to 9 Unit Apartments | 0 | 0.0% |
| 10 or more Apartments | 144 | 3.5% |
| Mobile Home / Other | 0 | 0.0% |
| Total | 4,175 | 100.0% |
Housing Structures by Occupancy in Palmetto Estates
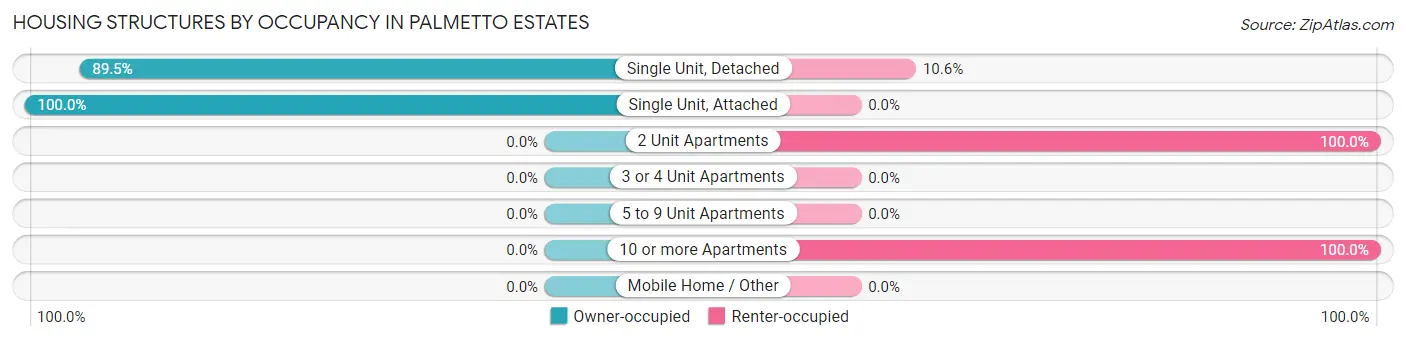
| Structure Type | Owner-occupied | Renter-occupied |
| Single Unit, Detached | 3,502 (89.4%) | 413 (10.5%) |
| Single Unit, Attached | 111 (100.0%) | 0 (0.0%) |
| 2 Unit Apartments | 0 (0.0%) | 5 (100.0%) |
| 3 or 4 Unit Apartments | 0 (0.0%) | 0 (0.0%) |
| 5 to 9 Unit Apartments | 0 (0.0%) | 0 (0.0%) |
| 10 or more Apartments | 0 (0.0%) | 144 (100.0%) |
| Mobile Home / Other | 0 (0.0%) | 0 (0.0%) |
| Total | 3,613 (86.5%) | 562 (13.5%) |
Housing Structures by Number of Rooms in Palmetto Estates
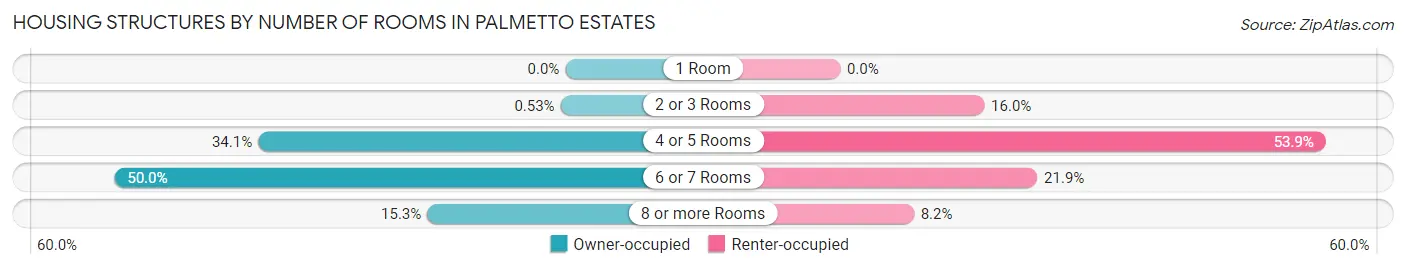
| Number of Rooms | Owner-occupied | Renter-occupied |
| 1 Room | 0 (0.0%) | 0 (0.0%) |
| 2 or 3 Rooms | 19 (0.5%) | 90 (16.0%) |
| 4 or 5 Rooms | 1,232 (34.1%) | 303 (53.9%) |
| 6 or 7 Rooms | 1,808 (50.0%) | 123 (21.9%) |
| 8 or more Rooms | 554 (15.3%) | 46 (8.2%) |
| Total | 3,613 (100.0%) | 562 (100.0%) |
Housing Structure by Heating Type in Palmetto Estates
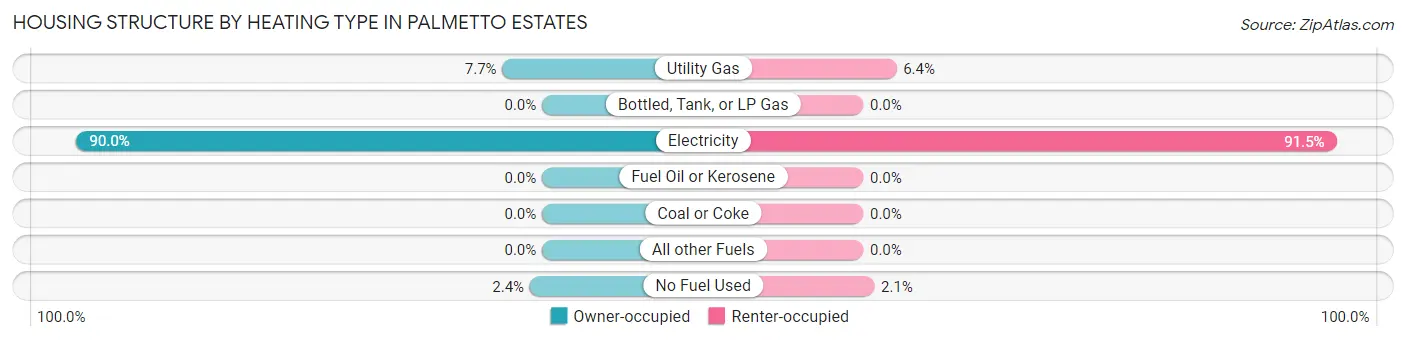
| Heating Type | Owner-occupied | Renter-occupied |
| Utility Gas | 277 (7.7%) | 36 (6.4%) |
| Bottled, Tank, or LP Gas | 0 (0.0%) | 0 (0.0%) |
| Electricity | 3,251 (90.0%) | 514 (91.5%) |
| Fuel Oil or Kerosene | 0 (0.0%) | 0 (0.0%) |
| Coal or Coke | 0 (0.0%) | 0 (0.0%) |
| All other Fuels | 0 (0.0%) | 0 (0.0%) |
| No Fuel Used | 85 (2.4%) | 12 (2.1%) |
| Total | 3,613 (100.0%) | 562 (100.0%) |
Household Vehicle Usage in Palmetto Estates
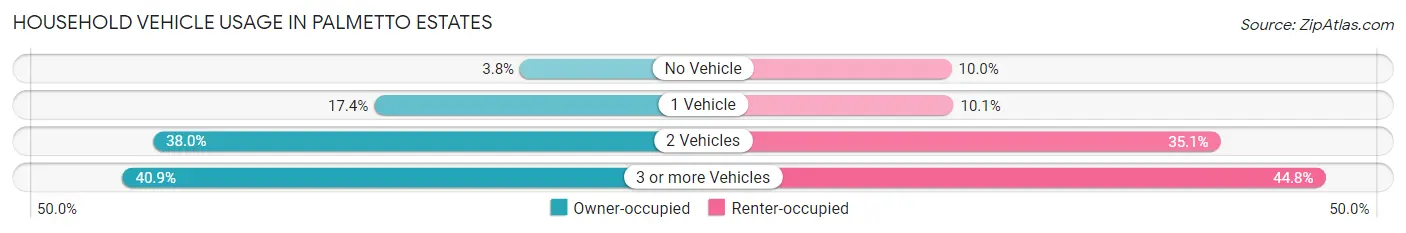
| Vehicles per Household | Owner-occupied | Renter-occupied |
| No Vehicle | 136 (3.8%) | 56 (10.0%) |
| 1 Vehicle | 628 (17.4%) | 57 (10.1%) |
| 2 Vehicles | 1,373 (38.0%) | 197 (35.0%) |
| 3 or more Vehicles | 1,476 (40.8%) | 252 (44.8%) |
| Total | 3,613 (100.0%) | 562 (100.0%) |
Real Estate & Mortgages in Palmetto Estates
Real Estate and Mortgage Overview in Palmetto Estates
| Characteristic | Without Mortgage | With Mortgage |
| Housing Units | 947 | 2,666 |
| Median Property Value | $368,100 | $349,200 |
| Median Household Income | $73,006 | $534 |
| Monthly Housing Costs | $614 | $289 |
| Real Estate Taxes | $2,344 | $123 |
Property Value by Mortgage Status in Palmetto Estates
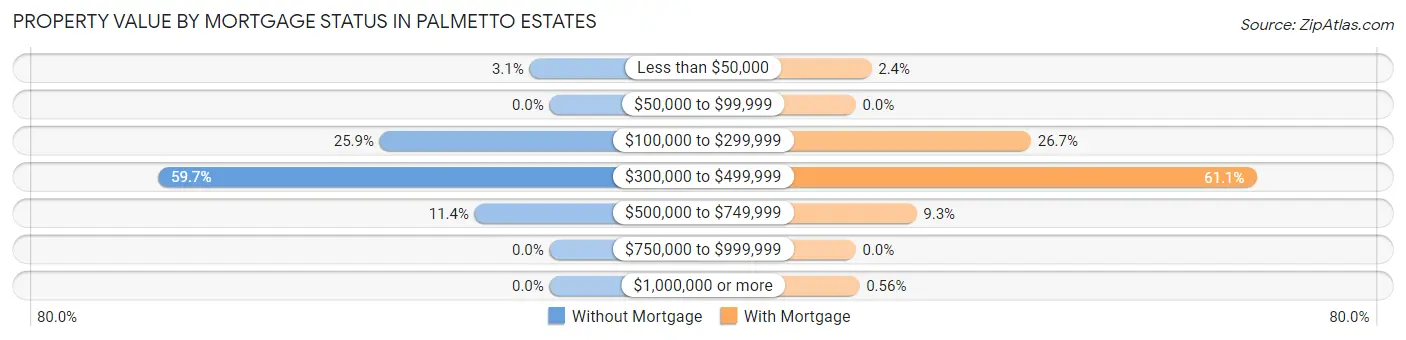
| Property Value | Without Mortgage | With Mortgage |
| Less than $50,000 | 29 (3.1%) | 64 (2.4%) |
| $50,000 to $99,999 | 0 (0.0%) | 0 (0.0%) |
| $100,000 to $299,999 | 245 (25.9%) | 712 (26.7%) |
| $300,000 to $499,999 | 565 (59.7%) | 1,628 (61.1%) |
| $500,000 to $749,999 | 108 (11.4%) | 247 (9.3%) |
| $750,000 to $999,999 | 0 (0.0%) | 0 (0.0%) |
| $1,000,000 or more | 0 (0.0%) | 15 (0.6%) |
| Total | 947 (100.0%) | 2,666 (100.0%) |
Household Income by Mortgage Status in Palmetto Estates
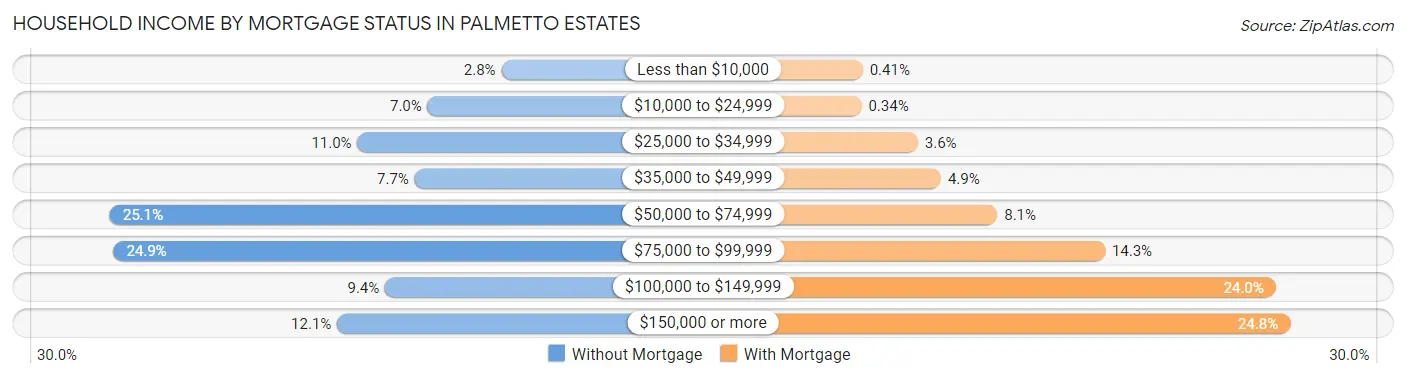
| Household Income | Without Mortgage | With Mortgage |
| Less than $10,000 | 26 (2.8%) | 11 (0.4%) |
| $10,000 to $24,999 | 66 (7.0%) | 9 (0.3%) |
| $25,000 to $34,999 | 104 (11.0%) | 95 (3.6%) |
| $35,000 to $49,999 | 73 (7.7%) | 130 (4.9%) |
| $50,000 to $74,999 | 238 (25.1%) | 216 (8.1%) |
| $75,000 to $99,999 | 236 (24.9%) | 380 (14.2%) |
| $100,000 to $149,999 | 89 (9.4%) | 640 (24.0%) |
| $150,000 or more | 115 (12.1%) | 662 (24.8%) |
| Total | 947 (100.0%) | 2,666 (100.0%) |
Property Value to Household Income Ratio in Palmetto Estates
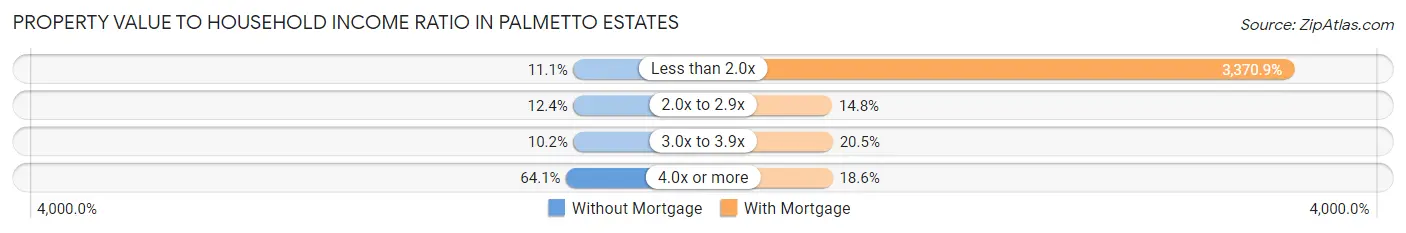
| Value-to-Income Ratio | Without Mortgage | With Mortgage |
| Less than 2.0x | 105 (11.1%) | 89,867 (3,370.9%) |
| 2.0x to 2.9x | 117 (12.3%) | 395 (14.8%) |
| 3.0x to 3.9x | 97 (10.2%) | 547 (20.5%) |
| 4.0x or more | 607 (64.1%) | 495 (18.6%) |
| Total | 947 (100.0%) | 2,666 (100.0%) |
Real Estate Taxes by Mortgage Status in Palmetto Estates
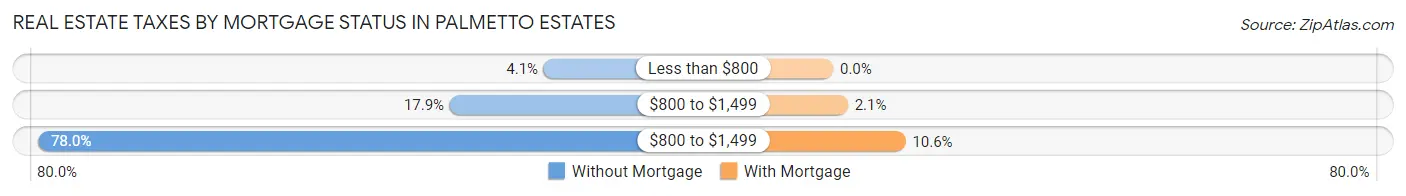
| Property Taxes | Without Mortgage | With Mortgage |
| Less than $800 | 39 (4.1%) | 0 (0.0%) |
| $800 to $1,499 | 169 (17.8%) | 57 (2.1%) |
| $800 to $1,499 | 739 (78.0%) | 282 (10.6%) |
| Total | 947 (100.0%) | 2,666 (100.0%) |
Health & Disability in Palmetto Estates
Health Insurance Coverage by Age in Palmetto Estates
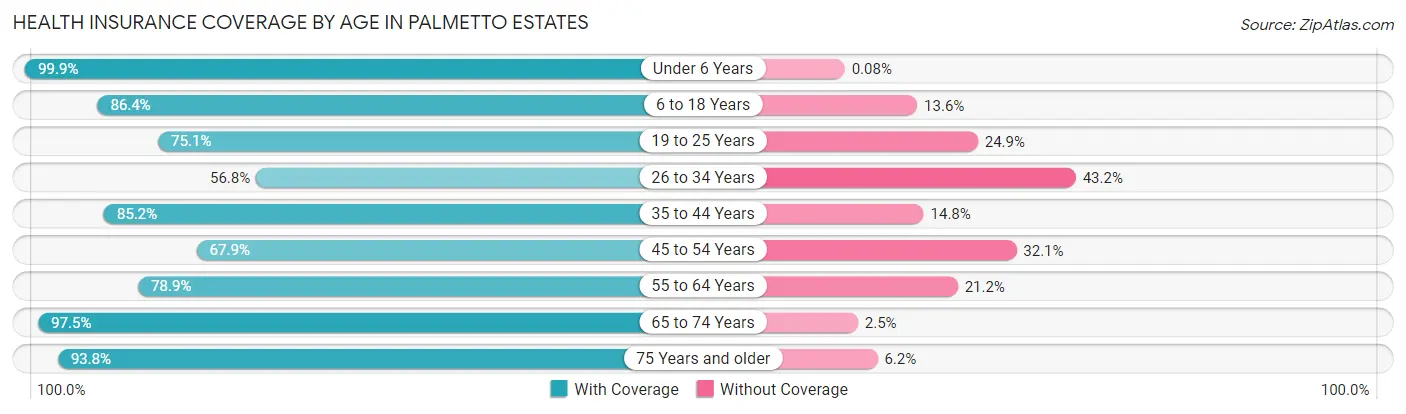
| Age Bracket | With Coverage | Without Coverage |
| Under 6 Years | 1,186 (99.9%) | 1 (0.1%) |
| 6 to 18 Years | 2,086 (86.4%) | 328 (13.6%) |
| 19 to 25 Years | 1,512 (75.1%) | 501 (24.9%) |
| 26 to 34 Years | 956 (56.8%) | 726 (43.2%) |
| 35 to 44 Years | 1,924 (85.2%) | 334 (14.8%) |
| 45 to 54 Years | 1,816 (67.9%) | 858 (32.1%) |
| 55 to 64 Years | 1,547 (78.8%) | 415 (21.1%) |
| 65 to 74 Years | 1,505 (97.5%) | 39 (2.5%) |
| 75 Years and older | 957 (93.8%) | 63 (6.2%) |
| Total | 13,489 (80.5%) | 3,265 (19.5%) |
Health Insurance Coverage by Citizenship Status in Palmetto Estates
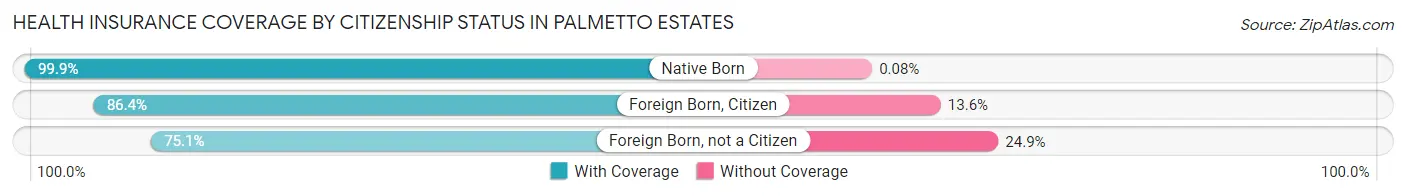
| Citizenship Status | With Coverage | Without Coverage |
| Native Born | 1,186 (99.9%) | 1 (0.1%) |
| Foreign Born, Citizen | 2,086 (86.4%) | 328 (13.6%) |
| Foreign Born, not a Citizen | 1,512 (75.1%) | 501 (24.9%) |
Health Insurance Coverage by Household Income in Palmetto Estates
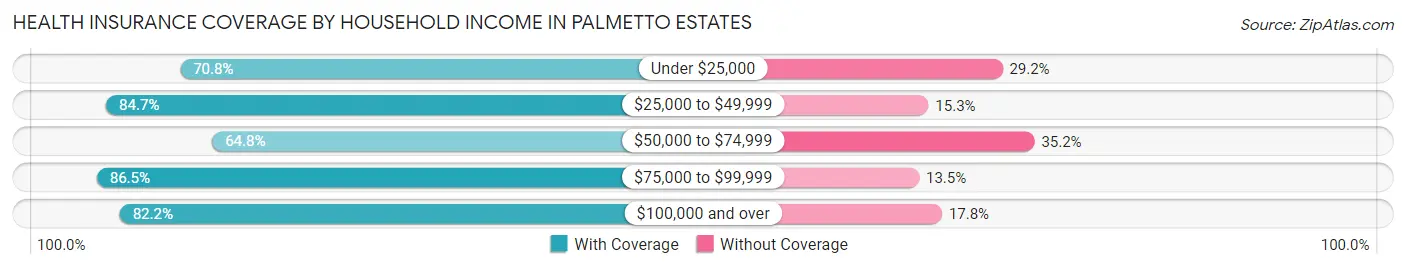
| Household Income | With Coverage | Without Coverage |
| Under $25,000 | 294 (70.8%) | 121 (29.2%) |
| $25,000 to $49,999 | 1,934 (84.7%) | 349 (15.3%) |
| $50,000 to $74,999 | 1,695 (64.8%) | 919 (35.2%) |
| $75,000 to $99,999 | 3,022 (86.5%) | 473 (13.5%) |
| $100,000 and over | 6,457 (82.2%) | 1,401 (17.8%) |
Public vs Private Health Insurance Coverage by Age in Palmetto Estates
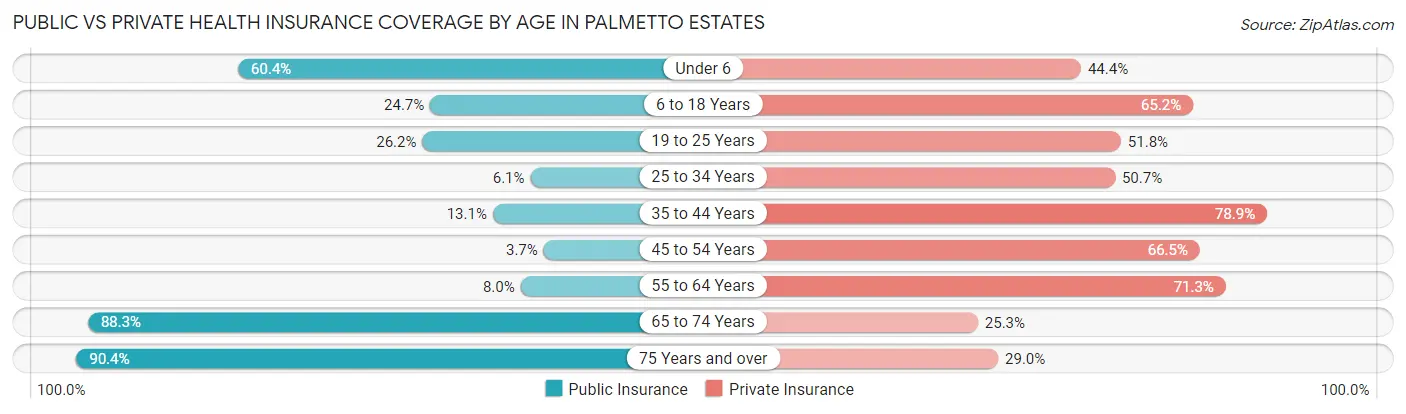
| Age Bracket | Public Insurance | Private Insurance |
| Under 6 | 717 (60.4%) | 527 (44.4%) |
| 6 to 18 Years | 597 (24.7%) | 1,574 (65.2%) |
| 19 to 25 Years | 527 (26.2%) | 1,043 (51.8%) |
| 25 to 34 Years | 103 (6.1%) | 853 (50.7%) |
| 35 to 44 Years | 296 (13.1%) | 1,782 (78.9%) |
| 45 to 54 Years | 98 (3.7%) | 1,777 (66.4%) |
| 55 to 64 Years | 156 (8.0%) | 1,398 (71.3%) |
| 65 to 74 Years | 1,363 (88.3%) | 390 (25.3%) |
| 75 Years and over | 922 (90.4%) | 296 (29.0%) |
| Total | 4,779 (28.5%) | 9,640 (57.5%) |
Disability Status by Sex by Age in Palmetto Estates
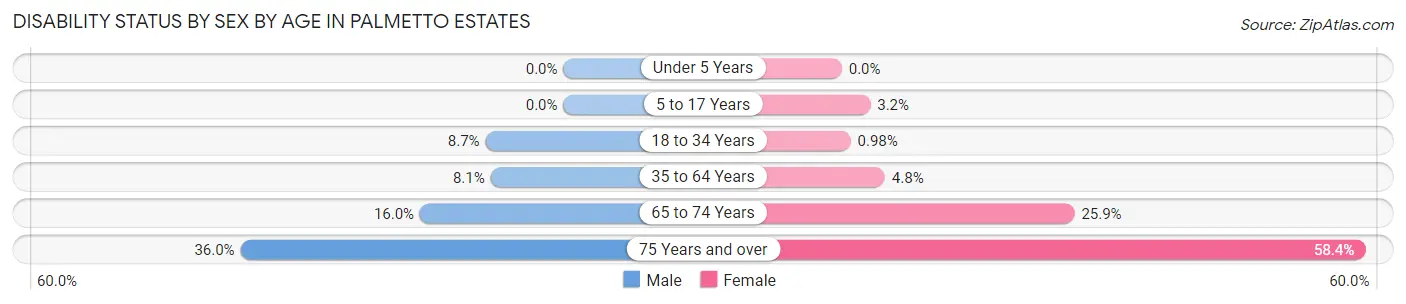
| Age Bracket | Male | Female |
| Under 5 Years | 0 (0.0%) | 0 (0.0%) |
| 5 to 17 Years | 0 (0.0%) | 51 (3.2%) |
| 18 to 34 Years | 196 (8.7%) | 15 (1.0%) |
| 35 to 64 Years | 292 (8.1%) | 158 (4.8%) |
| 65 to 74 Years | 119 (16.0%) | 207 (25.9%) |
| 75 Years and over | 105 (36.0%) | 425 (58.4%) |
Disability Class by Sex by Age in Palmetto Estates
Disability Class: Hearing Difficulty
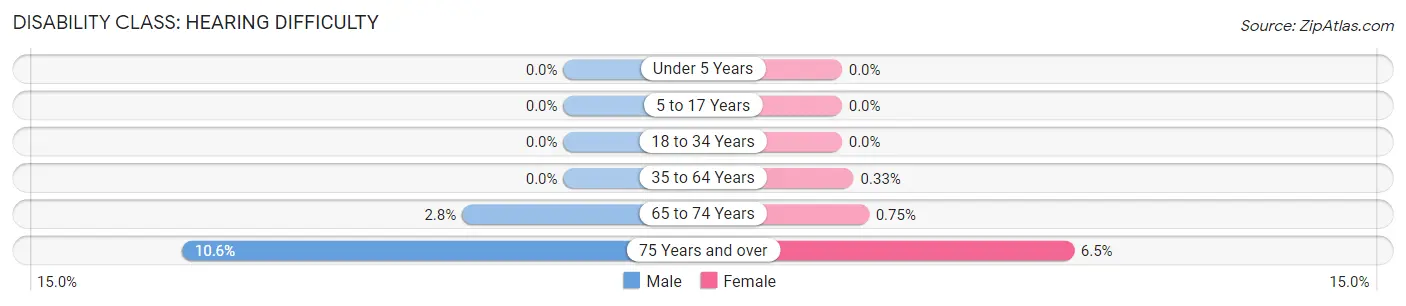
| Age Bracket | Male | Female |
| Under 5 Years | 0 (0.0%) | 0 (0.0%) |
| 5 to 17 Years | 0 (0.0%) | 0 (0.0%) |
| 18 to 34 Years | 0 (0.0%) | 0 (0.0%) |
| 35 to 64 Years | 0 (0.0%) | 11 (0.3%) |
| 65 to 74 Years | 21 (2.8%) | 6 (0.7%) |
| 75 Years and over | 31 (10.6%) | 47 (6.5%) |
Disability Class: Vision Difficulty
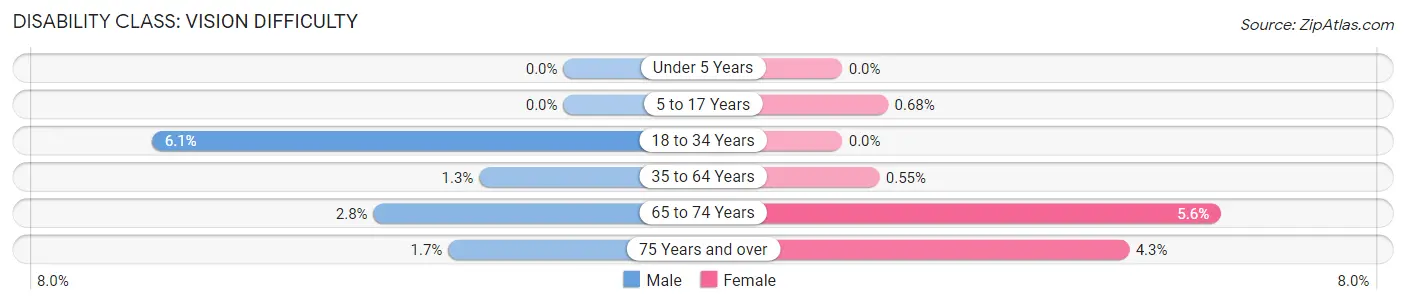
| Age Bracket | Male | Female |
| Under 5 Years | 0 (0.0%) | 0 (0.0%) |
| 5 to 17 Years | 0 (0.0%) | 11 (0.7%) |
| 18 to 34 Years | 138 (6.1%) | 0 (0.0%) |
| 35 to 64 Years | 45 (1.3%) | 18 (0.5%) |
| 65 to 74 Years | 21 (2.8%) | 45 (5.6%) |
| 75 Years and over | 5 (1.7%) | 31 (4.3%) |
Disability Class: Cognitive Difficulty
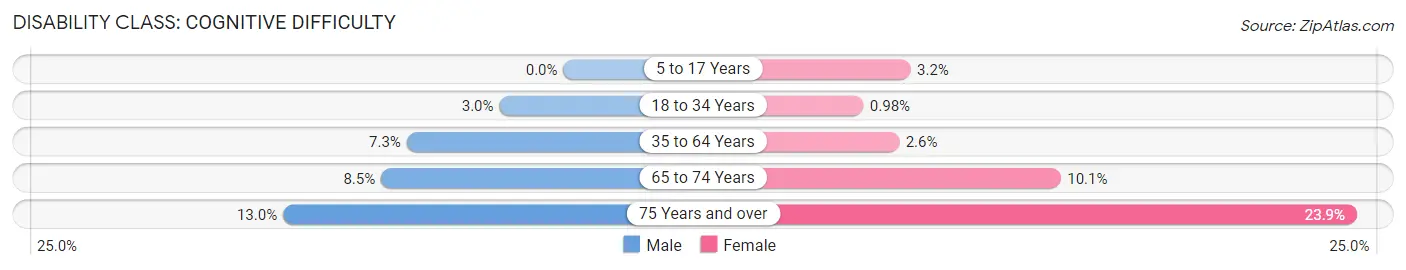
| Age Bracket | Male | Female |
| 5 to 17 Years | 0 (0.0%) | 51 (3.2%) |
| 18 to 34 Years | 67 (3.0%) | 15 (1.0%) |
| 35 to 64 Years | 262 (7.3%) | 87 (2.6%) |
| 65 to 74 Years | 63 (8.5%) | 81 (10.1%) |
| 75 Years and over | 38 (13.0%) | 174 (23.9%) |
Disability Class: Ambulatory Difficulty
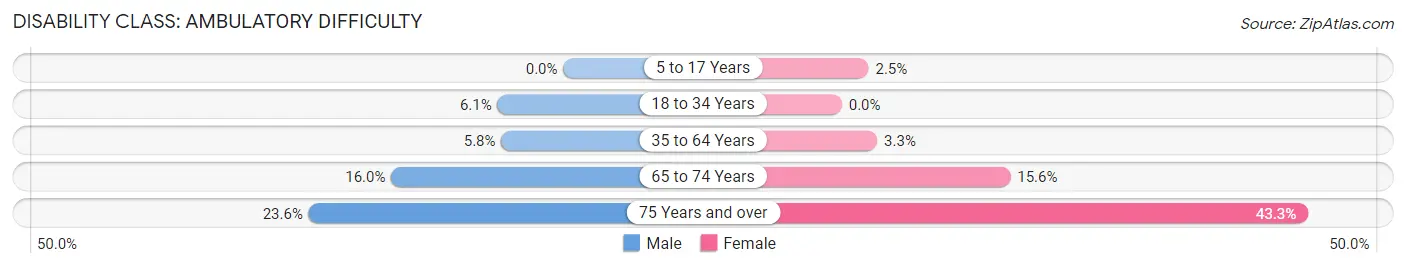
| Age Bracket | Male | Female |
| 5 to 17 Years | 0 (0.0%) | 40 (2.5%) |
| 18 to 34 Years | 138 (6.1%) | 0 (0.0%) |
| 35 to 64 Years | 207 (5.8%) | 108 (3.3%) |
| 65 to 74 Years | 119 (16.0%) | 125 (15.6%) |
| 75 Years and over | 69 (23.6%) | 315 (43.3%) |
Disability Class: Self-Care Difficulty
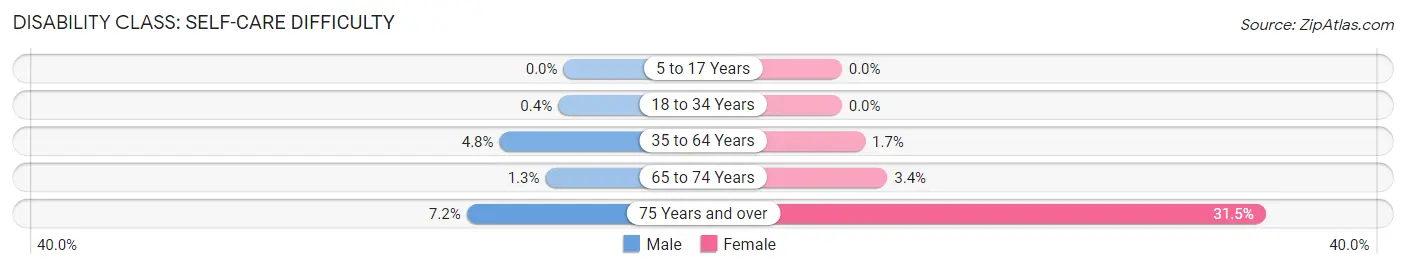
| Age Bracket | Male | Female |
| 5 to 17 Years | 0 (0.0%) | 0 (0.0%) |
| 18 to 34 Years | 9 (0.4%) | 0 (0.0%) |
| 35 to 64 Years | 171 (4.8%) | 57 (1.7%) |
| 65 to 74 Years | 10 (1.3%) | 27 (3.4%) |
| 75 Years and over | 21 (7.2%) | 229 (31.5%) |
Technology Access in Palmetto Estates
Computing Device Access in Palmetto Estates
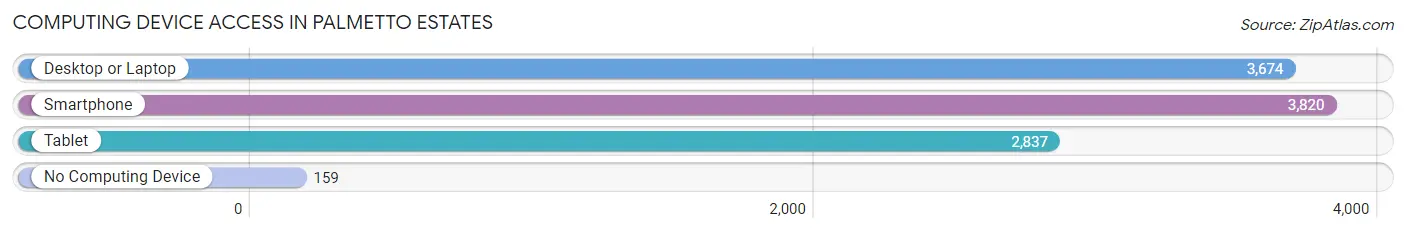
| Device Type | # Households | % Households |
| Desktop or Laptop | 3,674 | 88.0% |
| Smartphone | 3,820 | 91.5% |
| Tablet | 2,837 | 67.9% |
| No Computing Device | 159 | 3.8% |
| Total | 4,175 | 100.0% |
Internet Access in Palmetto Estates
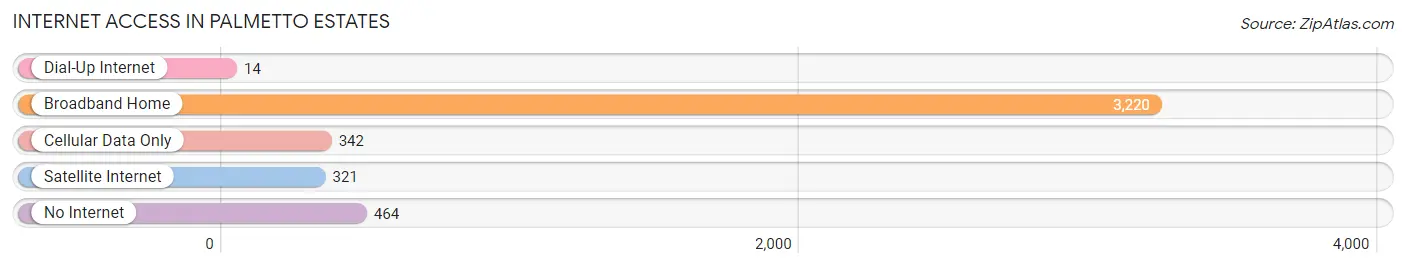
| Internet Type | # Households | % Households |
| Dial-Up Internet | 14 | 0.3% |
| Broadband Home | 3,220 | 77.1% |
| Cellular Data Only | 342 | 8.2% |
| Satellite Internet | 321 | 7.7% |
| No Internet | 464 | 11.1% |
| Total | 4,175 | 100.0% |
Palmetto Estates Summary
Palmetto Estates is a census-designated place (CDP) located in Miami-Dade County, Florida, United States. The population was 8,945 at the 2010 census. It is located in the southern part of the county, near the city of Miami.
History
Palmetto Estates was originally part of the Everglades, and was settled by Native Americans. The area was first settled by Europeans in the late 19th century, when it was used for farming and ranching. In the early 20th century, the area was developed as a residential community. The area was incorporated as a village in 1925, and was later annexed by the City of Miami in 1954.
Geography
Palmetto Estates is located at 25°41'25" North, 80°20'45" West (25.690278, -80.345833). It is bordered by the cities of Miami and Miami Gardens to the north, and by the unincorporated communities of West Perrine and Naranja to the south.
The CDP has a total area of 1 3 square miles 3 4 km2 all of it land
Economy
The economy of Palmetto Estates is largely based on services and retail. The area is home to a variety of businesses, including restaurants, grocery stores, and other retail establishments. The area is also home to a number of industrial and manufacturing businesses.
Demographics
As of the 2010 census, there were 8,945 people, 2,945 households, and 2,072 families residing in the CDP. The population density was 6,845.3 people per square mile (2,637.2/km2). There were 3,095 housing units at an average density of 2,364.2 per square mile (912.2/km2). The racial makeup of the CDP was 57.2% White (non-Hispanic), 28.2% African American, 0.3% Native American, 1.2% Asian, 0.1% Pacific Islander, 10.2% from other races, and 2.9% from two or more races. Hispanic or Latino of any race were 57.2% of the population.
There were 2,945 households, out of which 37.2% had children under the age of 18 living with them, 41.2% were married couples living together, 20.2% had a female householder with no husband present, and 30.7% were non-families. 24.2% of all households were made up of individuals, and 8.2% had someone living alone who was 65 years of age or older. The average household size was 3.02 and the average family size was 3.54.
In the CDP, the population was spread out, with 28.2% under the age of 18, 10.2% from 18 to 24, 30.2% from 25 to 44, 20.2% from 45 to 64, and 11.2% who were 65 years of age or older. The median age was 33 years. For every 100 females, there were 95.2 males. For every 100 females age 18 and over, there were 91.2 males.
The median income for a household in the CDP was $30,938, and the median income for a family was $33,906. Males had a median income of $25,938 versus $20,938 for females. The per capita income for the CDP was $12,938. About 17.2% of families and 19.2% of the population were below the poverty line, including 25.2% of those under age 18 and 15.2% of those age 65 or over.
Common Questions
What is Per Capita Income in Palmetto Estates?
Per Capita income in Palmetto Estates is $27,197.
What is the Median Family Income in Palmetto Estates?
Median Family Income in Palmetto Estates is $80,069.
What is the Median Household income in Palmetto Estates?
Median Household Income in Palmetto Estates is $79,096.
What is Income or Wage Gap in Palmetto Estates?
Income or Wage Gap in Palmetto Estates is 8.0%.
Women in Palmetto Estates earn 92.0 cents for every dollar earned by a man.
What is Inequality or Gini Index in Palmetto Estates?
Inequality or Gini Index in Palmetto Estates is 0.36.
What is the Total Population of Palmetto Estates?
Total Population of Palmetto Estates is 16,776.
What is the Total Male Population of Palmetto Estates?
Total Male Population of Palmetto Estates is 8,253.
What is the Total Female Population of Palmetto Estates?
Total Female Population of Palmetto Estates is 8,523.
What is the Ratio of Males per 100 Females in Palmetto Estates?
There are 96.83 Males per 100 Females in Palmetto Estates.
What is the Ratio of Females per 100 Males in Palmetto Estates?
There are 103.27 Females per 100 Males in Palmetto Estates.
What is the Median Population Age in Palmetto Estates?
Median Population Age in Palmetto Estates is 40.4 Years.
What is the Average Family Size in Palmetto Estates
Average Family Size in Palmetto Estates is 4.2 People.
What is the Average Household Size in Palmetto Estates
Average Household Size in Palmetto Estates is 4.0 People.
How Large is the Labor Force in Palmetto Estates?
There are 8,616 People in the Labor Forcein in Palmetto Estates.
What is the Percentage of People in the Labor Force in Palmetto Estates?
62.7% of People are in the Labor Force in Palmetto Estates.
What is the Unemployment Rate in Palmetto Estates?
Unemployment Rate in Palmetto Estates is 3.8%.