Lake Belvedere Estates, FL Map & Demographics
Lake Belvedere Estates Map
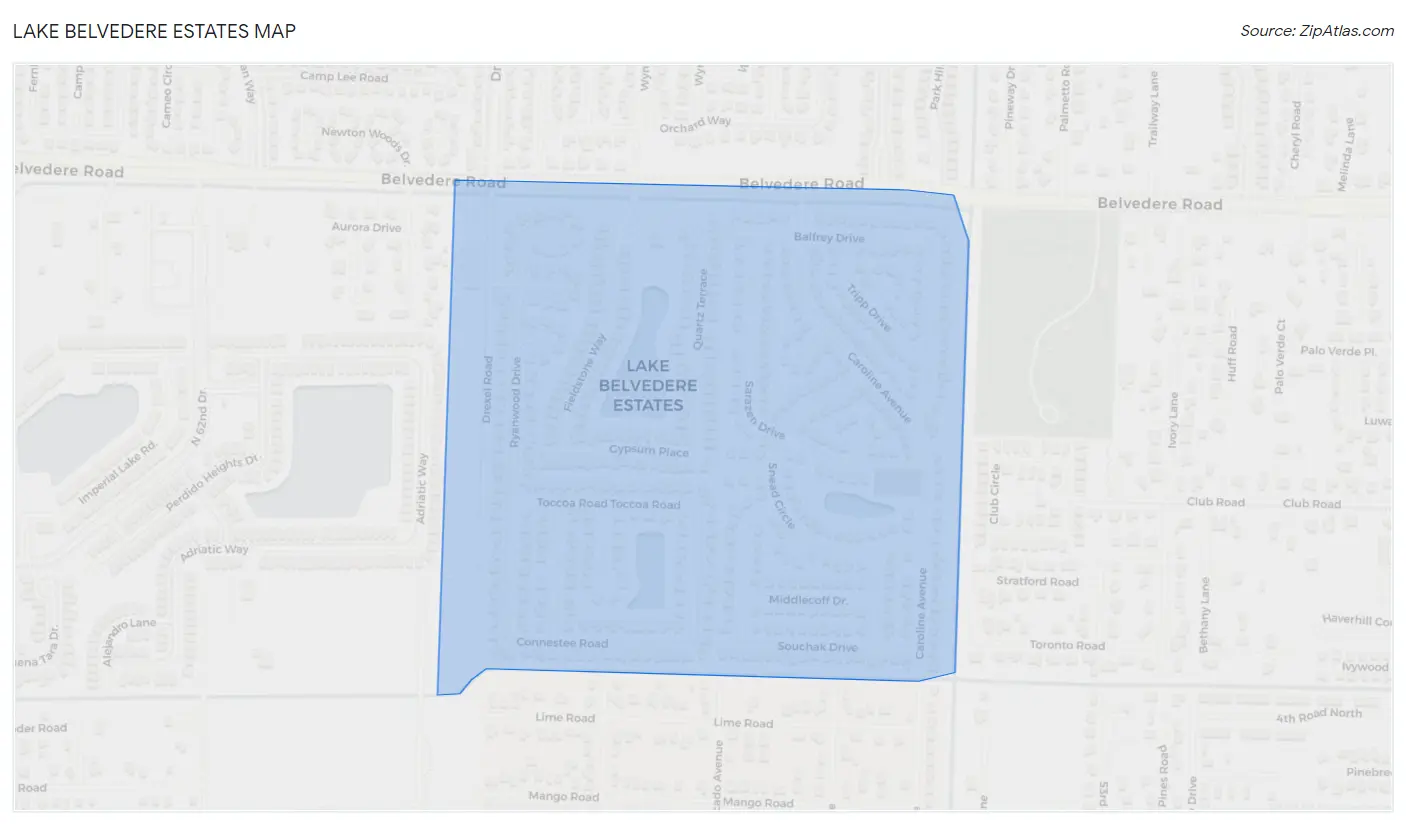
Lake Belvedere Estates Overview
$20,011
PER CAPITA INCOME
$80,952
AVG FAMILY INCOME
$70,250
AVG HOUSEHOLD INCOME
43.2%
WAGE / INCOME GAP [ % ]
56.8¢/ $1
WAGE / INCOME GAP [ $ ]
$11,686
FAMILY INCOME DEFICIT
0.36
INEQUALITY / GINI INDEX
2,867
TOTAL POPULATION
1,325
MALE POPULATION
1,542
FEMALE POPULATION
85.93
MALES / 100 FEMALES
116.38
FEMALES / 100 MALES
27.0
MEDIAN AGE
4.9
AVG FAMILY SIZE
4.3
AVG HOUSEHOLD SIZE
1,375
LABOR FORCE [ PEOPLE ]
69.4%
PERCENT IN LABOR FORCE
4.9%
UNEMPLOYMENT RATE
Income in Lake Belvedere Estates
Income Overview in Lake Belvedere Estates
Per Capita Income in Lake Belvedere Estates is $20,011, while median incomes of families and households are $80,952 and $70,250 respectively.
| Characteristic | Number | Measure |
| Per Capita Income | 2,867 | $20,011 |
| Median Family Income | 560 | $80,952 |
| Mean Family Income | 560 | $88,574 |
| Median Household Income | 662 | $70,250 |
| Mean Household Income | 662 | $81,676 |
| Income Deficit | 560 | $11,686 |
| Wage / Income Gap (%) | 2,867 | 43.16% |
| Wage / Income Gap ($) | 2,867 | 56.84¢ per $1 |
| Gini / Inequality Index | 2,867 | 0.36 |
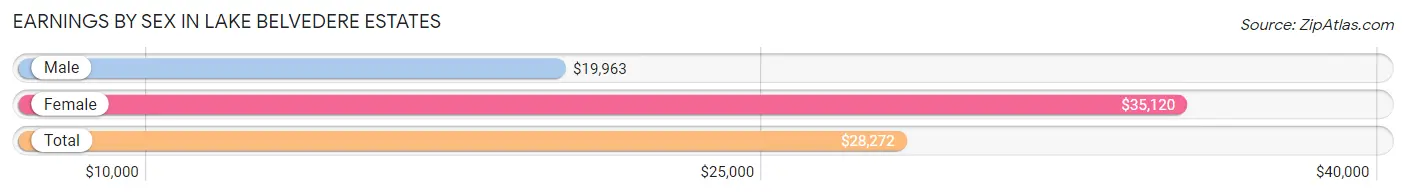
Earnings by Sex in Lake Belvedere Estates
Average Earnings in Lake Belvedere Estates are $28,272, $19,963 for men and $35,120 for women, a difference of 43.2%.
| Sex | Number | Average Earnings |
| Male | 747 (51.3%) | $19,963 |
| Female | 709 (48.7%) | $35,120 |
| Total | 1,456 (100.0%) | $28,272 |
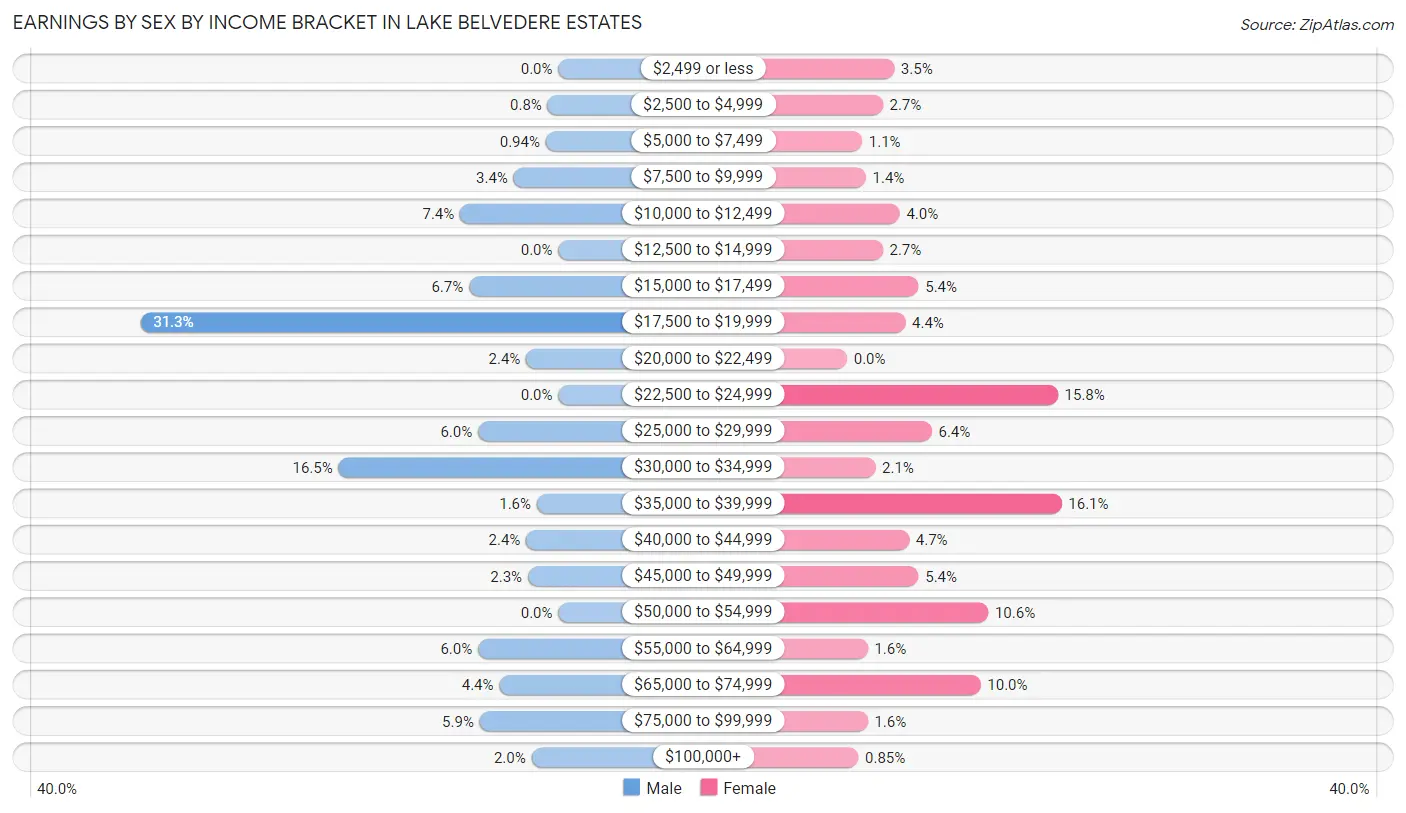
Earnings by Sex by Income Bracket in Lake Belvedere Estates
The most common earnings brackets in Lake Belvedere Estates are $17,500 to $19,999 for men (234 | 31.3%) and $35,000 to $39,999 for women (114 | 16.1%).
| Income | Male | Female |
| $2,499 or less | 0 (0.0%) | 25 (3.5%) |
| $2,500 to $4,999 | 6 (0.8%) | 19 (2.7%) |
| $5,000 to $7,499 | 7 (0.9%) | 8 (1.1%) |
| $7,500 to $9,999 | 25 (3.4%) | 10 (1.4%) |
| $10,000 to $12,499 | 55 (7.4%) | 28 (4.0%) |
| $12,500 to $14,999 | 0 (0.0%) | 19 (2.7%) |
| $15,000 to $17,499 | 50 (6.7%) | 38 (5.4%) |
| $17,500 to $19,999 | 234 (31.3%) | 31 (4.4%) |
| $20,000 to $22,499 | 18 (2.4%) | 0 (0.0%) |
| $22,500 to $24,999 | 0 (0.0%) | 112 (15.8%) |
| $25,000 to $29,999 | 45 (6.0%) | 45 (6.4%) |
| $30,000 to $34,999 | 123 (16.5%) | 15 (2.1%) |
| $35,000 to $39,999 | 12 (1.6%) | 114 (16.1%) |
| $40,000 to $44,999 | 18 (2.4%) | 33 (4.6%) |
| $45,000 to $49,999 | 17 (2.3%) | 38 (5.4%) |
| $50,000 to $54,999 | 0 (0.0%) | 75 (10.6%) |
| $55,000 to $64,999 | 45 (6.0%) | 11 (1.5%) |
| $65,000 to $74,999 | 33 (4.4%) | 71 (10.0%) |
| $75,000 to $99,999 | 44 (5.9%) | 11 (1.5%) |
| $100,000+ | 15 (2.0%) | 6 (0.9%) |
| Total | 747 (100.0%) | 709 (100.0%) |
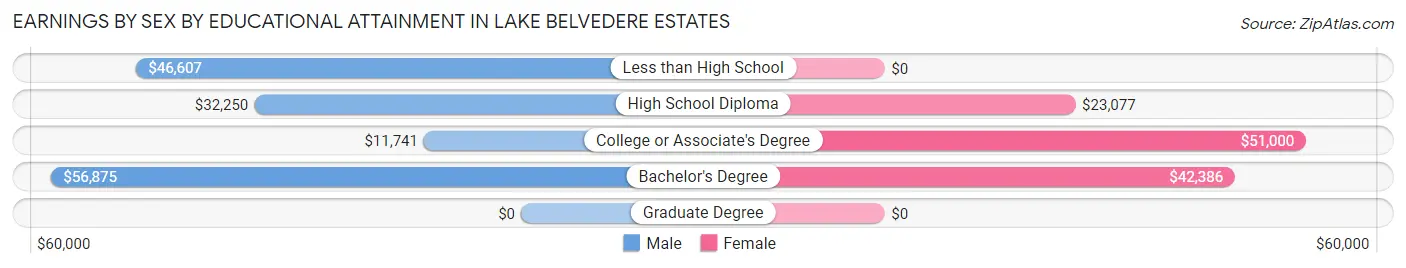
Earnings by Sex by Educational Attainment in Lake Belvedere Estates
Average earnings in Lake Belvedere Estates are $32,188 for men and $36,689 for women, a difference of 12.3%. Men with an educational attainment of bachelor's degree enjoy the highest average annual earnings of $56,875, while those with college or associate's degree education earn the least with $11,741. Women with an educational attainment of college or associate's degree earn the most with the average annual earnings of $51,000, while those with high school diploma education have the smallest earnings of $23,077.
| Educational Attainment | Male Income | Female Income |
| Less than High School | $46,607 | $0 |
| High School Diploma | $32,250 | $23,077 |
| College or Associate's Degree | $11,741 | $51,000 |
| Bachelor's Degree | $56,875 | $42,386 |
| Graduate Degree | - | - |
| Total | $32,188 | $36,689 |
Family Income in Lake Belvedere Estates
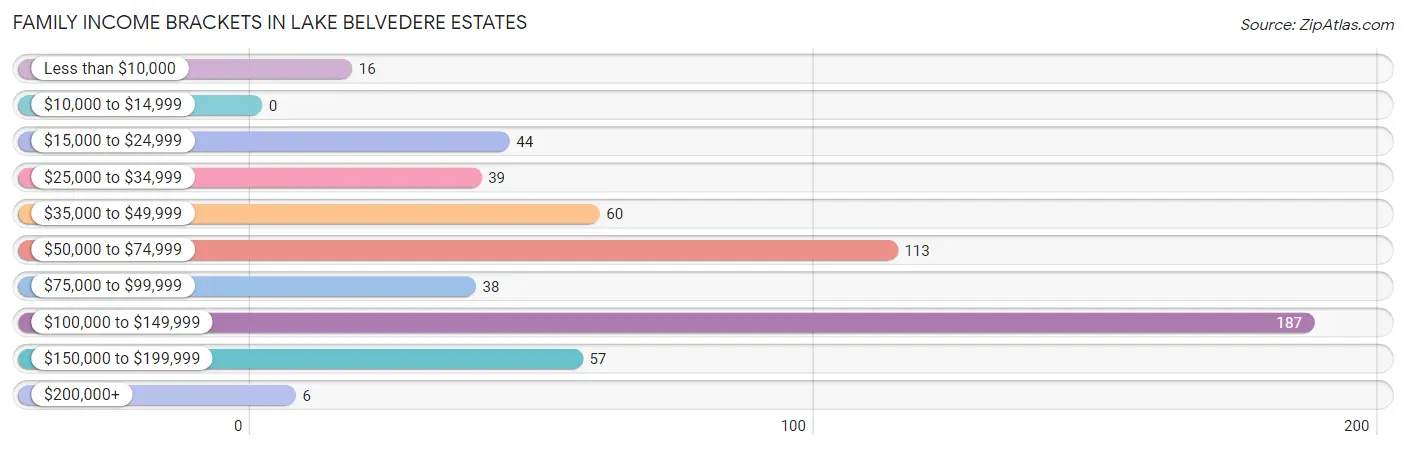
Family Income Brackets in Lake Belvedere Estates
According to the Lake Belvedere Estates family income data, there are 187 families falling into the $100,000 to $149,999 income range, which is the most common income bracket and makes up 33.4% of all families.
| Income Bracket | # Families | % Families |
| Less than $10,000 | 16 | 2.9% |
| $10,000 to $14,999 | 0 | 0.0% |
| $15,000 to $24,999 | 44 | 7.9% |
| $25,000 to $34,999 | 39 | 7.0% |
| $35,000 to $49,999 | 60 | 10.7% |
| $50,000 to $74,999 | 113 | 20.2% |
| $75,000 to $99,999 | 38 | 6.8% |
| $100,000 to $149,999 | 187 | 33.4% |
| $150,000 to $199,999 | 57 | 10.2% |
| $200,000+ | 6 | 1.1% |
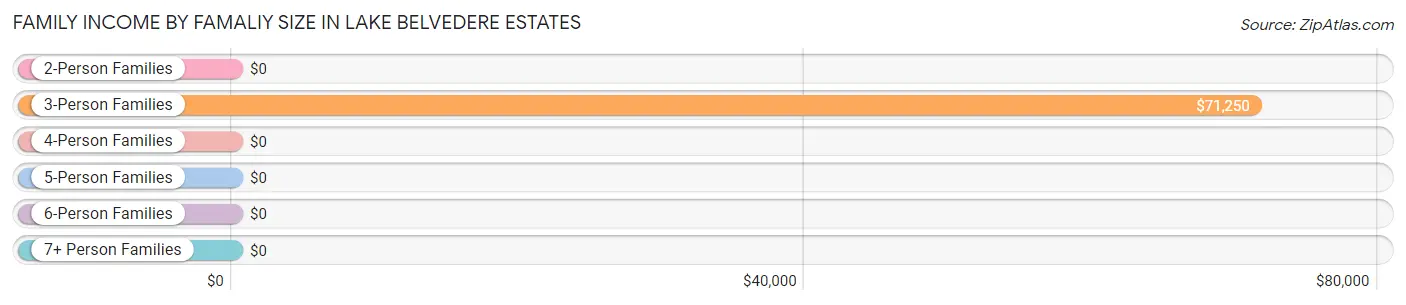
Family Income by Famaliy Size in Lake Belvedere Estates
3-person families (120 | 21.4%) account for the highest median family income in Lake Belvedere Estates with $71,250 per family, while 3-person families (120 | 21.4%) have the highest median income of $23,750 per family member.
| Income Bracket | # Families | Median Income |
| 2-Person Families | 136 (24.3%) | $0 |
| 3-Person Families | 120 (21.4%) | $71,250 |
| 4-Person Families | 99 (17.7%) | $0 |
| 5-Person Families | 81 (14.5%) | $0 |
| 6-Person Families | 29 (5.2%) | $0 |
| 7+ Person Families | 95 (17.0%) | $0 |
| Total | 560 (100.0%) | $80,952 |
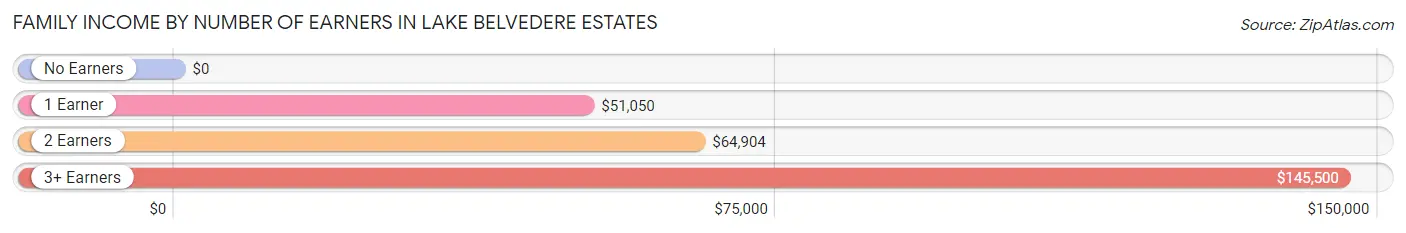
Family Income by Number of Earners in Lake Belvedere Estates
| Number of Earners | # Families | Median Income |
| No Earners | 9 (1.6%) | $0 |
| 1 Earner | 218 (38.9%) | $51,050 |
| 2 Earners | 129 (23.0%) | $64,904 |
| 3+ Earners | 204 (36.4%) | $145,500 |
| Total | 560 (100.0%) | $80,952 |
Household Income in Lake Belvedere Estates
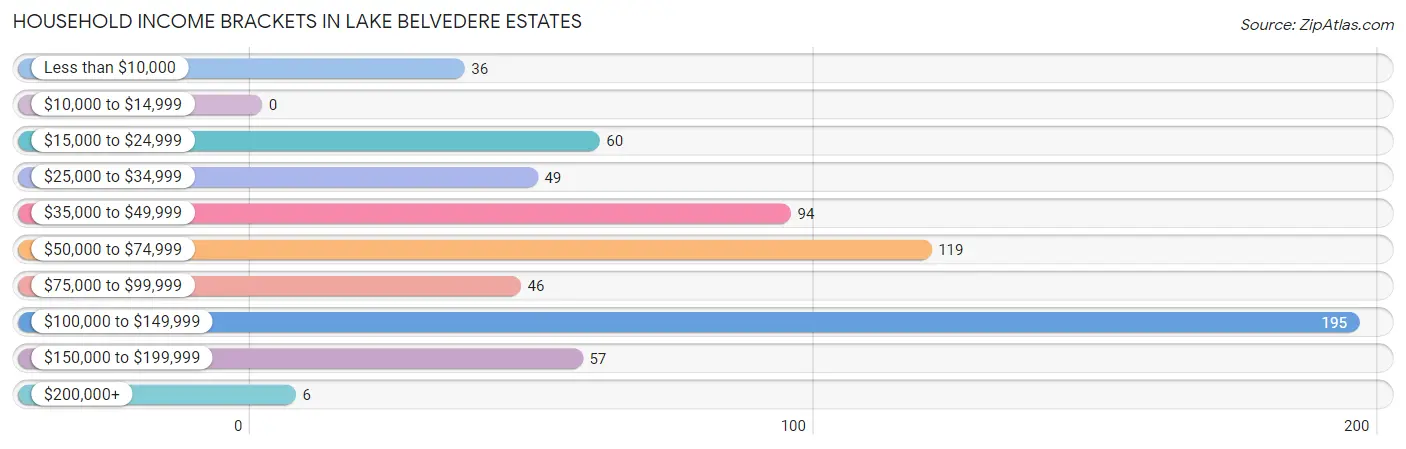
Household Income Brackets in Lake Belvedere Estates
With 195 households falling in the category, the $100,000 to $149,999 income range is the most frequent in Lake Belvedere Estates, accounting for 29.5% of all households.
| Income Bracket | # Households | % Households |
| Less than $10,000 | 36 | 5.4% |
| $10,000 to $14,999 | 0 | 0.0% |
| $15,000 to $24,999 | 60 | 9.1% |
| $25,000 to $34,999 | 49 | 7.4% |
| $35,000 to $49,999 | 94 | 14.2% |
| $50,000 to $74,999 | 119 | 18.0% |
| $75,000 to $99,999 | 46 | 6.9% |
| $100,000 to $149,999 | 195 | 29.5% |
| $150,000 to $199,999 | 57 | 8.6% |
| $200,000+ | 6 | 0.9% |
Household Income by Householder Age in Lake Belvedere Estates
The median household income in Lake Belvedere Estates is $70,250, with the highest median household income of $104,732 found in the 45 to 64 years age bracket for the primary householder. A total of 359 households (54.2%) fall into this category.

| Income Bracket | # Households | Median Income |
| 15 to 24 Years | 0 (0.0%) | $0 |
| 25 to 44 Years | 144 (21.7%) | $50,950 |
| 45 to 64 Years | 359 (54.2%) | $104,732 |
| 65+ Years | 159 (24.0%) | $31,122 |
| Total | 662 (100.0%) | $70,250 |
Poverty in Lake Belvedere Estates
Income Below Poverty by Sex and Age in Lake Belvedere Estates
With 5.4% poverty level for males and 6.9% for females among the residents of Lake Belvedere Estates, 16 and 17 year old males and 55 to 64 year old females are the most vulnerable to poverty, with 23 males (100.0%) and 28 females (21.0%) in their respective age groups living below the poverty level.
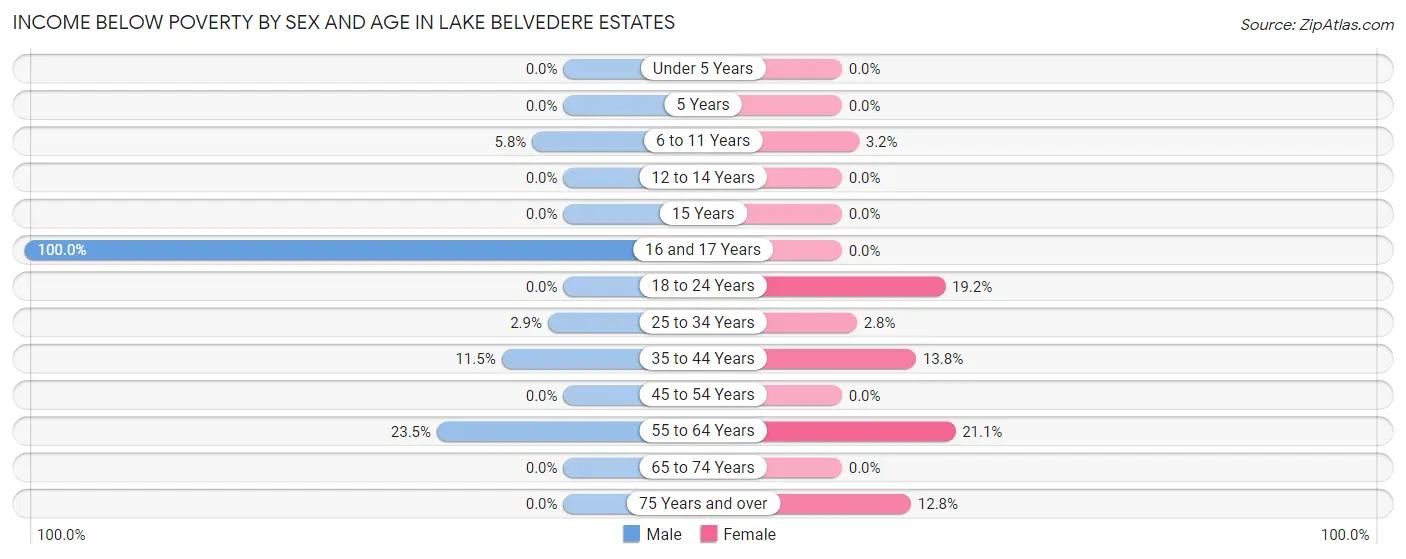
| Age Bracket | Male | Female |
| Under 5 Years | 0 (0.0%) | 0 (0.0%) |
| 5 Years | 0 (0.0%) | 0 (0.0%) |
| 6 to 11 Years | 7 (5.8%) | 7 (3.2%) |
| 12 to 14 Years | 0 (0.0%) | 0 (0.0%) |
| 15 Years | 0 (0.0%) | 0 (0.0%) |
| 16 and 17 Years | 23 (100.0%) | 0 (0.0%) |
| 18 to 24 Years | 0 (0.0%) | 27 (19.2%) |
| 25 to 34 Years | 3 (2.9%) | 6 (2.8%) |
| 35 to 44 Years | 7 (11.5%) | 19 (13.8%) |
| 45 to 54 Years | 0 (0.0%) | 0 (0.0%) |
| 55 to 64 Years | 31 (23.5%) | 28 (21.0%) |
| 65 to 74 Years | 0 (0.0%) | 0 (0.0%) |
| 75 Years and over | 0 (0.0%) | 20 (12.8%) |
| Total | 71 (5.4%) | 107 (6.9%) |
Income Above Poverty by Sex and Age in Lake Belvedere Estates
According to the poverty statistics in Lake Belvedere Estates, males aged under 5 years and females aged under 5 years are the age groups that are most secure financially, with 100.0% of males and 100.0% of females in these age groups living above the poverty line.
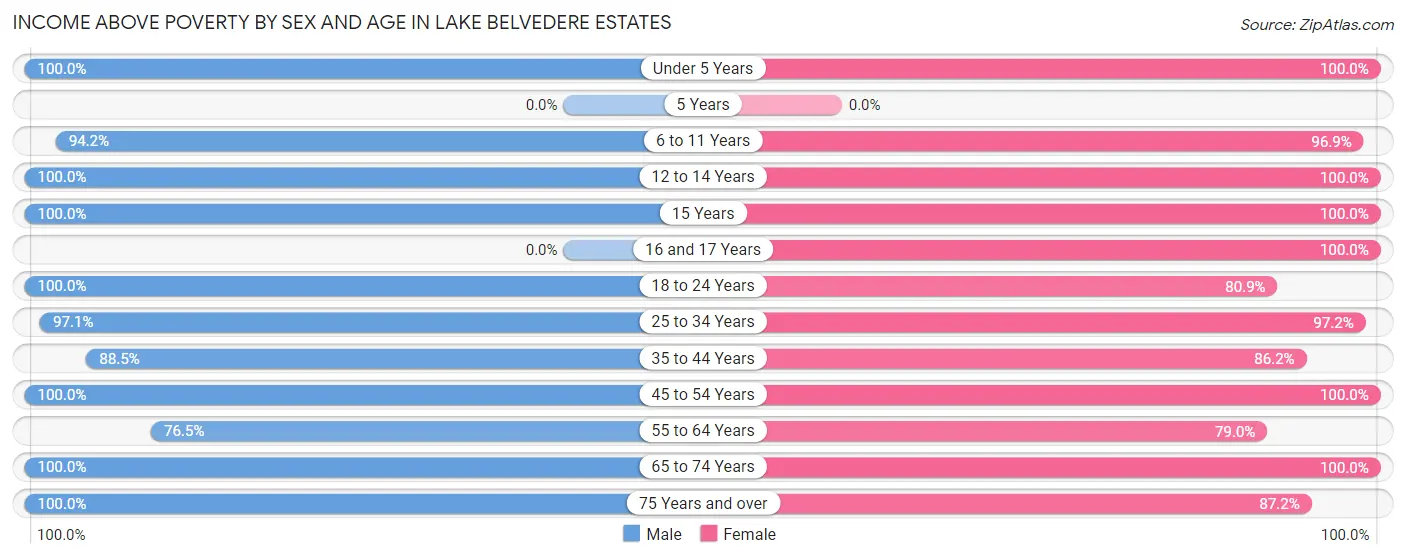
| Age Bracket | Male | Female |
| Under 5 Years | 167 (100.0%) | 111 (100.0%) |
| 5 Years | 0 (0.0%) | 0 (0.0%) |
| 6 to 11 Years | 114 (94.2%) | 215 (96.9%) |
| 12 to 14 Years | 118 (100.0%) | 33 (100.0%) |
| 15 Years | 13 (100.0%) | 101 (100.0%) |
| 16 and 17 Years | 0 (0.0%) | 37 (100.0%) |
| 18 to 24 Years | 309 (100.0%) | 114 (80.8%) |
| 25 to 34 Years | 101 (97.1%) | 210 (97.2%) |
| 35 to 44 Years | 54 (88.5%) | 119 (86.2%) |
| 45 to 54 Years | 179 (100.0%) | 163 (100.0%) |
| 55 to 64 Years | 101 (76.5%) | 105 (78.9%) |
| 65 to 74 Years | 88 (100.0%) | 91 (100.0%) |
| 75 Years and over | 10 (100.0%) | 136 (87.2%) |
| Total | 1,254 (94.6%) | 1,435 (93.1%) |
Income Below Poverty Among Married-Couple Families in Lake Belvedere Estates
The poverty statistics for married-couple families in Lake Belvedere Estates show that 8.7% or 36 of the total 412 families live below the poverty line. Families with 1 or 2 children have the highest poverty rate of 23.3%, comprising of 27 families. On the other hand, families with 3 or 4 children have the lowest poverty rate of 0.0%, which includes 0 families.
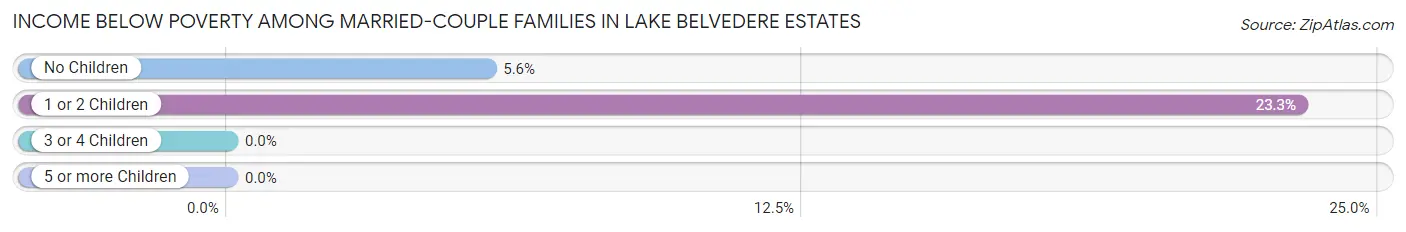
| Children | Above Poverty | Below Poverty |
| No Children | 151 (94.4%) | 9 (5.6%) |
| 1 or 2 Children | 89 (76.7%) | 27 (23.3%) |
| 3 or 4 Children | 121 (100.0%) | 0 (0.0%) |
| 5 or more Children | 15 (100.0%) | 0 (0.0%) |
| Total | 376 (91.3%) | 36 (8.7%) |
Income Below Poverty Among Single-Parent Households in Lake Belvedere Estates
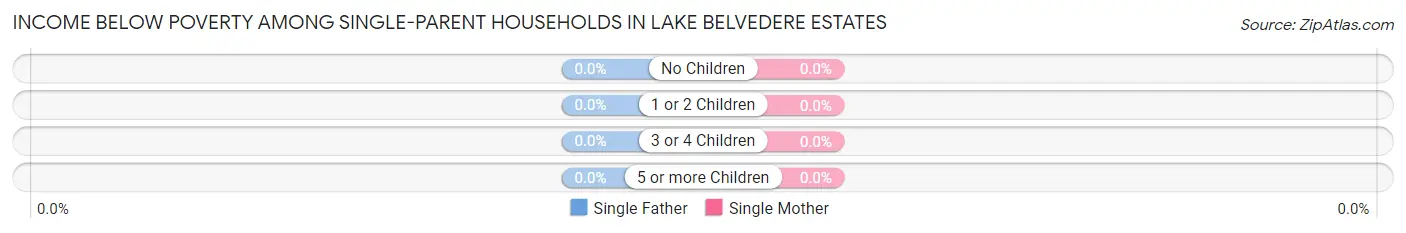
| Children | Single Father | Single Mother |
| No Children | 0 (0.0%) | 0 (0.0%) |
| 1 or 2 Children | 0 (0.0%) | 0 (0.0%) |
| 3 or 4 Children | 0 (0.0%) | 0 (0.0%) |
| 5 or more Children | 0 (0.0%) | 0 (0.0%) |
| Total | 0 (0.0%) | 0 (0.0%) |
Income Below Poverty Among Married-Couple vs Single-Parent Households in Lake Belvedere Estates
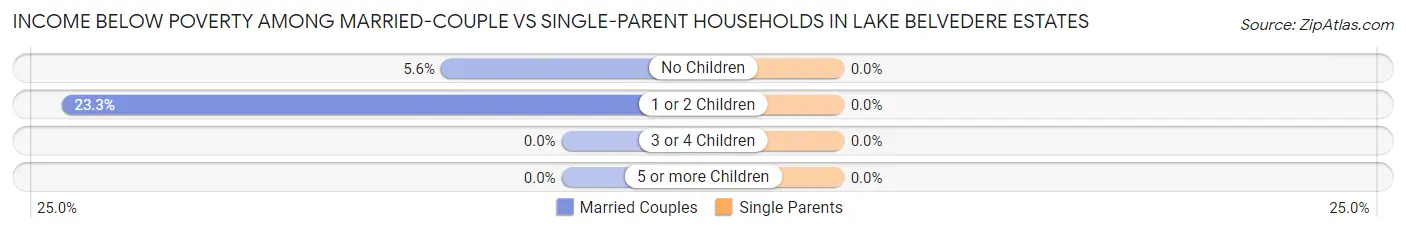
| Children | Married-Couple Families | Single-Parent Households |
| No Children | 9 (5.6%) | 0 (0.0%) |
| 1 or 2 Children | 27 (23.3%) | 0 (0.0%) |
| 3 or 4 Children | 0 (0.0%) | 0 (0.0%) |
| 5 or more Children | 0 (0.0%) | 0 (0.0%) |
| Total | 36 (8.7%) | 0 (0.0%) |
Race in Lake Belvedere Estates
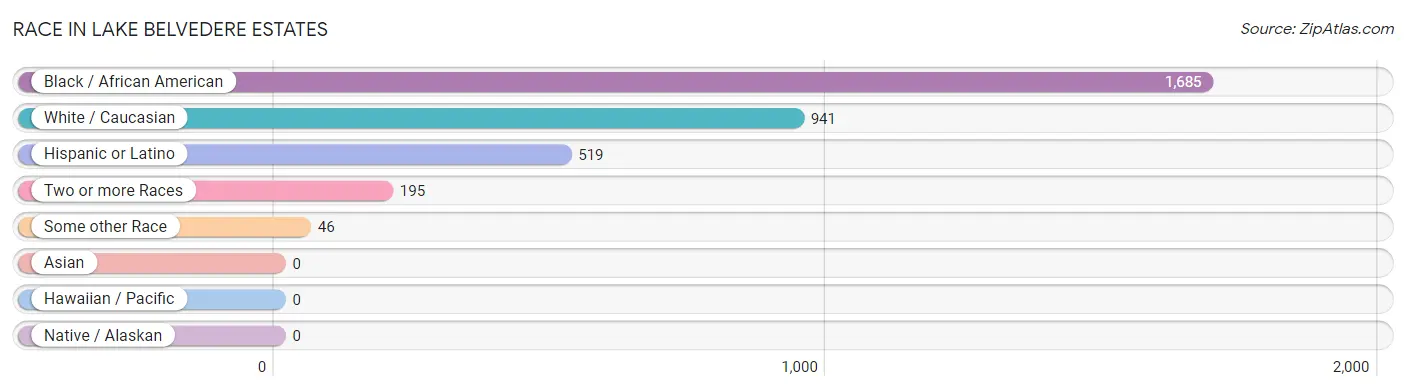
The most populous races in Lake Belvedere Estates are Black / African American (1,685 | 58.8%), White / Caucasian (941 | 32.8%), and Hispanic or Latino (519 | 18.1%).
| Race | # Population | % Population |
| Asian | 0 | 0.0% |
| Black / African American | 1,685 | 58.8% |
| Hawaiian / Pacific | 0 | 0.0% |
| Hispanic or Latino | 519 | 18.1% |
| Native / Alaskan | 0 | 0.0% |
| White / Caucasian | 941 | 32.8% |
| Two or more Races | 195 | 6.8% |
| Some other Race | 46 | 1.6% |
| Total | 2,867 | 100.0% |
Ancestry in Lake Belvedere Estates
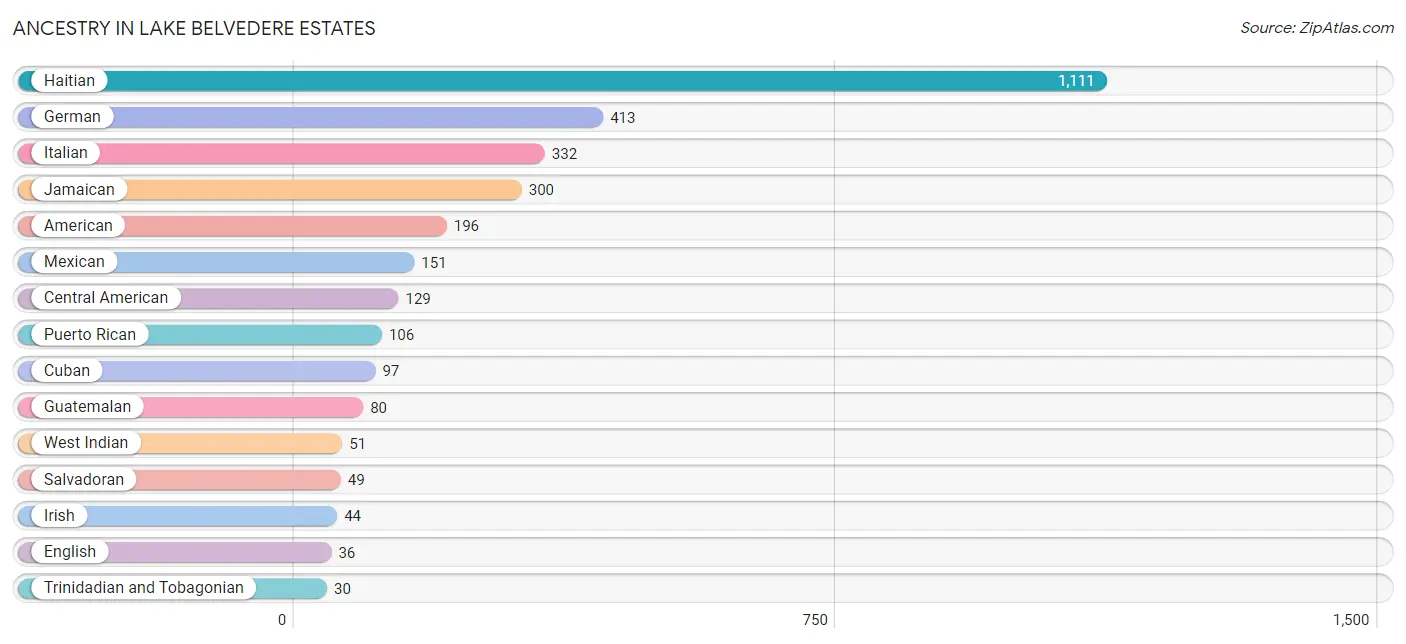
The most populous ancestries reported in Lake Belvedere Estates are Haitian (1,111 | 38.8%), German (413 | 14.4%), Italian (332 | 11.6%), Jamaican (300 | 10.5%), and American (196 | 6.8%), together accounting for 82.0% of all Lake Belvedere Estates residents.
| Ancestry | # Population | % Population |
| African | 19 | 0.7% |
| American | 196 | 6.8% |
| Central American | 129 | 4.5% |
| Central American Indian | 7 | 0.2% |
| Colombian | 16 | 0.6% |
| Cuban | 97 | 3.4% |
| Dominican | 20 | 0.7% |
| English | 36 | 1.3% |
| French | 28 | 1.0% |
| German | 413 | 14.4% |
| Guatemalan | 80 | 2.8% |
| Haitian | 1,111 | 38.8% |
| Irish | 44 | 1.5% |
| Italian | 332 | 11.6% |
| Jamaican | 300 | 10.5% |
| Mexican | 151 | 5.3% |
| Polish | 29 | 1.0% |
| Puerto Rican | 106 | 3.7% |
| Salvadoran | 49 | 1.7% |
| Scottish | 9 | 0.3% |
| South American | 16 | 0.6% |
| Subsaharan African | 25 | 0.9% |
| Swedish | 13 | 0.4% |
| Trinidadian and Tobagonian | 30 | 1.1% |
| West Indian | 51 | 1.8% | View All 25 Rows |
Immigrants in Lake Belvedere Estates
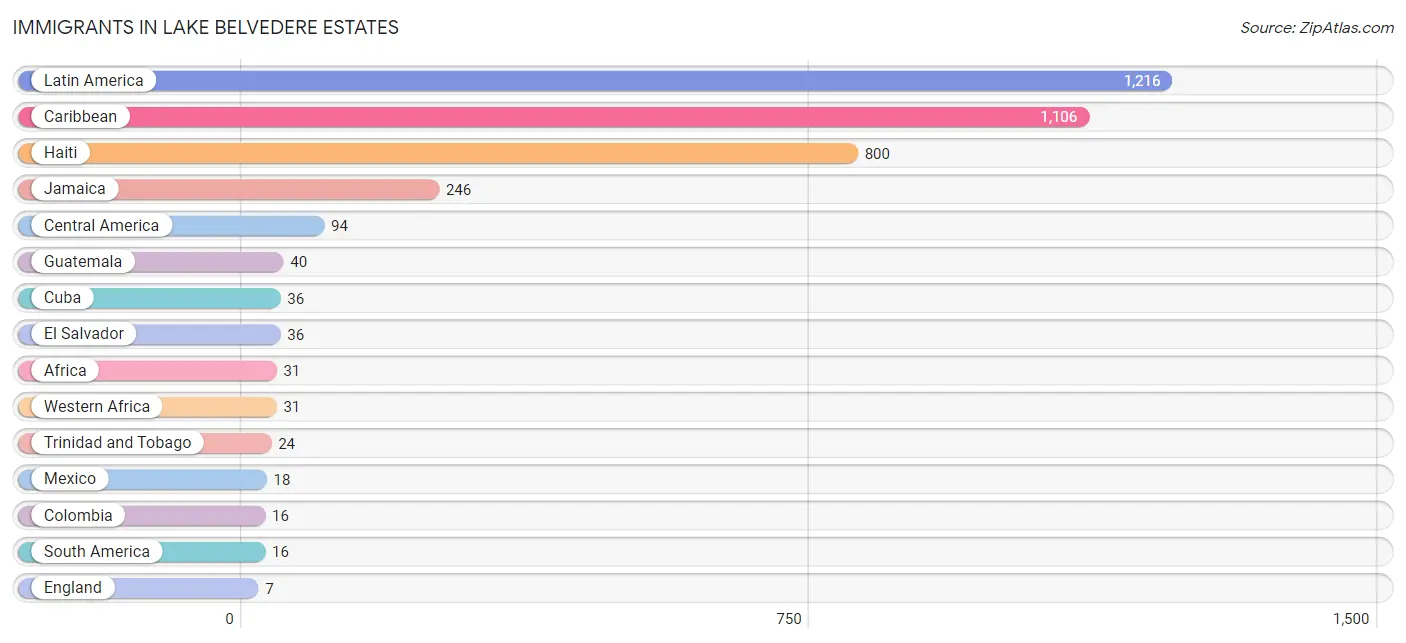
The most numerous immigrant groups reported in Lake Belvedere Estates came from Latin America (1,216 | 42.4%), Caribbean (1,106 | 38.6%), Haiti (800 | 27.9%), Jamaica (246 | 8.6%), and Central America (94 | 3.3%), together accounting for 120.8% of all Lake Belvedere Estates residents.
| Immigration Origin | # Population | % Population |
| Africa | 31 | 1.1% |
| Caribbean | 1,106 | 38.6% |
| Central America | 94 | 3.3% |
| Colombia | 16 | 0.6% |
| Cuba | 36 | 1.3% |
| El Salvador | 36 | 1.3% |
| England | 7 | 0.2% |
| Europe | 7 | 0.2% |
| Guatemala | 40 | 1.4% |
| Haiti | 800 | 27.9% |
| Jamaica | 246 | 8.6% |
| Latin America | 1,216 | 42.4% |
| Mexico | 18 | 0.6% |
| Northern Europe | 7 | 0.2% |
| South America | 16 | 0.6% |
| Trinidad and Tobago | 24 | 0.8% |
| Western Africa | 31 | 1.1% | View All 17 Rows |
Sex and Age in Lake Belvedere Estates
Sex and Age in Lake Belvedere Estates
The most populous age groups in Lake Belvedere Estates are 20 to 24 Years (309 | 23.3%) for men and 10 to 14 Years (154 | 10.0%) for women.
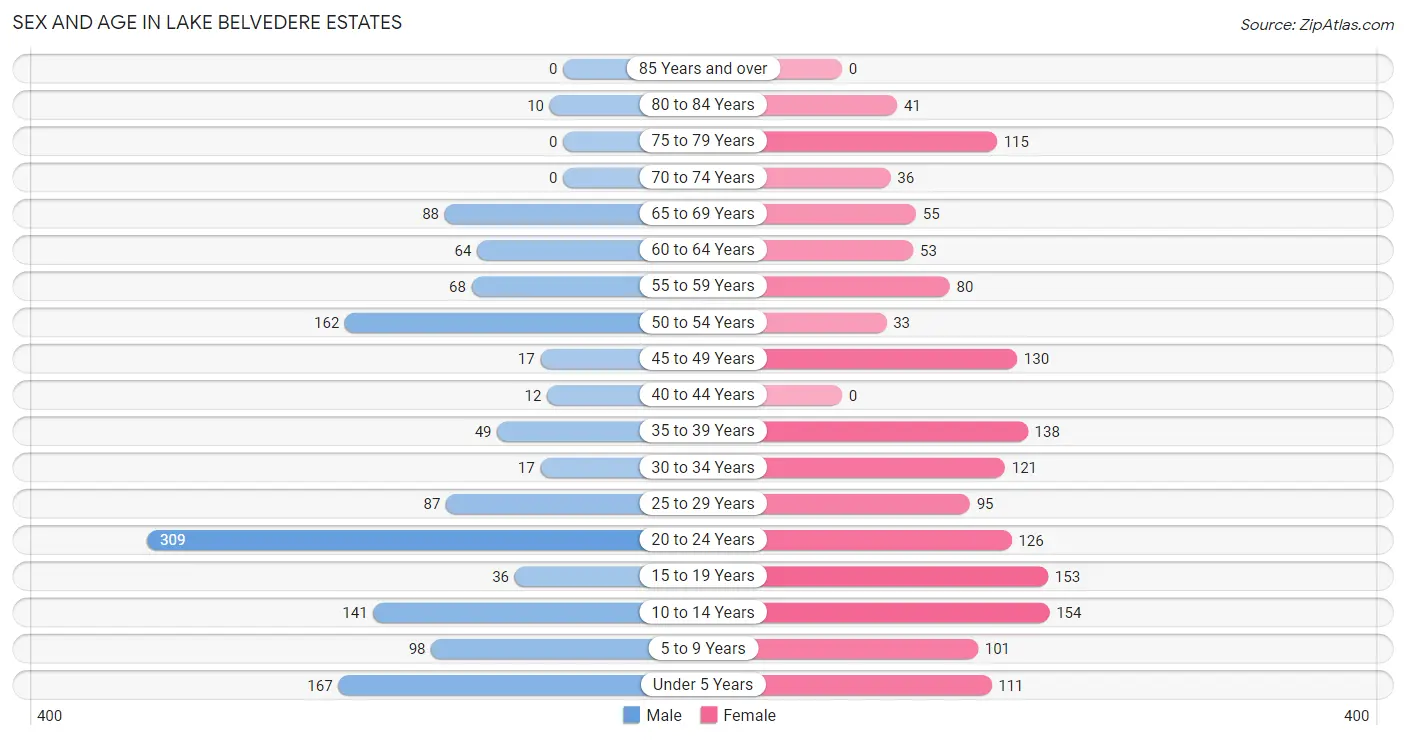
| Age Bracket | Male | Female |
| Under 5 Years | 167 (12.6%) | 111 (7.2%) |
| 5 to 9 Years | 98 (7.4%) | 101 (6.6%) |
| 10 to 14 Years | 141 (10.6%) | 154 (10.0%) |
| 15 to 19 Years | 36 (2.7%) | 153 (9.9%) |
| 20 to 24 Years | 309 (23.3%) | 126 (8.2%) |
| 25 to 29 Years | 87 (6.6%) | 95 (6.2%) |
| 30 to 34 Years | 17 (1.3%) | 121 (7.9%) |
| 35 to 39 Years | 49 (3.7%) | 138 (8.9%) |
| 40 to 44 Years | 12 (0.9%) | 0 (0.0%) |
| 45 to 49 Years | 17 (1.3%) | 130 (8.4%) |
| 50 to 54 Years | 162 (12.2%) | 33 (2.1%) |
| 55 to 59 Years | 68 (5.1%) | 80 (5.2%) |
| 60 to 64 Years | 64 (4.8%) | 53 (3.4%) |
| 65 to 69 Years | 88 (6.6%) | 55 (3.6%) |
| 70 to 74 Years | 0 (0.0%) | 36 (2.3%) |
| 75 to 79 Years | 0 (0.0%) | 115 (7.5%) |
| 80 to 84 Years | 10 (0.7%) | 41 (2.7%) |
| 85 Years and over | 0 (0.0%) | 0 (0.0%) |
| Total | 1,325 (100.0%) | 1,542 (100.0%) |
Families and Households in Lake Belvedere Estates
Median Family Size in Lake Belvedere Estates
The median family size in Lake Belvedere Estates is 4.88 persons per family, with married-couple families (412 | 73.6%) accounting for the largest median family size of 5.29 persons per family. On the other hand, single male/father families (38 | 6.8%) represent the smallest median family size with 2.45 persons per family.
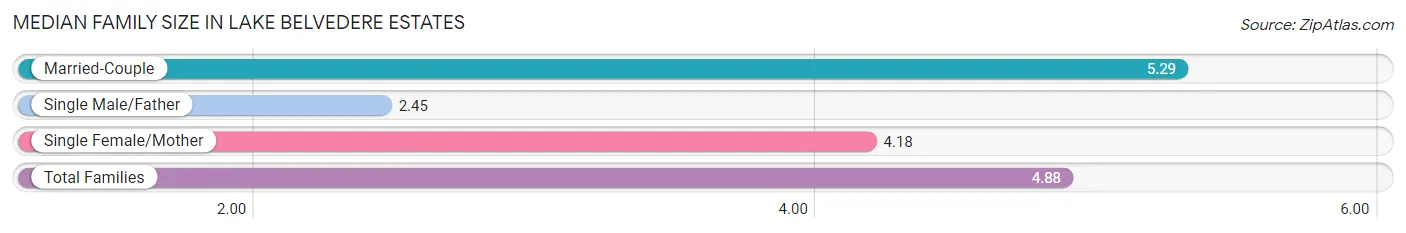
| Family Type | # Families | Family Size |
| Married-Couple | 412 (73.6%) | 5.29 |
| Single Male/Father | 38 (6.8%) | 2.45 |
| Single Female/Mother | 110 (19.6%) | 4.18 |
| Total Families | 560 (100.0%) | 4.88 |
Median Household Size in Lake Belvedere Estates
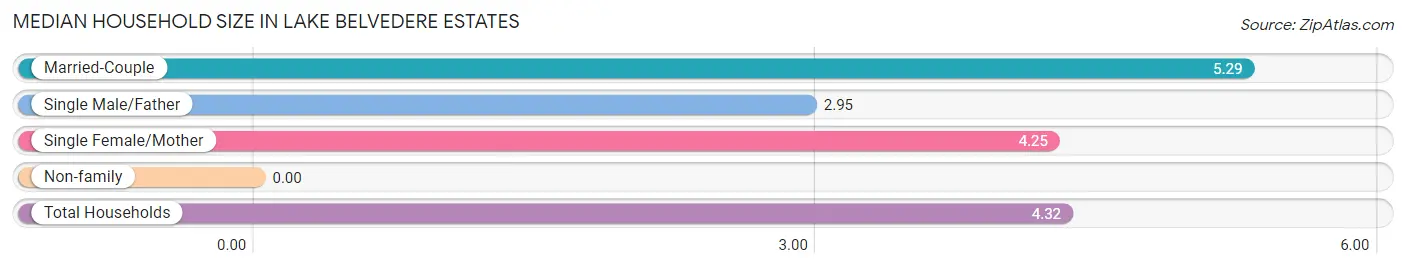
| Household Type | # Households | Household Size |
| Married-Couple | 412 (62.2%) | 5.29 |
| Single Male/Father | 38 (5.7%) | 2.95 |
| Single Female/Mother | 110 (16.6%) | 4.25 |
| Non-family | 102 (15.4%) | - |
| Total Households | 662 (100.0%) | 4.32 |
Household Size by Marriage Status in Lake Belvedere Estates
Out of a total of 662 households in Lake Belvedere Estates, 560 (84.6%) are family households, while 102 (15.4%) are nonfamily households. The most numerous type of family households are 3-person households, comprising 149, and the most common type of nonfamily households are 1-person households, comprising 102.
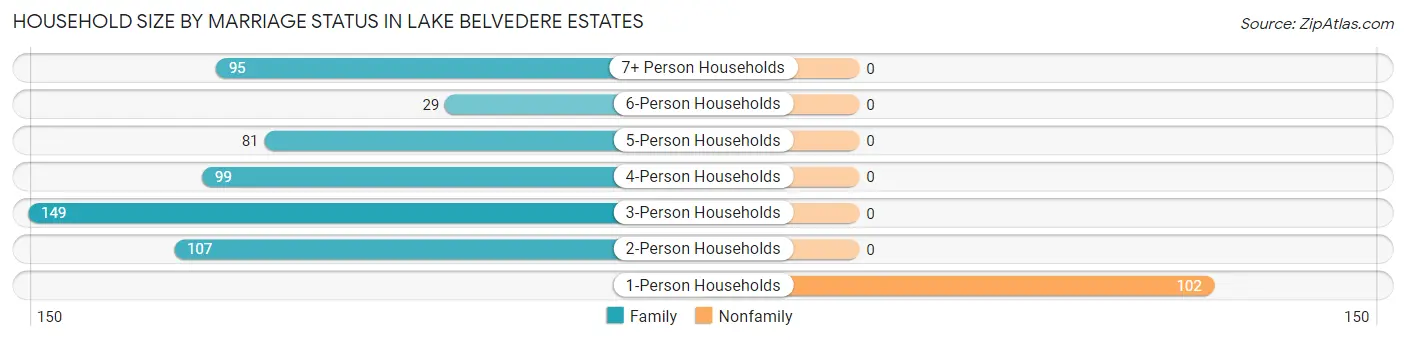
| Household Size | Family Households | Nonfamily Households |
| 1-Person Households | - | 102 (15.4%) |
| 2-Person Households | 107 (16.2%) | 0 (0.0%) |
| 3-Person Households | 149 (22.5%) | 0 (0.0%) |
| 4-Person Households | 99 (14.9%) | 0 (0.0%) |
| 5-Person Households | 81 (12.2%) | 0 (0.0%) |
| 6-Person Households | 29 (4.4%) | 0 (0.0%) |
| 7+ Person Households | 95 (14.3%) | 0 (0.0%) |
| Total | 560 (84.6%) | 102 (15.4%) |
Female Fertility in Lake Belvedere Estates
Fertility by Age in Lake Belvedere Estates
Average fertility rate in Lake Belvedere Estates is 148.0 births per 1,000 women. Women in the age bracket of 35 to 50 years have the highest fertility rate with 422.0 births per 1,000 women. Women in the age bracket of 35 to 50 years acount for 100.0% of all women with births.
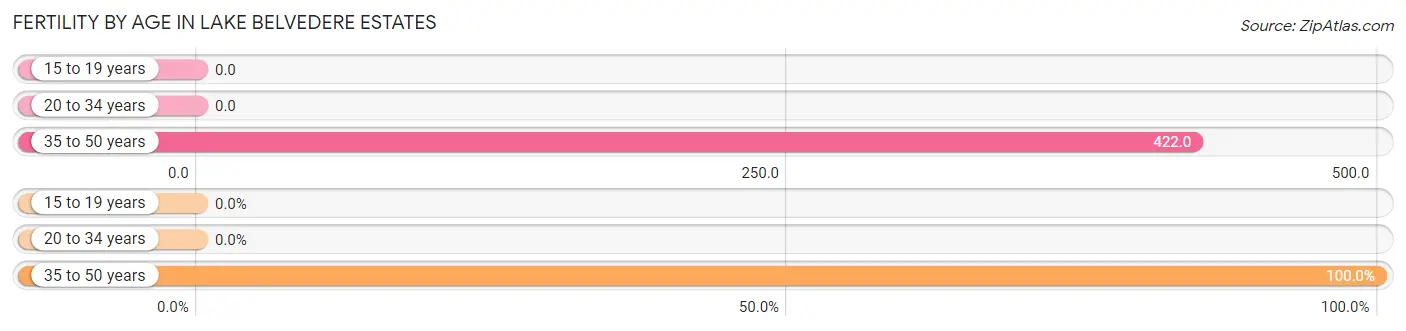
| Age Bracket | Women with Births | Births / 1,000 Women |
| 15 to 19 years | 0 (0.0%) | 0.0 |
| 20 to 34 years | 0 (0.0%) | 0.0 |
| 35 to 50 years | 113 (100.0%) | 422.0 |
| Total | 113 (100.0%) | 148.0 |
Fertility by Age by Marriage Status in Lake Belvedere Estates
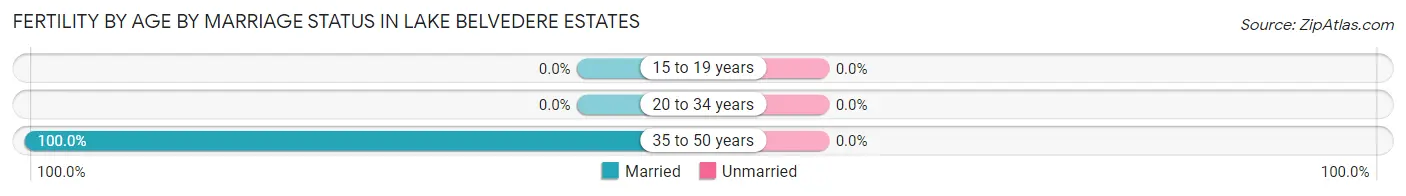
| Age Bracket | Married | Unmarried |
| 15 to 19 years | 0 (0.0%) | 0 (0.0%) |
| 20 to 34 years | 0 (0.0%) | 0 (0.0%) |
| 35 to 50 years | 113 (100.0%) | 0 (0.0%) |
| Total | 113 (100.0%) | 0 (0.0%) |
Fertility by Education in Lake Belvedere Estates
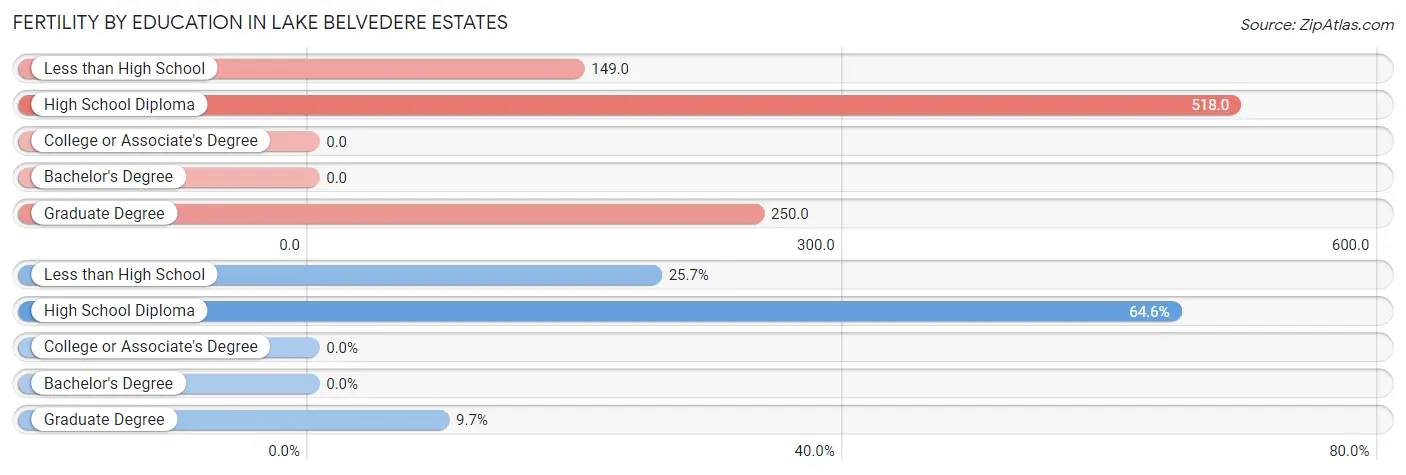
| Educational Attainment | Women with Births | Births / 1,000 Women |
| Less than High School | 29 (25.7%) | 149.0 |
| High School Diploma | 73 (64.6%) | 518.0 |
| College or Associate's Degree | 0 (0.0%) | 0.0 |
| Bachelor's Degree | 0 (0.0%) | 0.0 |
| Graduate Degree | 11 (9.7%) | 250.0 |
| Total | 113 (100.0%) | 148.0 |
Fertility by Education by Marriage Status in Lake Belvedere Estates
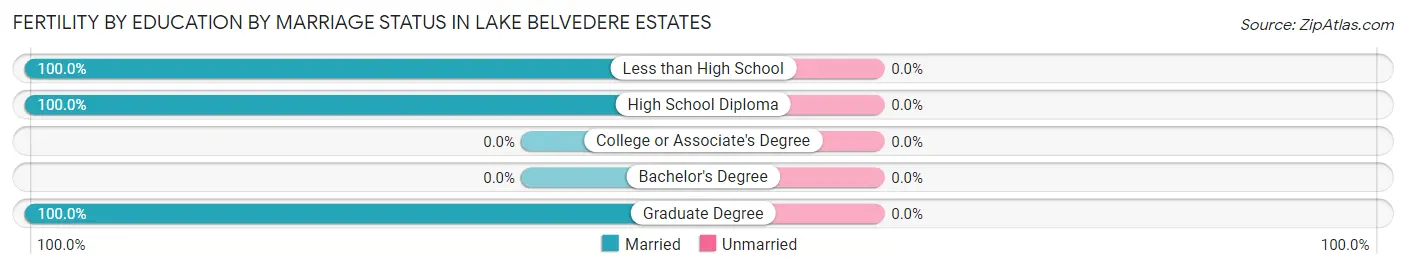
| Educational Attainment | Married | Unmarried |
| Less than High School | 29 (100.0%) | 0 (0.0%) |
| High School Diploma | 73 (100.0%) | 0 (0.0%) |
| College or Associate's Degree | 0 (0.0%) | 0 (0.0%) |
| Bachelor's Degree | 0 (0.0%) | 0 (0.0%) |
| Graduate Degree | 11 (100.0%) | 0 (0.0%) |
| Total | 113 (100.0%) | 0 (0.0%) |
Employment Characteristics in Lake Belvedere Estates
Employment by Class of Employer in Lake Belvedere Estates
Among the 1,267 employed individuals in Lake Belvedere Estates, private company employees (980 | 77.3%), local government employees (90 | 7.1%), and self-employed (not incorporated) (89 | 7.0%) make up the most common classes of employment.
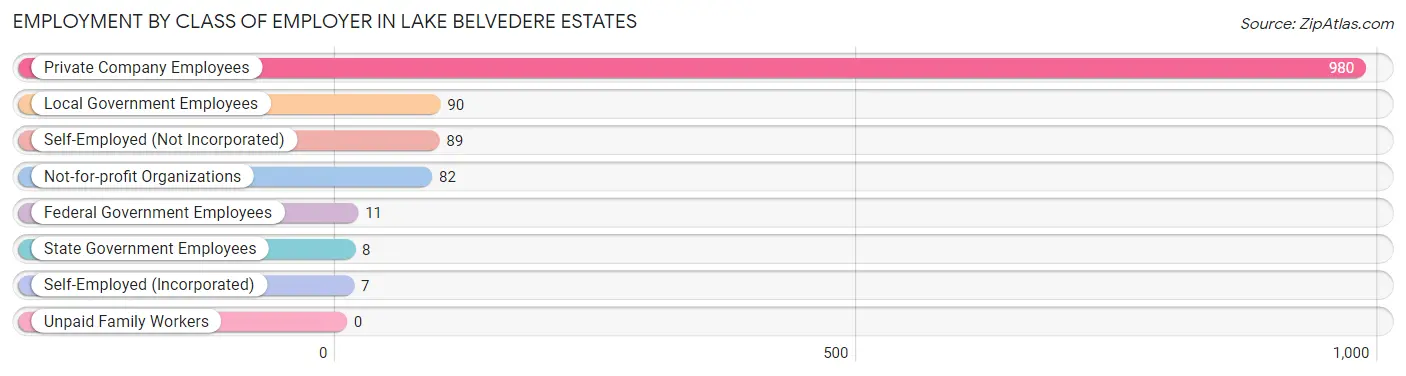
| Employer Class | # Employees | % Employees |
| Private Company Employees | 980 | 77.3% |
| Self-Employed (Incorporated) | 7 | 0.5% |
| Self-Employed (Not Incorporated) | 89 | 7.0% |
| Not-for-profit Organizations | 82 | 6.5% |
| Local Government Employees | 90 | 7.1% |
| State Government Employees | 8 | 0.6% |
| Federal Government Employees | 11 | 0.9% |
| Unpaid Family Workers | 0 | 0.0% |
| Total | 1,267 | 100.0% |
Employment Status by Age in Lake Belvedere Estates
According to the labor force statistics for Lake Belvedere Estates, out of the total population over 16 years of age (1,981), 69.4% or 1,375 individuals are in the labor force, with 4.9% or 67 of them unemployed. The age group with the highest labor force participation rate is 45 to 54 years, with 95.6% or 327 individuals in the labor force. Within the labor force, the 25 to 29 years age range has the highest percentage of unemployed individuals, with 20.0% or 25 of them being unemployed.
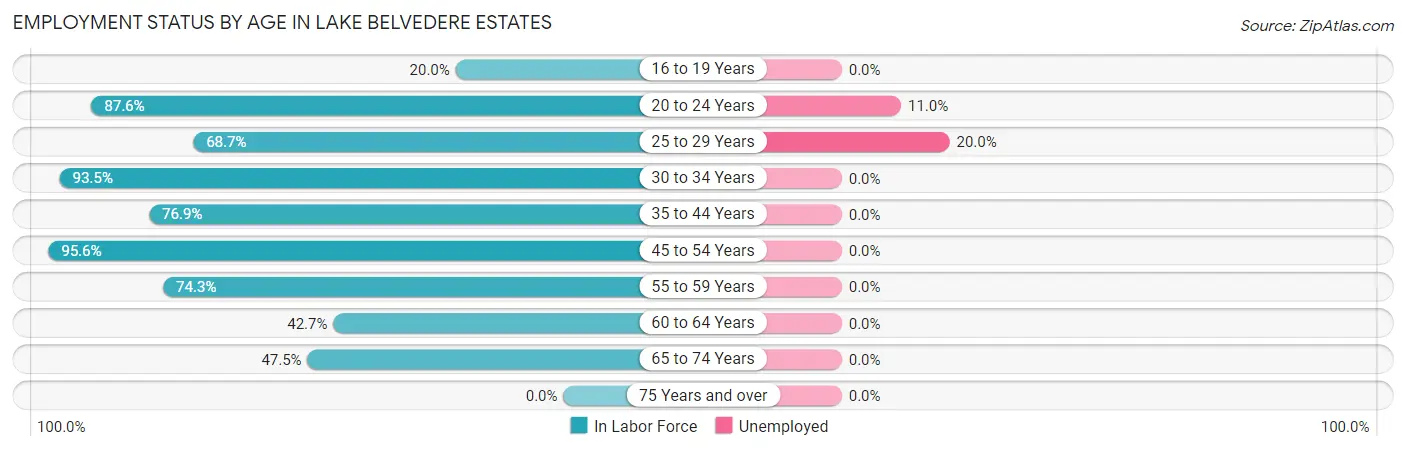
| Age Bracket | In Labor Force | Unemployed |
| 16 to 19 Years | 15 (20.0%) | 0 (0.0%) |
| 20 to 24 Years | 381 (87.6%) | 42 (11.0%) |
| 25 to 29 Years | 125 (68.7%) | 25 (20.0%) |
| 30 to 34 Years | 129 (93.5%) | 0 (0.0%) |
| 35 to 44 Years | 153 (76.9%) | 0 (0.0%) |
| 45 to 54 Years | 327 (95.6%) | 0 (0.0%) |
| 55 to 59 Years | 110 (74.3%) | 0 (0.0%) |
| 60 to 64 Years | 50 (42.7%) | 0 (0.0%) |
| 65 to 74 Years | 85 (47.5%) | 0 (0.0%) |
| 75 Years and over | 0 (0.0%) | 0 (0.0%) |
| Total | 1,375 (69.4%) | 67 (4.9%) |
Employment Status by Educational Attainment in Lake Belvedere Estates
According to labor force statistics for Lake Belvedere Estates, 79.4% of individuals (894) out of the total population between 25 and 64 years of age (1,126) are in the labor force, with 2.8% or 25 of them being unemployed. The group with the highest labor force participation rate are those with the educational attainment of college / associate degree, with 84.8% or 234 individuals in the labor force. Within the labor force, individuals with bachelor's degree or higher education have the highest percentage of unemployment, with 11.6% or 25 of them being unemployed.
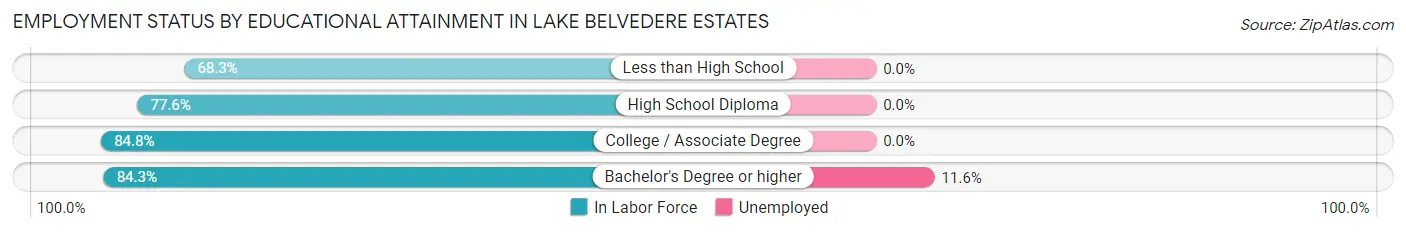
| Educational Attainment | In Labor Force | Unemployed |
| Less than High School | 123 (68.3%) | 0 (0.0%) |
| High School Diploma | 322 (77.6%) | 0 (0.0%) |
| College / Associate Degree | 234 (84.8%) | 0 (0.0%) |
| Bachelor's Degree or higher | 215 (84.3%) | 30 (11.6%) |
| Total | 894 (79.4%) | 32 (2.8%) |
Employment Occupations by Sex in Lake Belvedere Estates
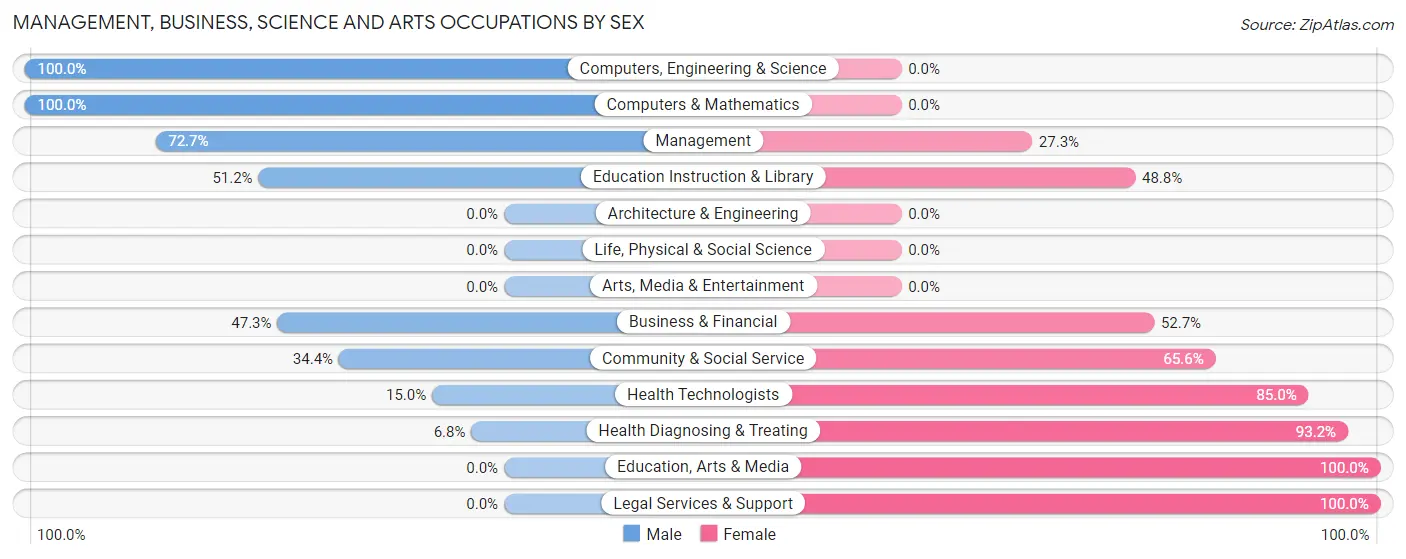
Management, Business, Science and Arts Occupations
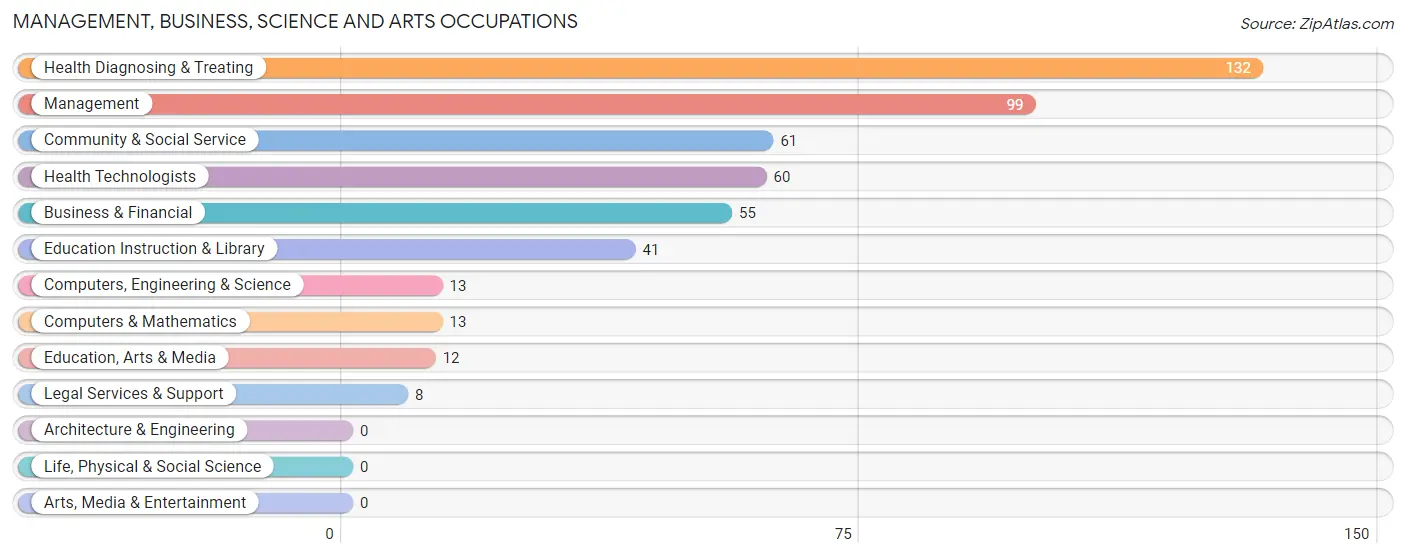
The most common Management, Business, Science and Arts occupations in Lake Belvedere Estates are Health Diagnosing & Treating (132 | 10.1%), Management (99 | 7.6%), Community & Social Service (61 | 4.7%), Health Technologists (60 | 4.6%), and Business & Financial (55 | 4.2%).
Management, Business, Science and Arts Occupations by Sex
Within the Management, Business, Science and Arts occupations in Lake Belvedere Estates, the most male-oriented occupations are Computers, Engineering & Science (100.0%), Computers & Mathematics (100.0%), and Management (72.7%), while the most female-oriented occupations are Education, Arts & Media (100.0%), Legal Services & Support (100.0%), and Health Diagnosing & Treating (93.2%).
| Occupation | Male | Female |
| Management | 72 (72.7%) | 27 (27.3%) |
| Business & Financial | 26 (47.3%) | 29 (52.7%) |
| Computers, Engineering & Science | 13 (100.0%) | 0 (0.0%) |
| Computers & Mathematics | 13 (100.0%) | 0 (0.0%) |
| Architecture & Engineering | 0 (0.0%) | 0 (0.0%) |
| Life, Physical & Social Science | 0 (0.0%) | 0 (0.0%) |
| Community & Social Service | 21 (34.4%) | 40 (65.6%) |
| Education, Arts & Media | 0 (0.0%) | 12 (100.0%) |
| Legal Services & Support | 0 (0.0%) | 8 (100.0%) |
| Education Instruction & Library | 21 (51.2%) | 20 (48.8%) |
| Arts, Media & Entertainment | 0 (0.0%) | 0 (0.0%) |
| Health Diagnosing & Treating | 9 (6.8%) | 123 (93.2%) |
| Health Technologists | 9 (15.0%) | 51 (85.0%) |
| Total (Category) | 141 (39.2%) | 219 (60.8%) |
| Total (Overall) | 645 (49.3%) | 663 (50.7%) |
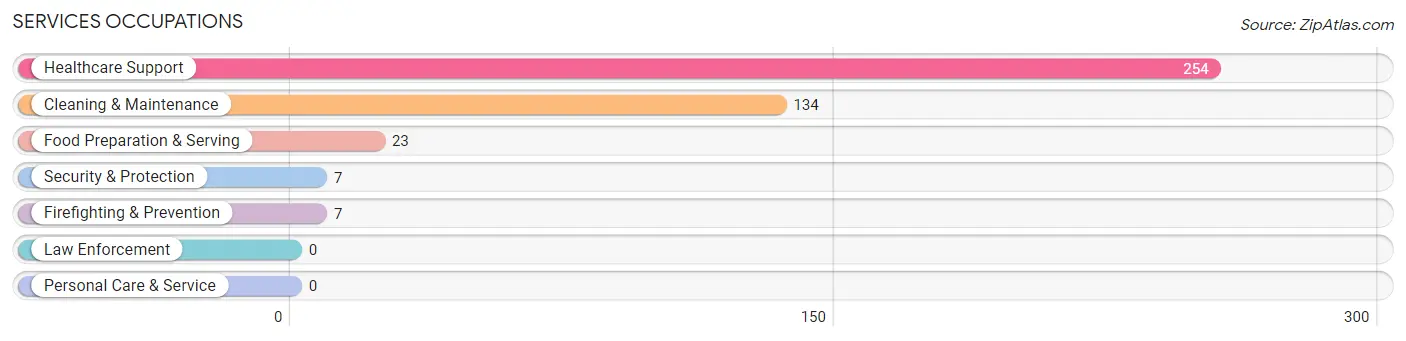
Services Occupations
The most common Services occupations in Lake Belvedere Estates are Healthcare Support (254 | 19.4%), Cleaning & Maintenance (134 | 10.2%), Food Preparation & Serving (23 | 1.8%), Security & Protection (7 | 0.5%), and Firefighting & Prevention (7 | 0.5%).
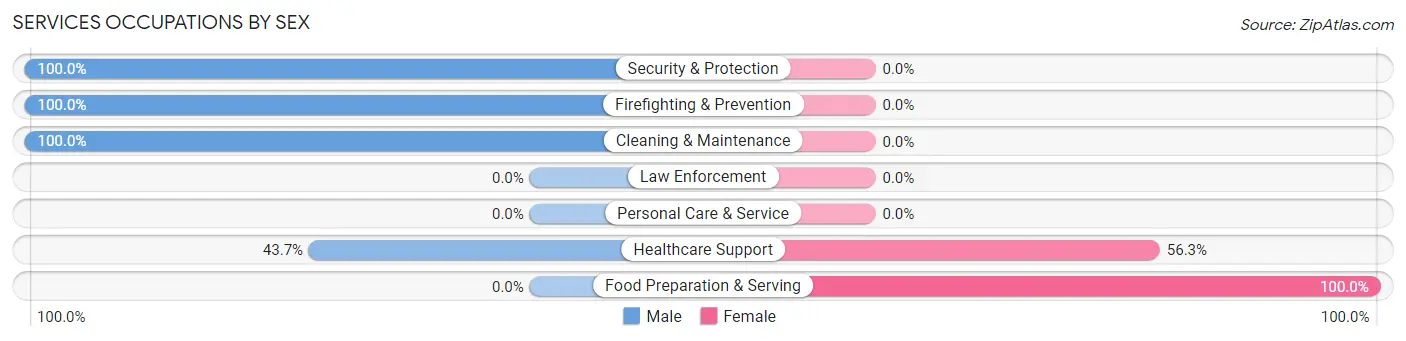
Services Occupations by Sex
Within the Services occupations in Lake Belvedere Estates, the most male-oriented occupations are Security & Protection (100.0%), Firefighting & Prevention (100.0%), and Cleaning & Maintenance (100.0%), while the most female-oriented occupations are Food Preparation & Serving (100.0%), and Healthcare Support (56.3%).
| Occupation | Male | Female |
| Healthcare Support | 111 (43.7%) | 143 (56.3%) |
| Security & Protection | 7 (100.0%) | 0 (0.0%) |
| Firefighting & Prevention | 7 (100.0%) | 0 (0.0%) |
| Law Enforcement | 0 (0.0%) | 0 (0.0%) |
| Food Preparation & Serving | 0 (0.0%) | 23 (100.0%) |
| Cleaning & Maintenance | 134 (100.0%) | 0 (0.0%) |
| Personal Care & Service | 0 (0.0%) | 0 (0.0%) |
| Total (Category) | 252 (60.3%) | 166 (39.7%) |
| Total (Overall) | 645 (49.3%) | 663 (50.7%) |
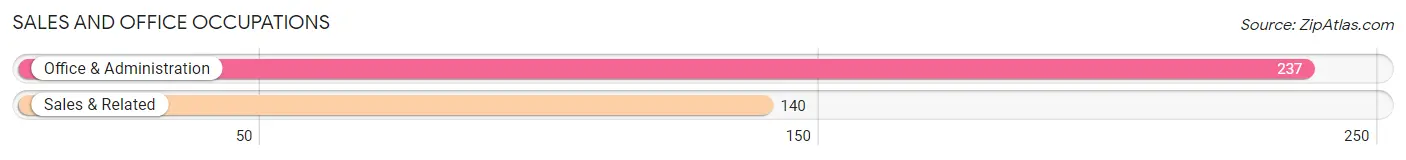
Sales and Office Occupations
The most common Sales and Office occupations in Lake Belvedere Estates are Office & Administration (237 | 18.1%), and Sales & Related (140 | 10.7%).
Sales and Office Occupations by Sex
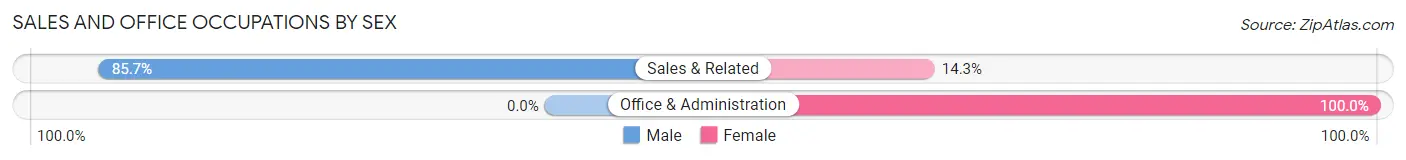
| Occupation | Male | Female |
| Sales & Related | 120 (85.7%) | 20 (14.3%) |
| Office & Administration | 0 (0.0%) | 237 (100.0%) |
| Total (Category) | 120 (31.8%) | 257 (68.2%) |
| Total (Overall) | 645 (49.3%) | 663 (50.7%) |
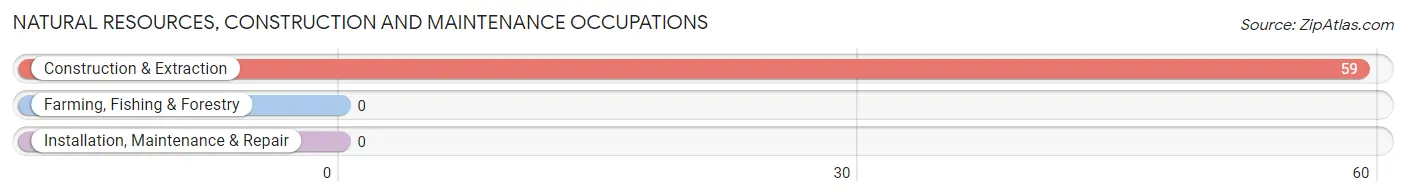
Natural Resources, Construction and Maintenance Occupations
The most common Natural Resources, Construction and Maintenance occupations in Lake Belvedere Estates are , and Construction & Extraction (59 | 4.5%).
Natural Resources, Construction and Maintenance Occupations by Sex
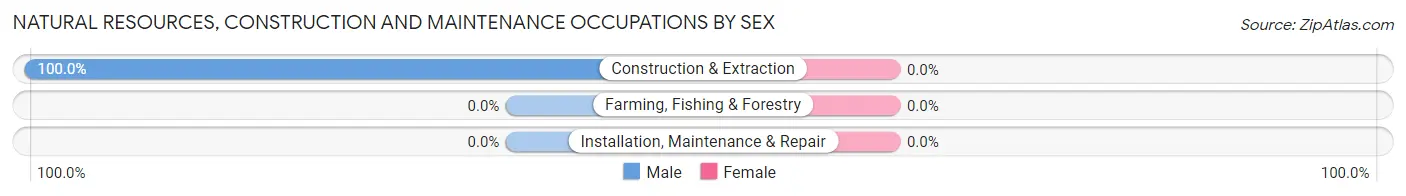
| Occupation | Male | Female |
| Farming, Fishing & Forestry | 0 (0.0%) | 0 (0.0%) |
| Construction & Extraction | 59 (100.0%) | 0 (0.0%) |
| Installation, Maintenance & Repair | 0 (0.0%) | 0 (0.0%) |
| Total (Category) | 59 (100.0%) | 0 (0.0%) |
| Total (Overall) | 645 (49.3%) | 663 (50.7%) |
Production, Transportation and Moving Occupations
The most common Production, Transportation and Moving occupations in Lake Belvedere Estates are Transportation (58 | 4.4%), Production (21 | 1.6%), and Material Moving (15 | 1.1%).
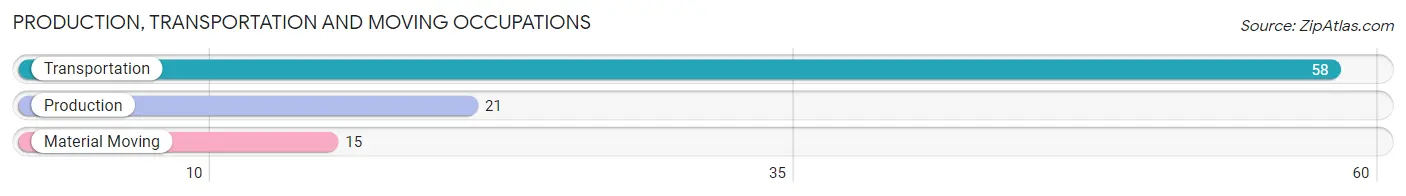
Production, Transportation and Moving Occupations by Sex
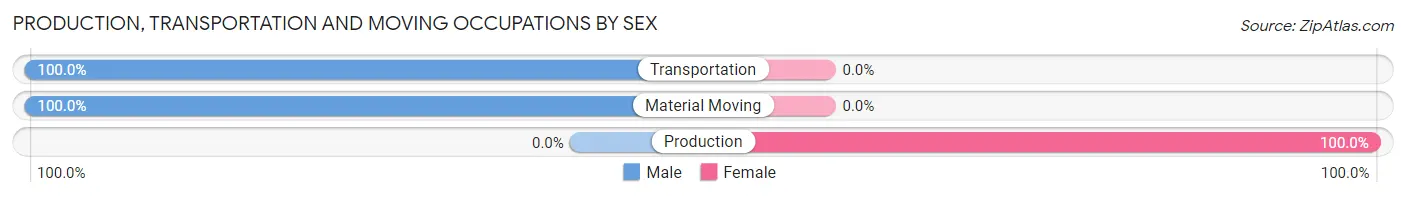
| Occupation | Male | Female |
| Production | 0 (0.0%) | 21 (100.0%) |
| Transportation | 58 (100.0%) | 0 (0.0%) |
| Material Moving | 15 (100.0%) | 0 (0.0%) |
| Total (Category) | 73 (77.7%) | 21 (22.3%) |
| Total (Overall) | 645 (49.3%) | 663 (50.7%) |
Employment Industries by Sex in Lake Belvedere Estates
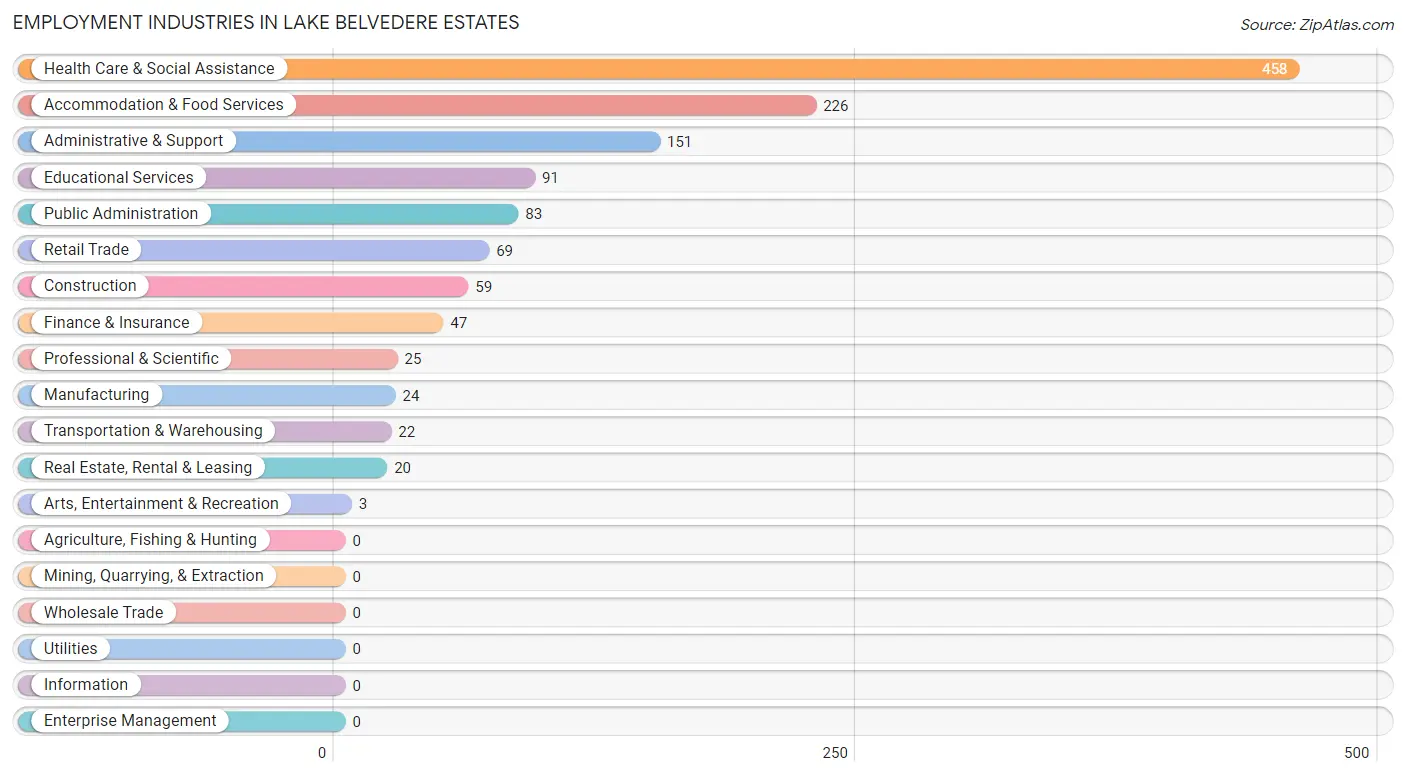
Employment Industries in Lake Belvedere Estates
The major employment industries in Lake Belvedere Estates include Health Care & Social Assistance (458 | 35.0%), Accommodation & Food Services (226 | 17.3%), Administrative & Support (151 | 11.5%), Educational Services (91 | 7.0%), and Public Administration (83 | 6.4%).
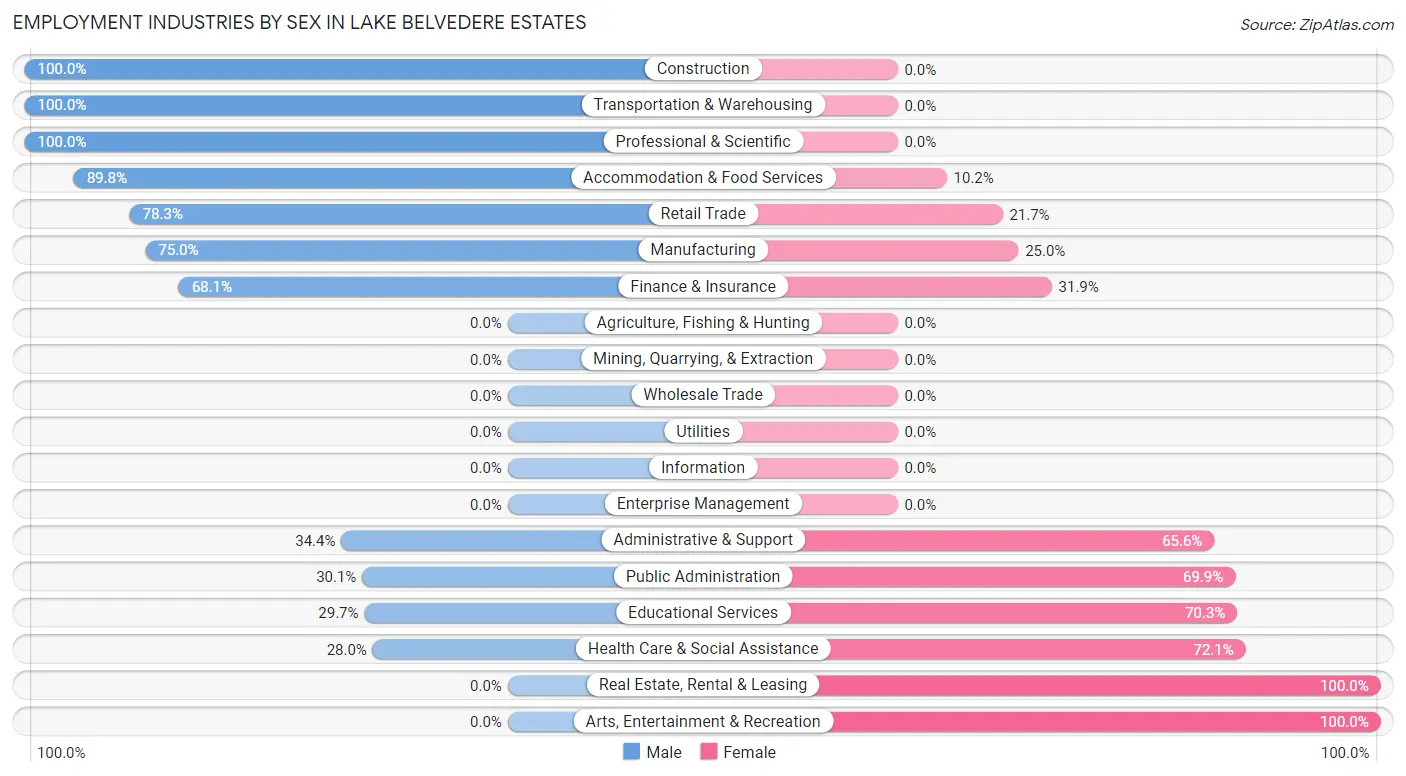
Employment Industries by Sex in Lake Belvedere Estates
The Lake Belvedere Estates industries that see more men than women are Construction (100.0%), Transportation & Warehousing (100.0%), and Professional & Scientific (100.0%), whereas the industries that tend to have a higher number of women are Real Estate, Rental & Leasing (100.0%), Arts, Entertainment & Recreation (100.0%), and Health Care & Social Assistance (72.1%).
| Industry | Male | Female |
| Agriculture, Fishing & Hunting | 0 (0.0%) | 0 (0.0%) |
| Mining, Quarrying, & Extraction | 0 (0.0%) | 0 (0.0%) |
| Construction | 59 (100.0%) | 0 (0.0%) |
| Manufacturing | 18 (75.0%) | 6 (25.0%) |
| Wholesale Trade | 0 (0.0%) | 0 (0.0%) |
| Retail Trade | 54 (78.3%) | 15 (21.7%) |
| Transportation & Warehousing | 22 (100.0%) | 0 (0.0%) |
| Utilities | 0 (0.0%) | 0 (0.0%) |
| Information | 0 (0.0%) | 0 (0.0%) |
| Finance & Insurance | 32 (68.1%) | 15 (31.9%) |
| Real Estate, Rental & Leasing | 0 (0.0%) | 20 (100.0%) |
| Professional & Scientific | 25 (100.0%) | 0 (0.0%) |
| Enterprise Management | 0 (0.0%) | 0 (0.0%) |
| Administrative & Support | 52 (34.4%) | 99 (65.6%) |
| Educational Services | 27 (29.7%) | 64 (70.3%) |
| Health Care & Social Assistance | 128 (28.0%) | 330 (72.1%) |
| Arts, Entertainment & Recreation | 0 (0.0%) | 3 (100.0%) |
| Accommodation & Food Services | 203 (89.8%) | 23 (10.2%) |
| Public Administration | 25 (30.1%) | 58 (69.9%) |
| Total | 645 (49.3%) | 663 (50.7%) |
Education in Lake Belvedere Estates
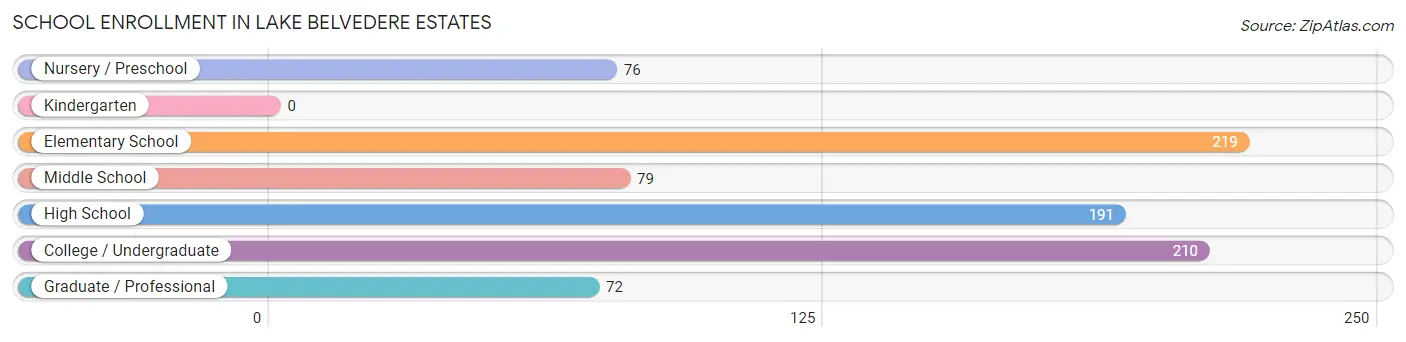
School Enrollment in Lake Belvedere Estates
The most common levels of schooling among the 847 students in Lake Belvedere Estates are elementary school (219 | 25.9%), college / undergraduate (210 | 24.8%), and high school (191 | 22.6%).
| School Level | # Students | % Students |
| Nursery / Preschool | 76 | 9.0% |
| Kindergarten | 0 | 0.0% |
| Elementary School | 219 | 25.9% |
| Middle School | 79 | 9.3% |
| High School | 191 | 22.6% |
| College / Undergraduate | 210 | 24.8% |
| Graduate / Professional | 72 | 8.5% |
| Total | 847 | 100.0% |
School Enrollment by Age by Funding Source in Lake Belvedere Estates
Out of a total of 847 students who are enrolled in schools in Lake Belvedere Estates, 108 (12.8%) attend a private institution, while the remaining 739 (87.2%) are enrolled in public schools. The age group of 10 to 14 year olds has the highest likelihood of being enrolled in private schools, with 40 (32.8% in the age bracket) enrolled. Conversely, the age group of 3 to 4 year olds has the lowest likelihood of being enrolled in a private school, with 76 (100.0% in the age bracket) attending a public institution.
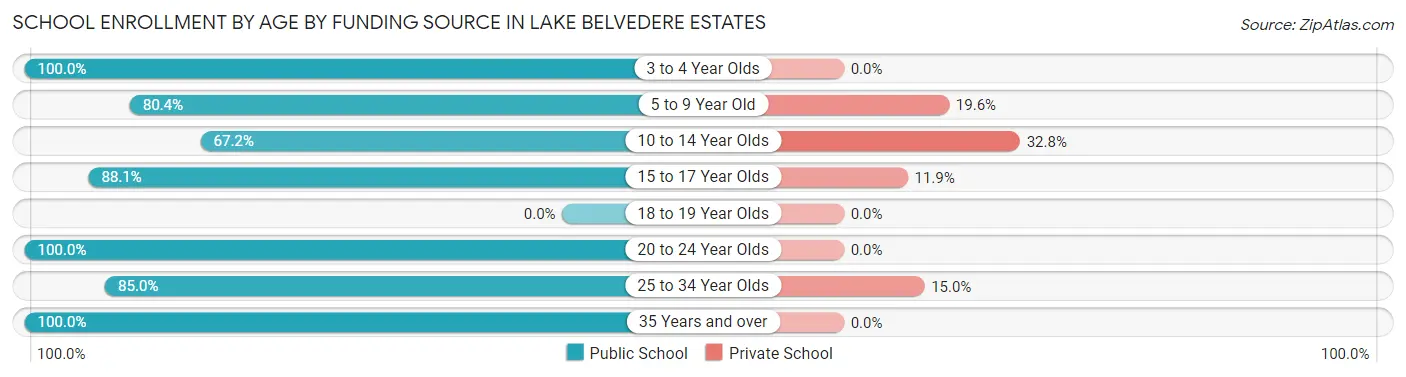
| Age Bracket | Public School | Private School |
| 3 to 4 Year Olds | 76 (100.0%) | 0 (0.0%) |
| 5 to 9 Year Old | 160 (80.4%) | 39 (19.6%) |
| 10 to 14 Year Olds | 82 (67.2%) | 40 (32.8%) |
| 15 to 17 Year Olds | 148 (88.1%) | 20 (11.9%) |
| 18 to 19 Year Olds | 0 (0.0%) | 0 (0.0%) |
| 20 to 24 Year Olds | 171 (100.0%) | 0 (0.0%) |
| 25 to 34 Year Olds | 51 (85.0%) | 9 (15.0%) |
| 35 Years and over | 51 (100.0%) | 0 (0.0%) |
| Total | 739 (87.2%) | 108 (12.8%) |
Educational Attainment by Field of Study in Lake Belvedere Estates
Business (87 | 27.9%), science & technology (78 | 25.0%), psychology (34 | 10.9%), liberal arts & history (34 | 10.9%), and education (31 | 9.9%) are the most common fields of study among 312 individuals in Lake Belvedere Estates who have obtained a bachelor's degree or higher.
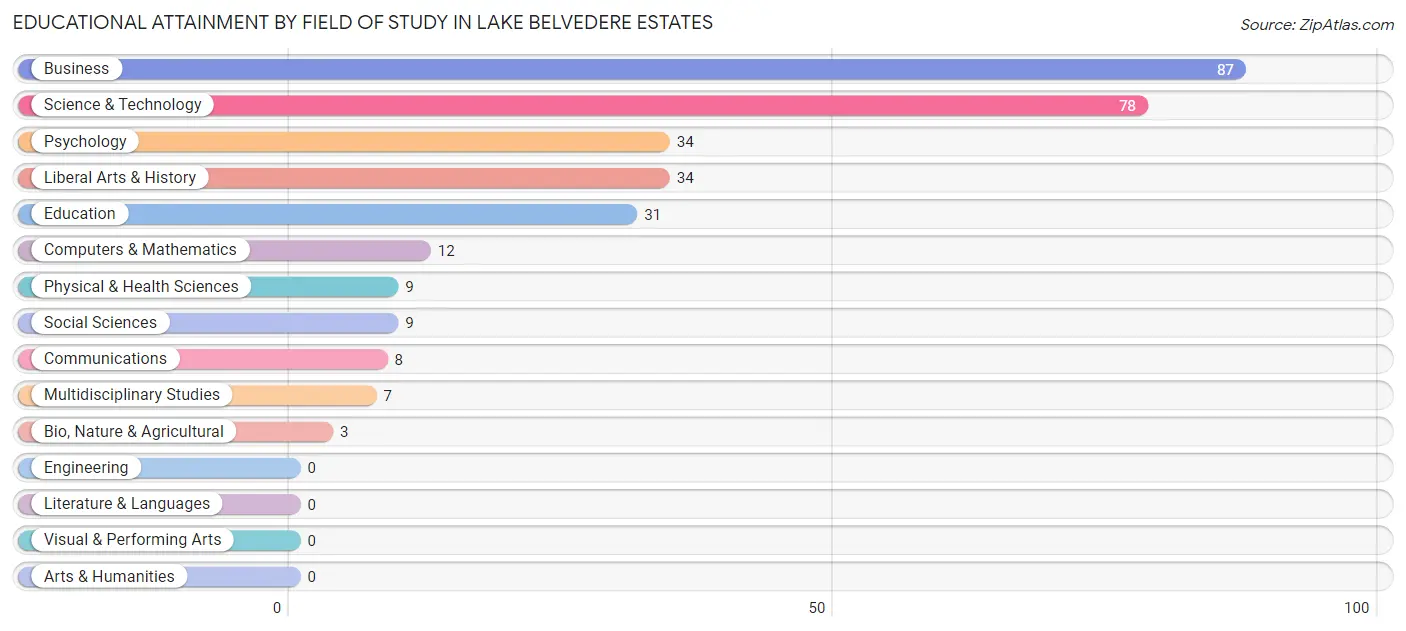
| Field of Study | # Graduates | % Graduates |
| Computers & Mathematics | 12 | 3.8% |
| Bio, Nature & Agricultural | 3 | 1.0% |
| Physical & Health Sciences | 9 | 2.9% |
| Psychology | 34 | 10.9% |
| Social Sciences | 9 | 2.9% |
| Engineering | 0 | 0.0% |
| Multidisciplinary Studies | 7 | 2.2% |
| Science & Technology | 78 | 25.0% |
| Business | 87 | 27.9% |
| Education | 31 | 9.9% |
| Literature & Languages | 0 | 0.0% |
| Liberal Arts & History | 34 | 10.9% |
| Visual & Performing Arts | 0 | 0.0% |
| Communications | 8 | 2.6% |
| Arts & Humanities | 0 | 0.0% |
| Total | 312 | 100.0% |
Transportation & Commute in Lake Belvedere Estates
Vehicle Availability by Sex in Lake Belvedere Estates
The most prevalent vehicle ownership categories in Lake Belvedere Estates are males with 4 vehicles (308, accounting for 49.5%) and females with 4 vehicles (178, making up 47.7%).
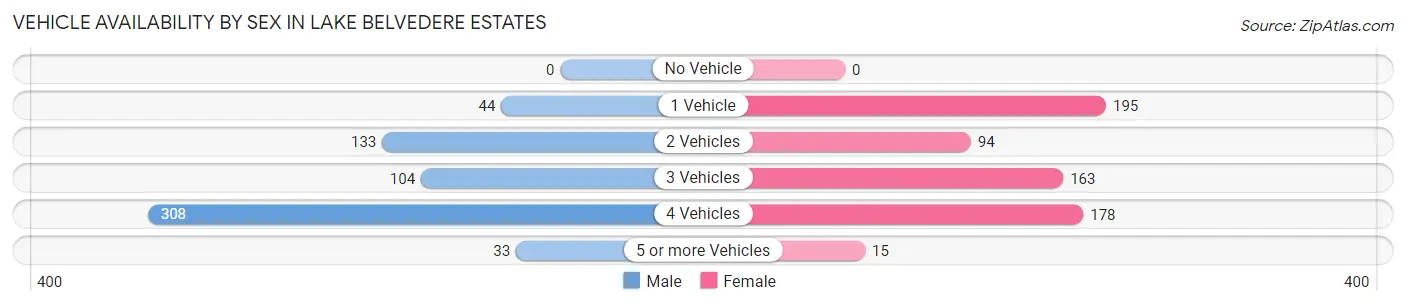
| Vehicles Available | Male | Female |
| No Vehicle | 0 (0.0%) | 0 (0.0%) |
| 1 Vehicle | 44 (7.1%) | 195 (30.2%) |
| 2 Vehicles | 133 (21.4%) | 94 (14.6%) |
| 3 Vehicles | 104 (16.7%) | 163 (25.3%) |
| 4 Vehicles | 308 (49.5%) | 178 (27.6%) |
| 5 or more Vehicles | 33 (5.3%) | 15 (2.3%) |
| Total | 622 (100.0%) | 645 (100.0%) |
Commute Time in Lake Belvedere Estates
The most frequently occuring commute durations in Lake Belvedere Estates are 30 to 34 minutes (421 commuters, 37.1%), 20 to 24 minutes (207 commuters, 18.2%), and 15 to 19 minutes (159 commuters, 14.0%).
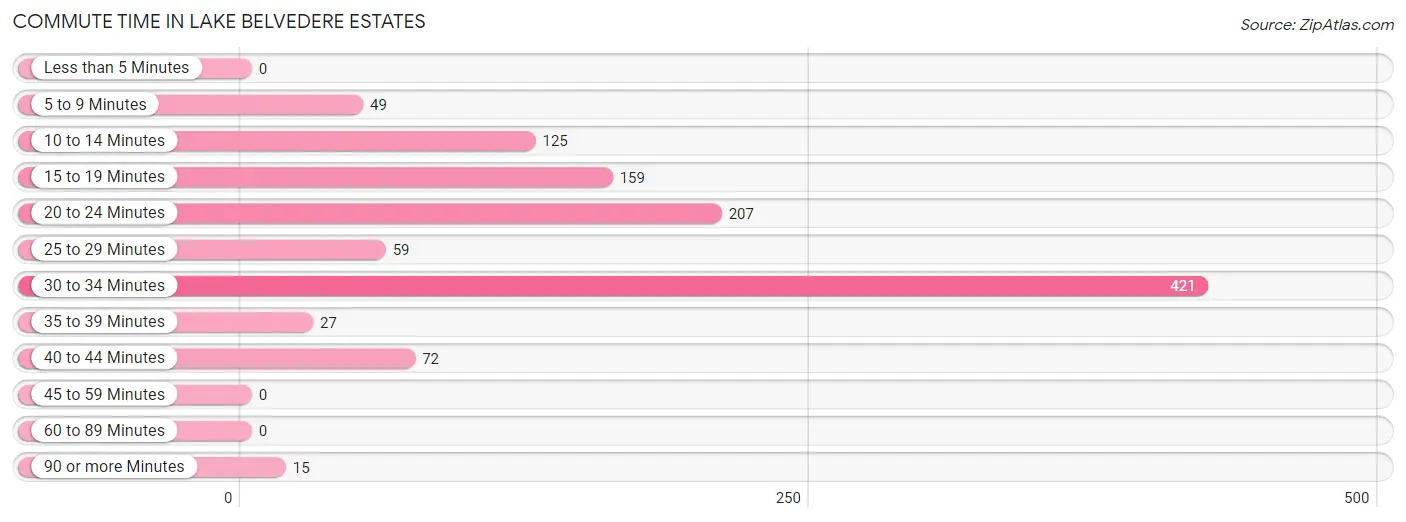
| Commute Time | # Commuters | % Commuters |
| Less than 5 Minutes | 0 | 0.0% |
| 5 to 9 Minutes | 49 | 4.3% |
| 10 to 14 Minutes | 125 | 11.0% |
| 15 to 19 Minutes | 159 | 14.0% |
| 20 to 24 Minutes | 207 | 18.2% |
| 25 to 29 Minutes | 59 | 5.2% |
| 30 to 34 Minutes | 421 | 37.1% |
| 35 to 39 Minutes | 27 | 2.4% |
| 40 to 44 Minutes | 72 | 6.4% |
| 45 to 59 Minutes | 0 | 0.0% |
| 60 to 89 Minutes | 0 | 0.0% |
| 90 or more Minutes | 15 | 1.3% |
Commute Time by Sex in Lake Belvedere Estates
The most common commute times in Lake Belvedere Estates are 30 to 34 minutes (234 commuters, 47.3%) for males and 30 to 34 minutes (187 commuters, 29.3%) for females.
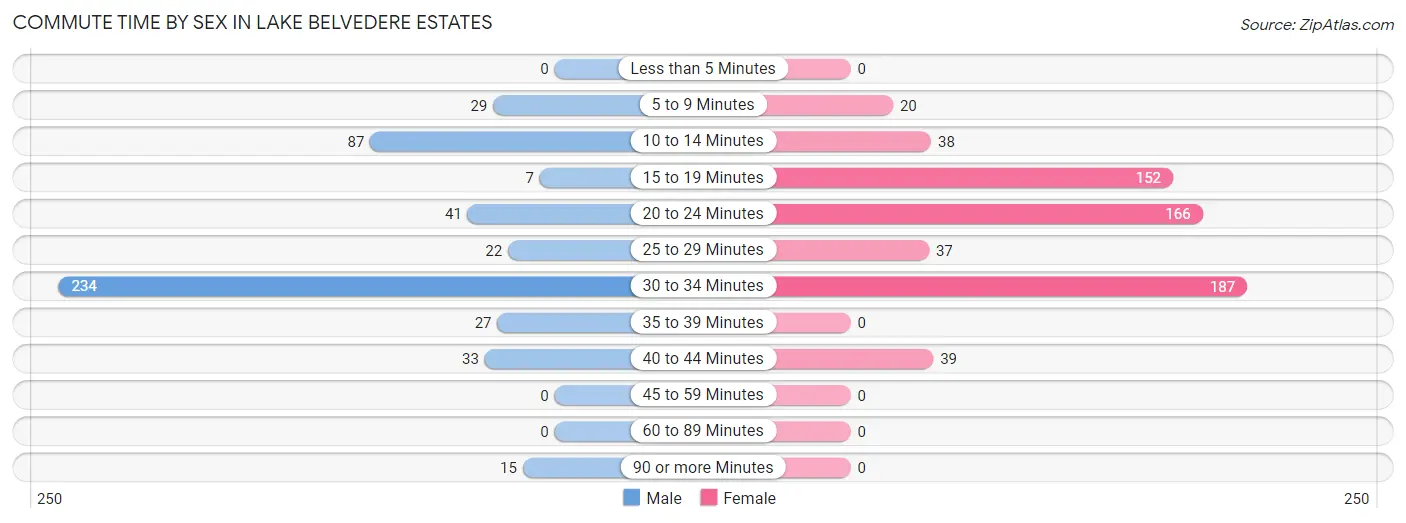
| Commute Time | Male | Female |
| Less than 5 Minutes | 0 (0.0%) | 0 (0.0%) |
| 5 to 9 Minutes | 29 (5.9%) | 20 (3.1%) |
| 10 to 14 Minutes | 87 (17.6%) | 38 (5.9%) |
| 15 to 19 Minutes | 7 (1.4%) | 152 (23.8%) |
| 20 to 24 Minutes | 41 (8.3%) | 166 (26.0%) |
| 25 to 29 Minutes | 22 (4.4%) | 37 (5.8%) |
| 30 to 34 Minutes | 234 (47.3%) | 187 (29.3%) |
| 35 to 39 Minutes | 27 (5.4%) | 0 (0.0%) |
| 40 to 44 Minutes | 33 (6.7%) | 39 (6.1%) |
| 45 to 59 Minutes | 0 (0.0%) | 0 (0.0%) |
| 60 to 89 Minutes | 0 (0.0%) | 0 (0.0%) |
| 90 or more Minutes | 15 (3.0%) | 0 (0.0%) |
Time of Departure to Work by Sex in Lake Belvedere Estates
The most frequent times of departure to work in Lake Belvedere Estates are 9:00 AM to 9:59 AM (133, 26.9%) for males and 9:00 AM to 9:59 AM (180, 28.2%) for females.
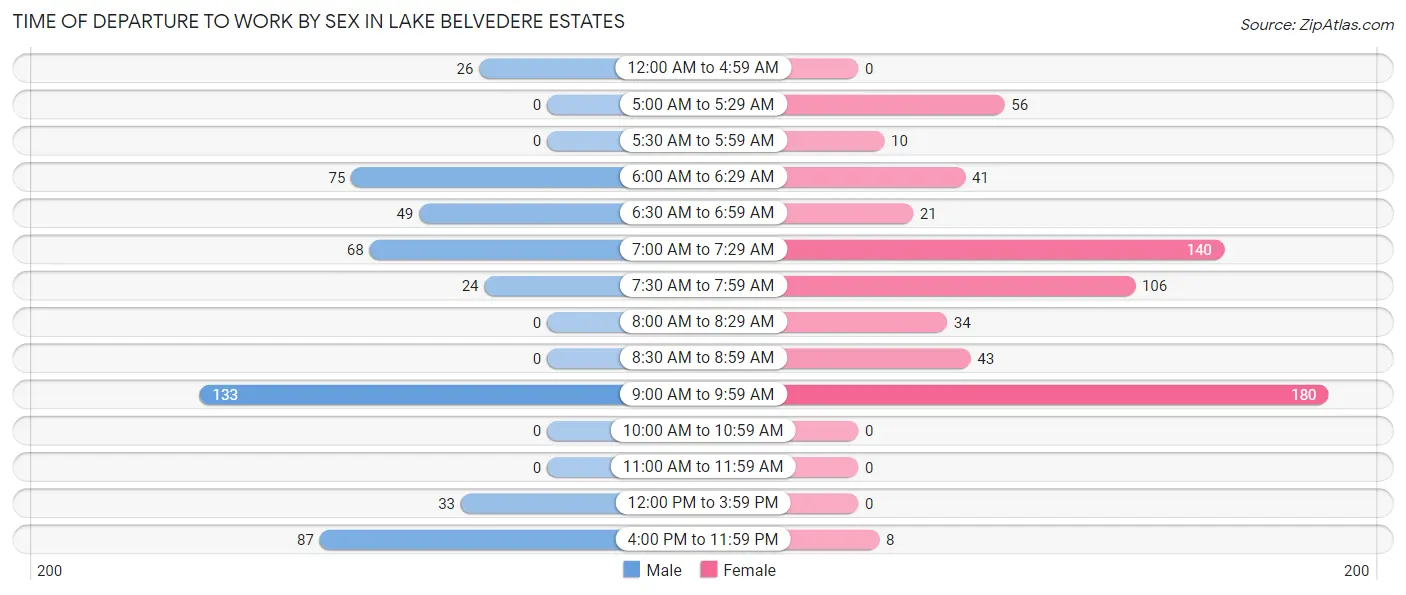
| Time of Departure | Male | Female |
| 12:00 AM to 4:59 AM | 26 (5.2%) | 0 (0.0%) |
| 5:00 AM to 5:29 AM | 0 (0.0%) | 56 (8.8%) |
| 5:30 AM to 5:59 AM | 0 (0.0%) | 10 (1.6%) |
| 6:00 AM to 6:29 AM | 75 (15.1%) | 41 (6.4%) |
| 6:30 AM to 6:59 AM | 49 (9.9%) | 21 (3.3%) |
| 7:00 AM to 7:29 AM | 68 (13.7%) | 140 (21.9%) |
| 7:30 AM to 7:59 AM | 24 (4.9%) | 106 (16.6%) |
| 8:00 AM to 8:29 AM | 0 (0.0%) | 34 (5.3%) |
| 8:30 AM to 8:59 AM | 0 (0.0%) | 43 (6.7%) |
| 9:00 AM to 9:59 AM | 133 (26.9%) | 180 (28.2%) |
| 10:00 AM to 10:59 AM | 0 (0.0%) | 0 (0.0%) |
| 11:00 AM to 11:59 AM | 0 (0.0%) | 0 (0.0%) |
| 12:00 PM to 3:59 PM | 33 (6.7%) | 0 (0.0%) |
| 4:00 PM to 11:59 PM | 87 (17.6%) | 8 (1.3%) |
| Total | 495 (100.0%) | 639 (100.0%) |
Housing Occupancy in Lake Belvedere Estates
Occupancy by Ownership in Lake Belvedere Estates
Of the total 662 dwellings in Lake Belvedere Estates, owner-occupied units account for 619 (93.5%), while renter-occupied units make up 43 (6.5%).
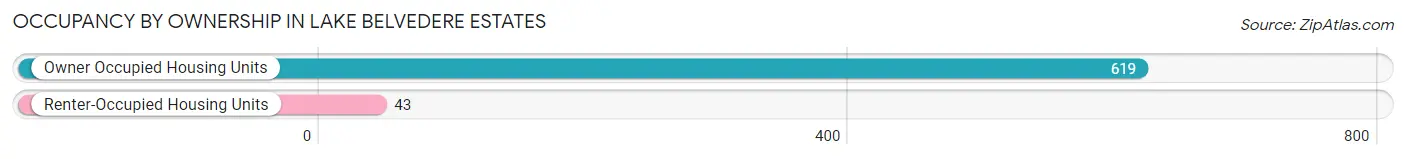
| Occupancy | # Housing Units | % Housing Units |
| Owner Occupied Housing Units | 619 | 93.5% |
| Renter-Occupied Housing Units | 43 | 6.5% |
| Total Occupied Housing Units | 662 | 100.0% |
Occupancy by Household Size in Lake Belvedere Estates
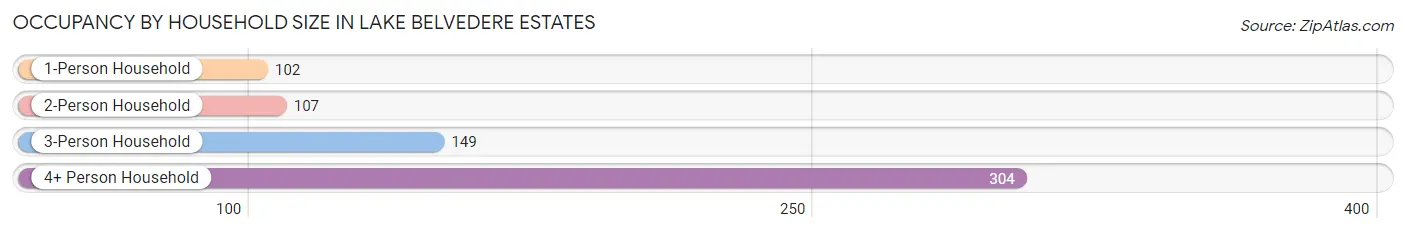
| Household Size | # Housing Units | % Housing Units |
| 1-Person Household | 102 | 15.4% |
| 2-Person Household | 107 | 16.2% |
| 3-Person Household | 149 | 22.5% |
| 4+ Person Household | 304 | 45.9% |
| Total Housing Units | 662 | 100.0% |
Occupancy by Ownership by Household Size in Lake Belvedere Estates
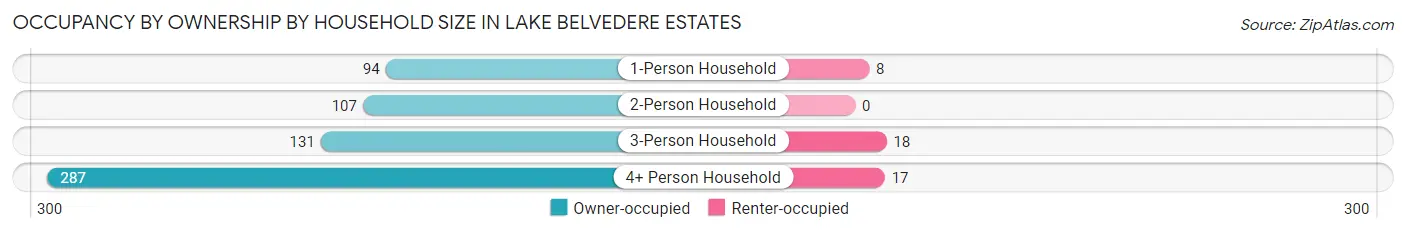
| Household Size | Owner-occupied | Renter-occupied |
| 1-Person Household | 94 (92.2%) | 8 (7.8%) |
| 2-Person Household | 107 (100.0%) | 0 (0.0%) |
| 3-Person Household | 131 (87.9%) | 18 (12.1%) |
| 4+ Person Household | 287 (94.4%) | 17 (5.6%) |
| Total Housing Units | 619 (93.5%) | 43 (6.5%) |
Occupancy by Educational Attainment in Lake Belvedere Estates
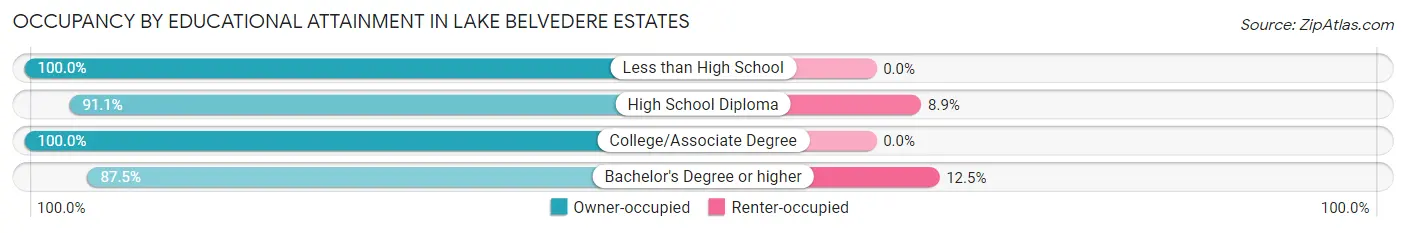
| Household Size | Owner-occupied | Renter-occupied |
| Less than High School | 57 (100.0%) | 0 (0.0%) |
| High School Diploma | 256 (91.1%) | 25 (8.9%) |
| College/Associate Degree | 180 (100.0%) | 0 (0.0%) |
| Bachelor's Degree or higher | 126 (87.5%) | 18 (12.5%) |
Occupancy by Age of Householder in Lake Belvedere Estates
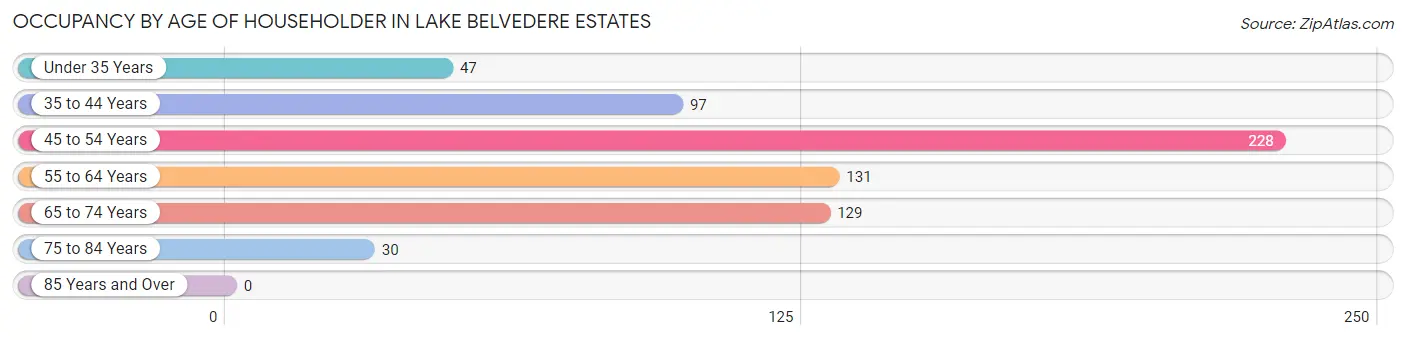
| Age Bracket | # Households | % Households |
| Under 35 Years | 47 | 7.1% |
| 35 to 44 Years | 97 | 14.6% |
| 45 to 54 Years | 228 | 34.4% |
| 55 to 64 Years | 131 | 19.8% |
| 65 to 74 Years | 129 | 19.5% |
| 75 to 84 Years | 30 | 4.5% |
| 85 Years and Over | 0 | 0.0% |
| Total | 662 | 100.0% |
Housing Finances in Lake Belvedere Estates
Median Income by Occupancy in Lake Belvedere Estates
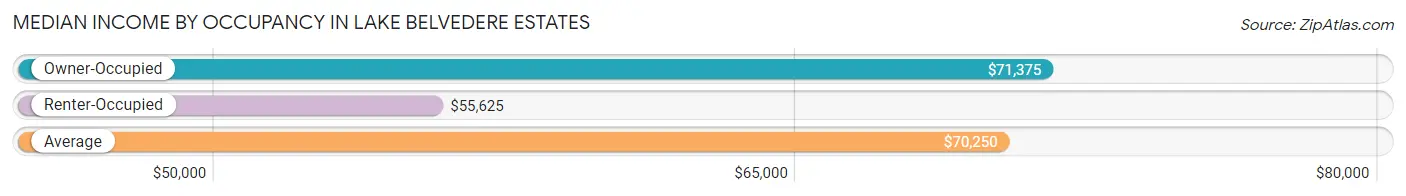
| Occupancy Type | # Households | Median Income |
| Owner-Occupied | 619 (93.5%) | $71,375 |
| Renter-Occupied | 43 (6.5%) | $55,625 |
| Average | 662 (100.0%) | $70,250 |
Occupancy by Householder Income Bracket in Lake Belvedere Estates
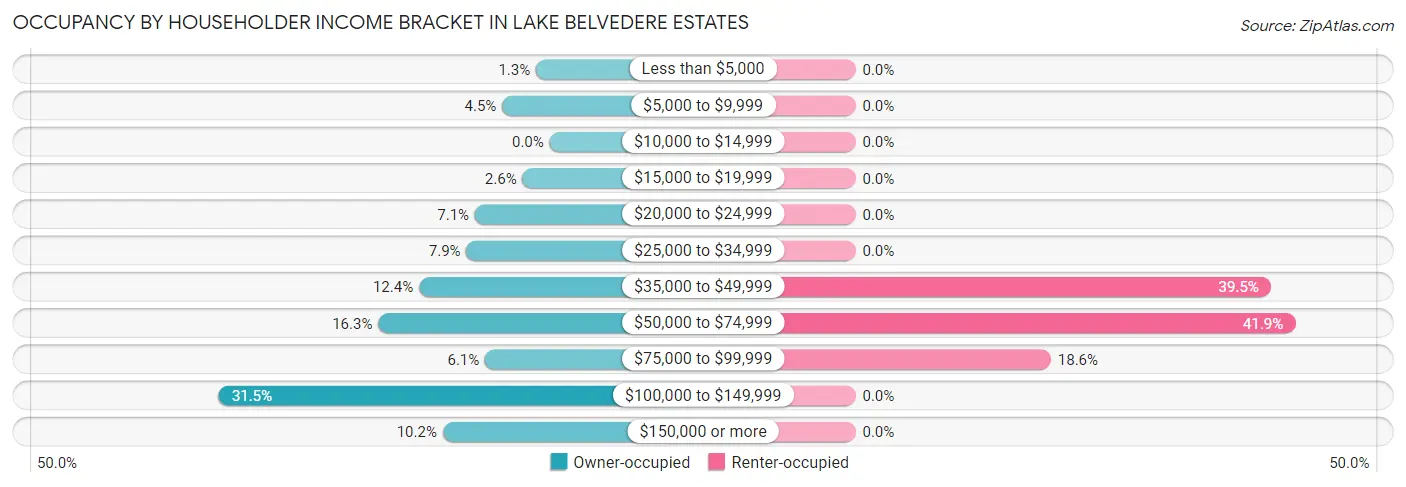
| Income Bracket | Owner-occupied | Renter-occupied |
| Less than $5,000 | 8 (1.3%) | 0 (0.0%) |
| $5,000 to $9,999 | 28 (4.5%) | 0 (0.0%) |
| $10,000 to $14,999 | 0 (0.0%) | 0 (0.0%) |
| $15,000 to $19,999 | 16 (2.6%) | 0 (0.0%) |
| $20,000 to $24,999 | 44 (7.1%) | 0 (0.0%) |
| $25,000 to $34,999 | 49 (7.9%) | 0 (0.0%) |
| $35,000 to $49,999 | 77 (12.4%) | 17 (39.5%) |
| $50,000 to $74,999 | 101 (16.3%) | 18 (41.9%) |
| $75,000 to $99,999 | 38 (6.1%) | 8 (18.6%) |
| $100,000 to $149,999 | 195 (31.5%) | 0 (0.0%) |
| $150,000 or more | 63 (10.2%) | 0 (0.0%) |
| Total | 619 (100.0%) | 43 (100.0%) |
Monthly Housing Cost Tiers in Lake Belvedere Estates
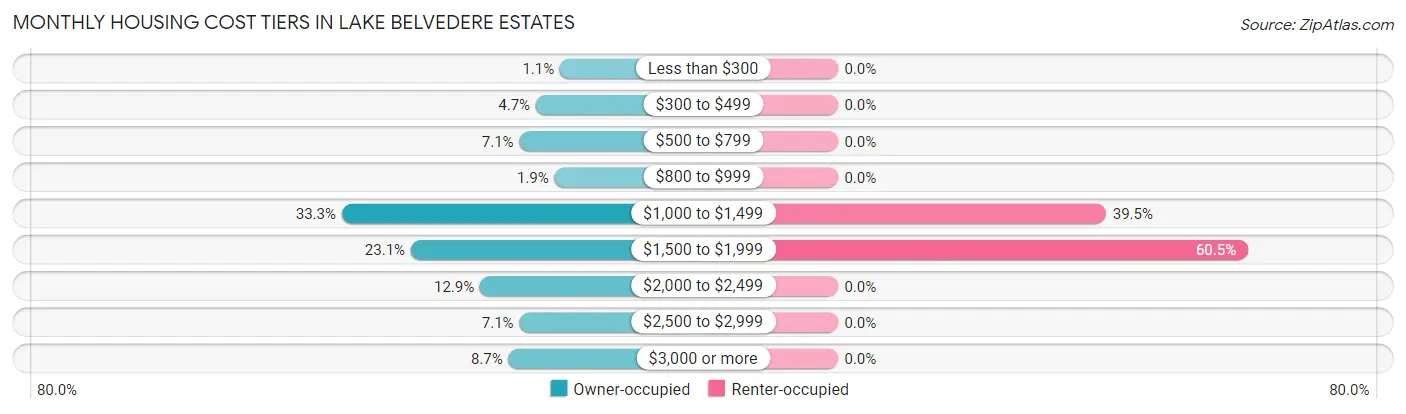
| Monthly Cost | Owner-occupied | Renter-occupied |
| Less than $300 | 7 (1.1%) | 0 (0.0%) |
| $300 to $499 | 29 (4.7%) | 0 (0.0%) |
| $500 to $799 | 44 (7.1%) | 0 (0.0%) |
| $800 to $999 | 12 (1.9%) | 0 (0.0%) |
| $1,000 to $1,499 | 206 (33.3%) | 17 (39.5%) |
| $1,500 to $1,999 | 143 (23.1%) | 26 (60.5%) |
| $2,000 to $2,499 | 80 (12.9%) | 0 (0.0%) |
| $2,500 to $2,999 | 44 (7.1%) | 0 (0.0%) |
| $3,000 or more | 54 (8.7%) | 0 (0.0%) |
| Total | 619 (100.0%) | 43 (100.0%) |
Physical Housing Characteristics in Lake Belvedere Estates
Housing Structures in Lake Belvedere Estates
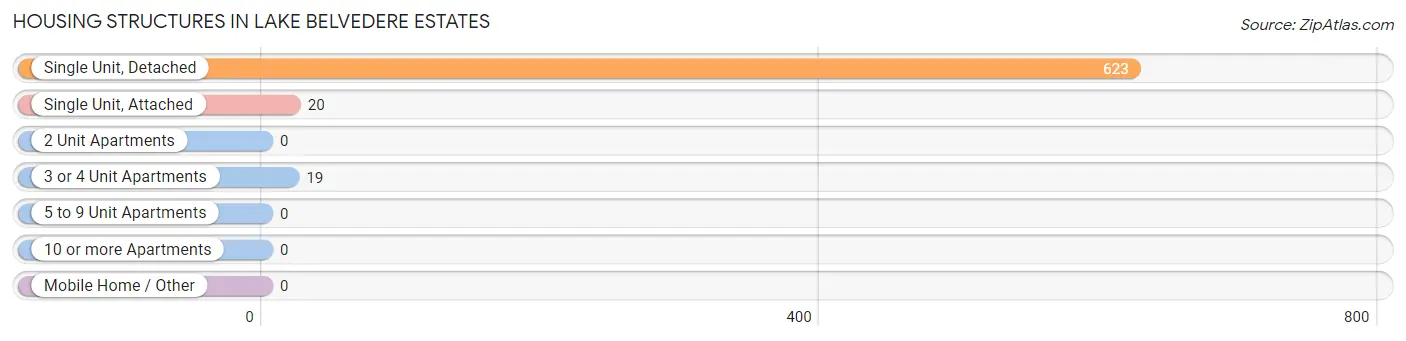
| Structure Type | # Housing Units | % Housing Units |
| Single Unit, Detached | 623 | 94.1% |
| Single Unit, Attached | 20 | 3.0% |
| 2 Unit Apartments | 0 | 0.0% |
| 3 or 4 Unit Apartments | 19 | 2.9% |
| 5 to 9 Unit Apartments | 0 | 0.0% |
| 10 or more Apartments | 0 | 0.0% |
| Mobile Home / Other | 0 | 0.0% |
| Total | 662 | 100.0% |
Housing Structures by Occupancy in Lake Belvedere Estates
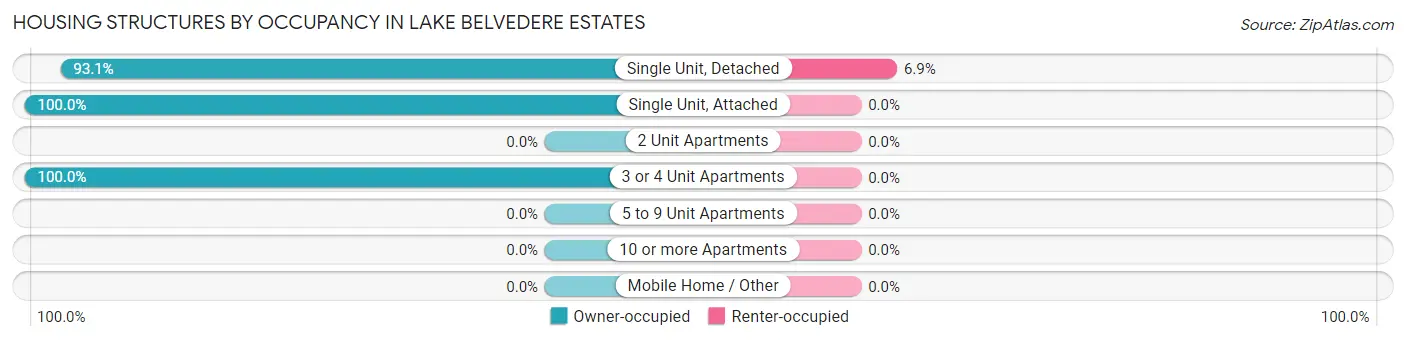
| Structure Type | Owner-occupied | Renter-occupied |
| Single Unit, Detached | 580 (93.1%) | 43 (6.9%) |
| Single Unit, Attached | 20 (100.0%) | 0 (0.0%) |
| 2 Unit Apartments | 0 (0.0%) | 0 (0.0%) |
| 3 or 4 Unit Apartments | 19 (100.0%) | 0 (0.0%) |
| 5 to 9 Unit Apartments | 0 (0.0%) | 0 (0.0%) |
| 10 or more Apartments | 0 (0.0%) | 0 (0.0%) |
| Mobile Home / Other | 0 (0.0%) | 0 (0.0%) |
| Total | 619 (93.5%) | 43 (6.5%) |
Housing Structures by Number of Rooms in Lake Belvedere Estates
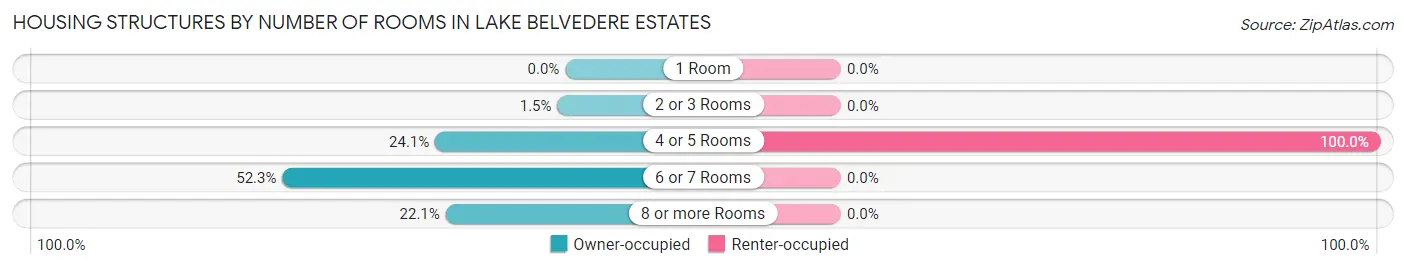
| Number of Rooms | Owner-occupied | Renter-occupied |
| 1 Room | 0 (0.0%) | 0 (0.0%) |
| 2 or 3 Rooms | 9 (1.5%) | 0 (0.0%) |
| 4 or 5 Rooms | 149 (24.1%) | 43 (100.0%) |
| 6 or 7 Rooms | 324 (52.3%) | 0 (0.0%) |
| 8 or more Rooms | 137 (22.1%) | 0 (0.0%) |
| Total | 619 (100.0%) | 43 (100.0%) |
Housing Structure by Heating Type in Lake Belvedere Estates
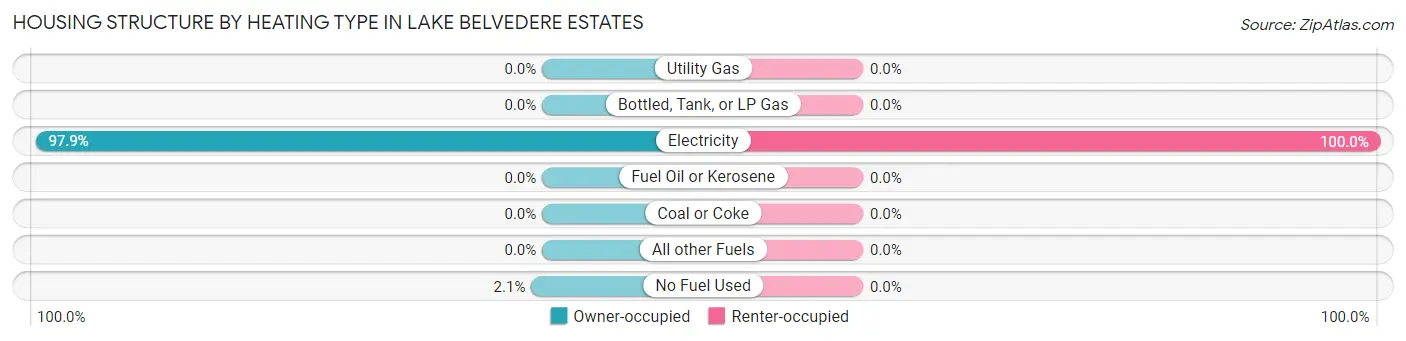
| Heating Type | Owner-occupied | Renter-occupied |
| Utility Gas | 0 (0.0%) | 0 (0.0%) |
| Bottled, Tank, or LP Gas | 0 (0.0%) | 0 (0.0%) |
| Electricity | 606 (97.9%) | 43 (100.0%) |
| Fuel Oil or Kerosene | 0 (0.0%) | 0 (0.0%) |
| Coal or Coke | 0 (0.0%) | 0 (0.0%) |
| All other Fuels | 0 (0.0%) | 0 (0.0%) |
| No Fuel Used | 13 (2.1%) | 0 (0.0%) |
| Total | 619 (100.0%) | 43 (100.0%) |
Household Vehicle Usage in Lake Belvedere Estates
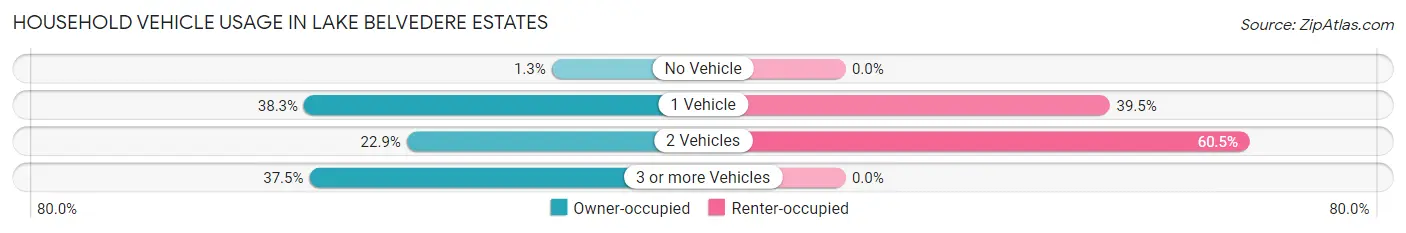
| Vehicles per Household | Owner-occupied | Renter-occupied |
| No Vehicle | 8 (1.3%) | 0 (0.0%) |
| 1 Vehicle | 237 (38.3%) | 17 (39.5%) |
| 2 Vehicles | 142 (22.9%) | 26 (60.5%) |
| 3 or more Vehicles | 232 (37.5%) | 0 (0.0%) |
| Total | 619 (100.0%) | 43 (100.0%) |
Real Estate & Mortgages in Lake Belvedere Estates
Real Estate and Mortgage Overview in Lake Belvedere Estates
| Characteristic | Without Mortgage | With Mortgage |
| Housing Units | 80 | 539 |
| Median Property Value | $208,300 | $327,200 |
| Median Household Income | - | - |
| Monthly Housing Costs | $616 | $54 |
| Real Estate Taxes | $3,500 | $96 |
Property Value by Mortgage Status in Lake Belvedere Estates
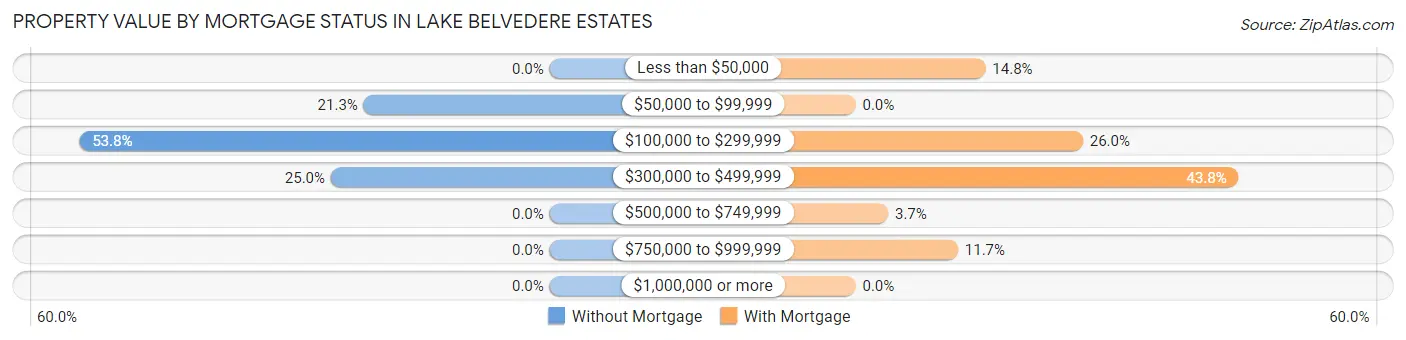
| Property Value | Without Mortgage | With Mortgage |
| Less than $50,000 | 0 (0.0%) | 80 (14.8%) |
| $50,000 to $99,999 | 17 (21.2%) | 0 (0.0%) |
| $100,000 to $299,999 | 43 (53.7%) | 140 (26.0%) |
| $300,000 to $499,999 | 20 (25.0%) | 236 (43.8%) |
| $500,000 to $749,999 | 0 (0.0%) | 20 (3.7%) |
| $750,000 to $999,999 | 0 (0.0%) | 63 (11.7%) |
| $1,000,000 or more | 0 (0.0%) | 0 (0.0%) |
| Total | 80 (100.0%) | 539 (100.0%) |
Household Income by Mortgage Status in Lake Belvedere Estates
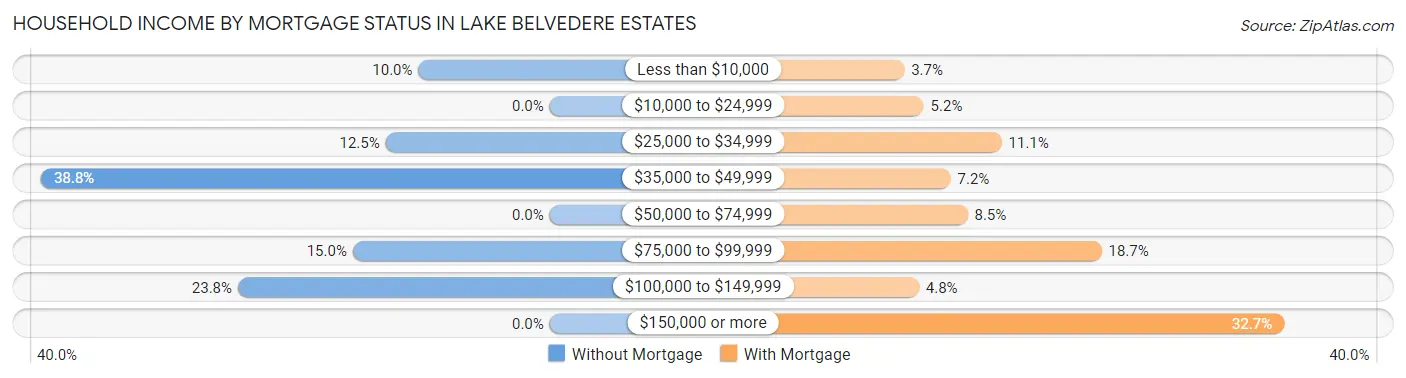
| Household Income | Without Mortgage | With Mortgage |
| Less than $10,000 | 8 (10.0%) | 20 (3.7%) |
| $10,000 to $24,999 | 0 (0.0%) | 28 (5.2%) |
| $25,000 to $34,999 | 10 (12.5%) | 60 (11.1%) |
| $35,000 to $49,999 | 31 (38.8%) | 39 (7.2%) |
| $50,000 to $74,999 | 0 (0.0%) | 46 (8.5%) |
| $75,000 to $99,999 | 12 (15.0%) | 101 (18.7%) |
| $100,000 to $149,999 | 19 (23.7%) | 26 (4.8%) |
| $150,000 or more | 0 (0.0%) | 176 (32.7%) |
| Total | 80 (100.0%) | 539 (100.0%) |
Property Value to Household Income Ratio in Lake Belvedere Estates
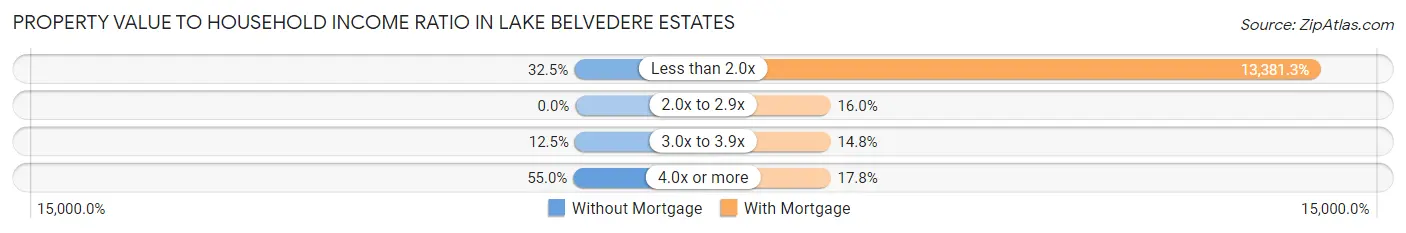
| Value-to-Income Ratio | Without Mortgage | With Mortgage |
| Less than 2.0x | 26 (32.5%) | 72,125 (13,381.3%) |
| 2.0x to 2.9x | 0 (0.0%) | 86 (16.0%) |
| 3.0x to 3.9x | 10 (12.5%) | 80 (14.8%) |
| 4.0x or more | 44 (55.0%) | 96 (17.8%) |
| Total | 80 (100.0%) | 539 (100.0%) |
Real Estate Taxes by Mortgage Status in Lake Belvedere Estates
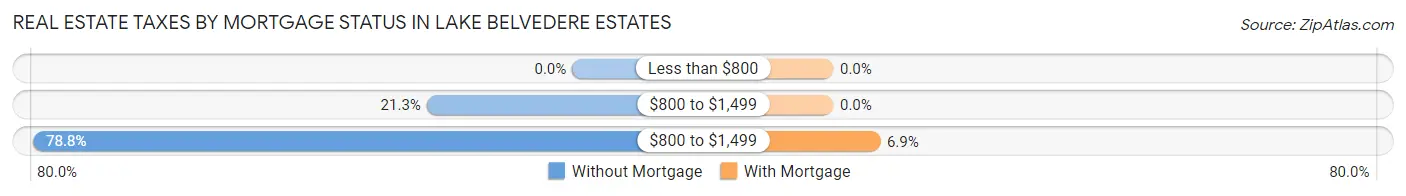
| Property Taxes | Without Mortgage | With Mortgage |
| Less than $800 | 0 (0.0%) | 0 (0.0%) |
| $800 to $1,499 | 17 (21.2%) | 0 (0.0%) |
| $800 to $1,499 | 63 (78.7%) | 37 (6.9%) |
| Total | 80 (100.0%) | 539 (100.0%) |
Health & Disability in Lake Belvedere Estates
Health Insurance Coverage by Age in Lake Belvedere Estates
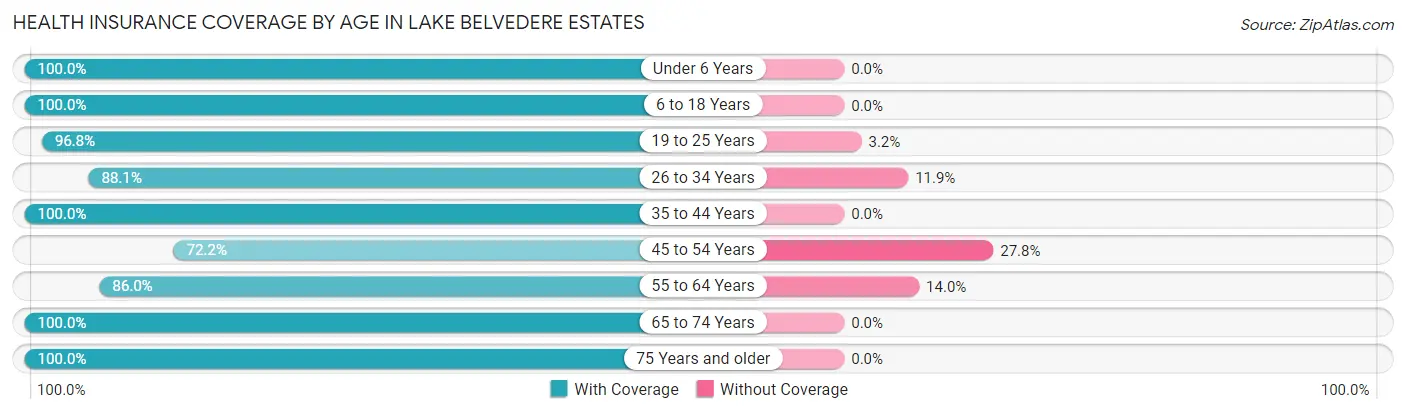
| Age Bracket | With Coverage | Without Coverage |
| Under 6 Years | 278 (100.0%) | 0 (0.0%) |
| 6 to 18 Years | 668 (100.0%) | 0 (0.0%) |
| 19 to 25 Years | 453 (96.8%) | 15 (3.2%) |
| 26 to 34 Years | 266 (88.1%) | 36 (11.9%) |
| 35 to 44 Years | 199 (100.0%) | 0 (0.0%) |
| 45 to 54 Years | 247 (72.2%) | 95 (27.8%) |
| 55 to 64 Years | 228 (86.0%) | 37 (14.0%) |
| 65 to 74 Years | 179 (100.0%) | 0 (0.0%) |
| 75 Years and older | 166 (100.0%) | 0 (0.0%) |
| Total | 2,684 (93.6%) | 183 (6.4%) |
Health Insurance Coverage by Citizenship Status in Lake Belvedere Estates
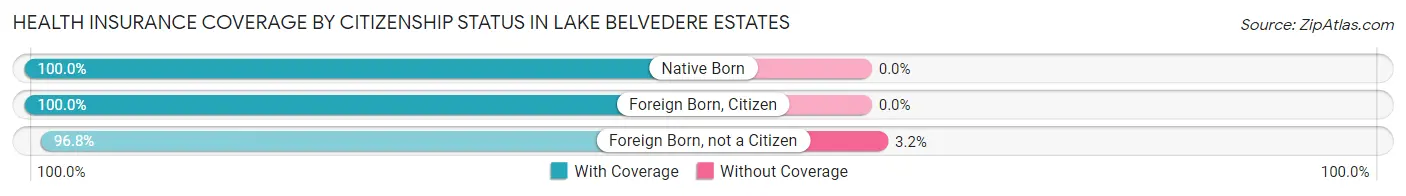
| Citizenship Status | With Coverage | Without Coverage |
| Native Born | 278 (100.0%) | 0 (0.0%) |
| Foreign Born, Citizen | 668 (100.0%) | 0 (0.0%) |
| Foreign Born, not a Citizen | 453 (96.8%) | 15 (3.2%) |
Health Insurance Coverage by Household Income in Lake Belvedere Estates
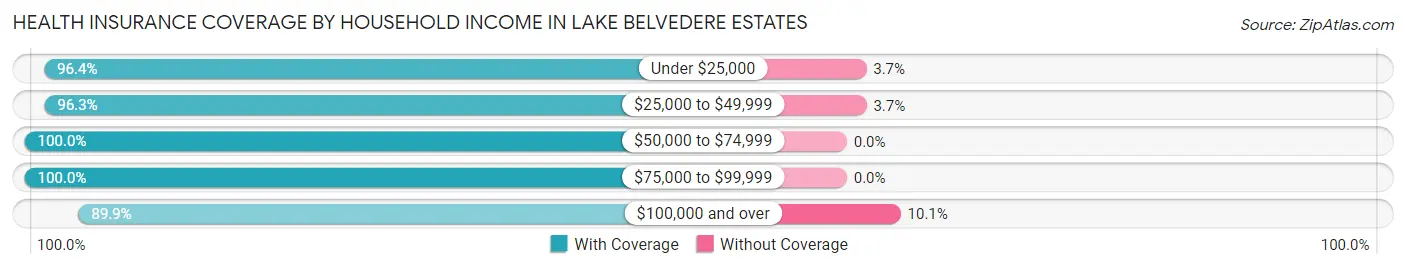
| Household Income | With Coverage | Without Coverage |
| Under $25,000 | 211 (96.4%) | 8 (3.6%) |
| $25,000 to $49,999 | 365 (96.3%) | 14 (3.7%) |
| $50,000 to $74,999 | 501 (100.0%) | 0 (0.0%) |
| $75,000 to $99,999 | 164 (100.0%) | 0 (0.0%) |
| $100,000 and over | 1,437 (89.9%) | 161 (10.1%) |
Public vs Private Health Insurance Coverage by Age in Lake Belvedere Estates
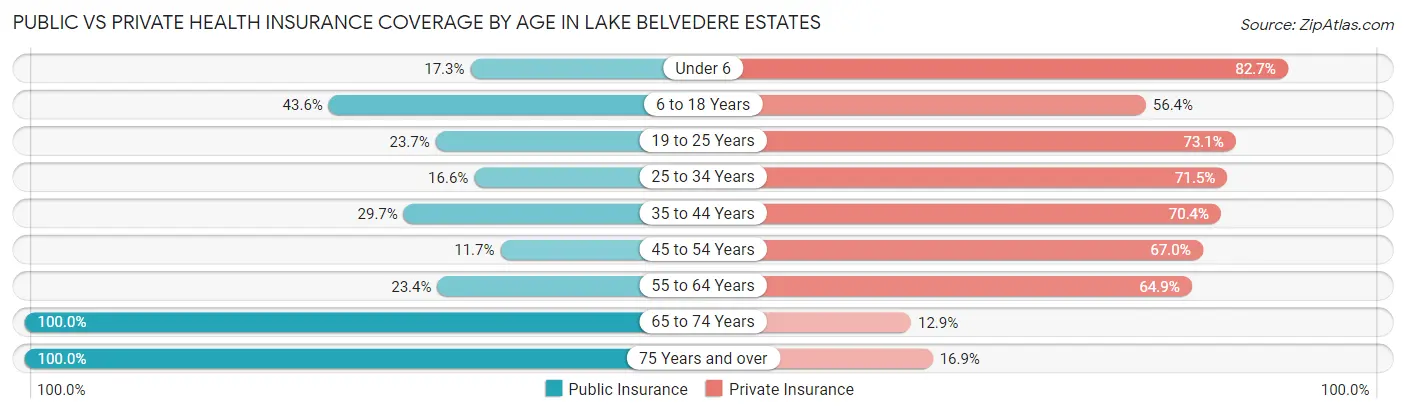
| Age Bracket | Public Insurance | Private Insurance |
| Under 6 | 48 (17.3%) | 230 (82.7%) |
| 6 to 18 Years | 291 (43.6%) | 377 (56.4%) |
| 19 to 25 Years | 111 (23.7%) | 342 (73.1%) |
| 25 to 34 Years | 50 (16.6%) | 216 (71.5%) |
| 35 to 44 Years | 59 (29.6%) | 140 (70.4%) |
| 45 to 54 Years | 40 (11.7%) | 229 (67.0%) |
| 55 to 64 Years | 62 (23.4%) | 172 (64.9%) |
| 65 to 74 Years | 179 (100.0%) | 23 (12.9%) |
| 75 Years and over | 166 (100.0%) | 28 (16.9%) |
| Total | 1,006 (35.1%) | 1,757 (61.3%) |
Disability Status by Sex by Age in Lake Belvedere Estates
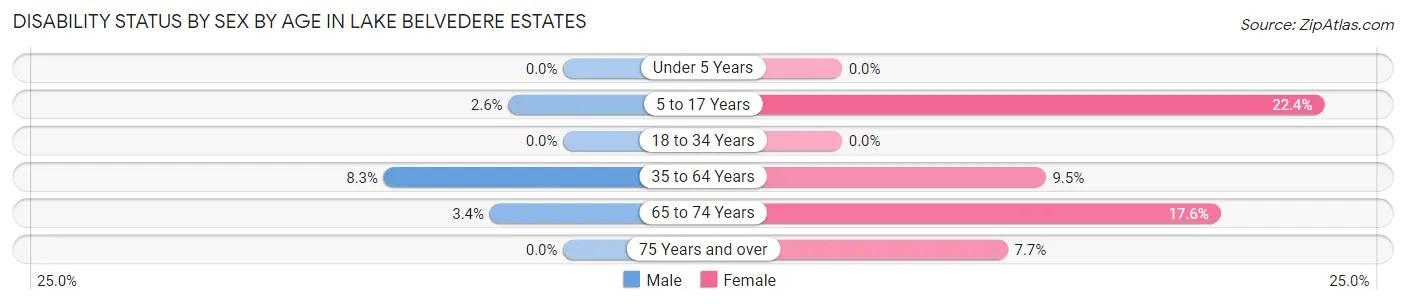
| Age Bracket | Male | Female |
| Under 5 Years | 0 (0.0%) | 0 (0.0%) |
| 5 to 17 Years | 7 (2.5%) | 88 (22.4%) |
| 18 to 34 Years | 0 (0.0%) | 0 (0.0%) |
| 35 to 64 Years | 31 (8.3%) | 41 (9.5%) |
| 65 to 74 Years | 3 (3.4%) | 16 (17.6%) |
| 75 Years and over | 0 (0.0%) | 12 (7.7%) |
Disability Class by Sex by Age in Lake Belvedere Estates
Disability Class: Hearing Difficulty
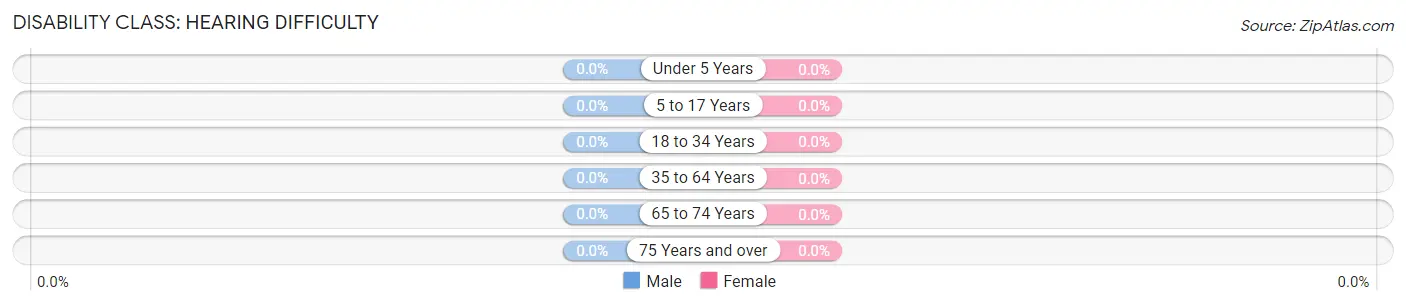
| Age Bracket | Male | Female |
| Under 5 Years | 0 (0.0%) | 0 (0.0%) |
| 5 to 17 Years | 0 (0.0%) | 0 (0.0%) |
| 18 to 34 Years | 0 (0.0%) | 0 (0.0%) |
| 35 to 64 Years | 0 (0.0%) | 0 (0.0%) |
| 65 to 74 Years | 0 (0.0%) | 0 (0.0%) |
| 75 Years and over | 0 (0.0%) | 0 (0.0%) |
Disability Class: Vision Difficulty
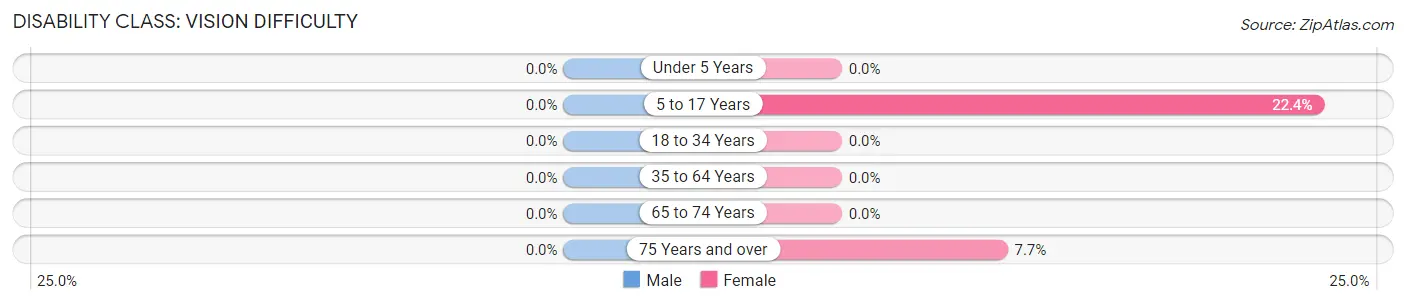
| Age Bracket | Male | Female |
| Under 5 Years | 0 (0.0%) | 0 (0.0%) |
| 5 to 17 Years | 0 (0.0%) | 88 (22.4%) |
| 18 to 34 Years | 0 (0.0%) | 0 (0.0%) |
| 35 to 64 Years | 0 (0.0%) | 0 (0.0%) |
| 65 to 74 Years | 0 (0.0%) | 0 (0.0%) |
| 75 Years and over | 0 (0.0%) | 12 (7.7%) |
Disability Class: Cognitive Difficulty
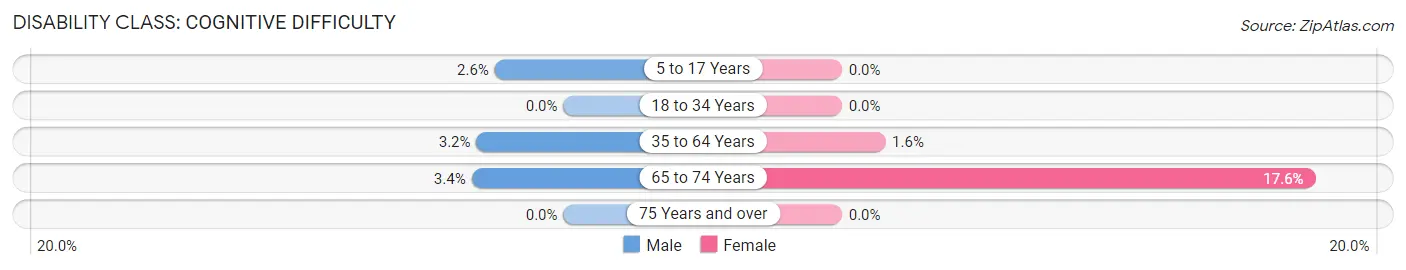
| Age Bracket | Male | Female |
| 5 to 17 Years | 7 (2.5%) | 0 (0.0%) |
| 18 to 34 Years | 0 (0.0%) | 0 (0.0%) |
| 35 to 64 Years | 12 (3.2%) | 7 (1.6%) |
| 65 to 74 Years | 3 (3.4%) | 16 (17.6%) |
| 75 Years and over | 0 (0.0%) | 0 (0.0%) |
Disability Class: Ambulatory Difficulty
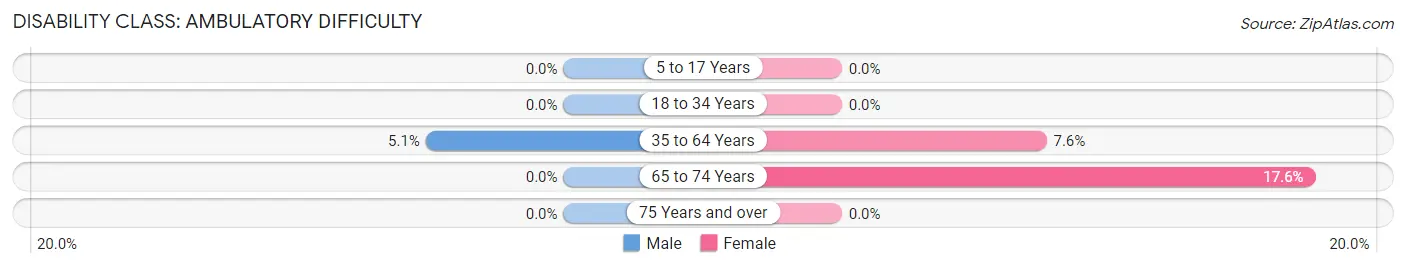
| Age Bracket | Male | Female |
| 5 to 17 Years | 0 (0.0%) | 0 (0.0%) |
| 18 to 34 Years | 0 (0.0%) | 0 (0.0%) |
| 35 to 64 Years | 19 (5.1%) | 33 (7.6%) |
| 65 to 74 Years | 0 (0.0%) | 16 (17.6%) |
| 75 Years and over | 0 (0.0%) | 0 (0.0%) |
Disability Class: Self-Care Difficulty
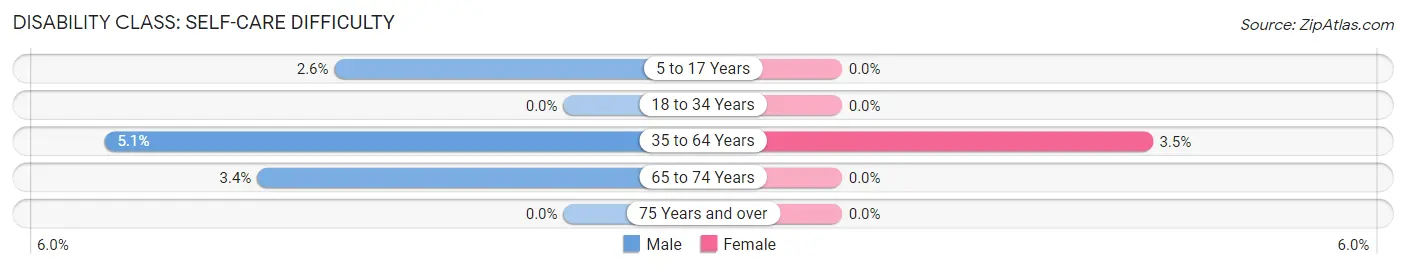
| Age Bracket | Male | Female |
| 5 to 17 Years | 7 (2.5%) | 0 (0.0%) |
| 18 to 34 Years | 0 (0.0%) | 0 (0.0%) |
| 35 to 64 Years | 19 (5.1%) | 15 (3.5%) |
| 65 to 74 Years | 3 (3.4%) | 0 (0.0%) |
| 75 Years and over | 0 (0.0%) | 0 (0.0%) |
Technology Access in Lake Belvedere Estates
Computing Device Access in Lake Belvedere Estates
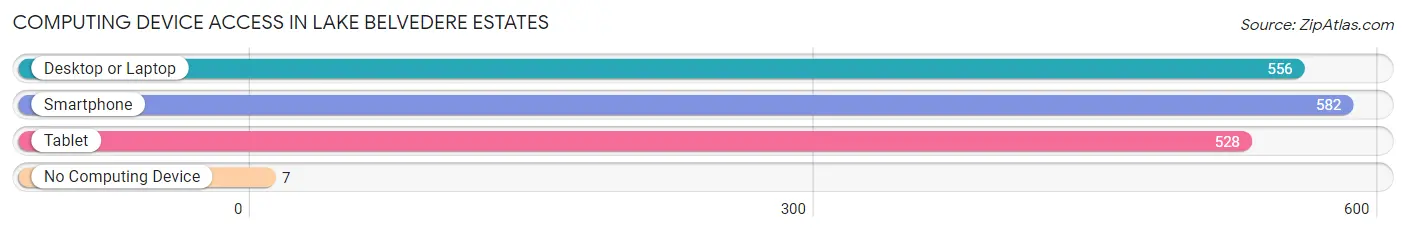
| Device Type | # Households | % Households |
| Desktop or Laptop | 556 | 84.0% |
| Smartphone | 582 | 87.9% |
| Tablet | 528 | 79.8% |
| No Computing Device | 7 | 1.1% |
| Total | 662 | 100.0% |
Internet Access in Lake Belvedere Estates
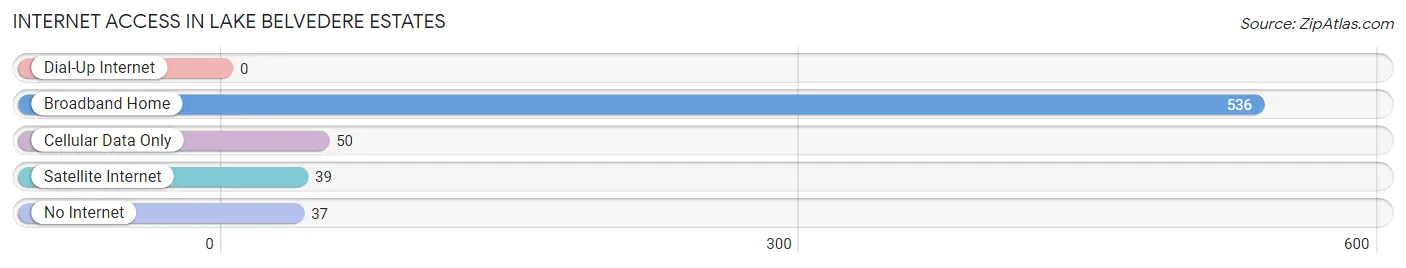
| Internet Type | # Households | % Households |
| Dial-Up Internet | 0 | 0.0% |
| Broadband Home | 536 | 81.0% |
| Cellular Data Only | 50 | 7.5% |
| Satellite Internet | 39 | 5.9% |
| No Internet | 37 | 5.6% |
| Total | 662 | 100.0% |
Lake Belvedere Estates Summary
History
Lake Belvedere Estates is a census-designated place located in Palm Beach County, Florida. It is located in the southeastern part of the county, just north of the city of West Palm Beach. The area was first settled in the late 1800s by settlers from the Bahamas, who were attracted to the area by its abundant natural resources. The area was originally known as "Belvedere" and was named after the nearby lake.
In the early 1900s, the area began to develop as a residential community. The first homes were built in the 1920s and 1930s, and the area quickly grew in popularity. By the 1950s, the area had become a popular destination for vacationers and retirees.
In the late 1970s, the area was incorporated as the Town of Lake Belvedere Estates. The town was named after the nearby lake, which was named after the Italian word for "beautiful view". The town was designed to be a residential community, and it has remained that way ever since.
Geography
Lake Belvedere Estates is located in the southeastern part of Palm Beach County, Florida. It is bordered by the cities of West Palm Beach and Lake Worth to the south, and by the towns of Loxahatchee and Royal Palm Beach to the north. The area is located on the western shore of Lake Okeechobee, the largest lake in Florida.
The area is mostly flat, with an elevation of just 10 feet above sea level. The climate is subtropical, with hot, humid summers and mild winters. The average annual temperature is around 75 degrees Fahrenheit.
Economy
The economy of Lake Belvedere Estates is largely based on tourism and retirement. The area is home to several resorts and retirement communities, as well as a number of golf courses. The area is also home to several small businesses, including restaurants, retail stores, and professional services.
The area is also home to a number of agricultural operations, including citrus groves, nurseries, and vegetable farms. The area is also home to a number of manufacturing and industrial operations, including a paper mill and a plastics factory.
Demographics
As of the 2010 census, the population of Lake Belvedere Estates was 8,945. The population is mostly white (83.3%), with a small percentage of African Americans (7.2%) and Hispanics (7.1%). The median household income is $50,945, and the median home value is $179,000.
The area is home to a number of churches, including Baptist, Methodist, and Catholic. The area is also home to a number of schools, including public elementary, middle, and high schools. The area is served by the Palm Beach County School District.
Conclusion
Lake Belvedere Estates is a census-designated place located in Palm Beach County, Florida. It is located in the southeastern part of the county, just north of the city of West Palm Beach. The area was first settled in the late 1800s by settlers from the Bahamas, and it has since become a popular destination for vacationers and retirees. The economy of the area is largely based on tourism and retirement, and the area is home to several resorts and retirement communities, as well as a number of small businesses. The population of the area is mostly white, with a small percentage of African Americans and Hispanics. The median household income is $50,945, and the median home value is $179,000. The area is home to a number of churches and schools, and it is served by the Palm Beach County School District.
Common Questions
What is Per Capita Income in Lake Belvedere Estates?
Per Capita income in Lake Belvedere Estates is $20,011.
What is the Median Family Income in Lake Belvedere Estates?
Median Family Income in Lake Belvedere Estates is $80,952.
What is the Median Household income in Lake Belvedere Estates?
Median Household Income in Lake Belvedere Estates is $70,250.
What is Income or Wage Gap in Lake Belvedere Estates?
Income or Wage Gap in Lake Belvedere Estates is 43.2%.
Women in Lake Belvedere Estates earn 56.8 cents for every dollar earned by a man.
What is Family Income Deficit in Lake Belvedere Estates?
Family Income Deficit in Lake Belvedere Estates is $11,686.
Families that are below poverty line in Lake Belvedere Estates earn $11,686 less on average than the poverty threshold level.
What is Inequality or Gini Index in Lake Belvedere Estates?
Inequality or Gini Index in Lake Belvedere Estates is 0.36.
What is the Total Population of Lake Belvedere Estates?
Total Population of Lake Belvedere Estates is 2,867.
What is the Total Male Population of Lake Belvedere Estates?
Total Male Population of Lake Belvedere Estates is 1,325.
What is the Total Female Population of Lake Belvedere Estates?
Total Female Population of Lake Belvedere Estates is 1,542.
What is the Ratio of Males per 100 Females in Lake Belvedere Estates?
There are 85.93 Males per 100 Females in Lake Belvedere Estates.
What is the Ratio of Females per 100 Males in Lake Belvedere Estates?
There are 116.38 Females per 100 Males in Lake Belvedere Estates.
What is the Median Population Age in Lake Belvedere Estates?
Median Population Age in Lake Belvedere Estates is 27.0 Years.
What is the Average Family Size in Lake Belvedere Estates
Average Family Size in Lake Belvedere Estates is 4.9 People.
What is the Average Household Size in Lake Belvedere Estates
Average Household Size in Lake Belvedere Estates is 4.3 People.
How Large is the Labor Force in Lake Belvedere Estates?
There are 1,375 People in the Labor Forcein in Lake Belvedere Estates.
What is the Percentage of People in the Labor Force in Lake Belvedere Estates?
69.4% of People are in the Labor Force in Lake Belvedere Estates.
What is the Unemployment Rate in Lake Belvedere Estates?
Unemployment Rate in Lake Belvedere Estates is 4.9%.