Gateway, FL Map & Demographics
Gateway Map
Gateway Overview
$47,173
PER CAPITA INCOME
$124,141
AVG FAMILY INCOME
$110,317
AVG HOUSEHOLD INCOME
21.9%
WAGE / INCOME GAP [ % ]
78.1¢/ $1
WAGE / INCOME GAP [ $ ]
0.40
INEQUALITY / GINI INDEX
10,395
TOTAL POPULATION
5,261
MALE POPULATION
5,134
FEMALE POPULATION
102.47
MALES / 100 FEMALES
97.59
FEMALES / 100 MALES
37.5
MEDIAN AGE
3.4
AVG FAMILY SIZE
2.9
AVG HOUSEHOLD SIZE
5,230
LABOR FORCE [ PEOPLE ]
61.7%
PERCENT IN LABOR FORCE
1.9%
UNEMPLOYMENT RATE
Income in Gateway
Income Overview in Gateway
Per Capita Income in Gateway is $47,173, while median incomes of families and households are $124,141 and $110,317 respectively.
| Characteristic | Number | Measure |
| Per Capita Income | 10,395 | $47,173 |
| Median Family Income | 2,586 | $124,141 |
| Mean Family Income | 2,586 | $148,372 |
| Median Household Income | 3,610 | $110,317 |
| Mean Household Income | 3,610 | $129,494 |
| Income Deficit | 2,586 | $0 |
| Wage / Income Gap (%) | 10,395 | 21.89% |
| Wage / Income Gap ($) | 10,395 | 78.11¢ per $1 |
| Gini / Inequality Index | 10,395 | 0.40 |
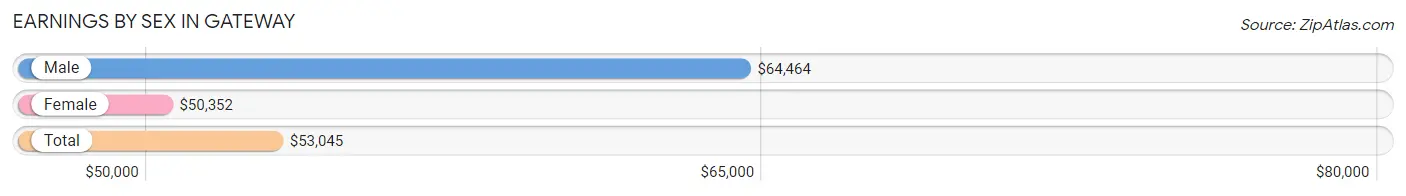
Earnings by Sex in Gateway
Average Earnings in Gateway are $53,045, $64,464 for men and $50,352 for women, a difference of 21.9%.
| Sex | Number | Average Earnings |
| Male | 3,089 (56.0%) | $64,464 |
| Female | 2,423 (44.0%) | $50,352 |
| Total | 5,512 (100.0%) | $53,045 |
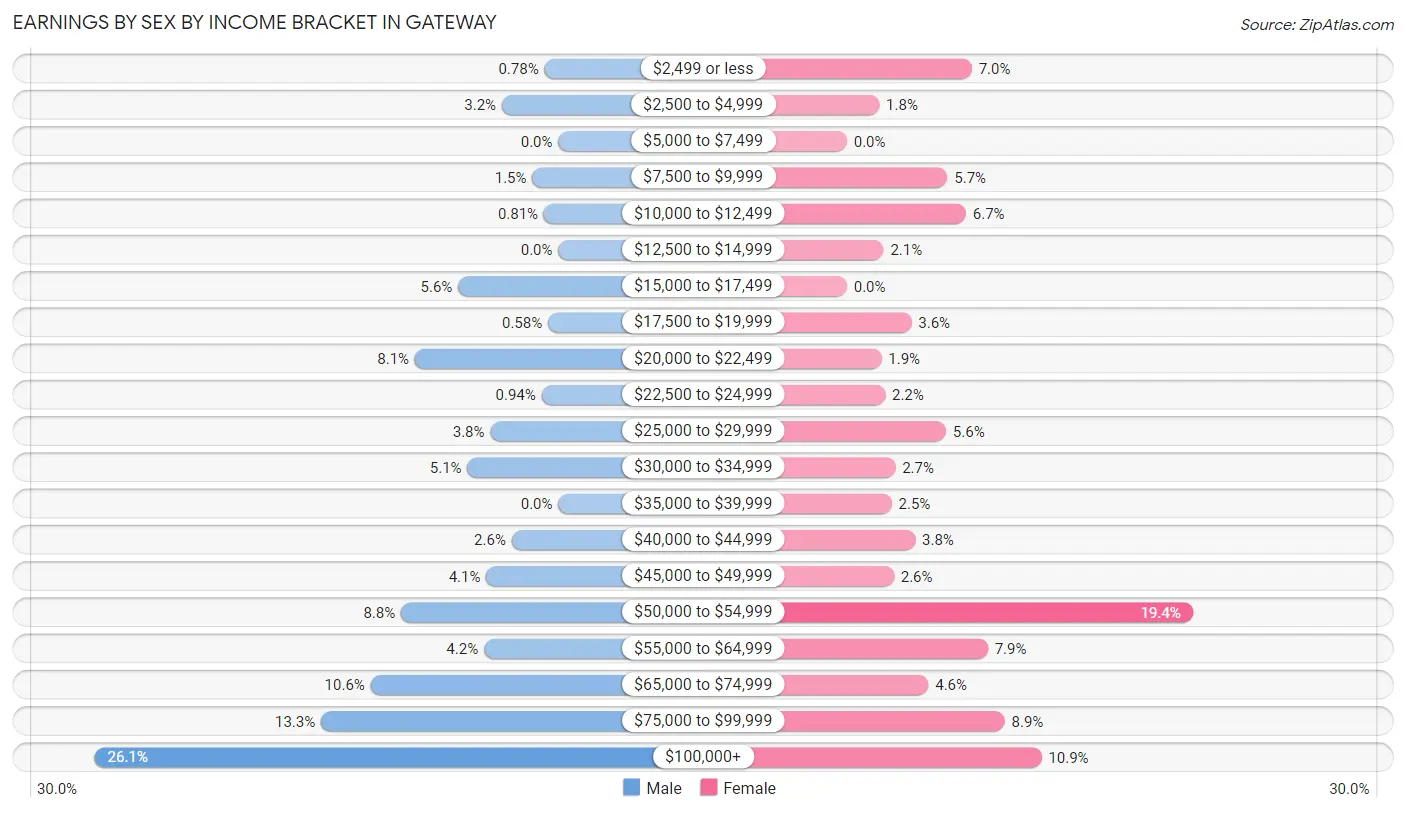
Earnings by Sex by Income Bracket in Gateway
The most common earnings brackets in Gateway are $100,000+ for men (805 | 26.1%) and $50,000 to $54,999 for women (471 | 19.4%).
| Income | Male | Female |
| $2,499 or less | 24 (0.8%) | 170 (7.0%) |
| $2,500 to $4,999 | 98 (3.2%) | 44 (1.8%) |
| $5,000 to $7,499 | 0 (0.0%) | 0 (0.0%) |
| $7,500 to $9,999 | 45 (1.5%) | 137 (5.7%) |
| $10,000 to $12,499 | 25 (0.8%) | 162 (6.7%) |
| $12,500 to $14,999 | 0 (0.0%) | 50 (2.1%) |
| $15,000 to $17,499 | 174 (5.6%) | 0 (0.0%) |
| $17,500 to $19,999 | 18 (0.6%) | 88 (3.6%) |
| $20,000 to $22,499 | 249 (8.1%) | 47 (1.9%) |
| $22,500 to $24,999 | 29 (0.9%) | 52 (2.1%) |
| $25,000 to $29,999 | 118 (3.8%) | 135 (5.6%) |
| $30,000 to $34,999 | 158 (5.1%) | 66 (2.7%) |
| $35,000 to $39,999 | 0 (0.0%) | 61 (2.5%) |
| $40,000 to $44,999 | 81 (2.6%) | 93 (3.8%) |
| $45,000 to $49,999 | 125 (4.1%) | 64 (2.6%) |
| $50,000 to $54,999 | 273 (8.8%) | 471 (19.4%) |
| $55,000 to $64,999 | 129 (4.2%) | 192 (7.9%) |
| $65,000 to $74,999 | 326 (10.5%) | 111 (4.6%) |
| $75,000 to $99,999 | 412 (13.3%) | 215 (8.9%) |
| $100,000+ | 805 (26.1%) | 265 (10.9%) |
| Total | 3,089 (100.0%) | 2,423 (100.0%) |
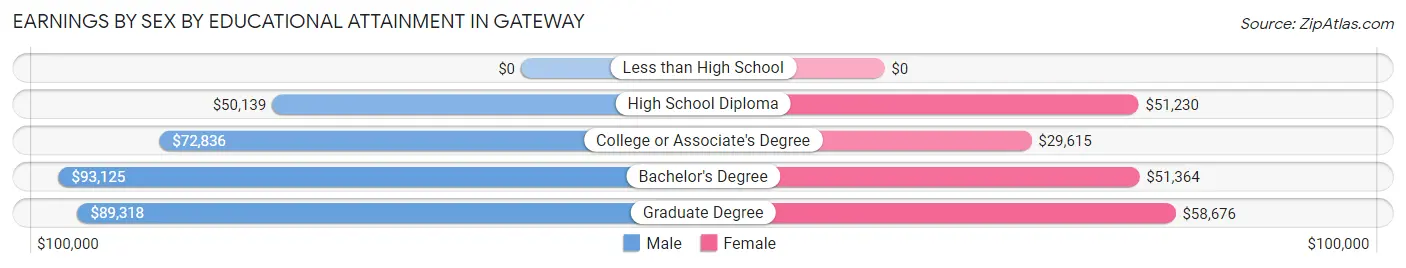
Earnings by Sex by Educational Attainment in Gateway
Average earnings in Gateway are $74,400 for men and $51,759 for women, a difference of 30.4%. Men with an educational attainment of bachelor's degree enjoy the highest average annual earnings of $93,125, while those with high school diploma education earn the least with $50,139. Women with an educational attainment of graduate degree earn the most with the average annual earnings of $58,676, while those with college or associate's degree education have the smallest earnings of $29,615.
| Educational Attainment | Male Income | Female Income |
| Less than High School | - | - |
| High School Diploma | $50,139 | $51,230 |
| College or Associate's Degree | $72,836 | $29,615 |
| Bachelor's Degree | $93,125 | $51,364 |
| Graduate Degree | $89,318 | $58,676 |
| Total | $74,400 | $51,759 |
Family Income in Gateway
Family Income Brackets in Gateway
According to the Gateway family income data, there are 657 families falling into the $100,000 to $149,999 income range, which is the most common income bracket and makes up 25.4% of all families.
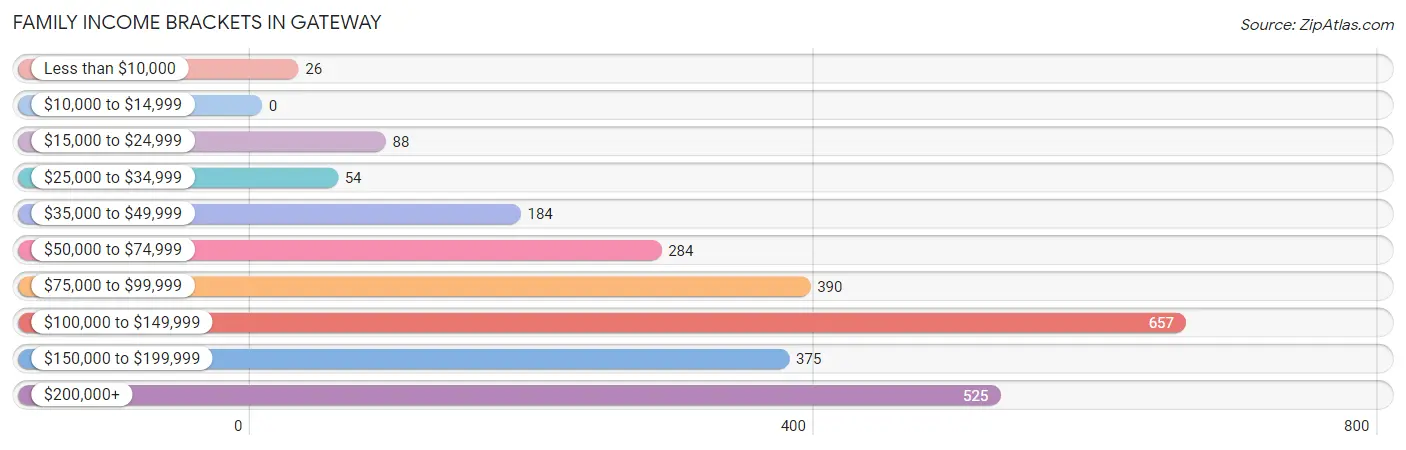
| Income Bracket | # Families | % Families |
| Less than $10,000 | 26 | 1.0% |
| $10,000 to $14,999 | 0 | 0.0% |
| $15,000 to $24,999 | 88 | 3.4% |
| $25,000 to $34,999 | 54 | 2.1% |
| $35,000 to $49,999 | 184 | 7.1% |
| $50,000 to $74,999 | 284 | 11.0% |
| $75,000 to $99,999 | 390 | 15.1% |
| $100,000 to $149,999 | 657 | 25.4% |
| $150,000 to $199,999 | 375 | 14.5% |
| $200,000+ | 525 | 20.3% |
Family Income by Famaliy Size in Gateway
4-person families (525 | 20.3%) account for the highest median family income in Gateway with $154,875 per family, while 2-person families (1,221 | 47.2%) have the highest median income of $44,548 per family member.
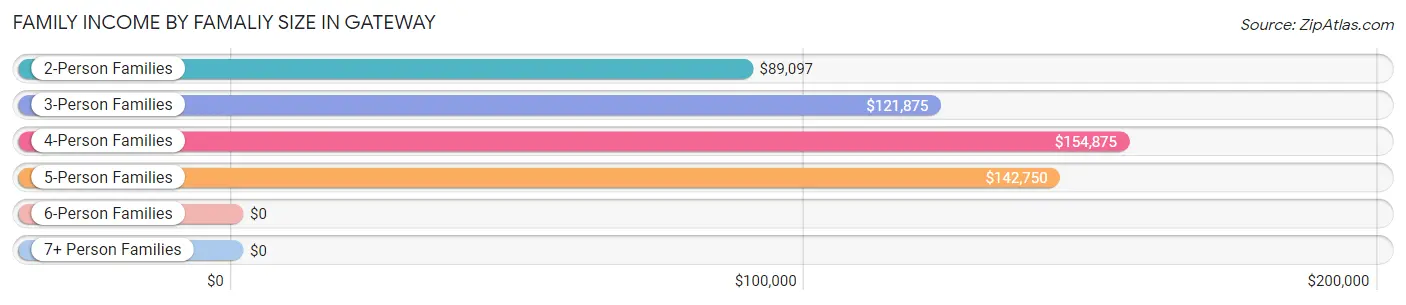
| Income Bracket | # Families | Median Income |
| 2-Person Families | 1,221 (47.2%) | $89,097 |
| 3-Person Families | 441 (17.1%) | $121,875 |
| 4-Person Families | 525 (20.3%) | $154,875 |
| 5-Person Families | 319 (12.3%) | $142,750 |
| 6-Person Families | 80 (3.1%) | $0 |
| 7+ Person Families | 0 (0.0%) | $0 |
| Total | 2,586 (100.0%) | $124,141 |
Family Income by Number of Earners in Gateway
The median family income in Gateway is $124,141, with families comprising 3+ earners (319) having the highest median family income of $195,987, while families with no earners (487) have the lowest median family income of $60,402, accounting for 12.3% and 18.8% of families, respectively.
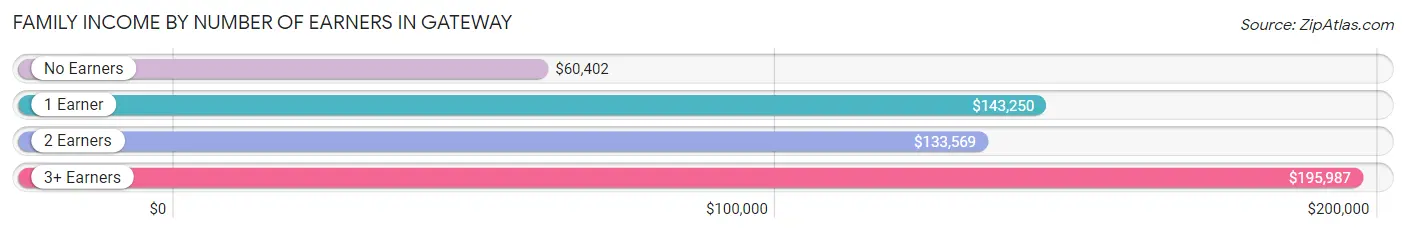
| Number of Earners | # Families | Median Income |
| No Earners | 487 (18.8%) | $60,402 |
| 1 Earner | 575 (22.2%) | $143,250 |
| 2 Earners | 1,205 (46.6%) | $133,569 |
| 3+ Earners | 319 (12.3%) | $195,987 |
| Total | 2,586 (100.0%) | $124,141 |
Household Income in Gateway
Household Income Brackets in Gateway
With 964 households falling in the category, the $100,000 to $149,999 income range is the most frequent in Gateway, accounting for 26.7% of all households. In contrast, only 14 households (0.4%) fall into the $10,000 to $14,999 income bracket, making it the least populous group.
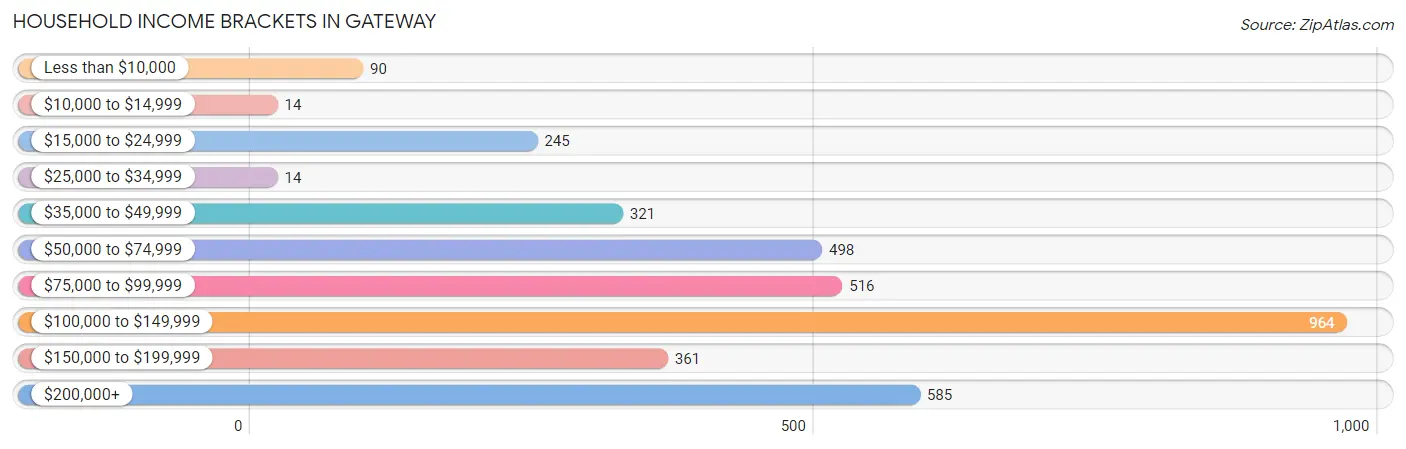
| Income Bracket | # Households | % Households |
| Less than $10,000 | 90 | 2.5% |
| $10,000 to $14,999 | 14 | 0.4% |
| $15,000 to $24,999 | 245 | 6.8% |
| $25,000 to $34,999 | 14 | 0.4% |
| $35,000 to $49,999 | 321 | 8.9% |
| $50,000 to $74,999 | 498 | 13.8% |
| $75,000 to $99,999 | 516 | 14.3% |
| $100,000 to $149,999 | 964 | 26.7% |
| $150,000 to $199,999 | 361 | 10.0% |
| $200,000+ | 585 | 16.2% |
Household Income by Householder Age in Gateway
The median household income in Gateway is $110,317, with the highest median household income of $140,239 found in the 45 to 64 years age bracket for the primary householder. A total of 1,591 households (44.1%) fall into this category. Meanwhile, the 15 to 24 years age bracket for the primary householder has the lowest median household income of $0, with 72 households (2.0%) in this group.
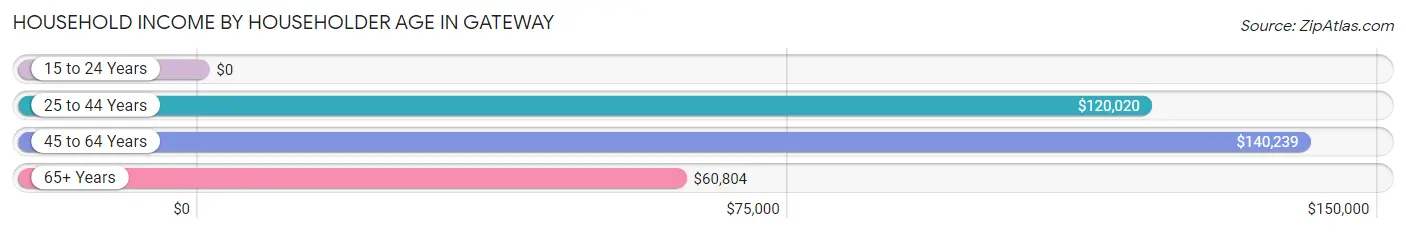
| Income Bracket | # Households | Median Income |
| 15 to 24 Years | 72 (2.0%) | $0 |
| 25 to 44 Years | 973 (27.0%) | $120,020 |
| 45 to 64 Years | 1,591 (44.1%) | $140,239 |
| 65+ Years | 974 (27.0%) | $60,804 |
| Total | 3,610 (100.0%) | $110,317 |
Poverty in Gateway
Income Below Poverty by Sex and Age in Gateway
With 2.0% poverty level for males and 4.7% for females among the residents of Gateway, 15 year old males and 16 and 17 year old females are the most vulnerable to poverty, with 16 males (38.1%) and 51 females (15.9%) in their respective age groups living below the poverty level.
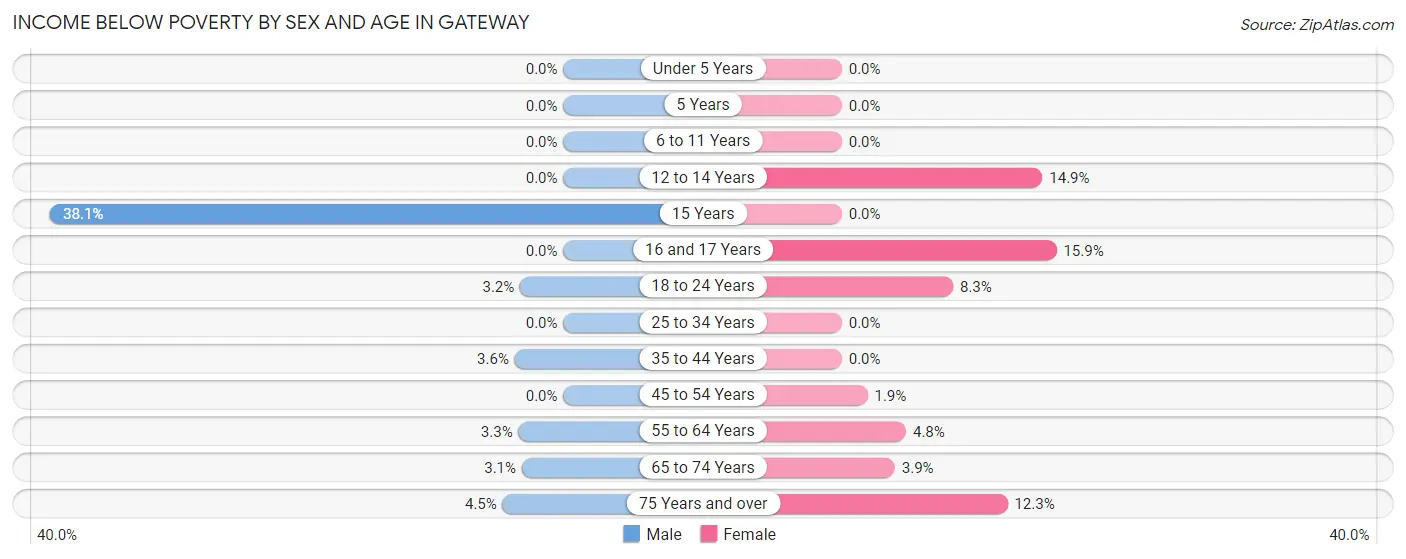
| Age Bracket | Male | Female |
| Under 5 Years | 0 (0.0%) | 0 (0.0%) |
| 5 Years | 0 (0.0%) | 0 (0.0%) |
| 6 to 11 Years | 0 (0.0%) | 0 (0.0%) |
| 12 to 14 Years | 0 (0.0%) | 49 (14.9%) |
| 15 Years | 16 (38.1%) | 0 (0.0%) |
| 16 and 17 Years | 0 (0.0%) | 51 (15.9%) |
| 18 to 24 Years | 25 (3.2%) | 40 (8.3%) |
| 25 to 34 Years | 0 (0.0%) | 0 (0.0%) |
| 35 to 44 Years | 17 (3.6%) | 0 (0.0%) |
| 45 to 54 Years | 0 (0.0%) | 15 (1.9%) |
| 55 to 64 Years | 18 (3.3%) | 18 (4.8%) |
| 65 to 74 Years | 16 (3.1%) | 15 (3.9%) |
| 75 Years and over | 12 (4.5%) | 53 (12.3%) |
| Total | 104 (2.0%) | 241 (4.7%) |
Income Above Poverty by Sex and Age in Gateway
According to the poverty statistics in Gateway, males aged under 5 years and females aged under 5 years are the age groups that are most secure financially, with 100.0% of males and 100.0% of females in these age groups living above the poverty line.
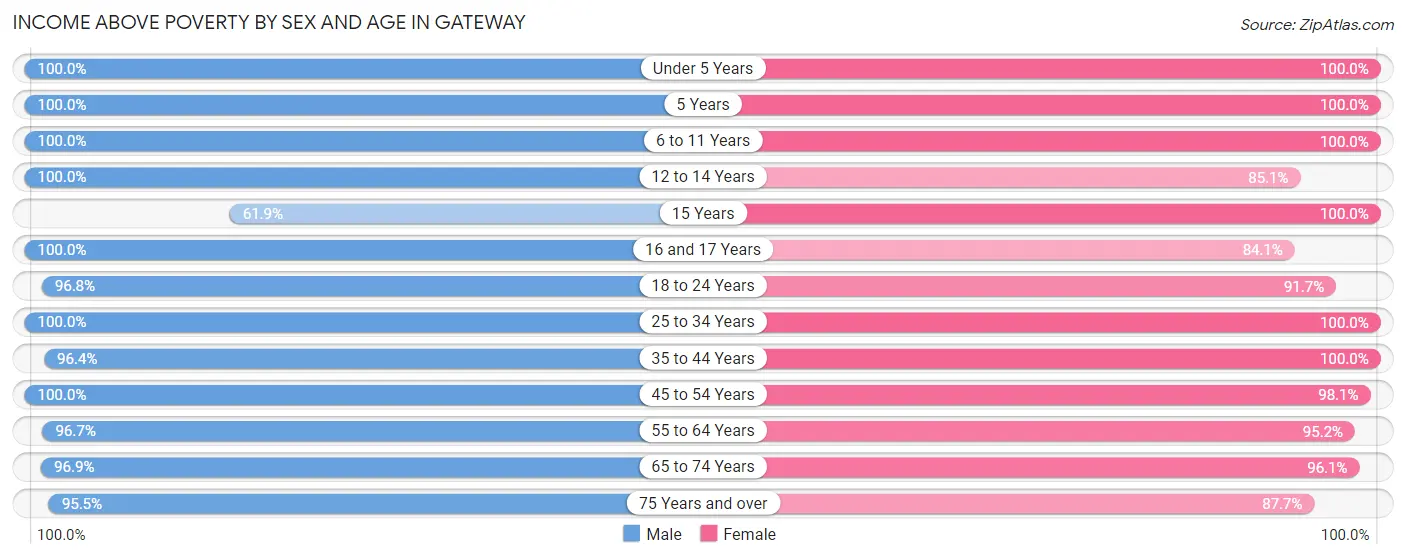
| Age Bracket | Male | Female |
| Under 5 Years | 308 (100.0%) | 204 (100.0%) |
| 5 Years | 22 (100.0%) | 122 (100.0%) |
| 6 to 11 Years | 229 (100.0%) | 423 (100.0%) |
| 12 to 14 Years | 149 (100.0%) | 280 (85.1%) |
| 15 Years | 26 (61.9%) | 44 (100.0%) |
| 16 and 17 Years | 239 (100.0%) | 269 (84.1%) |
| 18 to 24 Years | 753 (96.8%) | 444 (91.7%) |
| 25 to 34 Years | 624 (100.0%) | 676 (100.0%) |
| 35 to 44 Years | 454 (96.4%) | 510 (100.0%) |
| 45 to 54 Years | 1,072 (100.0%) | 772 (98.1%) |
| 55 to 64 Years | 523 (96.7%) | 359 (95.2%) |
| 65 to 74 Years | 504 (96.9%) | 366 (96.1%) |
| 75 Years and over | 254 (95.5%) | 378 (87.7%) |
| Total | 5,157 (98.0%) | 4,847 (95.3%) |
Income Below Poverty Among Married-Couple Families in Gateway
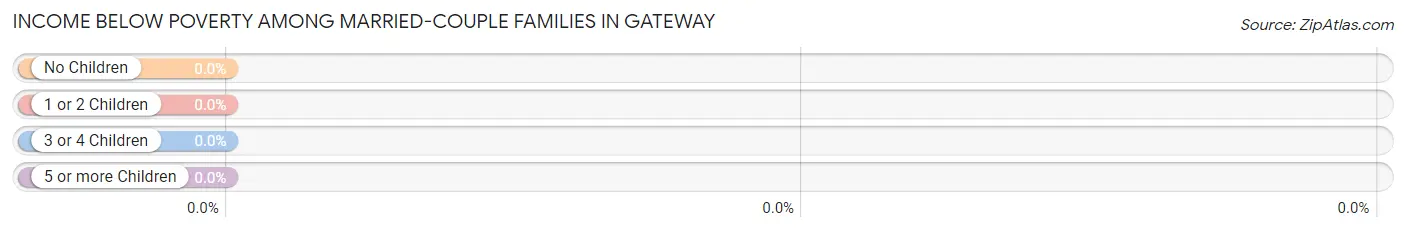
| Children | Above Poverty | Below Poverty |
| No Children | 1,267 (100.0%) | 0 (0.0%) |
| 1 or 2 Children | 821 (100.0%) | 0 (0.0%) |
| 3 or 4 Children | 148 (100.0%) | 0 (0.0%) |
| 5 or more Children | 0 (0.0%) | 0 (0.0%) |
| Total | 2,236 (100.0%) | 0 (0.0%) |
Income Below Poverty Among Single-Parent Households in Gateway
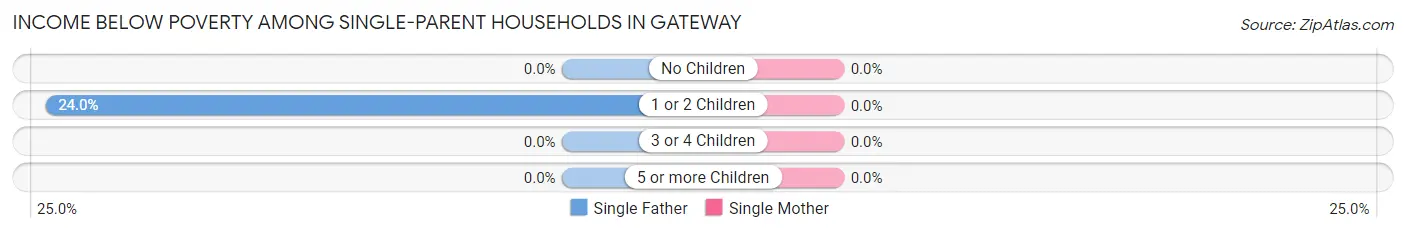
| Children | Single Father | Single Mother |
| No Children | 0 (0.0%) | 0 (0.0%) |
| 1 or 2 Children | 25 (24.0%) | 0 (0.0%) |
| 3 or 4 Children | 0 (0.0%) | 0 (0.0%) |
| 5 or more Children | 0 (0.0%) | 0 (0.0%) |
| Total | 25 (24.0%) | 0 (0.0%) |
Income Below Poverty Among Married-Couple vs Single-Parent Households in Gateway
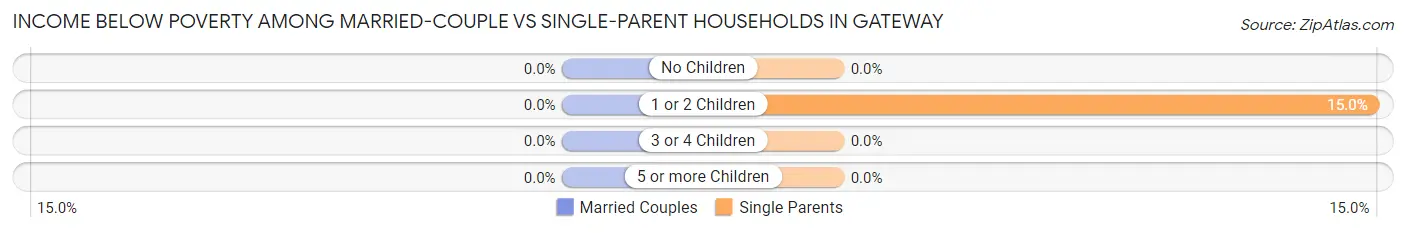
| Children | Married-Couple Families | Single-Parent Households |
| No Children | 0 (0.0%) | 0 (0.0%) |
| 1 or 2 Children | 0 (0.0%) | 25 (15.0%) |
| 3 or 4 Children | 0 (0.0%) | 0 (0.0%) |
| 5 or more Children | 0 (0.0%) | 0 (0.0%) |
| Total | 0 (0.0%) | 25 (7.1%) |
Race in Gateway
The most populous races in Gateway are White / Caucasian (8,457 | 81.4%), Hispanic or Latino (1,183 | 11.4%), and Two or more Races (632 | 6.1%).
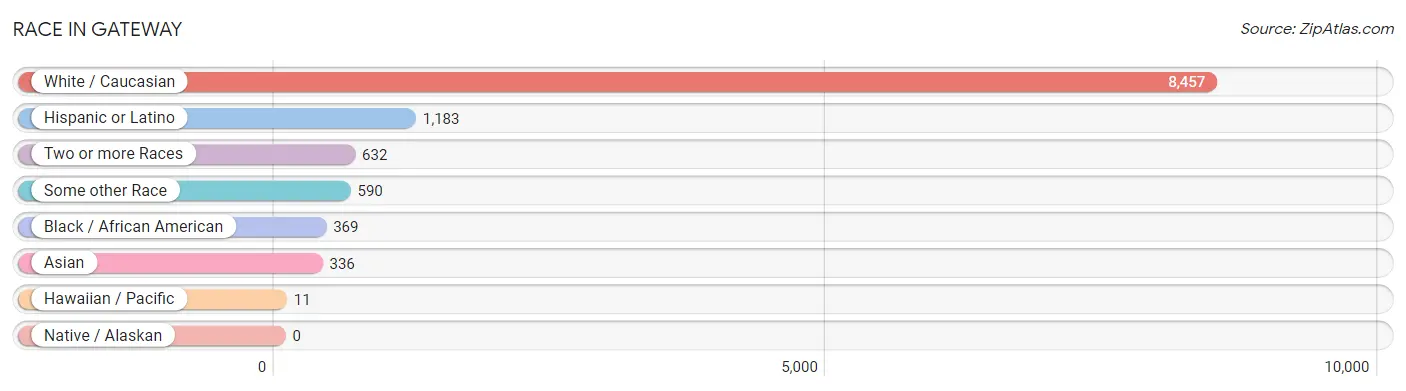
| Race | # Population | % Population |
| Asian | 336 | 3.2% |
| Black / African American | 369 | 3.5% |
| Hawaiian / Pacific | 11 | 0.1% |
| Hispanic or Latino | 1,183 | 11.4% |
| Native / Alaskan | 0 | 0.0% |
| White / Caucasian | 8,457 | 81.4% |
| Two or more Races | 632 | 6.1% |
| Some other Race | 590 | 5.7% |
| Total | 10,395 | 100.0% |
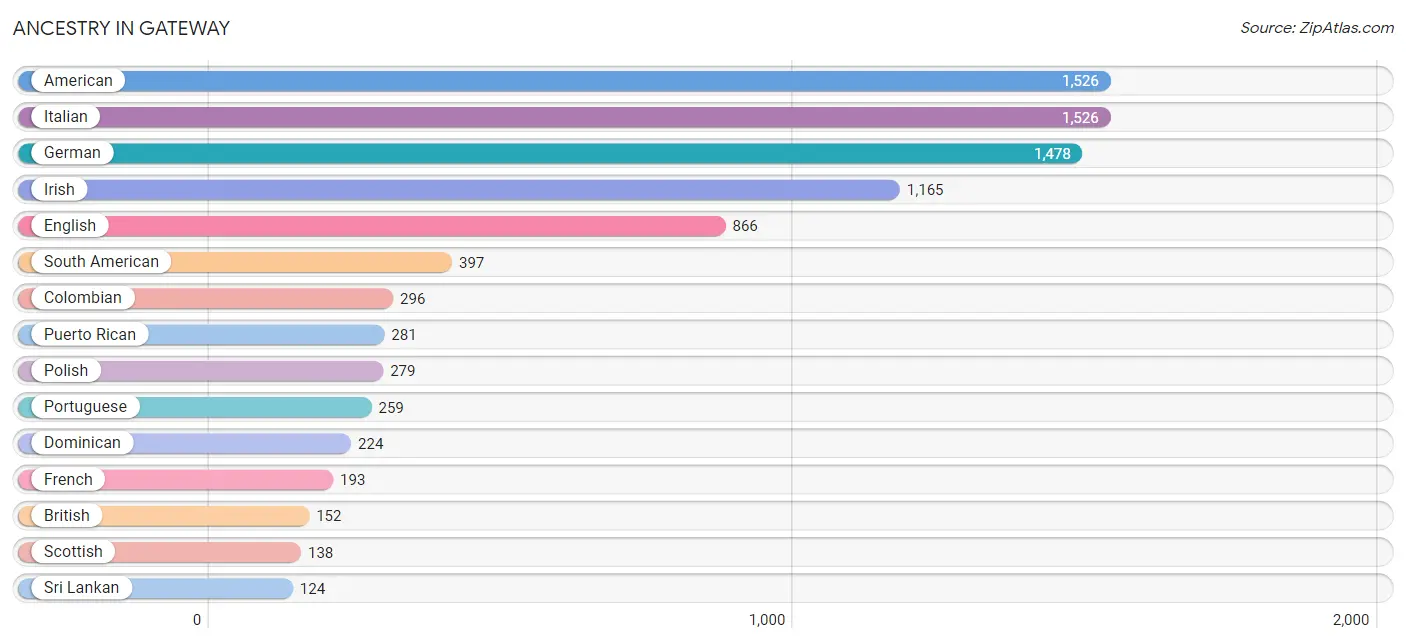
Ancestry in Gateway
The most populous ancestries reported in Gateway are American (1,526 | 14.7%), Italian (1,526 | 14.7%), German (1,478 | 14.2%), Irish (1,165 | 11.2%), and English (866 | 8.3%), together accounting for 63.1% of all Gateway residents.
| Ancestry | # Population | % Population |
| American | 1,526 | 14.7% |
| Arab | 16 | 0.2% |
| Argentinean | 17 | 0.2% |
| Austrian | 18 | 0.2% |
| Bhutanese | 15 | 0.1% |
| Brazilian | 99 | 0.9% |
| British | 152 | 1.5% |
| Canadian | 85 | 0.8% |
| Central American Indian | 15 | 0.1% |
| Cherokee | 20 | 0.2% |
| Colombian | 296 | 2.9% |
| Cuban | 113 | 1.1% |
| Czech | 72 | 0.7% |
| Danish | 17 | 0.2% |
| Dominican | 224 | 2.1% |
| Dutch | 86 | 0.8% |
| Eastern European | 20 | 0.2% |
| Ecuadorian | 18 | 0.2% |
| English | 866 | 8.3% |
| European | 79 | 0.8% |
| French | 193 | 1.9% |
| French Canadian | 78 | 0.7% |
| German | 1,478 | 14.2% |
| Greek | 35 | 0.3% |
| Guyanese | 49 | 0.5% |
| Haitian | 24 | 0.2% |
| Hungarian | 44 | 0.4% |
| Indian (Asian) | 104 | 1.0% |
| Irish | 1,165 | 11.2% |
| Italian | 1,526 | 14.7% |
| Jamaican | 83 | 0.8% |
| Korean | 119 | 1.1% |
| Mexican | 122 | 1.2% |
| Norwegian | 54 | 0.5% |
| Paraguayan | 21 | 0.2% |
| Peruvian | 33 | 0.3% |
| Polish | 279 | 2.7% |
| Portuguese | 259 | 2.5% |
| Puerto Rican | 281 | 2.7% |
| Russian | 108 | 1.0% |
| Scandinavian | 72 | 0.7% |
| Scottish | 138 | 1.3% |
| Slovak | 74 | 0.7% |
| South American | 397 | 3.8% |
| Spaniard | 31 | 0.3% |
| Sri Lankan | 124 | 1.2% |
| Swedish | 116 | 1.1% |
| Swiss | 18 | 0.2% |
| Syrian | 16 | 0.2% |
| Thai | 85 | 0.8% |
| Trinidadian and Tobagonian | 59 | 0.6% |
| Ukrainian | 17 | 0.2% |
| Uruguayan | 12 | 0.1% |
| Vietnamese | 29 | 0.3% |
| Welsh | 95 | 0.9% |
| West Indian | 15 | 0.1% | View All 56 Rows |
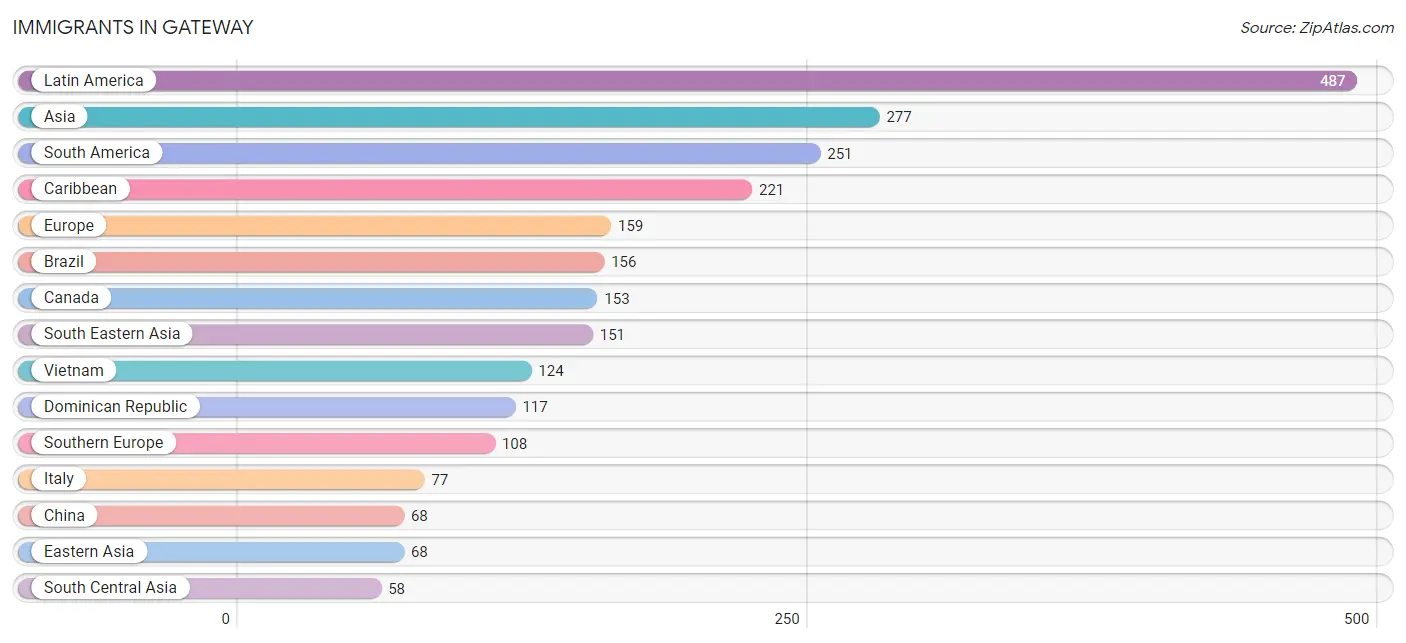
Immigrants in Gateway
The most numerous immigrant groups reported in Gateway came from Latin America (487 | 4.7%), Asia (277 | 2.7%), South America (251 | 2.4%), Caribbean (221 | 2.1%), and Europe (159 | 1.5%), together accounting for 13.4% of all Gateway residents.
| Immigration Origin | # Population | % Population |
| Argentina | 17 | 0.2% |
| Asia | 277 | 2.7% |
| Bangladesh | 29 | 0.3% |
| Brazil | 156 | 1.5% |
| Canada | 153 | 1.5% |
| Caribbean | 221 | 2.1% |
| Central America | 15 | 0.1% |
| China | 68 | 0.6% |
| Colombia | 18 | 0.2% |
| Cuba | 13 | 0.1% |
| Dominican Republic | 117 | 1.1% |
| Eastern Asia | 68 | 0.6% |
| Eastern Europe | 22 | 0.2% |
| England | 18 | 0.2% |
| Europe | 159 | 1.5% |
| Fiji | 11 | 0.1% |
| Germany | 11 | 0.1% |
| Guyana | 15 | 0.1% |
| Haiti | 24 | 0.2% |
| India | 29 | 0.3% |
| Italy | 77 | 0.7% |
| Jamaica | 53 | 0.5% |
| Latin America | 487 | 4.7% |
| Mexico | 15 | 0.1% |
| Northern Europe | 18 | 0.2% |
| Oceania | 11 | 0.1% |
| Peru | 33 | 0.3% |
| Philippines | 27 | 0.3% |
| Poland | 22 | 0.2% |
| South America | 251 | 2.4% |
| South Central Asia | 58 | 0.6% |
| South Eastern Asia | 151 | 1.5% |
| Southern Europe | 108 | 1.0% |
| Spain | 31 | 0.3% |
| Trinidad and Tobago | 14 | 0.1% |
| Uruguay | 12 | 0.1% |
| Vietnam | 124 | 1.2% |
| Western Europe | 11 | 0.1% | View All 38 Rows |
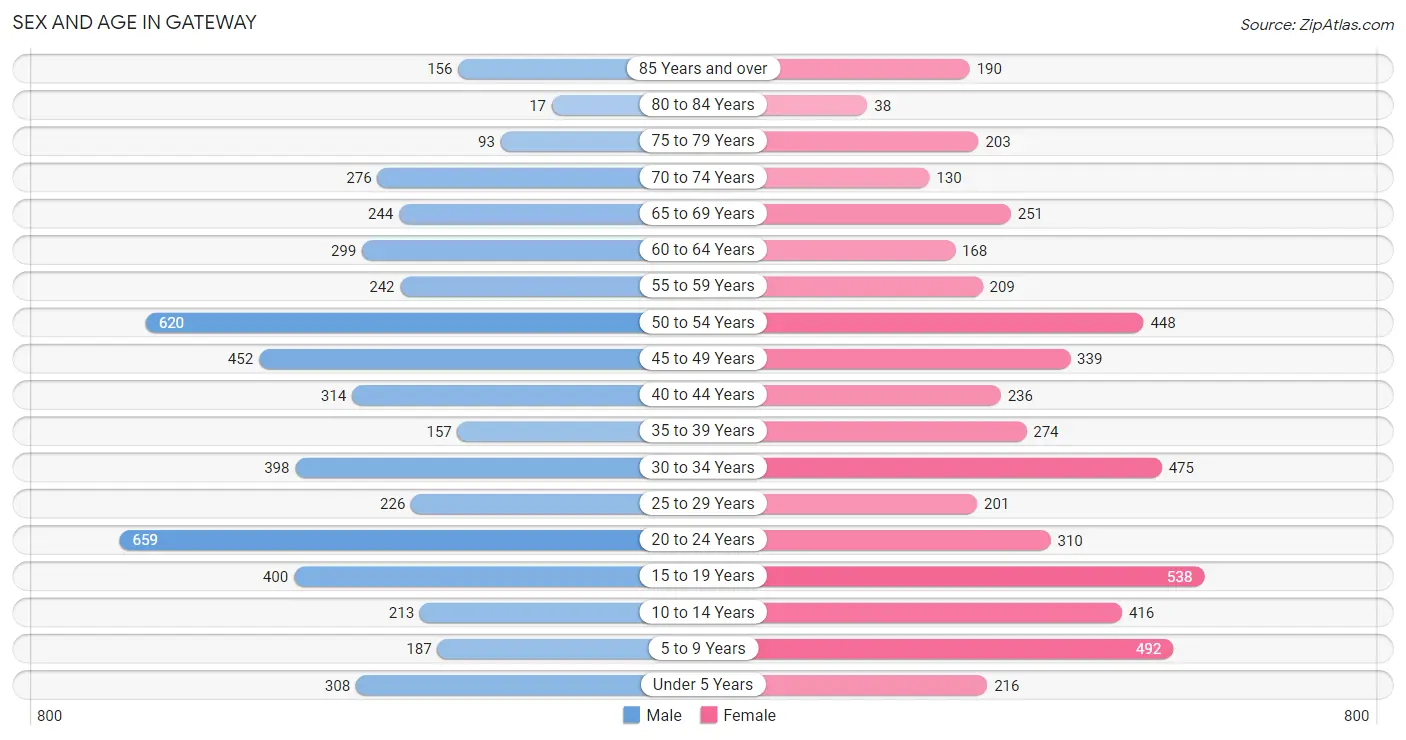
Sex and Age in Gateway
Sex and Age in Gateway
The most populous age groups in Gateway are 20 to 24 Years (659 | 12.5%) for men and 15 to 19 Years (538 | 10.5%) for women.
| Age Bracket | Male | Female |
| Under 5 Years | 308 (5.9%) | 216 (4.2%) |
| 5 to 9 Years | 187 (3.5%) | 492 (9.6%) |
| 10 to 14 Years | 213 (4.1%) | 416 (8.1%) |
| 15 to 19 Years | 400 (7.6%) | 538 (10.5%) |
| 20 to 24 Years | 659 (12.5%) | 310 (6.0%) |
| 25 to 29 Years | 226 (4.3%) | 201 (3.9%) |
| 30 to 34 Years | 398 (7.6%) | 475 (9.2%) |
| 35 to 39 Years | 157 (3.0%) | 274 (5.3%) |
| 40 to 44 Years | 314 (6.0%) | 236 (4.6%) |
| 45 to 49 Years | 452 (8.6%) | 339 (6.6%) |
| 50 to 54 Years | 620 (11.8%) | 448 (8.7%) |
| 55 to 59 Years | 242 (4.6%) | 209 (4.1%) |
| 60 to 64 Years | 299 (5.7%) | 168 (3.3%) |
| 65 to 69 Years | 244 (4.6%) | 251 (4.9%) |
| 70 to 74 Years | 276 (5.2%) | 130 (2.5%) |
| 75 to 79 Years | 93 (1.8%) | 203 (4.0%) |
| 80 to 84 Years | 17 (0.3%) | 38 (0.7%) |
| 85 Years and over | 156 (3.0%) | 190 (3.7%) |
| Total | 5,261 (100.0%) | 5,134 (100.0%) |
Families and Households in Gateway
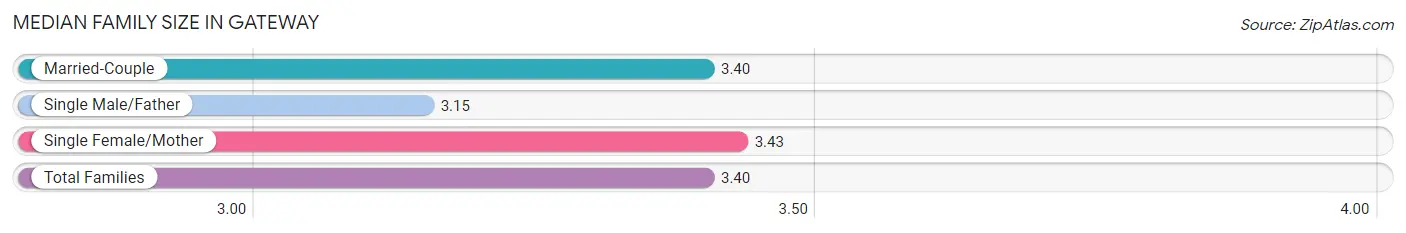
Median Family Size in Gateway
The median family size in Gateway is 3.40 persons per family, with single female/mother families (246 | 9.5%) accounting for the largest median family size of 3.43 persons per family. On the other hand, single male/father families (104 | 4.0%) represent the smallest median family size with 3.15 persons per family.
| Family Type | # Families | Family Size |
| Married-Couple | 2,236 (86.5%) | 3.40 |
| Single Male/Father | 104 (4.0%) | 3.15 |
| Single Female/Mother | 246 (9.5%) | 3.43 |
| Total Families | 2,586 (100.0%) | 3.40 |
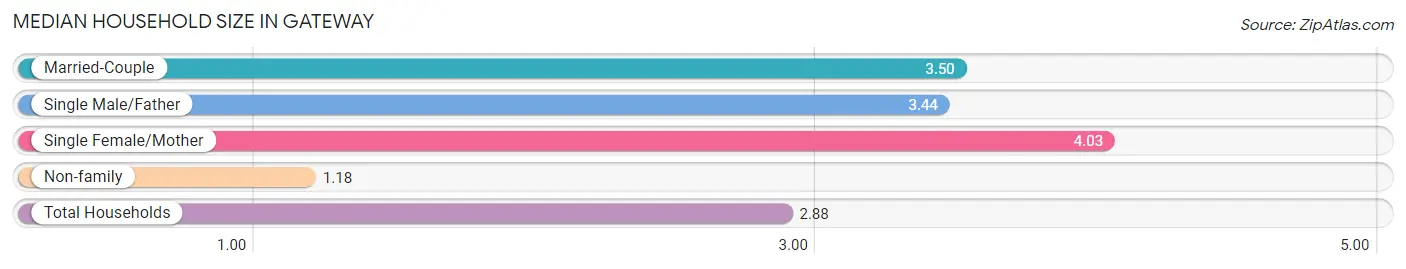
Median Household Size in Gateway
The median household size in Gateway is 2.88 persons per household, with single female/mother households (246 | 6.8%) accounting for the largest median household size of 4.03 persons per household. non-family households (1,024 | 28.4%) represent the smallest median household size with 1.18 persons per household.
| Household Type | # Households | Household Size |
| Married-Couple | 2,236 (61.9%) | 3.50 |
| Single Male/Father | 104 (2.9%) | 3.44 |
| Single Female/Mother | 246 (6.8%) | 4.03 |
| Non-family | 1,024 (28.4%) | 1.18 |
| Total Households | 3,610 (100.0%) | 2.88 |
Household Size by Marriage Status in Gateway
Out of a total of 3,610 households in Gateway, 2,586 (71.6%) are family households, while 1,024 (28.4%) are nonfamily households. The most numerous type of family households are 2-person households, comprising 1,080, and the most common type of nonfamily households are 1-person households, comprising 916.
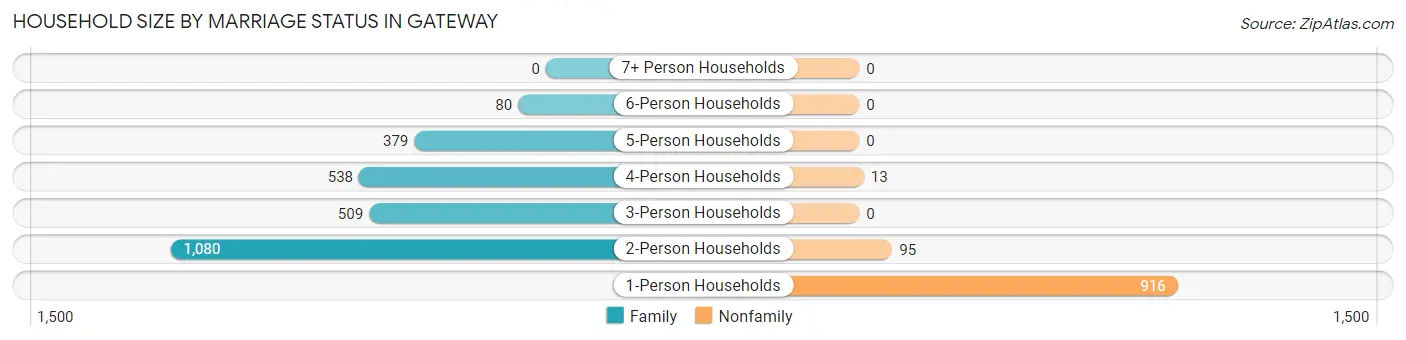
| Household Size | Family Households | Nonfamily Households |
| 1-Person Households | - | 916 (25.4%) |
| 2-Person Households | 1,080 (29.9%) | 95 (2.6%) |
| 3-Person Households | 509 (14.1%) | 0 (0.0%) |
| 4-Person Households | 538 (14.9%) | 13 (0.4%) |
| 5-Person Households | 379 (10.5%) | 0 (0.0%) |
| 6-Person Households | 80 (2.2%) | 0 (0.0%) |
| 7+ Person Households | 0 (0.0%) | 0 (0.0%) |
| Total | 2,586 (71.6%) | 1,024 (28.4%) |
Female Fertility in Gateway
Fertility by Age in Gateway
Average fertility rate in Gateway is 32.0 births per 1,000 women. Women in the age bracket of 20 to 34 years have the highest fertility rate with 81.0 births per 1,000 women. Women in the age bracket of 20 to 34 years acount for 100.0% of all women with births.
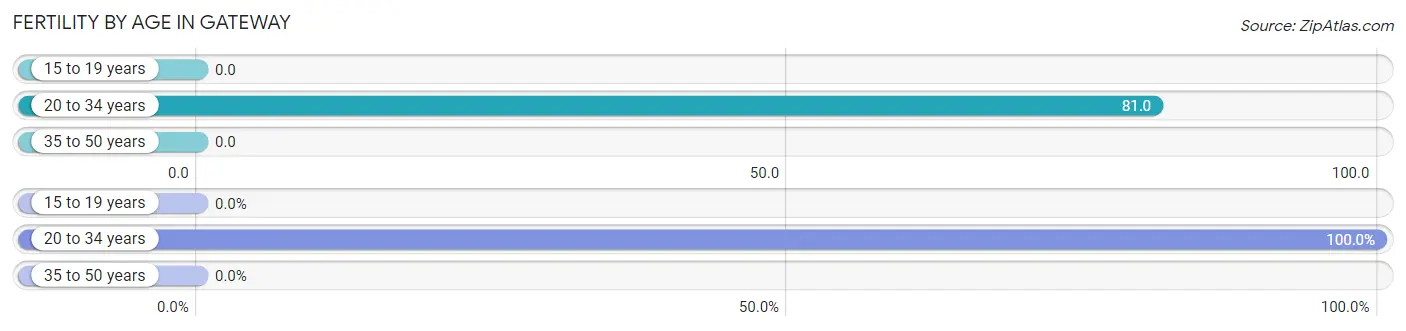
| Age Bracket | Women with Births | Births / 1,000 Women |
| 15 to 19 years | 0 (0.0%) | 0.0 |
| 20 to 34 years | 80 (100.0%) | 81.0 |
| 35 to 50 years | 0 (0.0%) | 0.0 |
| Total | 80 (100.0%) | 32.0 |
Fertility by Age by Marriage Status in Gateway
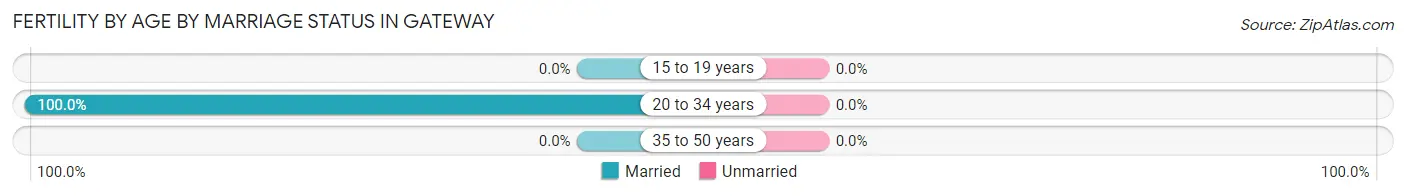
| Age Bracket | Married | Unmarried |
| 15 to 19 years | 0 (0.0%) | 0 (0.0%) |
| 20 to 34 years | 80 (100.0%) | 0 (0.0%) |
| 35 to 50 years | 0 (0.0%) | 0 (0.0%) |
| Total | 80 (100.0%) | 0 (0.0%) |
Fertility by Education in Gateway
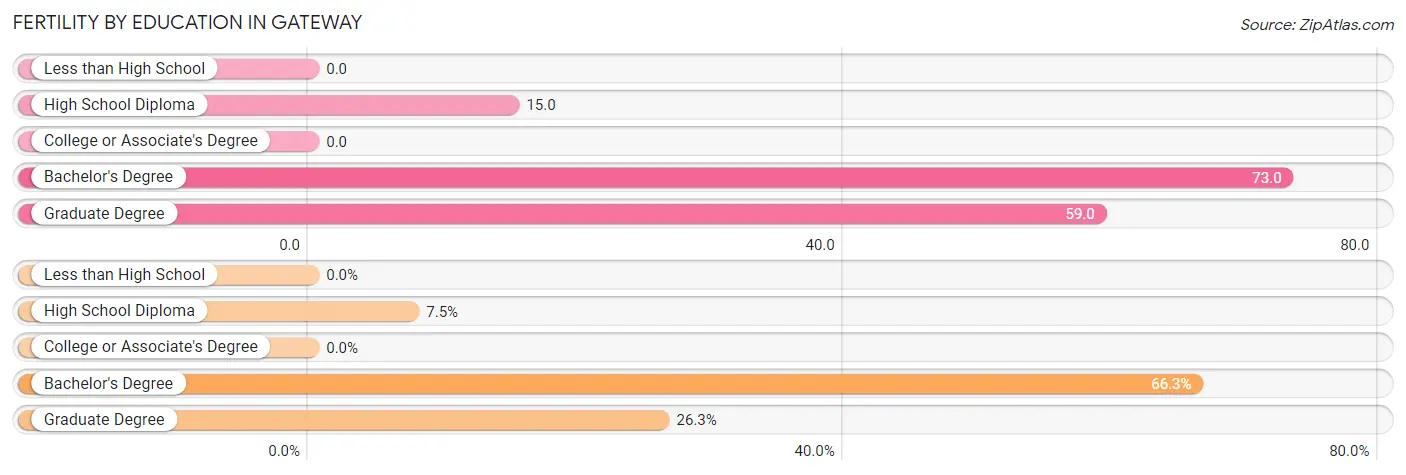
| Educational Attainment | Women with Births | Births / 1,000 Women |
| Less than High School | 0 (0.0%) | 0.0 |
| High School Diploma | 6 (7.5%) | 15.0 |
| College or Associate's Degree | 0 (0.0%) | 0.0 |
| Bachelor's Degree | 53 (66.2%) | 73.0 |
| Graduate Degree | 21 (26.3%) | 59.0 |
| Total | 80 (100.0%) | 32.0 |
Fertility by Education by Marriage Status in Gateway
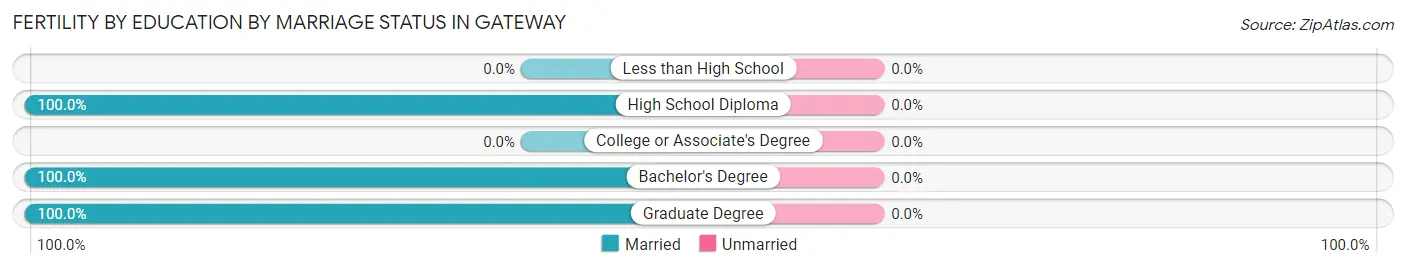
| Educational Attainment | Married | Unmarried |
| Less than High School | 0 (0.0%) | 0 (0.0%) |
| High School Diploma | 6 (100.0%) | 0 (0.0%) |
| College or Associate's Degree | 0 (0.0%) | 0 (0.0%) |
| Bachelor's Degree | 53 (100.0%) | 0 (0.0%) |
| Graduate Degree | 21 (100.0%) | 0 (0.0%) |
| Total | 80 (100.0%) | 0 (0.0%) |
Employment Characteristics in Gateway
Employment by Class of Employer in Gateway
Among the 5,069 employed individuals in Gateway, private company employees (3,027 | 59.7%), local government employees (728 | 14.4%), and self-employed (incorporated) (512 | 10.1%) make up the most common classes of employment.
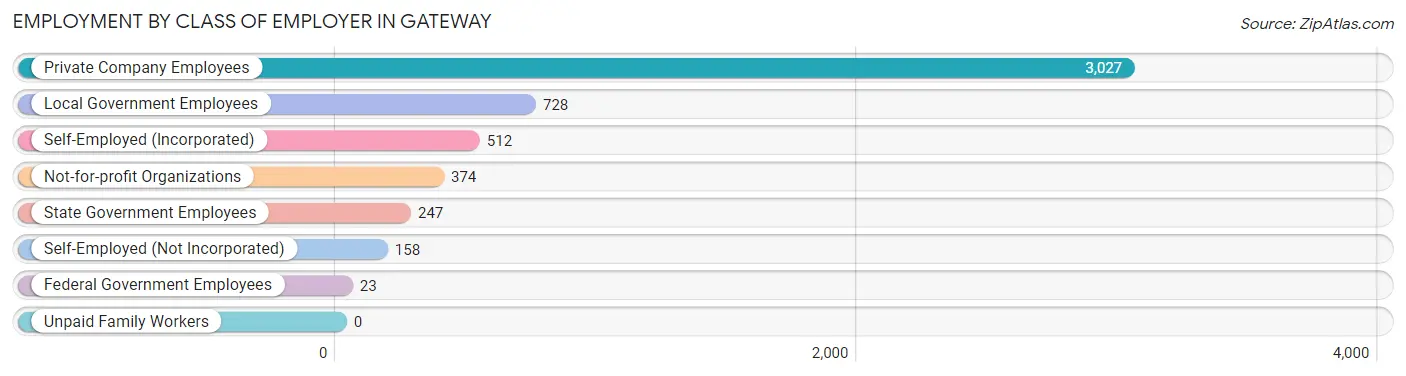
| Employer Class | # Employees | % Employees |
| Private Company Employees | 3,027 | 59.7% |
| Self-Employed (Incorporated) | 512 | 10.1% |
| Self-Employed (Not Incorporated) | 158 | 3.1% |
| Not-for-profit Organizations | 374 | 7.4% |
| Local Government Employees | 728 | 14.4% |
| State Government Employees | 247 | 4.9% |
| Federal Government Employees | 23 | 0.4% |
| Unpaid Family Workers | 0 | 0.0% |
| Total | 5,069 | 100.0% |
Employment Status by Age in Gateway
According to the labor force statistics for Gateway, out of the total population over 16 years of age (8,477), 61.7% or 5,230 individuals are in the labor force, with 1.9% or 99 of them unemployed. The age group with the highest labor force participation rate is 25 to 29 years, with 100.0% or 427 individuals in the labor force. Within the labor force, the 75 years and over age range has the highest percentage of unemployed individuals, with 100.0% or 15 of them being unemployed.
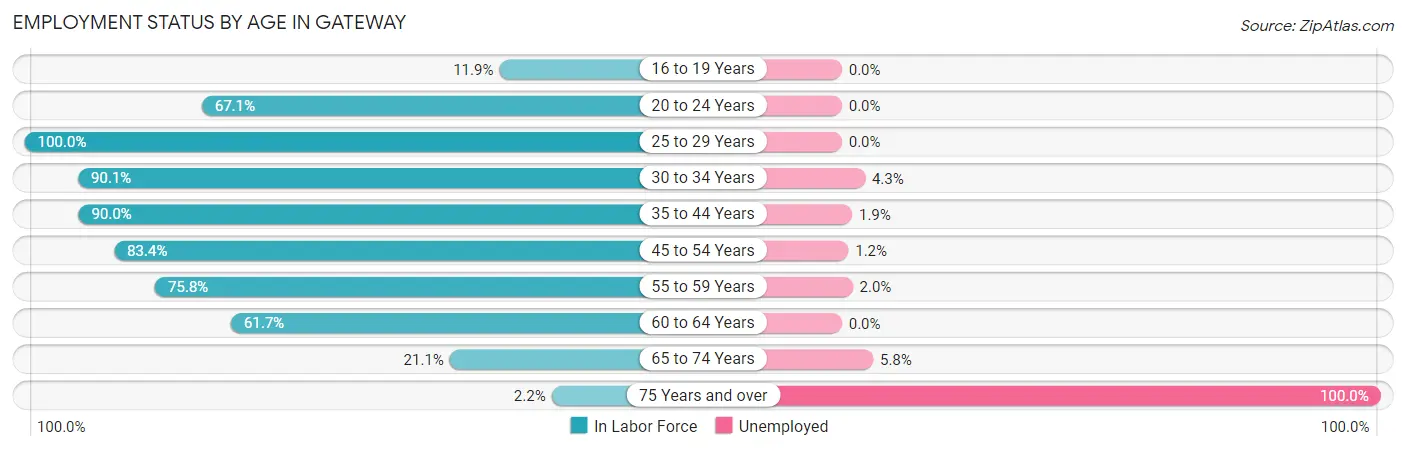
| Age Bracket | In Labor Force | Unemployed |
| 16 to 19 Years | 101 (11.9%) | 0 (0.0%) |
| 20 to 24 Years | 650 (67.1%) | 0 (0.0%) |
| 25 to 29 Years | 427 (100.0%) | 0 (0.0%) |
| 30 to 34 Years | 787 (90.1%) | 34 (4.3%) |
| 35 to 44 Years | 883 (90.0%) | 17 (1.9%) |
| 45 to 54 Years | 1,550 (83.4%) | 19 (1.2%) |
| 55 to 59 Years | 342 (75.8%) | 7 (2.0%) |
| 60 to 64 Years | 288 (61.7%) | 0 (0.0%) |
| 65 to 74 Years | 190 (21.1%) | 11 (5.8%) |
| 75 Years and over | 15 (2.2%) | 15 (100.0%) |
| Total | 5,230 (61.7%) | 99 (1.9%) |
Employment Status by Educational Attainment in Gateway
According to labor force statistics for Gateway, 84.6% of individuals (4,279) out of the total population between 25 and 64 years of age (5,058) are in the labor force, with 1.8% or 77 of them being unemployed. The group with the highest labor force participation rate are those with the educational attainment of college / associate degree, with 90.6% or 1,368 individuals in the labor force. Within the labor force, individuals with college / associate degree education have the highest percentage of unemployment, with 4.2% or 57 of them being unemployed.
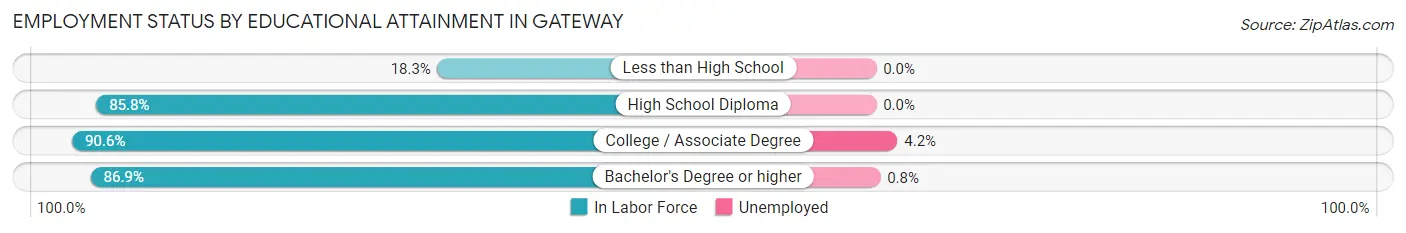
| Educational Attainment | In Labor Force | Unemployed |
| Less than High School | 44 (18.3%) | 0 (0.0%) |
| High School Diploma | 626 (85.8%) | 0 (0.0%) |
| College / Associate Degree | 1,368 (90.6%) | 63 (4.2%) |
| Bachelor's Degree or higher | 2,240 (86.9%) | 21 (0.8%) |
| Total | 4,279 (84.6%) | 91 (1.8%) |
Employment Occupations by Sex in Gateway
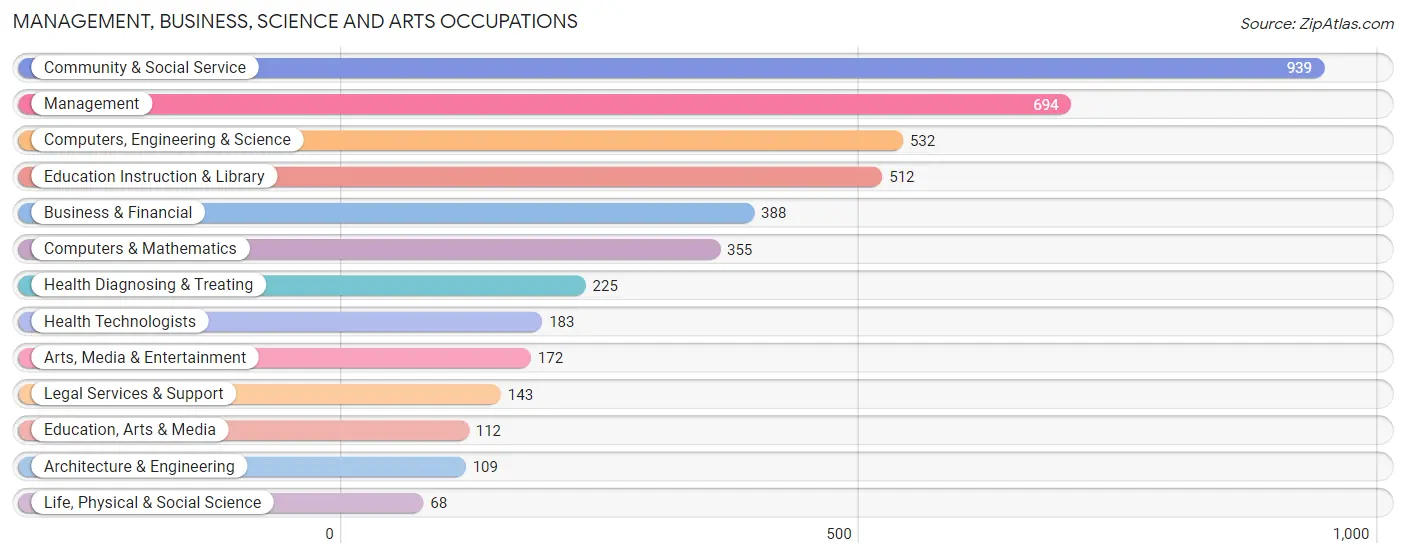
Management, Business, Science and Arts Occupations
The most common Management, Business, Science and Arts occupations in Gateway are Community & Social Service (939 | 18.3%), Management (694 | 13.5%), Computers, Engineering & Science (532 | 10.4%), Education Instruction & Library (512 | 10.0%), and Business & Financial (388 | 7.6%).
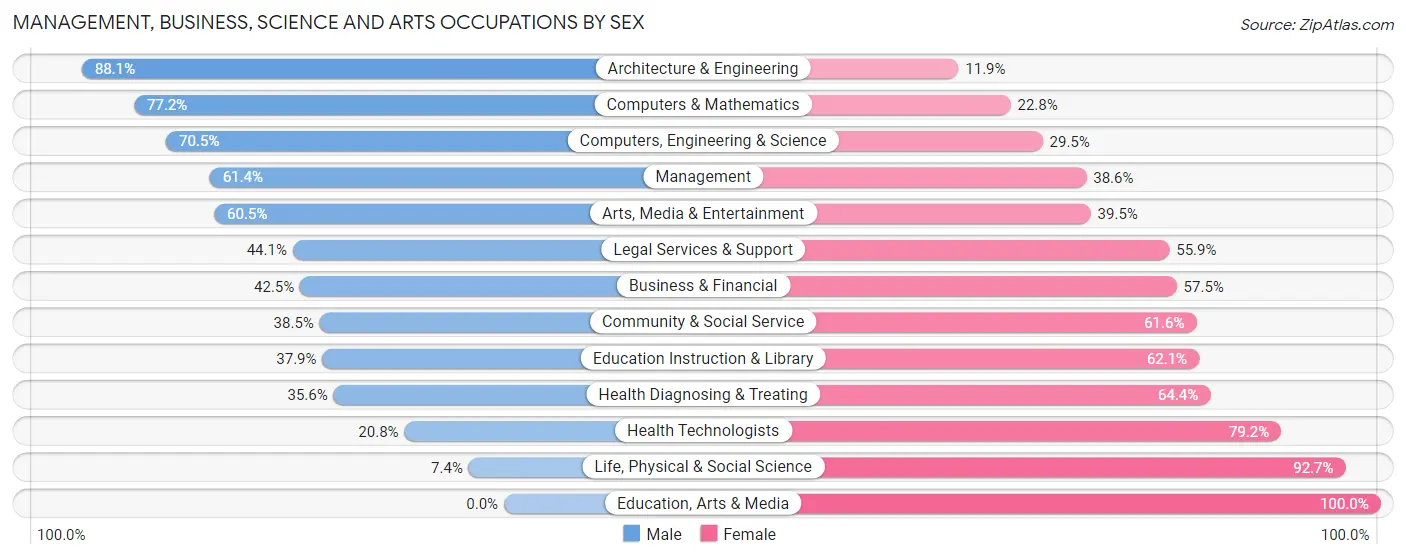
Management, Business, Science and Arts Occupations by Sex
Within the Management, Business, Science and Arts occupations in Gateway, the most male-oriented occupations are Architecture & Engineering (88.1%), Computers & Mathematics (77.2%), and Computers, Engineering & Science (70.5%), while the most female-oriented occupations are Education, Arts & Media (100.0%), Life, Physical & Social Science (92.6%), and Health Technologists (79.2%).
| Occupation | Male | Female |
| Management | 426 (61.4%) | 268 (38.6%) |
| Business & Financial | 165 (42.5%) | 223 (57.5%) |
| Computers, Engineering & Science | 375 (70.5%) | 157 (29.5%) |
| Computers & Mathematics | 274 (77.2%) | 81 (22.8%) |
| Architecture & Engineering | 96 (88.1%) | 13 (11.9%) |
| Life, Physical & Social Science | 5 (7.3%) | 63 (92.6%) |
| Community & Social Service | 361 (38.5%) | 578 (61.6%) |
| Education, Arts & Media | 0 (0.0%) | 112 (100.0%) |
| Legal Services & Support | 63 (44.1%) | 80 (55.9%) |
| Education Instruction & Library | 194 (37.9%) | 318 (62.1%) |
| Arts, Media & Entertainment | 104 (60.5%) | 68 (39.5%) |
| Health Diagnosing & Treating | 80 (35.6%) | 145 (64.4%) |
| Health Technologists | 38 (20.8%) | 145 (79.2%) |
| Total (Category) | 1,407 (50.6%) | 1,371 (49.3%) |
| Total (Overall) | 3,026 (59.0%) | 2,105 (41.0%) |
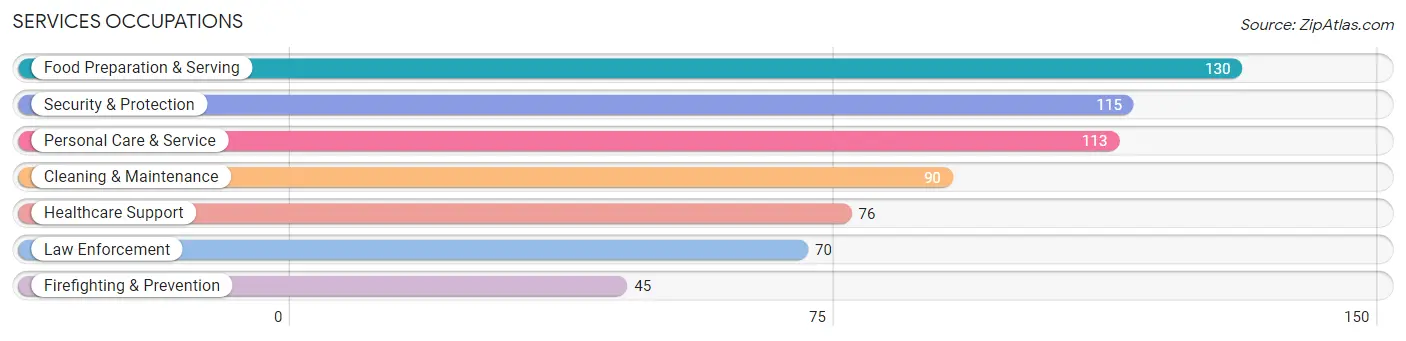
Services Occupations
The most common Services occupations in Gateway are Food Preparation & Serving (130 | 2.5%), Security & Protection (115 | 2.2%), Personal Care & Service (113 | 2.2%), Cleaning & Maintenance (90 | 1.8%), and Healthcare Support (76 | 1.5%).
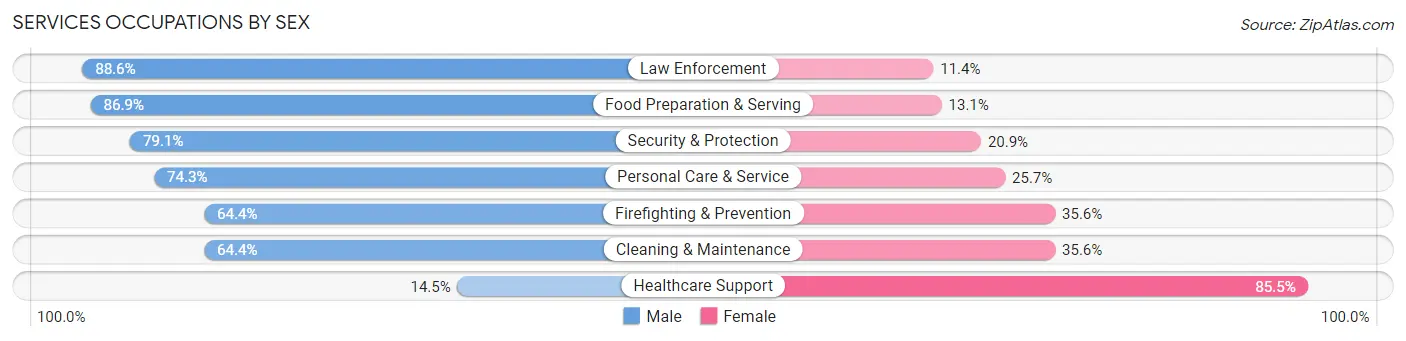
Services Occupations by Sex
Within the Services occupations in Gateway, the most male-oriented occupations are Law Enforcement (88.6%), Food Preparation & Serving (86.9%), and Security & Protection (79.1%), while the most female-oriented occupations are Healthcare Support (85.5%), Firefighting & Prevention (35.6%), and Cleaning & Maintenance (35.6%).
| Occupation | Male | Female |
| Healthcare Support | 11 (14.5%) | 65 (85.5%) |
| Security & Protection | 91 (79.1%) | 24 (20.9%) |
| Firefighting & Prevention | 29 (64.4%) | 16 (35.6%) |
| Law Enforcement | 62 (88.6%) | 8 (11.4%) |
| Food Preparation & Serving | 113 (86.9%) | 17 (13.1%) |
| Cleaning & Maintenance | 58 (64.4%) | 32 (35.6%) |
| Personal Care & Service | 84 (74.3%) | 29 (25.7%) |
| Total (Category) | 357 (68.1%) | 167 (31.9%) |
| Total (Overall) | 3,026 (59.0%) | 2,105 (41.0%) |
Sales and Office Occupations
The most common Sales and Office occupations in Gateway are Sales & Related (636 | 12.4%), and Office & Administration (553 | 10.8%).
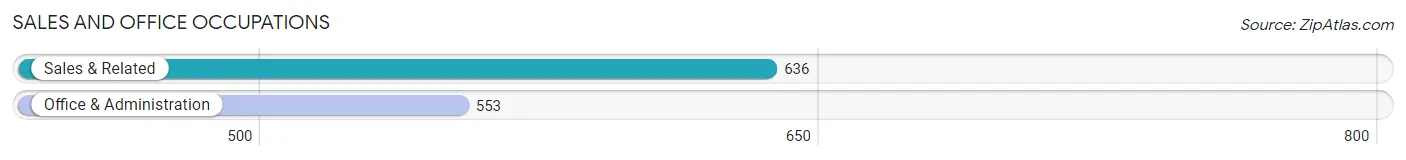
Sales and Office Occupations by Sex
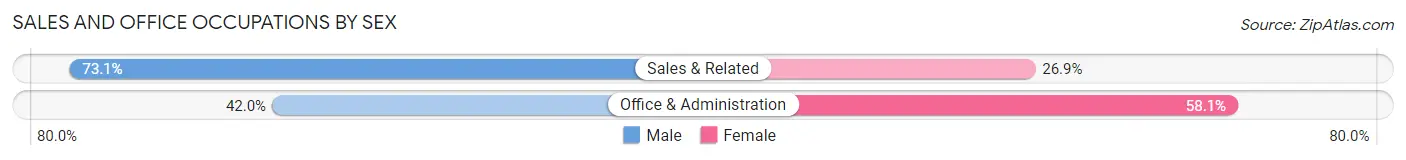
| Occupation | Male | Female |
| Sales & Related | 465 (73.1%) | 171 (26.9%) |
| Office & Administration | 232 (41.9%) | 321 (58.1%) |
| Total (Category) | 697 (58.6%) | 492 (41.4%) |
| Total (Overall) | 3,026 (59.0%) | 2,105 (41.0%) |
Natural Resources, Construction and Maintenance Occupations
The most common Natural Resources, Construction and Maintenance occupations in Gateway are Construction & Extraction (158 | 3.1%), and Installation, Maintenance & Repair (134 | 2.6%).
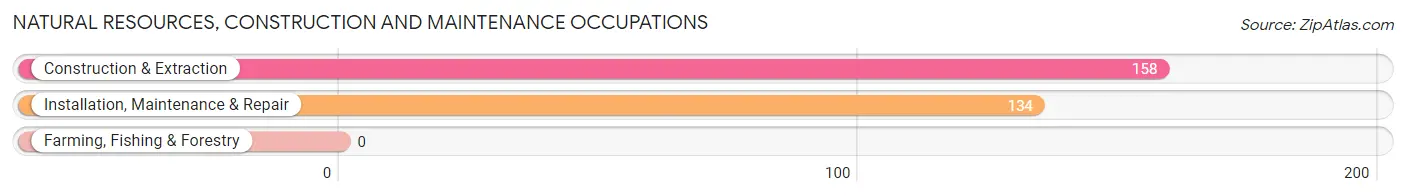
Natural Resources, Construction and Maintenance Occupations by Sex
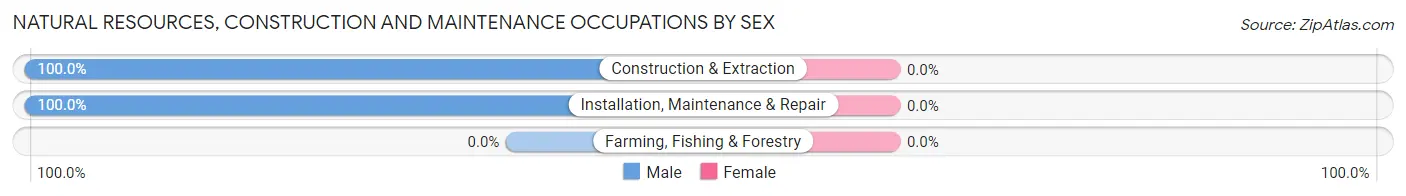
| Occupation | Male | Female |
| Farming, Fishing & Forestry | 0 (0.0%) | 0 (0.0%) |
| Construction & Extraction | 158 (100.0%) | 0 (0.0%) |
| Installation, Maintenance & Repair | 134 (100.0%) | 0 (0.0%) |
| Total (Category) | 292 (100.0%) | 0 (0.0%) |
| Total (Overall) | 3,026 (59.0%) | 2,105 (41.0%) |
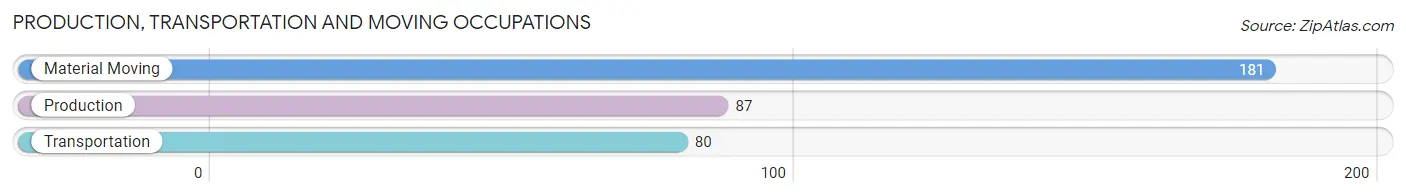
Production, Transportation and Moving Occupations
The most common Production, Transportation and Moving occupations in Gateway are Material Moving (181 | 3.5%), Production (87 | 1.7%), and Transportation (80 | 1.6%).
Production, Transportation and Moving Occupations by Sex
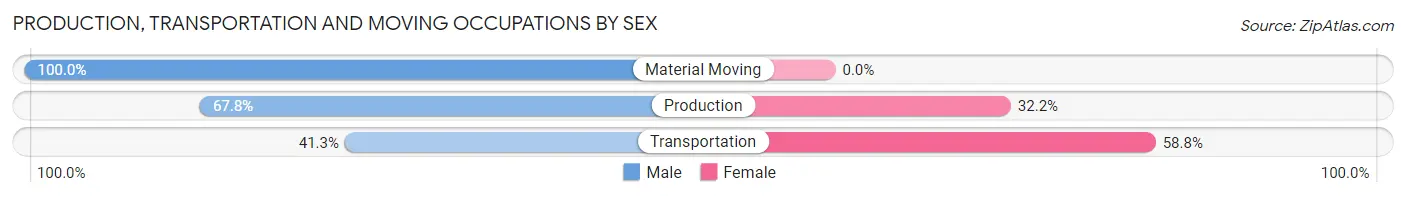
| Occupation | Male | Female |
| Production | 59 (67.8%) | 28 (32.2%) |
| Transportation | 33 (41.2%) | 47 (58.8%) |
| Material Moving | 181 (100.0%) | 0 (0.0%) |
| Total (Category) | 273 (78.4%) | 75 (21.5%) |
| Total (Overall) | 3,026 (59.0%) | 2,105 (41.0%) |
Employment Industries by Sex in Gateway
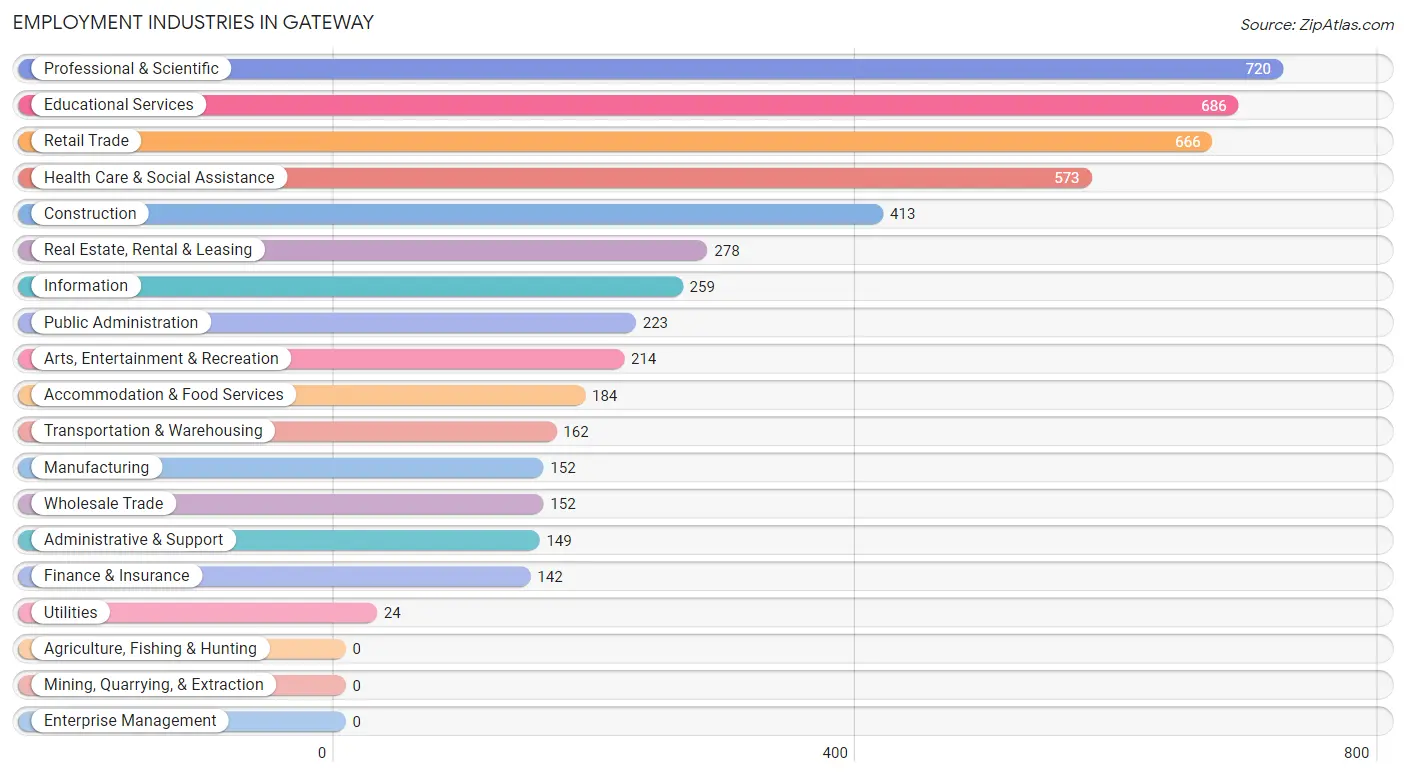
Employment Industries in Gateway
The major employment industries in Gateway include Professional & Scientific (720 | 14.0%), Educational Services (686 | 13.4%), Retail Trade (666 | 13.0%), Health Care & Social Assistance (573 | 11.2%), and Construction (413 | 8.1%).
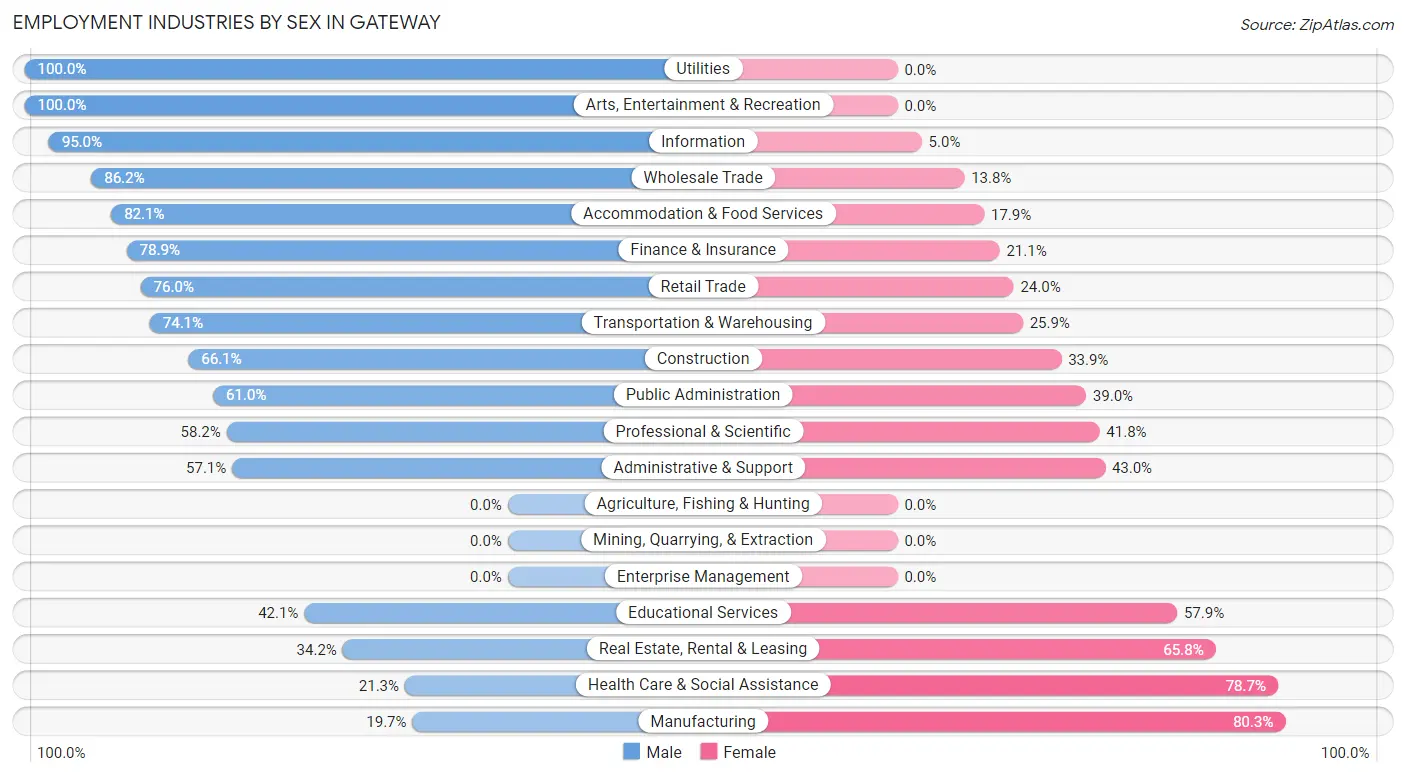
Employment Industries by Sex in Gateway
The Gateway industries that see more men than women are Utilities (100.0%), Arts, Entertainment & Recreation (100.0%), and Information (95.0%), whereas the industries that tend to have a higher number of women are Manufacturing (80.3%), Health Care & Social Assistance (78.7%), and Real Estate, Rental & Leasing (65.8%).
| Industry | Male | Female |
| Agriculture, Fishing & Hunting | 0 (0.0%) | 0 (0.0%) |
| Mining, Quarrying, & Extraction | 0 (0.0%) | 0 (0.0%) |
| Construction | 273 (66.1%) | 140 (33.9%) |
| Manufacturing | 30 (19.7%) | 122 (80.3%) |
| Wholesale Trade | 131 (86.2%) | 21 (13.8%) |
| Retail Trade | 506 (76.0%) | 160 (24.0%) |
| Transportation & Warehousing | 120 (74.1%) | 42 (25.9%) |
| Utilities | 24 (100.0%) | 0 (0.0%) |
| Information | 246 (95.0%) | 13 (5.0%) |
| Finance & Insurance | 112 (78.9%) | 30 (21.1%) |
| Real Estate, Rental & Leasing | 95 (34.2%) | 183 (65.8%) |
| Professional & Scientific | 419 (58.2%) | 301 (41.8%) |
| Enterprise Management | 0 (0.0%) | 0 (0.0%) |
| Administrative & Support | 85 (57.1%) | 64 (42.9%) |
| Educational Services | 289 (42.1%) | 397 (57.9%) |
| Health Care & Social Assistance | 122 (21.3%) | 451 (78.7%) |
| Arts, Entertainment & Recreation | 214 (100.0%) | 0 (0.0%) |
| Accommodation & Food Services | 151 (82.1%) | 33 (17.9%) |
| Public Administration | 136 (61.0%) | 87 (39.0%) |
| Total | 3,026 (59.0%) | 2,105 (41.0%) |
Education in Gateway
School Enrollment in Gateway
The most common levels of schooling among the 2,862 students in Gateway are high school (973 | 34.0%), college / undergraduate (492 | 17.2%), and elementary school (491 | 17.2%).
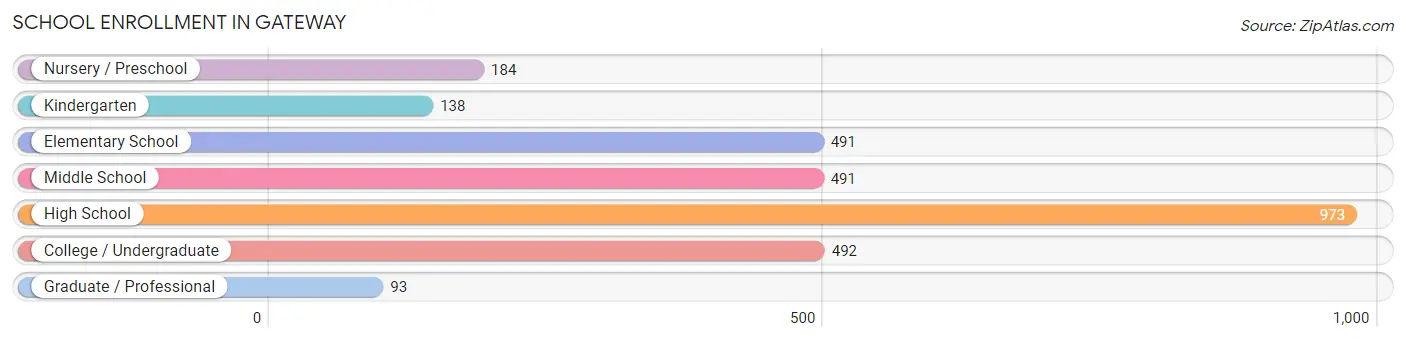
| School Level | # Students | % Students |
| Nursery / Preschool | 184 | 6.4% |
| Kindergarten | 138 | 4.8% |
| Elementary School | 491 | 17.2% |
| Middle School | 491 | 17.2% |
| High School | 973 | 34.0% |
| College / Undergraduate | 492 | 17.2% |
| Graduate / Professional | 93 | 3.3% |
| Total | 2,862 | 100.0% |
School Enrollment by Age by Funding Source in Gateway
Out of a total of 2,862 students who are enrolled in schools in Gateway, 675 (23.6%) attend a private institution, while the remaining 2,187 (76.4%) are enrolled in public schools. The age group of 3 to 4 year olds has the highest likelihood of being enrolled in private schools, with 105 (78.4% in the age bracket) enrolled. Conversely, the age group of 20 to 24 year olds has the lowest likelihood of being enrolled in a private school, with 402 (100.0% in the age bracket) attending a public institution.
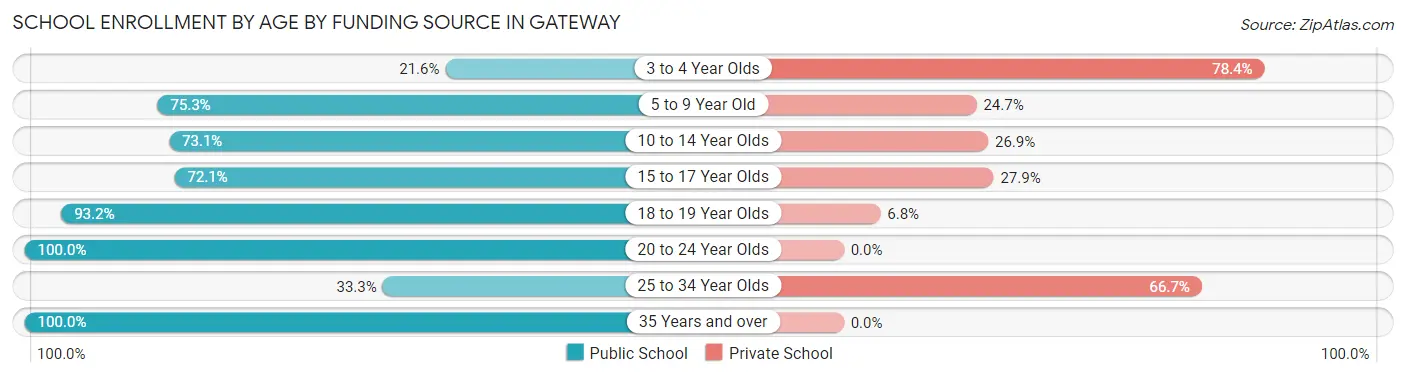
| Age Bracket | Public School | Private School |
| 3 to 4 Year Olds | 29 (21.6%) | 105 (78.4%) |
| 5 to 9 Year Old | 511 (75.3%) | 168 (24.7%) |
| 10 to 14 Year Olds | 435 (73.1%) | 160 (26.9%) |
| 15 to 17 Year Olds | 465 (72.1%) | 180 (27.9%) |
| 18 to 19 Year Olds | 273 (93.2%) | 20 (6.8%) |
| 20 to 24 Year Olds | 402 (100.0%) | 0 (0.0%) |
| 25 to 34 Year Olds | 21 (33.3%) | 42 (66.7%) |
| 35 Years and over | 51 (100.0%) | 0 (0.0%) |
| Total | 2,187 (76.4%) | 675 (23.6%) |
Educational Attainment by Field of Study in Gateway
Business (704 | 20.6%), science & technology (470 | 13.8%), education (460 | 13.5%), engineering (298 | 8.7%), and social sciences (245 | 7.2%) are the most common fields of study among 3,409 individuals in Gateway who have obtained a bachelor's degree or higher.
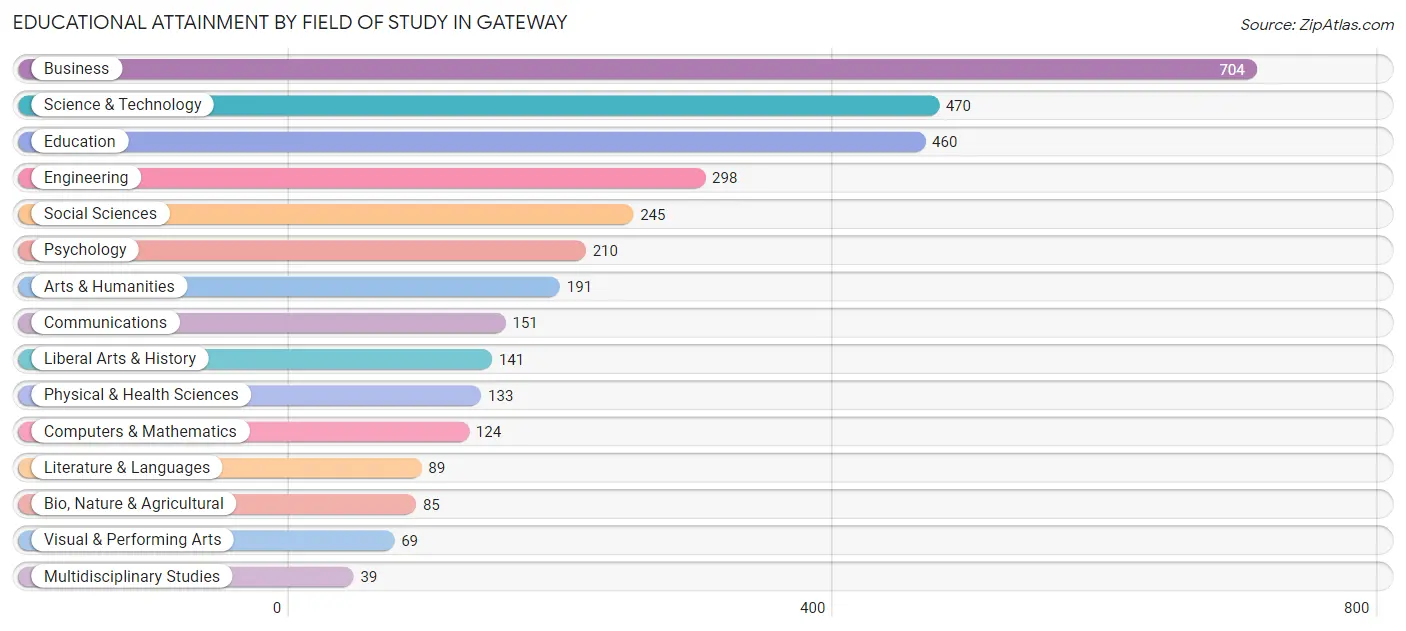
| Field of Study | # Graduates | % Graduates |
| Computers & Mathematics | 124 | 3.6% |
| Bio, Nature & Agricultural | 85 | 2.5% |
| Physical & Health Sciences | 133 | 3.9% |
| Psychology | 210 | 6.2% |
| Social Sciences | 245 | 7.2% |
| Engineering | 298 | 8.7% |
| Multidisciplinary Studies | 39 | 1.1% |
| Science & Technology | 470 | 13.8% |
| Business | 704 | 20.6% |
| Education | 460 | 13.5% |
| Literature & Languages | 89 | 2.6% |
| Liberal Arts & History | 141 | 4.1% |
| Visual & Performing Arts | 69 | 2.0% |
| Communications | 151 | 4.4% |
| Arts & Humanities | 191 | 5.6% |
| Total | 3,409 | 100.0% |
Transportation & Commute in Gateway
Vehicle Availability by Sex in Gateway
The most prevalent vehicle ownership categories in Gateway are males with 2 vehicles (1,202, accounting for 39.7%) and females with 2 vehicles (992, making up 58.8%).
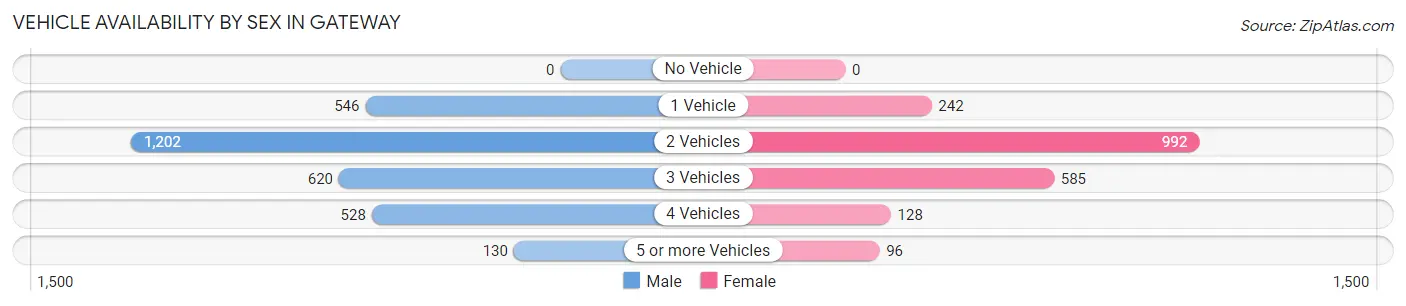
| Vehicles Available | Male | Female |
| No Vehicle | 0 (0.0%) | 0 (0.0%) |
| 1 Vehicle | 546 (18.0%) | 242 (11.8%) |
| 2 Vehicles | 1,202 (39.7%) | 992 (48.6%) |
| 3 Vehicles | 620 (20.5%) | 585 (28.6%) |
| 4 Vehicles | 528 (17.4%) | 128 (6.3%) |
| 5 or more Vehicles | 130 (4.3%) | 96 (4.7%) |
| Total | 3,026 (100.0%) | 2,043 (100.0%) |
Commute Time in Gateway
The most frequently occuring commute durations in Gateway are 30 to 34 minutes (952 commuters, 22.5%), 20 to 24 minutes (631 commuters, 14.9%), and 25 to 29 minutes (469 commuters, 11.1%).
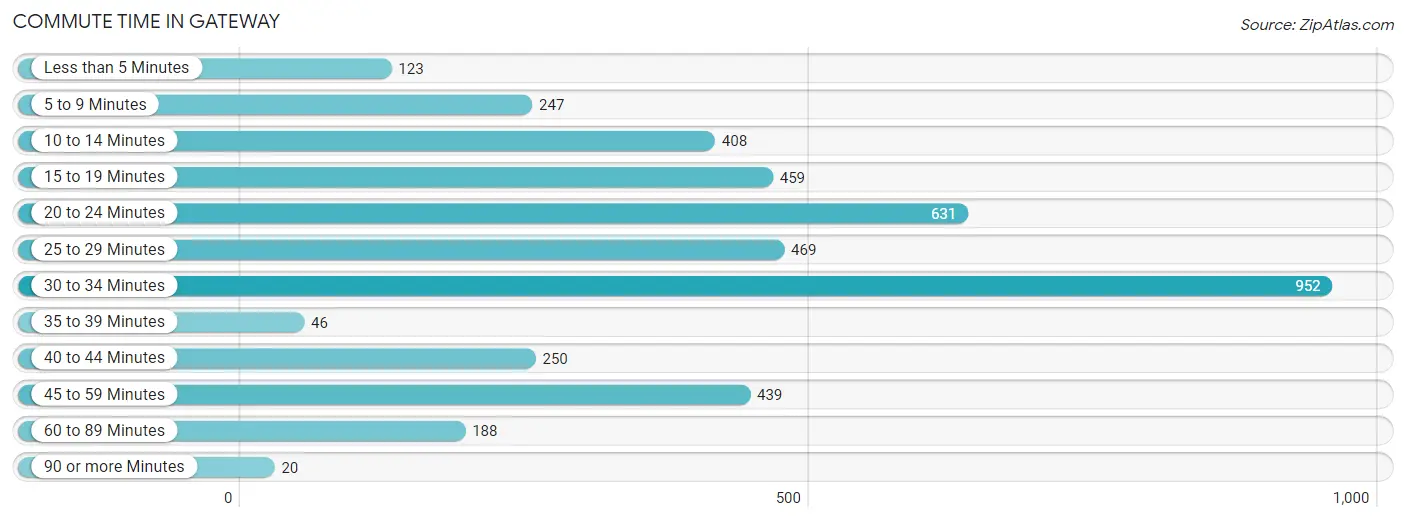
| Commute Time | # Commuters | % Commuters |
| Less than 5 Minutes | 123 | 2.9% |
| 5 to 9 Minutes | 247 | 5.8% |
| 10 to 14 Minutes | 408 | 9.6% |
| 15 to 19 Minutes | 459 | 10.8% |
| 20 to 24 Minutes | 631 | 14.9% |
| 25 to 29 Minutes | 469 | 11.1% |
| 30 to 34 Minutes | 952 | 22.5% |
| 35 to 39 Minutes | 46 | 1.1% |
| 40 to 44 Minutes | 250 | 5.9% |
| 45 to 59 Minutes | 439 | 10.4% |
| 60 to 89 Minutes | 188 | 4.4% |
| 90 or more Minutes | 20 | 0.5% |
Commute Time by Sex in Gateway
The most common commute times in Gateway are 30 to 34 minutes (540 commuters, 21.6%) for males and 30 to 34 minutes (412 commuters, 23.8%) for females.
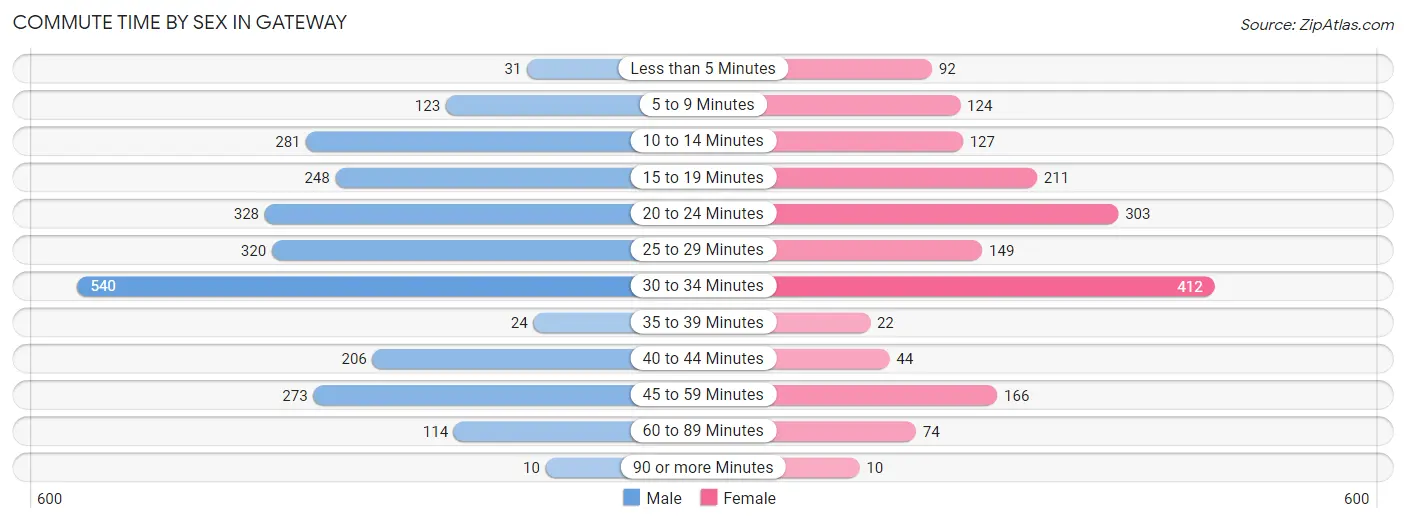
| Commute Time | Male | Female |
| Less than 5 Minutes | 31 (1.2%) | 92 (5.3%) |
| 5 to 9 Minutes | 123 (4.9%) | 124 (7.1%) |
| 10 to 14 Minutes | 281 (11.3%) | 127 (7.3%) |
| 15 to 19 Minutes | 248 (9.9%) | 211 (12.2%) |
| 20 to 24 Minutes | 328 (13.1%) | 303 (17.5%) |
| 25 to 29 Minutes | 320 (12.8%) | 149 (8.6%) |
| 30 to 34 Minutes | 540 (21.6%) | 412 (23.8%) |
| 35 to 39 Minutes | 24 (1.0%) | 22 (1.3%) |
| 40 to 44 Minutes | 206 (8.3%) | 44 (2.5%) |
| 45 to 59 Minutes | 273 (10.9%) | 166 (9.6%) |
| 60 to 89 Minutes | 114 (4.6%) | 74 (4.3%) |
| 90 or more Minutes | 10 (0.4%) | 10 (0.6%) |
Time of Departure to Work by Sex in Gateway
The most frequent times of departure to work in Gateway are 6:00 AM to 6:29 AM (508, 20.3%) for males and 8:00 AM to 8:29 AM (436, 25.1%) for females.
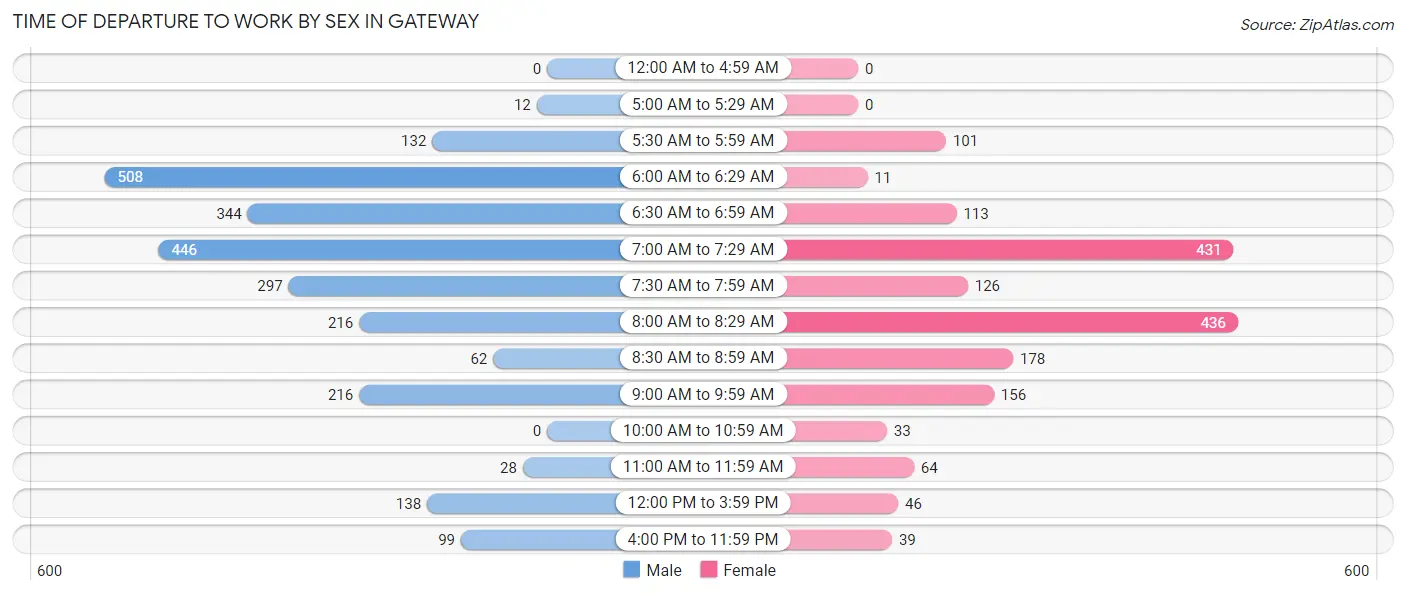
| Time of Departure | Male | Female |
| 12:00 AM to 4:59 AM | 0 (0.0%) | 0 (0.0%) |
| 5:00 AM to 5:29 AM | 12 (0.5%) | 0 (0.0%) |
| 5:30 AM to 5:59 AM | 132 (5.3%) | 101 (5.8%) |
| 6:00 AM to 6:29 AM | 508 (20.3%) | 11 (0.6%) |
| 6:30 AM to 6:59 AM | 344 (13.8%) | 113 (6.5%) |
| 7:00 AM to 7:29 AM | 446 (17.8%) | 431 (24.9%) |
| 7:30 AM to 7:59 AM | 297 (11.9%) | 126 (7.3%) |
| 8:00 AM to 8:29 AM | 216 (8.6%) | 436 (25.1%) |
| 8:30 AM to 8:59 AM | 62 (2.5%) | 178 (10.3%) |
| 9:00 AM to 9:59 AM | 216 (8.6%) | 156 (9.0%) |
| 10:00 AM to 10:59 AM | 0 (0.0%) | 33 (1.9%) |
| 11:00 AM to 11:59 AM | 28 (1.1%) | 64 (3.7%) |
| 12:00 PM to 3:59 PM | 138 (5.5%) | 46 (2.6%) |
| 4:00 PM to 11:59 PM | 99 (4.0%) | 39 (2.2%) |
| Total | 2,498 (100.0%) | 1,734 (100.0%) |
Housing Occupancy in Gateway
Occupancy by Ownership in Gateway
Of the total 3,610 dwellings in Gateway, owner-occupied units account for 3,043 (84.3%), while renter-occupied units make up 567 (15.7%).
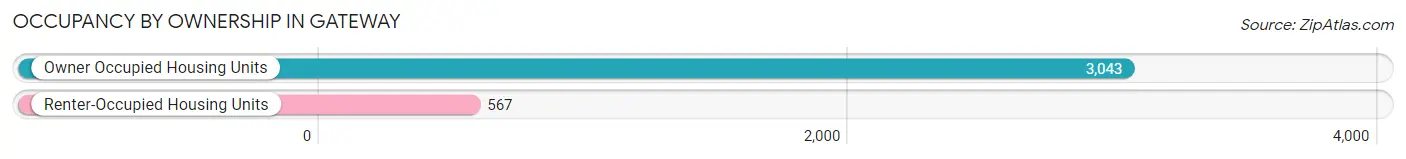
| Occupancy | # Housing Units | % Housing Units |
| Owner Occupied Housing Units | 3,043 | 84.3% |
| Renter-Occupied Housing Units | 567 | 15.7% |
| Total Occupied Housing Units | 3,610 | 100.0% |
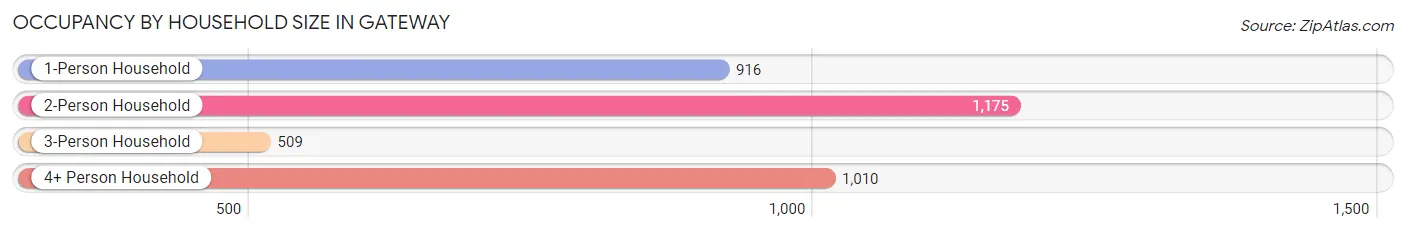
Occupancy by Household Size in Gateway
| Household Size | # Housing Units | % Housing Units |
| 1-Person Household | 916 | 25.4% |
| 2-Person Household | 1,175 | 32.6% |
| 3-Person Household | 509 | 14.1% |
| 4+ Person Household | 1,010 | 28.0% |
| Total Housing Units | 3,610 | 100.0% |
Occupancy by Ownership by Household Size in Gateway
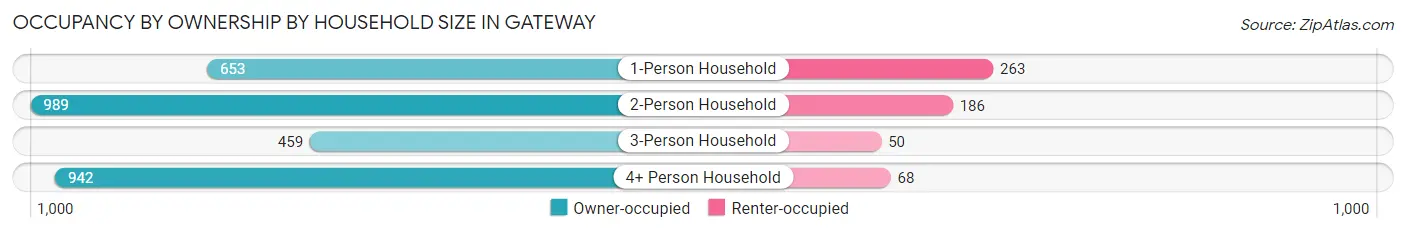
| Household Size | Owner-occupied | Renter-occupied |
| 1-Person Household | 653 (71.3%) | 263 (28.7%) |
| 2-Person Household | 989 (84.2%) | 186 (15.8%) |
| 3-Person Household | 459 (90.2%) | 50 (9.8%) |
| 4+ Person Household | 942 (93.3%) | 68 (6.7%) |
| Total Housing Units | 3,043 (84.3%) | 567 (15.7%) |
Occupancy by Educational Attainment in Gateway
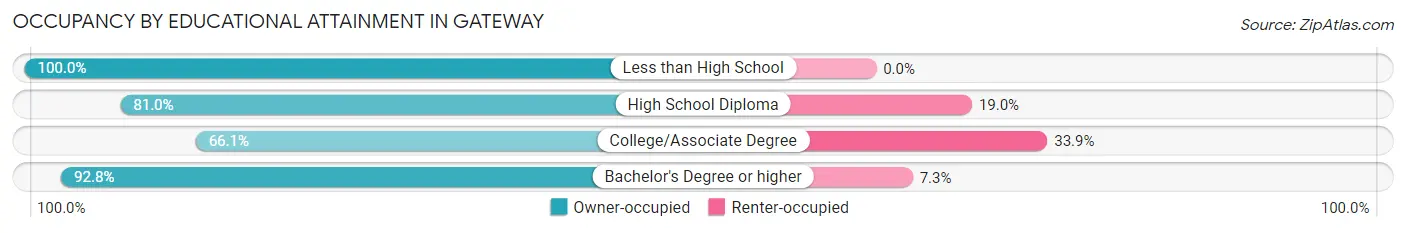
| Household Size | Owner-occupied | Renter-occupied |
| Less than High School | 86 (100.0%) | 0 (0.0%) |
| High School Diploma | 495 (81.0%) | 116 (19.0%) |
| College/Associate Degree | 594 (66.1%) | 305 (33.9%) |
| Bachelor's Degree or higher | 1,868 (92.7%) | 146 (7.2%) |
Occupancy by Age of Householder in Gateway
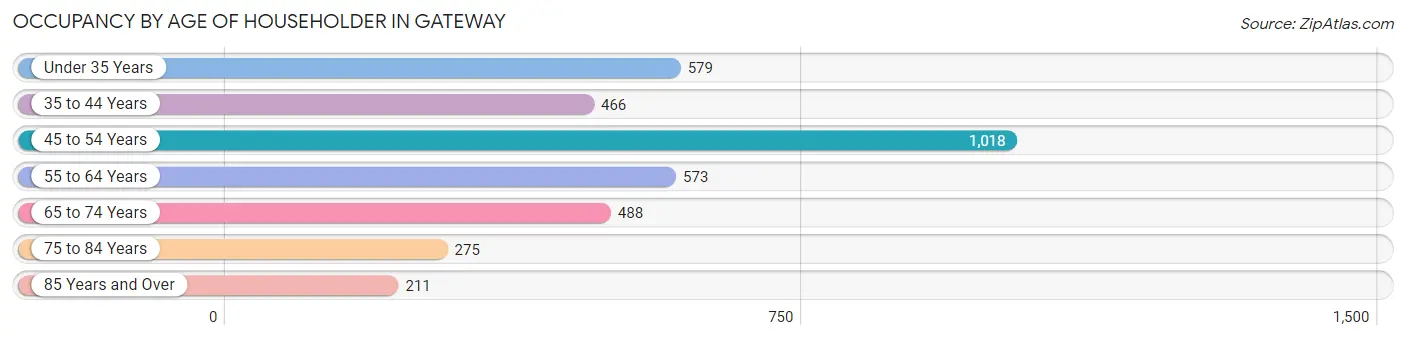
| Age Bracket | # Households | % Households |
| Under 35 Years | 579 | 16.0% |
| 35 to 44 Years | 466 | 12.9% |
| 45 to 54 Years | 1,018 | 28.2% |
| 55 to 64 Years | 573 | 15.9% |
| 65 to 74 Years | 488 | 13.5% |
| 75 to 84 Years | 275 | 7.6% |
| 85 Years and Over | 211 | 5.8% |
| Total | 3,610 | 100.0% |
Housing Finances in Gateway
Median Income by Occupancy in Gateway
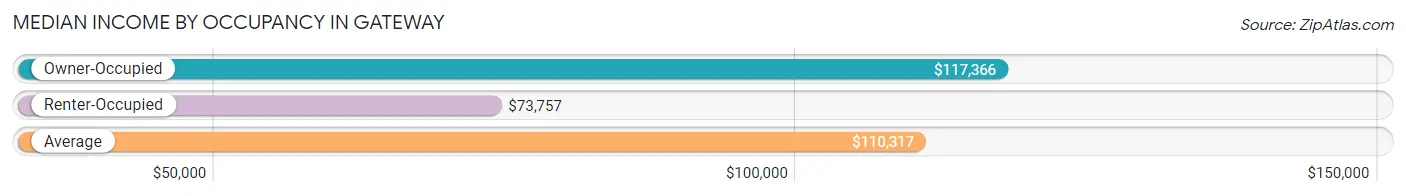
| Occupancy Type | # Households | Median Income |
| Owner-Occupied | 3,043 (84.3%) | $117,366 |
| Renter-Occupied | 567 (15.7%) | $73,757 |
| Average | 3,610 (100.0%) | $110,317 |
Occupancy by Householder Income Bracket in Gateway
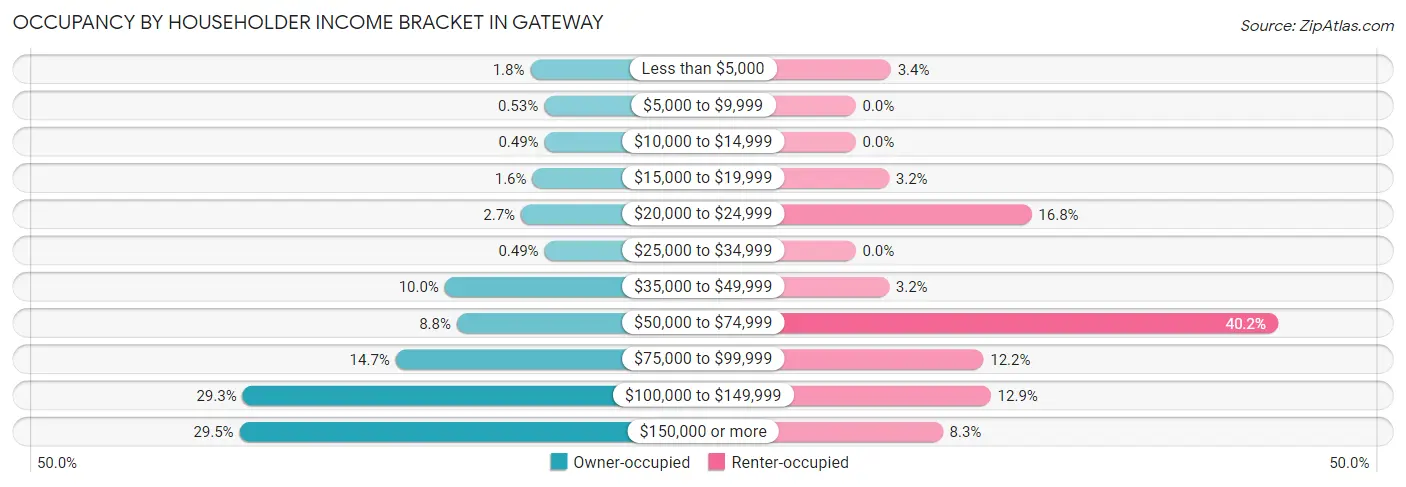
| Income Bracket | Owner-occupied | Renter-occupied |
| Less than $5,000 | 56 (1.8%) | 19 (3.4%) |
| $5,000 to $9,999 | 16 (0.5%) | 0 (0.0%) |
| $10,000 to $14,999 | 15 (0.5%) | 0 (0.0%) |
| $15,000 to $19,999 | 50 (1.6%) | 18 (3.2%) |
| $20,000 to $24,999 | 83 (2.7%) | 95 (16.8%) |
| $25,000 to $34,999 | 15 (0.5%) | 0 (0.0%) |
| $35,000 to $49,999 | 304 (10.0%) | 18 (3.2%) |
| $50,000 to $74,999 | 269 (8.8%) | 228 (40.2%) |
| $75,000 to $99,999 | 446 (14.7%) | 69 (12.2%) |
| $100,000 to $149,999 | 890 (29.2%) | 73 (12.9%) |
| $150,000 or more | 899 (29.5%) | 47 (8.3%) |
| Total | 3,043 (100.0%) | 567 (100.0%) |
Monthly Housing Cost Tiers in Gateway
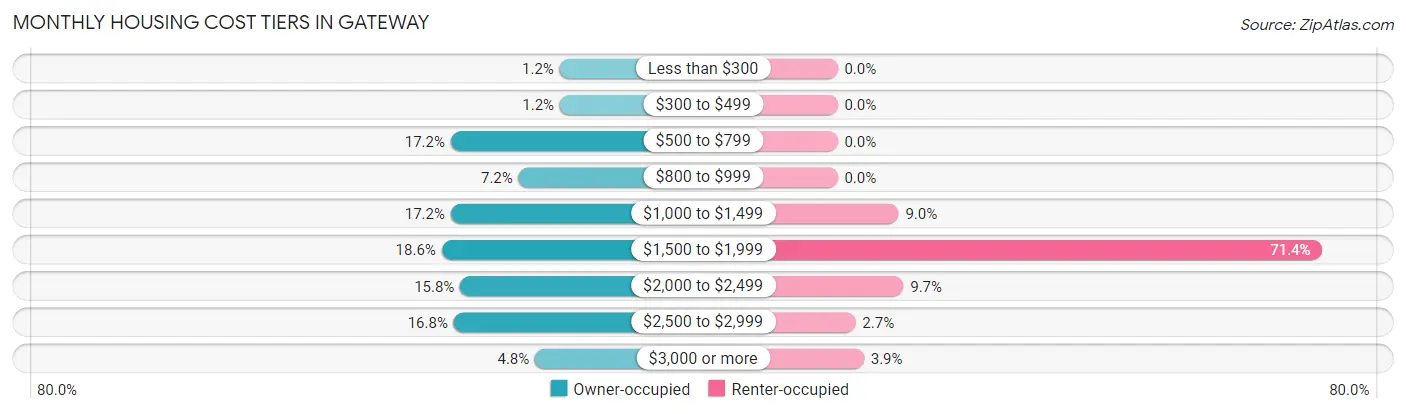
| Monthly Cost | Owner-occupied | Renter-occupied |
| Less than $300 | 36 (1.2%) | 0 (0.0%) |
| $300 to $499 | 35 (1.1%) | 0 (0.0%) |
| $500 to $799 | 524 (17.2%) | 0 (0.0%) |
| $800 to $999 | 220 (7.2%) | 0 (0.0%) |
| $1,000 to $1,499 | 524 (17.2%) | 51 (9.0%) |
| $1,500 to $1,999 | 565 (18.6%) | 405 (71.4%) |
| $2,000 to $2,499 | 482 (15.8%) | 55 (9.7%) |
| $2,500 to $2,999 | 511 (16.8%) | 15 (2.6%) |
| $3,000 or more | 146 (4.8%) | 22 (3.9%) |
| Total | 3,043 (100.0%) | 567 (100.0%) |
Physical Housing Characteristics in Gateway
Housing Structures in Gateway
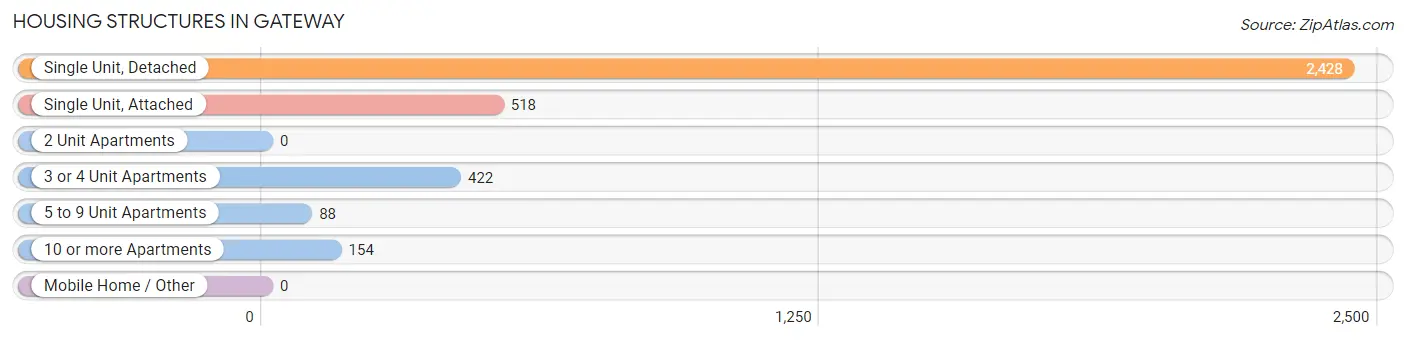
| Structure Type | # Housing Units | % Housing Units |
| Single Unit, Detached | 2,428 | 67.3% |
| Single Unit, Attached | 518 | 14.3% |
| 2 Unit Apartments | 0 | 0.0% |
| 3 or 4 Unit Apartments | 422 | 11.7% |
| 5 to 9 Unit Apartments | 88 | 2.4% |
| 10 or more Apartments | 154 | 4.3% |
| Mobile Home / Other | 0 | 0.0% |
| Total | 3,610 | 100.0% |
Housing Structures by Occupancy in Gateway
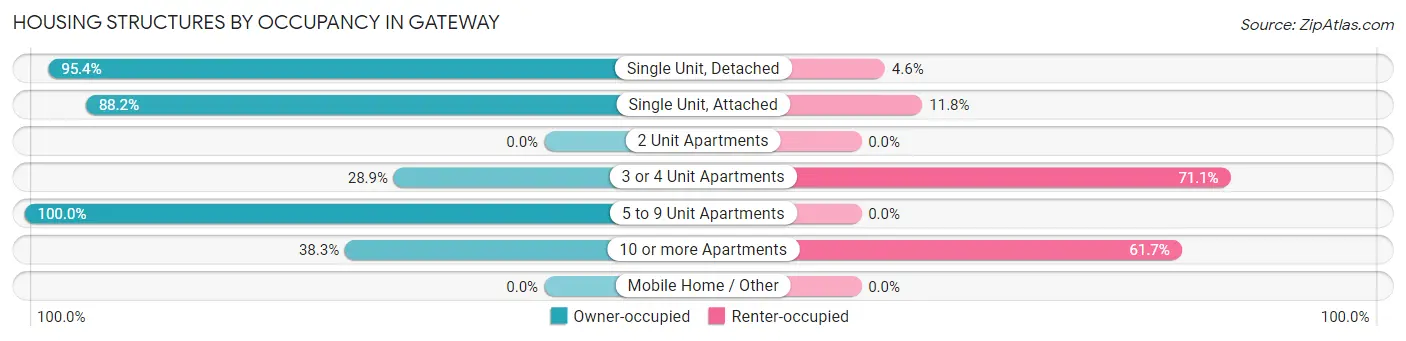
| Structure Type | Owner-occupied | Renter-occupied |
| Single Unit, Detached | 2,317 (95.4%) | 111 (4.6%) |
| Single Unit, Attached | 457 (88.2%) | 61 (11.8%) |
| 2 Unit Apartments | 0 (0.0%) | 0 (0.0%) |
| 3 or 4 Unit Apartments | 122 (28.9%) | 300 (71.1%) |
| 5 to 9 Unit Apartments | 88 (100.0%) | 0 (0.0%) |
| 10 or more Apartments | 59 (38.3%) | 95 (61.7%) |
| Mobile Home / Other | 0 (0.0%) | 0 (0.0%) |
| Total | 3,043 (84.3%) | 567 (15.7%) |
Housing Structures by Number of Rooms in Gateway
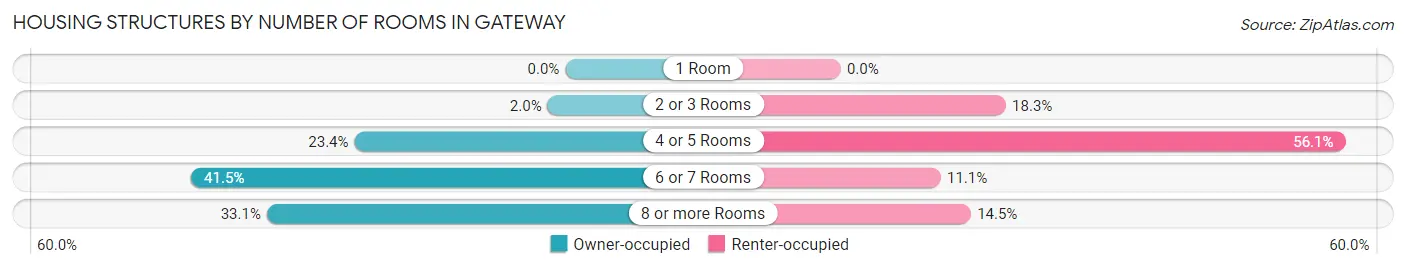
| Number of Rooms | Owner-occupied | Renter-occupied |
| 1 Room | 0 (0.0%) | 0 (0.0%) |
| 2 or 3 Rooms | 60 (2.0%) | 104 (18.3%) |
| 4 or 5 Rooms | 712 (23.4%) | 318 (56.1%) |
| 6 or 7 Rooms | 1,263 (41.5%) | 63 (11.1%) |
| 8 or more Rooms | 1,008 (33.1%) | 82 (14.5%) |
| Total | 3,043 (100.0%) | 567 (100.0%) |
Housing Structure by Heating Type in Gateway
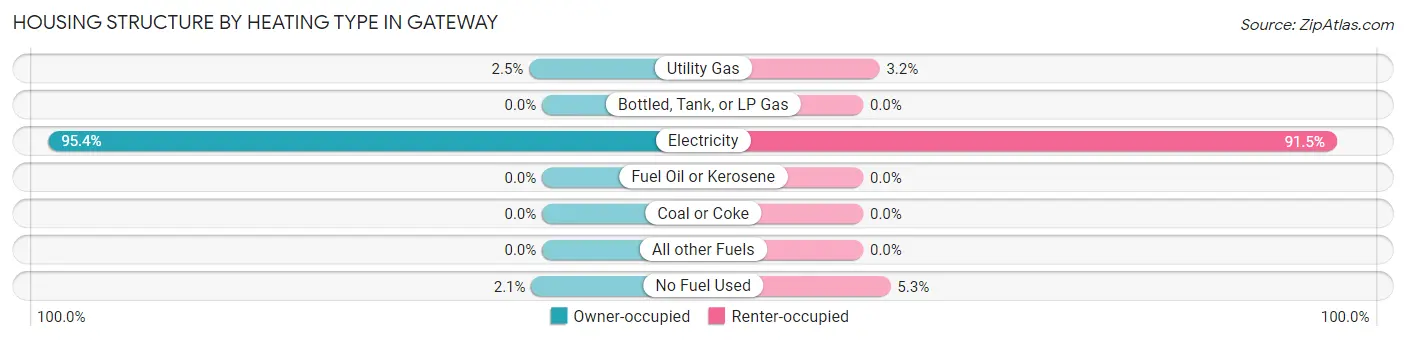
| Heating Type | Owner-occupied | Renter-occupied |
| Utility Gas | 76 (2.5%) | 18 (3.2%) |
| Bottled, Tank, or LP Gas | 0 (0.0%) | 0 (0.0%) |
| Electricity | 2,904 (95.4%) | 519 (91.5%) |
| Fuel Oil or Kerosene | 0 (0.0%) | 0 (0.0%) |
| Coal or Coke | 0 (0.0%) | 0 (0.0%) |
| All other Fuels | 0 (0.0%) | 0 (0.0%) |
| No Fuel Used | 63 (2.1%) | 30 (5.3%) |
| Total | 3,043 (100.0%) | 567 (100.0%) |
Household Vehicle Usage in Gateway
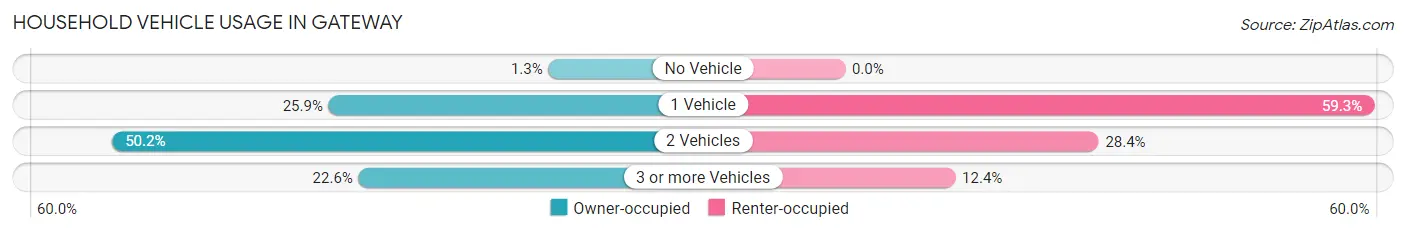
| Vehicles per Household | Owner-occupied | Renter-occupied |
| No Vehicle | 40 (1.3%) | 0 (0.0%) |
| 1 Vehicle | 789 (25.9%) | 336 (59.3%) |
| 2 Vehicles | 1,527 (50.2%) | 161 (28.4%) |
| 3 or more Vehicles | 687 (22.6%) | 70 (12.3%) |
| Total | 3,043 (100.0%) | 567 (100.0%) |
Real Estate & Mortgages in Gateway
Real Estate and Mortgage Overview in Gateway
| Characteristic | Without Mortgage | With Mortgage |
| Housing Units | 950 | 2,093 |
| Median Property Value | $338,100 | $361,100 |
| Median Household Income | $94,032 | $706 |
| Monthly Housing Costs | $725 | $146 |
| Real Estate Taxes | $3,500 | $110 |
Property Value by Mortgage Status in Gateway
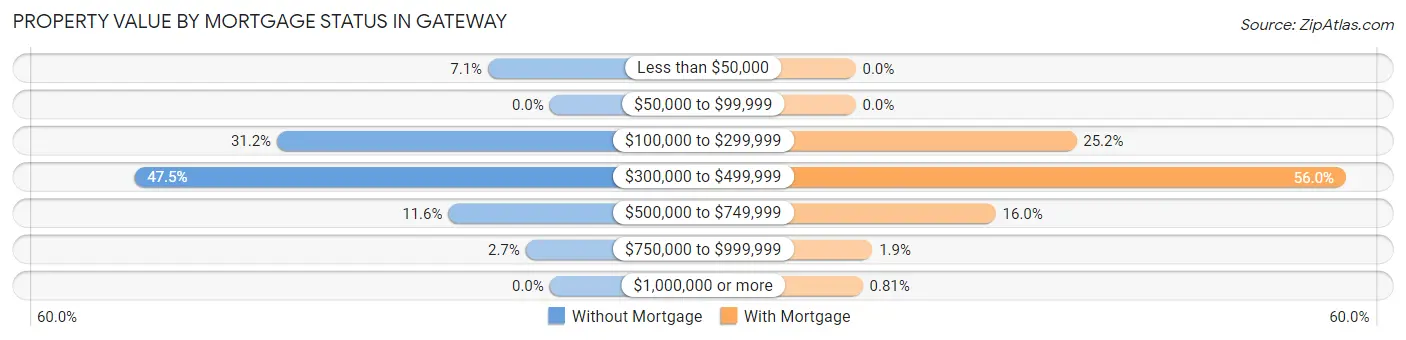
| Property Value | Without Mortgage | With Mortgage |
| Less than $50,000 | 67 (7.0%) | 0 (0.0%) |
| $50,000 to $99,999 | 0 (0.0%) | 0 (0.0%) |
| $100,000 to $299,999 | 296 (31.2%) | 528 (25.2%) |
| $300,000 to $499,999 | 451 (47.5%) | 1,173 (56.0%) |
| $500,000 to $749,999 | 110 (11.6%) | 335 (16.0%) |
| $750,000 to $999,999 | 26 (2.7%) | 40 (1.9%) |
| $1,000,000 or more | 0 (0.0%) | 17 (0.8%) |
| Total | 950 (100.0%) | 2,093 (100.0%) |
Household Income by Mortgage Status in Gateway
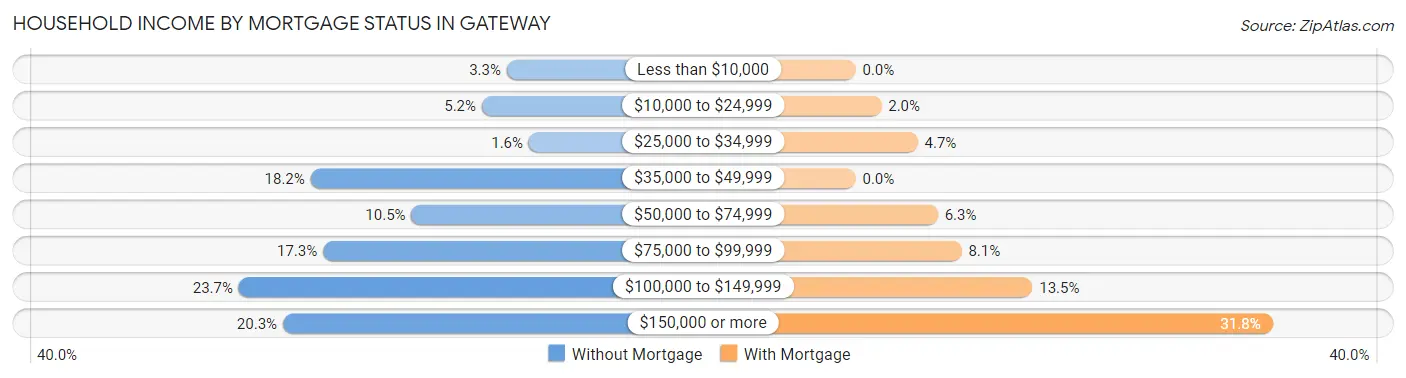
| Household Income | Without Mortgage | With Mortgage |
| Less than $10,000 | 31 (3.3%) | 0 (0.0%) |
| $10,000 to $24,999 | 49 (5.2%) | 41 (2.0%) |
| $25,000 to $34,999 | 15 (1.6%) | 99 (4.7%) |
| $35,000 to $49,999 | 173 (18.2%) | 0 (0.0%) |
| $50,000 to $74,999 | 100 (10.5%) | 131 (6.3%) |
| $75,000 to $99,999 | 164 (17.3%) | 169 (8.1%) |
| $100,000 to $149,999 | 225 (23.7%) | 282 (13.5%) |
| $150,000 or more | 193 (20.3%) | 665 (31.8%) |
| Total | 950 (100.0%) | 2,093 (100.0%) |
Property Value to Household Income Ratio in Gateway
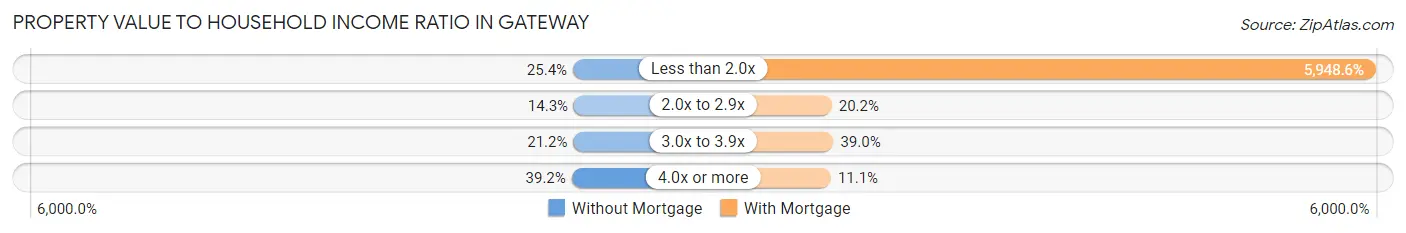
| Value-to-Income Ratio | Without Mortgage | With Mortgage |
| Less than 2.0x | 241 (25.4%) | 124,504 (5,948.6%) |
| 2.0x to 2.9x | 136 (14.3%) | 422 (20.2%) |
| 3.0x to 3.9x | 201 (21.2%) | 816 (39.0%) |
| 4.0x or more | 372 (39.2%) | 233 (11.1%) |
| Total | 950 (100.0%) | 2,093 (100.0%) |
Real Estate Taxes by Mortgage Status in Gateway
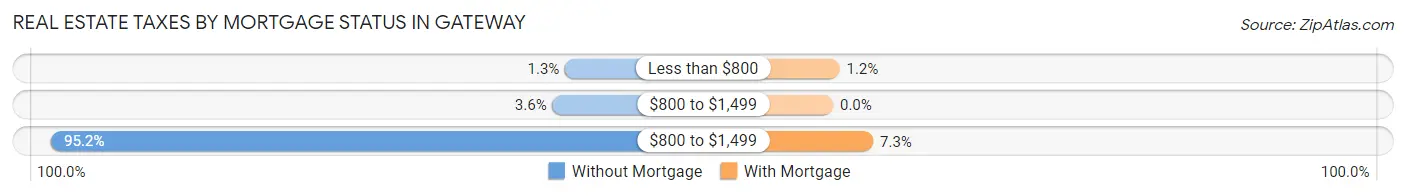
| Property Taxes | Without Mortgage | With Mortgage |
| Less than $800 | 12 (1.3%) | 25 (1.2%) |
| $800 to $1,499 | 34 (3.6%) | 0 (0.0%) |
| $800 to $1,499 | 904 (95.2%) | 153 (7.3%) |
| Total | 950 (100.0%) | 2,093 (100.0%) |
Health & Disability in Gateway
Health Insurance Coverage by Age in Gateway
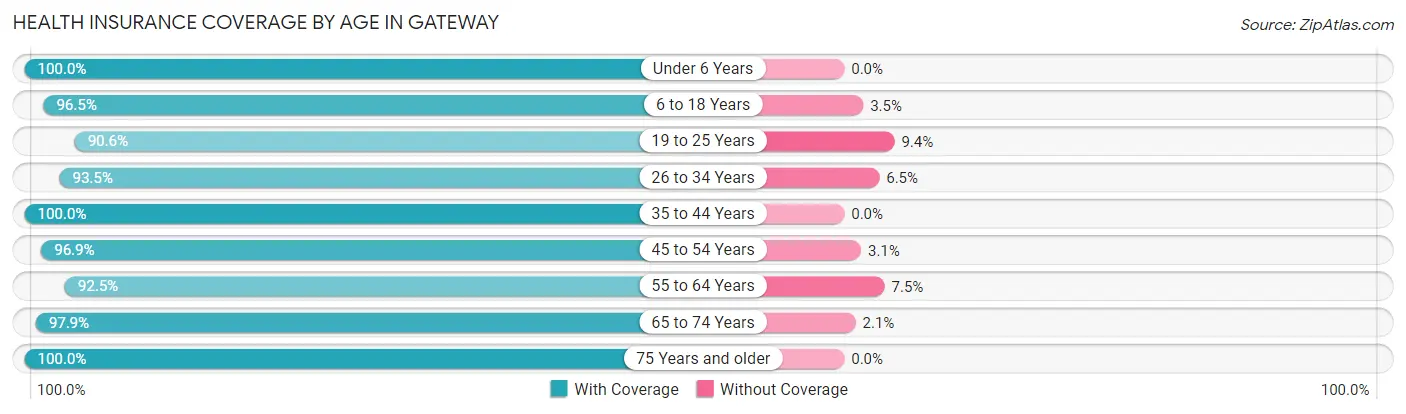
| Age Bracket | With Coverage | Without Coverage |
| Under 6 Years | 668 (100.0%) | 0 (0.0%) |
| 6 to 18 Years | 1,913 (96.5%) | 70 (3.5%) |
| 19 to 25 Years | 1,026 (90.6%) | 106 (9.4%) |
| 26 to 34 Years | 1,174 (93.5%) | 82 (6.5%) |
| 35 to 44 Years | 981 (100.0%) | 0 (0.0%) |
| 45 to 54 Years | 1,801 (96.9%) | 58 (3.1%) |
| 55 to 64 Years | 849 (92.5%) | 69 (7.5%) |
| 65 to 74 Years | 882 (97.9%) | 19 (2.1%) |
| 75 Years and older | 697 (100.0%) | 0 (0.0%) |
| Total | 9,991 (96.1%) | 404 (3.9%) |
Health Insurance Coverage by Citizenship Status in Gateway
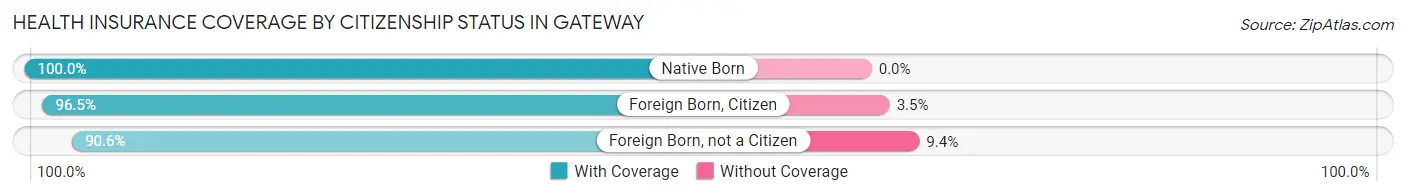
| Citizenship Status | With Coverage | Without Coverage |
| Native Born | 668 (100.0%) | 0 (0.0%) |
| Foreign Born, Citizen | 1,913 (96.5%) | 70 (3.5%) |
| Foreign Born, not a Citizen | 1,026 (90.6%) | 106 (9.4%) |
Health Insurance Coverage by Household Income in Gateway
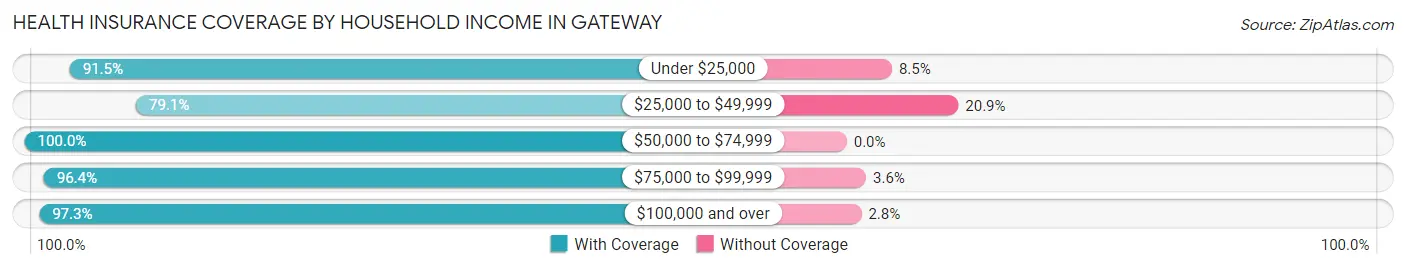
| Household Income | With Coverage | Without Coverage |
| Under $25,000 | 551 (91.5%) | 51 (8.5%) |
| $25,000 to $49,999 | 439 (79.1%) | 116 (20.9%) |
| $50,000 to $74,999 | 982 (100.0%) | 0 (0.0%) |
| $75,000 to $99,999 | 1,149 (96.4%) | 43 (3.6%) |
| $100,000 and over | 6,870 (97.3%) | 194 (2.8%) |
Public vs Private Health Insurance Coverage by Age in Gateway
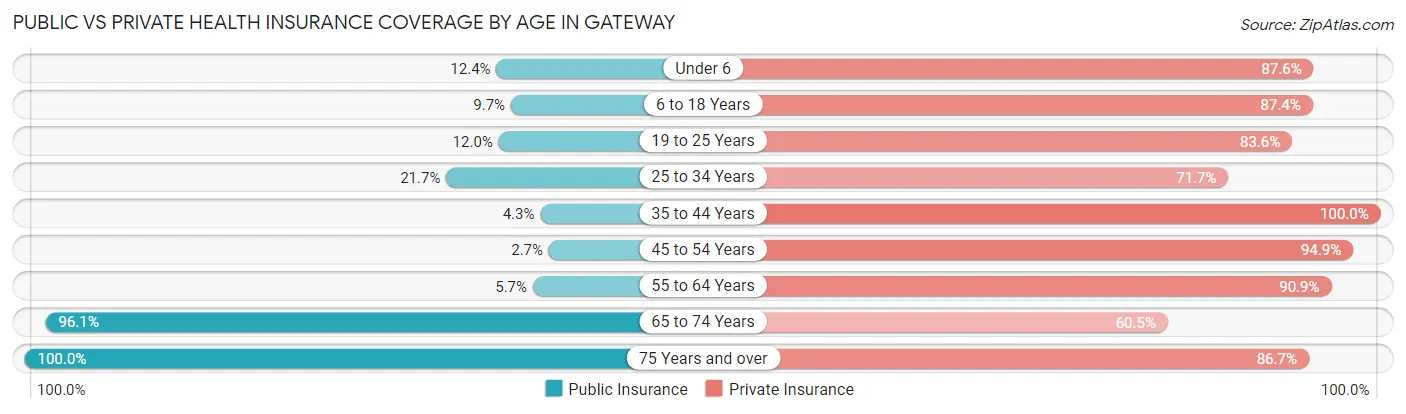
| Age Bracket | Public Insurance | Private Insurance |
| Under 6 | 83 (12.4%) | 585 (87.6%) |
| 6 to 18 Years | 193 (9.7%) | 1,733 (87.4%) |
| 19 to 25 Years | 136 (12.0%) | 946 (83.6%) |
| 25 to 34 Years | 273 (21.7%) | 901 (71.7%) |
| 35 to 44 Years | 42 (4.3%) | 981 (100.0%) |
| 45 to 54 Years | 50 (2.7%) | 1,764 (94.9%) |
| 55 to 64 Years | 52 (5.7%) | 834 (90.8%) |
| 65 to 74 Years | 866 (96.1%) | 545 (60.5%) |
| 75 Years and over | 697 (100.0%) | 604 (86.7%) |
| Total | 2,392 (23.0%) | 8,893 (85.6%) |
Disability Status by Sex by Age in Gateway
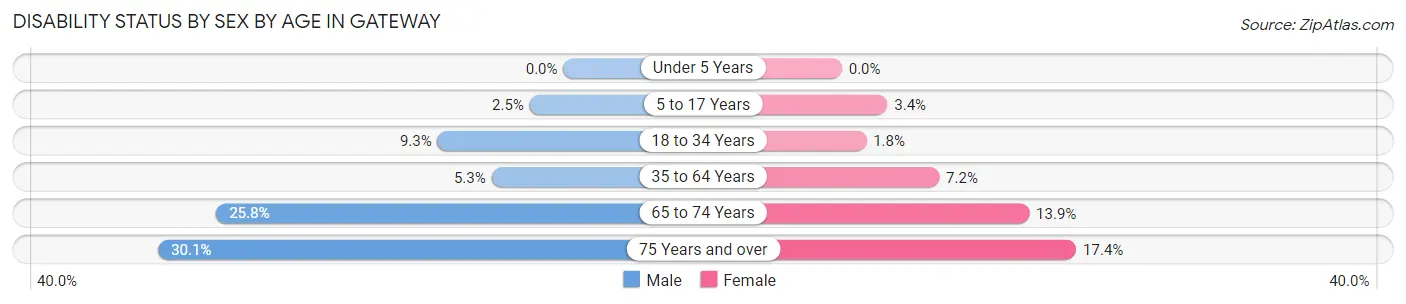
| Age Bracket | Male | Female |
| Under 5 Years | 0 (0.0%) | 0 (0.0%) |
| 5 to 17 Years | 17 (2.5%) | 43 (3.4%) |
| 18 to 34 Years | 131 (9.3%) | 21 (1.8%) |
| 35 to 64 Years | 111 (5.3%) | 121 (7.2%) |
| 65 to 74 Years | 134 (25.8%) | 53 (13.9%) |
| 75 Years and over | 80 (30.1%) | 75 (17.4%) |
Disability Class by Sex by Age in Gateway
Disability Class: Hearing Difficulty
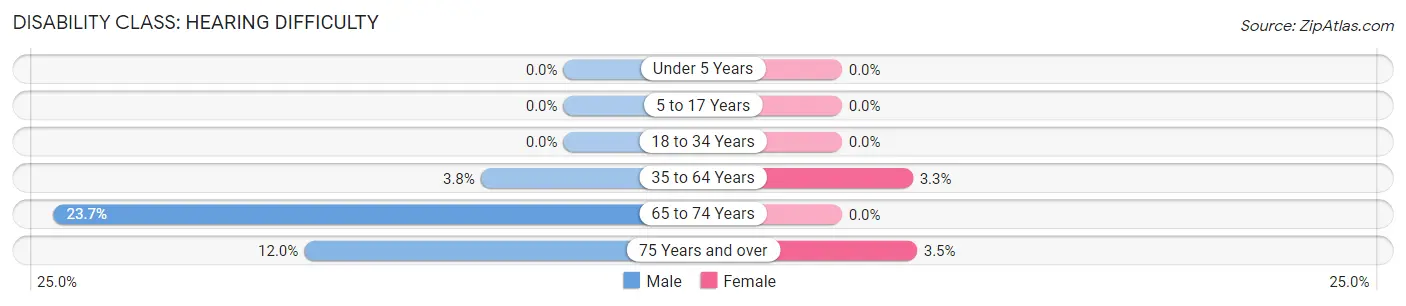
| Age Bracket | Male | Female |
| Under 5 Years | 0 (0.0%) | 0 (0.0%) |
| 5 to 17 Years | 0 (0.0%) | 0 (0.0%) |
| 18 to 34 Years | 0 (0.0%) | 0 (0.0%) |
| 35 to 64 Years | 80 (3.8%) | 55 (3.3%) |
| 65 to 74 Years | 123 (23.6%) | 0 (0.0%) |
| 75 Years and over | 32 (12.0%) | 15 (3.5%) |
Disability Class: Vision Difficulty
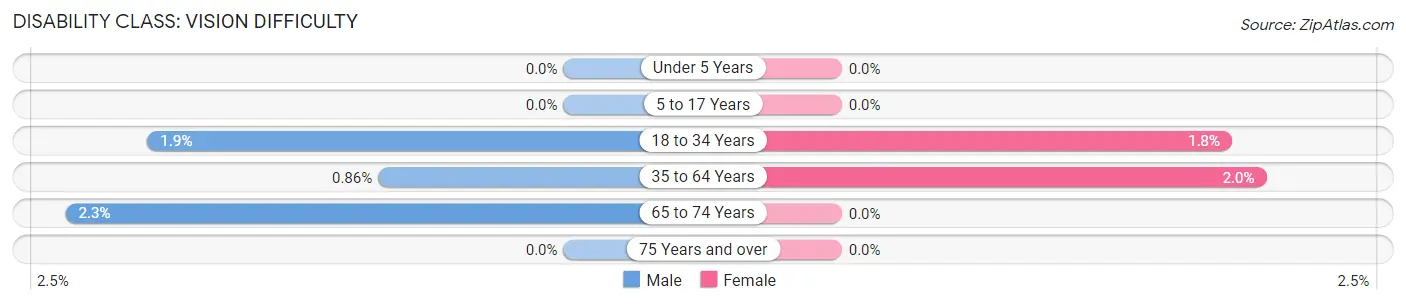
| Age Bracket | Male | Female |
| Under 5 Years | 0 (0.0%) | 0 (0.0%) |
| 5 to 17 Years | 0 (0.0%) | 0 (0.0%) |
| 18 to 34 Years | 27 (1.9%) | 21 (1.8%) |
| 35 to 64 Years | 18 (0.9%) | 33 (2.0%) |
| 65 to 74 Years | 12 (2.3%) | 0 (0.0%) |
| 75 Years and over | 0 (0.0%) | 0 (0.0%) |
Disability Class: Cognitive Difficulty
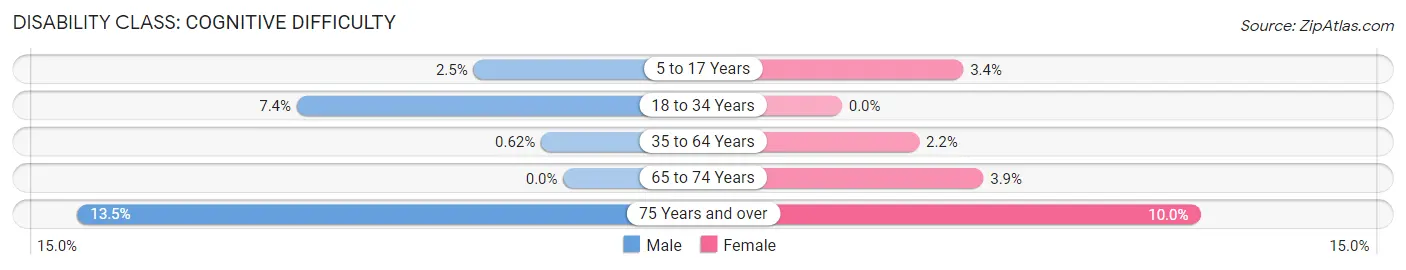
| Age Bracket | Male | Female |
| 5 to 17 Years | 17 (2.5%) | 43 (3.4%) |
| 18 to 34 Years | 104 (7.4%) | 0 (0.0%) |
| 35 to 64 Years | 13 (0.6%) | 36 (2.1%) |
| 65 to 74 Years | 0 (0.0%) | 15 (3.9%) |
| 75 Years and over | 36 (13.5%) | 43 (10.0%) |
Disability Class: Ambulatory Difficulty
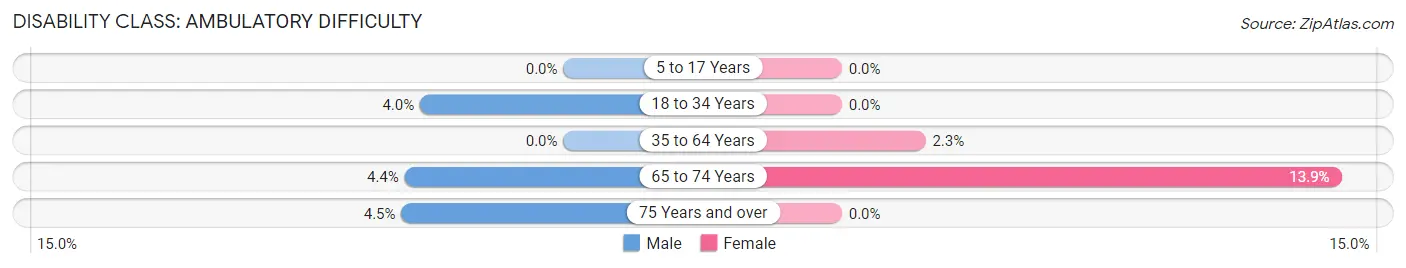
| Age Bracket | Male | Female |
| 5 to 17 Years | 0 (0.0%) | 0 (0.0%) |
| 18 to 34 Years | 56 (4.0%) | 0 (0.0%) |
| 35 to 64 Years | 0 (0.0%) | 39 (2.3%) |
| 65 to 74 Years | 23 (4.4%) | 53 (13.9%) |
| 75 Years and over | 12 (4.5%) | 0 (0.0%) |
Disability Class: Self-Care Difficulty
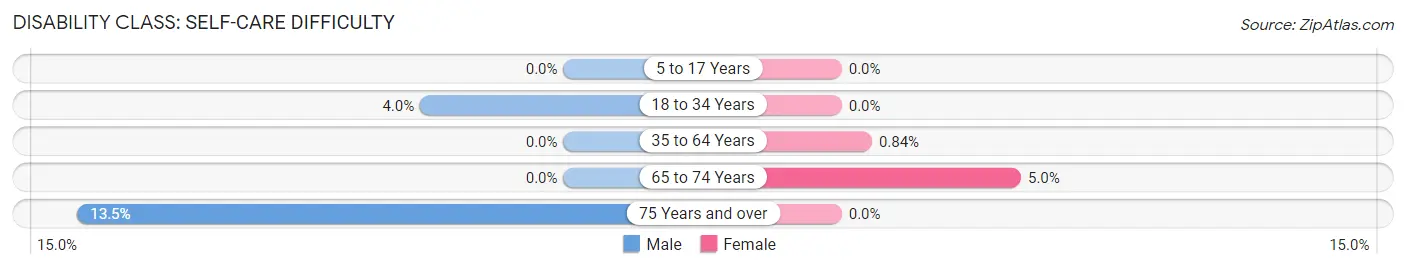
| Age Bracket | Male | Female |
| 5 to 17 Years | 0 (0.0%) | 0 (0.0%) |
| 18 to 34 Years | 56 (4.0%) | 0 (0.0%) |
| 35 to 64 Years | 0 (0.0%) | 14 (0.8%) |
| 65 to 74 Years | 0 (0.0%) | 19 (5.0%) |
| 75 Years and over | 36 (13.5%) | 0 (0.0%) |
Technology Access in Gateway
Computing Device Access in Gateway
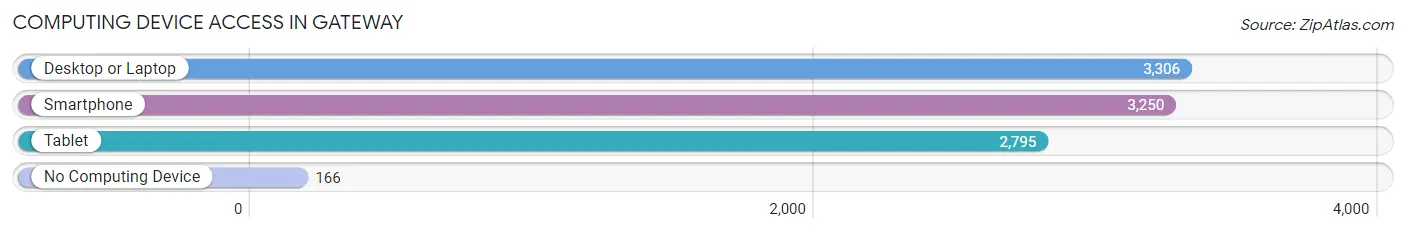
| Device Type | # Households | % Households |
| Desktop or Laptop | 3,306 | 91.6% |
| Smartphone | 3,250 | 90.0% |
| Tablet | 2,795 | 77.4% |
| No Computing Device | 166 | 4.6% |
| Total | 3,610 | 100.0% |
Internet Access in Gateway
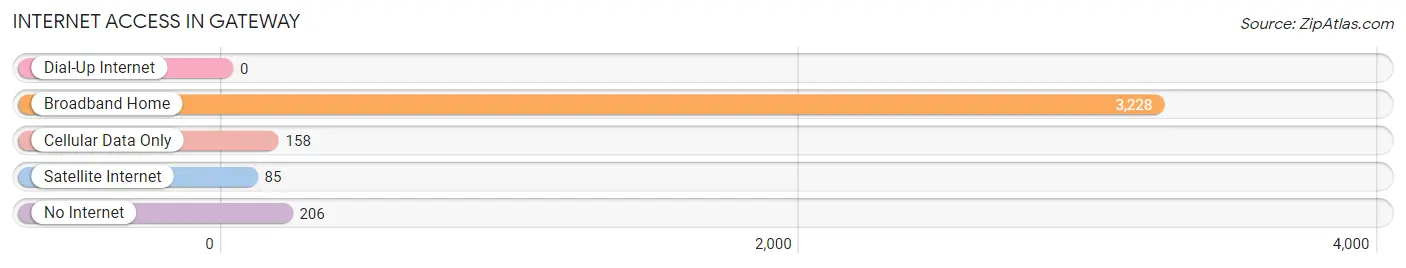
| Internet Type | # Households | % Households |
| Dial-Up Internet | 0 | 0.0% |
| Broadband Home | 3,228 | 89.4% |
| Cellular Data Only | 158 | 4.4% |
| Satellite Internet | 85 | 2.4% |
| No Internet | 206 | 5.7% |
| Total | 3,610 | 100.0% |
Gateway Summary
Gateway, Florida is a small unincorporated community located in Lee County, Florida. It is situated on the banks of the Caloosahatchee River, approximately 20 miles east of Fort Myers. The community is home to a population of approximately 1,500 people, and is known for its rural atmosphere and small-town charm.
History
Gateway was first settled in the late 1800s by a group of settlers from the Midwest. The settlers were attracted to the area due to its proximity to the Caloosahatchee River, which provided a convenient means of transportation and access to the Gulf of Mexico. The settlers established a small farming community, and the area quickly grew in population.
In the early 1900s, the area was known as “Gateway to the Gulf” due to its location at the mouth of the Caloosahatchee River. The area was also known for its abundance of citrus groves, which provided a steady source of income for the local residents.
In the 1950s, the area began to experience rapid growth due to the construction of the Tamiami Trail, which connected Miami to Tampa. This new highway provided easy access to the area, and the population quickly grew.
Geography
Gateway is located in Lee County, Florida, approximately 20 miles east of Fort Myers. The community is situated on the banks of the Caloosahatchee River, which provides access to the Gulf of Mexico. The area is characterized by its rural atmosphere and small-town charm.
The area is home to a variety of wildlife, including alligators, turtles, and a variety of birds. The area is also home to a variety of plant life, including cypress trees, palmetto trees, and a variety of other native plants.
Economy
The economy of Gateway is largely based on agriculture and tourism. The area is home to a variety of citrus groves, which provide a steady source of income for the local residents. The area is also home to a variety of tourist attractions, including fishing charters, airboat tours, and nature trails.
The area is also home to a variety of small businesses, including restaurants, convenience stores, and gas stations. The area is also home to a variety of manufacturing and industrial businesses, including a paper mill and a plastics factory.
Demographics
As of the 2010 census, the population of Gateway was 1,500. The population is largely composed of white (90.3%) and Hispanic (7.3%) residents. The median household income is $41,250, and the median age is 44.
The area is home to a variety of religious denominations, including Baptist (37.3%), Catholic (25.3%), and Methodist (14.3%). The area is also home to a variety of educational institutions, including Gateway Elementary School, Gateway Middle School, and Gateway High School.
Conclusion
Gateway, Florida is a small unincorporated community located in Lee County, Florida. It is situated on the banks of the Caloosahatchee River, approximately 20 miles east of Fort Myers. The community is home to a population of approximately 1,500 people, and is known for its rural atmosphere and small-town charm. The economy of Gateway is largely based on agriculture and tourism, and the area is home to a variety of small businesses, manufacturing and industrial businesses, and educational institutions. The population is largely composed of white and Hispanic residents, and the median household income is $41,250. Gateway is a charming community with a rich history and a bright future.
Common Questions
What is Per Capita Income in Gateway?
Per Capita income in Gateway is $47,173.
What is the Median Family Income in Gateway?
Median Family Income in Gateway is $124,141.
What is the Median Household income in Gateway?
Median Household Income in Gateway is $110,317.
What is Income or Wage Gap in Gateway?
Income or Wage Gap in Gateway is 21.9%.
Women in Gateway earn 78.1 cents for every dollar earned by a man.
What is Inequality or Gini Index in Gateway?
Inequality or Gini Index in Gateway is 0.40.
What is the Total Population of Gateway?
Total Population of Gateway is 10,395.
What is the Total Male Population of Gateway?
Total Male Population of Gateway is 5,261.
What is the Total Female Population of Gateway?
Total Female Population of Gateway is 5,134.
What is the Ratio of Males per 100 Females in Gateway?
There are 102.47 Males per 100 Females in Gateway.
What is the Ratio of Females per 100 Males in Gateway?
There are 97.59 Females per 100 Males in Gateway.
What is the Median Population Age in Gateway?
Median Population Age in Gateway is 37.5 Years.
What is the Average Family Size in Gateway
Average Family Size in Gateway is 3.4 People.
What is the Average Household Size in Gateway
Average Household Size in Gateway is 2.9 People.
How Large is the Labor Force in Gateway?
There are 5,230 People in the Labor Forcein in Gateway.
What is the Percentage of People in the Labor Force in Gateway?
61.7% of People are in the Labor Force in Gateway.
What is the Unemployment Rate in Gateway?
Unemployment Rate in Gateway is 1.9%.