Lockhart, FL Map & Demographics
Lockhart Map
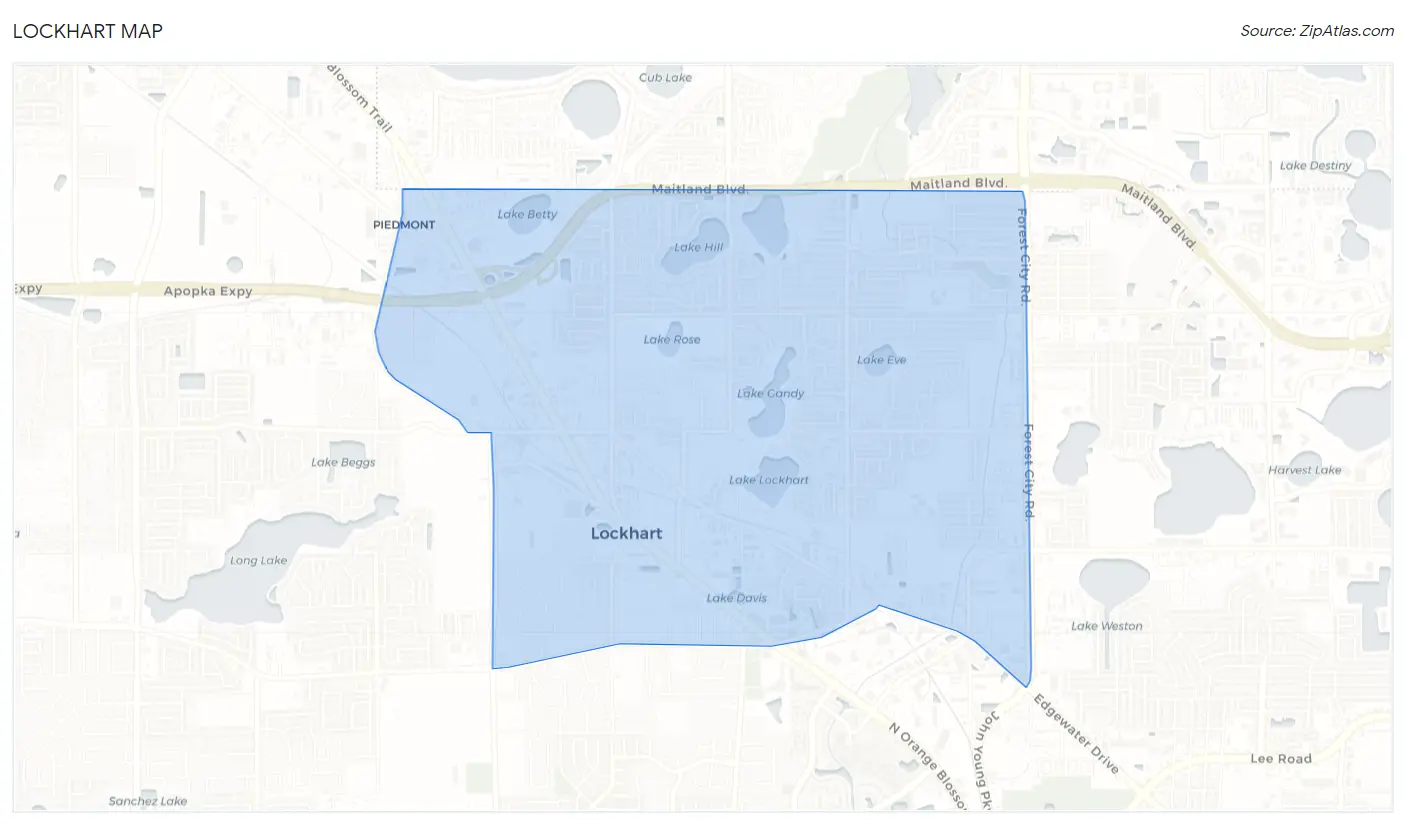
Lockhart Overview
$30,306
PER CAPITA INCOME
$82,004
AVG FAMILY INCOME
$68,658
AVG HOUSEHOLD INCOME
16.9%
WAGE / INCOME GAP [ % ]
83.1¢/ $1
WAGE / INCOME GAP [ $ ]
$12,026
FAMILY INCOME DEFICIT
0.39
INEQUALITY / GINI INDEX
15,017
TOTAL POPULATION
7,576
MALE POPULATION
7,441
FEMALE POPULATION
101.81
MALES / 100 FEMALES
98.22
FEMALES / 100 MALES
36.8
MEDIAN AGE
3.4
AVG FAMILY SIZE
2.7
AVG HOUSEHOLD SIZE
9,060
LABOR FORCE [ PEOPLE ]
74.6%
PERCENT IN LABOR FORCE
6.0%
UNEMPLOYMENT RATE
Income in Lockhart
Income Overview in Lockhart
Per Capita Income in Lockhart is $30,306, while median incomes of families and households are $82,004 and $68,658 respectively.
| Characteristic | Number | Measure |
| Per Capita Income | 15,017 | $30,306 |
| Median Family Income | 3,503 | $82,004 |
| Mean Family Income | 3,503 | $83,844 |
| Median Household Income | 5,487 | $68,658 |
| Mean Household Income | 5,487 | $76,220 |
| Income Deficit | 3,503 | $12,026 |
| Wage / Income Gap (%) | 15,017 | 16.92% |
| Wage / Income Gap ($) | 15,017 | 83.08¢ per $1 |
| Gini / Inequality Index | 15,017 | 0.39 |
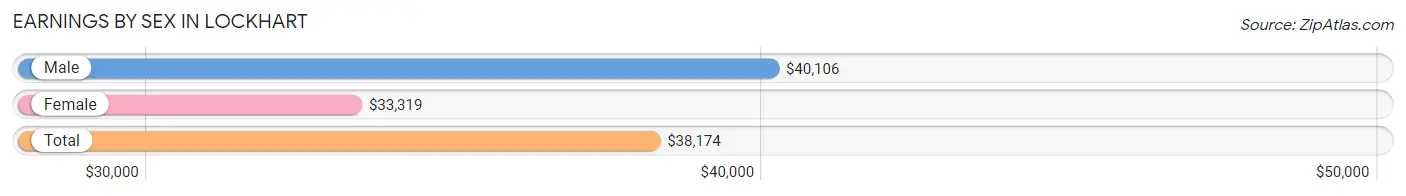
Earnings by Sex in Lockhart
Average Earnings in Lockhart are $38,174, $40,106 for men and $33,319 for women, a difference of 16.9%.
| Sex | Number | Average Earnings |
| Male | 4,692 (53.4%) | $40,106 |
| Female | 4,092 (46.6%) | $33,319 |
| Total | 8,784 (100.0%) | $38,174 |
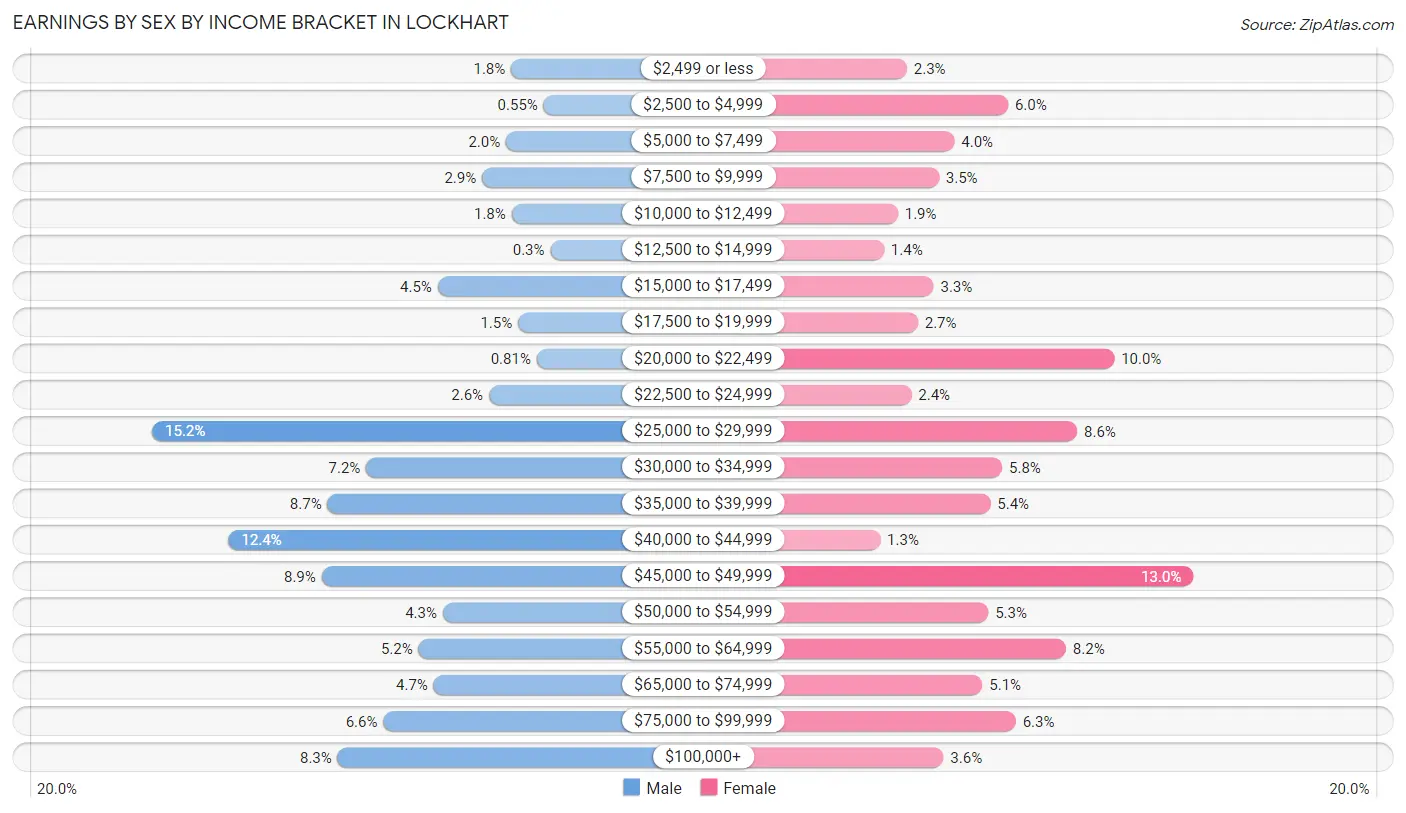
Earnings by Sex by Income Bracket in Lockhart
The most common earnings brackets in Lockhart are $25,000 to $29,999 for men (714 | 15.2%) and $45,000 to $49,999 for women (531 | 13.0%).
| Income | Male | Female |
| $2,499 or less | 83 (1.8%) | 92 (2.2%) |
| $2,500 to $4,999 | 26 (0.5%) | 247 (6.0%) |
| $5,000 to $7,499 | 92 (2.0%) | 165 (4.0%) |
| $7,500 to $9,999 | 134 (2.9%) | 141 (3.5%) |
| $10,000 to $12,499 | 82 (1.8%) | 78 (1.9%) |
| $12,500 to $14,999 | 14 (0.3%) | 57 (1.4%) |
| $15,000 to $17,499 | 212 (4.5%) | 133 (3.3%) |
| $17,500 to $19,999 | 71 (1.5%) | 109 (2.7%) |
| $20,000 to $22,499 | 38 (0.8%) | 410 (10.0%) |
| $22,500 to $24,999 | 122 (2.6%) | 99 (2.4%) |
| $25,000 to $29,999 | 714 (15.2%) | 353 (8.6%) |
| $30,000 to $34,999 | 338 (7.2%) | 238 (5.8%) |
| $35,000 to $39,999 | 406 (8.6%) | 220 (5.4%) |
| $40,000 to $44,999 | 580 (12.4%) | 51 (1.3%) |
| $45,000 to $49,999 | 416 (8.9%) | 531 (13.0%) |
| $50,000 to $54,999 | 203 (4.3%) | 217 (5.3%) |
| $55,000 to $64,999 | 246 (5.2%) | 336 (8.2%) |
| $65,000 to $74,999 | 219 (4.7%) | 208 (5.1%) |
| $75,000 to $99,999 | 308 (6.6%) | 259 (6.3%) |
| $100,000+ | 388 (8.3%) | 148 (3.6%) |
| Total | 4,692 (100.0%) | 4,092 (100.0%) |
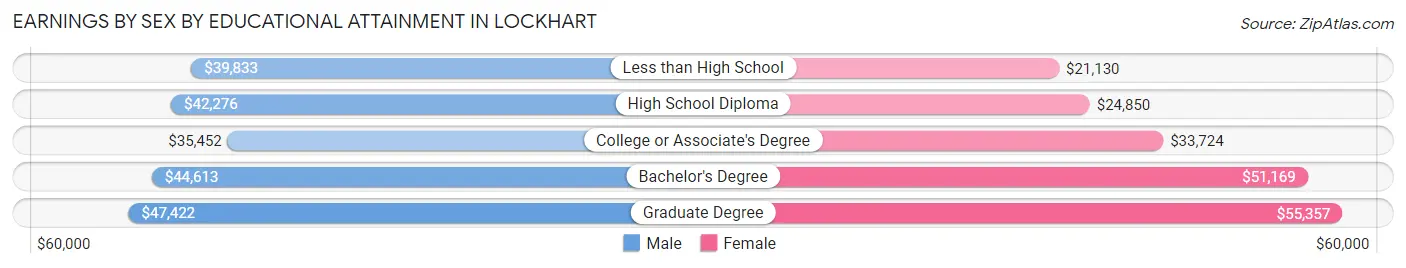
Earnings by Sex by Educational Attainment in Lockhart
Average earnings in Lockhart are $40,838 for men and $37,893 for women, a difference of 7.2%. Men with an educational attainment of graduate degree enjoy the highest average annual earnings of $47,422, while those with college or associate's degree education earn the least with $35,452. Women with an educational attainment of graduate degree earn the most with the average annual earnings of $55,357, while those with less than high school education have the smallest earnings of $21,130.
| Educational Attainment | Male Income | Female Income |
| Less than High School | $39,833 | $21,130 |
| High School Diploma | $42,276 | $24,850 |
| College or Associate's Degree | $35,452 | $33,724 |
| Bachelor's Degree | $44,613 | $51,169 |
| Graduate Degree | $47,422 | $55,357 |
| Total | $40,838 | $37,893 |
Family Income in Lockhart
Family Income Brackets in Lockhart
According to the Lockhart family income data, there are 827 families falling into the $75,000 to $99,999 income range, which is the most common income bracket and makes up 23.6% of all families. Conversely, the less than $10,000 income bracket is the least frequent group with only 88 families (2.5%) belonging to this category.
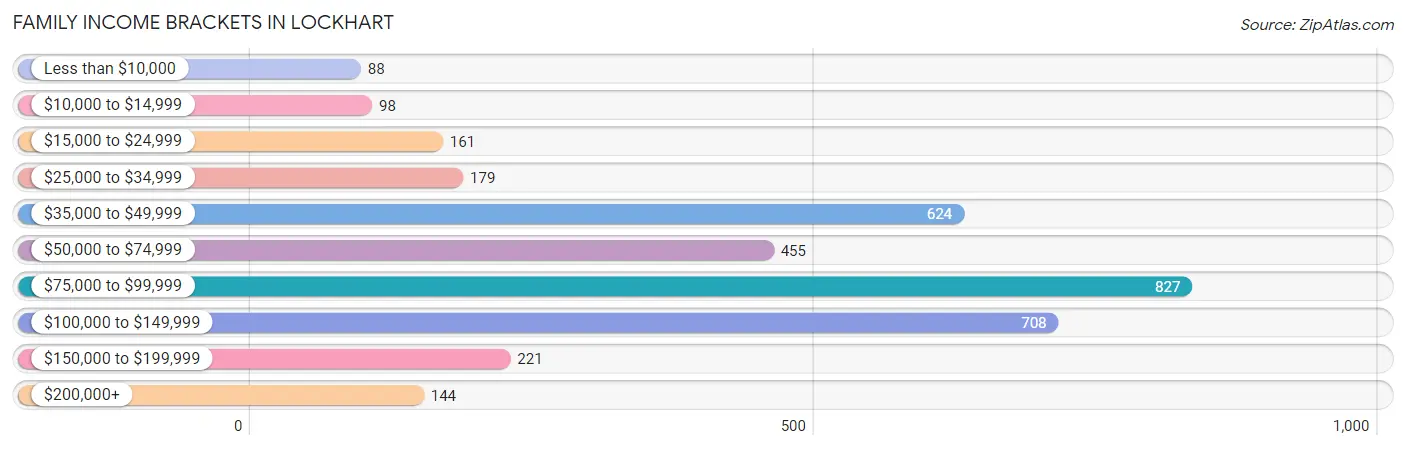
| Income Bracket | # Families | % Families |
| Less than $10,000 | 88 | 2.5% |
| $10,000 to $14,999 | 98 | 2.8% |
| $15,000 to $24,999 | 161 | 4.6% |
| $25,000 to $34,999 | 179 | 5.1% |
| $35,000 to $49,999 | 624 | 17.8% |
| $50,000 to $74,999 | 455 | 13.0% |
| $75,000 to $99,999 | 827 | 23.6% |
| $100,000 to $149,999 | 708 | 20.2% |
| $150,000 to $199,999 | 221 | 6.3% |
| $200,000+ | 144 | 4.1% |
Family Income by Famaliy Size in Lockhart
5-person families (374 | 10.7%) account for the highest median family income in Lockhart with $94,750 per family, while 2-person families (1,719 | 49.1%) have the highest median income of $37,726 per family member.
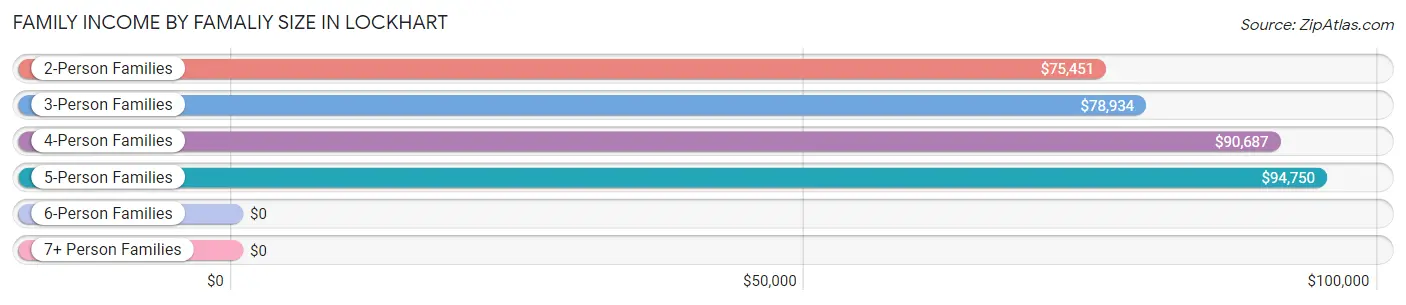
| Income Bracket | # Families | Median Income |
| 2-Person Families | 1,719 (49.1%) | $75,451 |
| 3-Person Families | 739 (21.1%) | $78,934 |
| 4-Person Families | 639 (18.2%) | $90,687 |
| 5-Person Families | 374 (10.7%) | $94,750 |
| 6-Person Families | 21 (0.6%) | $0 |
| 7+ Person Families | 11 (0.3%) | $0 |
| Total | 3,503 (100.0%) | $82,004 |
Family Income by Number of Earners in Lockhart
The median family income in Lockhart is $82,004, with families comprising 3+ earners (407) having the highest median family income of $92,347, while families with no earners (349) have the lowest median family income of $38,625, accounting for 11.6% and 10.0% of families, respectively.
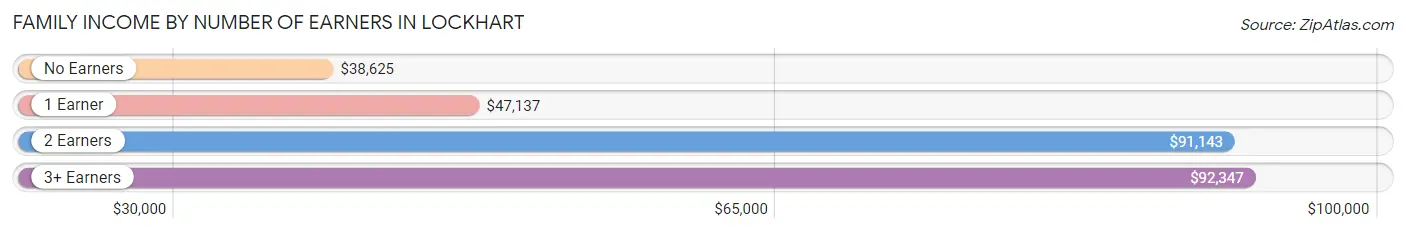
| Number of Earners | # Families | Median Income |
| No Earners | 349 (10.0%) | $38,625 |
| 1 Earner | 1,306 (37.3%) | $47,137 |
| 2 Earners | 1,441 (41.1%) | $91,143 |
| 3+ Earners | 407 (11.6%) | $92,347 |
| Total | 3,503 (100.0%) | $82,004 |
Household Income in Lockhart
Household Income Brackets in Lockhart
With 1,114 households falling in the category, the $75,000 to $99,999 income range is the most frequent in Lockhart, accounting for 20.3% of all households. In contrast, only 148 households (2.7%) fall into the $10,000 to $14,999 income bracket, making it the least populous group.
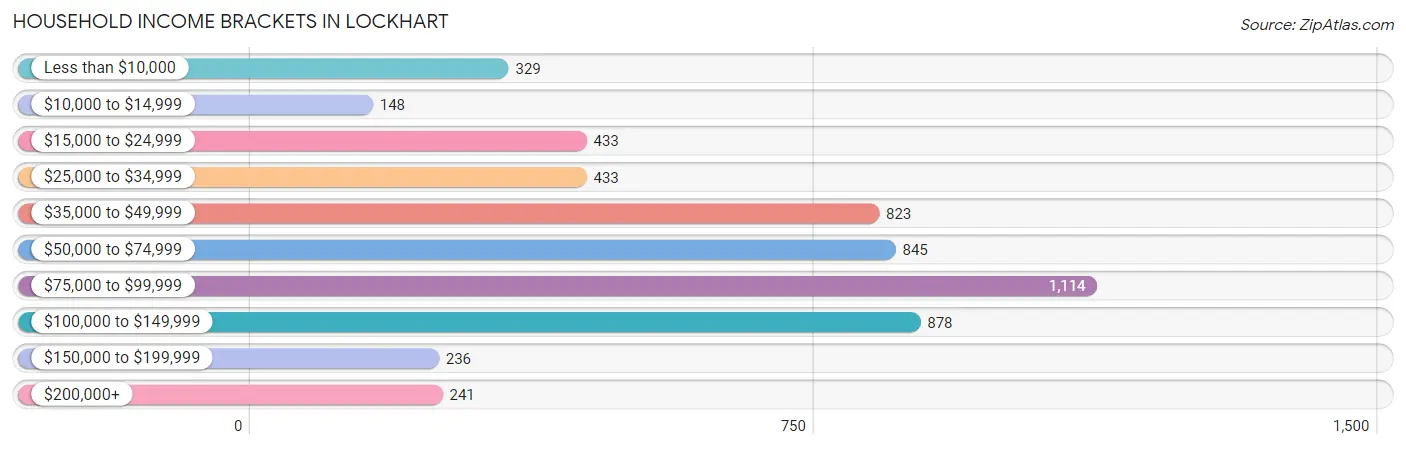
| Income Bracket | # Households | % Households |
| Less than $10,000 | 329 | 6.0% |
| $10,000 to $14,999 | 148 | 2.7% |
| $15,000 to $24,999 | 433 | 7.9% |
| $25,000 to $34,999 | 433 | 7.9% |
| $35,000 to $49,999 | 823 | 15.0% |
| $50,000 to $74,999 | 845 | 15.4% |
| $75,000 to $99,999 | 1,114 | 20.3% |
| $100,000 to $149,999 | 878 | 16.0% |
| $150,000 to $199,999 | 236 | 4.3% |
| $200,000+ | 241 | 4.4% |
Household Income by Householder Age in Lockhart
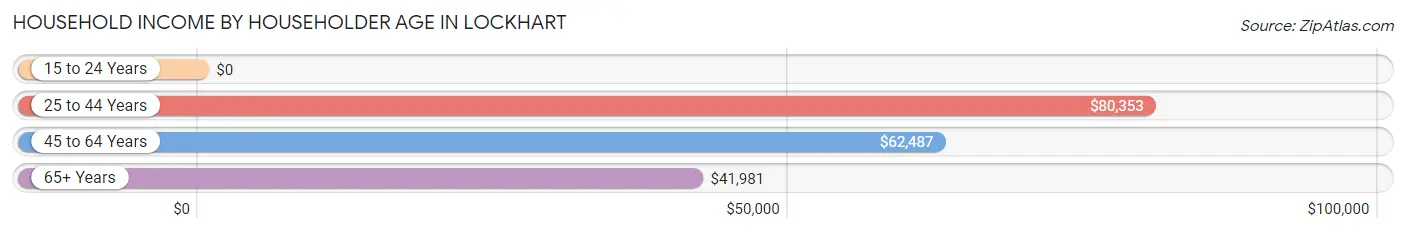
The median household income in Lockhart is $68,658, with the highest median household income of $80,353 found in the 25 to 44 years age bracket for the primary householder. A total of 2,219 households (40.4%) fall into this category. Meanwhile, the 15 to 24 years age bracket for the primary householder has the lowest median household income of $0, with 27 households (0.5%) in this group.
| Income Bracket | # Households | Median Income |
| 15 to 24 Years | 27 (0.5%) | $0 |
| 25 to 44 Years | 2,219 (40.4%) | $80,353 |
| 45 to 64 Years | 2,201 (40.1%) | $62,487 |
| 65+ Years | 1,040 (19.0%) | $41,981 |
| Total | 5,487 (100.0%) | $68,658 |
Poverty in Lockhart
Income Below Poverty by Sex and Age in Lockhart
With 11.9% poverty level for males and 12.7% for females among the residents of Lockhart, 12 to 14 year old males and 5 year old females are the most vulnerable to poverty, with 124 males (51.9%) and 39 females (100.0%) in their respective age groups living below the poverty level.
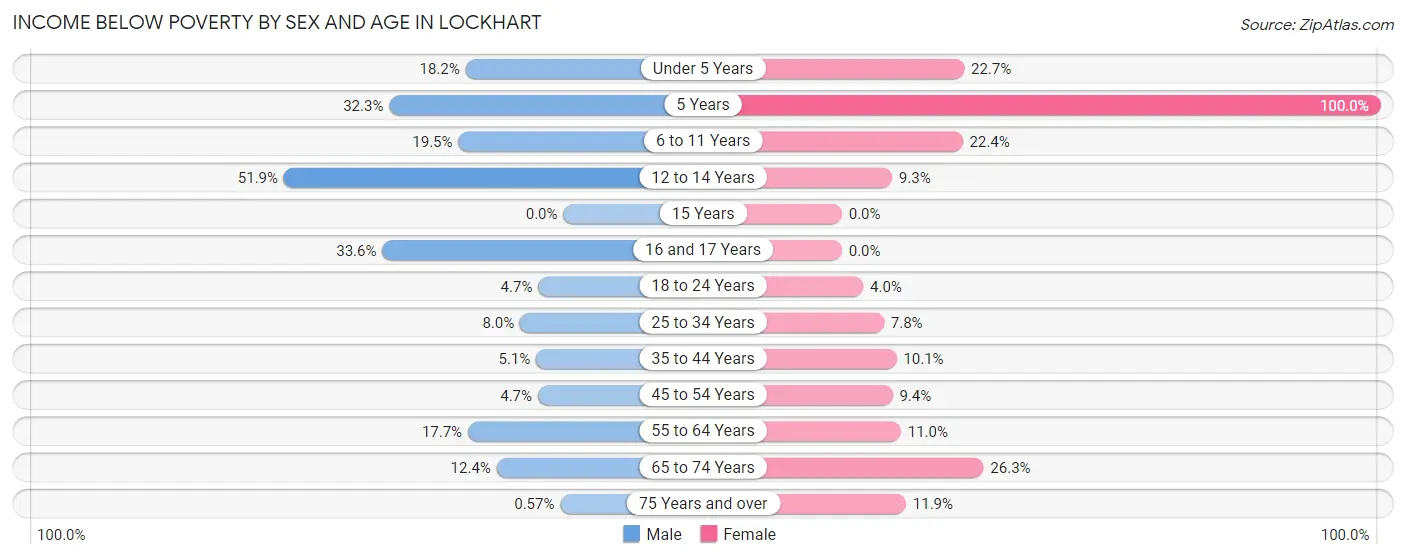
| Age Bracket | Male | Female |
| Under 5 Years | 65 (18.2%) | 91 (22.7%) |
| 5 Years | 85 (32.3%) | 39 (100.0%) |
| 6 to 11 Years | 99 (19.5%) | 151 (22.4%) |
| 12 to 14 Years | 124 (51.9%) | 12 (9.3%) |
| 15 Years | 0 (0.0%) | 0 (0.0%) |
| 16 and 17 Years | 40 (33.6%) | 0 (0.0%) |
| 18 to 24 Years | 17 (4.7%) | 31 (4.0%) |
| 25 to 34 Years | 110 (8.0%) | 124 (7.8%) |
| 35 to 44 Years | 65 (5.1%) | 89 (10.1%) |
| 45 to 54 Years | 61 (4.7%) | 84 (9.4%) |
| 55 to 64 Years | 158 (17.7%) | 97 (11.0%) |
| 65 to 74 Years | 67 (12.4%) | 198 (26.3%) |
| 75 Years and over | 1 (0.6%) | 29 (11.9%) |
| Total | 892 (11.9%) | 945 (12.7%) |
Income Above Poverty by Sex and Age in Lockhart
According to the poverty statistics in Lockhart, males aged 15 years and females aged 15 years are the age groups that are most secure financially, with 100.0% of males and 100.0% of females in these age groups living above the poverty line.
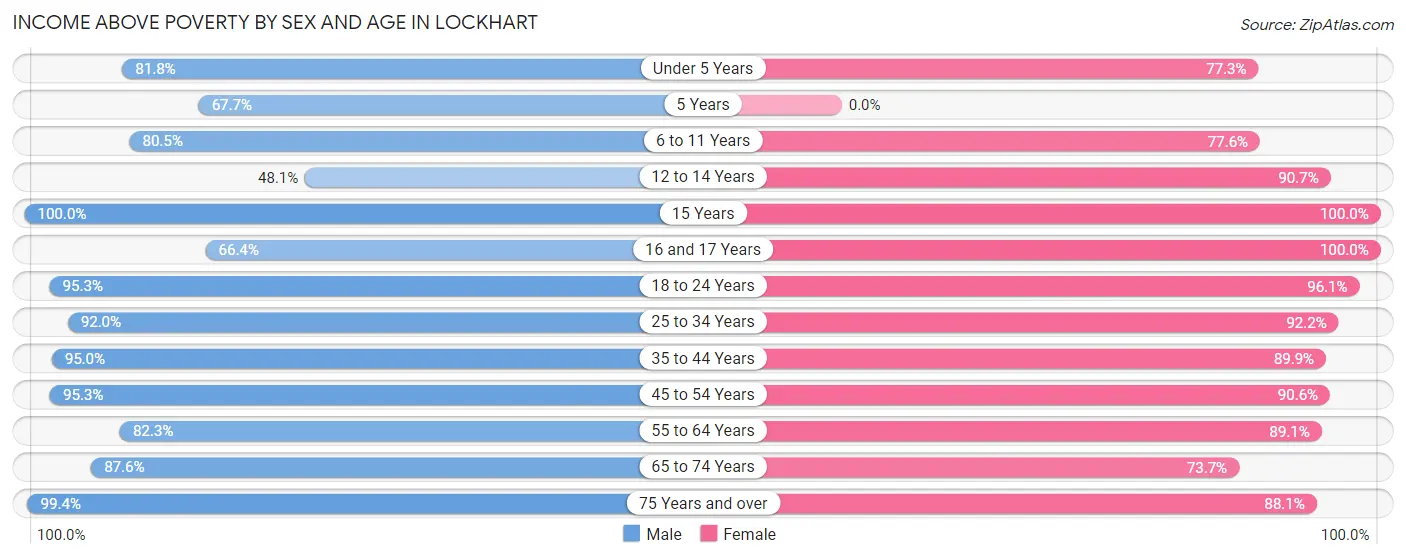
| Age Bracket | Male | Female |
| Under 5 Years | 293 (81.8%) | 310 (77.3%) |
| 5 Years | 178 (67.7%) | 0 (0.0%) |
| 6 to 11 Years | 409 (80.5%) | 523 (77.6%) |
| 12 to 14 Years | 115 (48.1%) | 117 (90.7%) |
| 15 Years | 107 (100.0%) | 91 (100.0%) |
| 16 and 17 Years | 79 (66.4%) | 81 (100.0%) |
| 18 to 24 Years | 348 (95.3%) | 754 (96.1%) |
| 25 to 34 Years | 1,259 (92.0%) | 1,463 (92.2%) |
| 35 to 44 Years | 1,221 (95.0%) | 789 (89.9%) |
| 45 to 54 Years | 1,229 (95.3%) | 809 (90.6%) |
| 55 to 64 Years | 734 (82.3%) | 789 (89.0%) |
| 65 to 74 Years | 474 (87.6%) | 555 (73.7%) |
| 75 Years and over | 175 (99.4%) | 215 (88.1%) |
| Total | 6,621 (88.1%) | 6,496 (87.3%) |
Income Below Poverty Among Married-Couple Families in Lockhart
The poverty statistics for married-couple families in Lockhart show that 7.1% or 160 of the total 2,267 families live below the poverty line. Families with 3 or 4 children have the highest poverty rate of 40.6%, comprising of 54 families. On the other hand, families with 1 or 2 children have the lowest poverty rate of 2.8%, which includes 13 families.
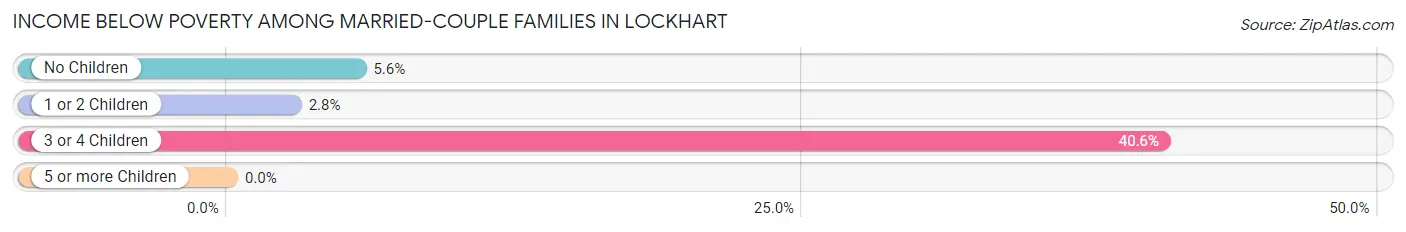
| Children | Above Poverty | Below Poverty |
| No Children | 1,572 (94.4%) | 93 (5.6%) |
| 1 or 2 Children | 456 (97.2%) | 13 (2.8%) |
| 3 or 4 Children | 79 (59.4%) | 54 (40.6%) |
| 5 or more Children | 0 (0.0%) | 0 (0.0%) |
| Total | 2,107 (92.9%) | 160 (7.1%) |
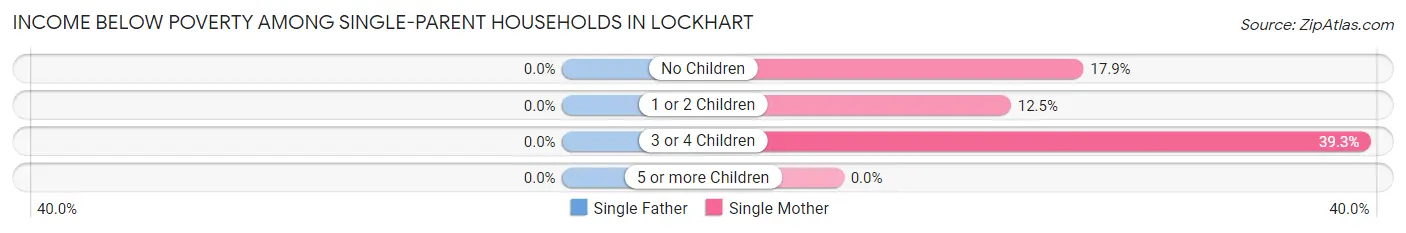
Income Below Poverty Among Single-Parent Households in Lockhart
| Children | Single Father | Single Mother |
| No Children | 0 (0.0%) | 30 (17.9%) |
| 1 or 2 Children | 0 (0.0%) | 63 (12.4%) |
| 3 or 4 Children | 0 (0.0%) | 79 (39.3%) |
| 5 or more Children | 0 (0.0%) | 0 (0.0%) |
| Total | 0 (0.0%) | 172 (19.7%) |
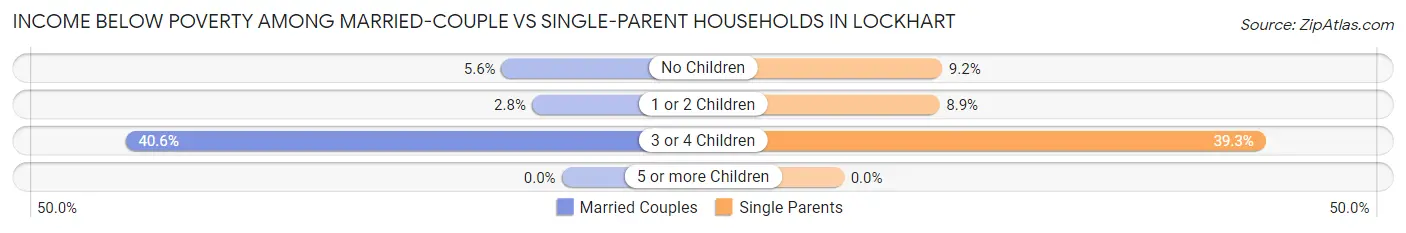
Income Below Poverty Among Married-Couple vs Single-Parent Households in Lockhart
The poverty data for Lockhart shows that 160 of the married-couple family households (7.1%) and 172 of the single-parent households (13.9%) are living below the poverty level. Within the married-couple family households, those with 3 or 4 children have the highest poverty rate, with 54 households (40.6%) falling below the poverty line. Among the single-parent households, those with 3 or 4 children have the highest poverty rate, with 79 household (39.3%) living below poverty.
| Children | Married-Couple Families | Single-Parent Households |
| No Children | 93 (5.6%) | 30 (9.1%) |
| 1 or 2 Children | 13 (2.8%) | 63 (8.9%) |
| 3 or 4 Children | 54 (40.6%) | 79 (39.3%) |
| 5 or more Children | 0 (0.0%) | 0 (0.0%) |
| Total | 160 (7.1%) | 172 (13.9%) |
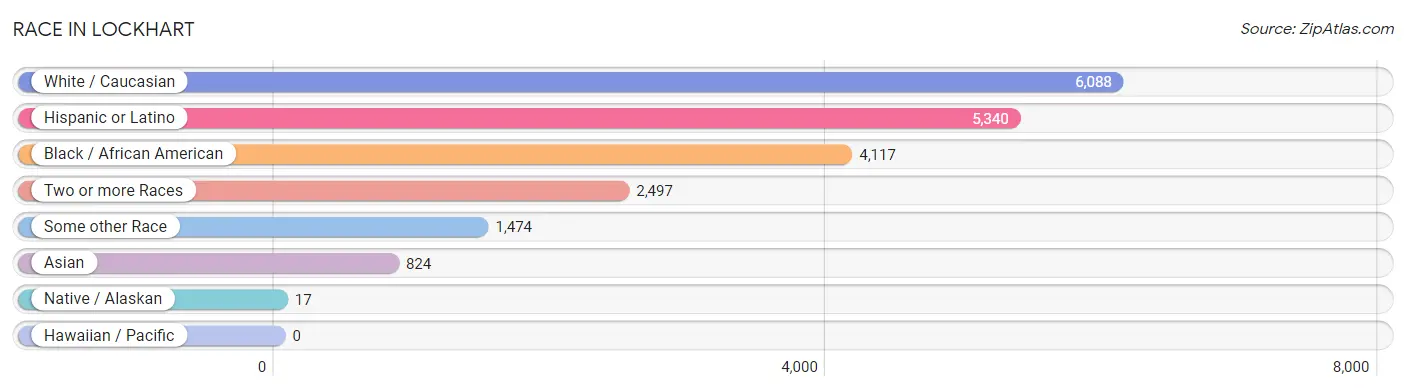
Race in Lockhart
The most populous races in Lockhart are White / Caucasian (6,088 | 40.5%), Hispanic or Latino (5,340 | 35.6%), and Black / African American (4,117 | 27.4%).
| Race | # Population | % Population |
| Asian | 824 | 5.5% |
| Black / African American | 4,117 | 27.4% |
| Hawaiian / Pacific | 0 | 0.0% |
| Hispanic or Latino | 5,340 | 35.6% |
| Native / Alaskan | 17 | 0.1% |
| White / Caucasian | 6,088 | 40.5% |
| Two or more Races | 2,497 | 16.6% |
| Some other Race | 1,474 | 9.8% |
| Total | 15,017 | 100.0% |
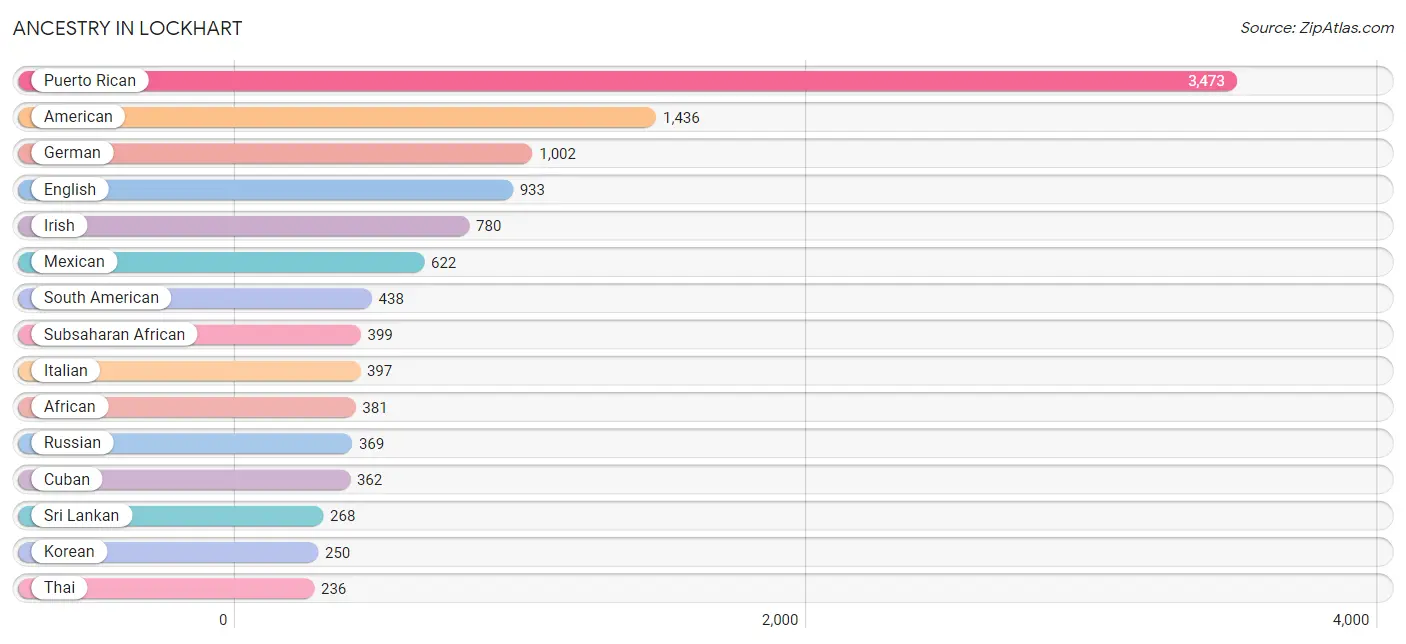
Ancestry in Lockhart
The most populous ancestries reported in Lockhart are Puerto Rican (3,473 | 23.1%), American (1,436 | 9.6%), German (1,002 | 6.7%), English (933 | 6.2%), and Irish (780 | 5.2%), together accounting for 50.8% of all Lockhart residents.
| Ancestry | # Population | % Population |
| African | 381 | 2.5% |
| Alaska Native | 2 | 0.0% |
| American | 1,436 | 9.6% |
| Arab | 18 | 0.1% |
| Argentinean | 12 | 0.1% |
| Austrian | 9 | 0.1% |
| Belgian | 5 | 0.0% |
| Bhutanese | 2 | 0.0% |
| Brazilian | 20 | 0.1% |
| British | 34 | 0.2% |
| British West Indian | 31 | 0.2% |
| Bulgarian | 46 | 0.3% |
| Burmese | 19 | 0.1% |
| Cajun | 16 | 0.1% |
| Canadian | 18 | 0.1% |
| Central American | 63 | 0.4% |
| Cherokee | 46 | 0.3% |
| Chilean | 34 | 0.2% |
| Colombian | 216 | 1.4% |
| Cuban | 362 | 2.4% |
| Czechoslovakian | 15 | 0.1% |
| Danish | 11 | 0.1% |
| Dominican | 159 | 1.1% |
| Dutch | 141 | 0.9% |
| Eastern European | 14 | 0.1% |
| Ecuadorian | 95 | 0.6% |
| English | 933 | 6.2% |
| Ethiopian | 7 | 0.1% |
| European | 148 | 1.0% |
| Filipino | 53 | 0.4% |
| French | 150 | 1.0% |
| French Canadian | 61 | 0.4% |
| German | 1,002 | 6.7% |
| Greek | 8 | 0.1% |
| Guyanese | 12 | 0.1% |
| Haitian | 26 | 0.2% |
| Honduran | 15 | 0.1% |
| Hungarian | 33 | 0.2% |
| Indian (Asian) | 195 | 1.3% |
| Inupiat | 6 | 0.0% |
| Iranian | 4 | 0.0% |
| Irish | 780 | 5.2% |
| Italian | 397 | 2.6% |
| Jamaican | 81 | 0.5% |
| Japanese | 56 | 0.4% |
| Korean | 250 | 1.7% |
| Mexican | 622 | 4.1% |
| Mexican American Indian | 3 | 0.0% |
| Native Hawaiian | 12 | 0.1% |
| Osage | 14 | 0.1% |
| Pakistani | 8 | 0.1% |
| Panamanian | 17 | 0.1% |
| Peruvian | 55 | 0.4% |
| Polish | 112 | 0.7% |
| Portuguese | 110 | 0.7% |
| Puerto Rican | 3,473 | 23.1% |
| Russian | 369 | 2.5% |
| Salvadoran | 31 | 0.2% |
| Scandinavian | 24 | 0.2% |
| Scotch-Irish | 69 | 0.5% |
| Scottish | 179 | 1.2% |
| South African | 11 | 0.1% |
| South American | 438 | 2.9% |
| Spaniard | 132 | 0.9% |
| Sri Lankan | 268 | 1.8% |
| Subsaharan African | 399 | 2.7% |
| Swedish | 120 | 0.8% |
| Thai | 236 | 1.6% |
| Trinidadian and Tobagonian | 61 | 0.4% |
| Ukrainian | 52 | 0.4% |
| Venezuelan | 26 | 0.2% |
| Welsh | 69 | 0.5% |
| West Indian | 15 | 0.1% | View All 73 Rows |
Immigrants in Lockhart
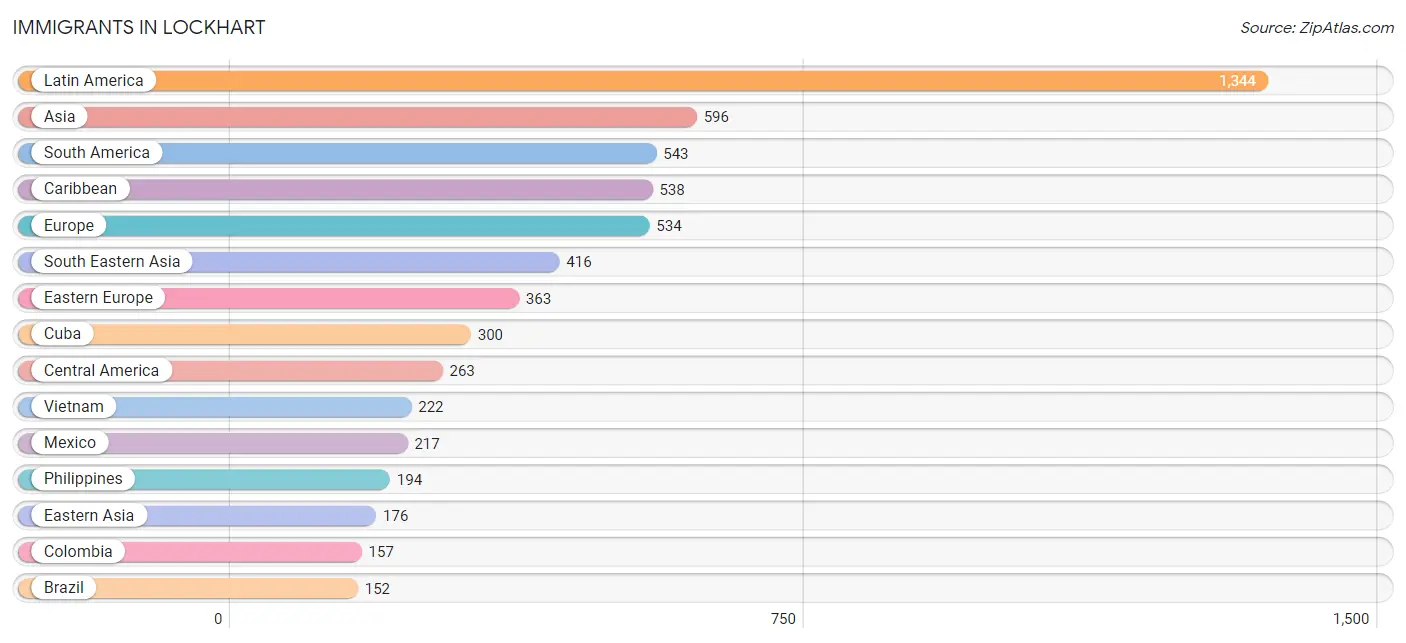
The most numerous immigrant groups reported in Lockhart came from Latin America (1,344 | 8.9%), Asia (596 | 4.0%), South America (543 | 3.6%), Caribbean (538 | 3.6%), and Europe (534 | 3.6%), together accounting for 23.7% of all Lockhart residents.
| Immigration Origin | # Population | % Population |
| Africa | 63 | 0.4% |
| Argentina | 12 | 0.1% |
| Asia | 596 | 4.0% |
| Belarus | 49 | 0.3% |
| Brazil | 152 | 1.0% |
| Bulgaria | 46 | 0.3% |
| Canada | 32 | 0.2% |
| Caribbean | 538 | 3.6% |
| Central America | 263 | 1.8% |
| Chile | 15 | 0.1% |
| China | 134 | 0.9% |
| Colombia | 157 | 1.1% |
| Cuba | 300 | 2.0% |
| Dominican Republic | 75 | 0.5% |
| Eastern Africa | 52 | 0.4% |
| Eastern Asia | 176 | 1.2% |
| Eastern Europe | 363 | 2.4% |
| Ecuador | 84 | 0.6% |
| El Salvador | 31 | 0.2% |
| England | 51 | 0.3% |
| Eritrea | 3 | 0.0% |
| Ethiopia | 4 | 0.0% |
| Europe | 534 | 3.6% |
| Germany | 9 | 0.1% |
| Greece | 8 | 0.1% |
| Guyana | 41 | 0.3% |
| Haiti | 26 | 0.2% |
| Honduras | 15 | 0.1% |
| Hungary | 15 | 0.1% |
| Iran | 4 | 0.0% |
| Italy | 10 | 0.1% |
| Jamaica | 76 | 0.5% |
| Korea | 42 | 0.3% |
| Latin America | 1,344 | 8.9% |
| Mexico | 217 | 1.5% |
| Northern Europe | 126 | 0.8% |
| Peru | 43 | 0.3% |
| Philippines | 194 | 1.3% |
| Portugal | 18 | 0.1% |
| Russia | 109 | 0.7% |
| Scotland | 17 | 0.1% |
| South Africa | 11 | 0.1% |
| South America | 543 | 3.6% |
| South Central Asia | 4 | 0.0% |
| South Eastern Asia | 416 | 2.8% |
| Southern Europe | 36 | 0.2% |
| Taiwan | 53 | 0.4% |
| Trinidad and Tobago | 61 | 0.4% |
| Venezuela | 39 | 0.3% |
| Vietnam | 222 | 1.5% |
| Western Europe | 9 | 0.1% | View All 51 Rows |
Sex and Age in Lockhart
Sex and Age in Lockhart
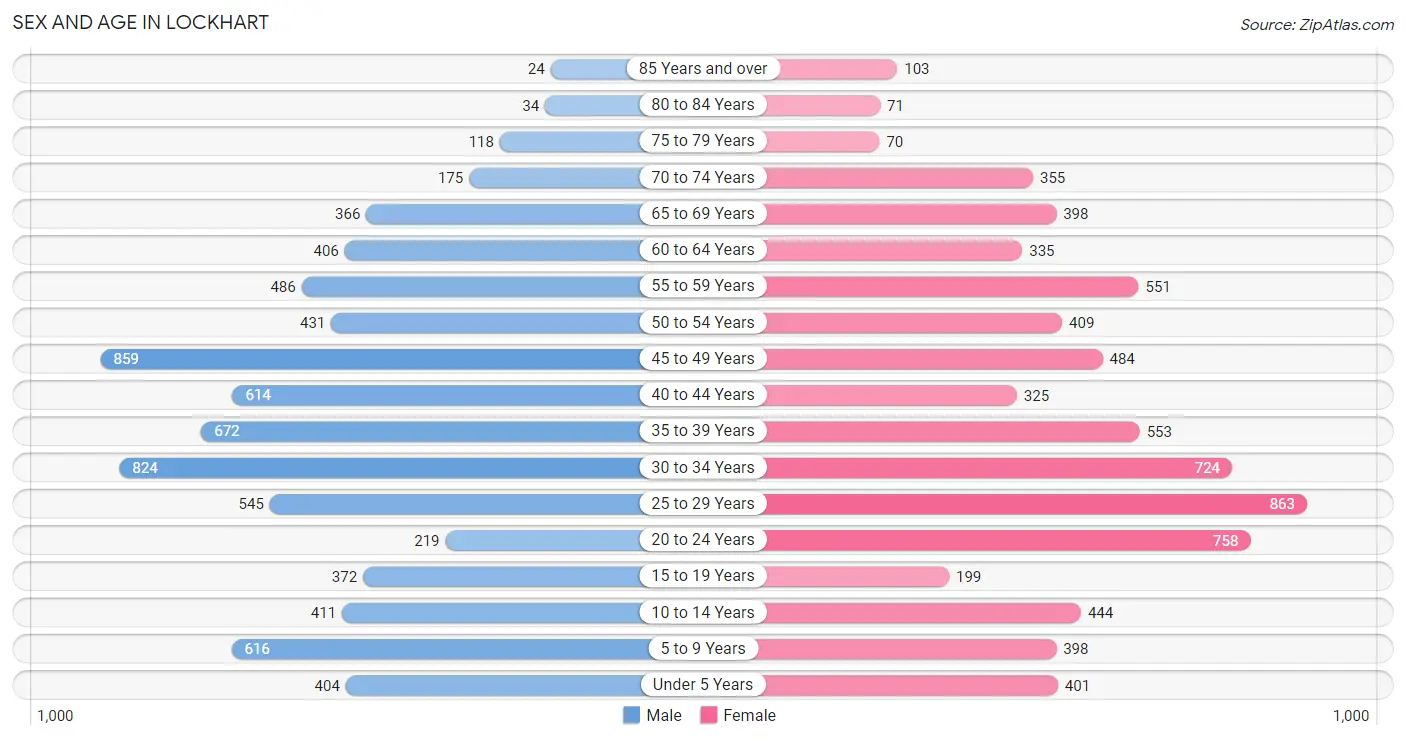
The most populous age groups in Lockhart are 45 to 49 Years (859 | 11.3%) for men and 25 to 29 Years (863 | 11.6%) for women.
| Age Bracket | Male | Female |
| Under 5 Years | 404 (5.3%) | 401 (5.4%) |
| 5 to 9 Years | 616 (8.1%) | 398 (5.3%) |
| 10 to 14 Years | 411 (5.4%) | 444 (6.0%) |
| 15 to 19 Years | 372 (4.9%) | 199 (2.7%) |
| 20 to 24 Years | 219 (2.9%) | 758 (10.2%) |
| 25 to 29 Years | 545 (7.2%) | 863 (11.6%) |
| 30 to 34 Years | 824 (10.9%) | 724 (9.7%) |
| 35 to 39 Years | 672 (8.9%) | 553 (7.4%) |
| 40 to 44 Years | 614 (8.1%) | 325 (4.4%) |
| 45 to 49 Years | 859 (11.3%) | 484 (6.5%) |
| 50 to 54 Years | 431 (5.7%) | 409 (5.5%) |
| 55 to 59 Years | 486 (6.4%) | 551 (7.4%) |
| 60 to 64 Years | 406 (5.4%) | 335 (4.5%) |
| 65 to 69 Years | 366 (4.8%) | 398 (5.3%) |
| 70 to 74 Years | 175 (2.3%) | 355 (4.8%) |
| 75 to 79 Years | 118 (1.6%) | 70 (0.9%) |
| 80 to 84 Years | 34 (0.4%) | 71 (0.9%) |
| 85 Years and over | 24 (0.3%) | 103 (1.4%) |
| Total | 7,576 (100.0%) | 7,441 (100.0%) |
Families and Households in Lockhart
Median Family Size in Lockhart
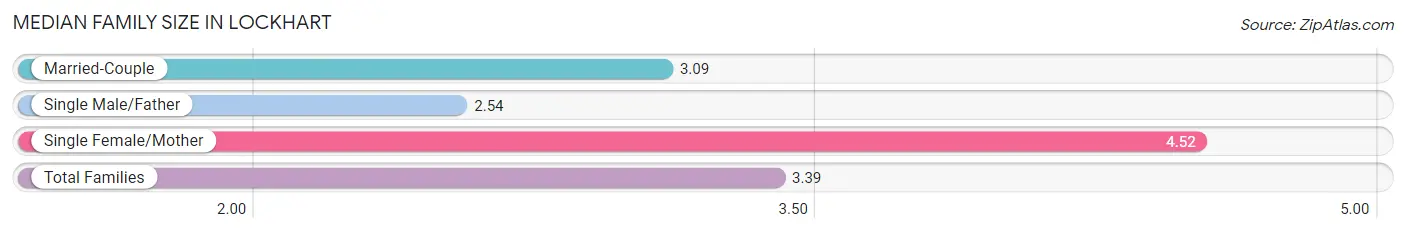
The median family size in Lockhart is 3.39 persons per family, with single female/mother families (875 | 25.0%) accounting for the largest median family size of 4.52 persons per family. On the other hand, single male/father families (361 | 10.3%) represent the smallest median family size with 2.54 persons per family.
| Family Type | # Families | Family Size |
| Married-Couple | 2,267 (64.7%) | 3.09 |
| Single Male/Father | 361 (10.3%) | 2.54 |
| Single Female/Mother | 875 (25.0%) | 4.52 |
| Total Families | 3,503 (100.0%) | 3.39 |
Median Household Size in Lockhart
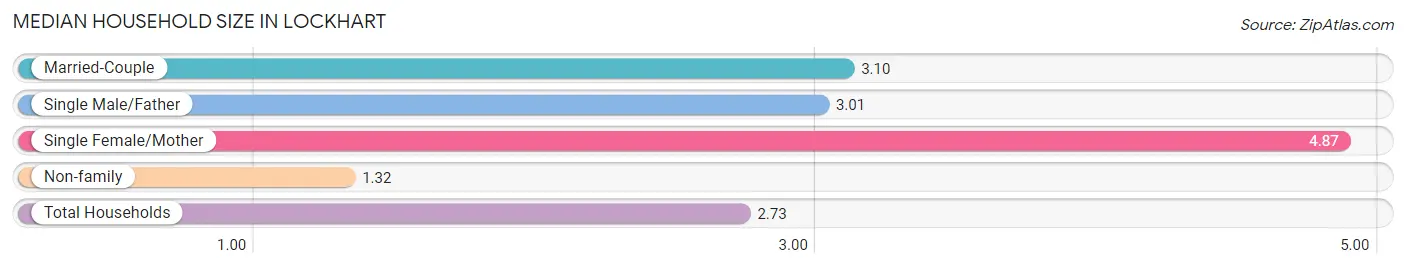
The median household size in Lockhart is 2.73 persons per household, with single female/mother households (875 | 16.0%) accounting for the largest median household size of 4.87 persons per household. non-family households (1,984 | 36.2%) represent the smallest median household size with 1.32 persons per household.
| Household Type | # Households | Household Size |
| Married-Couple | 2,267 (41.3%) | 3.10 |
| Single Male/Father | 361 (6.6%) | 3.01 |
| Single Female/Mother | 875 (16.0%) | 4.87 |
| Non-family | 1,984 (36.2%) | 1.32 |
| Total Households | 5,487 (100.0%) | 2.73 |
Household Size by Marriage Status in Lockhart
Out of a total of 5,487 households in Lockhart, 3,503 (63.8%) are family households, while 1,984 (36.2%) are nonfamily households. The most numerous type of family households are 2-person households, comprising 1,572, and the most common type of nonfamily households are 1-person households, comprising 1,581.
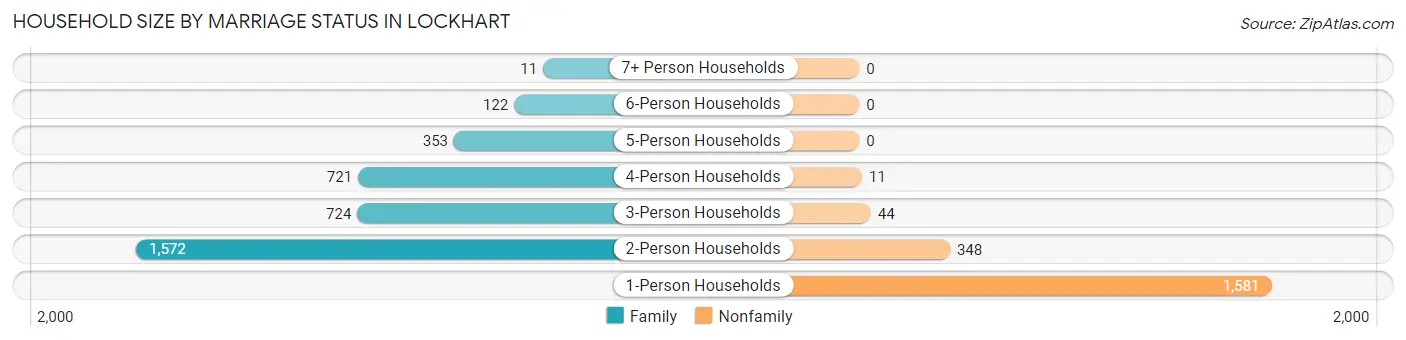
| Household Size | Family Households | Nonfamily Households |
| 1-Person Households | - | 1,581 (28.8%) |
| 2-Person Households | 1,572 (28.6%) | 348 (6.3%) |
| 3-Person Households | 724 (13.2%) | 44 (0.8%) |
| 4-Person Households | 721 (13.1%) | 11 (0.2%) |
| 5-Person Households | 353 (6.4%) | 0 (0.0%) |
| 6-Person Households | 122 (2.2%) | 0 (0.0%) |
| 7+ Person Households | 11 (0.2%) | 0 (0.0%) |
| Total | 3,503 (63.8%) | 1,984 (36.2%) |
Female Fertility in Lockhart
Fertility by Age in Lockhart
Average fertility rate in Lockhart is 34.0 births per 1,000 women. Women in the age bracket of 20 to 34 years have the highest fertility rate with 51.0 births per 1,000 women. Women in the age bracket of 20 to 34 years acount for 88.9% of all women with births.
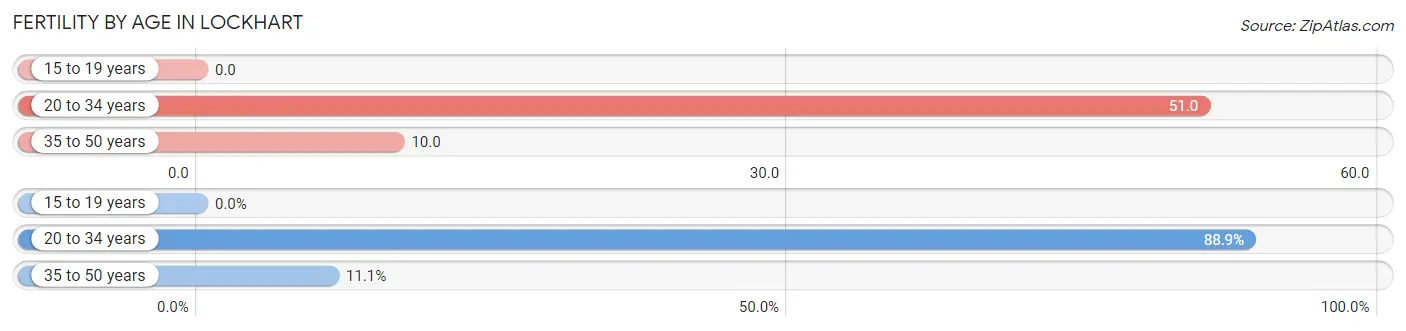
| Age Bracket | Women with Births | Births / 1,000 Women |
| 15 to 19 years | 0 (0.0%) | 0.0 |
| 20 to 34 years | 120 (88.9%) | 51.0 |
| 35 to 50 years | 15 (11.1%) | 10.0 |
| Total | 135 (100.0%) | 34.0 |
Fertility by Age by Marriage Status in Lockhart
39.3% of women with births (135) in Lockhart are married. The highest percentage of unmarried women with births falls into 20 to 34 years age bracket with 68.3% of them unmarried at the time of birth, while the lowest percentage of unmarried women with births belong to 35 to 50 years age bracket with 0.0% of them unmarried.
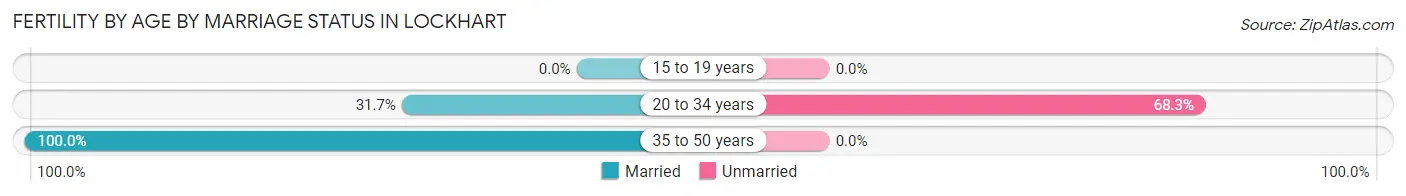
| Age Bracket | Married | Unmarried |
| 15 to 19 years | 0 (0.0%) | 0 (0.0%) |
| 20 to 34 years | 38 (31.7%) | 82 (68.3%) |
| 35 to 50 years | 15 (100.0%) | 0 (0.0%) |
| Total | 53 (39.3%) | 82 (60.7%) |
Fertility by Education in Lockhart
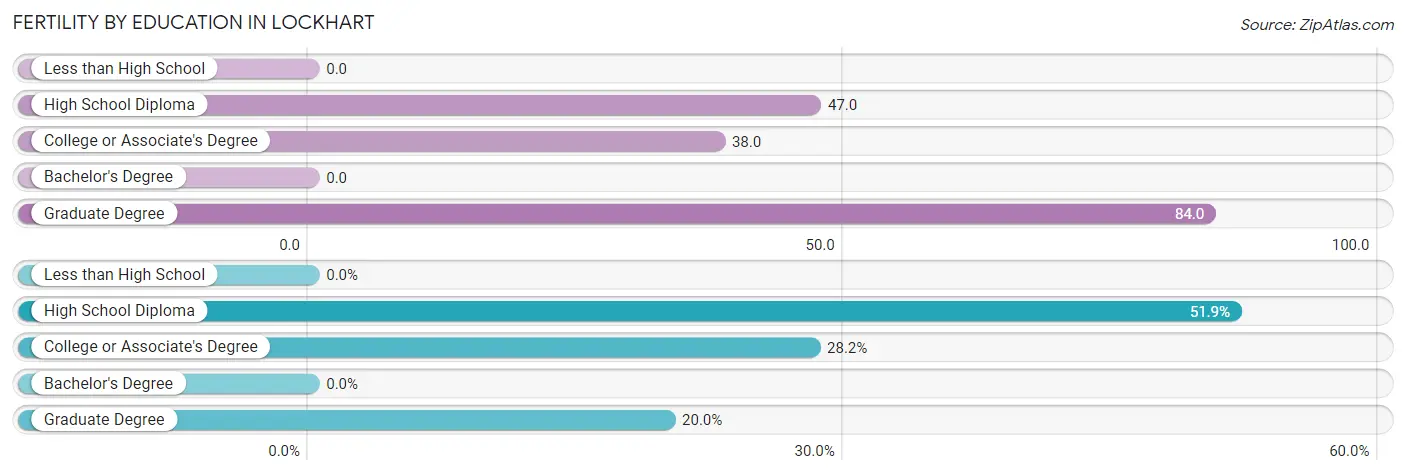
| Educational Attainment | Women with Births | Births / 1,000 Women |
| Less than High School | 0 (0.0%) | 0.0 |
| High School Diploma | 70 (51.8%) | 47.0 |
| College or Associate's Degree | 38 (28.1%) | 38.0 |
| Bachelor's Degree | 0 (0.0%) | 0.0 |
| Graduate Degree | 27 (20.0%) | 84.0 |
| Total | 135 (100.0%) | 34.0 |
Fertility by Education by Marriage Status in Lockhart
60.7% of women with births in Lockhart are unmarried. Women with the educational attainment of graduate degree are most likely to be married with 100.0% of them married at childbirth, while women with the educational attainment of high school diploma are least likely to be married with 100.0% of them unmarried at childbirth.
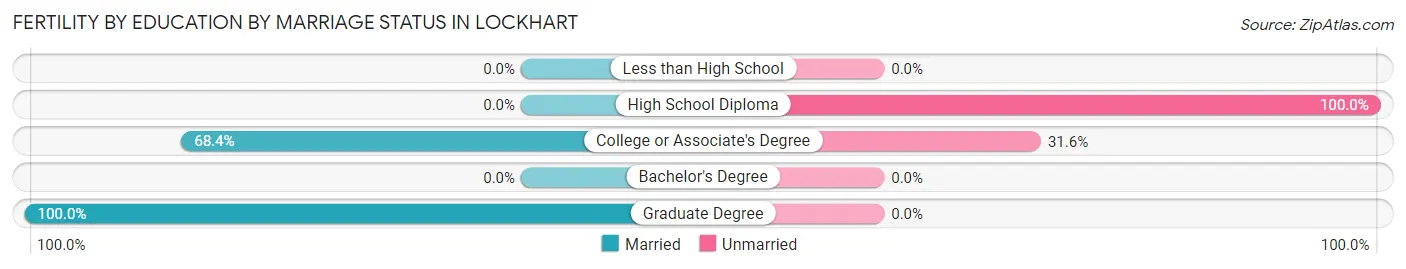
| Educational Attainment | Married | Unmarried |
| Less than High School | 0 (0.0%) | 0 (0.0%) |
| High School Diploma | 0 (0.0%) | 70 (100.0%) |
| College or Associate's Degree | 26 (68.4%) | 12 (31.6%) |
| Bachelor's Degree | 0 (0.0%) | 0 (0.0%) |
| Graduate Degree | 27 (100.0%) | 0 (0.0%) |
| Total | 53 (39.3%) | 82 (60.7%) |
Employment Characteristics in Lockhart
Employment by Class of Employer in Lockhart
Among the 8,461 employed individuals in Lockhart, private company employees (5,907 | 69.8%), local government employees (801 | 9.5%), and self-employed (incorporated) (586 | 6.9%) make up the most common classes of employment.
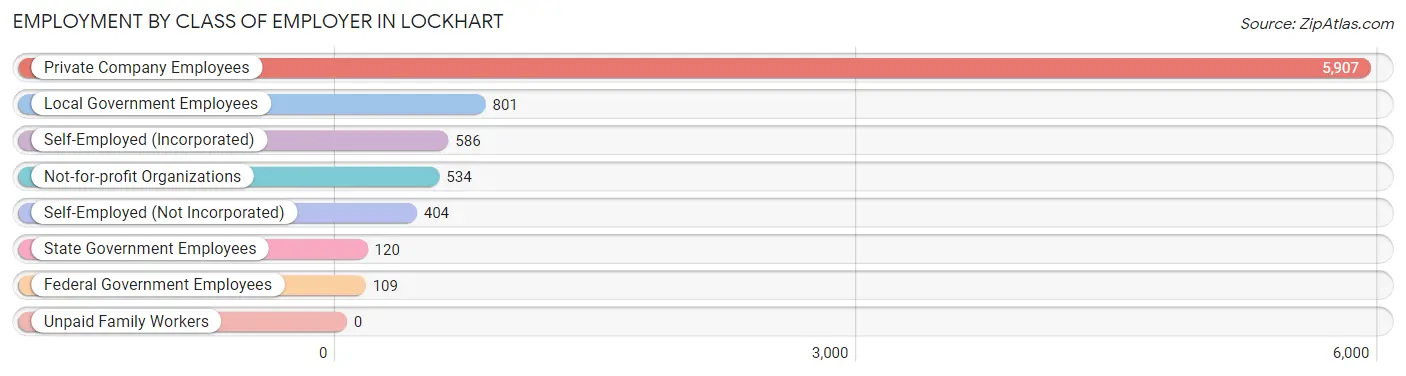
| Employer Class | # Employees | % Employees |
| Private Company Employees | 5,907 | 69.8% |
| Self-Employed (Incorporated) | 586 | 6.9% |
| Self-Employed (Not Incorporated) | 404 | 4.8% |
| Not-for-profit Organizations | 534 | 6.3% |
| Local Government Employees | 801 | 9.5% |
| State Government Employees | 120 | 1.4% |
| Federal Government Employees | 109 | 1.3% |
| Unpaid Family Workers | 0 | 0.0% |
| Total | 8,461 | 100.0% |
Employment Status by Age in Lockhart
According to the labor force statistics for Lockhart, out of the total population over 16 years of age (12,145), 74.6% or 9,060 individuals are in the labor force, with 6.0% or 544 of them unemployed. The age group with the highest labor force participation rate is 30 to 34 years, with 89.6% or 1,387 individuals in the labor force. Within the labor force, the 16 to 19 years age range has the highest percentage of unemployed individuals, with 55.4% or 97 of them being unemployed.
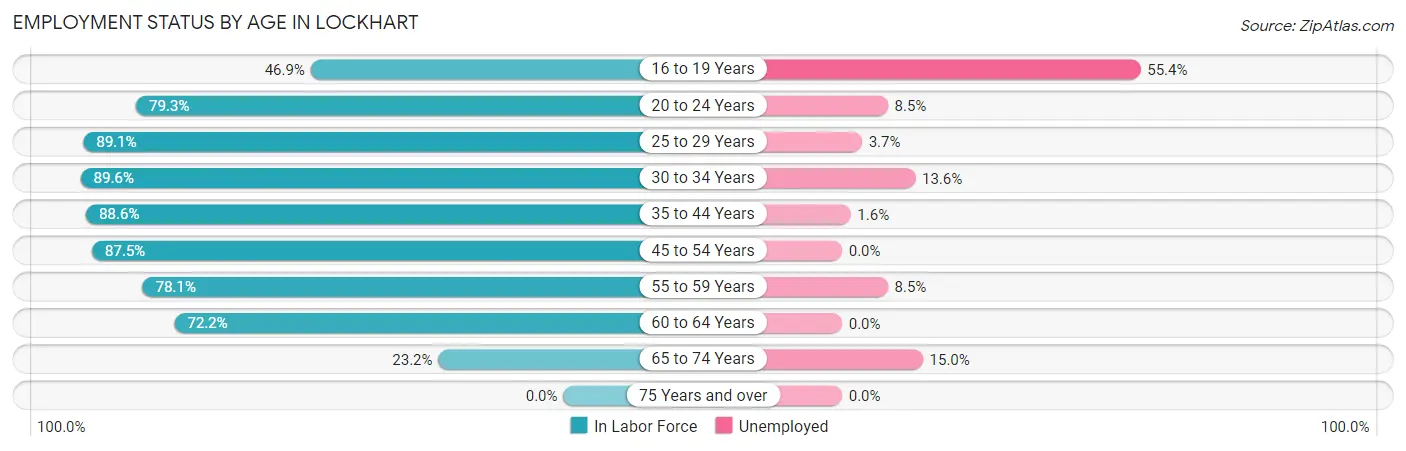
| Age Bracket | In Labor Force | Unemployed |
| 16 to 19 Years | 175 (46.9%) | 97 (55.4%) |
| 20 to 24 Years | 775 (79.3%) | 66 (8.5%) |
| 25 to 29 Years | 1,255 (89.1%) | 46 (3.7%) |
| 30 to 34 Years | 1,387 (89.6%) | 189 (13.6%) |
| 35 to 44 Years | 1,917 (88.6%) | 31 (1.6%) |
| 45 to 54 Years | 1,910 (87.5%) | 0 (0.0%) |
| 55 to 59 Years | 810 (78.1%) | 69 (8.5%) |
| 60 to 64 Years | 535 (72.2%) | 0 (0.0%) |
| 65 to 74 Years | 300 (23.2%) | 45 (15.0%) |
| 75 Years and over | 0 (0.0%) | 0 (0.0%) |
| Total | 9,060 (74.6%) | 544 (6.0%) |
Employment Status by Educational Attainment in Lockhart
According to labor force statistics for Lockhart, 86.1% of individuals (7,819) out of the total population between 25 and 64 years of age (9,081) are in the labor force, with 4.3% or 336 of them being unemployed. The group with the highest labor force participation rate are those with the educational attainment of college / associate degree, with 90.2% or 3,003 individuals in the labor force. Within the labor force, individuals with high school diploma education have the highest percentage of unemployment, with 10.5% or 203 of them being unemployed.
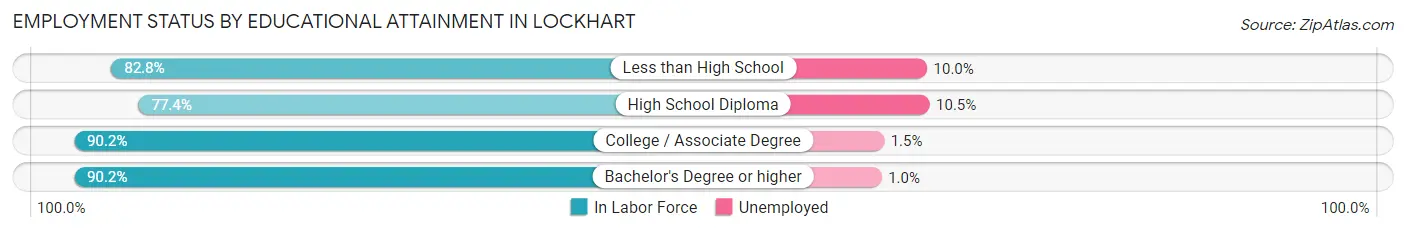
| Educational Attainment | In Labor Force | Unemployed |
| Less than High School | 623 (82.8%) | 75 (10.0%) |
| High School Diploma | 1,936 (77.4%) | 263 (10.5%) |
| College / Associate Degree | 3,003 (90.2%) | 50 (1.5%) |
| Bachelor's Degree or higher | 2,254 (90.2%) | 25 (1.0%) |
| Total | 7,819 (86.1%) | 390 (4.3%) |
Employment Occupations by Sex in Lockhart
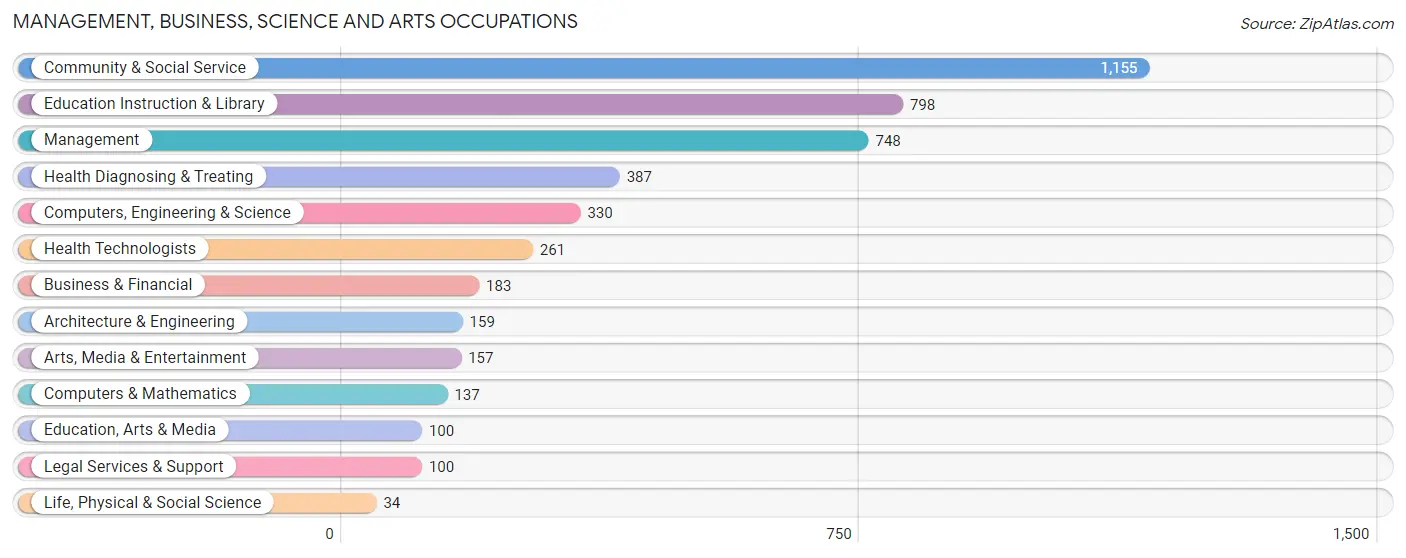
Management, Business, Science and Arts Occupations
The most common Management, Business, Science and Arts occupations in Lockhart are Community & Social Service (1,155 | 13.6%), Education Instruction & Library (798 | 9.4%), Management (748 | 8.8%), Health Diagnosing & Treating (387 | 4.5%), and Computers, Engineering & Science (330 | 3.9%).
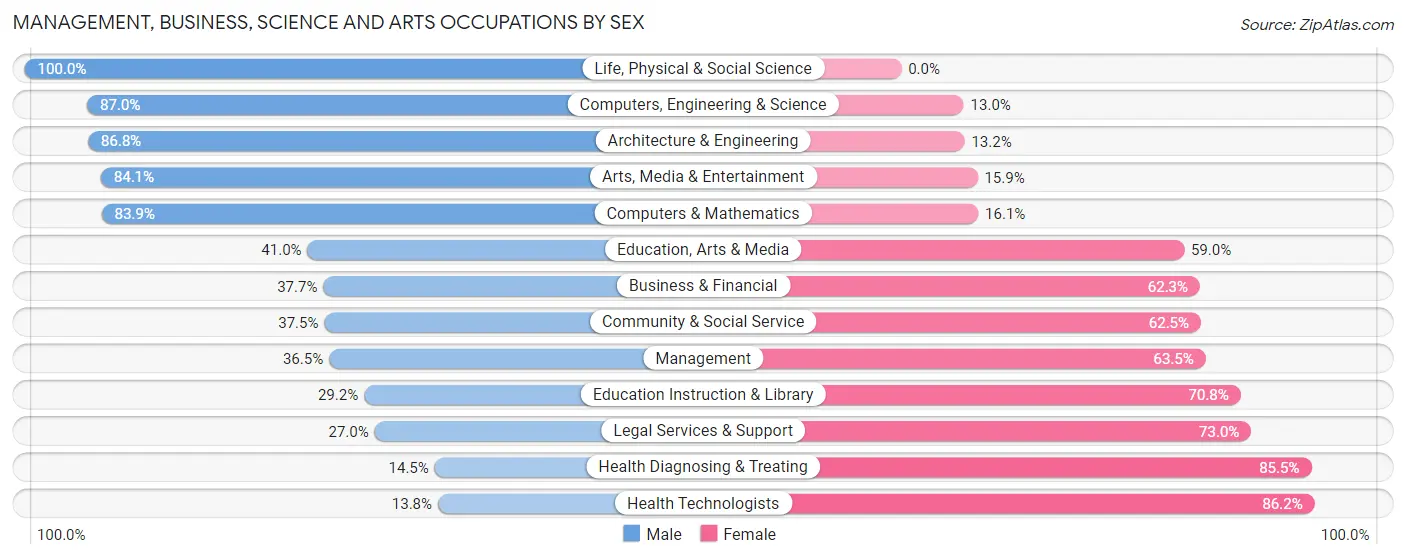
Management, Business, Science and Arts Occupations by Sex
Within the Management, Business, Science and Arts occupations in Lockhart, the most male-oriented occupations are Life, Physical & Social Science (100.0%), Computers, Engineering & Science (87.0%), and Architecture & Engineering (86.8%), while the most female-oriented occupations are Health Technologists (86.2%), Health Diagnosing & Treating (85.5%), and Legal Services & Support (73.0%).
| Occupation | Male | Female |
| Management | 273 (36.5%) | 475 (63.5%) |
| Business & Financial | 69 (37.7%) | 114 (62.3%) |
| Computers, Engineering & Science | 287 (87.0%) | 43 (13.0%) |
| Computers & Mathematics | 115 (83.9%) | 22 (16.1%) |
| Architecture & Engineering | 138 (86.8%) | 21 (13.2%) |
| Life, Physical & Social Science | 34 (100.0%) | 0 (0.0%) |
| Community & Social Service | 433 (37.5%) | 722 (62.5%) |
| Education, Arts & Media | 41 (41.0%) | 59 (59.0%) |
| Legal Services & Support | 27 (27.0%) | 73 (73.0%) |
| Education Instruction & Library | 233 (29.2%) | 565 (70.8%) |
| Arts, Media & Entertainment | 132 (84.1%) | 25 (15.9%) |
| Health Diagnosing & Treating | 56 (14.5%) | 331 (85.5%) |
| Health Technologists | 36 (13.8%) | 225 (86.2%) |
| Total (Category) | 1,118 (39.9%) | 1,685 (60.1%) |
| Total (Overall) | 4,592 (53.9%) | 3,919 (46.1%) |
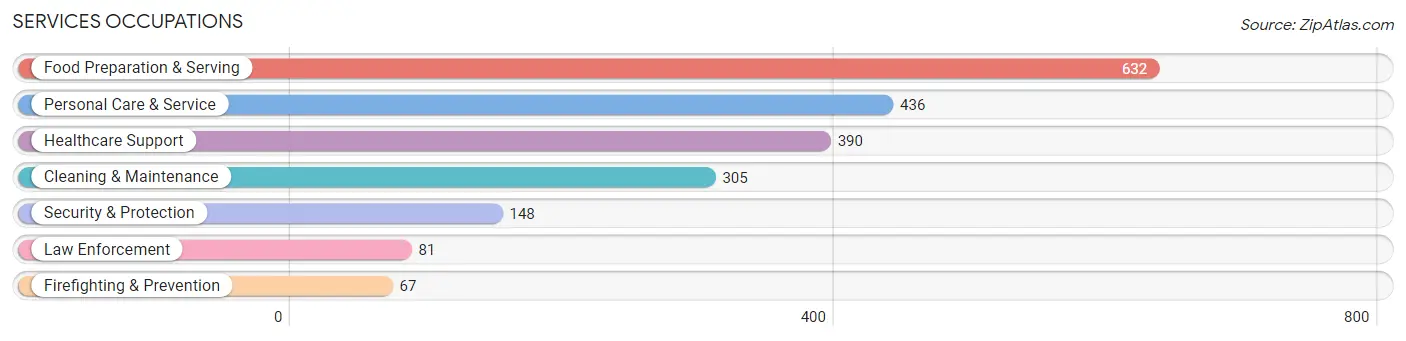
Services Occupations
The most common Services occupations in Lockhart are Food Preparation & Serving (632 | 7.4%), Personal Care & Service (436 | 5.1%), Healthcare Support (390 | 4.6%), Cleaning & Maintenance (305 | 3.6%), and Security & Protection (148 | 1.7%).
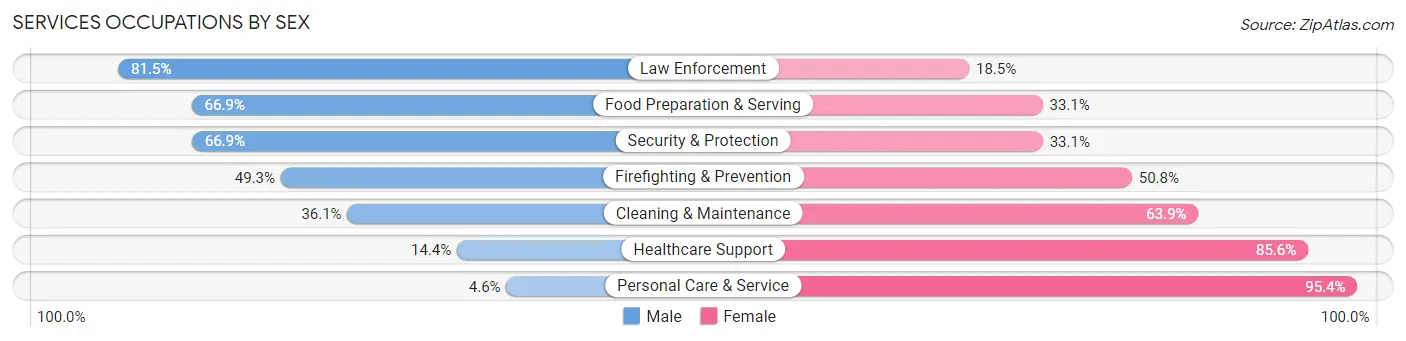
Services Occupations by Sex
Within the Services occupations in Lockhart, the most male-oriented occupations are Law Enforcement (81.5%), Food Preparation & Serving (66.9%), and Security & Protection (66.9%), while the most female-oriented occupations are Personal Care & Service (95.4%), Healthcare Support (85.6%), and Cleaning & Maintenance (63.9%).
| Occupation | Male | Female |
| Healthcare Support | 56 (14.4%) | 334 (85.6%) |
| Security & Protection | 99 (66.9%) | 49 (33.1%) |
| Firefighting & Prevention | 33 (49.2%) | 34 (50.7%) |
| Law Enforcement | 66 (81.5%) | 15 (18.5%) |
| Food Preparation & Serving | 423 (66.9%) | 209 (33.1%) |
| Cleaning & Maintenance | 110 (36.1%) | 195 (63.9%) |
| Personal Care & Service | 20 (4.6%) | 416 (95.4%) |
| Total (Category) | 708 (37.0%) | 1,203 (62.9%) |
| Total (Overall) | 4,592 (53.9%) | 3,919 (46.1%) |
Sales and Office Occupations
The most common Sales and Office occupations in Lockhart are Sales & Related (1,249 | 14.7%), and Office & Administration (718 | 8.4%).

Sales and Office Occupations by Sex
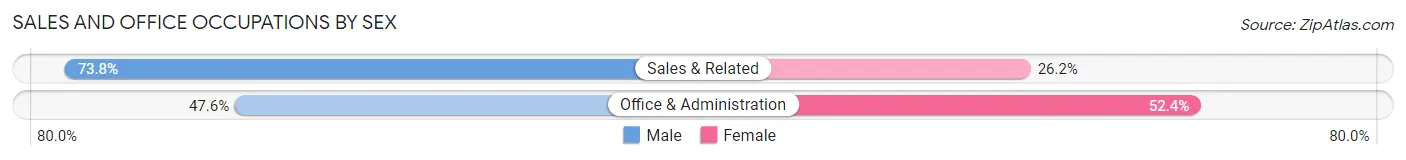
| Occupation | Male | Female |
| Sales & Related | 922 (73.8%) | 327 (26.2%) |
| Office & Administration | 342 (47.6%) | 376 (52.4%) |
| Total (Category) | 1,264 (64.3%) | 703 (35.7%) |
| Total (Overall) | 4,592 (53.9%) | 3,919 (46.1%) |
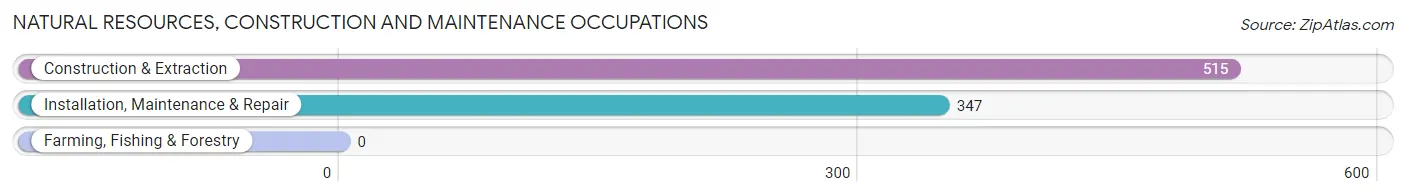
Natural Resources, Construction and Maintenance Occupations
The most common Natural Resources, Construction and Maintenance occupations in Lockhart are Construction & Extraction (515 | 6.0%), and Installation, Maintenance & Repair (347 | 4.1%).
Natural Resources, Construction and Maintenance Occupations by Sex
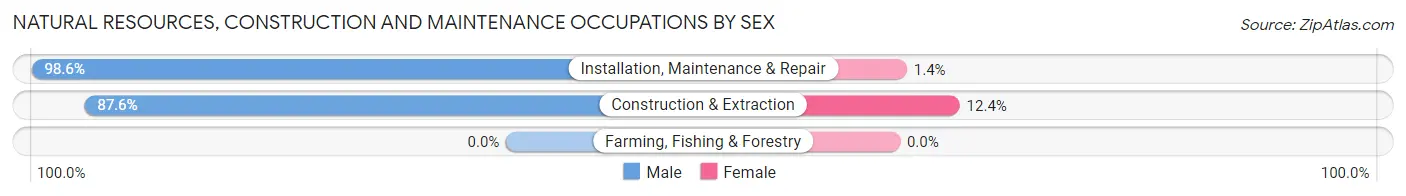
| Occupation | Male | Female |
| Farming, Fishing & Forestry | 0 (0.0%) | 0 (0.0%) |
| Construction & Extraction | 451 (87.6%) | 64 (12.4%) |
| Installation, Maintenance & Repair | 342 (98.6%) | 5 (1.4%) |
| Total (Category) | 793 (92.0%) | 69 (8.0%) |
| Total (Overall) | 4,592 (53.9%) | 3,919 (46.1%) |
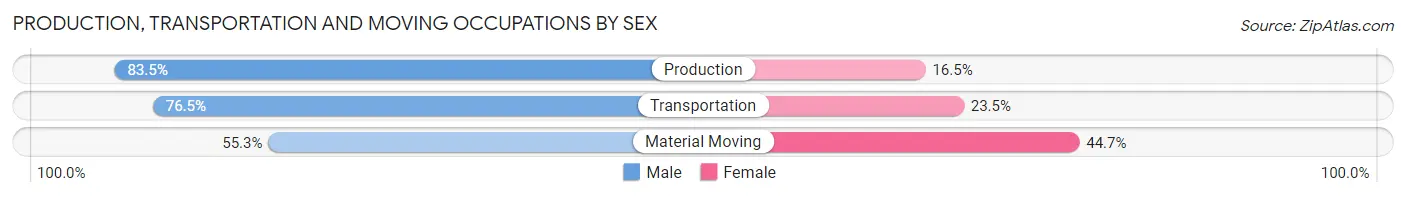
Production, Transportation and Moving Occupations
The most common Production, Transportation and Moving occupations in Lockhart are Transportation (425 | 5.0%), Production (297 | 3.5%), and Material Moving (246 | 2.9%).
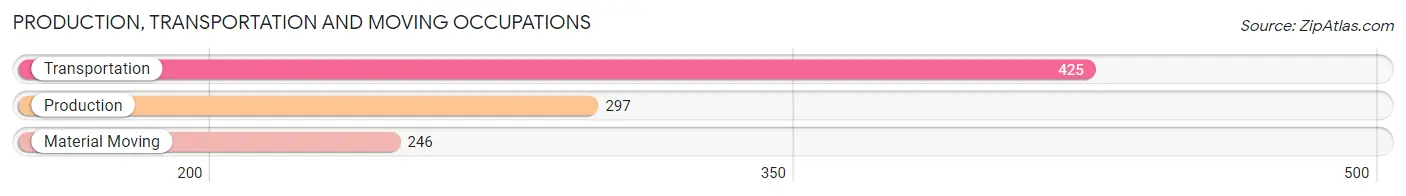
Production, Transportation and Moving Occupations by Sex
| Occupation | Male | Female |
| Production | 248 (83.5%) | 49 (16.5%) |
| Transportation | 325 (76.5%) | 100 (23.5%) |
| Material Moving | 136 (55.3%) | 110 (44.7%) |
| Total (Category) | 709 (73.2%) | 259 (26.8%) |
| Total (Overall) | 4,592 (53.9%) | 3,919 (46.1%) |
Employment Industries by Sex in Lockhart
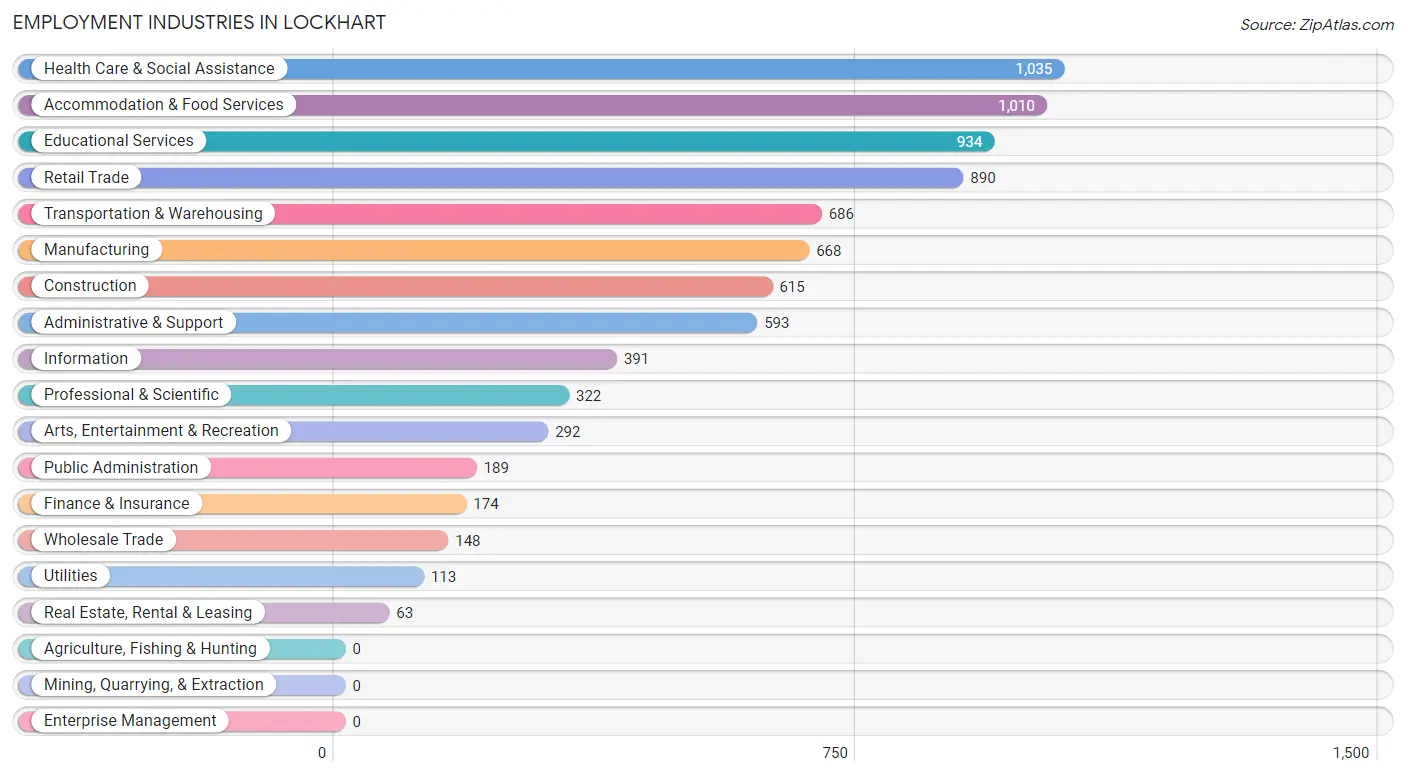
Employment Industries in Lockhart
The major employment industries in Lockhart include Health Care & Social Assistance (1,035 | 12.2%), Accommodation & Food Services (1,010 | 11.9%), Educational Services (934 | 11.0%), Retail Trade (890 | 10.5%), and Transportation & Warehousing (686 | 8.1%).
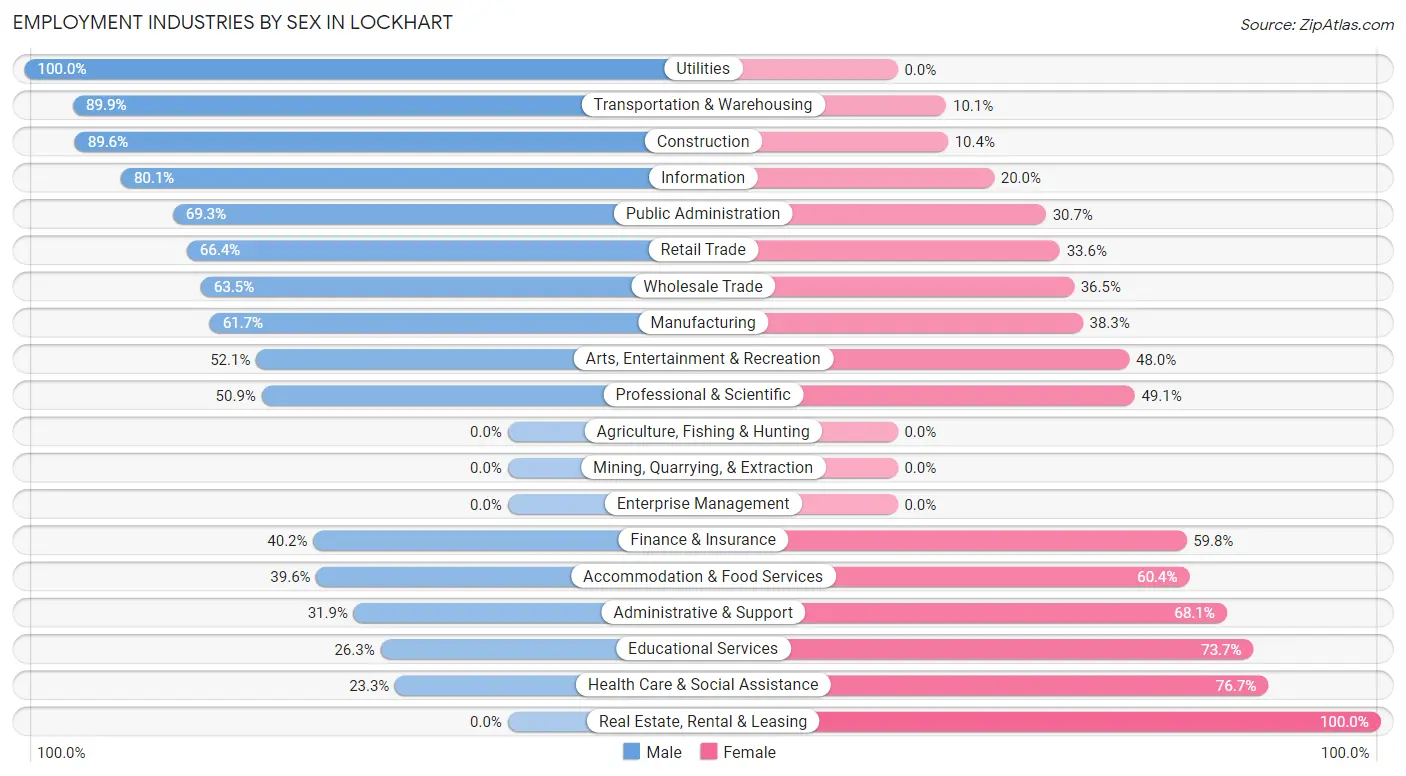
Employment Industries by Sex in Lockhart
The Lockhart industries that see more men than women are Utilities (100.0%), Transportation & Warehousing (89.9%), and Construction (89.6%), whereas the industries that tend to have a higher number of women are Real Estate, Rental & Leasing (100.0%), Health Care & Social Assistance (76.7%), and Educational Services (73.7%).
| Industry | Male | Female |
| Agriculture, Fishing & Hunting | 0 (0.0%) | 0 (0.0%) |
| Mining, Quarrying, & Extraction | 0 (0.0%) | 0 (0.0%) |
| Construction | 551 (89.6%) | 64 (10.4%) |
| Manufacturing | 412 (61.7%) | 256 (38.3%) |
| Wholesale Trade | 94 (63.5%) | 54 (36.5%) |
| Retail Trade | 591 (66.4%) | 299 (33.6%) |
| Transportation & Warehousing | 617 (89.9%) | 69 (10.1%) |
| Utilities | 113 (100.0%) | 0 (0.0%) |
| Information | 313 (80.0%) | 78 (20.0%) |
| Finance & Insurance | 70 (40.2%) | 104 (59.8%) |
| Real Estate, Rental & Leasing | 0 (0.0%) | 63 (100.0%) |
| Professional & Scientific | 164 (50.9%) | 158 (49.1%) |
| Enterprise Management | 0 (0.0%) | 0 (0.0%) |
| Administrative & Support | 189 (31.9%) | 404 (68.1%) |
| Educational Services | 246 (26.3%) | 688 (73.7%) |
| Health Care & Social Assistance | 241 (23.3%) | 794 (76.7%) |
| Arts, Entertainment & Recreation | 152 (52.0%) | 140 (47.9%) |
| Accommodation & Food Services | 400 (39.6%) | 610 (60.4%) |
| Public Administration | 131 (69.3%) | 58 (30.7%) |
| Total | 4,592 (53.9%) | 3,919 (46.1%) |
Education in Lockhart
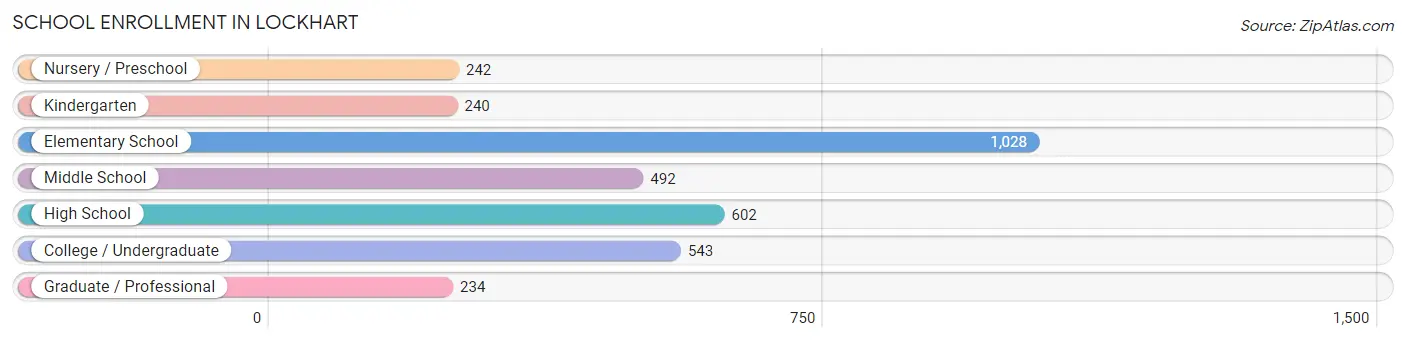
School Enrollment in Lockhart
The most common levels of schooling among the 3,381 students in Lockhart are elementary school (1,028 | 30.4%), high school (602 | 17.8%), and college / undergraduate (543 | 16.1%).
| School Level | # Students | % Students |
| Nursery / Preschool | 242 | 7.2% |
| Kindergarten | 240 | 7.1% |
| Elementary School | 1,028 | 30.4% |
| Middle School | 492 | 14.5% |
| High School | 602 | 17.8% |
| College / Undergraduate | 543 | 16.1% |
| Graduate / Professional | 234 | 6.9% |
| Total | 3,381 | 100.0% |
School Enrollment by Age by Funding Source in Lockhart
Out of a total of 3,381 students who are enrolled in schools in Lockhart, 876 (25.9%) attend a private institution, while the remaining 2,505 (74.1%) are enrolled in public schools. The age group of 35 years and over has the highest likelihood of being enrolled in private schools, with 195 (62.3% in the age bracket) enrolled. Conversely, the age group of 18 to 19 year olds has the lowest likelihood of being enrolled in a private school, with 112 (100.0% in the age bracket) attending a public institution.
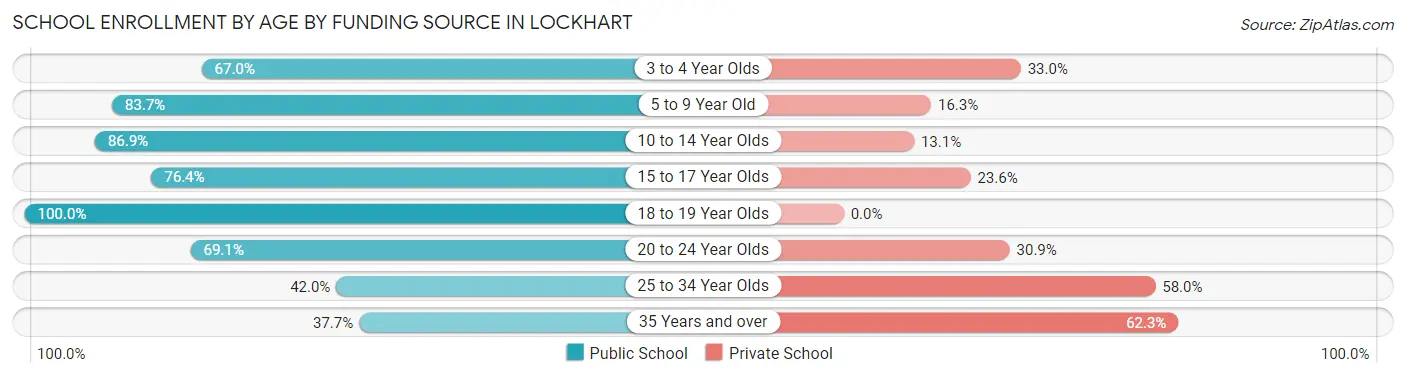
| Age Bracket | Public School | Private School |
| 3 to 4 Year Olds | 126 (67.0%) | 62 (33.0%) |
| 5 to 9 Year Old | 849 (83.7%) | 165 (16.3%) |
| 10 to 14 Year Olds | 743 (86.9%) | 112 (13.1%) |
| 15 to 17 Year Olds | 304 (76.4%) | 94 (23.6%) |
| 18 to 19 Year Olds | 112 (100.0%) | 0 (0.0%) |
| 20 to 24 Year Olds | 114 (69.1%) | 51 (30.9%) |
| 25 to 34 Year Olds | 141 (42.0%) | 195 (58.0%) |
| 35 Years and over | 118 (37.7%) | 195 (62.3%) |
| Total | 2,505 (74.1%) | 876 (25.9%) |
Educational Attainment by Field of Study in Lockhart
Education (646 | 21.1%), business (476 | 15.5%), science & technology (281 | 9.2%), arts & humanities (265 | 8.6%), and bio, nature & agricultural (244 | 8.0%) are the most common fields of study among 3,067 individuals in Lockhart who have obtained a bachelor's degree or higher.
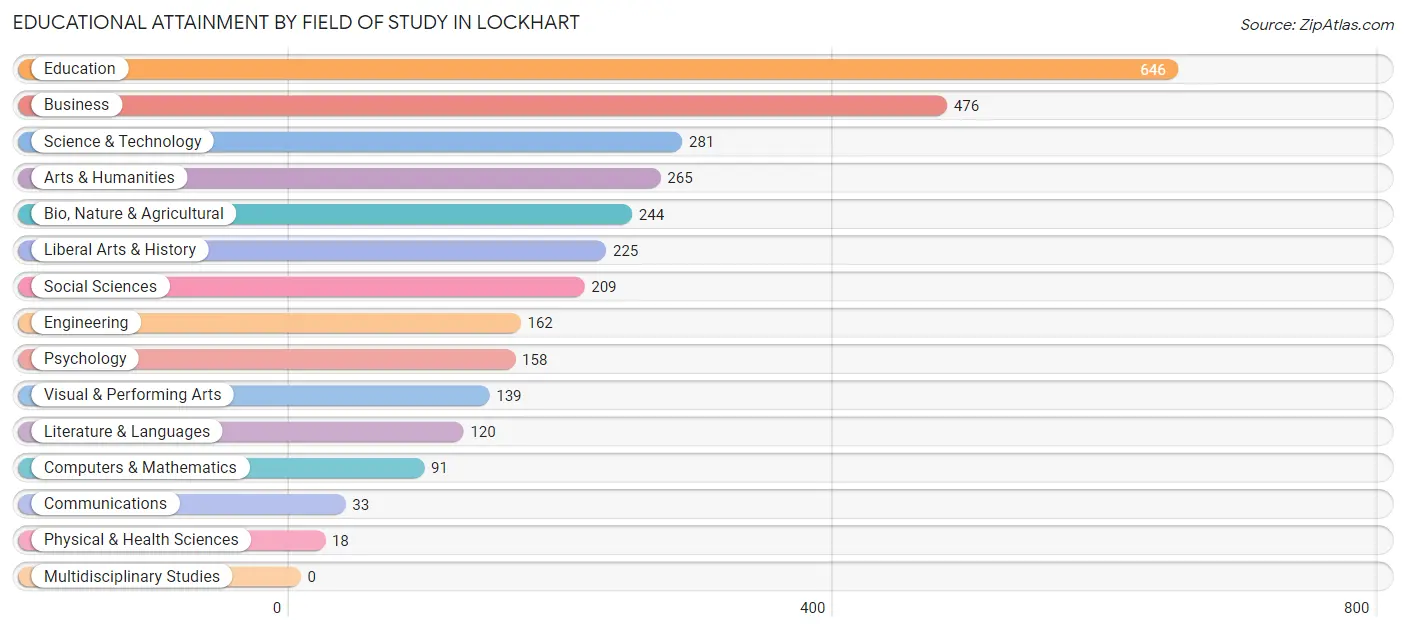
| Field of Study | # Graduates | % Graduates |
| Computers & Mathematics | 91 | 3.0% |
| Bio, Nature & Agricultural | 244 | 8.0% |
| Physical & Health Sciences | 18 | 0.6% |
| Psychology | 158 | 5.1% |
| Social Sciences | 209 | 6.8% |
| Engineering | 162 | 5.3% |
| Multidisciplinary Studies | 0 | 0.0% |
| Science & Technology | 281 | 9.2% |
| Business | 476 | 15.5% |
| Education | 646 | 21.1% |
| Literature & Languages | 120 | 3.9% |
| Liberal Arts & History | 225 | 7.3% |
| Visual & Performing Arts | 139 | 4.5% |
| Communications | 33 | 1.1% |
| Arts & Humanities | 265 | 8.6% |
| Total | 3,067 | 100.0% |
Transportation & Commute in Lockhart
Vehicle Availability by Sex in Lockhart
The most prevalent vehicle ownership categories in Lockhart are males with 2 vehicles (2,483, accounting for 54.0%) and females with 2 vehicles (2,126, making up 64.3%).
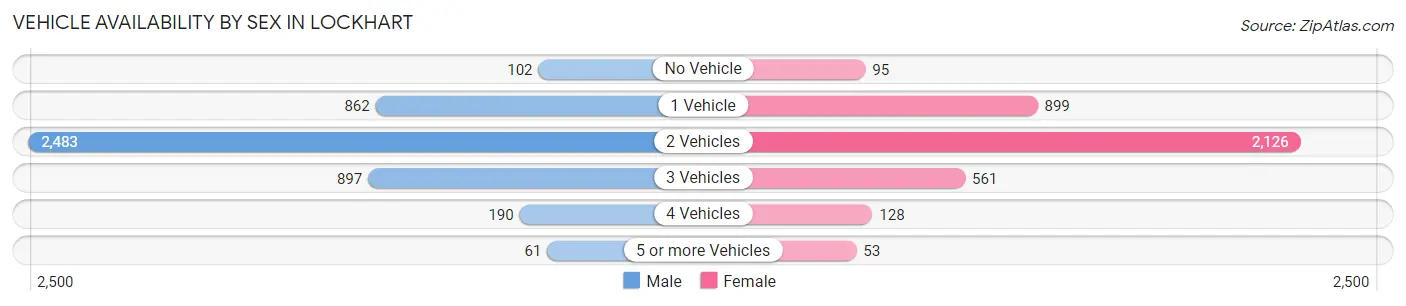
| Vehicles Available | Male | Female |
| No Vehicle | 102 (2.2%) | 95 (2.5%) |
| 1 Vehicle | 862 (18.8%) | 899 (23.3%) |
| 2 Vehicles | 2,483 (54.0%) | 2,126 (55.0%) |
| 3 Vehicles | 897 (19.5%) | 561 (14.5%) |
| 4 Vehicles | 190 (4.1%) | 128 (3.3%) |
| 5 or more Vehicles | 61 (1.3%) | 53 (1.4%) |
| Total | 4,595 (100.0%) | 3,862 (100.0%) |
Commute Time in Lockhart
The most frequently occuring commute durations in Lockhart are 30 to 34 minutes (1,402 commuters, 18.1%), 15 to 19 minutes (1,276 commuters, 16.5%), and 10 to 14 minutes (1,211 commuters, 15.7%).
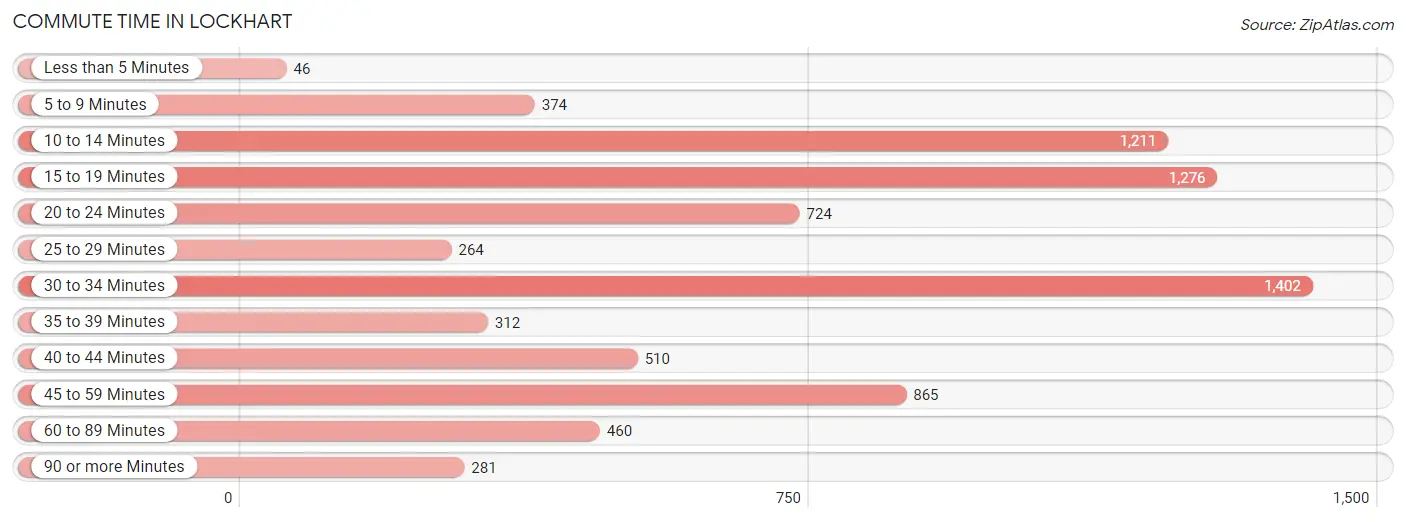
| Commute Time | # Commuters | % Commuters |
| Less than 5 Minutes | 46 | 0.6% |
| 5 to 9 Minutes | 374 | 4.8% |
| 10 to 14 Minutes | 1,211 | 15.7% |
| 15 to 19 Minutes | 1,276 | 16.5% |
| 20 to 24 Minutes | 724 | 9.4% |
| 25 to 29 Minutes | 264 | 3.4% |
| 30 to 34 Minutes | 1,402 | 18.1% |
| 35 to 39 Minutes | 312 | 4.0% |
| 40 to 44 Minutes | 510 | 6.6% |
| 45 to 59 Minutes | 865 | 11.2% |
| 60 to 89 Minutes | 460 | 5.9% |
| 90 or more Minutes | 281 | 3.6% |
Commute Time by Sex in Lockhart
The most common commute times in Lockhart are 10 to 14 minutes (833 commuters, 19.5%) for males and 30 to 34 minutes (772 commuters, 22.3%) for females.
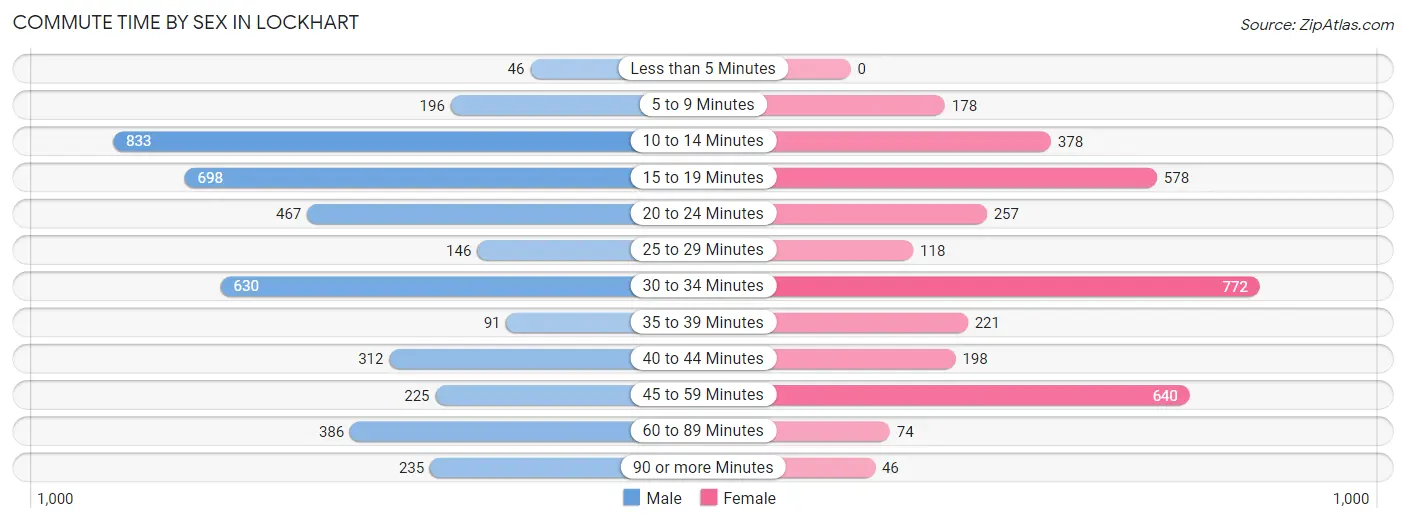
| Commute Time | Male | Female |
| Less than 5 Minutes | 46 (1.1%) | 0 (0.0%) |
| 5 to 9 Minutes | 196 (4.6%) | 178 (5.1%) |
| 10 to 14 Minutes | 833 (19.5%) | 378 (10.9%) |
| 15 to 19 Minutes | 698 (16.4%) | 578 (16.7%) |
| 20 to 24 Minutes | 467 (11.0%) | 257 (7.4%) |
| 25 to 29 Minutes | 146 (3.4%) | 118 (3.4%) |
| 30 to 34 Minutes | 630 (14.8%) | 772 (22.3%) |
| 35 to 39 Minutes | 91 (2.1%) | 221 (6.4%) |
| 40 to 44 Minutes | 312 (7.3%) | 198 (5.7%) |
| 45 to 59 Minutes | 225 (5.3%) | 640 (18.5%) |
| 60 to 89 Minutes | 386 (9.0%) | 74 (2.1%) |
| 90 or more Minutes | 235 (5.5%) | 46 (1.3%) |
Time of Departure to Work by Sex in Lockhart
The most frequent times of departure to work in Lockhart are 7:00 AM to 7:29 AM (908, 21.3%) for males and 7:00 AM to 7:29 AM (607, 17.5%) for females.
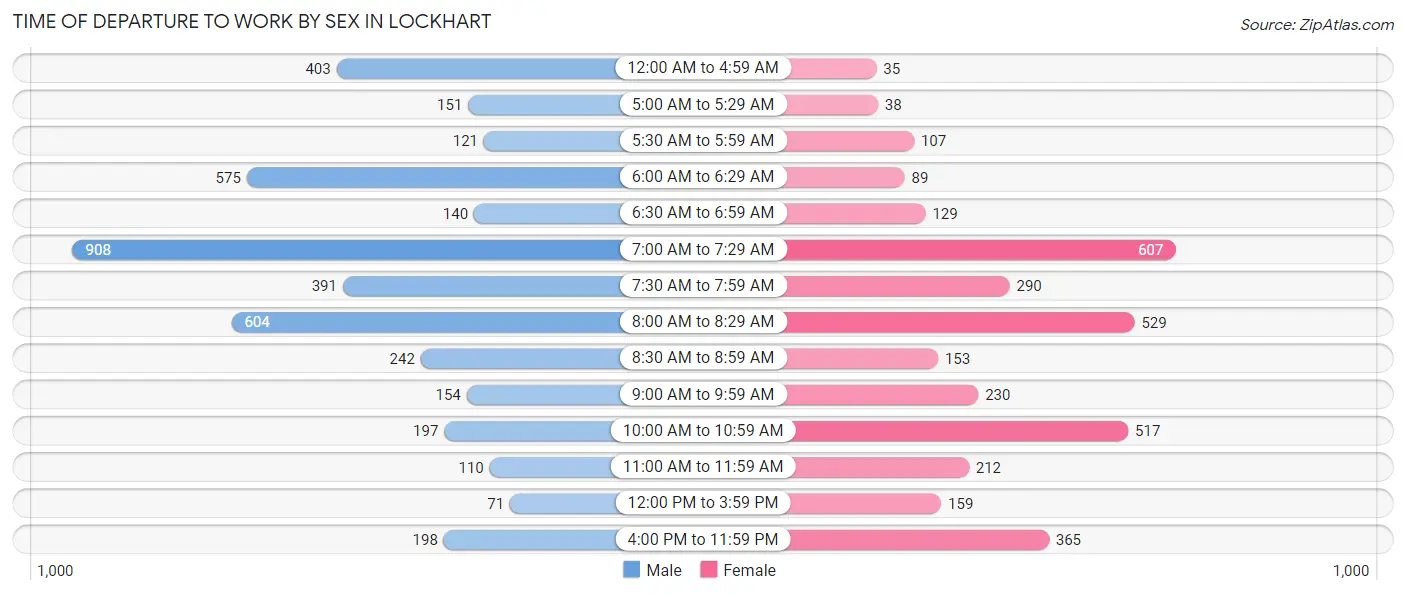
| Time of Departure | Male | Female |
| 12:00 AM to 4:59 AM | 403 (9.5%) | 35 (1.0%) |
| 5:00 AM to 5:29 AM | 151 (3.5%) | 38 (1.1%) |
| 5:30 AM to 5:59 AM | 121 (2.8%) | 107 (3.1%) |
| 6:00 AM to 6:29 AM | 575 (13.5%) | 89 (2.6%) |
| 6:30 AM to 6:59 AM | 140 (3.3%) | 129 (3.7%) |
| 7:00 AM to 7:29 AM | 908 (21.3%) | 607 (17.5%) |
| 7:30 AM to 7:59 AM | 391 (9.2%) | 290 (8.4%) |
| 8:00 AM to 8:29 AM | 604 (14.2%) | 529 (15.3%) |
| 8:30 AM to 8:59 AM | 242 (5.7%) | 153 (4.4%) |
| 9:00 AM to 9:59 AM | 154 (3.6%) | 230 (6.7%) |
| 10:00 AM to 10:59 AM | 197 (4.6%) | 517 (14.9%) |
| 11:00 AM to 11:59 AM | 110 (2.6%) | 212 (6.1%) |
| 12:00 PM to 3:59 PM | 71 (1.7%) | 159 (4.6%) |
| 4:00 PM to 11:59 PM | 198 (4.6%) | 365 (10.5%) |
| Total | 4,265 (100.0%) | 3,460 (100.0%) |
Housing Occupancy in Lockhart
Occupancy by Ownership in Lockhart
Of the total 5,487 dwellings in Lockhart, owner-occupied units account for 3,412 (62.2%), while renter-occupied units make up 2,075 (37.8%).
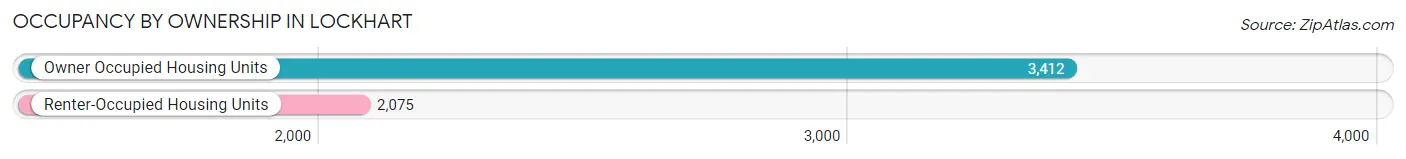
| Occupancy | # Housing Units | % Housing Units |
| Owner Occupied Housing Units | 3,412 | 62.2% |
| Renter-Occupied Housing Units | 2,075 | 37.8% |
| Total Occupied Housing Units | 5,487 | 100.0% |
Occupancy by Household Size in Lockhart
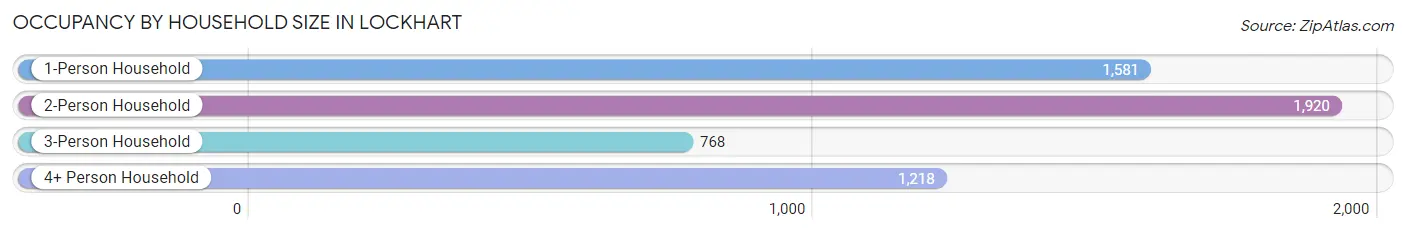
| Household Size | # Housing Units | % Housing Units |
| 1-Person Household | 1,581 | 28.8% |
| 2-Person Household | 1,920 | 35.0% |
| 3-Person Household | 768 | 14.0% |
| 4+ Person Household | 1,218 | 22.2% |
| Total Housing Units | 5,487 | 100.0% |
Occupancy by Ownership by Household Size in Lockhart
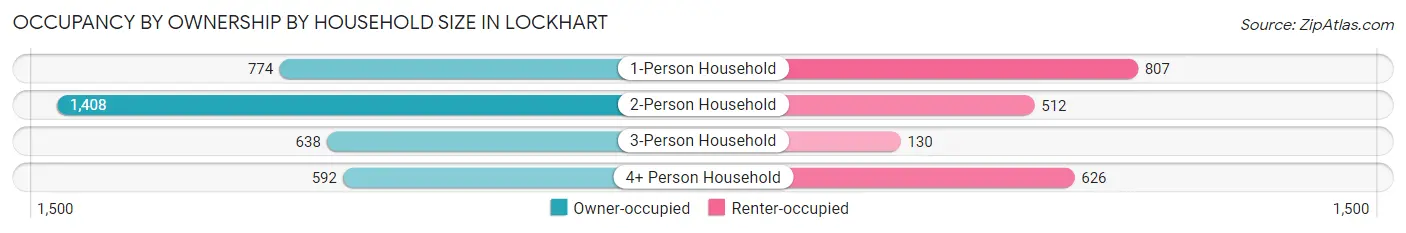
| Household Size | Owner-occupied | Renter-occupied |
| 1-Person Household | 774 (49.0%) | 807 (51.0%) |
| 2-Person Household | 1,408 (73.3%) | 512 (26.7%) |
| 3-Person Household | 638 (83.1%) | 130 (16.9%) |
| 4+ Person Household | 592 (48.6%) | 626 (51.4%) |
| Total Housing Units | 3,412 (62.2%) | 2,075 (37.8%) |
Occupancy by Educational Attainment in Lockhart
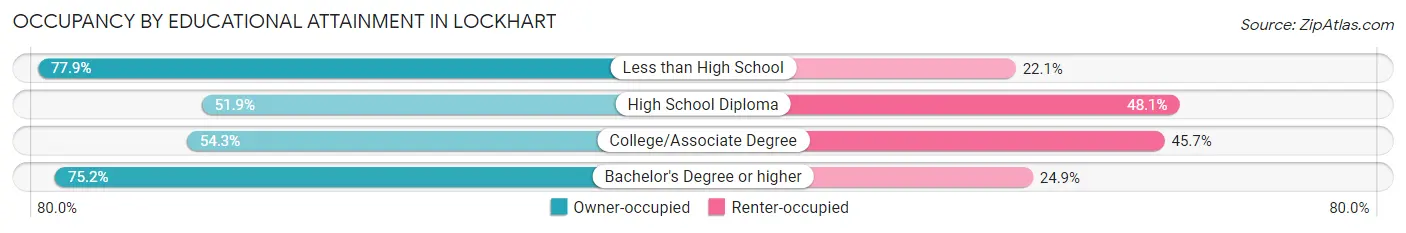
| Household Size | Owner-occupied | Renter-occupied |
| Less than High School | 366 (77.9%) | 104 (22.1%) |
| High School Diploma | 649 (51.9%) | 601 (48.1%) |
| College/Associate Degree | 1,127 (54.3%) | 950 (45.7%) |
| Bachelor's Degree or higher | 1,270 (75.1%) | 420 (24.8%) |
Occupancy by Age of Householder in Lockhart
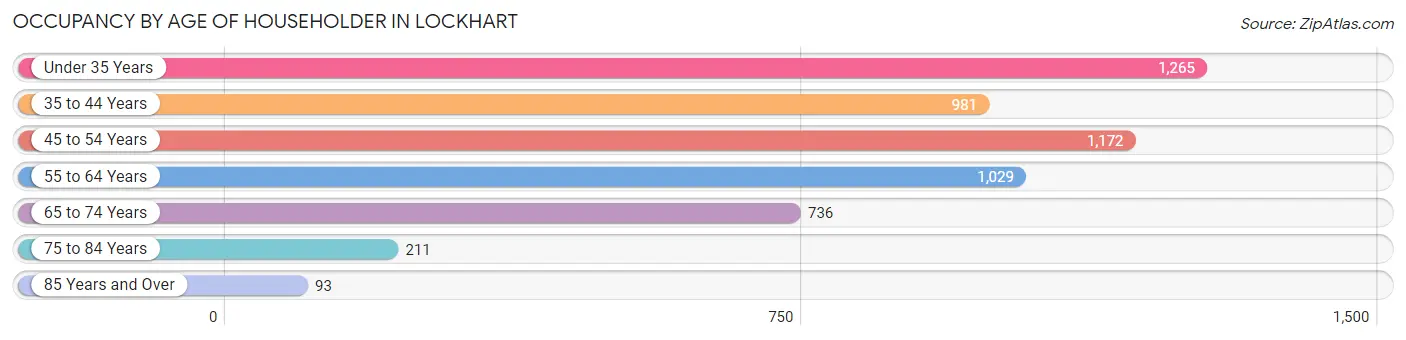
| Age Bracket | # Households | % Households |
| Under 35 Years | 1,265 | 23.1% |
| 35 to 44 Years | 981 | 17.9% |
| 45 to 54 Years | 1,172 | 21.4% |
| 55 to 64 Years | 1,029 | 18.8% |
| 65 to 74 Years | 736 | 13.4% |
| 75 to 84 Years | 211 | 3.8% |
| 85 Years and Over | 93 | 1.7% |
| Total | 5,487 | 100.0% |
Housing Finances in Lockhart
Median Income by Occupancy in Lockhart
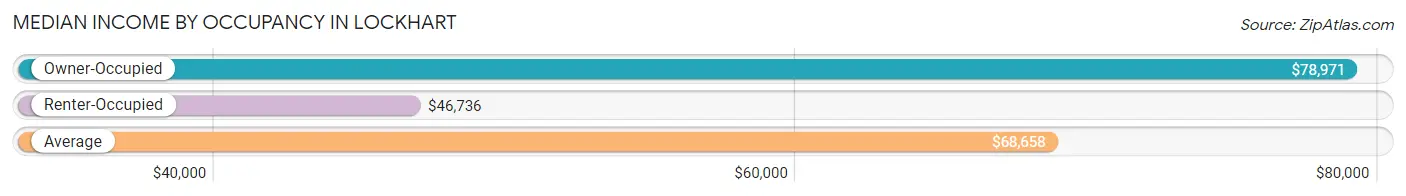
| Occupancy Type | # Households | Median Income |
| Owner-Occupied | 3,412 (62.2%) | $78,971 |
| Renter-Occupied | 2,075 (37.8%) | $46,736 |
| Average | 5,487 (100.0%) | $68,658 |
Occupancy by Householder Income Bracket in Lockhart
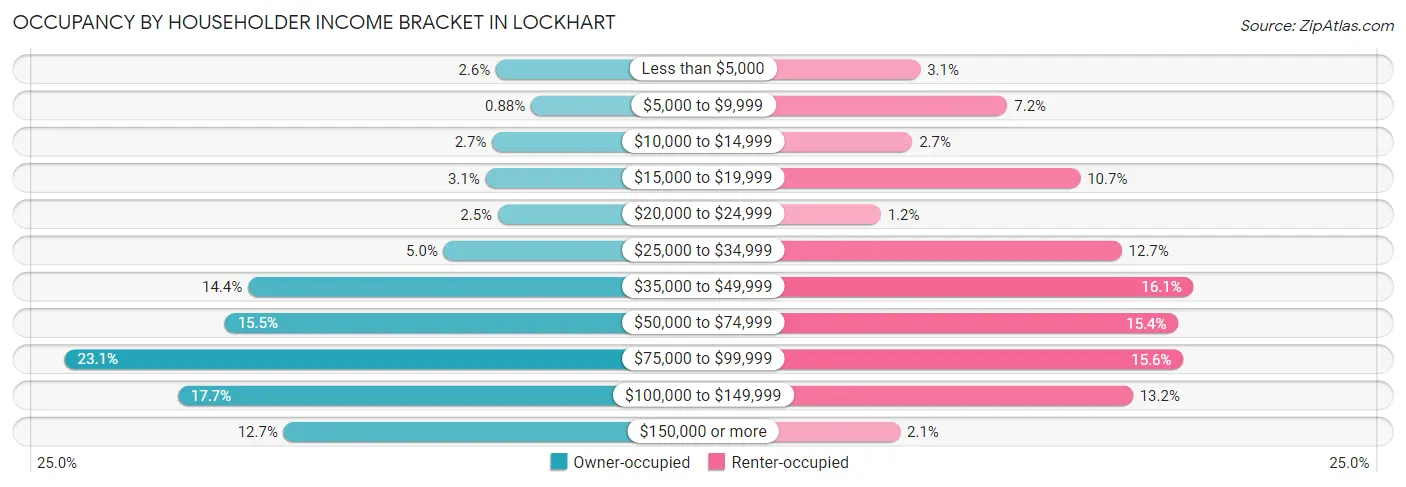
| Income Bracket | Owner-occupied | Renter-occupied |
| Less than $5,000 | 87 (2.5%) | 64 (3.1%) |
| $5,000 to $9,999 | 30 (0.9%) | 150 (7.2%) |
| $10,000 to $14,999 | 93 (2.7%) | 56 (2.7%) |
| $15,000 to $19,999 | 104 (3.0%) | 222 (10.7%) |
| $20,000 to $24,999 | 84 (2.5%) | 25 (1.2%) |
| $25,000 to $34,999 | 172 (5.0%) | 263 (12.7%) |
| $35,000 to $49,999 | 490 (14.4%) | 334 (16.1%) |
| $50,000 to $74,999 | 528 (15.5%) | 319 (15.4%) |
| $75,000 to $99,999 | 788 (23.1%) | 324 (15.6%) |
| $100,000 to $149,999 | 604 (17.7%) | 274 (13.2%) |
| $150,000 or more | 432 (12.7%) | 44 (2.1%) |
| Total | 3,412 (100.0%) | 2,075 (100.0%) |
Monthly Housing Cost Tiers in Lockhart
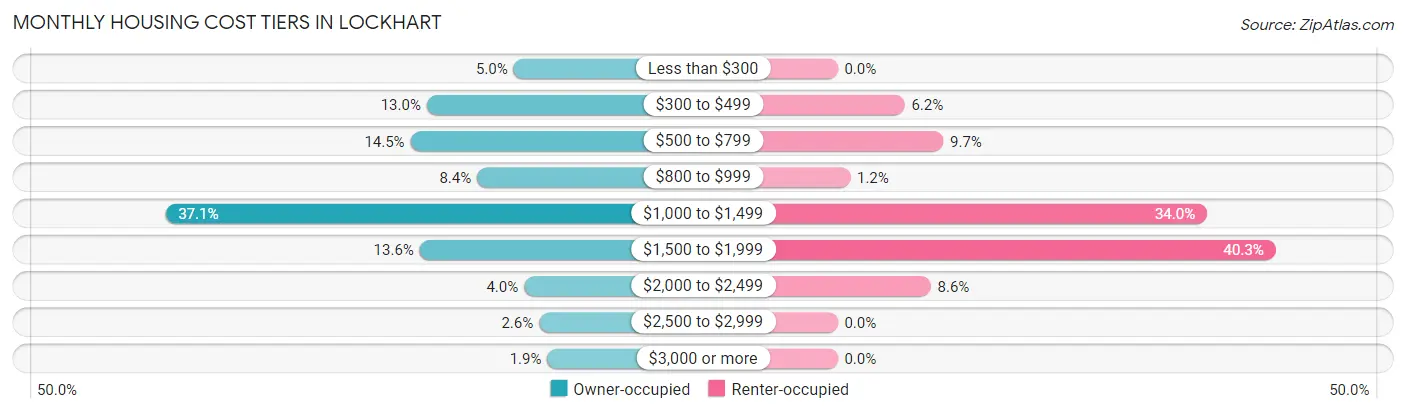
| Monthly Cost | Owner-occupied | Renter-occupied |
| Less than $300 | 170 (5.0%) | 0 (0.0%) |
| $300 to $499 | 443 (13.0%) | 128 (6.2%) |
| $500 to $799 | 494 (14.5%) | 202 (9.7%) |
| $800 to $999 | 285 (8.4%) | 24 (1.2%) |
| $1,000 to $1,499 | 1,264 (37.0%) | 706 (34.0%) |
| $1,500 to $1,999 | 465 (13.6%) | 837 (40.3%) |
| $2,000 to $2,499 | 137 (4.0%) | 178 (8.6%) |
| $2,500 to $2,999 | 90 (2.6%) | 0 (0.0%) |
| $3,000 or more | 64 (1.9%) | 0 (0.0%) |
| Total | 3,412 (100.0%) | 2,075 (100.0%) |
Physical Housing Characteristics in Lockhart
Housing Structures in Lockhart
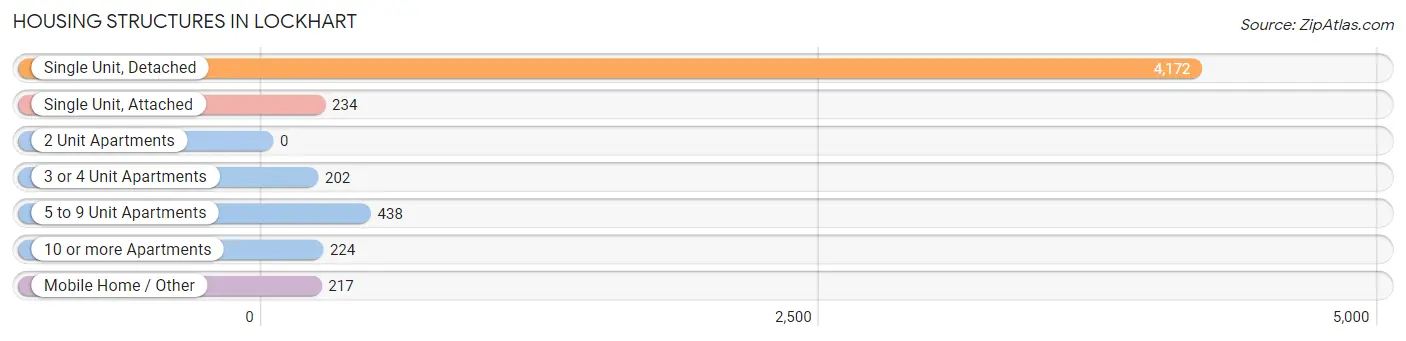
| Structure Type | # Housing Units | % Housing Units |
| Single Unit, Detached | 4,172 | 76.0% |
| Single Unit, Attached | 234 | 4.3% |
| 2 Unit Apartments | 0 | 0.0% |
| 3 or 4 Unit Apartments | 202 | 3.7% |
| 5 to 9 Unit Apartments | 438 | 8.0% |
| 10 or more Apartments | 224 | 4.1% |
| Mobile Home / Other | 217 | 4.0% |
| Total | 5,487 | 100.0% |
Housing Structures by Occupancy in Lockhart
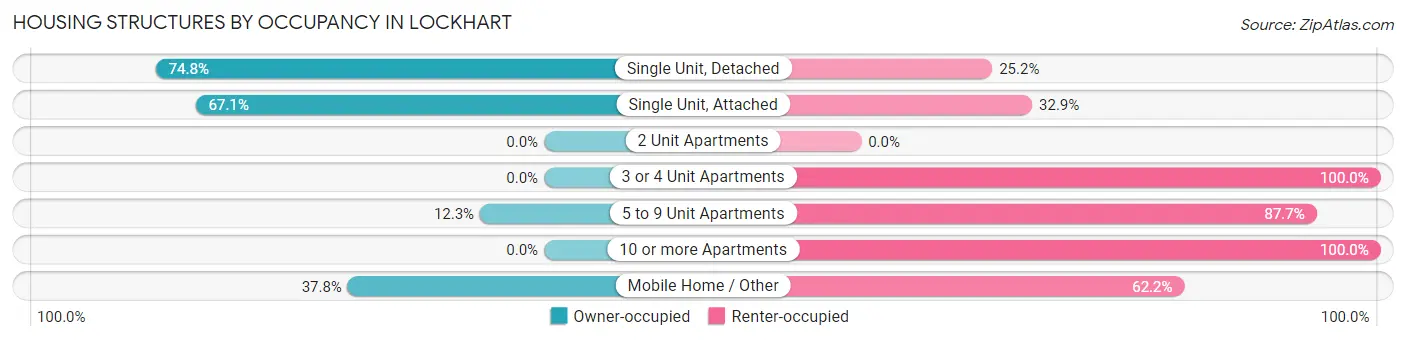
| Structure Type | Owner-occupied | Renter-occupied |
| Single Unit, Detached | 3,119 (74.8%) | 1,053 (25.2%) |
| Single Unit, Attached | 157 (67.1%) | 77 (32.9%) |
| 2 Unit Apartments | 0 (0.0%) | 0 (0.0%) |
| 3 or 4 Unit Apartments | 0 (0.0%) | 202 (100.0%) |
| 5 to 9 Unit Apartments | 54 (12.3%) | 384 (87.7%) |
| 10 or more Apartments | 0 (0.0%) | 224 (100.0%) |
| Mobile Home / Other | 82 (37.8%) | 135 (62.2%) |
| Total | 3,412 (62.2%) | 2,075 (37.8%) |
Housing Structures by Number of Rooms in Lockhart
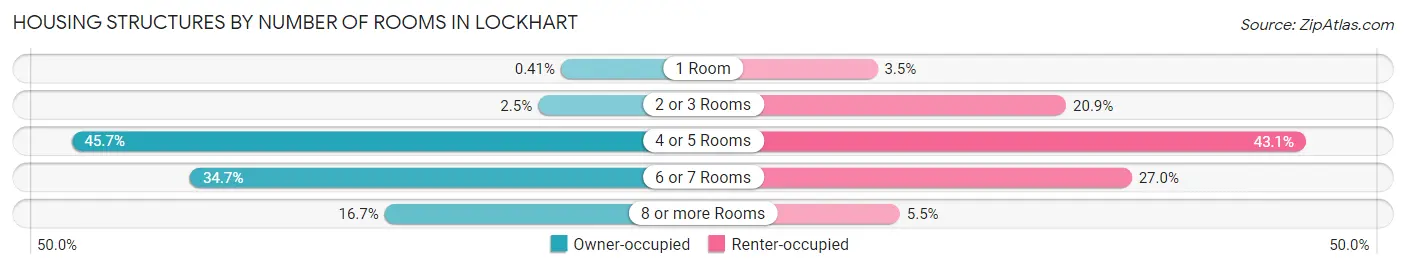
| Number of Rooms | Owner-occupied | Renter-occupied |
| 1 Room | 14 (0.4%) | 72 (3.5%) |
| 2 or 3 Rooms | 86 (2.5%) | 434 (20.9%) |
| 4 or 5 Rooms | 1,558 (45.7%) | 894 (43.1%) |
| 6 or 7 Rooms | 1,184 (34.7%) | 560 (27.0%) |
| 8 or more Rooms | 570 (16.7%) | 115 (5.5%) |
| Total | 3,412 (100.0%) | 2,075 (100.0%) |
Housing Structure by Heating Type in Lockhart
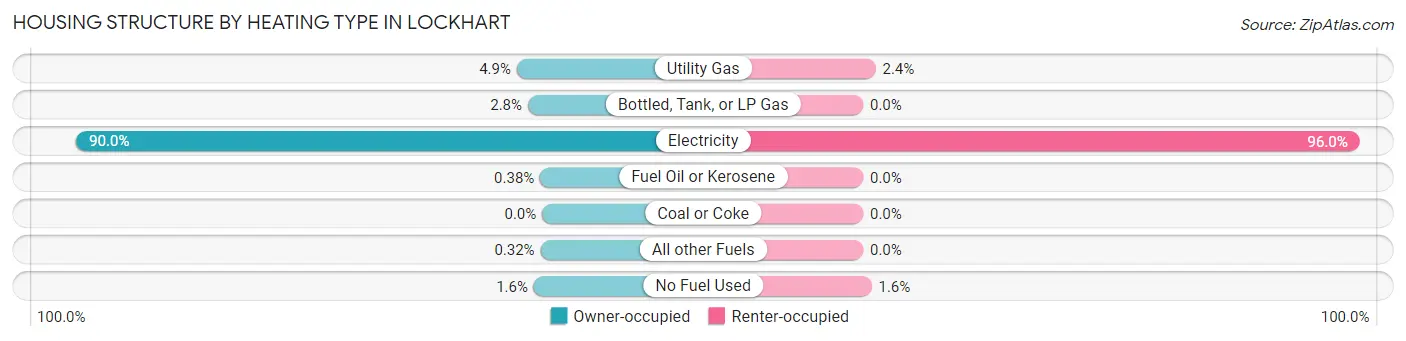
| Heating Type | Owner-occupied | Renter-occupied |
| Utility Gas | 167 (4.9%) | 50 (2.4%) |
| Bottled, Tank, or LP Gas | 94 (2.8%) | 0 (0.0%) |
| Electricity | 3,072 (90.0%) | 1,991 (96.0%) |
| Fuel Oil or Kerosene | 13 (0.4%) | 0 (0.0%) |
| Coal or Coke | 0 (0.0%) | 0 (0.0%) |
| All other Fuels | 11 (0.3%) | 0 (0.0%) |
| No Fuel Used | 55 (1.6%) | 34 (1.6%) |
| Total | 3,412 (100.0%) | 2,075 (100.0%) |
Household Vehicle Usage in Lockhart
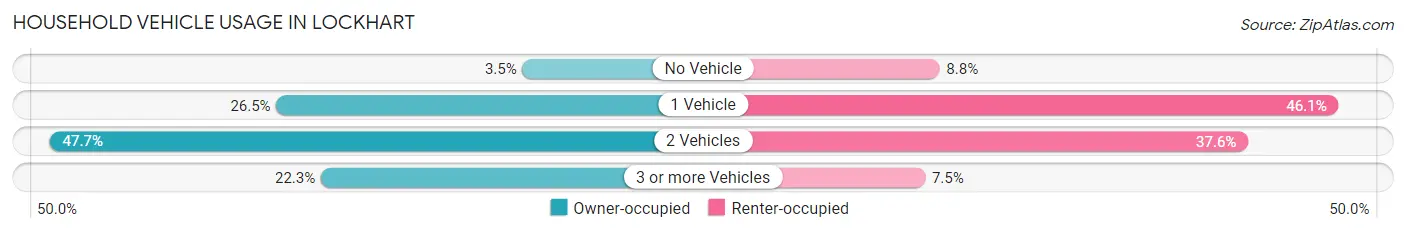
| Vehicles per Household | Owner-occupied | Renter-occupied |
| No Vehicle | 120 (3.5%) | 183 (8.8%) |
| 1 Vehicle | 904 (26.5%) | 956 (46.1%) |
| 2 Vehicles | 1,626 (47.7%) | 781 (37.6%) |
| 3 or more Vehicles | 762 (22.3%) | 155 (7.5%) |
| Total | 3,412 (100.0%) | 2,075 (100.0%) |
Real Estate & Mortgages in Lockhart
Real Estate and Mortgage Overview in Lockhart
| Characteristic | Without Mortgage | With Mortgage |
| Housing Units | 1,001 | 2,411 |
| Median Property Value | $232,200 | $230,200 |
| Median Household Income | $69,592 | $322 |
| Monthly Housing Costs | $438 | $64 |
| Real Estate Taxes | $1,312 | $71 |
Property Value by Mortgage Status in Lockhart
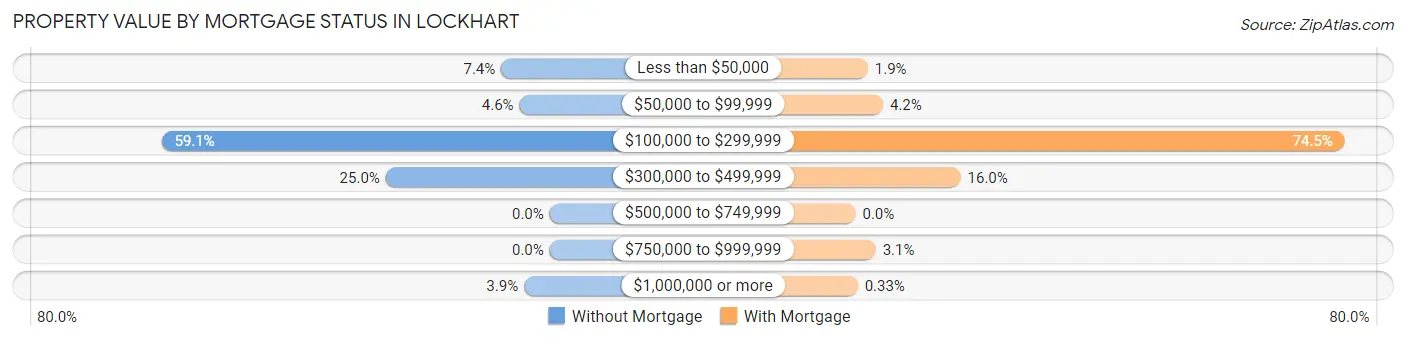
| Property Value | Without Mortgage | With Mortgage |
| Less than $50,000 | 74 (7.4%) | 45 (1.9%) |
| $50,000 to $99,999 | 46 (4.6%) | 101 (4.2%) |
| $100,000 to $299,999 | 592 (59.1%) | 1,797 (74.5%) |
| $300,000 to $499,999 | 250 (25.0%) | 386 (16.0%) |
| $500,000 to $749,999 | 0 (0.0%) | 0 (0.0%) |
| $750,000 to $999,999 | 0 (0.0%) | 74 (3.1%) |
| $1,000,000 or more | 39 (3.9%) | 8 (0.3%) |
| Total | 1,001 (100.0%) | 2,411 (100.0%) |
Household Income by Mortgage Status in Lockhart
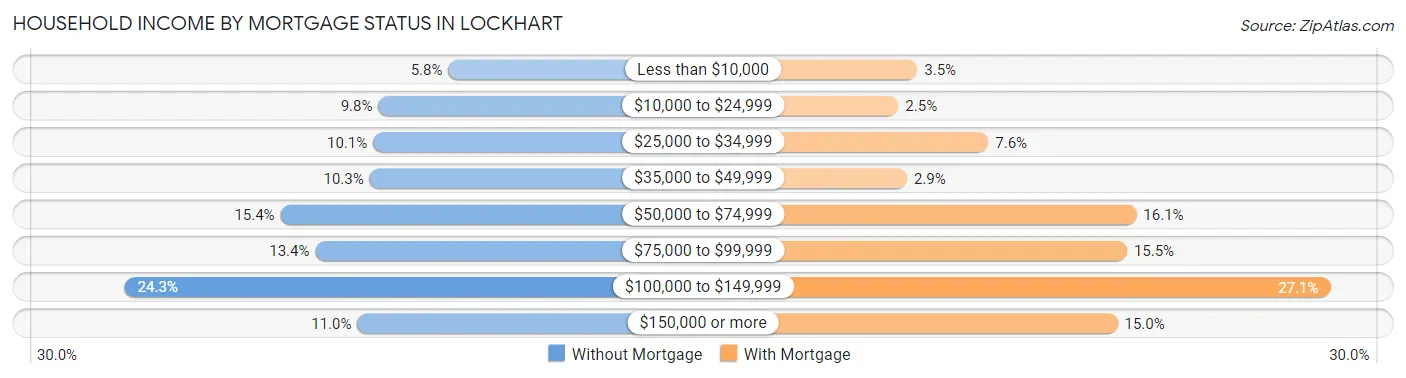
| Household Income | Without Mortgage | With Mortgage |
| Less than $10,000 | 58 (5.8%) | 85 (3.5%) |
| $10,000 to $24,999 | 98 (9.8%) | 59 (2.5%) |
| $25,000 to $34,999 | 101 (10.1%) | 183 (7.6%) |
| $35,000 to $49,999 | 103 (10.3%) | 71 (2.9%) |
| $50,000 to $74,999 | 154 (15.4%) | 387 (16.1%) |
| $75,000 to $99,999 | 134 (13.4%) | 374 (15.5%) |
| $100,000 to $149,999 | 243 (24.3%) | 654 (27.1%) |
| $150,000 or more | 110 (11.0%) | 361 (15.0%) |
| Total | 1,001 (100.0%) | 2,411 (100.0%) |
Property Value to Household Income Ratio in Lockhart
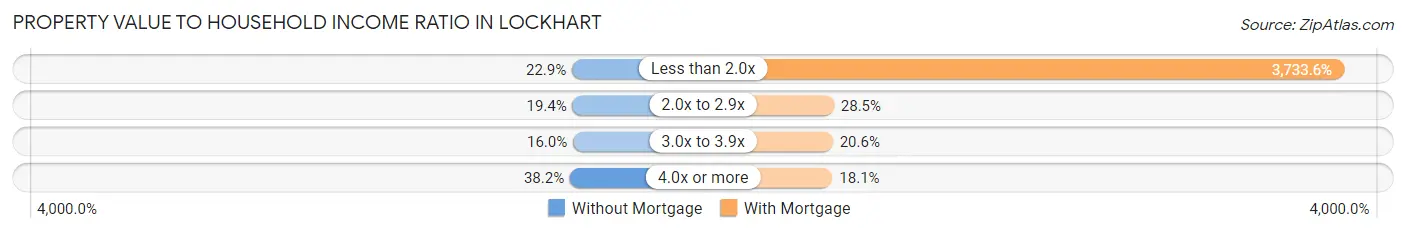
| Value-to-Income Ratio | Without Mortgage | With Mortgage |
| Less than 2.0x | 229 (22.9%) | 90,018 (3,733.6%) |
| 2.0x to 2.9x | 194 (19.4%) | 688 (28.5%) |
| 3.0x to 3.9x | 160 (16.0%) | 496 (20.6%) |
| 4.0x or more | 382 (38.2%) | 436 (18.1%) |
| Total | 1,001 (100.0%) | 2,411 (100.0%) |
Real Estate Taxes by Mortgage Status in Lockhart
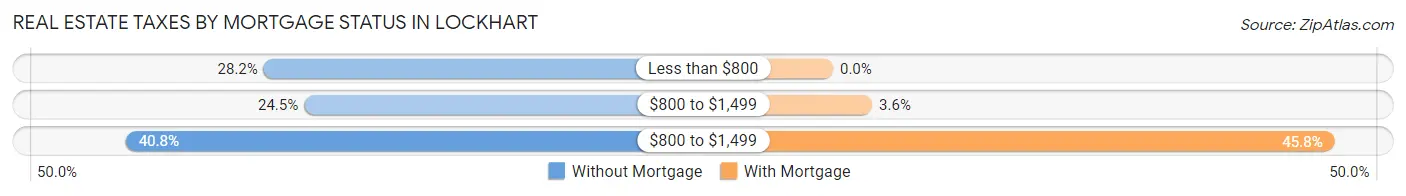
| Property Taxes | Without Mortgage | With Mortgage |
| Less than $800 | 282 (28.2%) | 0 (0.0%) |
| $800 to $1,499 | 245 (24.5%) | 86 (3.6%) |
| $800 to $1,499 | 408 (40.8%) | 1,104 (45.8%) |
| Total | 1,001 (100.0%) | 2,411 (100.0%) |
Health & Disability in Lockhart
Health Insurance Coverage by Age in Lockhart
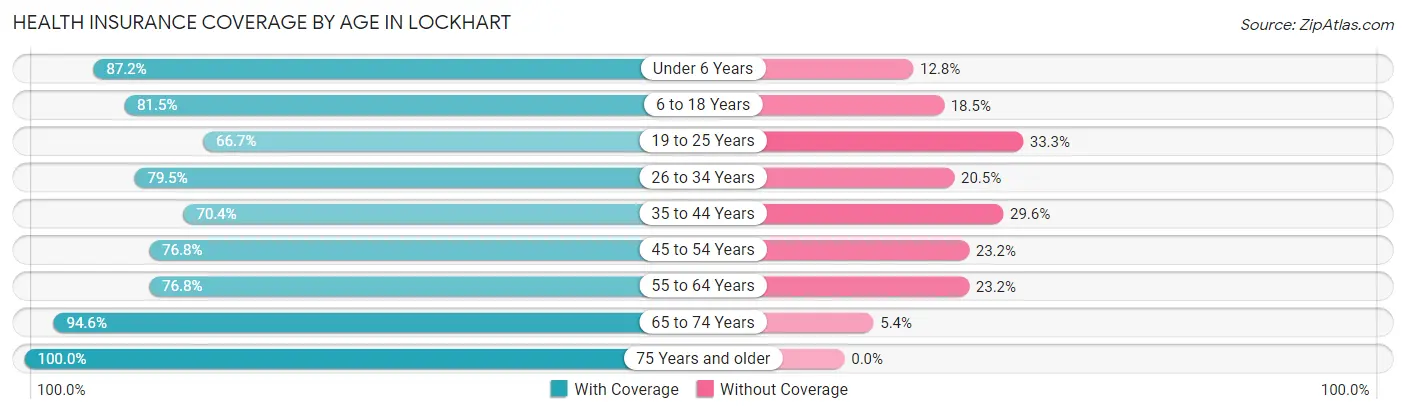
| Age Bracket | With Coverage | Without Coverage |
| Under 6 Years | 965 (87.2%) | 142 (12.8%) |
| 6 to 18 Years | 1,692 (81.5%) | 385 (18.5%) |
| 19 to 25 Years | 842 (66.7%) | 420 (33.3%) |
| 26 to 34 Years | 2,173 (79.5%) | 559 (20.5%) |
| 35 to 44 Years | 1,514 (70.4%) | 637 (29.6%) |
| 45 to 54 Years | 1,676 (76.8%) | 507 (23.2%) |
| 55 to 64 Years | 1,365 (76.8%) | 413 (23.2%) |
| 65 to 74 Years | 1,224 (94.6%) | 70 (5.4%) |
| 75 Years and older | 420 (100.0%) | 0 (0.0%) |
| Total | 11,871 (79.1%) | 3,133 (20.9%) |
Health Insurance Coverage by Citizenship Status in Lockhart
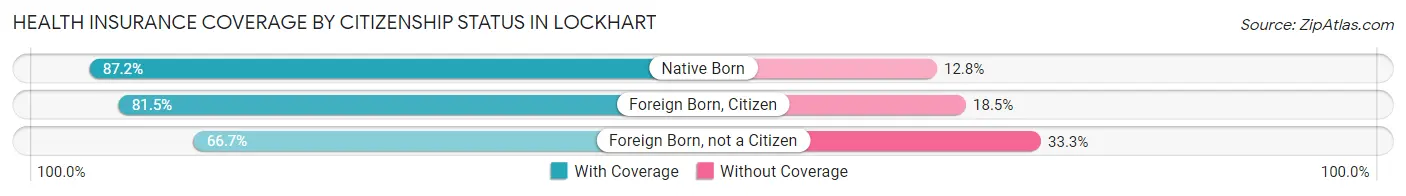
| Citizenship Status | With Coverage | Without Coverage |
| Native Born | 965 (87.2%) | 142 (12.8%) |
| Foreign Born, Citizen | 1,692 (81.5%) | 385 (18.5%) |
| Foreign Born, not a Citizen | 842 (66.7%) | 420 (33.3%) |
Health Insurance Coverage by Household Income in Lockhart
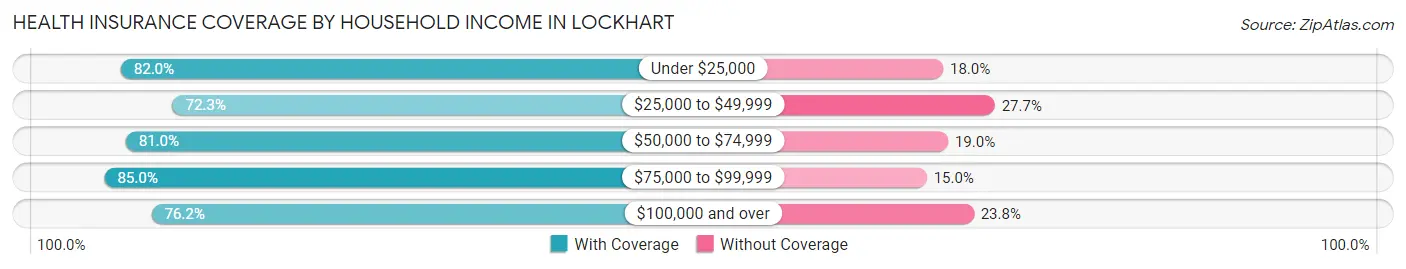
| Household Income | With Coverage | Without Coverage |
| Under $25,000 | 1,249 (82.0%) | 275 (18.0%) |
| $25,000 to $49,999 | 1,976 (72.3%) | 758 (27.7%) |
| $50,000 to $74,999 | 1,825 (81.0%) | 427 (19.0%) |
| $75,000 to $99,999 | 3,307 (85.0%) | 582 (15.0%) |
| $100,000 and over | 3,490 (76.2%) | 1,089 (23.8%) |
Public vs Private Health Insurance Coverage by Age in Lockhart
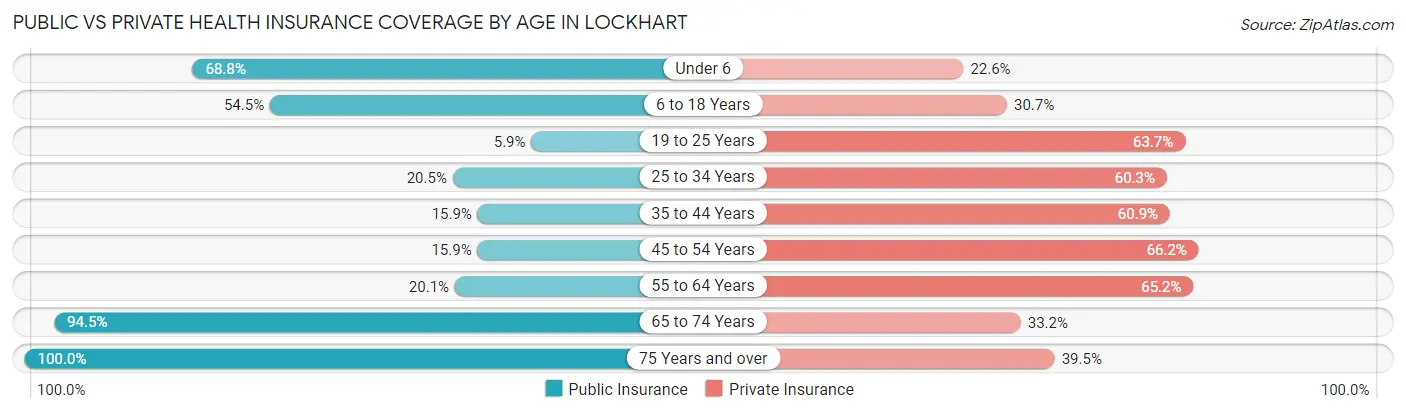
| Age Bracket | Public Insurance | Private Insurance |
| Under 6 | 762 (68.8%) | 250 (22.6%) |
| 6 to 18 Years | 1,131 (54.4%) | 637 (30.7%) |
| 19 to 25 Years | 75 (5.9%) | 804 (63.7%) |
| 25 to 34 Years | 561 (20.5%) | 1,648 (60.3%) |
| 35 to 44 Years | 342 (15.9%) | 1,310 (60.9%) |
| 45 to 54 Years | 348 (15.9%) | 1,446 (66.2%) |
| 55 to 64 Years | 358 (20.1%) | 1,160 (65.2%) |
| 65 to 74 Years | 1,223 (94.5%) | 430 (33.2%) |
| 75 Years and over | 420 (100.0%) | 166 (39.5%) |
| Total | 5,220 (34.8%) | 7,851 (52.3%) |
Disability Status by Sex by Age in Lockhart
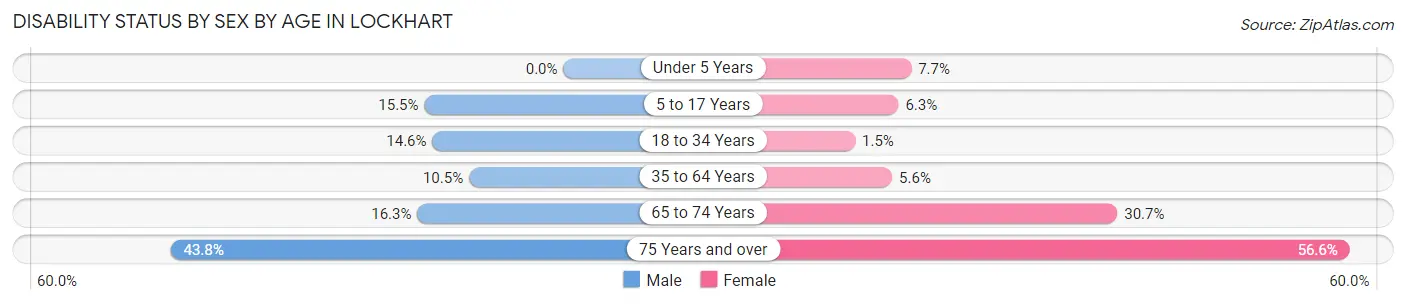
| Age Bracket | Male | Female |
| Under 5 Years | 0 (0.0%) | 31 (7.7%) |
| 5 to 17 Years | 194 (15.5%) | 64 (6.3%) |
| 18 to 34 Years | 253 (14.6%) | 35 (1.5%) |
| 35 to 64 Years | 363 (10.5%) | 149 (5.6%) |
| 65 to 74 Years | 88 (16.3%) | 231 (30.7%) |
| 75 Years and over | 77 (43.8%) | 138 (56.6%) |
Disability Class by Sex by Age in Lockhart
Disability Class: Hearing Difficulty
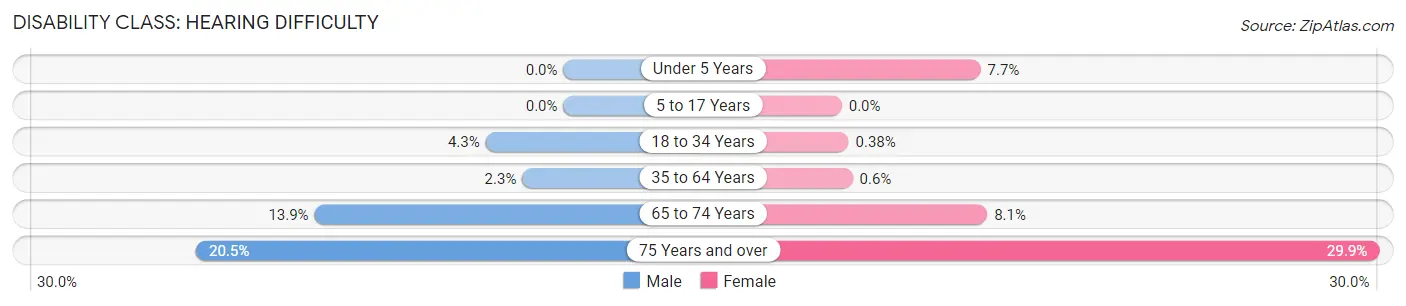
| Age Bracket | Male | Female |
| Under 5 Years | 0 (0.0%) | 31 (7.7%) |
| 5 to 17 Years | 0 (0.0%) | 0 (0.0%) |
| 18 to 34 Years | 75 (4.3%) | 9 (0.4%) |
| 35 to 64 Years | 79 (2.3%) | 16 (0.6%) |
| 65 to 74 Years | 75 (13.9%) | 61 (8.1%) |
| 75 Years and over | 36 (20.4%) | 73 (29.9%) |
Disability Class: Vision Difficulty
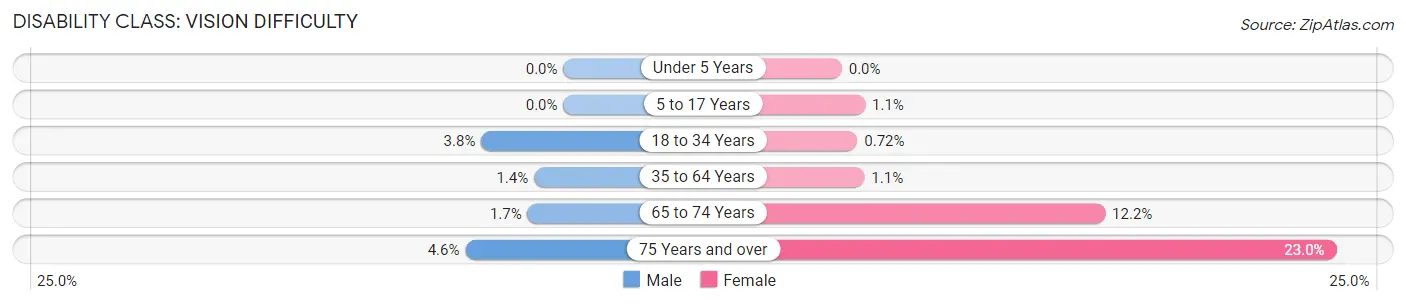
| Age Bracket | Male | Female |
| Under 5 Years | 0 (0.0%) | 0 (0.0%) |
| 5 to 17 Years | 0 (0.0%) | 11 (1.1%) |
| 18 to 34 Years | 66 (3.8%) | 17 (0.7%) |
| 35 to 64 Years | 47 (1.4%) | 28 (1.1%) |
| 65 to 74 Years | 9 (1.7%) | 92 (12.2%) |
| 75 Years and over | 8 (4.5%) | 56 (23.0%) |
Disability Class: Cognitive Difficulty
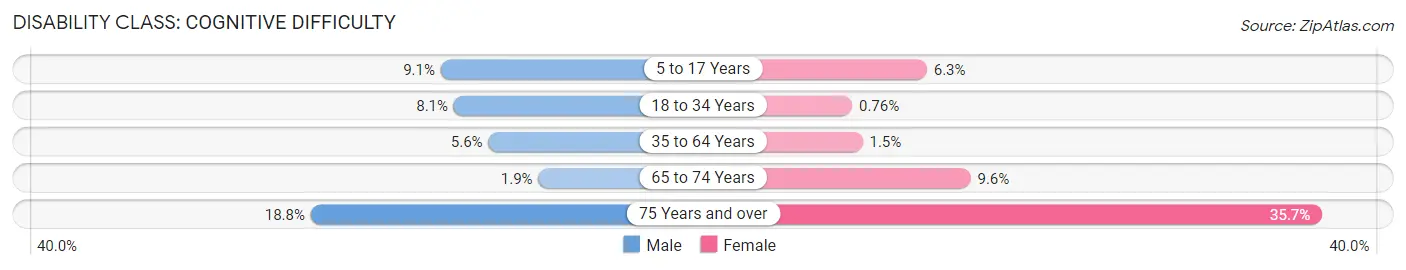
| Age Bracket | Male | Female |
| 5 to 17 Years | 114 (9.1%) | 64 (6.3%) |
| 18 to 34 Years | 141 (8.1%) | 18 (0.8%) |
| 35 to 64 Years | 192 (5.6%) | 41 (1.5%) |
| 65 to 74 Years | 10 (1.8%) | 72 (9.6%) |
| 75 Years and over | 33 (18.8%) | 87 (35.7%) |
Disability Class: Ambulatory Difficulty
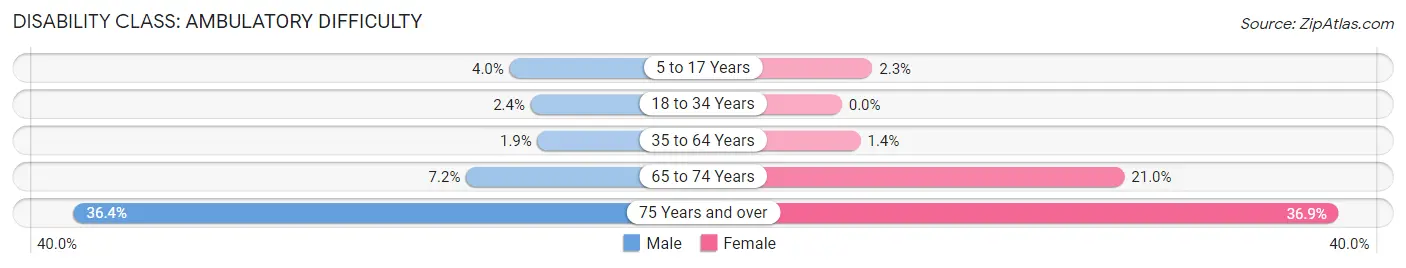
| Age Bracket | Male | Female |
| 5 to 17 Years | 50 (4.0%) | 23 (2.3%) |
| 18 to 34 Years | 42 (2.4%) | 0 (0.0%) |
| 35 to 64 Years | 66 (1.9%) | 37 (1.4%) |
| 65 to 74 Years | 39 (7.2%) | 158 (21.0%) |
| 75 Years and over | 64 (36.4%) | 90 (36.9%) |
Disability Class: Self-Care Difficulty
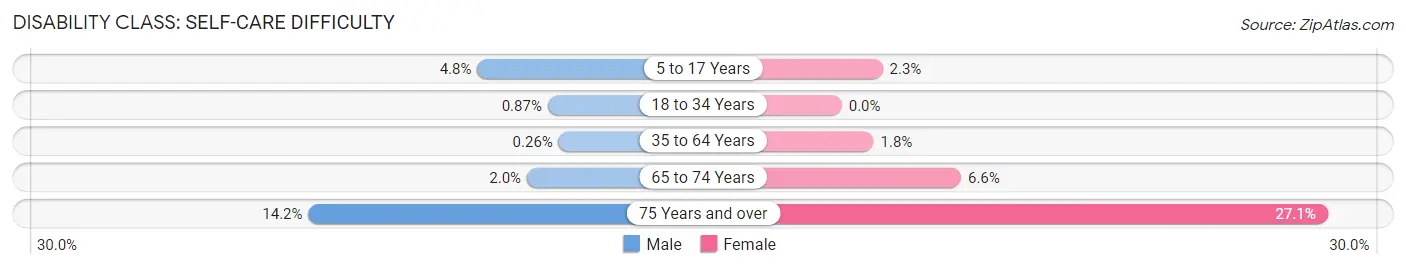
| Age Bracket | Male | Female |
| 5 to 17 Years | 60 (4.8%) | 23 (2.3%) |
| 18 to 34 Years | 15 (0.9%) | 0 (0.0%) |
| 35 to 64 Years | 9 (0.3%) | 47 (1.8%) |
| 65 to 74 Years | 11 (2.0%) | 50 (6.6%) |
| 75 Years and over | 25 (14.2%) | 66 (27.1%) |
Technology Access in Lockhart
Computing Device Access in Lockhart
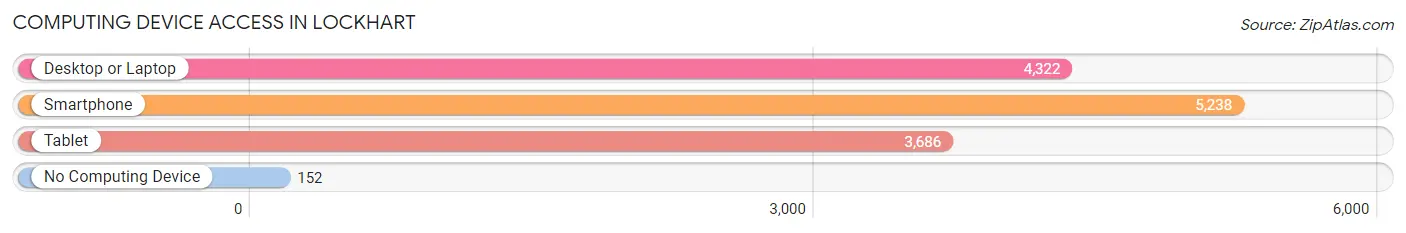
| Device Type | # Households | % Households |
| Desktop or Laptop | 4,322 | 78.8% |
| Smartphone | 5,238 | 95.5% |
| Tablet | 3,686 | 67.2% |
| No Computing Device | 152 | 2.8% |
| Total | 5,487 | 100.0% |
Internet Access in Lockhart
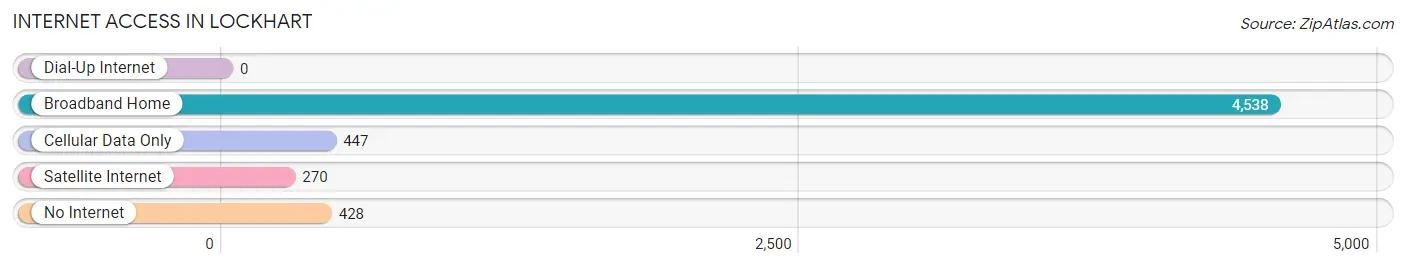
| Internet Type | # Households | % Households |
| Dial-Up Internet | 0 | 0.0% |
| Broadband Home | 4,538 | 82.7% |
| Cellular Data Only | 447 | 8.2% |
| Satellite Internet | 270 | 4.9% |
| No Internet | 428 | 7.8% |
| Total | 5,487 | 100.0% |
Lockhart Summary
Lockhart is a small town located in Orange County, Florida. It is situated in the central part of the state, approximately 20 miles north of Orlando. The town has a population of just over 1,000 people, and is part of the Orlando-Kissimmee-Sanford Metropolitan Statistical Area.
History
The area that is now Lockhart was first settled in the late 1800s by a group of settlers from Georgia. The town was originally known as “Lockhart’s Station”, named after the first postmaster, William Lockhart. The town was officially incorporated in 1887, and the first post office was established in 1888.
In the early 1900s, Lockhart was a thriving agricultural community, with citrus groves, vegetable farms, and cattle ranches. The town was also home to several sawmills and turpentine stills. In the 1920s, the town began to experience a decline in population as many of the residents moved away to larger cities.
Geography
Lockhart is located in the central part of Orange County, Florida. It is situated approximately 20 miles north of Orlando and is part of the Orlando-Kissimmee-Sanford Metropolitan Statistical Area. The town is bordered by the cities of Winter Garden to the north, Ocoee to the east, and Apopka to the south.
The town is situated on a flat, sandy plain, with an elevation of just over 100 feet. The area is mostly rural, with a few small lakes and ponds scattered throughout. The town is located in the humid subtropical climate zone, with hot, humid summers and mild winters.
Economy
The economy of Lockhart is largely based on agriculture and tourism. The town is home to several citrus groves, vegetable farms, and cattle ranches. The town is also home to several small businesses, including restaurants, retail stores, and service providers.
The town is also home to several tourist attractions, including the Orange County Regional History Center, the Central Florida Zoo, and the Orange County Convention Center. The town is also home to several golf courses, including the Orange County National Golf Center and the Orange County Golf Club.
Demographics
As of the 2010 census, the population of Lockhart was 1,037. The racial makeup of the town was 79.3% White, 15.2% African American, 0.3% Native American, 0.7% Asian, 0.1% Pacific Islander, and 4.4% from other races. Hispanic or Latino of any race were 8.2% of the population.
The median household income in Lockhart was $41,250, and the median family income was $45,000. The per capita income for the town was $19,845. About 11.2% of families and 13.2% of the population were below the poverty line, including 17.2% of those under age 18 and 8.3% of those age 65 or over.
Lockhart is a small town with a rich history and a diverse population. The town is home to several agricultural businesses, as well as several tourist attractions. The town has a median household income of $41,250, and the per capita income is $19,845. Lockhart is a great place to live and work, and is a great place to visit.
Common Questions
What is Per Capita Income in Lockhart?
Per Capita income in Lockhart is $30,306.
What is the Median Family Income in Lockhart?
Median Family Income in Lockhart is $82,004.
What is the Median Household income in Lockhart?
Median Household Income in Lockhart is $68,658.
What is Income or Wage Gap in Lockhart?
Income or Wage Gap in Lockhart is 16.9%.
Women in Lockhart earn 83.1 cents for every dollar earned by a man.
What is Family Income Deficit in Lockhart?
Family Income Deficit in Lockhart is $12,026.
Families that are below poverty line in Lockhart earn $12,026 less on average than the poverty threshold level.
What is Inequality or Gini Index in Lockhart?
Inequality or Gini Index in Lockhart is 0.39.
What is the Total Population of Lockhart?
Total Population of Lockhart is 15,017.
What is the Total Male Population of Lockhart?
Total Male Population of Lockhart is 7,576.
What is the Total Female Population of Lockhart?
Total Female Population of Lockhart is 7,441.
What is the Ratio of Males per 100 Females in Lockhart?
There are 101.81 Males per 100 Females in Lockhart.
What is the Ratio of Females per 100 Males in Lockhart?
There are 98.22 Females per 100 Males in Lockhart.
What is the Median Population Age in Lockhart?
Median Population Age in Lockhart is 36.8 Years.
What is the Average Family Size in Lockhart
Average Family Size in Lockhart is 3.4 People.
What is the Average Household Size in Lockhart
Average Household Size in Lockhart is 2.7 People.
How Large is the Labor Force in Lockhart?
There are 9,060 People in the Labor Forcein in Lockhart.
What is the Percentage of People in the Labor Force in Lockhart?
74.6% of People are in the Labor Force in Lockhart.
What is the Unemployment Rate in Lockhart?
Unemployment Rate in Lockhart is 6.0%.