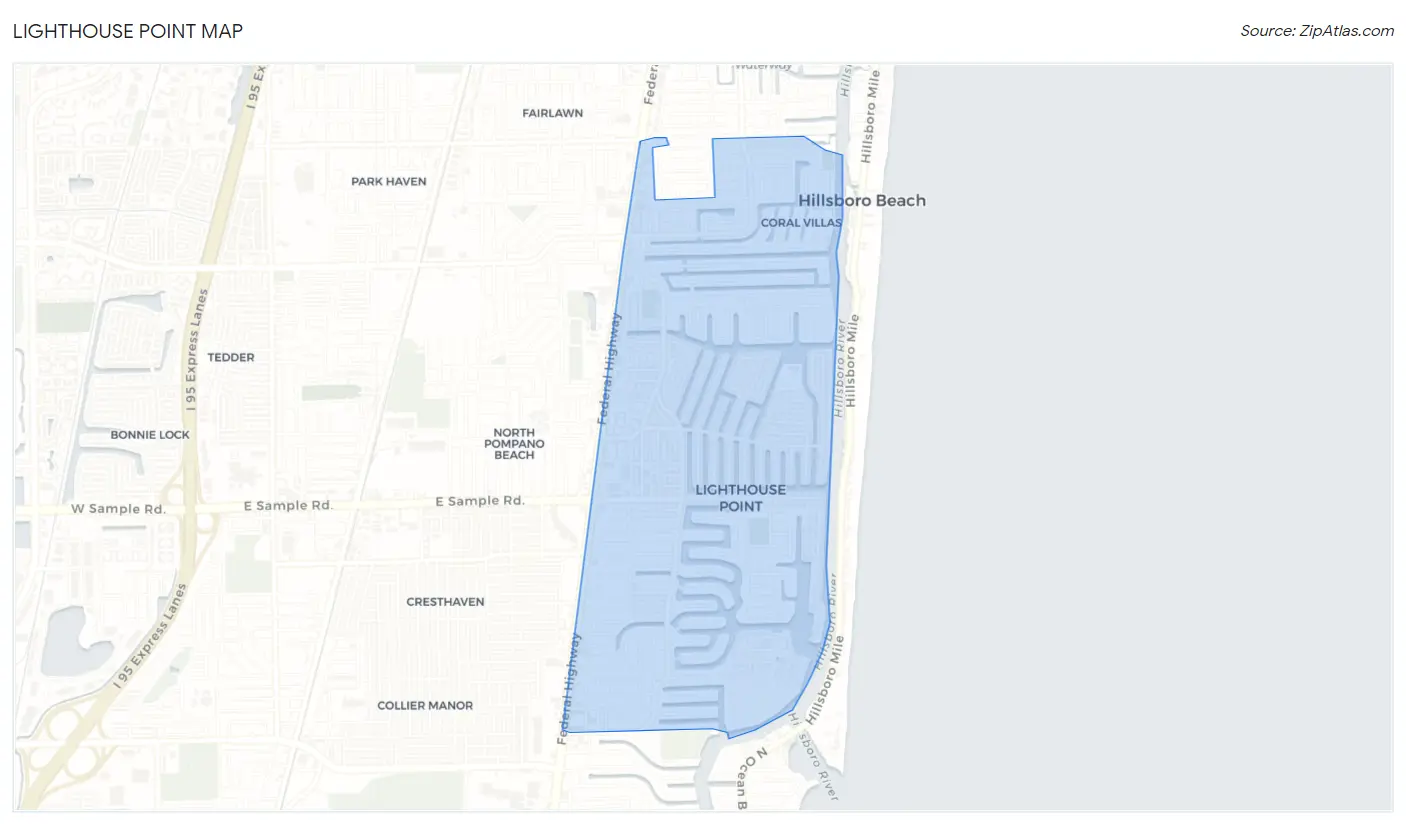
Lighthouse Point, FL Map & Demographics
Lighthouse Point Map
Lighthouse Point Overview
$78,250
PER CAPITA INCOME
$126,616
AVG FAMILY INCOME
$86,586
AVG HOUSEHOLD INCOME
50.8%
WAGE / INCOME GAP [ % ]
49.2¢/ $1
WAGE / INCOME GAP [ $ ]
0.55
INEQUALITY / GINI INDEX
10,496
TOTAL POPULATION
5,288
MALE POPULATION
5,208
FEMALE POPULATION
101.54
MALES / 100 FEMALES
98.49
FEMALES / 100 MALES
55.2
MEDIAN AGE
2.6
AVG FAMILY SIZE
2.0
AVG HOUSEHOLD SIZE
5,434
LABOR FORCE [ PEOPLE ]
59.3%
PERCENT IN LABOR FORCE
2.2%
UNEMPLOYMENT RATE
Income in Lighthouse Point
Income Overview in Lighthouse Point
Per Capita Income in Lighthouse Point is $78,250, while median incomes of families and households are $126,616 and $86,586 respectively.
| Characteristic | Number | Measure |
| Per Capita Income | 10,496 | $78,250 |
| Median Family Income | 2,863 | $126,616 |
| Mean Family Income | 2,863 | $197,268 |
| Median Household Income | 5,315 | $86,586 |
| Mean Household Income | 5,315 | $153,683 |
| Income Deficit | 2,863 | $0 |
| Wage / Income Gap (%) | 10,496 | 50.85% |
| Wage / Income Gap ($) | 10,496 | 49.15¢ per $1 |
| Gini / Inequality Index | 10,496 | 0.55 |
Earnings by Sex in Lighthouse Point
Average Earnings in Lighthouse Point are $49,587, $67,699 for men and $33,277 for women, a difference of 50.8%.
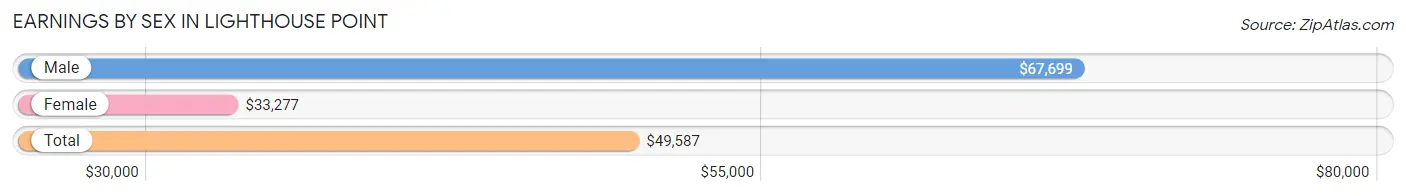
| Sex | Number | Average Earnings |
| Male | 3,244 (55.6%) | $67,699 |
| Female | 2,588 (44.4%) | $33,277 |
| Total | 5,832 (100.0%) | $49,587 |
Earnings by Sex by Income Bracket in Lighthouse Point
The most common earnings brackets in Lighthouse Point are $100,000+ for men (1,304 | 40.2%) and $100,000+ for women (376 | 14.5%).
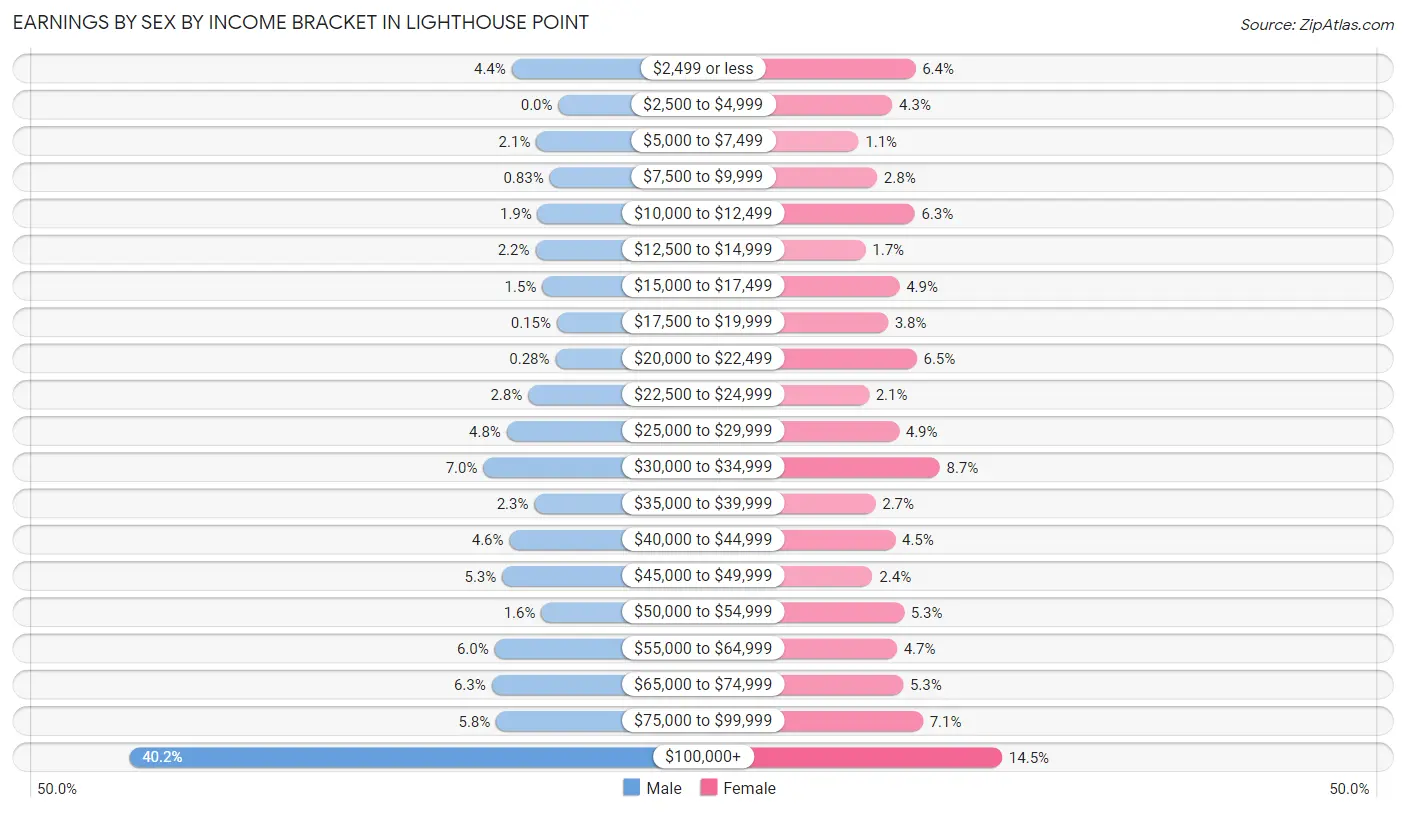
| Income | Male | Female |
| $2,499 or less | 142 (4.4%) | 166 (6.4%) |
| $2,500 to $4,999 | 0 (0.0%) | 110 (4.3%) |
| $5,000 to $7,499 | 67 (2.1%) | 28 (1.1%) |
| $7,500 to $9,999 | 27 (0.8%) | 73 (2.8%) |
| $10,000 to $12,499 | 63 (1.9%) | 164 (6.3%) |
| $12,500 to $14,999 | 70 (2.2%) | 45 (1.7%) |
| $15,000 to $17,499 | 49 (1.5%) | 127 (4.9%) |
| $17,500 to $19,999 | 5 (0.2%) | 99 (3.8%) |
| $20,000 to $22,499 | 9 (0.3%) | 169 (6.5%) |
| $22,500 to $24,999 | 92 (2.8%) | 53 (2.1%) |
| $25,000 to $29,999 | 157 (4.8%) | 126 (4.9%) |
| $30,000 to $34,999 | 228 (7.0%) | 225 (8.7%) |
| $35,000 to $39,999 | 73 (2.2%) | 69 (2.7%) |
| $40,000 to $44,999 | 149 (4.6%) | 117 (4.5%) |
| $45,000 to $49,999 | 171 (5.3%) | 62 (2.4%) |
| $50,000 to $54,999 | 52 (1.6%) | 138 (5.3%) |
| $55,000 to $64,999 | 194 (6.0%) | 121 (4.7%) |
| $65,000 to $74,999 | 203 (6.3%) | 136 (5.3%) |
| $75,000 to $99,999 | 189 (5.8%) | 184 (7.1%) |
| $100,000+ | 1,304 (40.2%) | 376 (14.5%) |
| Total | 3,244 (100.0%) | 2,588 (100.0%) |
Earnings by Sex by Educational Attainment in Lighthouse Point
Average earnings in Lighthouse Point are $69,137 for men and $40,641 for women, a difference of 41.2%. Men with an educational attainment of graduate degree enjoy the highest average annual earnings of $117,639, while those with high school diploma education earn the least with $43,493. Women with an educational attainment of graduate degree earn the most with the average annual earnings of $65,900, while those with high school diploma education have the smallest earnings of $22,798.
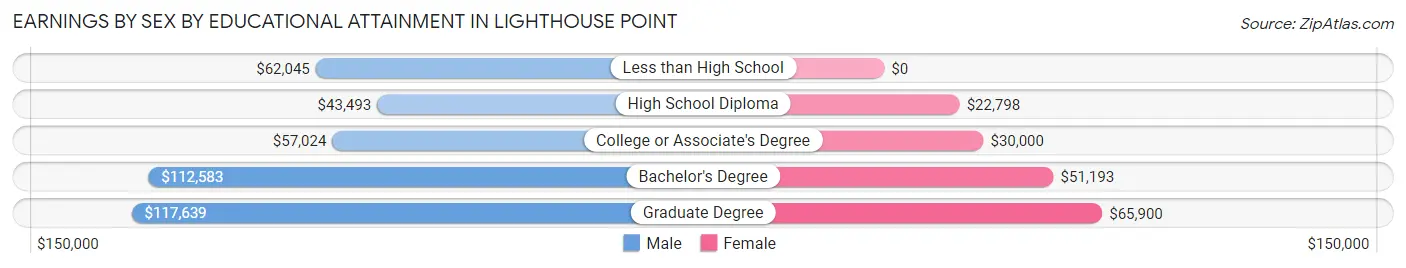
| Educational Attainment | Male Income | Female Income |
| Less than High School | $62,045 | $0 |
| High School Diploma | $43,493 | $22,798 |
| College or Associate's Degree | $57,024 | $30,000 |
| Bachelor's Degree | $112,583 | $51,193 |
| Graduate Degree | $117,639 | $65,900 |
| Total | $69,137 | $40,641 |
Family Income in Lighthouse Point
Family Income Brackets in Lighthouse Point
According to the Lighthouse Point family income data, there are 925 families falling into the $200,000+ income range, which is the most common income bracket and makes up 32.3% of all families. Conversely, the less than $10,000 income bracket is the least frequent group with only 23 families (0.8%) belonging to this category.
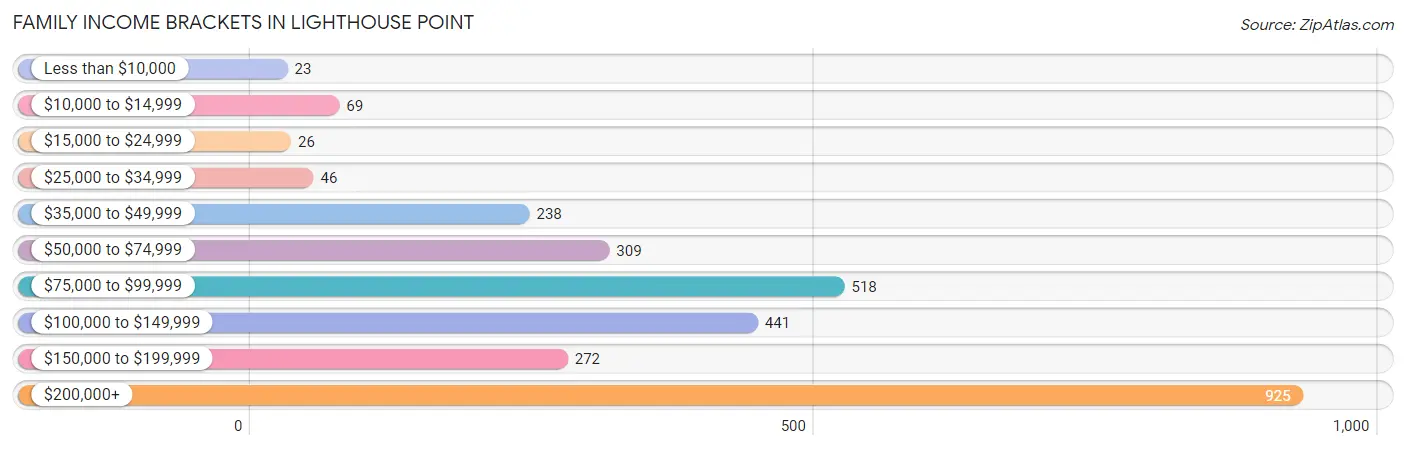
| Income Bracket | # Families | % Families |
| Less than $10,000 | 23 | 0.8% |
| $10,000 to $14,999 | 69 | 2.4% |
| $15,000 to $24,999 | 26 | 0.9% |
| $25,000 to $34,999 | 46 | 1.6% |
| $35,000 to $49,999 | 238 | 8.3% |
| $50,000 to $74,999 | 309 | 10.8% |
| $75,000 to $99,999 | 518 | 18.1% |
| $100,000 to $149,999 | 441 | 15.4% |
| $150,000 to $199,999 | 272 | 9.5% |
| $200,000+ | 925 | 32.3% |
Family Income by Famaliy Size in Lighthouse Point
4-person families (279 | 9.8%) account for the highest median family income in Lighthouse Point with $206,125 per family, while 2-person families (1,920 | 67.1%) have the highest median income of $53,047 per family member.
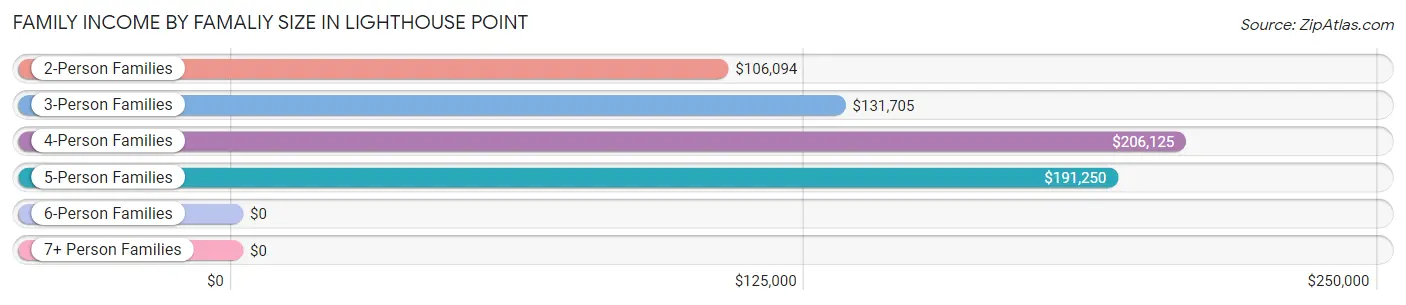
| Income Bracket | # Families | Median Income |
| 2-Person Families | 1,920 (67.1%) | $106,094 |
| 3-Person Families | 518 (18.1%) | $131,705 |
| 4-Person Families | 279 (9.8%) | $206,125 |
| 5-Person Families | 119 (4.2%) | $191,250 |
| 6-Person Families | 27 (0.9%) | $0 |
| 7+ Person Families | 0 (0.0%) | $0 |
| Total | 2,863 (100.0%) | $126,616 |
Family Income by Number of Earners in Lighthouse Point
The median family income in Lighthouse Point is $126,616, with families comprising 3+ earners (124) having the highest median family income of $189,392, while families with 1 earner (936) have the lowest median family income of $98,500, accounting for 4.3% and 32.7% of families, respectively.
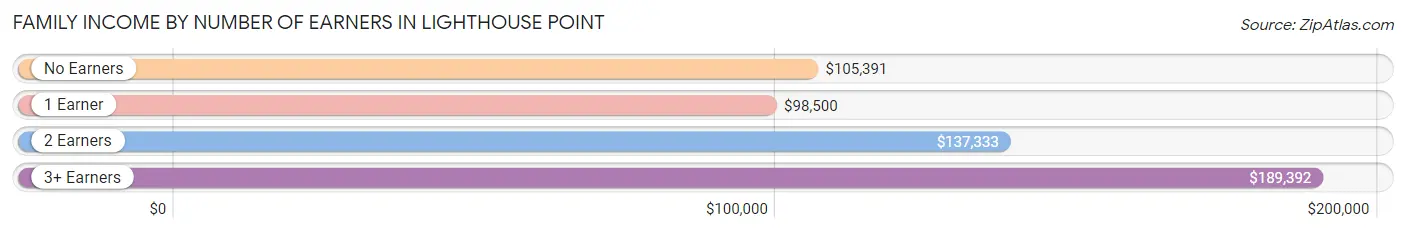
| Number of Earners | # Families | Median Income |
| No Earners | 439 (15.3%) | $105,391 |
| 1 Earner | 936 (32.7%) | $98,500 |
| 2 Earners | 1,364 (47.6%) | $137,333 |
| 3+ Earners | 124 (4.3%) | $189,392 |
| Total | 2,863 (100.0%) | $126,616 |
Household Income in Lighthouse Point
Household Income Brackets in Lighthouse Point
With 1,185 households falling in the category, the $200,000+ income range is the most frequent in Lighthouse Point, accounting for 22.3% of all households. In contrast, only 133 households (2.5%) fall into the $10,000 to $14,999 income bracket, making it the least populous group.
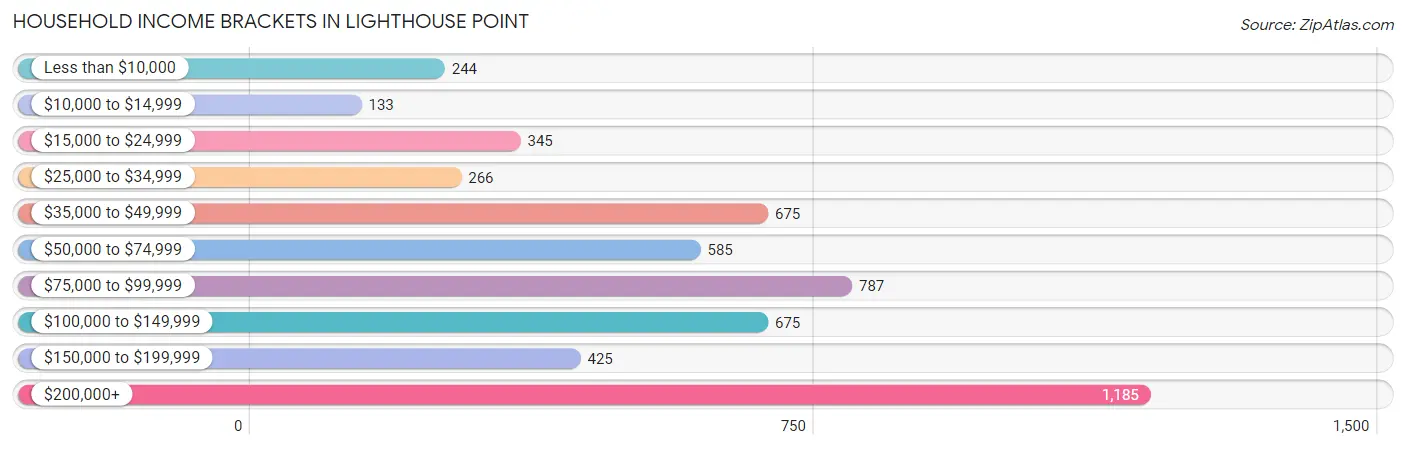
| Income Bracket | # Households | % Households |
| Less than $10,000 | 244 | 4.6% |
| $10,000 to $14,999 | 133 | 2.5% |
| $15,000 to $24,999 | 345 | 6.5% |
| $25,000 to $34,999 | 266 | 5.0% |
| $35,000 to $49,999 | 675 | 12.7% |
| $50,000 to $74,999 | 585 | 11.0% |
| $75,000 to $99,999 | 787 | 14.8% |
| $100,000 to $149,999 | 675 | 12.7% |
| $150,000 to $199,999 | 425 | 8.0% |
| $200,000+ | 1,185 | 22.3% |
Household Income by Householder Age in Lighthouse Point
The median household income in Lighthouse Point is $86,586, with the highest median household income of $115,781 found in the 45 to 64 years age bracket for the primary householder. A total of 2,241 households (42.2%) fall into this category. Meanwhile, the 15 to 24 years age bracket for the primary householder has the lowest median household income of $0, with 68 households (1.3%) in this group.
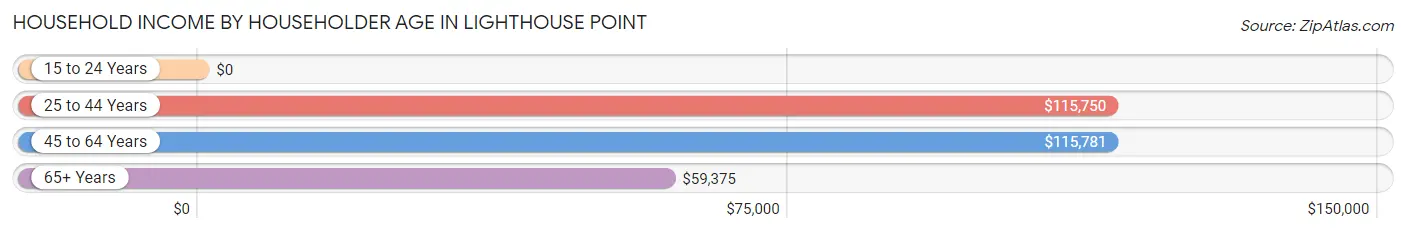
| Income Bracket | # Households | Median Income |
| 15 to 24 Years | 68 (1.3%) | $0 |
| 25 to 44 Years | 789 (14.8%) | $115,750 |
| 45 to 64 Years | 2,241 (42.2%) | $115,781 |
| 65+ Years | 2,217 (41.7%) | $59,375 |
| Total | 5,315 (100.0%) | $86,586 |
Poverty in Lighthouse Point
Income Below Poverty by Sex and Age in Lighthouse Point
With 5.5% poverty level for males and 7.8% for females among the residents of Lighthouse Point, 25 to 34 year old males and 65 to 74 year old females are the most vulnerable to poverty, with 77 males (20.9%) and 193 females (23.9%) in their respective age groups living below the poverty level.
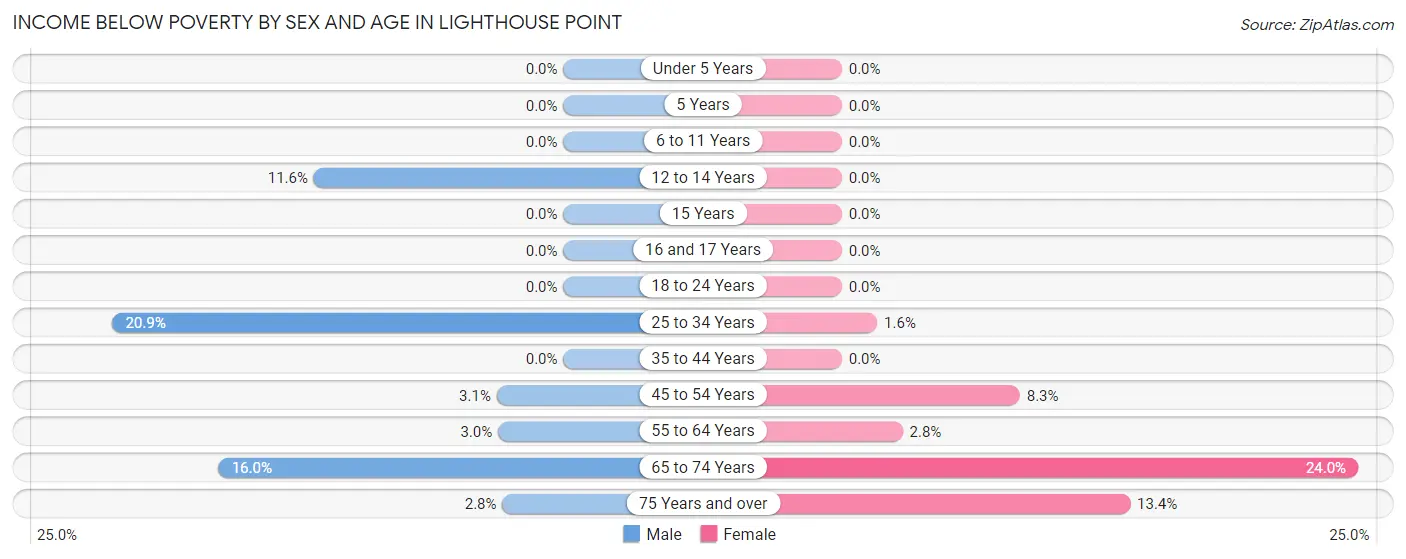
| Age Bracket | Male | Female |
| Under 5 Years | 0 (0.0%) | 0 (0.0%) |
| 5 Years | 0 (0.0%) | 0 (0.0%) |
| 6 to 11 Years | 0 (0.0%) | 0 (0.0%) |
| 12 to 14 Years | 22 (11.6%) | 0 (0.0%) |
| 15 Years | 0 (0.0%) | 0 (0.0%) |
| 16 and 17 Years | 0 (0.0%) | 0 (0.0%) |
| 18 to 24 Years | 0 (0.0%) | 0 (0.0%) |
| 25 to 34 Years | 77 (20.9%) | 5 (1.6%) |
| 35 to 44 Years | 0 (0.0%) | 0 (0.0%) |
| 45 to 54 Years | 22 (3.1%) | 81 (8.3%) |
| 55 to 64 Years | 42 (3.0%) | 25 (2.8%) |
| 65 to 74 Years | 102 (16.0%) | 193 (23.9%) |
| 75 Years and over | 23 (2.8%) | 103 (13.4%) |
| Total | 288 (5.5%) | 407 (7.8%) |
Income Above Poverty by Sex and Age in Lighthouse Point
According to the poverty statistics in Lighthouse Point, males aged under 5 years and females aged under 5 years are the age groups that are most secure financially, with 100.0% of males and 100.0% of females in these age groups living above the poverty line.
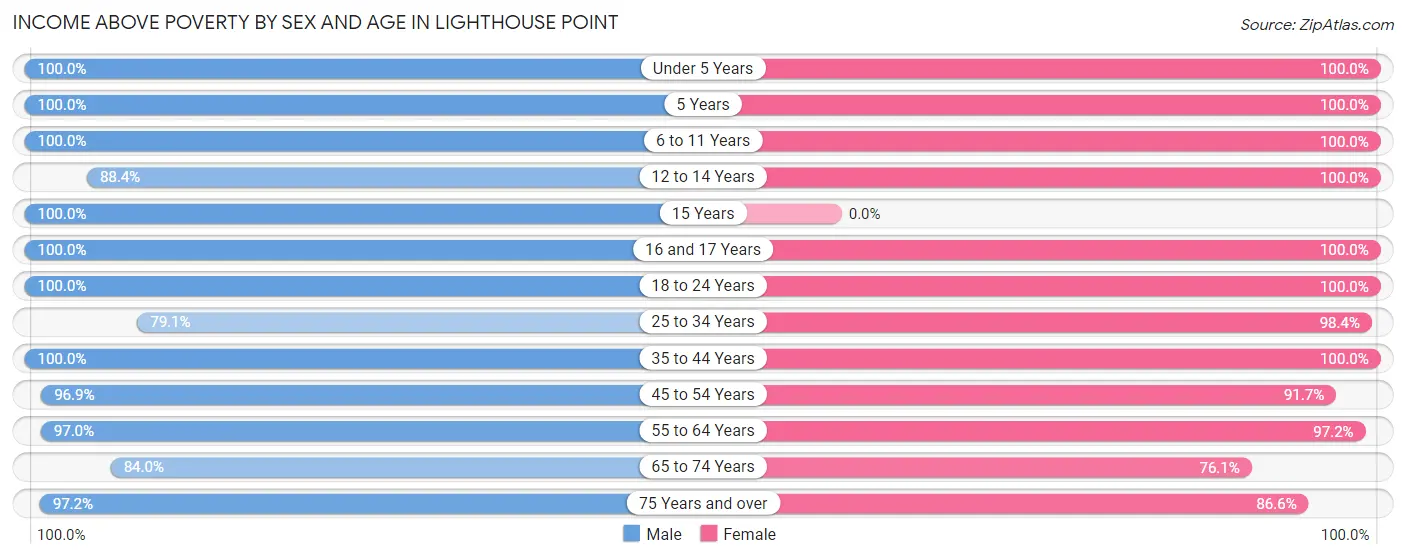
| Age Bracket | Male | Female |
| Under 5 Years | 107 (100.0%) | 220 (100.0%) |
| 5 Years | 39 (100.0%) | 14 (100.0%) |
| 6 to 11 Years | 207 (100.0%) | 302 (100.0%) |
| 12 to 14 Years | 168 (88.4%) | 145 (100.0%) |
| 15 Years | 78 (100.0%) | 0 (0.0%) |
| 16 and 17 Years | 75 (100.0%) | 43 (100.0%) |
| 18 to 24 Years | 153 (100.0%) | 328 (100.0%) |
| 25 to 34 Years | 291 (79.1%) | 299 (98.4%) |
| 35 to 44 Years | 491 (100.0%) | 407 (100.0%) |
| 45 to 54 Years | 689 (96.9%) | 900 (91.7%) |
| 55 to 64 Years | 1,346 (97.0%) | 863 (97.2%) |
| 65 to 74 Years | 536 (84.0%) | 613 (76.0%) |
| 75 Years and over | 790 (97.2%) | 667 (86.6%) |
| Total | 4,970 (94.5%) | 4,801 (92.2%) |
Income Below Poverty Among Married-Couple Families in Lighthouse Point
The poverty statistics for married-couple families in Lighthouse Point show that 3.3% or 83 of the total 2,482 families live below the poverty line. Families with 1 or 2 children have the highest poverty rate of 3.9%, comprising of 21 families. On the other hand, families with 3 or 4 children have the lowest poverty rate of 0.0%, which includes 0 families.
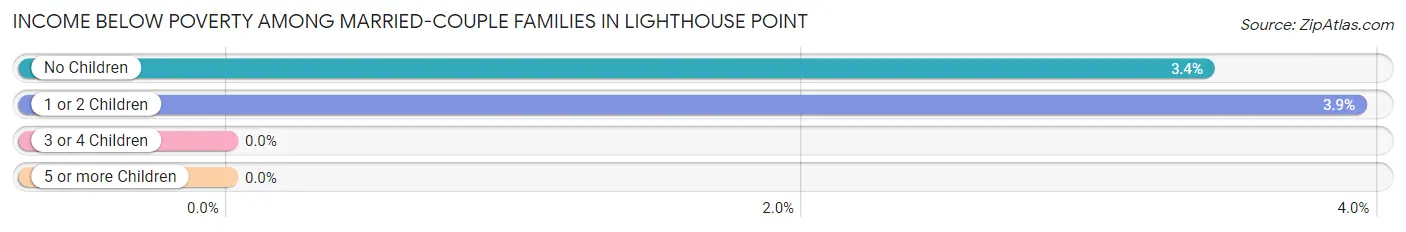
| Children | Above Poverty | Below Poverty |
| No Children | 1,760 (96.6%) | 62 (3.4%) |
| 1 or 2 Children | 513 (96.1%) | 21 (3.9%) |
| 3 or 4 Children | 126 (100.0%) | 0 (0.0%) |
| 5 or more Children | 0 (0.0%) | 0 (0.0%) |
| Total | 2,399 (96.7%) | 83 (3.3%) |
Income Below Poverty Among Single-Parent Households in Lighthouse Point
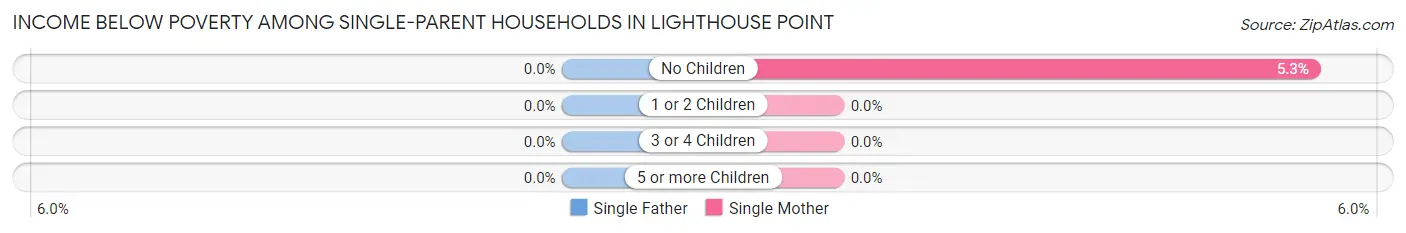
| Children | Single Father | Single Mother |
| No Children | 0 (0.0%) | 9 (5.3%) |
| 1 or 2 Children | 0 (0.0%) | 0 (0.0%) |
| 3 or 4 Children | 0 (0.0%) | 0 (0.0%) |
| 5 or more Children | 0 (0.0%) | 0 (0.0%) |
| Total | 0 (0.0%) | 9 (3.8%) |
Income Below Poverty Among Married-Couple vs Single-Parent Households in Lighthouse Point
The poverty data for Lighthouse Point shows that 83 of the married-couple family households (3.3%) and 9 of the single-parent households (2.4%) are living below the poverty level. Within the married-couple family households, those with 1 or 2 children have the highest poverty rate, with 21 households (3.9%) falling below the poverty line. Among the single-parent households, those with no children have the highest poverty rate, with 9 household (3.1%) living below poverty.
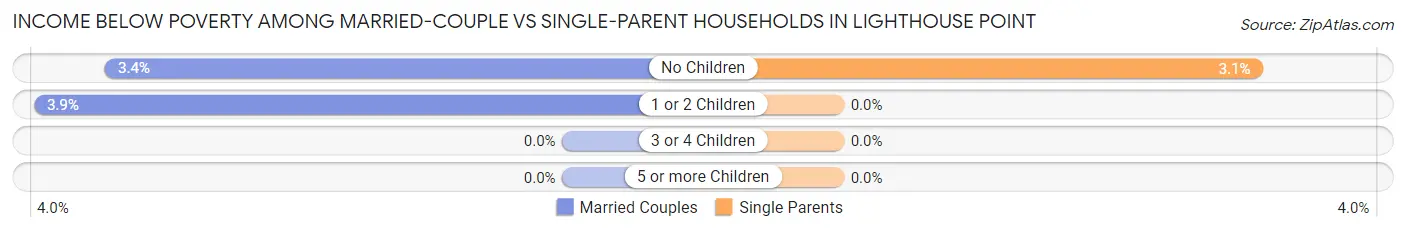
| Children | Married-Couple Families | Single-Parent Households |
| No Children | 62 (3.4%) | 9 (3.1%) |
| 1 or 2 Children | 21 (3.9%) | 0 (0.0%) |
| 3 or 4 Children | 0 (0.0%) | 0 (0.0%) |
| 5 or more Children | 0 (0.0%) | 0 (0.0%) |
| Total | 83 (3.3%) | 9 (2.4%) |
Race in Lighthouse Point
The most populous races in Lighthouse Point are White / Caucasian (9,003 | 85.8%), Hispanic or Latino (1,251 | 11.9%), and Two or more Races (1,016 | 9.7%).
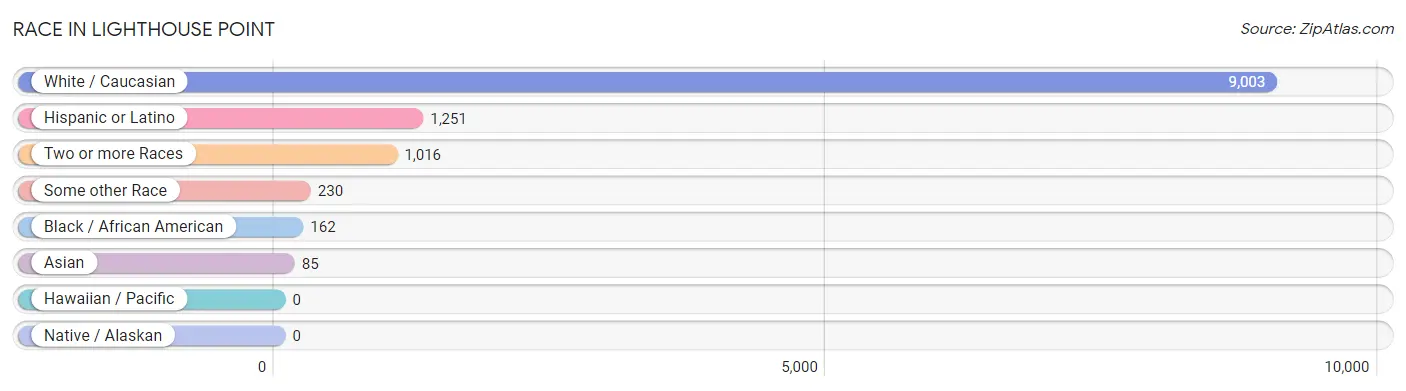
| Race | # Population | % Population |
| Asian | 85 | 0.8% |
| Black / African American | 162 | 1.5% |
| Hawaiian / Pacific | 0 | 0.0% |
| Hispanic or Latino | 1,251 | 11.9% |
| Native / Alaskan | 0 | 0.0% |
| White / Caucasian | 9,003 | 85.8% |
| Two or more Races | 1,016 | 9.7% |
| Some other Race | 230 | 2.2% |
| Total | 10,496 | 100.0% |
Ancestry in Lighthouse Point
The most populous ancestries reported in Lighthouse Point are Irish (1,821 | 17.3%), Italian (1,461 | 13.9%), German (1,368 | 13.0%), English (1,027 | 9.8%), and American (744 | 7.1%), together accounting for 61.2% of all Lighthouse Point residents.
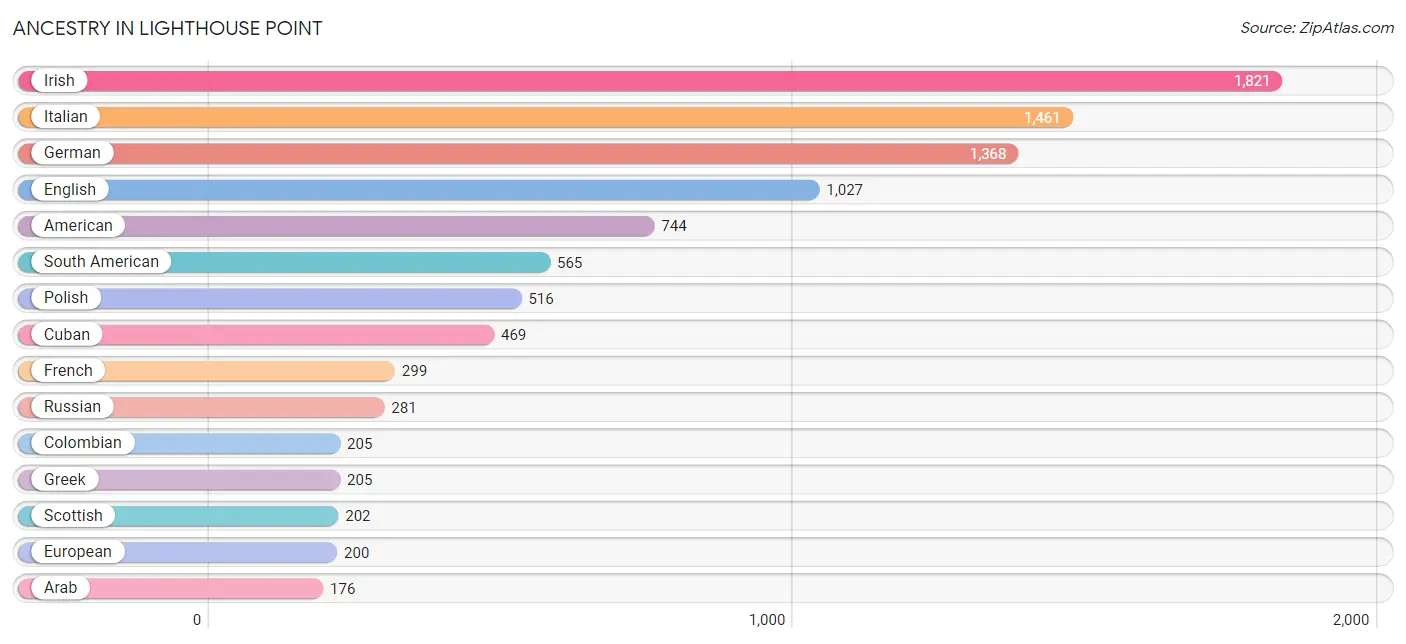
| Ancestry | # Population | % Population |
| American | 744 | 7.1% |
| Arab | 176 | 1.7% |
| Argentinean | 36 | 0.3% |
| Armenian | 5 | 0.1% |
| Australian | 27 | 0.3% |
| Austrian | 23 | 0.2% |
| Brazilian | 61 | 0.6% |
| British | 19 | 0.2% |
| Burmese | 46 | 0.4% |
| Canadian | 30 | 0.3% |
| Celtic | 8 | 0.1% |
| Cherokee | 16 | 0.2% |
| Chilean | 45 | 0.4% |
| Colombian | 205 | 1.9% |
| Croatian | 16 | 0.2% |
| Cuban | 469 | 4.5% |
| Czech | 64 | 0.6% |
| Danish | 69 | 0.7% |
| Dominican | 11 | 0.1% |
| Dutch | 137 | 1.3% |
| Eastern European | 151 | 1.4% |
| Ecuadorian | 29 | 0.3% |
| Egyptian | 17 | 0.2% |
| English | 1,027 | 9.8% |
| European | 200 | 1.9% |
| Finnish | 15 | 0.1% |
| French | 299 | 2.9% |
| French Canadian | 84 | 0.8% |
| German | 1,368 | 13.0% |
| Greek | 205 | 1.9% |
| Hungarian | 158 | 1.5% |
| Indian (Asian) | 15 | 0.1% |
| Irish | 1,821 | 17.3% |
| Italian | 1,461 | 13.9% |
| Korean | 87 | 0.8% |
| Lebanese | 53 | 0.5% |
| Lithuanian | 35 | 0.3% |
| Mexican | 99 | 0.9% |
| Moroccan | 106 | 1.0% |
| Northern European | 4 | 0.0% |
| Norwegian | 120 | 1.1% |
| Peruvian | 92 | 0.9% |
| Polish | 516 | 4.9% |
| Portuguese | 51 | 0.5% |
| Puerto Rican | 107 | 1.0% |
| Romanian | 45 | 0.4% |
| Russian | 281 | 2.7% |
| Scotch-Irish | 7 | 0.1% |
| Scottish | 202 | 1.9% |
| Slovak | 23 | 0.2% |
| South African | 10 | 0.1% |
| South American | 565 | 5.4% |
| South American Indian | 3 | 0.0% |
| Sri Lankan | 9 | 0.1% |
| Subsaharan African | 127 | 1.2% |
| Swedish | 153 | 1.5% |
| Swiss | 20 | 0.2% |
| Syrian | 13 | 0.1% |
| Thai | 60 | 0.6% |
| Trinidadian and Tobagonian | 26 | 0.3% |
| Turkish | 60 | 0.6% |
| Ukrainian | 76 | 0.7% |
| Uruguayan | 142 | 1.3% |
| Venezuelan | 16 | 0.2% |
| Welsh | 47 | 0.4% |
| Zimbabwean | 117 | 1.1% | View All 66 Rows |
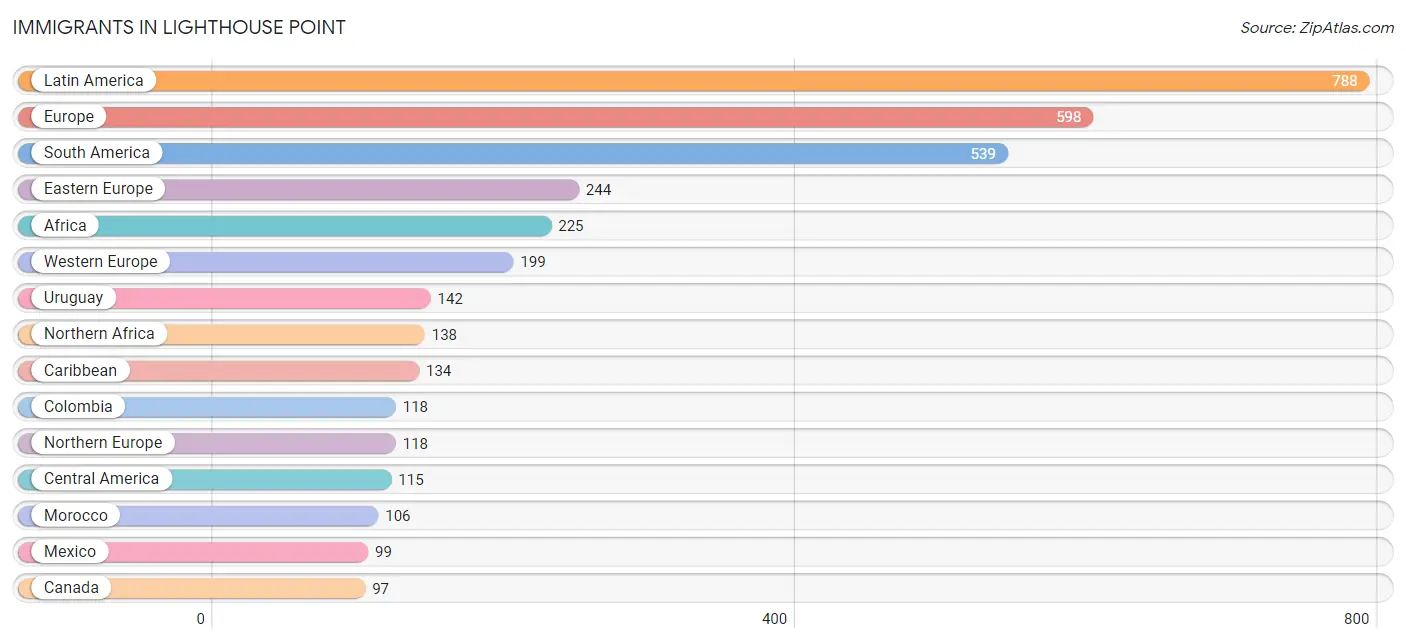
Immigrants in Lighthouse Point
The most numerous immigrant groups reported in Lighthouse Point came from Latin America (788 | 7.5%), Europe (598 | 5.7%), South America (539 | 5.1%), Eastern Europe (244 | 2.3%), and Africa (225 | 2.1%), together accounting for 22.8% of all Lighthouse Point residents.
| Immigration Origin | # Population | % Population |
| Africa | 225 | 2.1% |
| Argentina | 89 | 0.9% |
| Asia | 90 | 0.9% |
| Australia | 15 | 0.1% |
| Austria | 9 | 0.1% |
| Brazil | 86 | 0.8% |
| Canada | 97 | 0.9% |
| Caribbean | 134 | 1.3% |
| Central America | 115 | 1.1% |
| Chile | 45 | 0.4% |
| Colombia | 118 | 1.1% |
| Cuba | 25 | 0.2% |
| Czechoslovakia | 49 | 0.5% |
| Dominican Republic | 11 | 0.1% |
| Eastern Africa | 77 | 0.7% |
| Eastern Asia | 42 | 0.4% |
| Eastern Europe | 244 | 2.3% |
| Ecuador | 14 | 0.1% |
| Egypt | 32 | 0.3% |
| England | 47 | 0.4% |
| Europe | 598 | 5.7% |
| France | 96 | 0.9% |
| Germany | 38 | 0.4% |
| Haiti | 37 | 0.4% |
| Honduras | 16 | 0.2% |
| Hungary | 34 | 0.3% |
| India | 4 | 0.0% |
| Italy | 21 | 0.2% |
| Jamaica | 8 | 0.1% |
| Korea | 42 | 0.4% |
| Latin America | 788 | 7.5% |
| Lithuania | 19 | 0.2% |
| Mexico | 99 | 0.9% |
| Morocco | 106 | 1.0% |
| Netherlands | 47 | 0.4% |
| Northern Africa | 138 | 1.3% |
| Northern Europe | 118 | 1.1% |
| Oceania | 15 | 0.1% |
| Peru | 29 | 0.3% |
| Poland | 10 | 0.1% |
| Portugal | 16 | 0.2% |
| Romania | 10 | 0.1% |
| Russia | 67 | 0.6% |
| South Africa | 10 | 0.1% |
| South America | 539 | 5.1% |
| South Central Asia | 12 | 0.1% |
| South Eastern Asia | 22 | 0.2% |
| Southern Europe | 37 | 0.4% |
| Sri Lanka | 8 | 0.1% |
| Switzerland | 9 | 0.1% |
| Thailand | 2 | 0.0% |
| Trinidad and Tobago | 39 | 0.4% |
| Ukraine | 45 | 0.4% |
| Uruguay | 142 | 1.3% |
| Venezuela | 16 | 0.2% |
| Vietnam | 20 | 0.2% |
| Western Asia | 14 | 0.1% |
| Western Europe | 199 | 1.9% |
| Zimbabwe | 49 | 0.5% | View All 59 Rows |
Sex and Age in Lighthouse Point
Sex and Age in Lighthouse Point
The most populous age groups in Lighthouse Point are 55 to 59 Years (701 | 13.3%) for men and 65 to 69 Years (535 | 10.3%) for women.
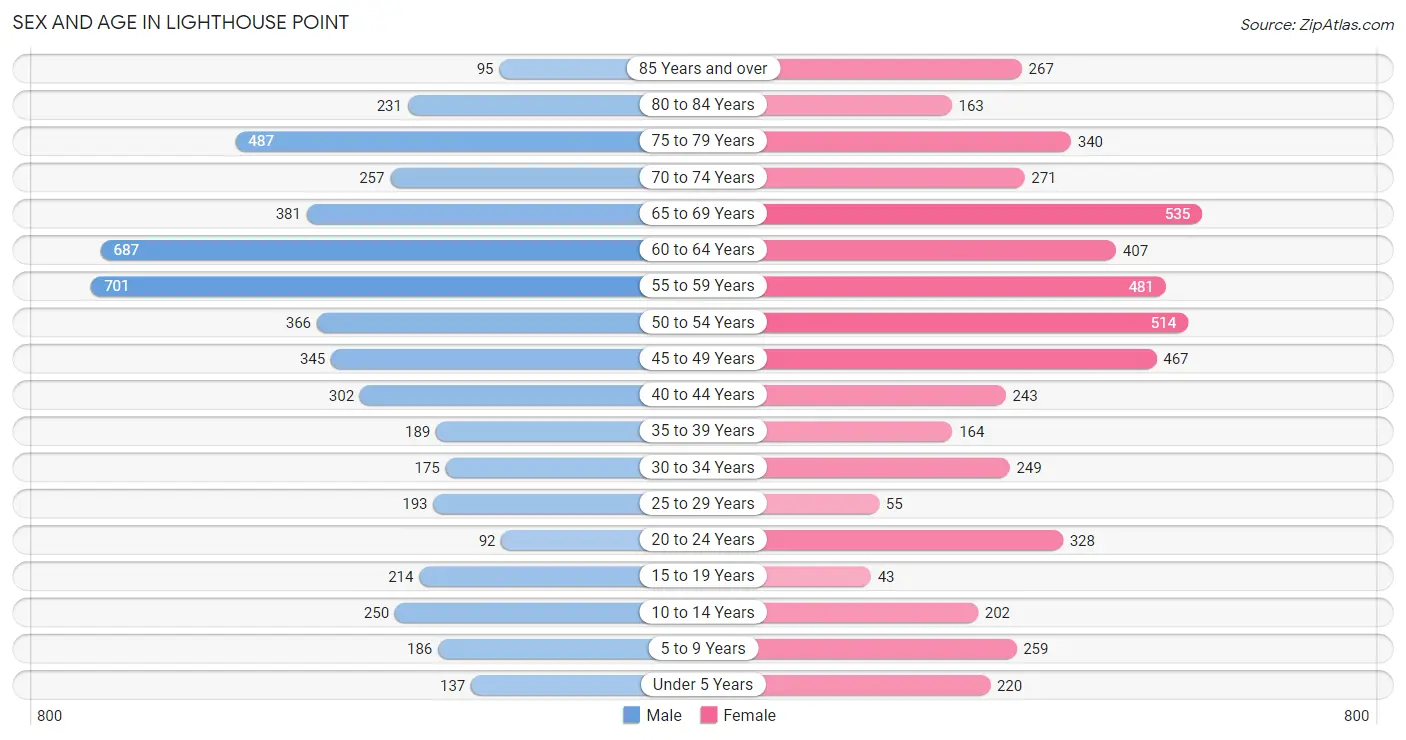
| Age Bracket | Male | Female |
| Under 5 Years | 137 (2.6%) | 220 (4.2%) |
| 5 to 9 Years | 186 (3.5%) | 259 (5.0%) |
| 10 to 14 Years | 250 (4.7%) | 202 (3.9%) |
| 15 to 19 Years | 214 (4.1%) | 43 (0.8%) |
| 20 to 24 Years | 92 (1.7%) | 328 (6.3%) |
| 25 to 29 Years | 193 (3.6%) | 55 (1.1%) |
| 30 to 34 Years | 175 (3.3%) | 249 (4.8%) |
| 35 to 39 Years | 189 (3.6%) | 164 (3.2%) |
| 40 to 44 Years | 302 (5.7%) | 243 (4.7%) |
| 45 to 49 Years | 345 (6.5%) | 467 (9.0%) |
| 50 to 54 Years | 366 (6.9%) | 514 (9.9%) |
| 55 to 59 Years | 701 (13.3%) | 481 (9.2%) |
| 60 to 64 Years | 687 (13.0%) | 407 (7.8%) |
| 65 to 69 Years | 381 (7.2%) | 535 (10.3%) |
| 70 to 74 Years | 257 (4.9%) | 271 (5.2%) |
| 75 to 79 Years | 487 (9.2%) | 340 (6.5%) |
| 80 to 84 Years | 231 (4.4%) | 163 (3.1%) |
| 85 Years and over | 95 (1.8%) | 267 (5.1%) |
| Total | 5,288 (100.0%) | 5,208 (100.0%) |
Families and Households in Lighthouse Point
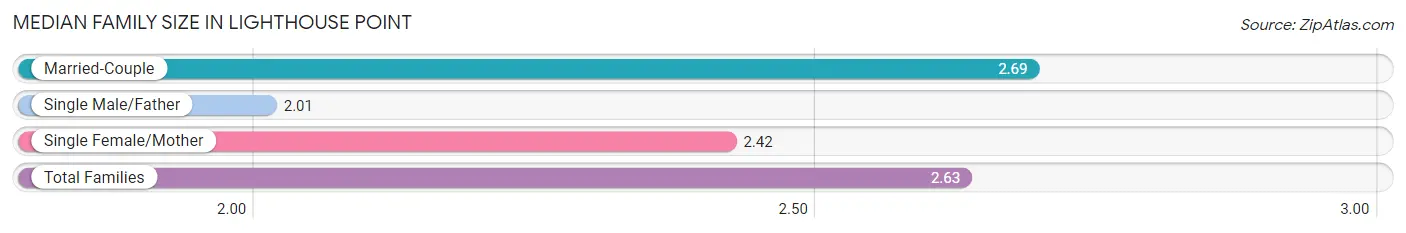
Median Family Size in Lighthouse Point
The median family size in Lighthouse Point is 2.63 persons per family, with married-couple families (2,482 | 86.7%) accounting for the largest median family size of 2.69 persons per family. On the other hand, single male/father families (146 | 5.1%) represent the smallest median family size with 2.01 persons per family.
| Family Type | # Families | Family Size |
| Married-Couple | 2,482 (86.7%) | 2.69 |
| Single Male/Father | 146 (5.1%) | 2.01 |
| Single Female/Mother | 235 (8.2%) | 2.42 |
| Total Families | 2,863 (100.0%) | 2.63 |
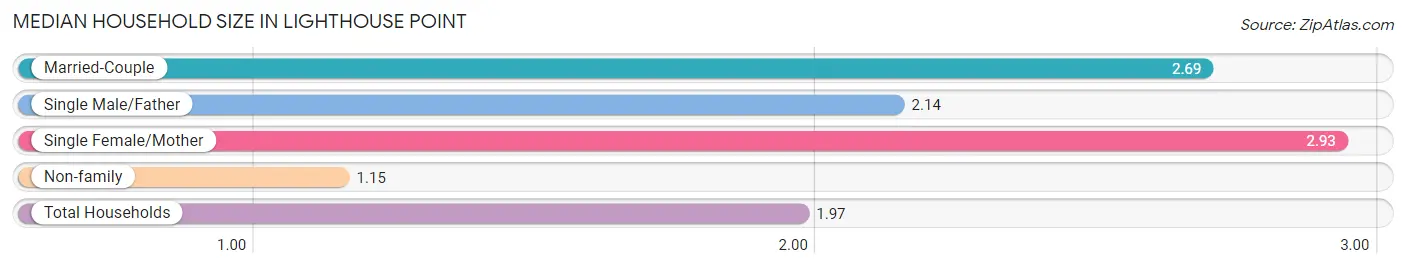
Median Household Size in Lighthouse Point
The median household size in Lighthouse Point is 1.97 persons per household, with single female/mother households (235 | 4.4%) accounting for the largest median household size of 2.93 persons per household. non-family households (2,452 | 46.1%) represent the smallest median household size with 1.15 persons per household.
| Household Type | # Households | Household Size |
| Married-Couple | 2,482 (46.7%) | 2.69 |
| Single Male/Father | 146 (2.8%) | 2.14 |
| Single Female/Mother | 235 (4.4%) | 2.93 |
| Non-family | 2,452 (46.1%) | 1.15 |
| Total Households | 5,315 (100.0%) | 1.97 |
Household Size by Marriage Status in Lighthouse Point
Out of a total of 5,315 households in Lighthouse Point, 2,863 (53.9%) are family households, while 2,452 (46.1%) are nonfamily households. The most numerous type of family households are 2-person households, comprising 1,824, and the most common type of nonfamily households are 1-person households, comprising 2,183.
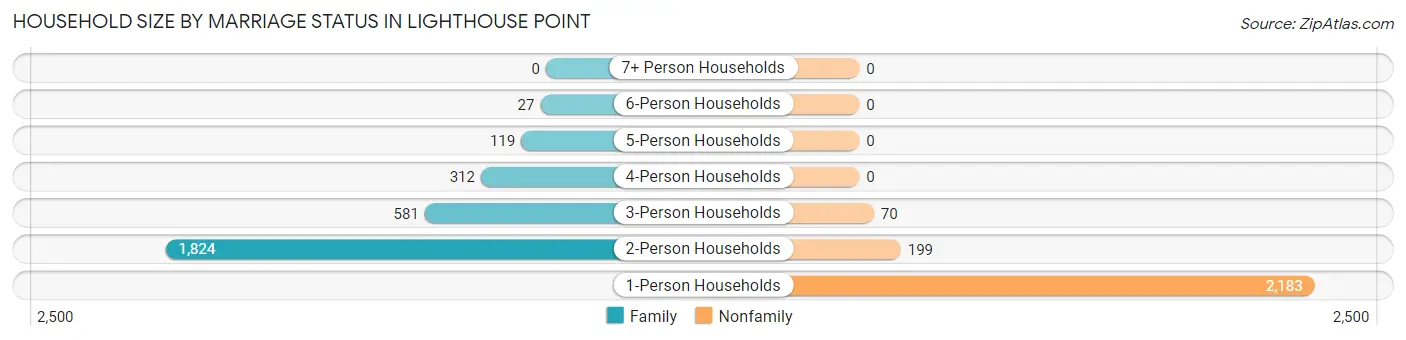
| Household Size | Family Households | Nonfamily Households |
| 1-Person Households | - | 2,183 (41.1%) |
| 2-Person Households | 1,824 (34.3%) | 199 (3.7%) |
| 3-Person Households | 581 (10.9%) | 70 (1.3%) |
| 4-Person Households | 312 (5.9%) | 0 (0.0%) |
| 5-Person Households | 119 (2.2%) | 0 (0.0%) |
| 6-Person Households | 27 (0.5%) | 0 (0.0%) |
| 7+ Person Households | 0 (0.0%) | 0 (0.0%) |
| Total | 2,863 (53.9%) | 2,452 (46.1%) |
Female Fertility in Lighthouse Point
Fertility by Age in Lighthouse Point
Average fertility rate in Lighthouse Point is 15.0 births per 1,000 women. Women in the age bracket of 20 to 34 years have the highest fertility rate with 30.0 births per 1,000 women. Women in the age bracket of 20 to 34 years acount for 76.0% of all women with births.
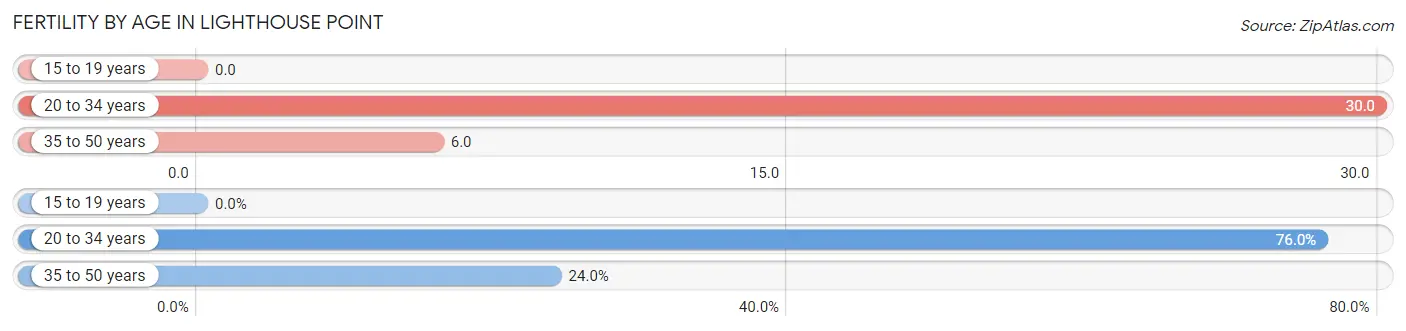
| Age Bracket | Women with Births | Births / 1,000 Women |
| 15 to 19 years | 0 (0.0%) | 0.0 |
| 20 to 34 years | 19 (76.0%) | 30.0 |
| 35 to 50 years | 6 (24.0%) | 6.0 |
| Total | 25 (100.0%) | 15.0 |
Fertility by Age by Marriage Status in Lighthouse Point
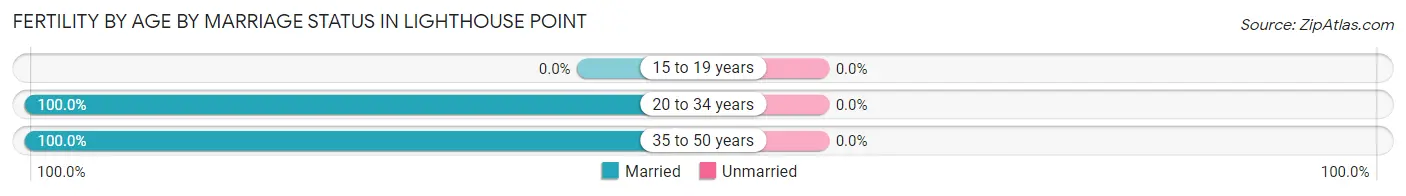
| Age Bracket | Married | Unmarried |
| 15 to 19 years | 0 (0.0%) | 0 (0.0%) |
| 20 to 34 years | 19 (100.0%) | 0 (0.0%) |
| 35 to 50 years | 6 (100.0%) | 0 (0.0%) |
| Total | 25 (100.0%) | 0 (0.0%) |
Fertility by Education in Lighthouse Point
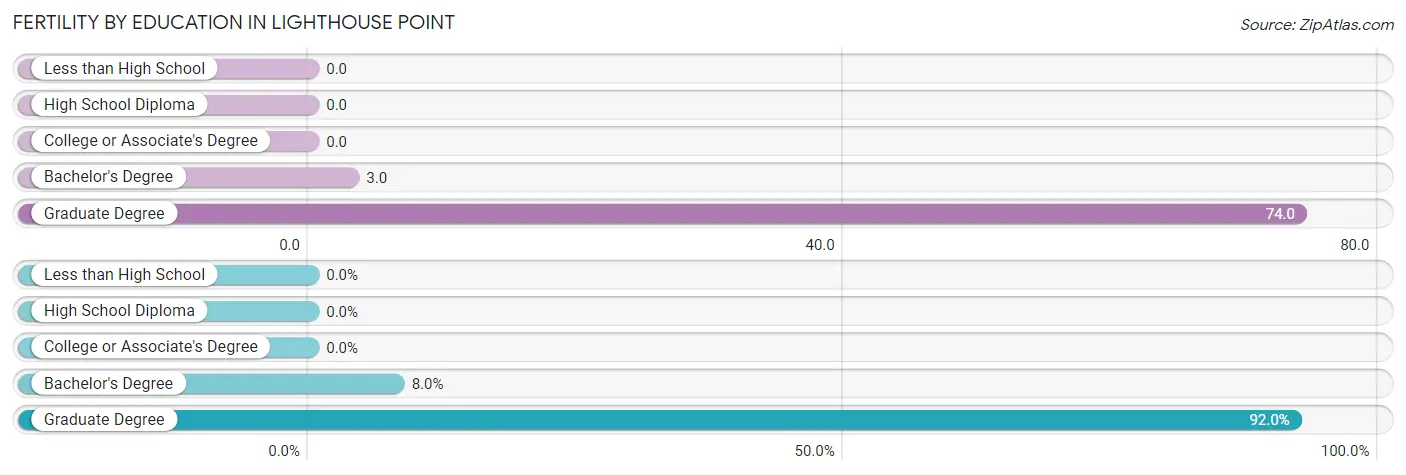
| Educational Attainment | Women with Births | Births / 1,000 Women |
| Less than High School | 0 (0.0%) | 0.0 |
| High School Diploma | 0 (0.0%) | 0.0 |
| College or Associate's Degree | 0 (0.0%) | 0.0 |
| Bachelor's Degree | 2 (8.0%) | 3.0 |
| Graduate Degree | 23 (92.0%) | 74.0 |
| Total | 25 (100.0%) | 15.0 |
Fertility by Education by Marriage Status in Lighthouse Point
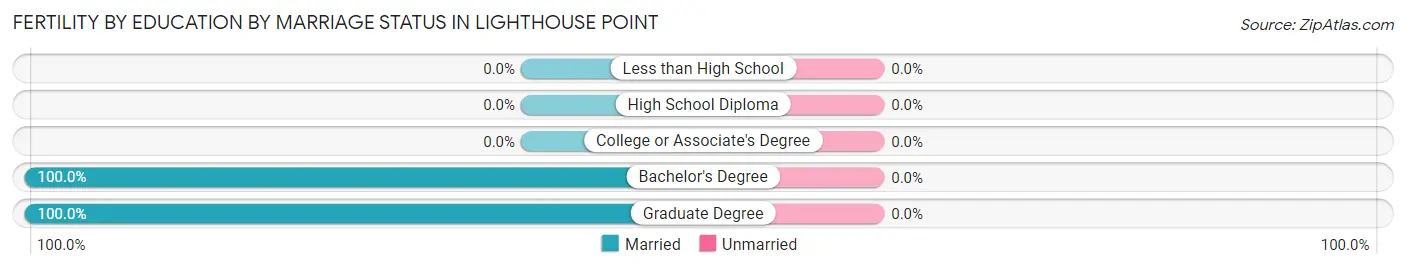
| Educational Attainment | Married | Unmarried |
| Less than High School | 0 (0.0%) | 0 (0.0%) |
| High School Diploma | 0 (0.0%) | 0 (0.0%) |
| College or Associate's Degree | 0 (0.0%) | 0 (0.0%) |
| Bachelor's Degree | 2 (100.0%) | 0 (0.0%) |
| Graduate Degree | 23 (100.0%) | 0 (0.0%) |
| Total | 25 (100.0%) | 0 (0.0%) |
Employment Characteristics in Lighthouse Point
Employment by Class of Employer in Lighthouse Point
Among the 5,257 employed individuals in Lighthouse Point, private company employees (3,050 | 58.0%), self-employed (incorporated) (932 | 17.7%), and self-employed (not incorporated) (571 | 10.9%) make up the most common classes of employment.
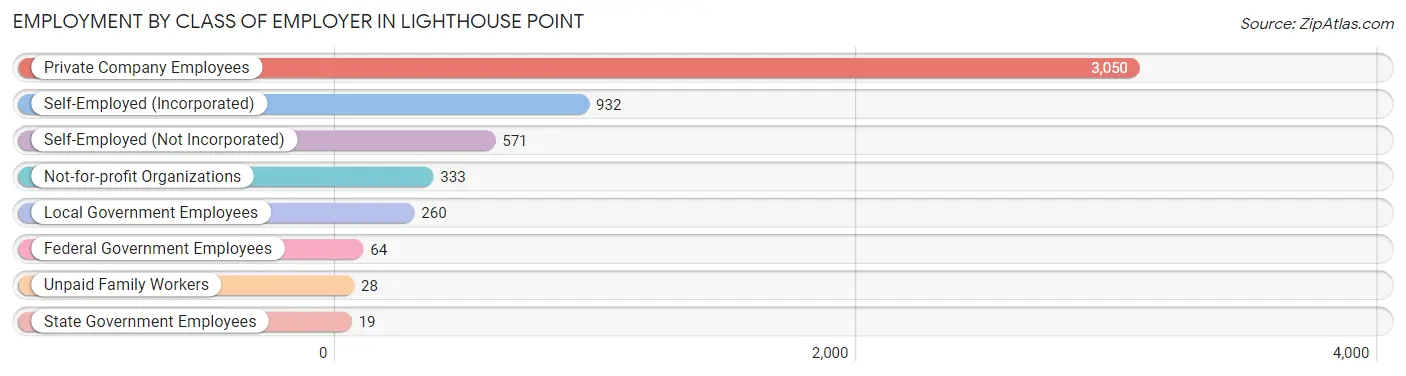
| Employer Class | # Employees | % Employees |
| Private Company Employees | 3,050 | 58.0% |
| Self-Employed (Incorporated) | 932 | 17.7% |
| Self-Employed (Not Incorporated) | 571 | 10.9% |
| Not-for-profit Organizations | 333 | 6.3% |
| Local Government Employees | 260 | 5.0% |
| State Government Employees | 19 | 0.4% |
| Federal Government Employees | 64 | 1.2% |
| Unpaid Family Workers | 28 | 0.5% |
| Total | 5,257 | 100.0% |
Employment Status by Age in Lighthouse Point
According to the labor force statistics for Lighthouse Point, out of the total population over 16 years of age (9,164), 59.3% or 5,434 individuals are in the labor force, with 2.2% or 120 of them unemployed. The age group with the highest labor force participation rate is 35 to 44 years, with 92.5% or 831 individuals in the labor force. Within the labor force, the 16 to 19 years age range has the highest percentage of unemployed individuals, with 18.3% or 11 of them being unemployed.
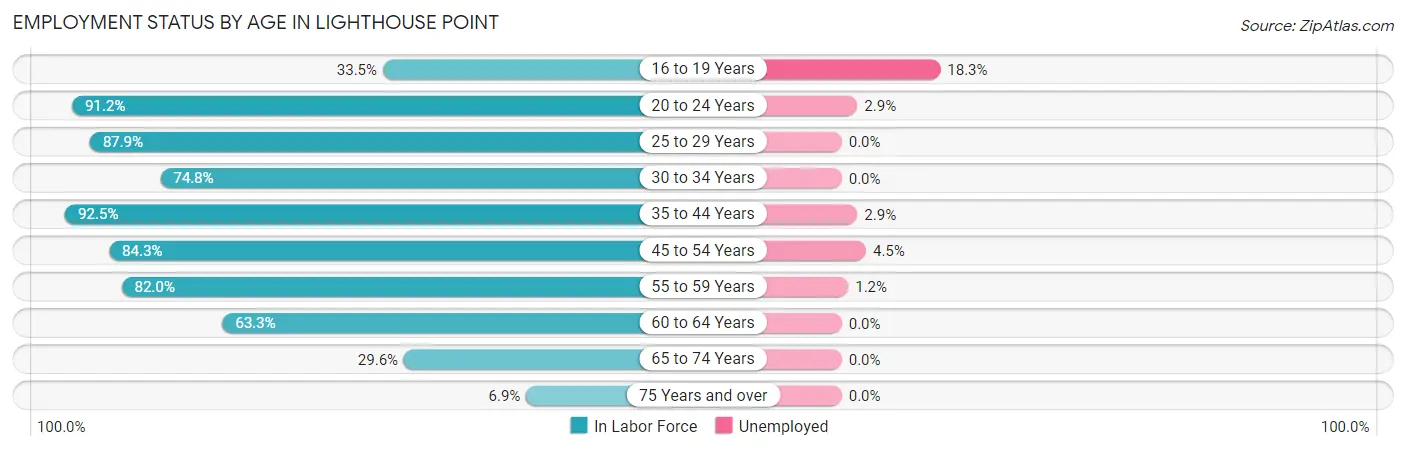
| Age Bracket | In Labor Force | Unemployed |
| 16 to 19 Years | 60 (33.5%) | 11 (18.3%) |
| 20 to 24 Years | 383 (91.2%) | 11 (2.9%) |
| 25 to 29 Years | 218 (87.9%) | 0 (0.0%) |
| 30 to 34 Years | 317 (74.8%) | 0 (0.0%) |
| 35 to 44 Years | 831 (92.5%) | 24 (2.9%) |
| 45 to 54 Years | 1,426 (84.3%) | 64 (4.5%) |
| 55 to 59 Years | 969 (82.0%) | 12 (1.2%) |
| 60 to 64 Years | 693 (63.3%) | 0 (0.0%) |
| 65 to 74 Years | 427 (29.6%) | 0 (0.0%) |
| 75 Years and over | 109 (6.9%) | 0 (0.0%) |
| Total | 5,434 (59.3%) | 120 (2.2%) |
Employment Status by Educational Attainment in Lighthouse Point
According to labor force statistics for Lighthouse Point, 80.4% of individuals (4,453) out of the total population between 25 and 64 years of age (5,538) are in the labor force, with 2.2% or 98 of them being unemployed. The group with the highest labor force participation rate are those with the educational attainment of college / associate degree, with 83.1% or 1,262 individuals in the labor force. Within the labor force, individuals with college / associate degree education have the highest percentage of unemployment, with 4.3% or 54 of them being unemployed.
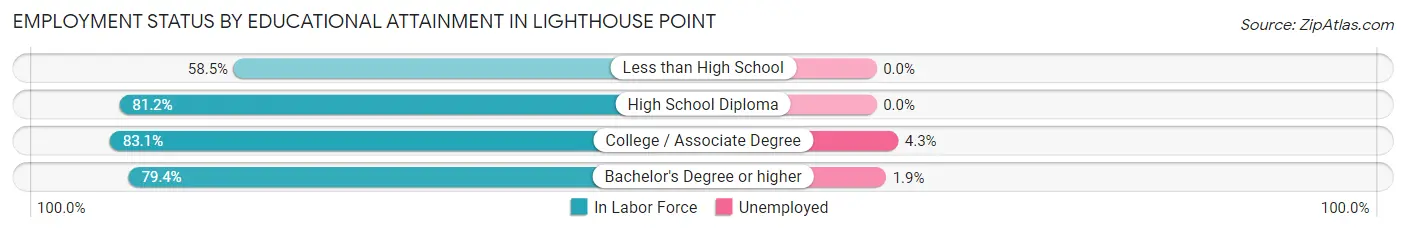
| Educational Attainment | In Labor Force | Unemployed |
| Less than High School | 48 (58.5%) | 0 (0.0%) |
| High School Diploma | 739 (81.2%) | 0 (0.0%) |
| College / Associate Degree | 1,262 (83.1%) | 65 (4.3%) |
| Bachelor's Degree or higher | 2,403 (79.4%) | 58 (1.9%) |
| Total | 4,453 (80.4%) | 122 (2.2%) |
Employment Occupations by Sex in Lighthouse Point
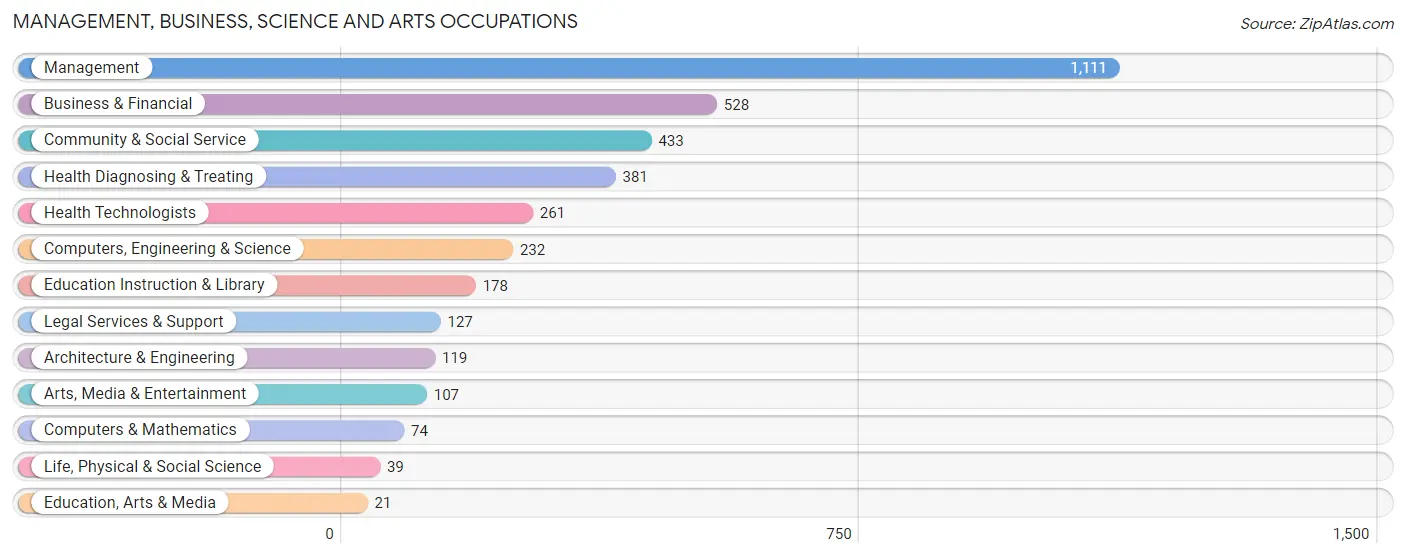
Management, Business, Science and Arts Occupations
The most common Management, Business, Science and Arts occupations in Lighthouse Point are Management (1,111 | 20.9%), Business & Financial (528 | 9.9%), Community & Social Service (433 | 8.2%), Health Diagnosing & Treating (381 | 7.2%), and Health Technologists (261 | 4.9%).
Management, Business, Science and Arts Occupations by Sex
Within the Management, Business, Science and Arts occupations in Lighthouse Point, the most male-oriented occupations are Architecture & Engineering (100.0%), Life, Physical & Social Science (100.0%), and Computers, Engineering & Science (93.5%), while the most female-oriented occupations are Education, Arts & Media (100.0%), Education Instruction & Library (87.6%), and Community & Social Service (66.5%).
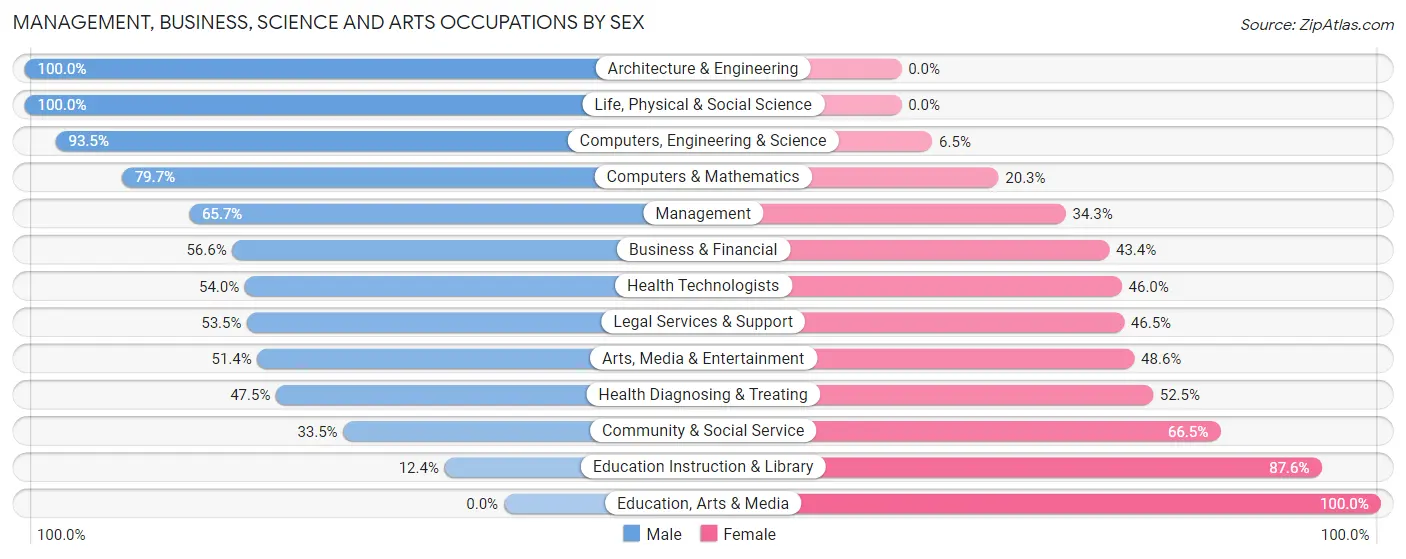
| Occupation | Male | Female |
| Management | 730 (65.7%) | 381 (34.3%) |
| Business & Financial | 299 (56.6%) | 229 (43.4%) |
| Computers, Engineering & Science | 217 (93.5%) | 15 (6.5%) |
| Computers & Mathematics | 59 (79.7%) | 15 (20.3%) |
| Architecture & Engineering | 119 (100.0%) | 0 (0.0%) |
| Life, Physical & Social Science | 39 (100.0%) | 0 (0.0%) |
| Community & Social Service | 145 (33.5%) | 288 (66.5%) |
| Education, Arts & Media | 0 (0.0%) | 21 (100.0%) |
| Legal Services & Support | 68 (53.5%) | 59 (46.5%) |
| Education Instruction & Library | 22 (12.4%) | 156 (87.6%) |
| Arts, Media & Entertainment | 55 (51.4%) | 52 (48.6%) |
| Health Diagnosing & Treating | 181 (47.5%) | 200 (52.5%) |
| Health Technologists | 141 (54.0%) | 120 (46.0%) |
| Total (Category) | 1,572 (58.6%) | 1,113 (41.4%) |
| Total (Overall) | 3,027 (57.0%) | 2,285 (43.0%) |
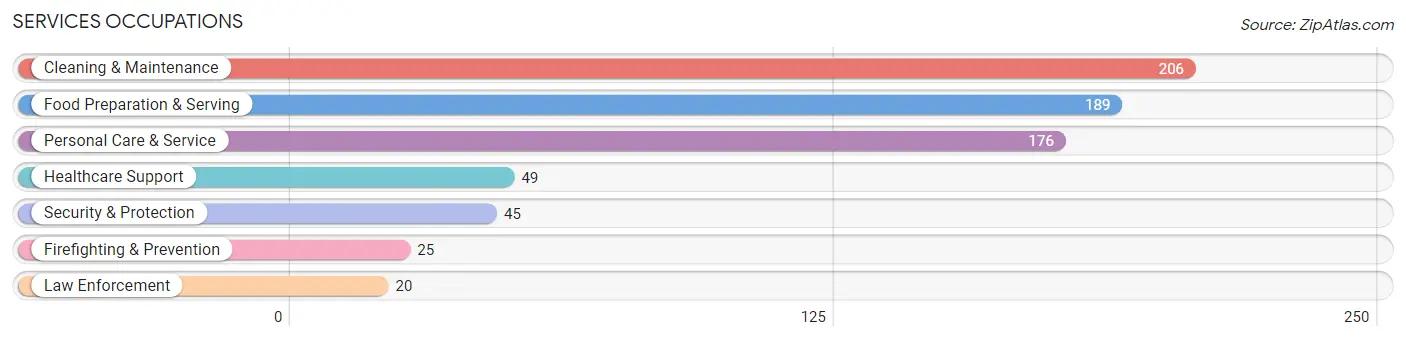
Services Occupations
The most common Services occupations in Lighthouse Point are Cleaning & Maintenance (206 | 3.9%), Food Preparation & Serving (189 | 3.6%), Personal Care & Service (176 | 3.3%), Healthcare Support (49 | 0.9%), and Security & Protection (45 | 0.9%).
Services Occupations by Sex
Within the Services occupations in Lighthouse Point, the most male-oriented occupations are Security & Protection (100.0%), Firefighting & Prevention (100.0%), and Law Enforcement (100.0%), while the most female-oriented occupations are Healthcare Support (100.0%), Food Preparation & Serving (66.7%), and Personal Care & Service (59.7%).
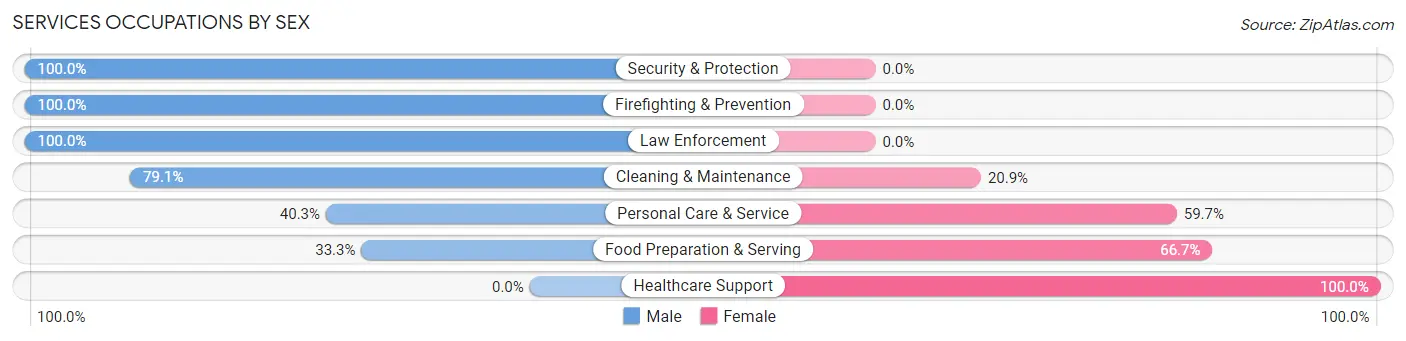
| Occupation | Male | Female |
| Healthcare Support | 0 (0.0%) | 49 (100.0%) |
| Security & Protection | 45 (100.0%) | 0 (0.0%) |
| Firefighting & Prevention | 25 (100.0%) | 0 (0.0%) |
| Law Enforcement | 20 (100.0%) | 0 (0.0%) |
| Food Preparation & Serving | 63 (33.3%) | 126 (66.7%) |
| Cleaning & Maintenance | 163 (79.1%) | 43 (20.9%) |
| Personal Care & Service | 71 (40.3%) | 105 (59.7%) |
| Total (Category) | 342 (51.4%) | 323 (48.6%) |
| Total (Overall) | 3,027 (57.0%) | 2,285 (43.0%) |
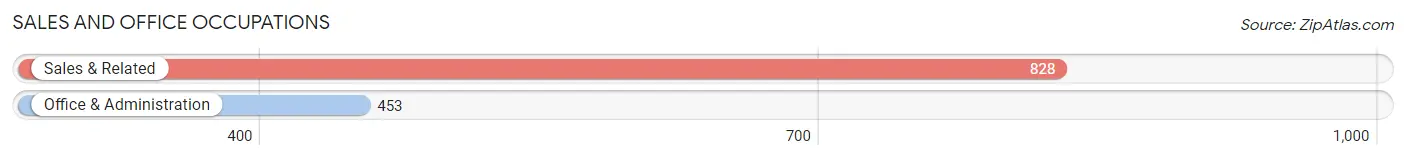
Sales and Office Occupations
The most common Sales and Office occupations in Lighthouse Point are Sales & Related (828 | 15.6%), and Office & Administration (453 | 8.5%).
Sales and Office Occupations by Sex
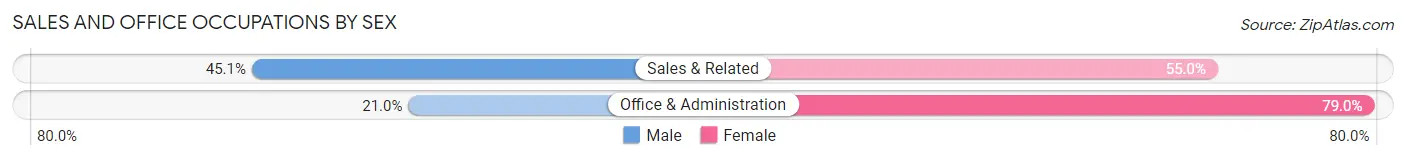
| Occupation | Male | Female |
| Sales & Related | 373 (45.1%) | 455 (54.9%) |
| Office & Administration | 95 (21.0%) | 358 (79.0%) |
| Total (Category) | 468 (36.5%) | 813 (63.5%) |
| Total (Overall) | 3,027 (57.0%) | 2,285 (43.0%) |
Natural Resources, Construction and Maintenance Occupations
The most common Natural Resources, Construction and Maintenance occupations in Lighthouse Point are Installation, Maintenance & Repair (242 | 4.6%), and Construction & Extraction (196 | 3.7%).
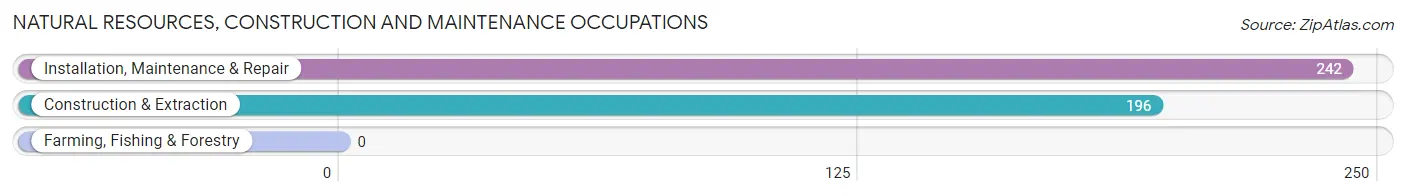
Natural Resources, Construction and Maintenance Occupations by Sex
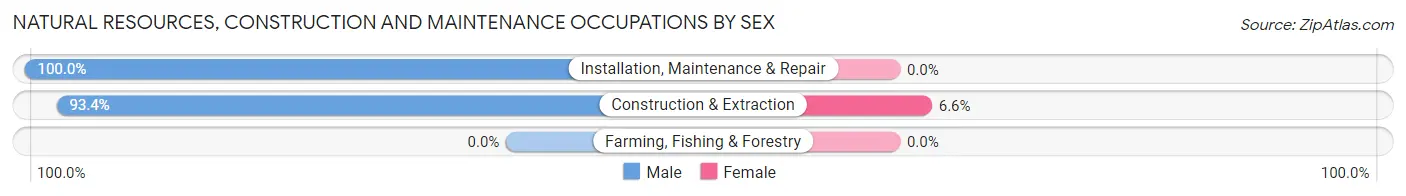
| Occupation | Male | Female |
| Farming, Fishing & Forestry | 0 (0.0%) | 0 (0.0%) |
| Construction & Extraction | 183 (93.4%) | 13 (6.6%) |
| Installation, Maintenance & Repair | 242 (100.0%) | 0 (0.0%) |
| Total (Category) | 425 (97.0%) | 13 (3.0%) |
| Total (Overall) | 3,027 (57.0%) | 2,285 (43.0%) |
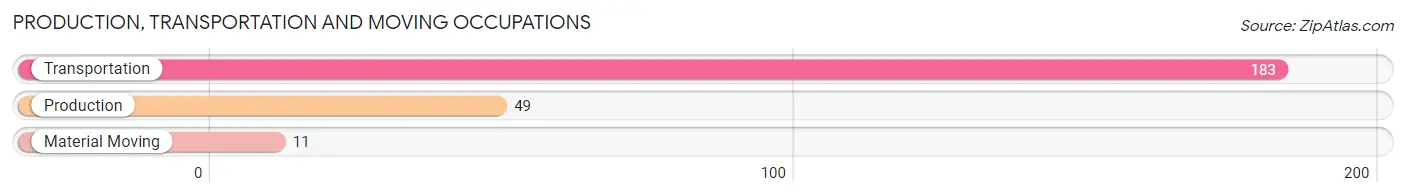
Production, Transportation and Moving Occupations
The most common Production, Transportation and Moving occupations in Lighthouse Point are Transportation (183 | 3.5%), Production (49 | 0.9%), and Material Moving (11 | 0.2%).
Production, Transportation and Moving Occupations by Sex
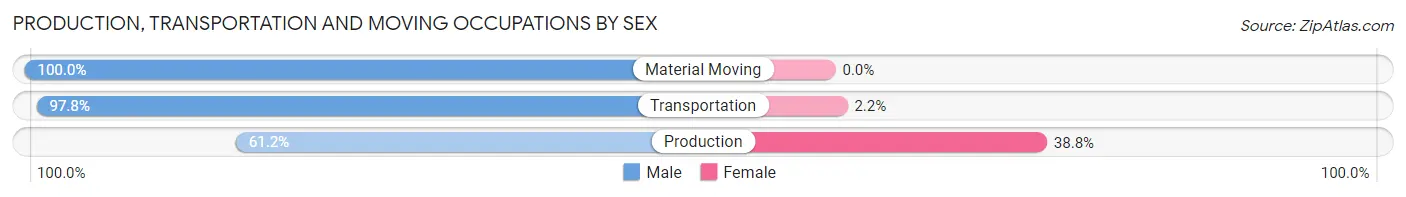
| Occupation | Male | Female |
| Production | 30 (61.2%) | 19 (38.8%) |
| Transportation | 179 (97.8%) | 4 (2.2%) |
| Material Moving | 11 (100.0%) | 0 (0.0%) |
| Total (Category) | 220 (90.5%) | 23 (9.5%) |
| Total (Overall) | 3,027 (57.0%) | 2,285 (43.0%) |
Employment Industries by Sex in Lighthouse Point
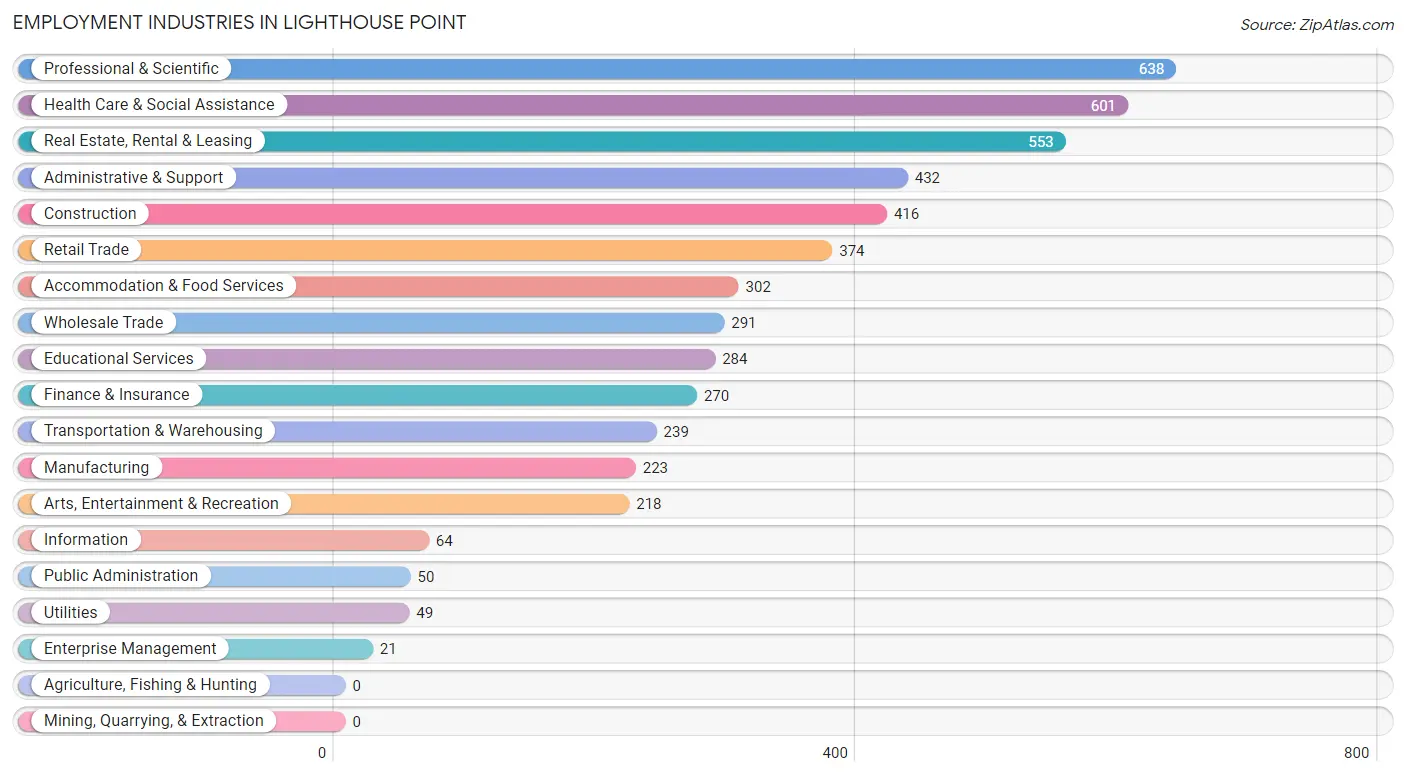
Employment Industries in Lighthouse Point
The major employment industries in Lighthouse Point include Professional & Scientific (638 | 12.0%), Health Care & Social Assistance (601 | 11.3%), Real Estate, Rental & Leasing (553 | 10.4%), Administrative & Support (432 | 8.1%), and Construction (416 | 7.8%).
Employment Industries by Sex in Lighthouse Point
The Lighthouse Point industries that see more men than women are Information (100.0%), Construction (90.9%), and Enterprise Management (90.5%), whereas the industries that tend to have a higher number of women are Educational Services (73.6%), Health Care & Social Assistance (68.0%), and Arts, Entertainment & Recreation (66.5%).
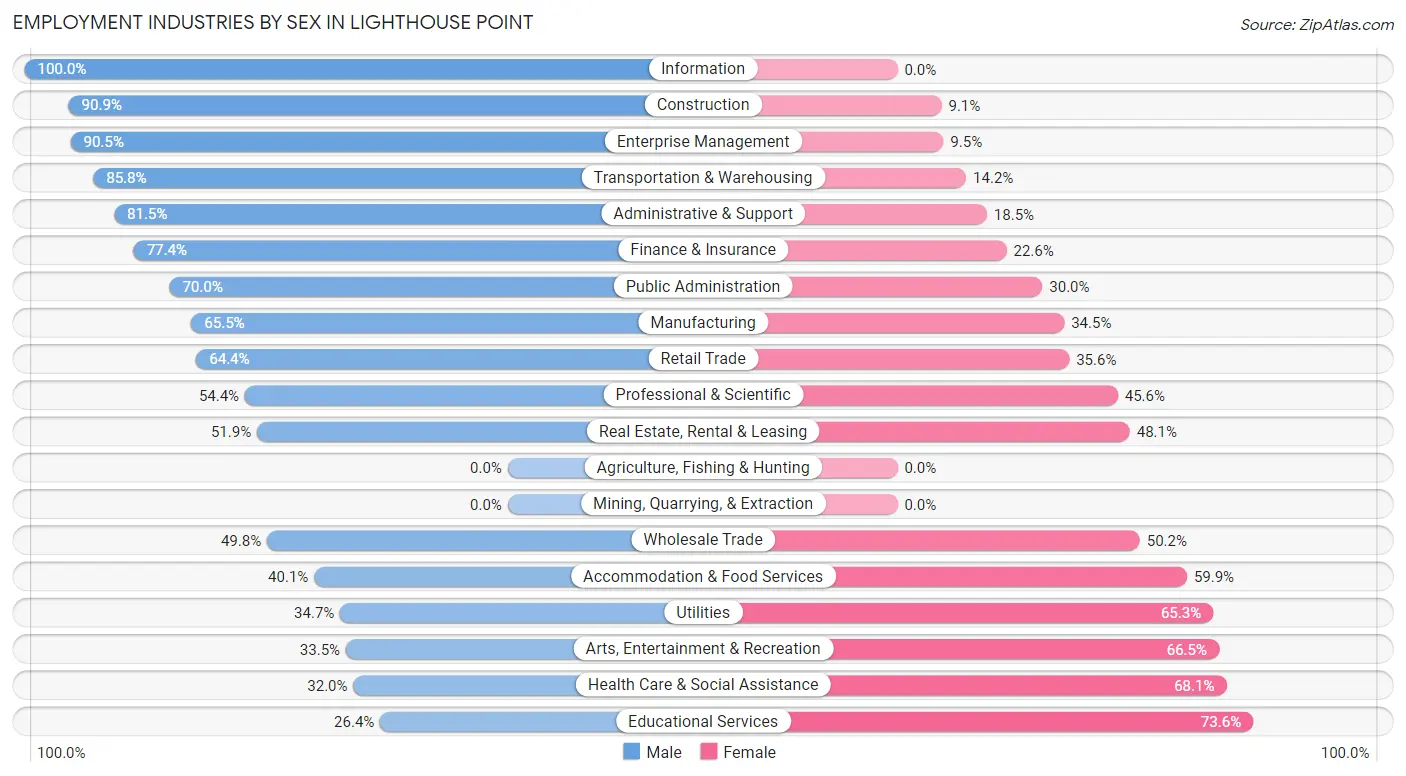
| Industry | Male | Female |
| Agriculture, Fishing & Hunting | 0 (0.0%) | 0 (0.0%) |
| Mining, Quarrying, & Extraction | 0 (0.0%) | 0 (0.0%) |
| Construction | 378 (90.9%) | 38 (9.1%) |
| Manufacturing | 146 (65.5%) | 77 (34.5%) |
| Wholesale Trade | 145 (49.8%) | 146 (50.2%) |
| Retail Trade | 241 (64.4%) | 133 (35.6%) |
| Transportation & Warehousing | 205 (85.8%) | 34 (14.2%) |
| Utilities | 17 (34.7%) | 32 (65.3%) |
| Information | 64 (100.0%) | 0 (0.0%) |
| Finance & Insurance | 209 (77.4%) | 61 (22.6%) |
| Real Estate, Rental & Leasing | 287 (51.9%) | 266 (48.1%) |
| Professional & Scientific | 347 (54.4%) | 291 (45.6%) |
| Enterprise Management | 19 (90.5%) | 2 (9.5%) |
| Administrative & Support | 352 (81.5%) | 80 (18.5%) |
| Educational Services | 75 (26.4%) | 209 (73.6%) |
| Health Care & Social Assistance | 192 (32.0%) | 409 (68.0%) |
| Arts, Entertainment & Recreation | 73 (33.5%) | 145 (66.5%) |
| Accommodation & Food Services | 121 (40.1%) | 181 (59.9%) |
| Public Administration | 35 (70.0%) | 15 (30.0%) |
| Total | 3,027 (57.0%) | 2,285 (43.0%) |
Education in Lighthouse Point
School Enrollment in Lighthouse Point
The most common levels of schooling among the 1,711 students in Lighthouse Point are college / undergraduate (479 | 28.0%), middle school (389 | 22.7%), and elementary school (340 | 19.9%).
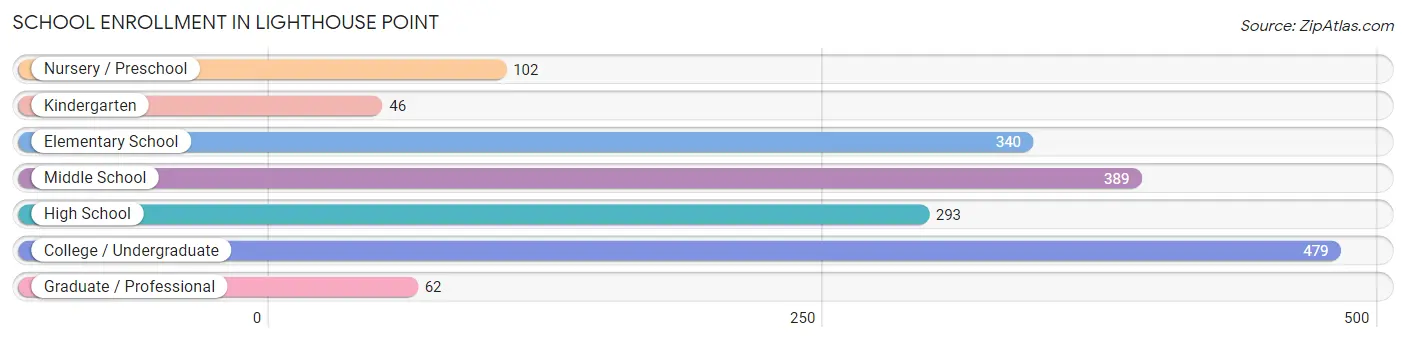
| School Level | # Students | % Students |
| Nursery / Preschool | 102 | 6.0% |
| Kindergarten | 46 | 2.7% |
| Elementary School | 340 | 19.9% |
| Middle School | 389 | 22.7% |
| High School | 293 | 17.1% |
| College / Undergraduate | 479 | 28.0% |
| Graduate / Professional | 62 | 3.6% |
| Total | 1,711 | 100.0% |
School Enrollment by Age by Funding Source in Lighthouse Point
Out of a total of 1,711 students who are enrolled in schools in Lighthouse Point, 678 (39.6%) attend a private institution, while the remaining 1,033 (60.4%) are enrolled in public schools. The age group of 3 to 4 year olds has the highest likelihood of being enrolled in private schools, with 54 (69.2% in the age bracket) enrolled. Conversely, the age group of 18 to 19 year olds has the lowest likelihood of being enrolled in a private school, with 61 (100.0% in the age bracket) attending a public institution.
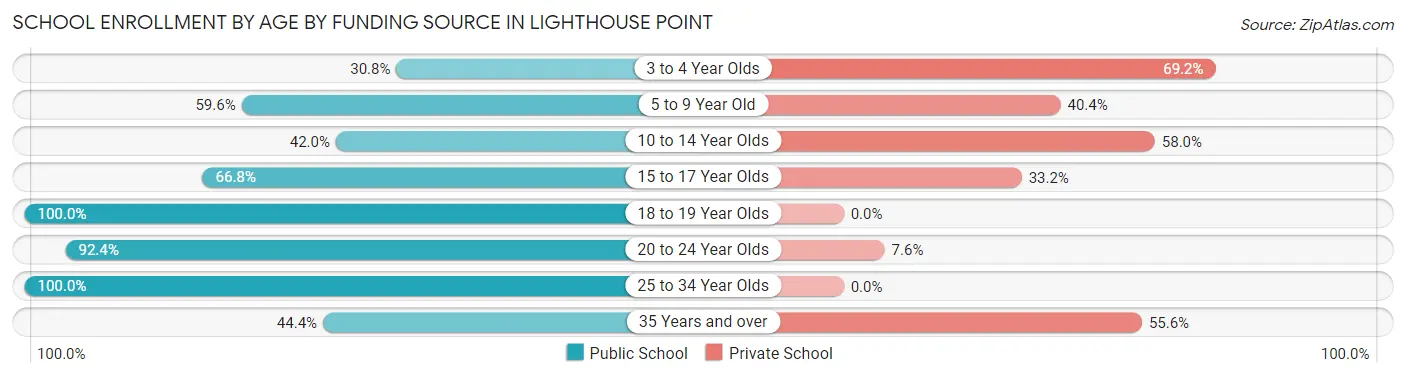
| Age Bracket | Public School | Private School |
| 3 to 4 Year Olds | 24 (30.8%) | 54 (69.2%) |
| 5 to 9 Year Old | 239 (59.6%) | 162 (40.4%) |
| 10 to 14 Year Olds | 190 (42.0%) | 262 (58.0%) |
| 15 to 17 Year Olds | 131 (66.8%) | 65 (33.2%) |
| 18 to 19 Year Olds | 61 (100.0%) | 0 (0.0%) |
| 20 to 24 Year Olds | 242 (92.4%) | 20 (7.6%) |
| 25 to 34 Year Olds | 54 (100.0%) | 0 (0.0%) |
| 35 Years and over | 92 (44.4%) | 115 (55.6%) |
| Total | 1,033 (60.4%) | 678 (39.6%) |
Educational Attainment by Field of Study in Lighthouse Point
Business (1,316 | 27.9%), education (595 | 12.6%), social sciences (453 | 9.6%), science & technology (452 | 9.6%), and psychology (351 | 7.4%) are the most common fields of study among 4,723 individuals in Lighthouse Point who have obtained a bachelor's degree or higher.
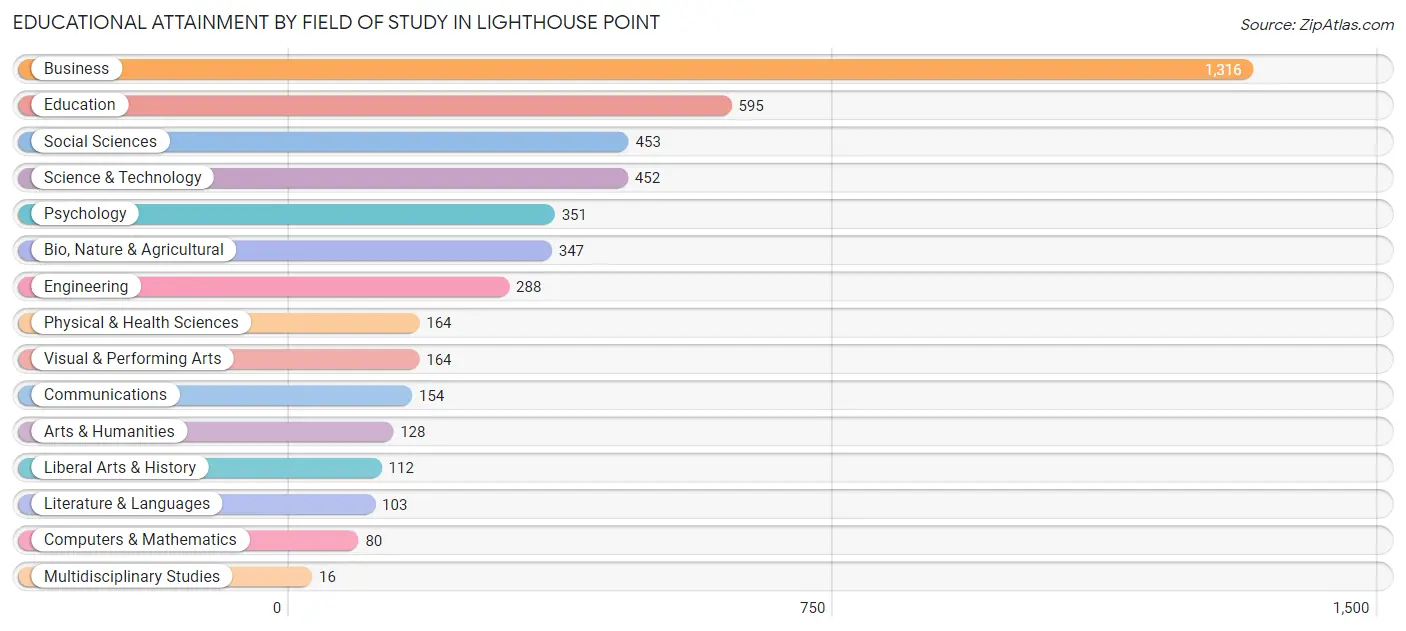
| Field of Study | # Graduates | % Graduates |
| Computers & Mathematics | 80 | 1.7% |
| Bio, Nature & Agricultural | 347 | 7.3% |
| Physical & Health Sciences | 164 | 3.5% |
| Psychology | 351 | 7.4% |
| Social Sciences | 453 | 9.6% |
| Engineering | 288 | 6.1% |
| Multidisciplinary Studies | 16 | 0.3% |
| Science & Technology | 452 | 9.6% |
| Business | 1,316 | 27.9% |
| Education | 595 | 12.6% |
| Literature & Languages | 103 | 2.2% |
| Liberal Arts & History | 112 | 2.4% |
| Visual & Performing Arts | 164 | 3.5% |
| Communications | 154 | 3.3% |
| Arts & Humanities | 128 | 2.7% |
| Total | 4,723 | 100.0% |
Transportation & Commute in Lighthouse Point
Vehicle Availability by Sex in Lighthouse Point
The most prevalent vehicle ownership categories in Lighthouse Point are males with 2 vehicles (1,474, accounting for 49.3%) and females with 2 vehicles (1,086, making up 64.9%).
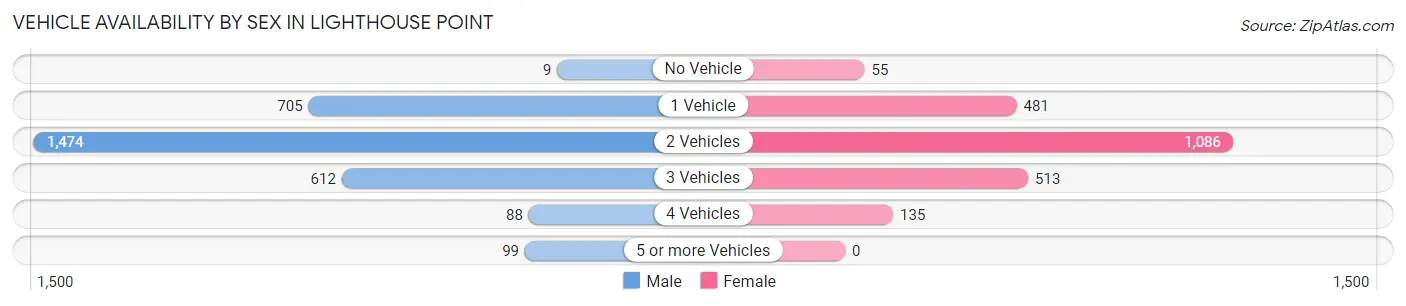
| Vehicles Available | Male | Female |
| No Vehicle | 9 (0.3%) | 55 (2.4%) |
| 1 Vehicle | 705 (23.6%) | 481 (21.2%) |
| 2 Vehicles | 1,474 (49.3%) | 1,086 (47.8%) |
| 3 Vehicles | 612 (20.5%) | 513 (22.6%) |
| 4 Vehicles | 88 (2.9%) | 135 (5.9%) |
| 5 or more Vehicles | 99 (3.3%) | 0 (0.0%) |
| Total | 2,987 (100.0%) | 2,270 (100.0%) |
Commute Time in Lighthouse Point
The most frequently occuring commute durations in Lighthouse Point are 30 to 34 minutes (972 commuters, 20.9%), 15 to 19 minutes (729 commuters, 15.7%), and 45 to 59 minutes (568 commuters, 12.2%).
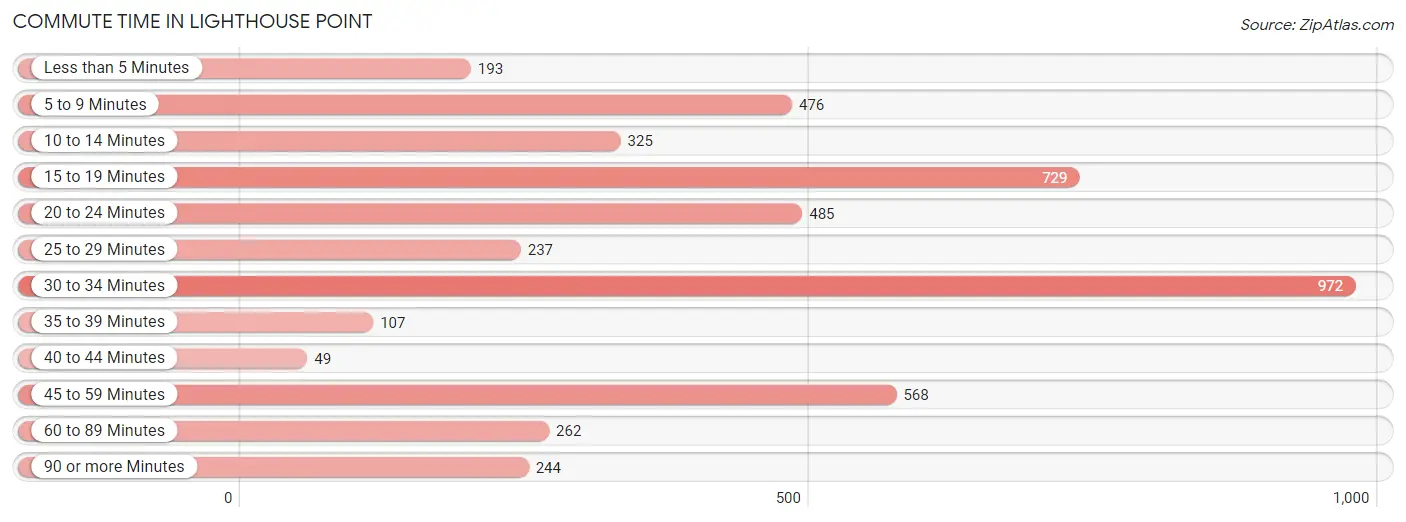
| Commute Time | # Commuters | % Commuters |
| Less than 5 Minutes | 193 | 4.2% |
| 5 to 9 Minutes | 476 | 10.2% |
| 10 to 14 Minutes | 325 | 7.0% |
| 15 to 19 Minutes | 729 | 15.7% |
| 20 to 24 Minutes | 485 | 10.4% |
| 25 to 29 Minutes | 237 | 5.1% |
| 30 to 34 Minutes | 972 | 20.9% |
| 35 to 39 Minutes | 107 | 2.3% |
| 40 to 44 Minutes | 49 | 1.1% |
| 45 to 59 Minutes | 568 | 12.2% |
| 60 to 89 Minutes | 262 | 5.6% |
| 90 or more Minutes | 244 | 5.2% |
Commute Time by Sex in Lighthouse Point
The most common commute times in Lighthouse Point are 30 to 34 minutes (529 commuters, 19.4%) for males and 30 to 34 minutes (443 commuters, 23.0%) for females.
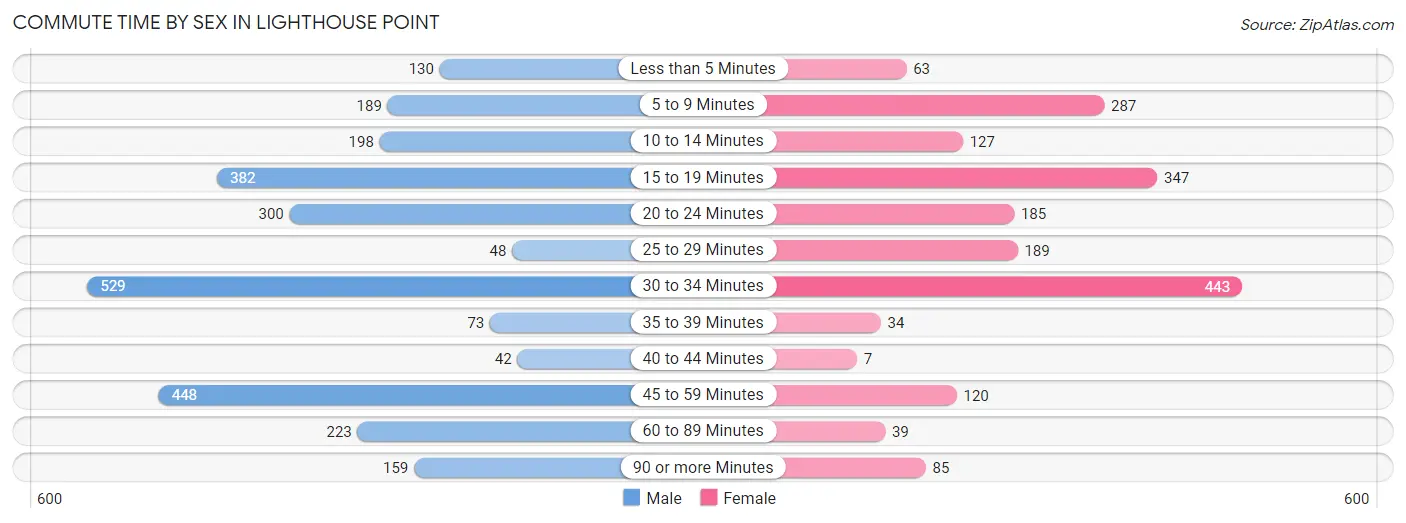
| Commute Time | Male | Female |
| Less than 5 Minutes | 130 (4.8%) | 63 (3.3%) |
| 5 to 9 Minutes | 189 (7.0%) | 287 (14.9%) |
| 10 to 14 Minutes | 198 (7.3%) | 127 (6.6%) |
| 15 to 19 Minutes | 382 (14.0%) | 347 (18.0%) |
| 20 to 24 Minutes | 300 (11.0%) | 185 (9.6%) |
| 25 to 29 Minutes | 48 (1.8%) | 189 (9.8%) |
| 30 to 34 Minutes | 529 (19.4%) | 443 (23.0%) |
| 35 to 39 Minutes | 73 (2.7%) | 34 (1.8%) |
| 40 to 44 Minutes | 42 (1.5%) | 7 (0.4%) |
| 45 to 59 Minutes | 448 (16.5%) | 120 (6.2%) |
| 60 to 89 Minutes | 223 (8.2%) | 39 (2.0%) |
| 90 or more Minutes | 159 (5.8%) | 85 (4.4%) |
Time of Departure to Work by Sex in Lighthouse Point
The most frequent times of departure to work in Lighthouse Point are 8:00 AM to 8:29 AM (746, 27.4%) for males and 8:30 AM to 8:59 AM (281, 14.6%) for females.
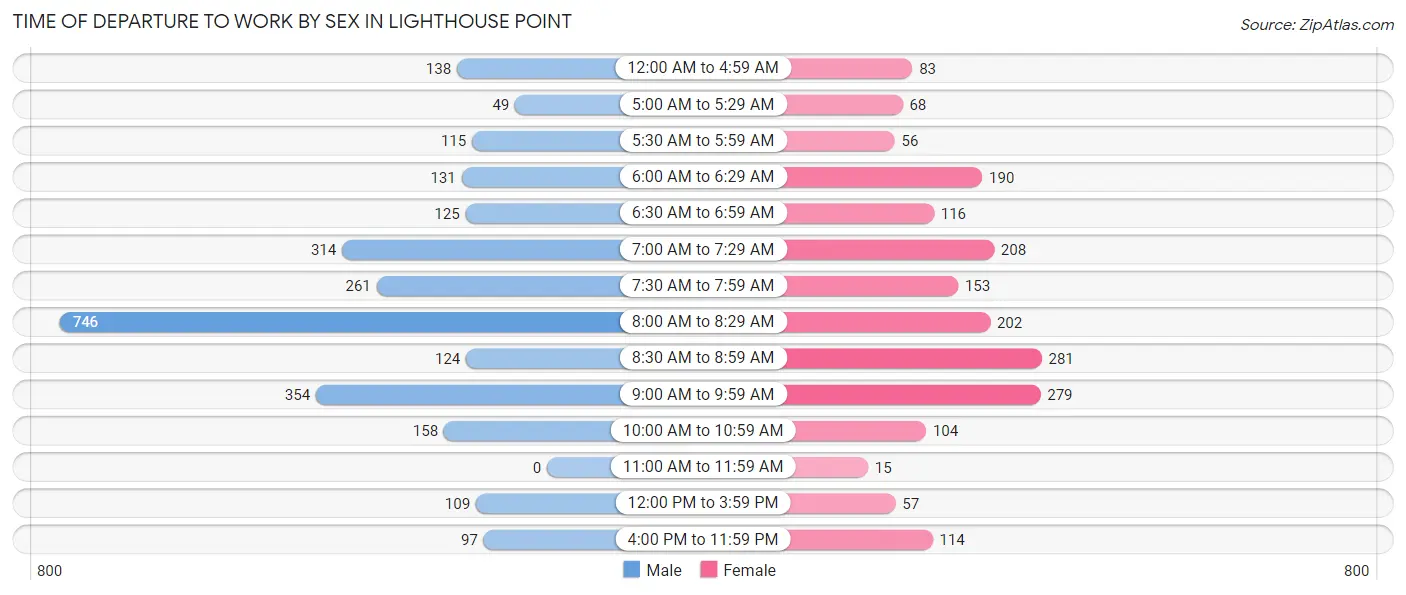
| Time of Departure | Male | Female |
| 12:00 AM to 4:59 AM | 138 (5.1%) | 83 (4.3%) |
| 5:00 AM to 5:29 AM | 49 (1.8%) | 68 (3.5%) |
| 5:30 AM to 5:59 AM | 115 (4.2%) | 56 (2.9%) |
| 6:00 AM to 6:29 AM | 131 (4.8%) | 190 (9.9%) |
| 6:30 AM to 6:59 AM | 125 (4.6%) | 116 (6.0%) |
| 7:00 AM to 7:29 AM | 314 (11.5%) | 208 (10.8%) |
| 7:30 AM to 7:59 AM | 261 (9.6%) | 153 (7.9%) |
| 8:00 AM to 8:29 AM | 746 (27.4%) | 202 (10.5%) |
| 8:30 AM to 8:59 AM | 124 (4.6%) | 281 (14.6%) |
| 9:00 AM to 9:59 AM | 354 (13.0%) | 279 (14.5%) |
| 10:00 AM to 10:59 AM | 158 (5.8%) | 104 (5.4%) |
| 11:00 AM to 11:59 AM | 0 (0.0%) | 15 (0.8%) |
| 12:00 PM to 3:59 PM | 109 (4.0%) | 57 (3.0%) |
| 4:00 PM to 11:59 PM | 97 (3.6%) | 114 (5.9%) |
| Total | 2,721 (100.0%) | 1,926 (100.0%) |
Housing Occupancy in Lighthouse Point
Occupancy by Ownership in Lighthouse Point
Of the total 5,315 dwellings in Lighthouse Point, owner-occupied units account for 4,329 (81.5%), while renter-occupied units make up 986 (18.5%).
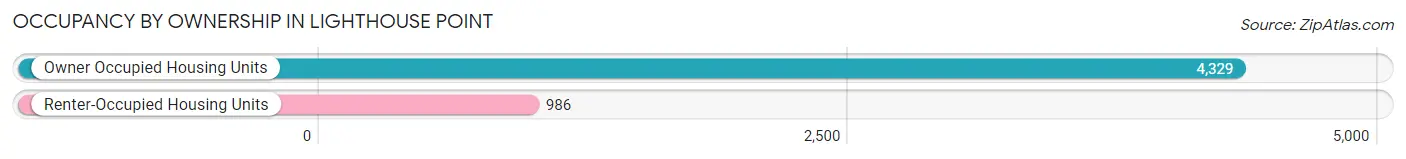
| Occupancy | # Housing Units | % Housing Units |
| Owner Occupied Housing Units | 4,329 | 81.5% |
| Renter-Occupied Housing Units | 986 | 18.5% |
| Total Occupied Housing Units | 5,315 | 100.0% |
Occupancy by Household Size in Lighthouse Point
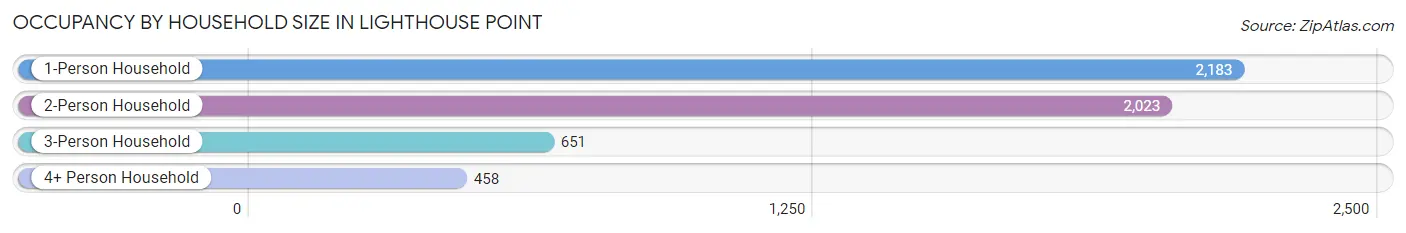
| Household Size | # Housing Units | % Housing Units |
| 1-Person Household | 2,183 | 41.1% |
| 2-Person Household | 2,023 | 38.1% |
| 3-Person Household | 651 | 12.2% |
| 4+ Person Household | 458 | 8.6% |
| Total Housing Units | 5,315 | 100.0% |
Occupancy by Ownership by Household Size in Lighthouse Point
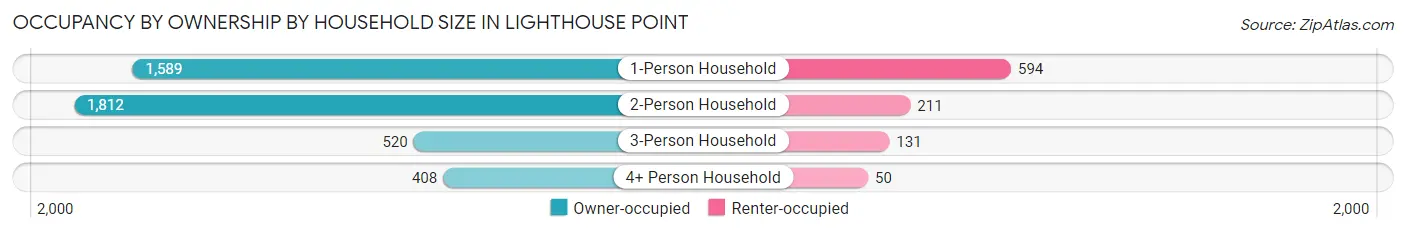
| Household Size | Owner-occupied | Renter-occupied |
| 1-Person Household | 1,589 (72.8%) | 594 (27.2%) |
| 2-Person Household | 1,812 (89.6%) | 211 (10.4%) |
| 3-Person Household | 520 (79.9%) | 131 (20.1%) |
| 4+ Person Household | 408 (89.1%) | 50 (10.9%) |
| Total Housing Units | 4,329 (81.5%) | 986 (18.5%) |
Occupancy by Educational Attainment in Lighthouse Point
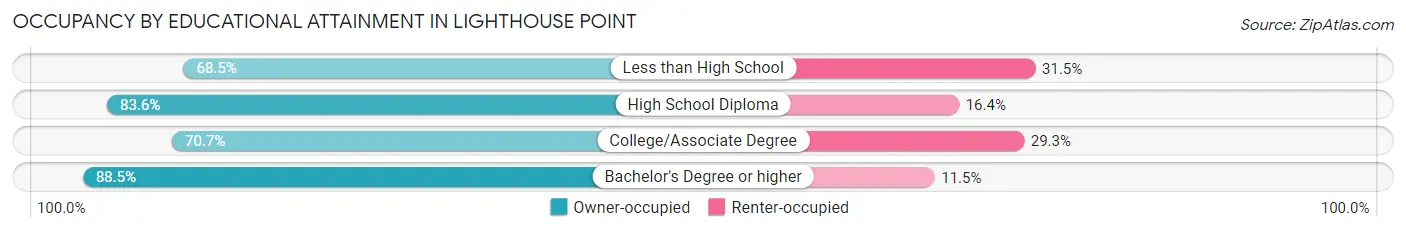
| Household Size | Owner-occupied | Renter-occupied |
| Less than High School | 100 (68.5%) | 46 (31.5%) |
| High School Diploma | 700 (83.6%) | 137 (16.4%) |
| College/Associate Degree | 1,211 (70.7%) | 501 (29.3%) |
| Bachelor's Degree or higher | 2,318 (88.5%) | 302 (11.5%) |
Occupancy by Age of Householder in Lighthouse Point
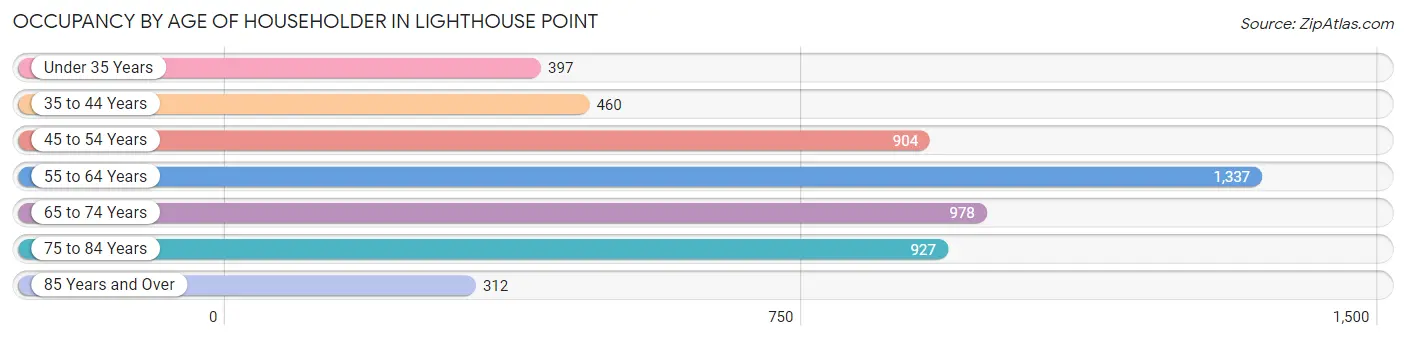
| Age Bracket | # Households | % Households |
| Under 35 Years | 397 | 7.5% |
| 35 to 44 Years | 460 | 8.6% |
| 45 to 54 Years | 904 | 17.0% |
| 55 to 64 Years | 1,337 | 25.2% |
| 65 to 74 Years | 978 | 18.4% |
| 75 to 84 Years | 927 | 17.4% |
| 85 Years and Over | 312 | 5.9% |
| Total | 5,315 | 100.0% |
Housing Finances in Lighthouse Point
Median Income by Occupancy in Lighthouse Point
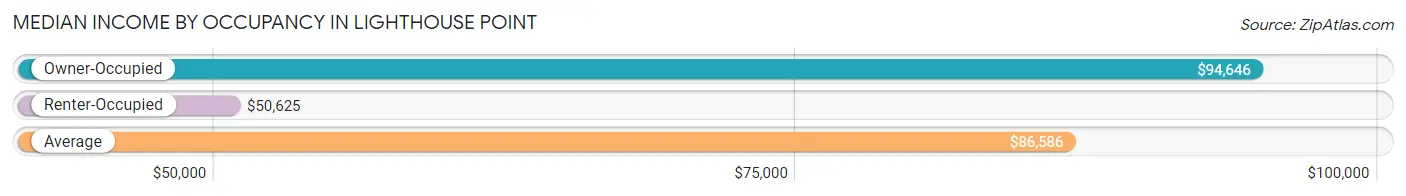
| Occupancy Type | # Households | Median Income |
| Owner-Occupied | 4,329 (81.5%) | $94,646 |
| Renter-Occupied | 986 (18.5%) | $50,625 |
| Average | 5,315 (100.0%) | $86,586 |
Occupancy by Householder Income Bracket in Lighthouse Point
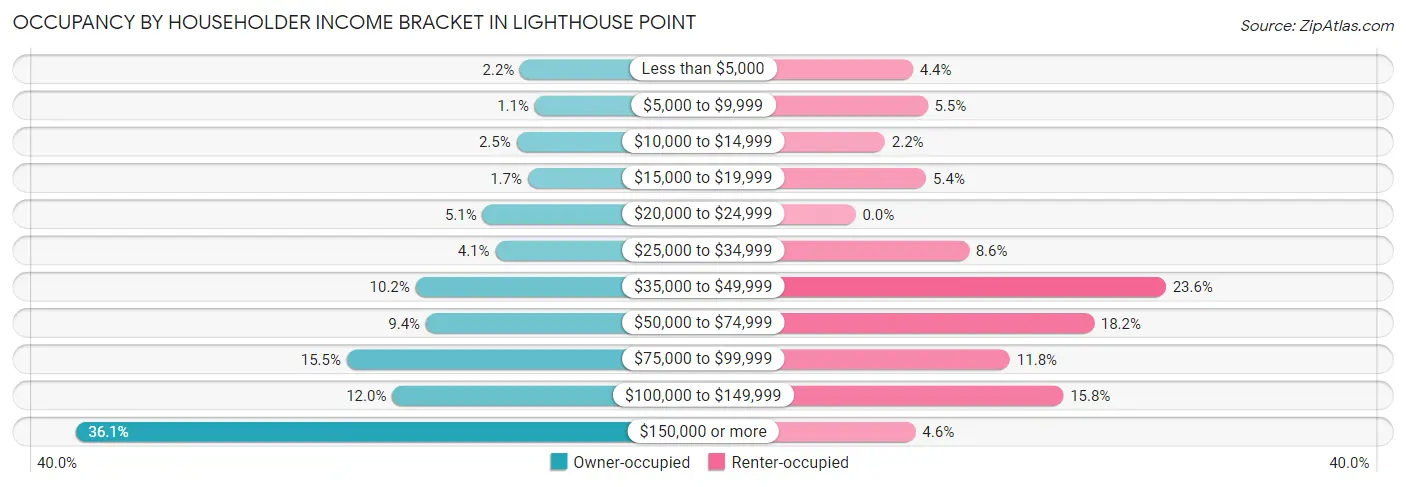
| Income Bracket | Owner-occupied | Renter-occupied |
| Less than $5,000 | 97 (2.2%) | 43 (4.4%) |
| $5,000 to $9,999 | 49 (1.1%) | 54 (5.5%) |
| $10,000 to $14,999 | 109 (2.5%) | 22 (2.2%) |
| $15,000 to $19,999 | 72 (1.7%) | 53 (5.4%) |
| $20,000 to $24,999 | 221 (5.1%) | 0 (0.0%) |
| $25,000 to $34,999 | 179 (4.1%) | 85 (8.6%) |
| $35,000 to $49,999 | 442 (10.2%) | 233 (23.6%) |
| $50,000 to $74,999 | 408 (9.4%) | 179 (18.1%) |
| $75,000 to $99,999 | 669 (15.4%) | 116 (11.8%) |
| $100,000 to $149,999 | 519 (12.0%) | 156 (15.8%) |
| $150,000 or more | 1,564 (36.1%) | 45 (4.6%) |
| Total | 4,329 (100.0%) | 986 (100.0%) |
Monthly Housing Cost Tiers in Lighthouse Point
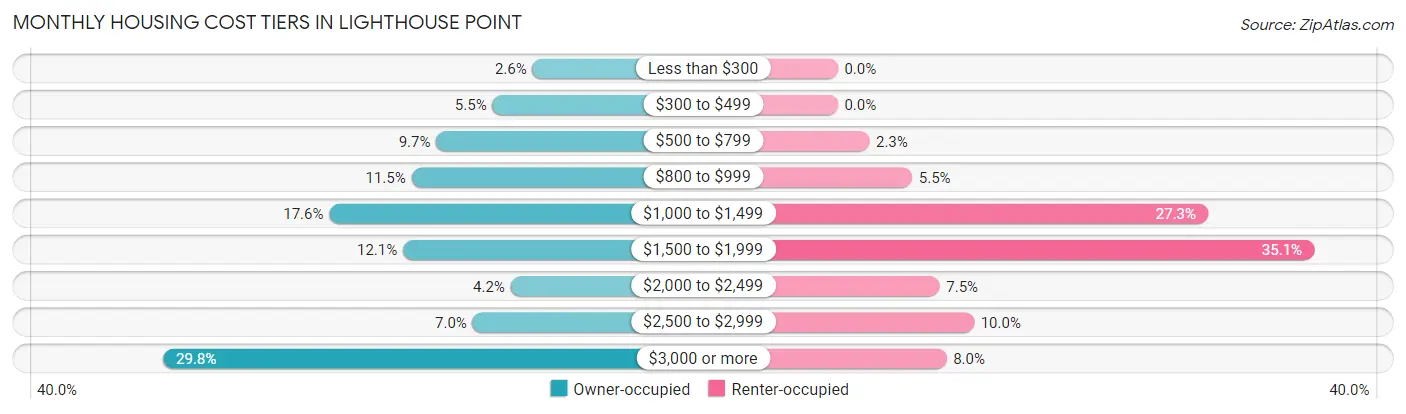
| Monthly Cost | Owner-occupied | Renter-occupied |
| Less than $300 | 112 (2.6%) | 0 (0.0%) |
| $300 to $499 | 240 (5.5%) | 0 (0.0%) |
| $500 to $799 | 419 (9.7%) | 23 (2.3%) |
| $800 to $999 | 498 (11.5%) | 54 (5.5%) |
| $1,000 to $1,499 | 760 (17.6%) | 269 (27.3%) |
| $1,500 to $1,999 | 525 (12.1%) | 346 (35.1%) |
| $2,000 to $2,499 | 182 (4.2%) | 74 (7.5%) |
| $2,500 to $2,999 | 303 (7.0%) | 99 (10.0%) |
| $3,000 or more | 1,290 (29.8%) | 79 (8.0%) |
| Total | 4,329 (100.0%) | 986 (100.0%) |
Physical Housing Characteristics in Lighthouse Point
Housing Structures in Lighthouse Point
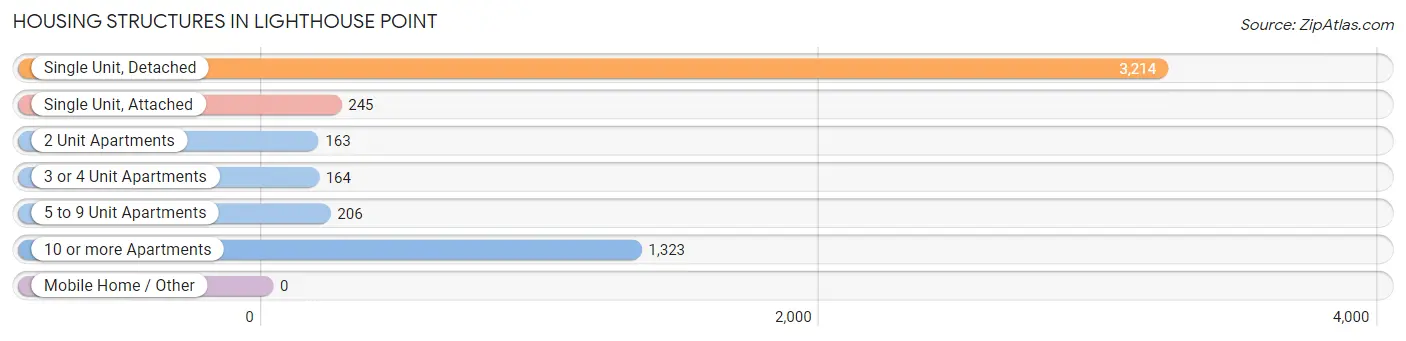
| Structure Type | # Housing Units | % Housing Units |
| Single Unit, Detached | 3,214 | 60.5% |
| Single Unit, Attached | 245 | 4.6% |
| 2 Unit Apartments | 163 | 3.1% |
| 3 or 4 Unit Apartments | 164 | 3.1% |
| 5 to 9 Unit Apartments | 206 | 3.9% |
| 10 or more Apartments | 1,323 | 24.9% |
| Mobile Home / Other | 0 | 0.0% |
| Total | 5,315 | 100.0% |
Housing Structures by Occupancy in Lighthouse Point
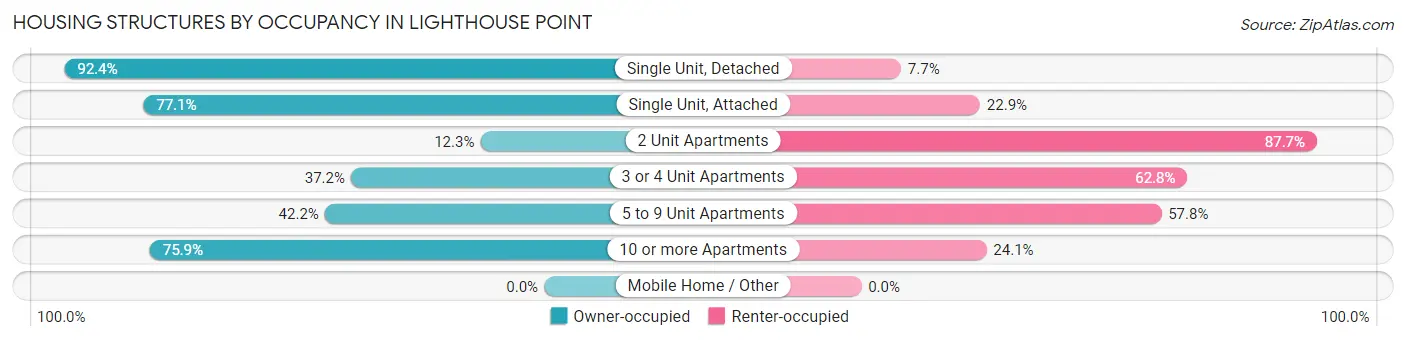
| Structure Type | Owner-occupied | Renter-occupied |
| Single Unit, Detached | 2,968 (92.3%) | 246 (7.6%) |
| Single Unit, Attached | 189 (77.1%) | 56 (22.9%) |
| 2 Unit Apartments | 20 (12.3%) | 143 (87.7%) |
| 3 or 4 Unit Apartments | 61 (37.2%) | 103 (62.8%) |
| 5 to 9 Unit Apartments | 87 (42.2%) | 119 (57.8%) |
| 10 or more Apartments | 1,004 (75.9%) | 319 (24.1%) |
| Mobile Home / Other | 0 (0.0%) | 0 (0.0%) |
| Total | 4,329 (81.5%) | 986 (18.5%) |
Housing Structures by Number of Rooms in Lighthouse Point
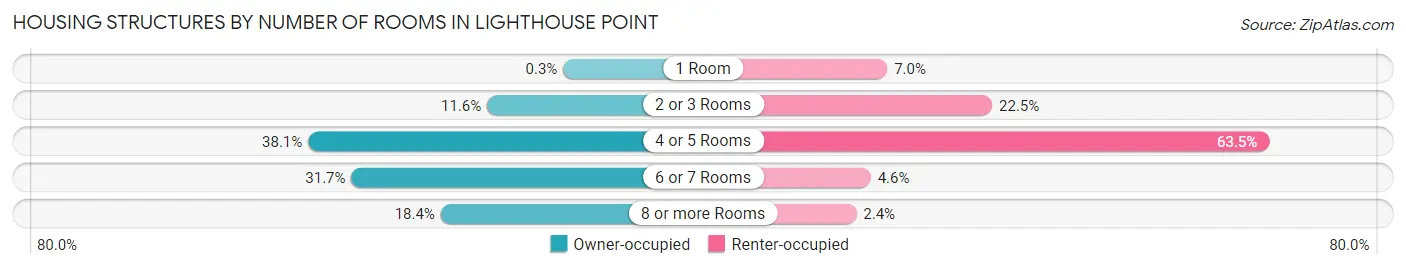
| Number of Rooms | Owner-occupied | Renter-occupied |
| 1 Room | 13 (0.3%) | 69 (7.0%) |
| 2 or 3 Rooms | 501 (11.6%) | 222 (22.5%) |
| 4 or 5 Rooms | 1,647 (38.1%) | 626 (63.5%) |
| 6 or 7 Rooms | 1,370 (31.7%) | 45 (4.6%) |
| 8 or more Rooms | 798 (18.4%) | 24 (2.4%) |
| Total | 4,329 (100.0%) | 986 (100.0%) |
Housing Structure by Heating Type in Lighthouse Point
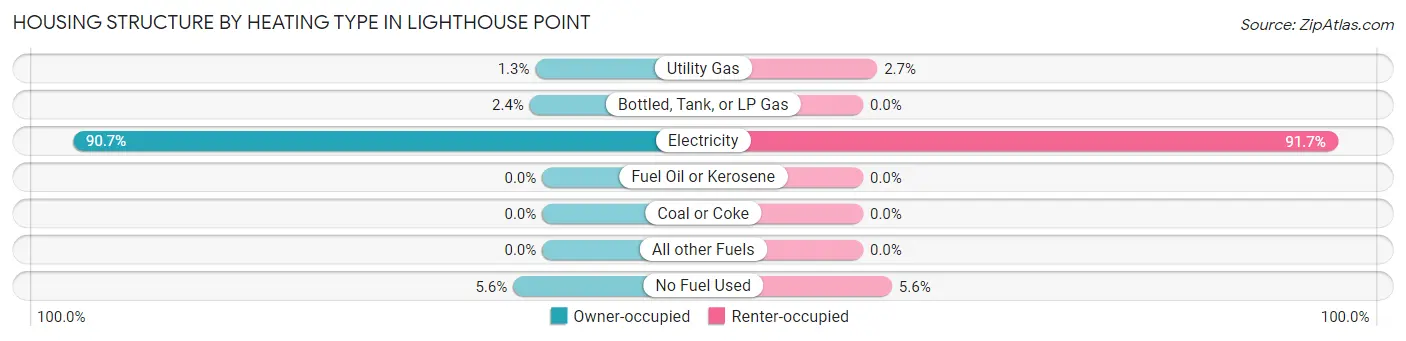
| Heating Type | Owner-occupied | Renter-occupied |
| Utility Gas | 57 (1.3%) | 27 (2.7%) |
| Bottled, Tank, or LP Gas | 104 (2.4%) | 0 (0.0%) |
| Electricity | 3,925 (90.7%) | 904 (91.7%) |
| Fuel Oil or Kerosene | 0 (0.0%) | 0 (0.0%) |
| Coal or Coke | 0 (0.0%) | 0 (0.0%) |
| All other Fuels | 0 (0.0%) | 0 (0.0%) |
| No Fuel Used | 243 (5.6%) | 55 (5.6%) |
| Total | 4,329 (100.0%) | 986 (100.0%) |
Household Vehicle Usage in Lighthouse Point
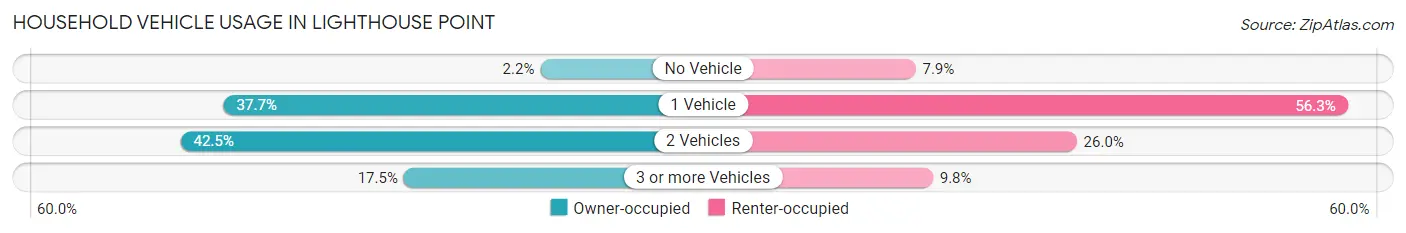
| Vehicles per Household | Owner-occupied | Renter-occupied |
| No Vehicle | 97 (2.2%) | 78 (7.9%) |
| 1 Vehicle | 1,632 (37.7%) | 555 (56.3%) |
| 2 Vehicles | 1,841 (42.5%) | 256 (26.0%) |
| 3 or more Vehicles | 759 (17.5%) | 97 (9.8%) |
| Total | 4,329 (100.0%) | 986 (100.0%) |
Real Estate & Mortgages in Lighthouse Point
Real Estate and Mortgage Overview in Lighthouse Point
| Characteristic | Without Mortgage | With Mortgage |
| Housing Units | 2,249 | 2,080 |
| Median Property Value | $533,100 | $680,300 |
| Median Household Income | $86,518 | $986 |
| Monthly Housing Costs | $956 | $1,160 |
| Real Estate Taxes | $4,881 | $52 |
Property Value by Mortgage Status in Lighthouse Point
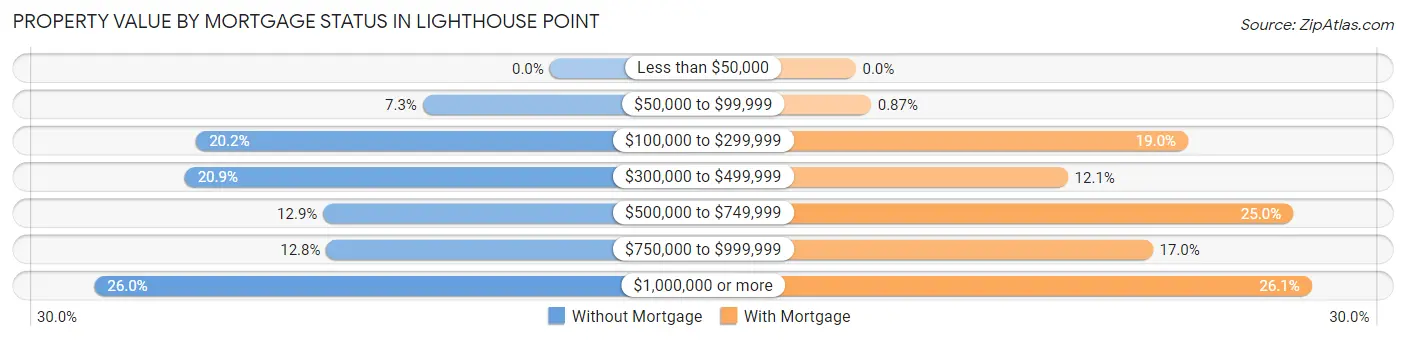
| Property Value | Without Mortgage | With Mortgage |
| Less than $50,000 | 0 (0.0%) | 0 (0.0%) |
| $50,000 to $99,999 | 163 (7.2%) | 18 (0.9%) |
| $100,000 to $299,999 | 454 (20.2%) | 395 (19.0%) |
| $300,000 to $499,999 | 469 (20.8%) | 252 (12.1%) |
| $500,000 to $749,999 | 291 (12.9%) | 520 (25.0%) |
| $750,000 to $999,999 | 287 (12.8%) | 353 (17.0%) |
| $1,000,000 or more | 585 (26.0%) | 542 (26.1%) |
| Total | 2,249 (100.0%) | 2,080 (100.0%) |
Household Income by Mortgage Status in Lighthouse Point
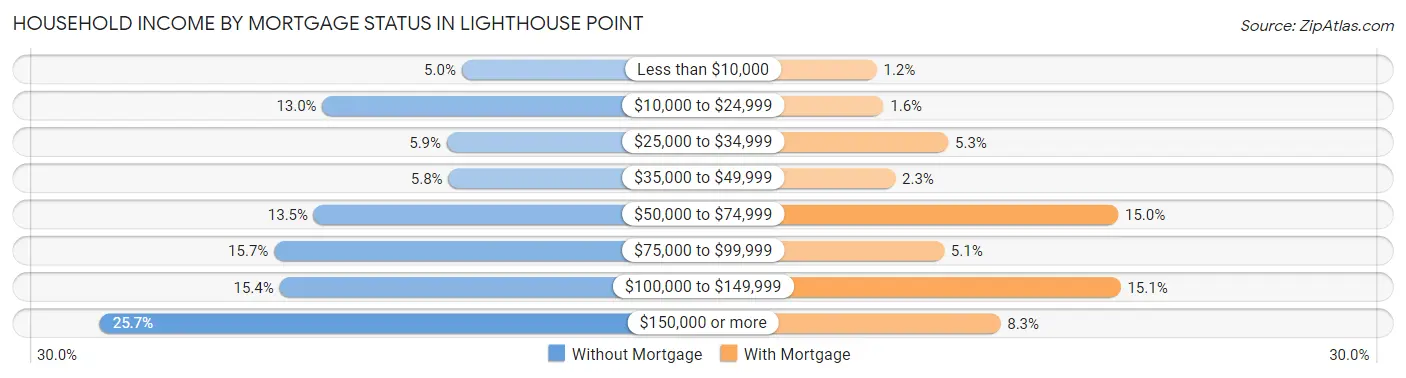
| Household Income | Without Mortgage | With Mortgage |
| Less than $10,000 | 113 (5.0%) | 25 (1.2%) |
| $10,000 to $24,999 | 292 (13.0%) | 33 (1.6%) |
| $25,000 to $34,999 | 132 (5.9%) | 110 (5.3%) |
| $35,000 to $49,999 | 130 (5.8%) | 47 (2.3%) |
| $50,000 to $74,999 | 303 (13.5%) | 312 (15.0%) |
| $75,000 to $99,999 | 354 (15.7%) | 105 (5.1%) |
| $100,000 to $149,999 | 347 (15.4%) | 315 (15.1%) |
| $150,000 or more | 578 (25.7%) | 172 (8.3%) |
| Total | 2,249 (100.0%) | 2,080 (100.0%) |
Property Value to Household Income Ratio in Lighthouse Point
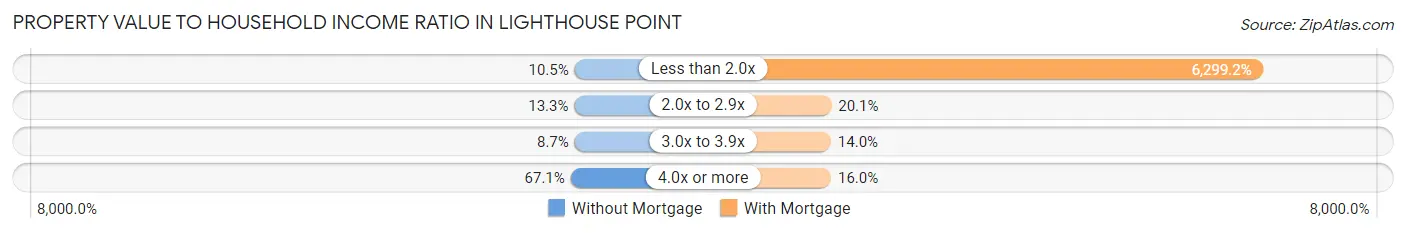
| Value-to-Income Ratio | Without Mortgage | With Mortgage |
| Less than 2.0x | 235 (10.4%) | 131,023 (6,299.2%) |
| 2.0x to 2.9x | 298 (13.3%) | 417 (20.1%) |
| 3.0x to 3.9x | 195 (8.7%) | 292 (14.0%) |
| 4.0x or more | 1,510 (67.1%) | 333 (16.0%) |
| Total | 2,249 (100.0%) | 2,080 (100.0%) |
Real Estate Taxes by Mortgage Status in Lighthouse Point

| Property Taxes | Without Mortgage | With Mortgage |
| Less than $800 | 228 (10.1%) | 13 (0.6%) |
| $800 to $1,499 | 121 (5.4%) | 50 (2.4%) |
| $800 to $1,499 | 1,861 (82.8%) | 105 (5.1%) |
| Total | 2,249 (100.0%) | 2,080 (100.0%) |
Health & Disability in Lighthouse Point
Health Insurance Coverage by Age in Lighthouse Point
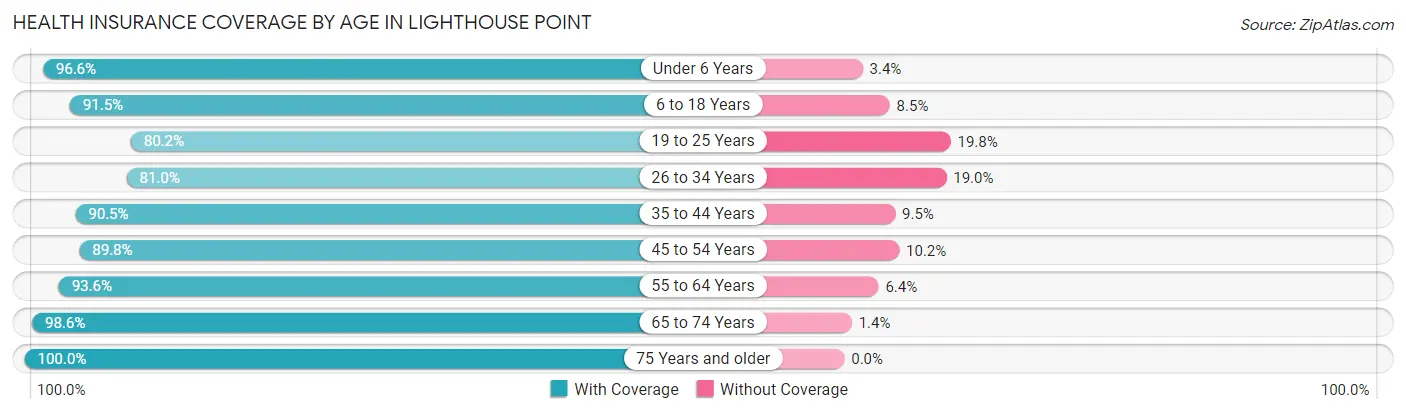
| Age Bracket | With Coverage | Without Coverage |
| Under 6 Years | 396 (96.6%) | 14 (3.4%) |
| 6 to 18 Years | 974 (91.5%) | 90 (8.5%) |
| 19 to 25 Years | 429 (80.2%) | 106 (19.8%) |
| 26 to 34 Years | 481 (81.0%) | 113 (19.0%) |
| 35 to 44 Years | 813 (90.5%) | 85 (9.5%) |
| 45 to 54 Years | 1,519 (89.8%) | 173 (10.2%) |
| 55 to 64 Years | 2,131 (93.6%) | 145 (6.4%) |
| 65 to 74 Years | 1,424 (98.6%) | 20 (1.4%) |
| 75 Years and older | 1,583 (100.0%) | 0 (0.0%) |
| Total | 9,750 (92.9%) | 746 (7.1%) |
Health Insurance Coverage by Citizenship Status in Lighthouse Point
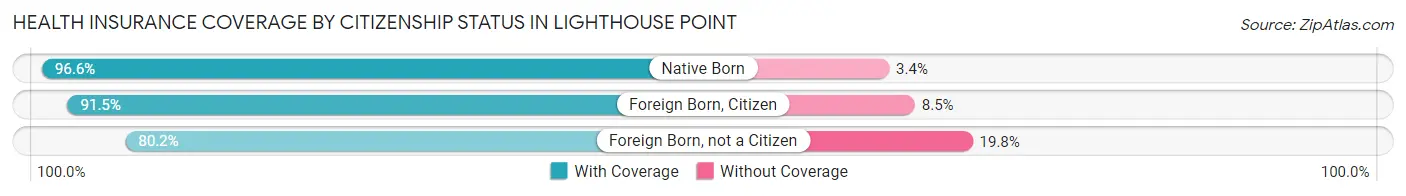
| Citizenship Status | With Coverage | Without Coverage |
| Native Born | 396 (96.6%) | 14 (3.4%) |
| Foreign Born, Citizen | 974 (91.5%) | 90 (8.5%) |
| Foreign Born, not a Citizen | 429 (80.2%) | 106 (19.8%) |
Health Insurance Coverage by Household Income in Lighthouse Point
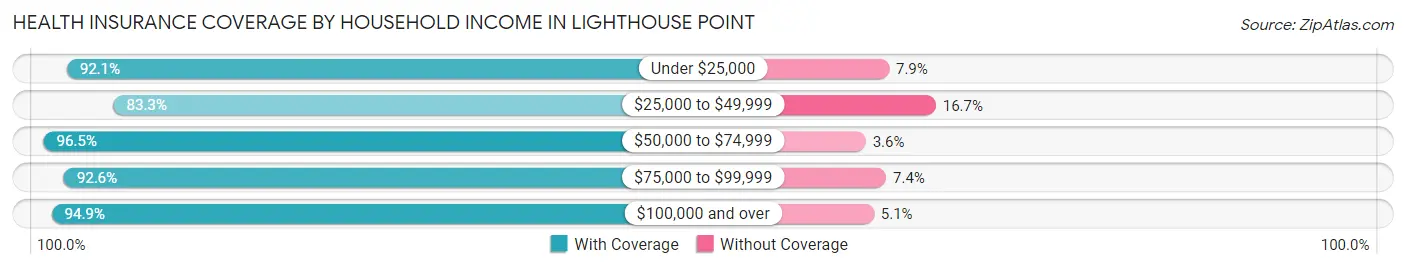
| Household Income | With Coverage | Without Coverage |
| Under $25,000 | 780 (92.1%) | 67 (7.9%) |
| $25,000 to $49,999 | 1,179 (83.3%) | 236 (16.7%) |
| $50,000 to $74,999 | 923 (96.5%) | 34 (3.5%) |
| $75,000 to $99,999 | 1,612 (92.6%) | 128 (7.4%) |
| $100,000 and over | 5,256 (94.9%) | 281 (5.1%) |
Public vs Private Health Insurance Coverage by Age in Lighthouse Point
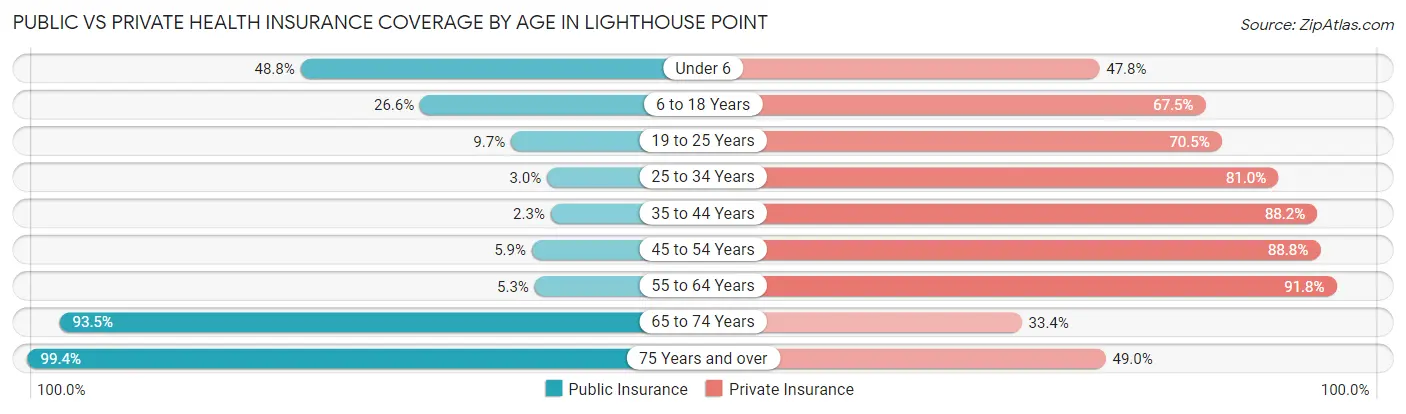
| Age Bracket | Public Insurance | Private Insurance |
| Under 6 | 200 (48.8%) | 196 (47.8%) |
| 6 to 18 Years | 283 (26.6%) | 718 (67.5%) |
| 19 to 25 Years | 52 (9.7%) | 377 (70.5%) |
| 25 to 34 Years | 18 (3.0%) | 481 (81.0%) |
| 35 to 44 Years | 21 (2.3%) | 792 (88.2%) |
| 45 to 54 Years | 99 (5.9%) | 1,502 (88.8%) |
| 55 to 64 Years | 121 (5.3%) | 2,089 (91.8%) |
| 65 to 74 Years | 1,350 (93.5%) | 482 (33.4%) |
| 75 Years and over | 1,574 (99.4%) | 775 (49.0%) |
| Total | 3,718 (35.4%) | 7,412 (70.6%) |
Disability Status by Sex by Age in Lighthouse Point
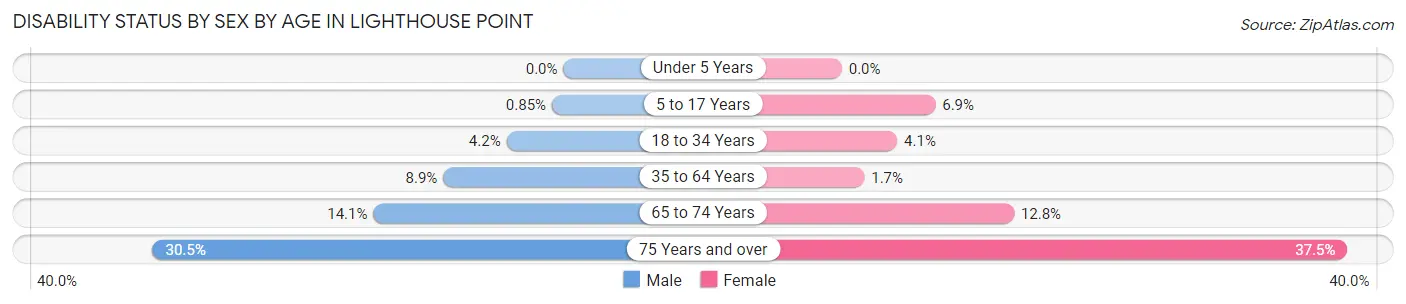
| Age Bracket | Male | Female |
| Under 5 Years | 0 (0.0%) | 0 (0.0%) |
| 5 to 17 Years | 5 (0.9%) | 35 (6.9%) |
| 18 to 34 Years | 22 (4.2%) | 26 (4.1%) |
| 35 to 64 Years | 231 (8.9%) | 38 (1.7%) |
| 65 to 74 Years | 90 (14.1%) | 103 (12.8%) |
| 75 Years and over | 248 (30.5%) | 289 (37.5%) |
Disability Class by Sex by Age in Lighthouse Point
Disability Class: Hearing Difficulty
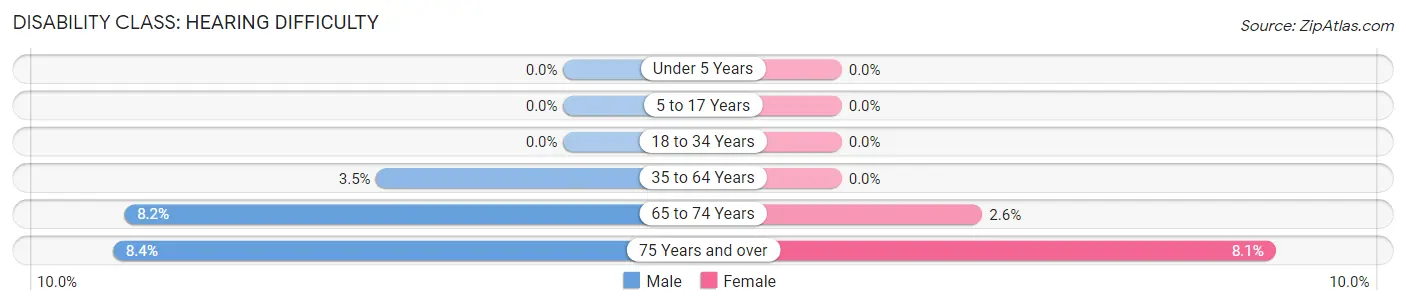
| Age Bracket | Male | Female |
| Under 5 Years | 0 (0.0%) | 0 (0.0%) |
| 5 to 17 Years | 0 (0.0%) | 0 (0.0%) |
| 18 to 34 Years | 0 (0.0%) | 0 (0.0%) |
| 35 to 64 Years | 90 (3.5%) | 0 (0.0%) |
| 65 to 74 Years | 52 (8.2%) | 21 (2.6%) |
| 75 Years and over | 68 (8.4%) | 62 (8.1%) |
Disability Class: Vision Difficulty
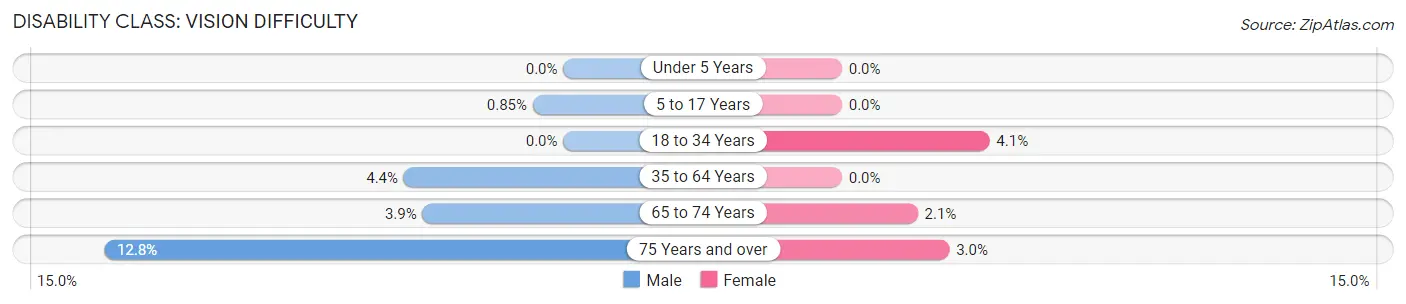
| Age Bracket | Male | Female |
| Under 5 Years | 0 (0.0%) | 0 (0.0%) |
| 5 to 17 Years | 5 (0.9%) | 0 (0.0%) |
| 18 to 34 Years | 0 (0.0%) | 26 (4.1%) |
| 35 to 64 Years | 115 (4.4%) | 0 (0.0%) |
| 65 to 74 Years | 25 (3.9%) | 17 (2.1%) |
| 75 Years and over | 104 (12.8%) | 23 (3.0%) |
Disability Class: Cognitive Difficulty
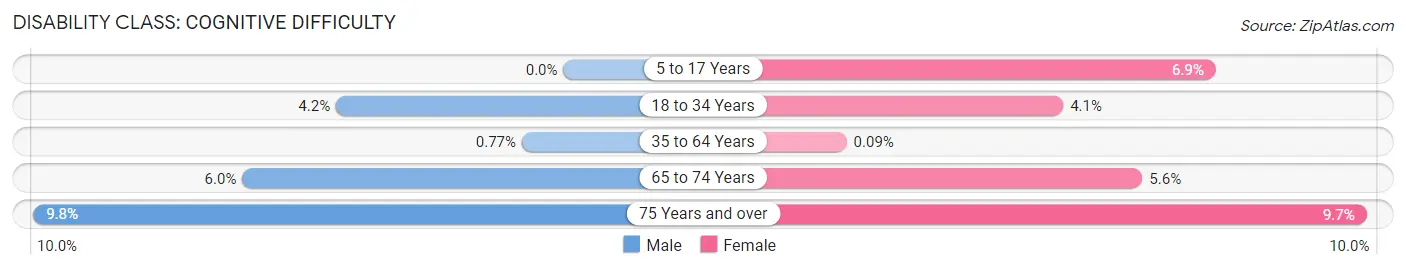
| Age Bracket | Male | Female |
| 5 to 17 Years | 0 (0.0%) | 35 (6.9%) |
| 18 to 34 Years | 22 (4.2%) | 26 (4.1%) |
| 35 to 64 Years | 20 (0.8%) | 2 (0.1%) |
| 65 to 74 Years | 38 (6.0%) | 45 (5.6%) |
| 75 Years and over | 80 (9.8%) | 75 (9.7%) |
Disability Class: Ambulatory Difficulty
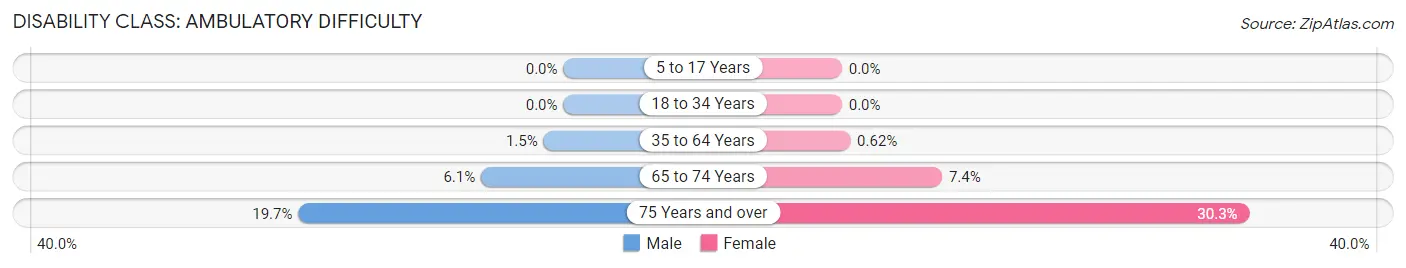
| Age Bracket | Male | Female |
| 5 to 17 Years | 0 (0.0%) | 0 (0.0%) |
| 18 to 34 Years | 0 (0.0%) | 0 (0.0%) |
| 35 to 64 Years | 38 (1.5%) | 14 (0.6%) |
| 65 to 74 Years | 39 (6.1%) | 60 (7.4%) |
| 75 Years and over | 160 (19.7%) | 233 (30.3%) |
Disability Class: Self-Care Difficulty
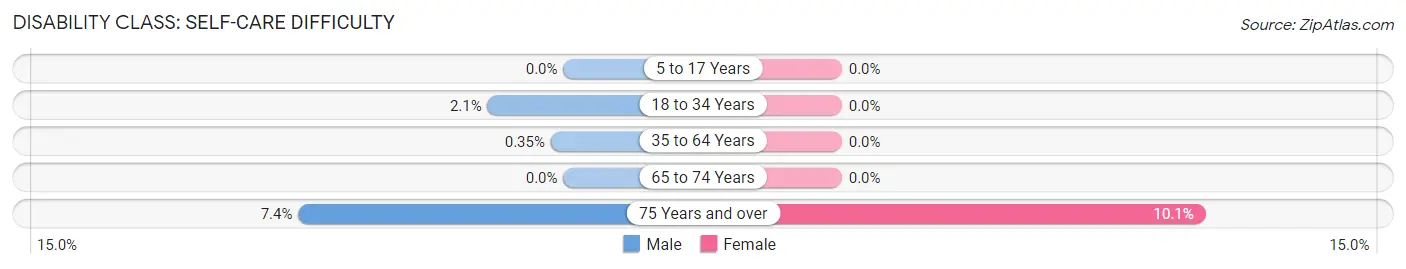
| Age Bracket | Male | Female |
| 5 to 17 Years | 0 (0.0%) | 0 (0.0%) |
| 18 to 34 Years | 11 (2.1%) | 0 (0.0%) |
| 35 to 64 Years | 9 (0.4%) | 0 (0.0%) |
| 65 to 74 Years | 0 (0.0%) | 0 (0.0%) |
| 75 Years and over | 60 (7.4%) | 78 (10.1%) |
Technology Access in Lighthouse Point
Computing Device Access in Lighthouse Point
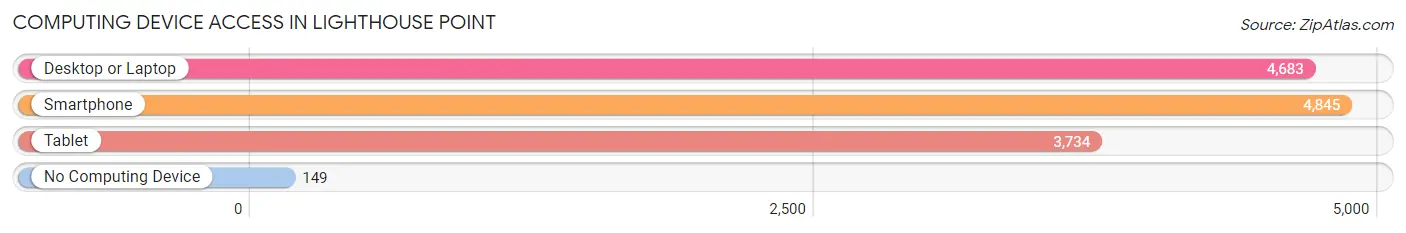
| Device Type | # Households | % Households |
| Desktop or Laptop | 4,683 | 88.1% |
| Smartphone | 4,845 | 91.2% |
| Tablet | 3,734 | 70.3% |
| No Computing Device | 149 | 2.8% |
| Total | 5,315 | 100.0% |
Internet Access in Lighthouse Point
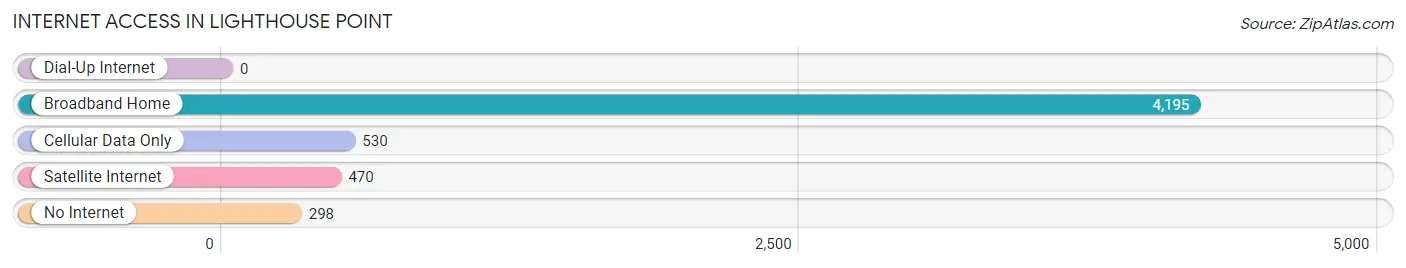
| Internet Type | # Households | % Households |
| Dial-Up Internet | 0 | 0.0% |
| Broadband Home | 4,195 | 78.9% |
| Cellular Data Only | 530 | 10.0% |
| Satellite Internet | 470 | 8.8% |
| No Internet | 298 | 5.6% |
| Total | 5,315 | 100.0% |
Lighthouse Point Summary
Lighthouse Point is a city located in Broward County, Florida, United States. The city is situated on the Intracoastal Waterway, just north of Pompano Beach and south of Deerfield Beach. The city was incorporated in 1956 and has a population of 10,344 as of the 2010 census.
History
The area that is now Lighthouse Point was originally inhabited by the Tequesta Indians. The first settlers in the area were the Blount family, who arrived in the late 1800s. The family built a lighthouse on the Intracoastal Waterway, which gave the city its name.
In the early 1900s, the area began to attract more settlers, and the city was officially incorporated in 1956. The city was originally a farming community, but it soon began to attract more tourists and businesses.
Geography
Lighthouse Point is located in southeastern Florida, in Broward County. The city is situated on the Intracoastal Waterway, just north of Pompano Beach and south of Deerfield Beach. The city covers an area of 4.2 square miles and has a population of 10,344 as of the 2010 census.
The city is bordered by the Atlantic Ocean to the east, the Intracoastal Waterway to the west, and the Hillsboro Canal to the north. The city is home to several parks, including Frank McDonough Park, which features a playground, picnic area, and basketball court.
Economy
The economy of Lighthouse Point is largely based on tourism and retail. The city is home to several hotels, restaurants, and shops, as well as a marina. The city also has a thriving real estate market, with many homes and condos available for purchase.
The city is also home to several businesses, including a number of medical and dental offices, as well as a variety of professional services. The city is also home to a number of manufacturing and distribution companies.
Demographics
As of the 2010 census, the population of Lighthouse Point was 10,344. The racial makeup of the city was 87.3% White, 4.2% African American, 0.3% Native American, 2.2% Asian, 0.1% Pacific Islander, 3.7% from other races, and 2.4% from two or more races. Hispanic or Latino of any race were 11.2% of the population.
The median income for a household in the city was $60,945, and the median income for a family was $71,945. The per capita income for the city was $35,945. About 4.2% of families and 5.7% of the population were below the poverty line, including 6.3% of those under age 18 and 4.2% of those age 65 or over.
Common Questions
What is Per Capita Income in Lighthouse Point?
Per Capita income in Lighthouse Point is $78,250.
What is the Median Family Income in Lighthouse Point?
Median Family Income in Lighthouse Point is $126,616.
What is the Median Household income in Lighthouse Point?
Median Household Income in Lighthouse Point is $86,586.
What is Income or Wage Gap in Lighthouse Point?
Income or Wage Gap in Lighthouse Point is 50.8%.
Women in Lighthouse Point earn 49.2 cents for every dollar earned by a man.
What is Inequality or Gini Index in Lighthouse Point?
Inequality or Gini Index in Lighthouse Point is 0.55.
What is the Total Population of Lighthouse Point?
Total Population of Lighthouse Point is 10,496.
What is the Total Male Population of Lighthouse Point?
Total Male Population of Lighthouse Point is 5,288.
What is the Total Female Population of Lighthouse Point?
Total Female Population of Lighthouse Point is 5,208.
What is the Ratio of Males per 100 Females in Lighthouse Point?
There are 101.54 Males per 100 Females in Lighthouse Point.
What is the Ratio of Females per 100 Males in Lighthouse Point?
There are 98.49 Females per 100 Males in Lighthouse Point.
What is the Median Population Age in Lighthouse Point?
Median Population Age in Lighthouse Point is 55.2 Years.
What is the Average Family Size in Lighthouse Point
Average Family Size in Lighthouse Point is 2.6 People.
What is the Average Household Size in Lighthouse Point
Average Household Size in Lighthouse Point is 2.0 People.
How Large is the Labor Force in Lighthouse Point?
There are 5,434 People in the Labor Forcein in Lighthouse Point.
What is the Percentage of People in the Labor Force in Lighthouse Point?
59.3% of People are in the Labor Force in Lighthouse Point.
What is the Unemployment Rate in Lighthouse Point?
Unemployment Rate in Lighthouse Point is 2.2%.