Panama City, FL Map & Demographics
Panama City Map
Panama City Overview
$33,853
PER CAPITA INCOME
$69,338
AVG FAMILY INCOME
$57,221
AVG HOUSEHOLD INCOME
26.1%
WAGE / INCOME GAP [ % ]
73.9¢/ $1
WAGE / INCOME GAP [ $ ]
$11,375
FAMILY INCOME DEFICIT
0.48
INEQUALITY / GINI INDEX
34,254
TOTAL POPULATION
16,240
MALE POPULATION
18,014
FEMALE POPULATION
90.15
MALES / 100 FEMALES
110.92
FEMALES / 100 MALES
38.5
MEDIAN AGE
3.0
AVG FAMILY SIZE
2.3
AVG HOUSEHOLD SIZE
16,836
LABOR FORCE [ PEOPLE ]
62.2%
PERCENT IN LABOR FORCE
5.1%
UNEMPLOYMENT RATE
Panama City Area Codes
Income in Panama City
Income Overview in Panama City
Per Capita Income in Panama City is $33,853, while median incomes of families and households are $69,338 and $57,221 respectively.
| Characteristic | Number | Measure |
| Per Capita Income | 34,254 | $33,853 |
| Median Family Income | 8,381 | $69,338 |
| Mean Family Income | 8,381 | $89,171 |
| Median Household Income | 14,550 | $57,221 |
| Mean Household Income | 14,550 | $77,946 |
| Income Deficit | 8,381 | $11,375 |
| Wage / Income Gap (%) | 34,254 | 26.09% |
| Wage / Income Gap ($) | 34,254 | 73.91¢ per $1 |
| Gini / Inequality Index | 34,254 | 0.48 |
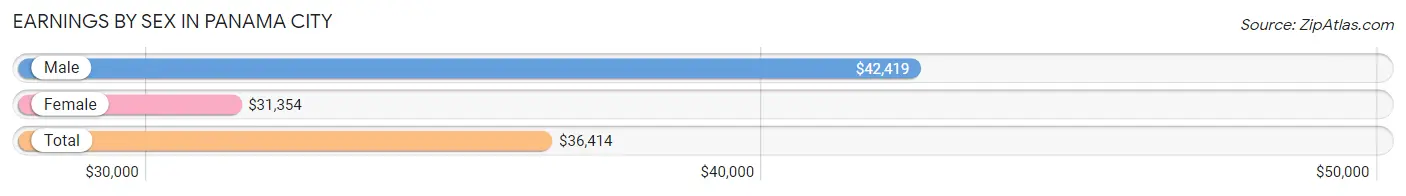
Earnings by Sex in Panama City
Average Earnings in Panama City are $36,414, $42,419 for men and $31,354 for women, a difference of 26.1%.
| Sex | Number | Average Earnings |
| Male | 8,694 (49.7%) | $42,419 |
| Female | 8,780 (50.2%) | $31,354 |
| Total | 17,474 (100.0%) | $36,414 |
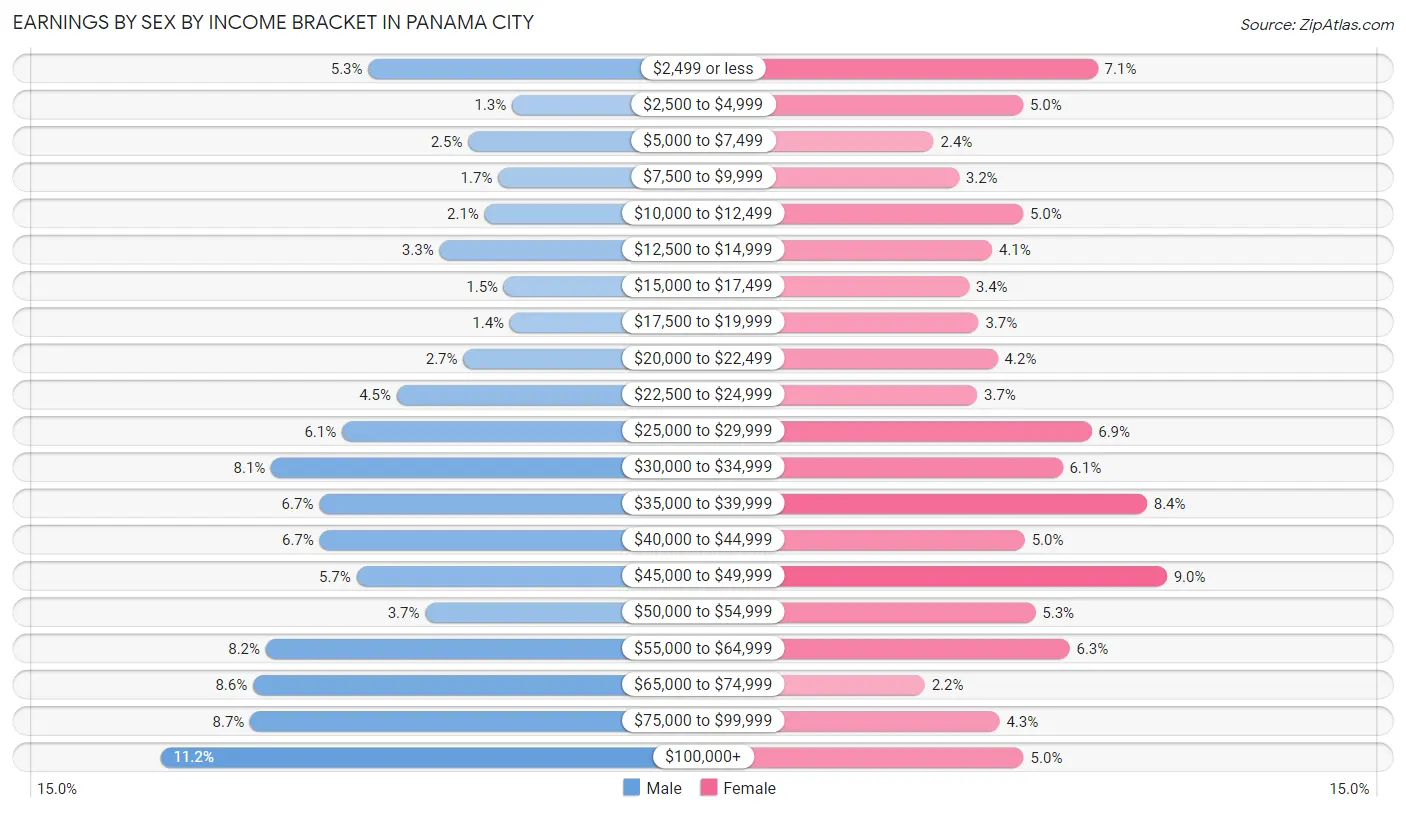
Earnings by Sex by Income Bracket in Panama City
The most common earnings brackets in Panama City are $100,000+ for men (972 | 11.2%) and $45,000 to $49,999 for women (789 | 9.0%).
| Income | Male | Female |
| $2,499 or less | 464 (5.3%) | 619 (7.0%) |
| $2,500 to $4,999 | 113 (1.3%) | 435 (5.0%) |
| $5,000 to $7,499 | 220 (2.5%) | 214 (2.4%) |
| $7,500 to $9,999 | 147 (1.7%) | 277 (3.2%) |
| $10,000 to $12,499 | 180 (2.1%) | 435 (5.0%) |
| $12,500 to $14,999 | 290 (3.3%) | 358 (4.1%) |
| $15,000 to $17,499 | 133 (1.5%) | 301 (3.4%) |
| $17,500 to $19,999 | 118 (1.4%) | 325 (3.7%) |
| $20,000 to $22,499 | 232 (2.7%) | 372 (4.2%) |
| $22,500 to $24,999 | 395 (4.5%) | 321 (3.7%) |
| $25,000 to $29,999 | 529 (6.1%) | 603 (6.9%) |
| $30,000 to $34,999 | 702 (8.1%) | 532 (6.1%) |
| $35,000 to $39,999 | 584 (6.7%) | 740 (8.4%) |
| $40,000 to $44,999 | 583 (6.7%) | 439 (5.0%) |
| $45,000 to $49,999 | 493 (5.7%) | 789 (9.0%) |
| $50,000 to $54,999 | 325 (3.7%) | 465 (5.3%) |
| $55,000 to $64,999 | 715 (8.2%) | 550 (6.3%) |
| $65,000 to $74,999 | 746 (8.6%) | 192 (2.2%) |
| $75,000 to $99,999 | 753 (8.7%) | 377 (4.3%) |
| $100,000+ | 972 (11.2%) | 436 (5.0%) |
| Total | 8,694 (100.0%) | 8,780 (100.0%) |
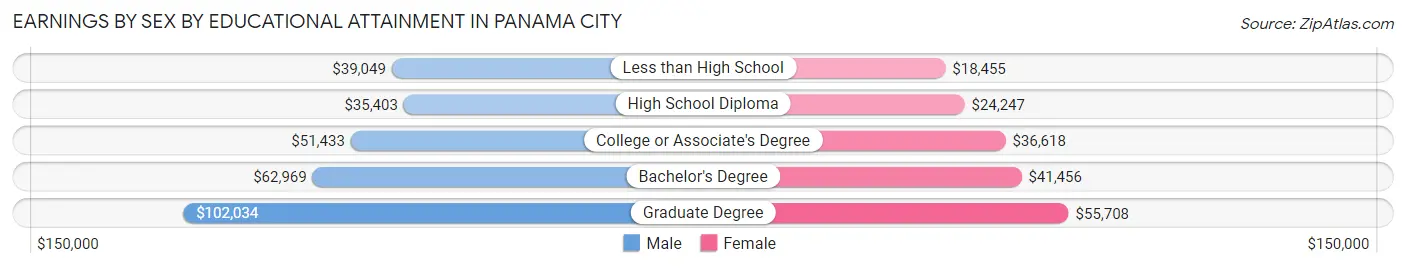
Earnings by Sex by Educational Attainment in Panama City
Average earnings in Panama City are $46,546 for men and $35,452 for women, a difference of 23.8%. Men with an educational attainment of graduate degree enjoy the highest average annual earnings of $102,034, while those with high school diploma education earn the least with $35,403. Women with an educational attainment of graduate degree earn the most with the average annual earnings of $55,708, while those with less than high school education have the smallest earnings of $18,455.
| Educational Attainment | Male Income | Female Income |
| Less than High School | $39,049 | $18,455 |
| High School Diploma | $35,403 | $24,247 |
| College or Associate's Degree | $51,433 | $36,618 |
| Bachelor's Degree | $62,969 | $41,456 |
| Graduate Degree | $102,034 | $55,708 |
| Total | $46,546 | $35,452 |
Family Income in Panama City
Family Income Brackets in Panama City
According to the Panama City family income data, there are 1,760 families falling into the $50,000 to $74,999 income range, which is the most common income bracket and makes up 21.0% of all families. Conversely, the $10,000 to $14,999 income bracket is the least frequent group with only 142 families (1.7%) belonging to this category.
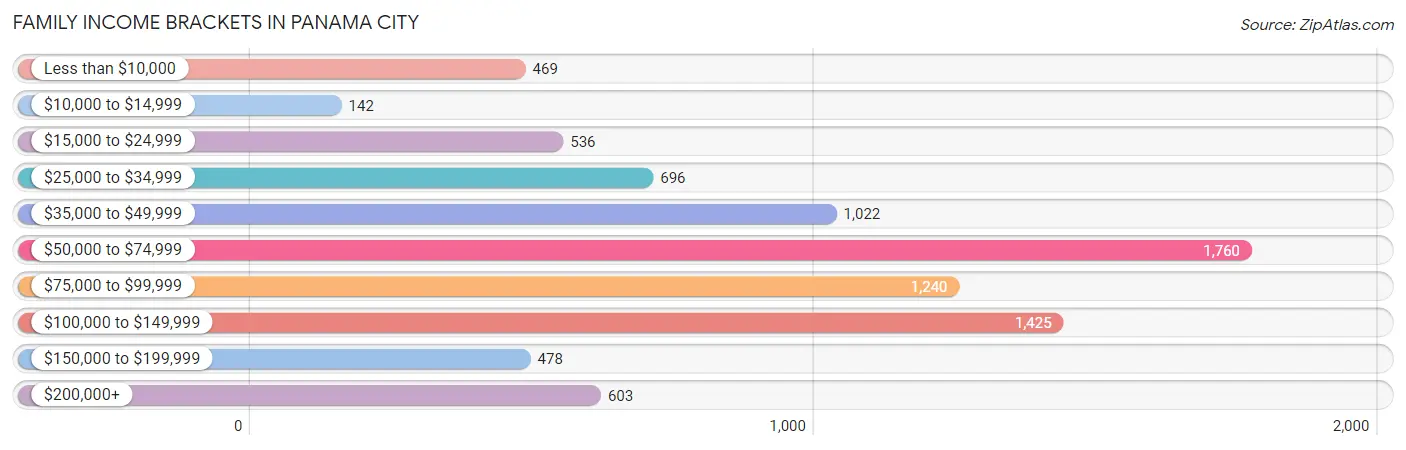
| Income Bracket | # Families | % Families |
| Less than $10,000 | 469 | 5.6% |
| $10,000 to $14,999 | 142 | 1.7% |
| $15,000 to $24,999 | 536 | 6.4% |
| $25,000 to $34,999 | 696 | 8.3% |
| $35,000 to $49,999 | 1,022 | 12.2% |
| $50,000 to $74,999 | 1,760 | 21.0% |
| $75,000 to $99,999 | 1,240 | 14.8% |
| $100,000 to $149,999 | 1,425 | 17.0% |
| $150,000 to $199,999 | 478 | 5.7% |
| $200,000+ | 603 | 7.2% |
Family Income by Famaliy Size in Panama City
6-person families (210 | 2.5%) account for the highest median family income in Panama City with $112,738 per family, while 2-person families (4,502 | 53.7%) have the highest median income of $34,025 per family member.
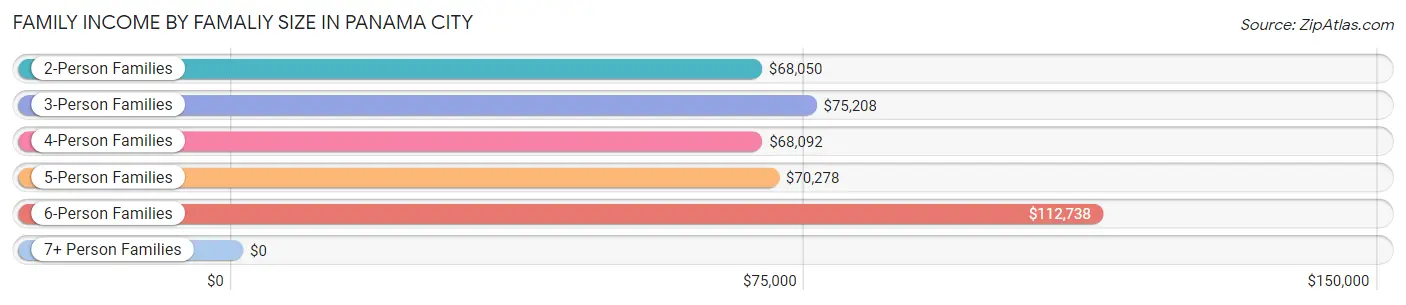
| Income Bracket | # Families | Median Income |
| 2-Person Families | 4,502 (53.7%) | $68,050 |
| 3-Person Families | 1,600 (19.1%) | $75,208 |
| 4-Person Families | 1,319 (15.7%) | $68,092 |
| 5-Person Families | 580 (6.9%) | $70,278 |
| 6-Person Families | 210 (2.5%) | $112,738 |
| 7+ Person Families | 170 (2.0%) | $0 |
| Total | 8,381 (100.0%) | $69,338 |
Family Income by Number of Earners in Panama City
The median family income in Panama City is $69,338, with families comprising 3+ earners (523) having the highest median family income of $99,087, while families with no earners (1,336) have the lowest median family income of $44,293, accounting for 6.2% and 15.9% of families, respectively.
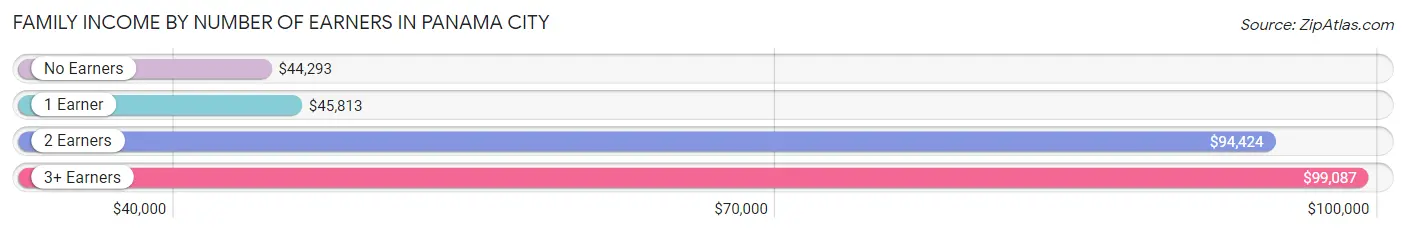
| Number of Earners | # Families | Median Income |
| No Earners | 1,336 (15.9%) | $44,293 |
| 1 Earner | 3,131 (37.4%) | $45,813 |
| 2 Earners | 3,391 (40.5%) | $94,424 |
| 3+ Earners | 523 (6.2%) | $99,087 |
| Total | 8,381 (100.0%) | $69,338 |
Household Income in Panama City
Household Income Brackets in Panama City
With 3,026 households falling in the category, the $50,000 to $74,999 income range is the most frequent in Panama City, accounting for 20.8% of all households. In contrast, only 597 households (4.1%) fall into the $150,000 to $199,999 income bracket, making it the least populous group.
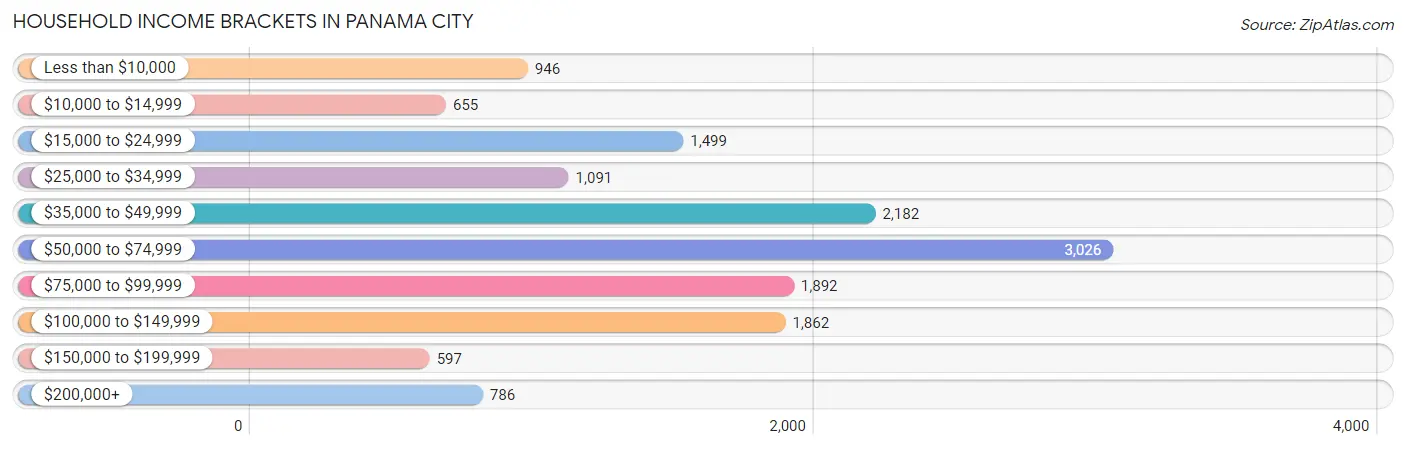
| Income Bracket | # Households | % Households |
| Less than $10,000 | 946 | 6.5% |
| $10,000 to $14,999 | 655 | 4.5% |
| $15,000 to $24,999 | 1,499 | 10.3% |
| $25,000 to $34,999 | 1,091 | 7.5% |
| $35,000 to $49,999 | 2,182 | 15.0% |
| $50,000 to $74,999 | 3,026 | 20.8% |
| $75,000 to $99,999 | 1,892 | 13.0% |
| $100,000 to $149,999 | 1,862 | 12.8% |
| $150,000 to $199,999 | 597 | 4.1% |
| $200,000+ | 786 | 5.4% |
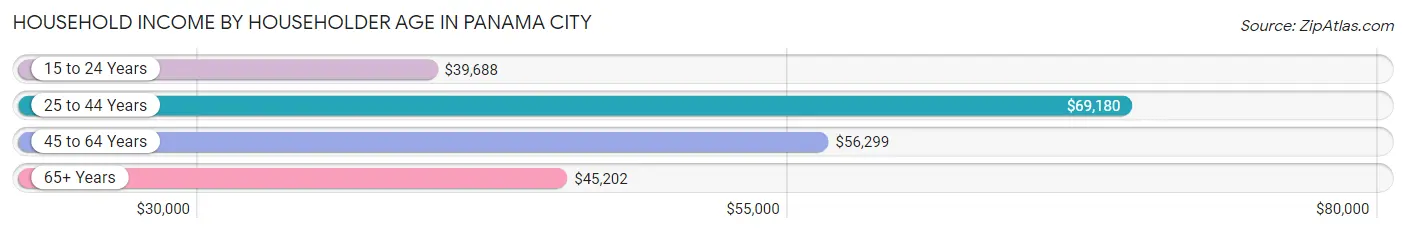
Household Income by Householder Age in Panama City
The median household income in Panama City is $57,221, with the highest median household income of $69,180 found in the 25 to 44 years age bracket for the primary householder. A total of 4,672 households (32.1%) fall into this category. Meanwhile, the 15 to 24 years age bracket for the primary householder has the lowest median household income of $39,688, with 692 households (4.8%) in this group.
| Income Bracket | # Households | Median Income |
| 15 to 24 Years | 692 (4.8%) | $39,688 |
| 25 to 44 Years | 4,672 (32.1%) | $69,180 |
| 45 to 64 Years | 5,320 (36.6%) | $56,299 |
| 65+ Years | 3,866 (26.6%) | $45,202 |
| Total | 14,550 (100.0%) | $57,221 |
Poverty in Panama City
Income Below Poverty by Sex and Age in Panama City
With 16.1% poverty level for males and 21.0% for females among the residents of Panama City, 15 year old males and 18 to 24 year old females are the most vulnerable to poverty, with 96 males (51.3%) and 450 females (33.3%) in their respective age groups living below the poverty level.
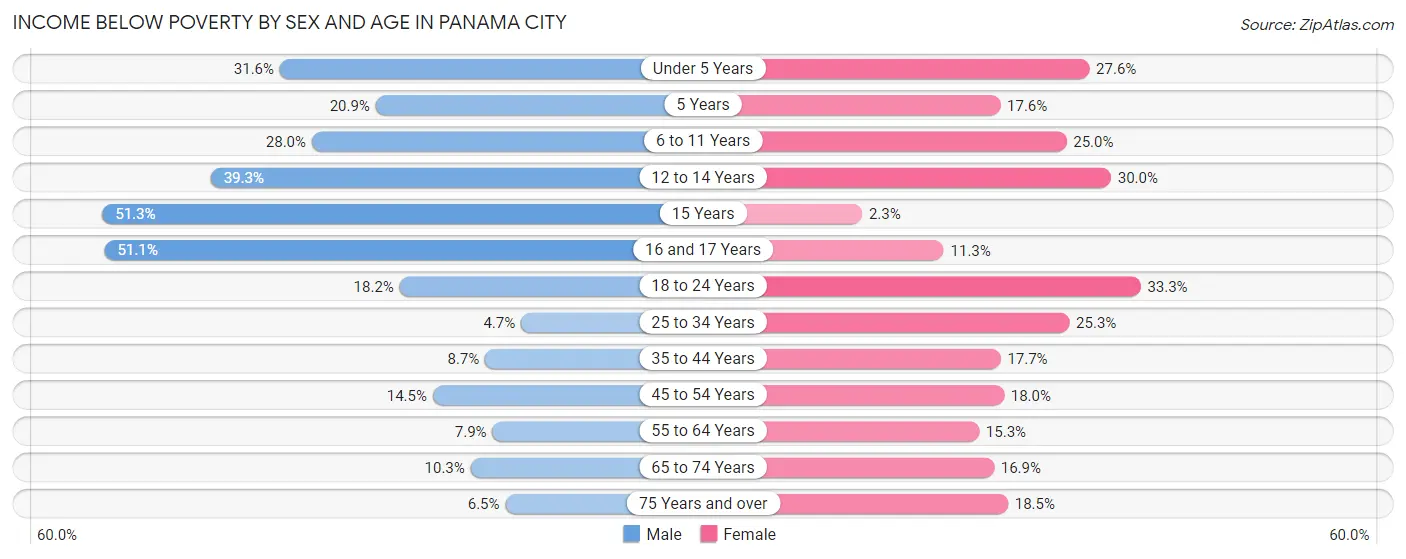
| Age Bracket | Male | Female |
| Under 5 Years | 411 (31.6%) | 238 (27.6%) |
| 5 Years | 28 (20.9%) | 49 (17.6%) |
| 6 to 11 Years | 453 (28.0%) | 293 (25.0%) |
| 12 to 14 Years | 247 (39.3%) | 234 (30.0%) |
| 15 Years | 96 (51.3%) | 4 (2.2%) |
| 16 and 17 Years | 162 (51.1%) | 50 (11.3%) |
| 18 to 24 Years | 257 (18.2%) | 450 (33.3%) |
| 25 to 34 Years | 110 (4.7%) | 698 (25.3%) |
| 35 to 44 Years | 160 (8.7%) | 350 (17.7%) |
| 45 to 54 Years | 266 (14.5%) | 379 (18.0%) |
| 55 to 64 Years | 158 (7.9%) | 351 (15.3%) |
| 65 to 74 Years | 157 (10.3%) | 313 (16.9%) |
| 75 Years and over | 53 (6.5%) | 276 (18.5%) |
| Total | 2,558 (16.1%) | 3,685 (21.0%) |
Income Above Poverty by Sex and Age in Panama City
According to the poverty statistics in Panama City, males aged 25 to 34 years and females aged 15 years are the age groups that are most secure financially, with 95.3% of males and 97.8% of females in these age groups living above the poverty line.
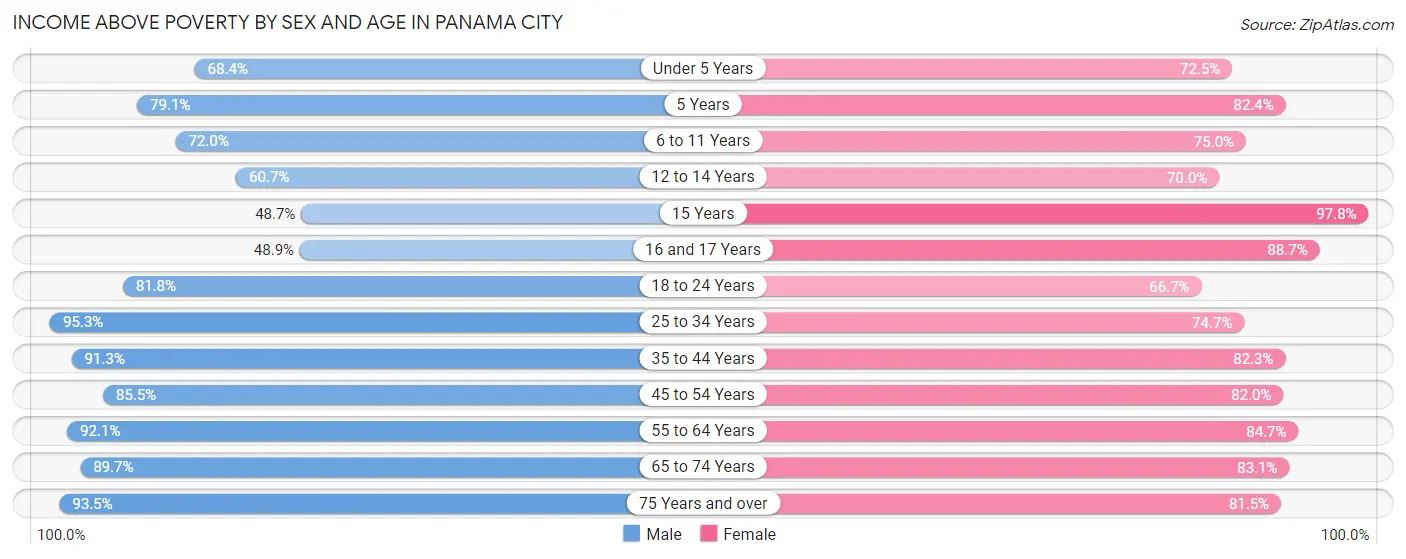
| Age Bracket | Male | Female |
| Under 5 Years | 891 (68.4%) | 626 (72.5%) |
| 5 Years | 106 (79.1%) | 229 (82.4%) |
| 6 to 11 Years | 1,164 (72.0%) | 879 (75.0%) |
| 12 to 14 Years | 382 (60.7%) | 547 (70.0%) |
| 15 Years | 91 (48.7%) | 174 (97.8%) |
| 16 and 17 Years | 155 (48.9%) | 391 (88.7%) |
| 18 to 24 Years | 1,153 (81.8%) | 903 (66.7%) |
| 25 to 34 Years | 2,223 (95.3%) | 2,059 (74.7%) |
| 35 to 44 Years | 1,677 (91.3%) | 1,631 (82.3%) |
| 45 to 54 Years | 1,563 (85.5%) | 1,722 (82.0%) |
| 55 to 64 Years | 1,842 (92.1%) | 1,948 (84.7%) |
| 65 to 74 Years | 1,363 (89.7%) | 1,536 (83.1%) |
| 75 Years and over | 767 (93.5%) | 1,217 (81.5%) |
| Total | 13,377 (84.0%) | 13,862 (79.0%) |
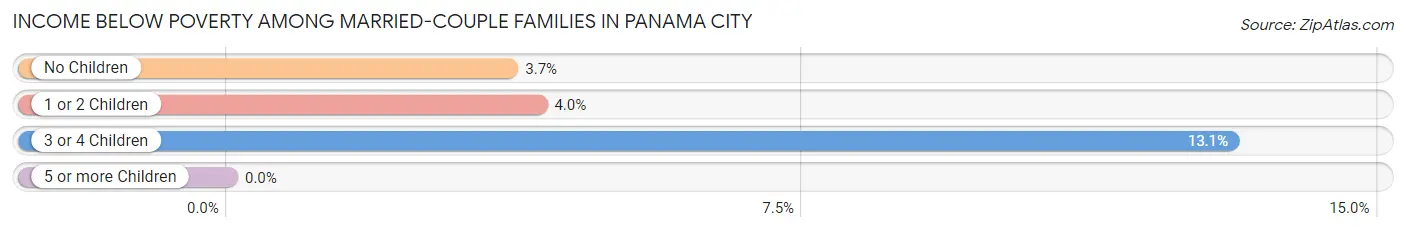
Income Below Poverty Among Married-Couple Families in Panama City
The poverty statistics for married-couple families in Panama City show that 4.5% or 235 of the total 5,181 families live below the poverty line. Families with 3 or 4 children have the highest poverty rate of 13.1%, comprising of 56 families. On the other hand, families with 5 or more children have the lowest poverty rate of 0.0%, which includes 0 families.
| Children | Above Poverty | Below Poverty |
| No Children | 3,079 (96.3%) | 117 (3.7%) |
| 1 or 2 Children | 1,471 (96.0%) | 62 (4.0%) |
| 3 or 4 Children | 372 (86.9%) | 56 (13.1%) |
| 5 or more Children | 24 (100.0%) | 0 (0.0%) |
| Total | 4,946 (95.5%) | 235 (4.5%) |
Income Below Poverty Among Single-Parent Households in Panama City
According to the poverty data in Panama City, 10.7% or 76 single-father households and 36.0% or 896 single-mother households are living below the poverty line. Among single-father households, those with 1 or 2 children have the highest poverty rate, with 65 households (28.9%) experiencing poverty. Likewise, among single-mother households, those with 3 or 4 children have the highest poverty rate, with 160 households (70.5%) falling below the poverty line.
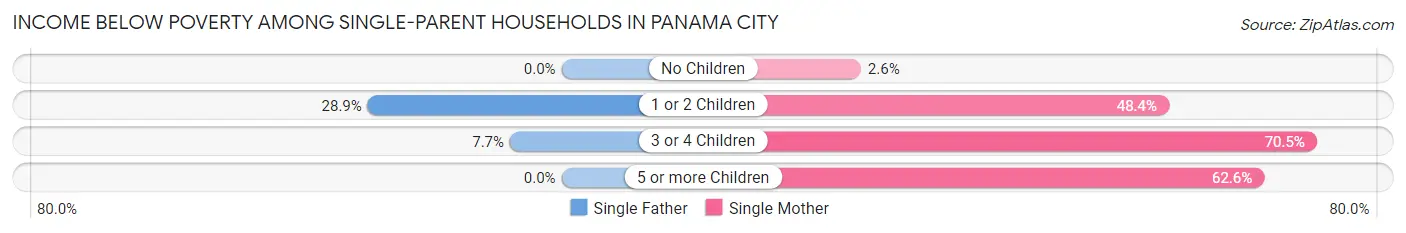
| Children | Single Father | Single Mother |
| No Children | 0 (0.0%) | 21 (2.6%) |
| 1 or 2 Children | 65 (28.9%) | 653 (48.4%) |
| 3 or 4 Children | 11 (7.7%) | 160 (70.5%) |
| 5 or more Children | 0 (0.0%) | 62 (62.6%) |
| Total | 76 (10.7%) | 896 (36.0%) |
Income Below Poverty Among Married-Couple vs Single-Parent Households in Panama City
The poverty data for Panama City shows that 235 of the married-couple family households (4.5%) and 972 of the single-parent households (30.4%) are living below the poverty level. Within the married-couple family households, those with 3 or 4 children have the highest poverty rate, with 56 households (13.1%) falling below the poverty line. Among the single-parent households, those with 5 or more children have the highest poverty rate, with 62 household (62.6%) living below poverty.
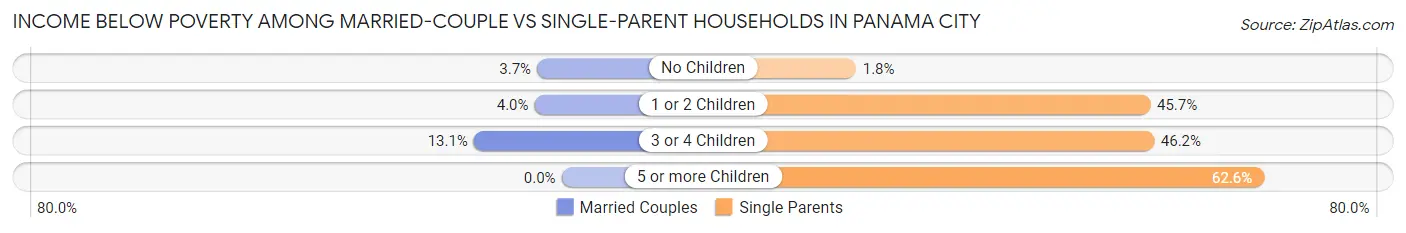
| Children | Married-Couple Families | Single-Parent Households |
| No Children | 117 (3.7%) | 21 (1.8%) |
| 1 or 2 Children | 62 (4.0%) | 718 (45.7%) |
| 3 or 4 Children | 56 (13.1%) | 171 (46.2%) |
| 5 or more Children | 0 (0.0%) | 62 (62.6%) |
| Total | 235 (4.5%) | 972 (30.4%) |
Race in Panama City
The most populous races in Panama City are White / Caucasian (22,083 | 64.5%), Black / African American (7,243 | 21.1%), and Hispanic or Latino (2,945 | 8.6%).
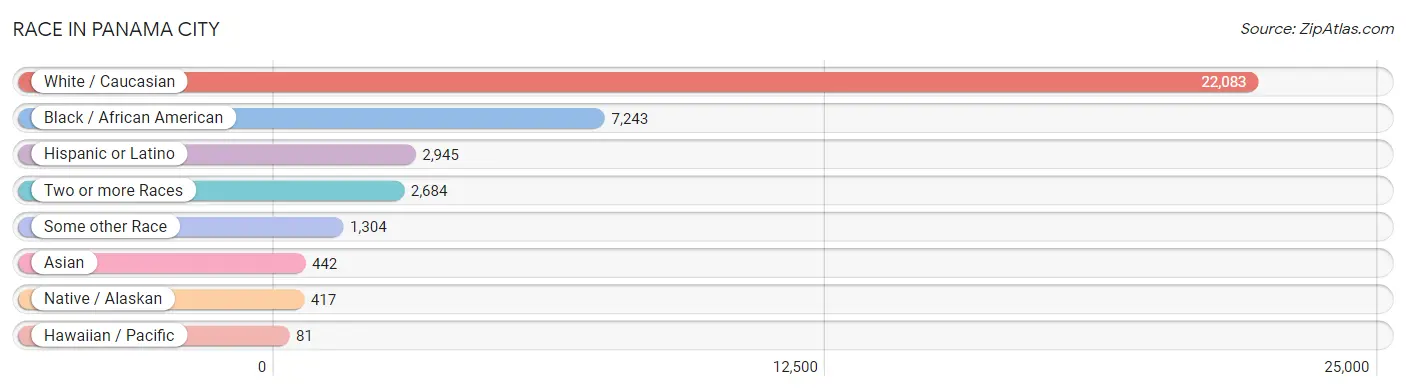
| Race | # Population | % Population |
| Asian | 442 | 1.3% |
| Black / African American | 7,243 | 21.1% |
| Hawaiian / Pacific | 81 | 0.2% |
| Hispanic or Latino | 2,945 | 8.6% |
| Native / Alaskan | 417 | 1.2% |
| White / Caucasian | 22,083 | 64.5% |
| Two or more Races | 2,684 | 7.8% |
| Some other Race | 1,304 | 3.8% |
| Total | 34,254 | 100.0% |
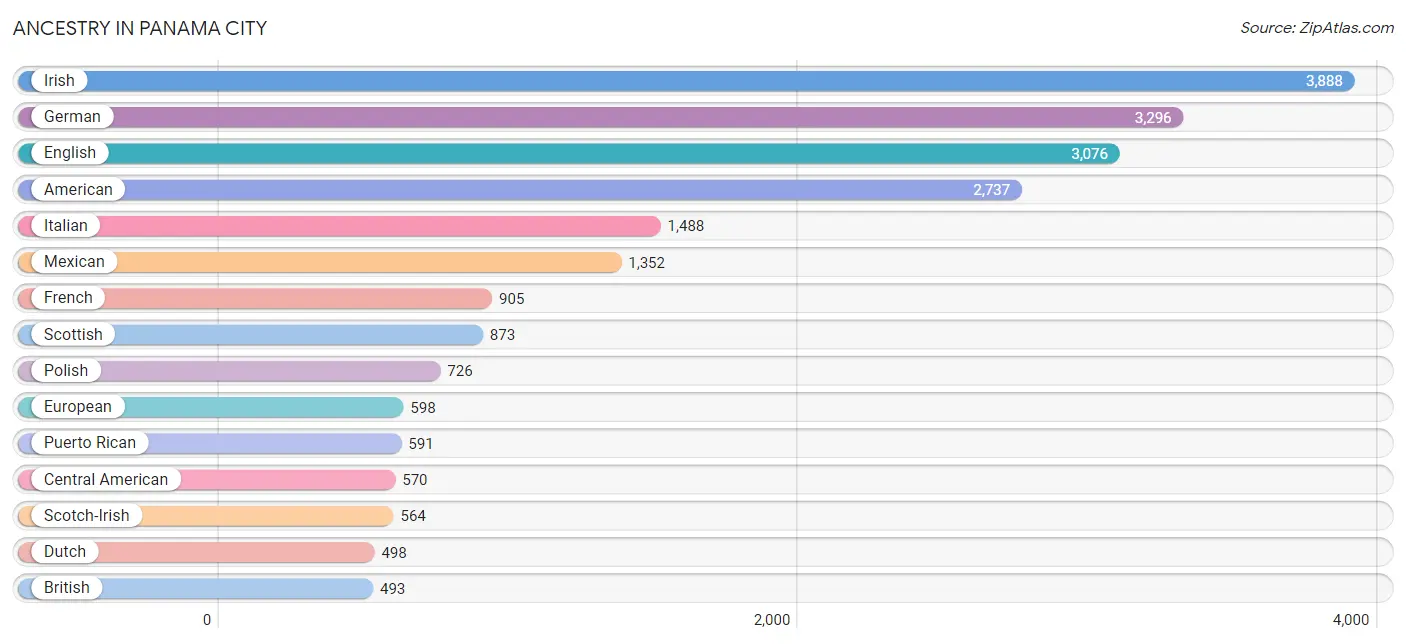
Ancestry in Panama City
The most populous ancestries reported in Panama City are Irish (3,888 | 11.4%), German (3,296 | 9.6%), English (3,076 | 9.0%), American (2,737 | 8.0%), and Italian (1,488 | 4.3%), together accounting for 42.3% of all Panama City residents.
| Ancestry | # Population | % Population |
| African | 37 | 0.1% |
| American | 2,737 | 8.0% |
| Apache | 5 | 0.0% |
| Arab | 312 | 0.9% |
| Austrian | 22 | 0.1% |
| Belgian | 13 | 0.0% |
| Bhutanese | 67 | 0.2% |
| British | 493 | 1.4% |
| Burmese | 83 | 0.2% |
| Cambodian | 7 | 0.0% |
| Canadian | 228 | 0.7% |
| Central American | 570 | 1.7% |
| Cherokee | 194 | 0.6% |
| Choctaw | 4 | 0.0% |
| Colombian | 10 | 0.0% |
| Costa Rican | 83 | 0.2% |
| Creek | 21 | 0.1% |
| Cuban | 54 | 0.2% |
| Czech | 87 | 0.3% |
| Czechoslovakian | 11 | 0.0% |
| Danish | 42 | 0.1% |
| Delaware | 5 | 0.0% |
| Dominican | 106 | 0.3% |
| Dutch | 498 | 1.5% |
| Eastern European | 77 | 0.2% |
| Egyptian | 33 | 0.1% |
| English | 3,076 | 9.0% |
| European | 598 | 1.8% |
| Fijian | 22 | 0.1% |
| Finnish | 56 | 0.2% |
| French | 905 | 2.6% |
| French Canadian | 70 | 0.2% |
| German | 3,296 | 9.6% |
| Greek | 115 | 0.3% |
| Guatemalan | 57 | 0.2% |
| Haitian | 28 | 0.1% |
| Honduran | 230 | 0.7% |
| Hungarian | 67 | 0.2% |
| Icelander | 20 | 0.1% |
| Indian (Asian) | 19 | 0.1% |
| Irish | 3,888 | 11.4% |
| Italian | 1,488 | 4.3% |
| Jamaican | 267 | 0.8% |
| Korean | 250 | 0.7% |
| Lebanese | 17 | 0.1% |
| Lithuanian | 28 | 0.1% |
| Mexican | 1,352 | 4.0% |
| Mexican American Indian | 238 | 0.7% |
| Native Hawaiian | 6 | 0.0% |
| Nicaraguan | 112 | 0.3% |
| Nigerian | 28 | 0.1% |
| Northern European | 60 | 0.2% |
| Norwegian | 254 | 0.7% |
| Pakistani | 116 | 0.3% |
| Peruvian | 22 | 0.1% |
| Polish | 726 | 2.1% |
| Portuguese | 112 | 0.3% |
| Puerto Rican | 591 | 1.7% |
| Romanian | 15 | 0.0% |
| Russian | 114 | 0.3% |
| Salvadoran | 88 | 0.3% |
| Scandinavian | 104 | 0.3% |
| Scotch-Irish | 564 | 1.7% |
| Scottish | 873 | 2.5% |
| Seminole | 10 | 0.0% |
| Slavic | 23 | 0.1% |
| Slovak | 9 | 0.0% |
| South American | 63 | 0.2% |
| Spaniard | 30 | 0.1% |
| Spanish | 159 | 0.5% |
| Sri Lankan | 273 | 0.8% |
| Subsaharan African | 65 | 0.2% |
| Swedish | 101 | 0.3% |
| Swiss | 116 | 0.3% |
| Syrian | 232 | 0.7% |
| Thai | 57 | 0.2% |
| Trinidadian and Tobagonian | 157 | 0.5% |
| Ukrainian | 15 | 0.0% |
| Venezuelan | 31 | 0.1% |
| Welsh | 167 | 0.5% |
| West Indian | 24 | 0.1% |
| Yugoslavian | 16 | 0.1% | View All 82 Rows |
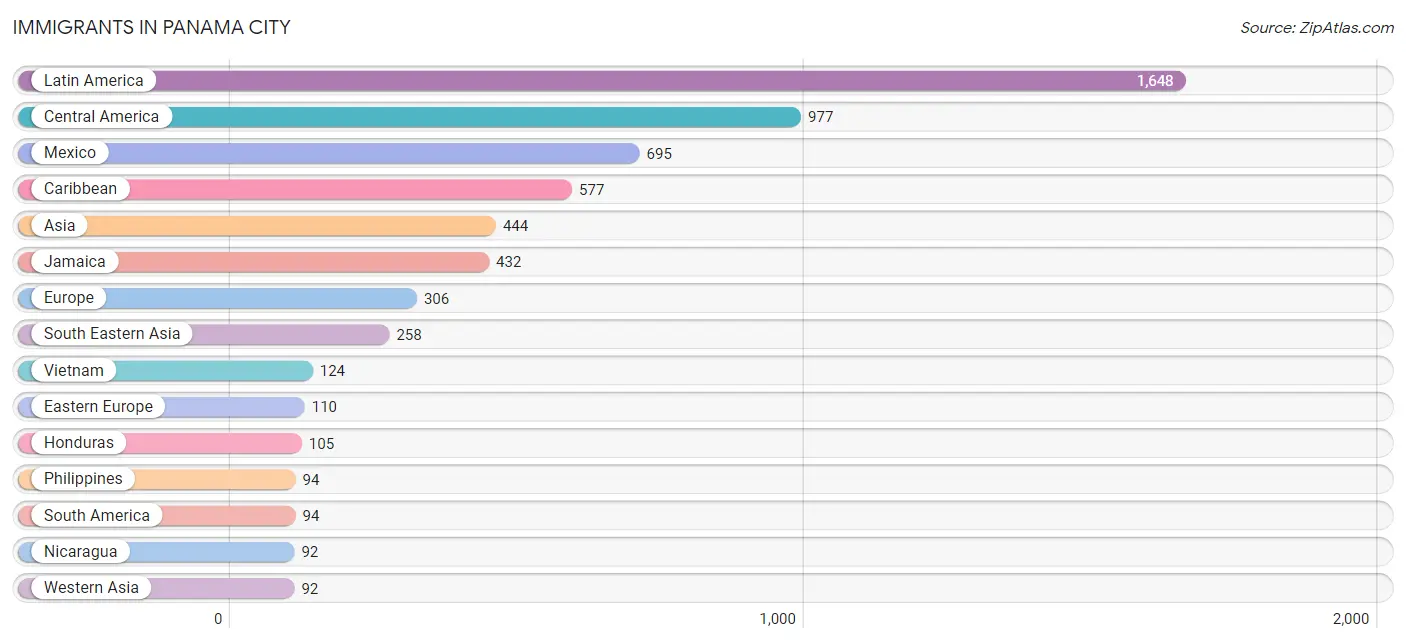
Immigrants in Panama City
The most numerous immigrant groups reported in Panama City came from Latin America (1,648 | 4.8%), Central America (977 | 2.9%), Mexico (695 | 2.0%), Caribbean (577 | 1.7%), and Asia (444 | 1.3%), together accounting for 12.7% of all Panama City residents.
| Immigration Origin | # Population | % Population |
| Africa | 73 | 0.2% |
| Asia | 444 | 1.3% |
| Bangladesh | 13 | 0.0% |
| Canada | 34 | 0.1% |
| Caribbean | 577 | 1.7% |
| Central America | 977 | 2.9% |
| Colombia | 10 | 0.0% |
| Costa Rica | 28 | 0.1% |
| Cuba | 38 | 0.1% |
| Dominican Republic | 31 | 0.1% |
| Eastern Africa | 10 | 0.0% |
| Eastern Asia | 57 | 0.2% |
| Eastern Europe | 110 | 0.3% |
| Egypt | 63 | 0.2% |
| England | 41 | 0.1% |
| Europe | 306 | 0.9% |
| Germany | 88 | 0.3% |
| Guatemala | 57 | 0.2% |
| Guyana | 43 | 0.1% |
| Haiti | 14 | 0.0% |
| Honduras | 105 | 0.3% |
| Hungary | 37 | 0.1% |
| India | 11 | 0.0% |
| Indonesia | 6 | 0.0% |
| Israel | 5 | 0.0% |
| Italy | 32 | 0.1% |
| Jamaica | 432 | 1.3% |
| Jordan | 20 | 0.1% |
| Kazakhstan | 9 | 0.0% |
| Kenya | 10 | 0.0% |
| Korea | 57 | 0.2% |
| Latin America | 1,648 | 4.8% |
| Mexico | 695 | 2.0% |
| Nicaragua | 92 | 0.3% |
| Northern Africa | 63 | 0.2% |
| Northern Europe | 76 | 0.2% |
| Oceania | 7 | 0.0% |
| Pakistan | 4 | 0.0% |
| Peru | 10 | 0.0% |
| Philippines | 94 | 0.3% |
| Romania | 15 | 0.0% |
| Russia | 58 | 0.2% |
| Scotland | 6 | 0.0% |
| South America | 94 | 0.3% |
| South Central Asia | 37 | 0.1% |
| South Eastern Asia | 258 | 0.7% |
| Southern Europe | 32 | 0.1% |
| Syria | 67 | 0.2% |
| Thailand | 34 | 0.1% |
| Trinidad and Tobago | 62 | 0.2% |
| Venezuela | 31 | 0.1% |
| Vietnam | 124 | 0.4% |
| Western Asia | 92 | 0.3% |
| Western Europe | 88 | 0.3% | View All 54 Rows |
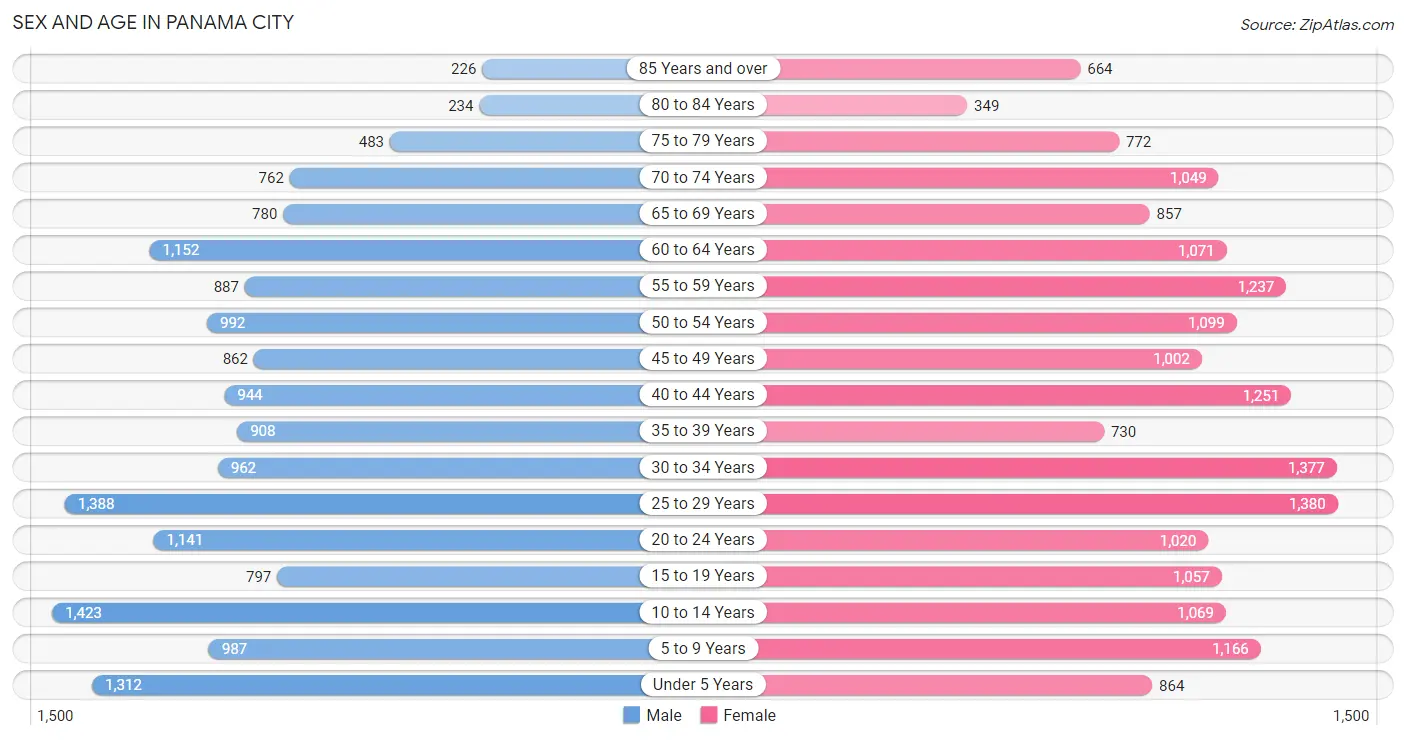
Sex and Age in Panama City
Sex and Age in Panama City
The most populous age groups in Panama City are 10 to 14 Years (1,423 | 8.8%) for men and 25 to 29 Years (1,380 | 7.7%) for women.
| Age Bracket | Male | Female |
| Under 5 Years | 1,312 (8.1%) | 864 (4.8%) |
| 5 to 9 Years | 987 (6.1%) | 1,166 (6.5%) |
| 10 to 14 Years | 1,423 (8.8%) | 1,069 (5.9%) |
| 15 to 19 Years | 797 (4.9%) | 1,057 (5.9%) |
| 20 to 24 Years | 1,141 (7.0%) | 1,020 (5.7%) |
| 25 to 29 Years | 1,388 (8.6%) | 1,380 (7.7%) |
| 30 to 34 Years | 962 (5.9%) | 1,377 (7.6%) |
| 35 to 39 Years | 908 (5.6%) | 730 (4.1%) |
| 40 to 44 Years | 944 (5.8%) | 1,251 (6.9%) |
| 45 to 49 Years | 862 (5.3%) | 1,002 (5.6%) |
| 50 to 54 Years | 992 (6.1%) | 1,099 (6.1%) |
| 55 to 59 Years | 887 (5.5%) | 1,237 (6.9%) |
| 60 to 64 Years | 1,152 (7.1%) | 1,071 (5.9%) |
| 65 to 69 Years | 780 (4.8%) | 857 (4.8%) |
| 70 to 74 Years | 762 (4.7%) | 1,049 (5.8%) |
| 75 to 79 Years | 483 (3.0%) | 772 (4.3%) |
| 80 to 84 Years | 234 (1.4%) | 349 (1.9%) |
| 85 Years and over | 226 (1.4%) | 664 (3.7%) |
| Total | 16,240 (100.0%) | 18,014 (100.0%) |
Families and Households in Panama City
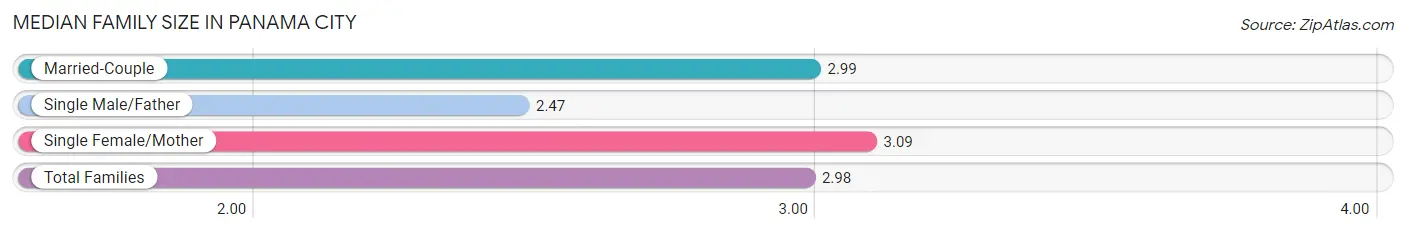
Median Family Size in Panama City
The median family size in Panama City is 2.98 persons per family, with single female/mother families (2,491 | 29.7%) accounting for the largest median family size of 3.09 persons per family. On the other hand, single male/father families (709 | 8.5%) represent the smallest median family size with 2.47 persons per family.
| Family Type | # Families | Family Size |
| Married-Couple | 5,181 (61.8%) | 2.99 |
| Single Male/Father | 709 (8.5%) | 2.47 |
| Single Female/Mother | 2,491 (29.7%) | 3.09 |
| Total Families | 8,381 (100.0%) | 2.98 |
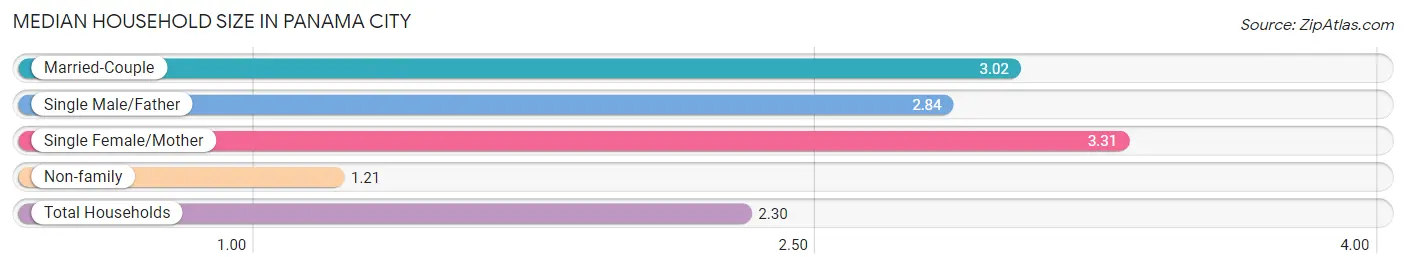
Median Household Size in Panama City
The median household size in Panama City is 2.30 persons per household, with single female/mother households (2,491 | 17.1%) accounting for the largest median household size of 3.31 persons per household. non-family households (6,169 | 42.4%) represent the smallest median household size with 1.21 persons per household.
| Household Type | # Households | Household Size |
| Married-Couple | 5,181 (35.6%) | 3.02 |
| Single Male/Father | 709 (4.9%) | 2.84 |
| Single Female/Mother | 2,491 (17.1%) | 3.31 |
| Non-family | 6,169 (42.4%) | 1.21 |
| Total Households | 14,550 (100.0%) | 2.30 |
Household Size by Marriage Status in Panama City
Out of a total of 14,550 households in Panama City, 8,381 (57.6%) are family households, while 6,169 (42.4%) are nonfamily households. The most numerous type of family households are 2-person households, comprising 3,966, and the most common type of nonfamily households are 1-person households, comprising 4,955.
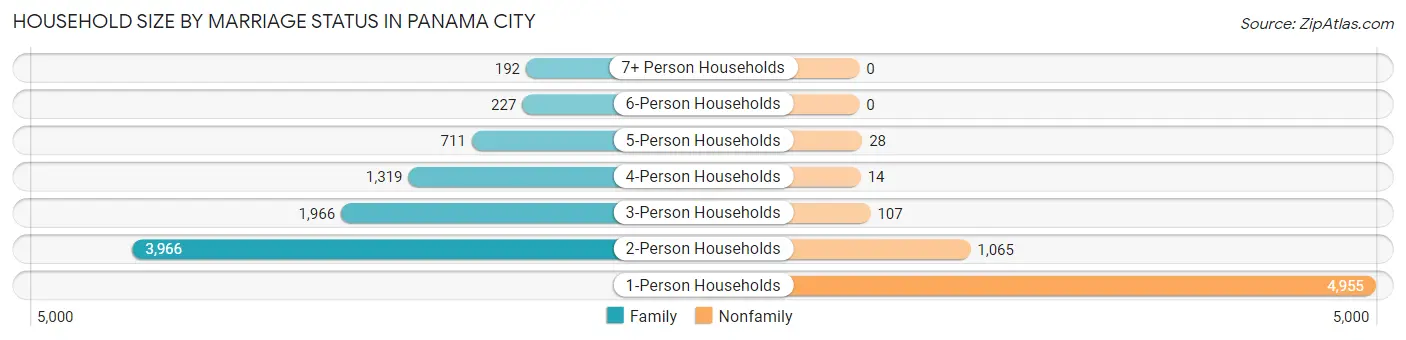
| Household Size | Family Households | Nonfamily Households |
| 1-Person Households | - | 4,955 (34.1%) |
| 2-Person Households | 3,966 (27.3%) | 1,065 (7.3%) |
| 3-Person Households | 1,966 (13.5%) | 107 (0.7%) |
| 4-Person Households | 1,319 (9.1%) | 14 (0.1%) |
| 5-Person Households | 711 (4.9%) | 28 (0.2%) |
| 6-Person Households | 227 (1.6%) | 0 (0.0%) |
| 7+ Person Households | 192 (1.3%) | 0 (0.0%) |
| Total | 8,381 (57.6%) | 6,169 (42.4%) |
Female Fertility in Panama City
Fertility by Age in Panama City
Average fertility rate in Panama City is 66.0 births per 1,000 women. Women in the age bracket of 20 to 34 years have the highest fertility rate with 134.0 births per 1,000 women. Women in the age bracket of 20 to 34 years acount for 96.0% of all women with births.
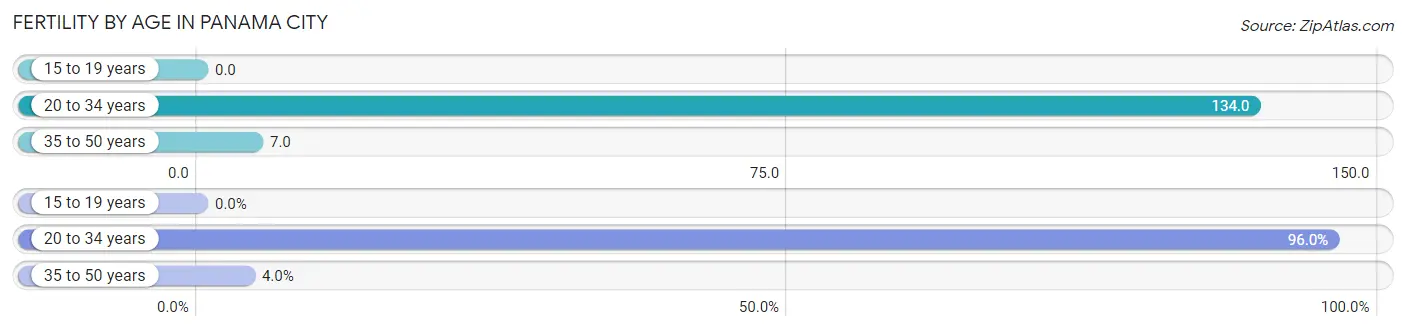
| Age Bracket | Women with Births | Births / 1,000 Women |
| 15 to 19 years | 0 (0.0%) | 0.0 |
| 20 to 34 years | 506 (96.0%) | 134.0 |
| 35 to 50 years | 21 (4.0%) | 7.0 |
| Total | 527 (100.0%) | 66.0 |
Fertility by Age by Marriage Status in Panama City
74.4% of women with births (527) in Panama City are married. The highest percentage of unmarried women with births falls into 20 to 34 years age bracket with 26.7% of them unmarried at the time of birth, while the lowest percentage of unmarried women with births belong to 35 to 50 years age bracket with 0.0% of them unmarried.
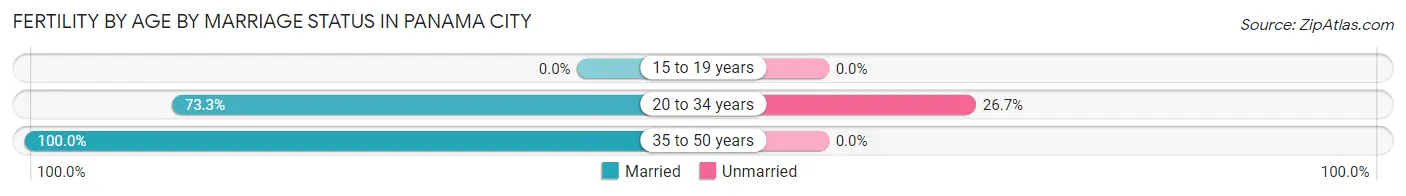
| Age Bracket | Married | Unmarried |
| 15 to 19 years | 0 (0.0%) | 0 (0.0%) |
| 20 to 34 years | 371 (73.3%) | 135 (26.7%) |
| 35 to 50 years | 21 (100.0%) | 0 (0.0%) |
| Total | 392 (74.4%) | 135 (25.6%) |
Fertility by Education in Panama City
Average fertility rate in Panama City is 66.0 births per 1,000 women. Women with the education attainment of bachelor's degree have the highest fertility rate of 185.0 births per 1,000 women, while women with the education attainment of college or associate's degree have the lowest fertility at 34.0 births per 1,000 women. Women with the education attainment of bachelor's degree represent 39.5% of all women with births.
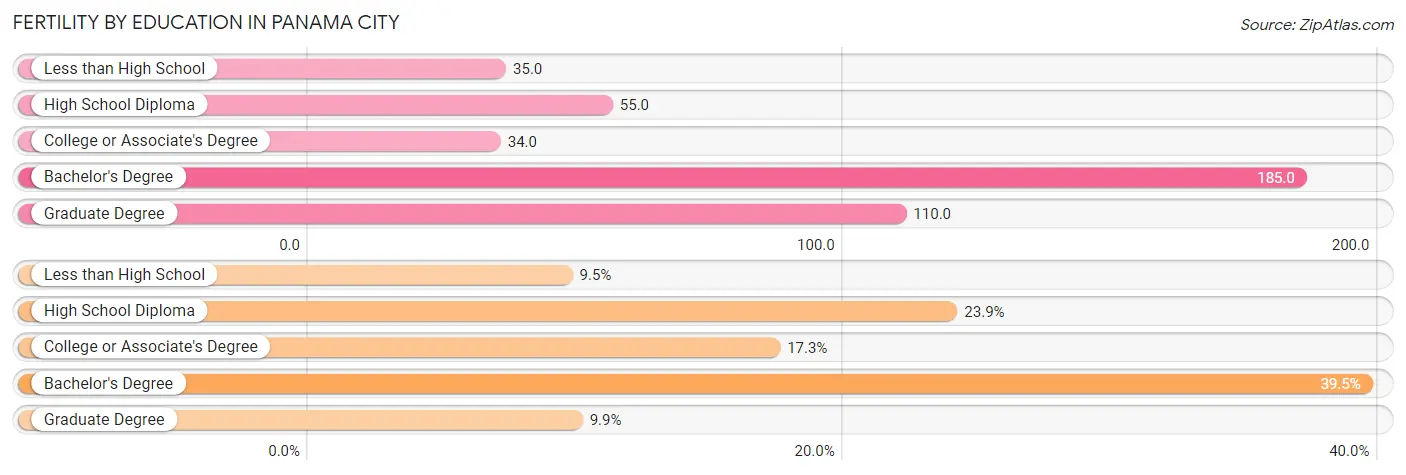
| Educational Attainment | Women with Births | Births / 1,000 Women |
| Less than High School | 50 (9.5%) | 35.0 |
| High School Diploma | 126 (23.9%) | 55.0 |
| College or Associate's Degree | 91 (17.3%) | 34.0 |
| Bachelor's Degree | 208 (39.5%) | 185.0 |
| Graduate Degree | 52 (9.9%) | 110.0 |
| Total | 527 (100.0%) | 66.0 |
Fertility by Education by Marriage Status in Panama City
25.6% of women with births in Panama City are unmarried. Women with the educational attainment of less than high school are most likely to be married with 100.0% of them married at childbirth, while women with the educational attainment of college or associate's degree are least likely to be married with 65.9% of them unmarried at childbirth.
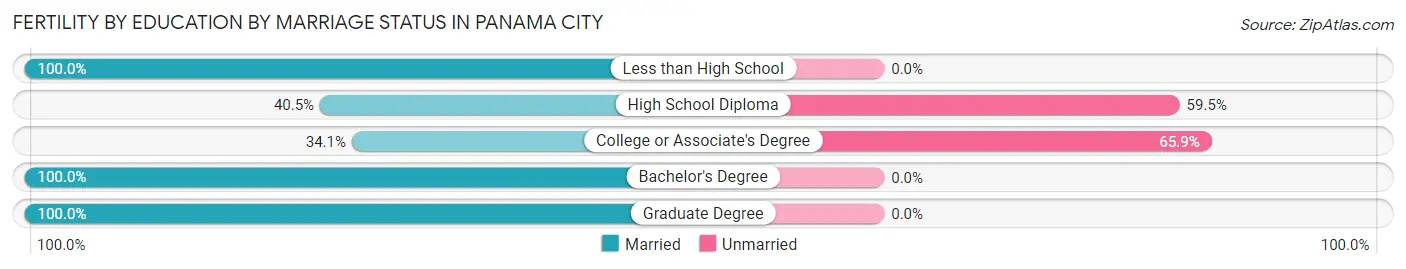
| Educational Attainment | Married | Unmarried |
| Less than High School | 50 (100.0%) | 0 (0.0%) |
| High School Diploma | 51 (40.5%) | 75 (59.5%) |
| College or Associate's Degree | 31 (34.1%) | 60 (65.9%) |
| Bachelor's Degree | 208 (100.0%) | 0 (0.0%) |
| Graduate Degree | 52 (100.0%) | 0 (0.0%) |
| Total | 392 (74.4%) | 135 (25.6%) |
Employment Characteristics in Panama City
Employment by Class of Employer in Panama City
Among the 15,624 employed individuals in Panama City, private company employees (10,026 | 64.2%), local government employees (1,234 | 7.9%), and federal government employees (1,086 | 7.0%) make up the most common classes of employment.
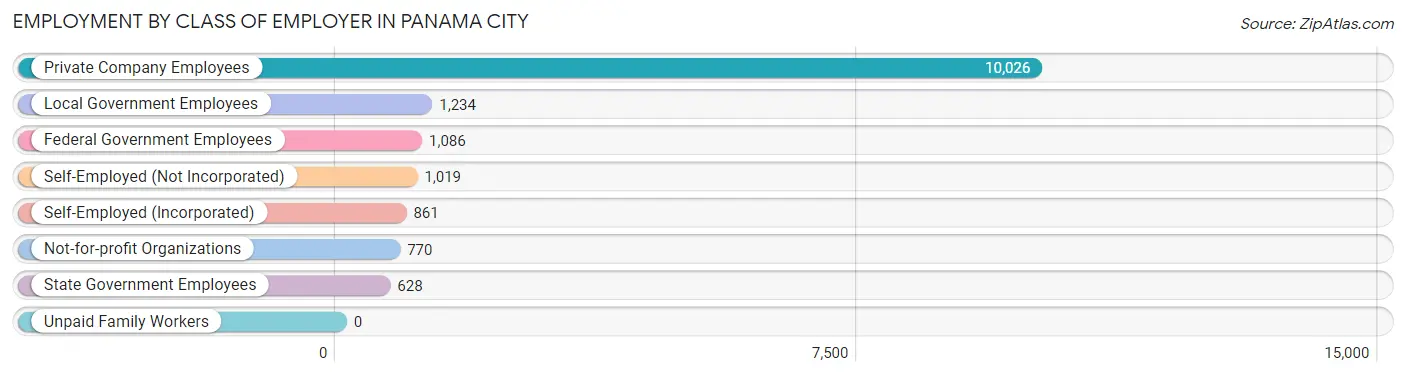
| Employer Class | # Employees | % Employees |
| Private Company Employees | 10,026 | 64.2% |
| Self-Employed (Incorporated) | 861 | 5.5% |
| Self-Employed (Not Incorporated) | 1,019 | 6.5% |
| Not-for-profit Organizations | 770 | 4.9% |
| Local Government Employees | 1,234 | 7.9% |
| State Government Employees | 628 | 4.0% |
| Federal Government Employees | 1,086 | 7.0% |
| Unpaid Family Workers | 0 | 0.0% |
| Total | 15,624 | 100.0% |
Employment Status by Age in Panama City
According to the labor force statistics for Panama City, out of the total population over 16 years of age (27,068), 62.2% or 16,836 individuals are in the labor force, with 5.1% or 859 of them unemployed. The age group with the highest labor force participation rate is 25 to 29 years, with 90.4% or 2,502 individuals in the labor force. Within the labor force, the 25 to 29 years age range has the highest percentage of unemployed individuals, with 7.8% or 195 of them being unemployed.
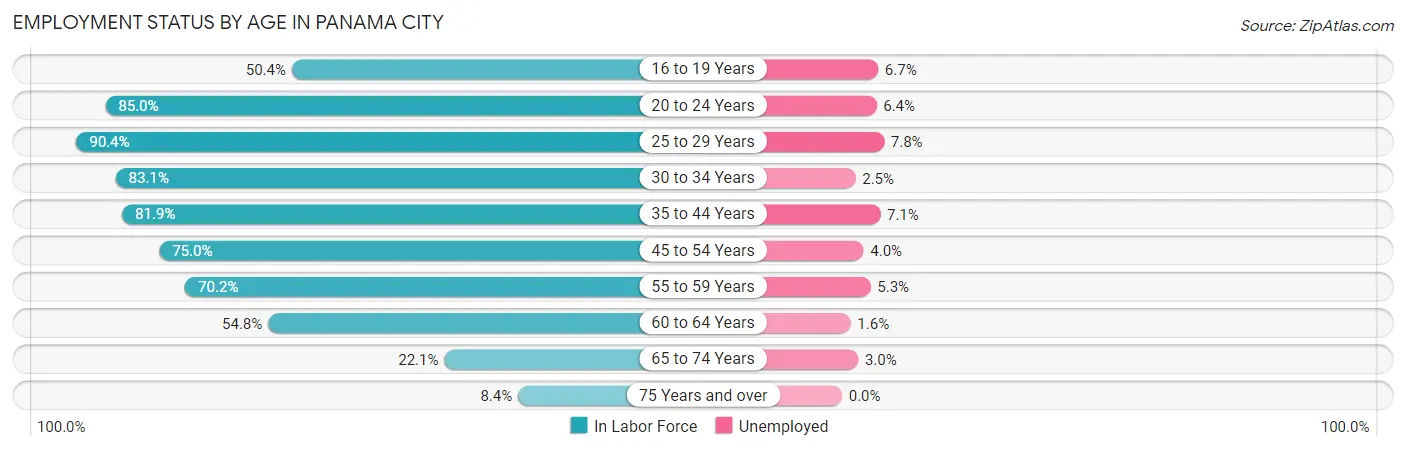
| Age Bracket | In Labor Force | Unemployed |
| 16 to 19 Years | 750 (50.4%) | 50 (6.7%) |
| 20 to 24 Years | 1,837 (85.0%) | 118 (6.4%) |
| 25 to 29 Years | 2,502 (90.4%) | 195 (7.8%) |
| 30 to 34 Years | 1,944 (83.1%) | 49 (2.5%) |
| 35 to 44 Years | 3,139 (81.9%) | 223 (7.1%) |
| 45 to 54 Years | 2,966 (75.0%) | 119 (4.0%) |
| 55 to 59 Years | 1,491 (70.2%) | 79 (5.3%) |
| 60 to 64 Years | 1,218 (54.8%) | 19 (1.6%) |
| 65 to 74 Years | 762 (22.1%) | 23 (3.0%) |
| 75 Years and over | 229 (8.4%) | 0 (0.0%) |
| Total | 16,836 (62.2%) | 859 (5.1%) |
Employment Status by Educational Attainment in Panama City
According to labor force statistics for Panama City, 76.9% of individuals (13,259) out of the total population between 25 and 64 years of age (17,242) are in the labor force, with 5.1% or 676 of them being unemployed. The group with the highest labor force participation rate are those with the educational attainment of bachelor's degree or higher, with 87.8% or 3,805 individuals in the labor force. Within the labor force, individuals with high school diploma education have the highest percentage of unemployment, with 9.2% or 287 of them being unemployed.
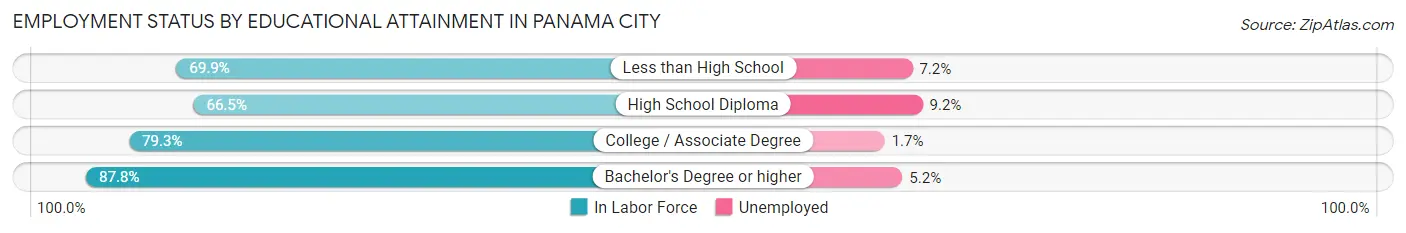
| Educational Attainment | In Labor Force | Unemployed |
| Less than High School | 1,311 (69.9%) | 135 (7.2%) |
| High School Diploma | 3,117 (66.5%) | 431 (9.2%) |
| College / Associate Degree | 5,032 (79.3%) | 108 (1.7%) |
| Bachelor's Degree or higher | 3,805 (87.8%) | 225 (5.2%) |
| Total | 13,259 (76.9%) | 879 (5.1%) |
Employment Occupations by Sex in Panama City
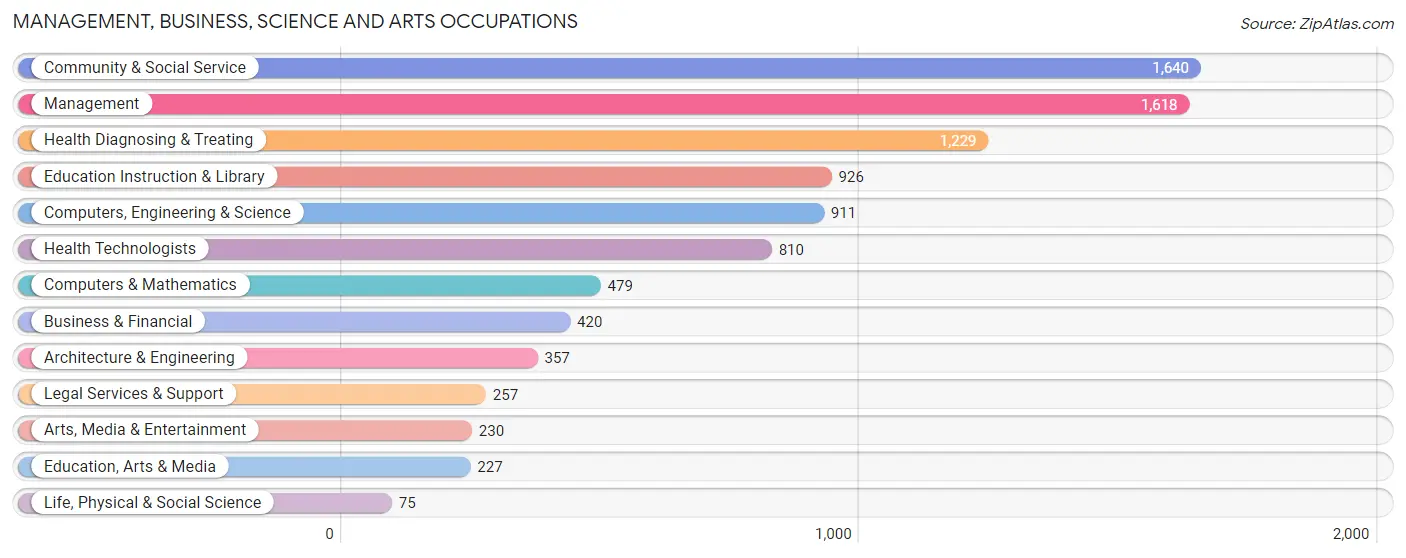
Management, Business, Science and Arts Occupations
The most common Management, Business, Science and Arts occupations in Panama City are Community & Social Service (1,640 | 10.5%), Management (1,618 | 10.4%), Health Diagnosing & Treating (1,229 | 7.9%), Education Instruction & Library (926 | 5.9%), and Computers, Engineering & Science (911 | 5.8%).
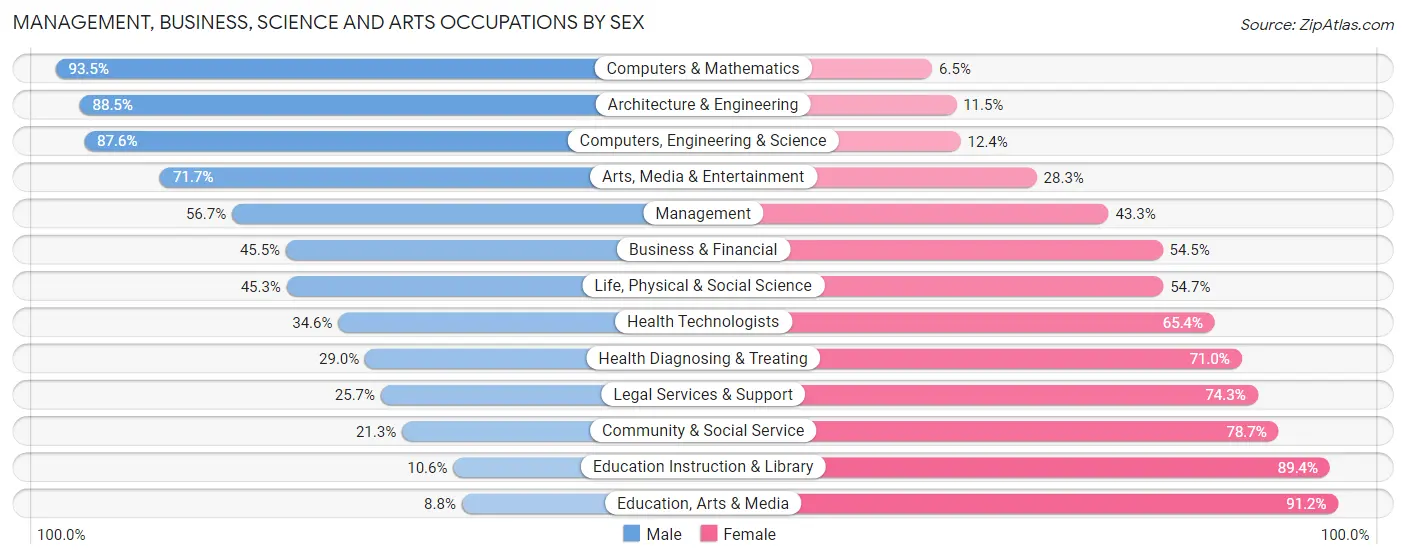
Management, Business, Science and Arts Occupations by Sex
Within the Management, Business, Science and Arts occupations in Panama City, the most male-oriented occupations are Computers & Mathematics (93.5%), Architecture & Engineering (88.5%), and Computers, Engineering & Science (87.6%), while the most female-oriented occupations are Education, Arts & Media (91.2%), Education Instruction & Library (89.4%), and Community & Social Service (78.7%).
| Occupation | Male | Female |
| Management | 918 (56.7%) | 700 (43.3%) |
| Business & Financial | 191 (45.5%) | 229 (54.5%) |
| Computers, Engineering & Science | 798 (87.6%) | 113 (12.4%) |
| Computers & Mathematics | 448 (93.5%) | 31 (6.5%) |
| Architecture & Engineering | 316 (88.5%) | 41 (11.5%) |
| Life, Physical & Social Science | 34 (45.3%) | 41 (54.7%) |
| Community & Social Service | 349 (21.3%) | 1,291 (78.7%) |
| Education, Arts & Media | 20 (8.8%) | 207 (91.2%) |
| Legal Services & Support | 66 (25.7%) | 191 (74.3%) |
| Education Instruction & Library | 98 (10.6%) | 828 (89.4%) |
| Arts, Media & Entertainment | 165 (71.7%) | 65 (28.3%) |
| Health Diagnosing & Treating | 356 (29.0%) | 873 (71.0%) |
| Health Technologists | 280 (34.6%) | 530 (65.4%) |
| Total (Category) | 2,612 (44.9%) | 3,206 (55.1%) |
| Total (Overall) | 7,722 (49.5%) | 7,864 (50.5%) |
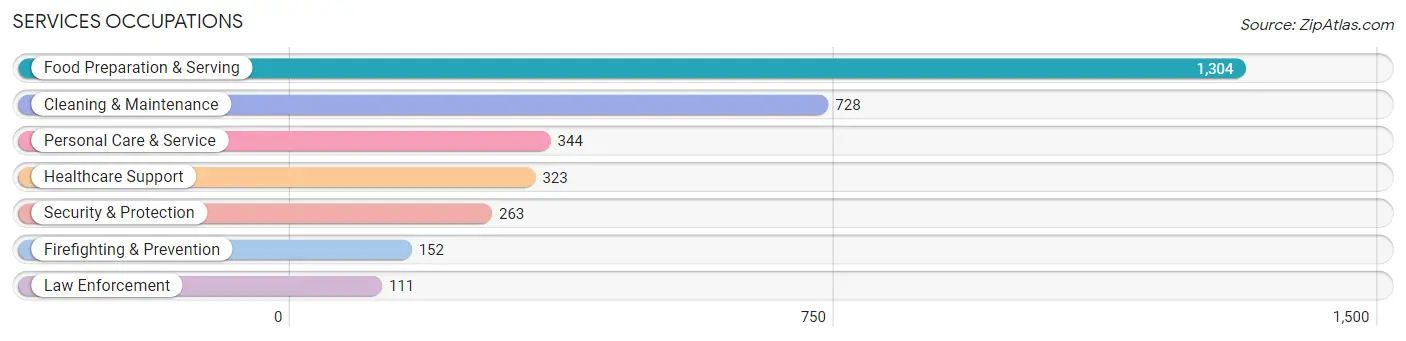
Services Occupations
The most common Services occupations in Panama City are Food Preparation & Serving (1,304 | 8.4%), Cleaning & Maintenance (728 | 4.7%), Personal Care & Service (344 | 2.2%), Healthcare Support (323 | 2.1%), and Security & Protection (263 | 1.7%).
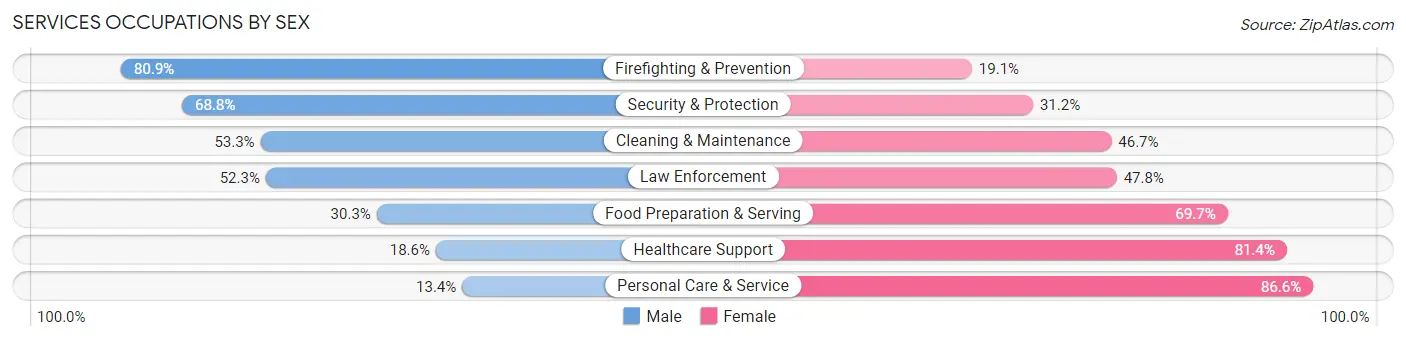
Services Occupations by Sex
Within the Services occupations in Panama City, the most male-oriented occupations are Firefighting & Prevention (80.9%), Security & Protection (68.8%), and Cleaning & Maintenance (53.3%), while the most female-oriented occupations are Personal Care & Service (86.6%), Healthcare Support (81.4%), and Food Preparation & Serving (69.7%).
| Occupation | Male | Female |
| Healthcare Support | 60 (18.6%) | 263 (81.4%) |
| Security & Protection | 181 (68.8%) | 82 (31.2%) |
| Firefighting & Prevention | 123 (80.9%) | 29 (19.1%) |
| Law Enforcement | 58 (52.2%) | 53 (47.7%) |
| Food Preparation & Serving | 395 (30.3%) | 909 (69.7%) |
| Cleaning & Maintenance | 388 (53.3%) | 340 (46.7%) |
| Personal Care & Service | 46 (13.4%) | 298 (86.6%) |
| Total (Category) | 1,070 (36.1%) | 1,892 (63.9%) |
| Total (Overall) | 7,722 (49.5%) | 7,864 (50.5%) |
Sales and Office Occupations
The most common Sales and Office occupations in Panama City are Sales & Related (1,837 | 11.8%), and Office & Administration (1,708 | 11.0%).

Sales and Office Occupations by Sex
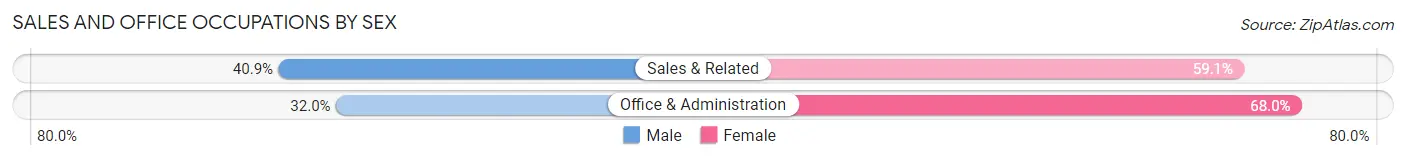
| Occupation | Male | Female |
| Sales & Related | 751 (40.9%) | 1,086 (59.1%) |
| Office & Administration | 547 (32.0%) | 1,161 (68.0%) |
| Total (Category) | 1,298 (36.6%) | 2,247 (63.4%) |
| Total (Overall) | 7,722 (49.5%) | 7,864 (50.5%) |
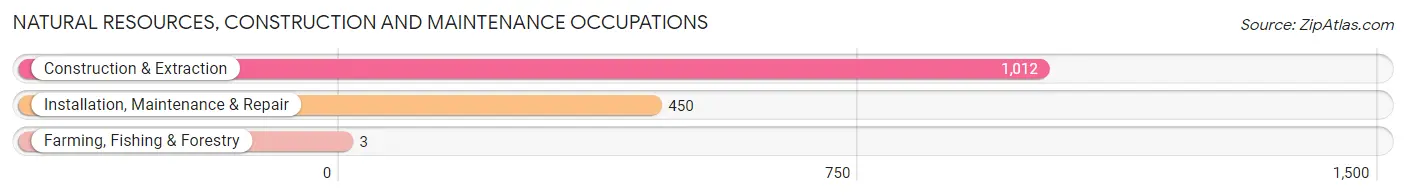
Natural Resources, Construction and Maintenance Occupations
The most common Natural Resources, Construction and Maintenance occupations in Panama City are Construction & Extraction (1,012 | 6.5%), Installation, Maintenance & Repair (450 | 2.9%), and Farming, Fishing & Forestry (3 | 0.0%).
Natural Resources, Construction and Maintenance Occupations by Sex
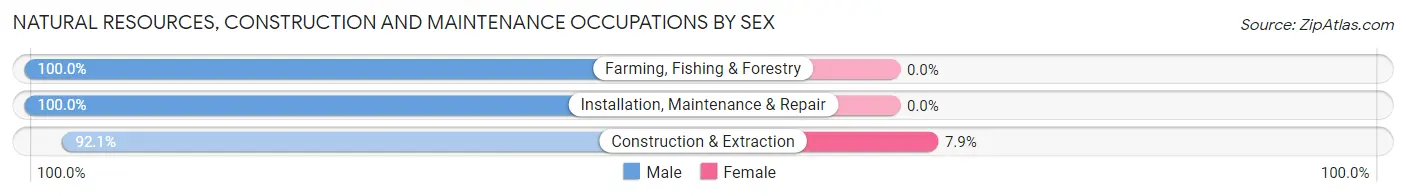
| Occupation | Male | Female |
| Farming, Fishing & Forestry | 3 (100.0%) | 0 (0.0%) |
| Construction & Extraction | 932 (92.1%) | 80 (7.9%) |
| Installation, Maintenance & Repair | 450 (100.0%) | 0 (0.0%) |
| Total (Category) | 1,385 (94.5%) | 80 (5.5%) |
| Total (Overall) | 7,722 (49.5%) | 7,864 (50.5%) |
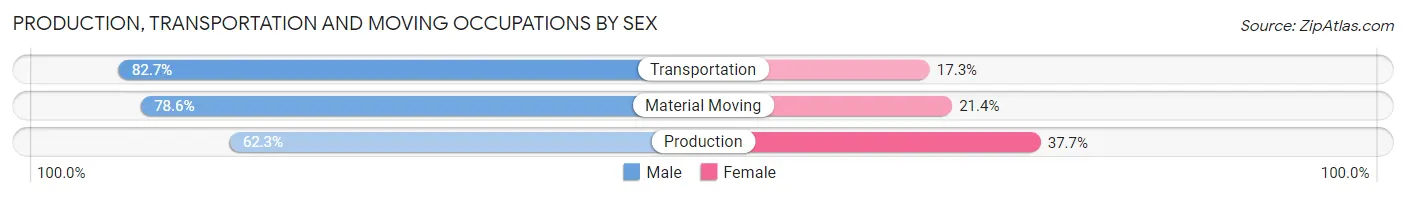
Production, Transportation and Moving Occupations
The most common Production, Transportation and Moving occupations in Panama City are Material Moving (752 | 4.8%), Transportation (566 | 3.6%), and Production (478 | 3.1%).
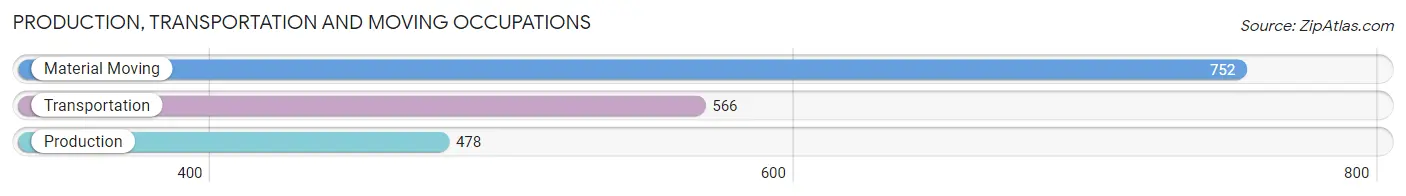
Production, Transportation and Moving Occupations by Sex
| Occupation | Male | Female |
| Production | 298 (62.3%) | 180 (37.7%) |
| Transportation | 468 (82.7%) | 98 (17.3%) |
| Material Moving | 591 (78.6%) | 161 (21.4%) |
| Total (Category) | 1,357 (75.6%) | 439 (24.4%) |
| Total (Overall) | 7,722 (49.5%) | 7,864 (50.5%) |
Employment Industries by Sex in Panama City
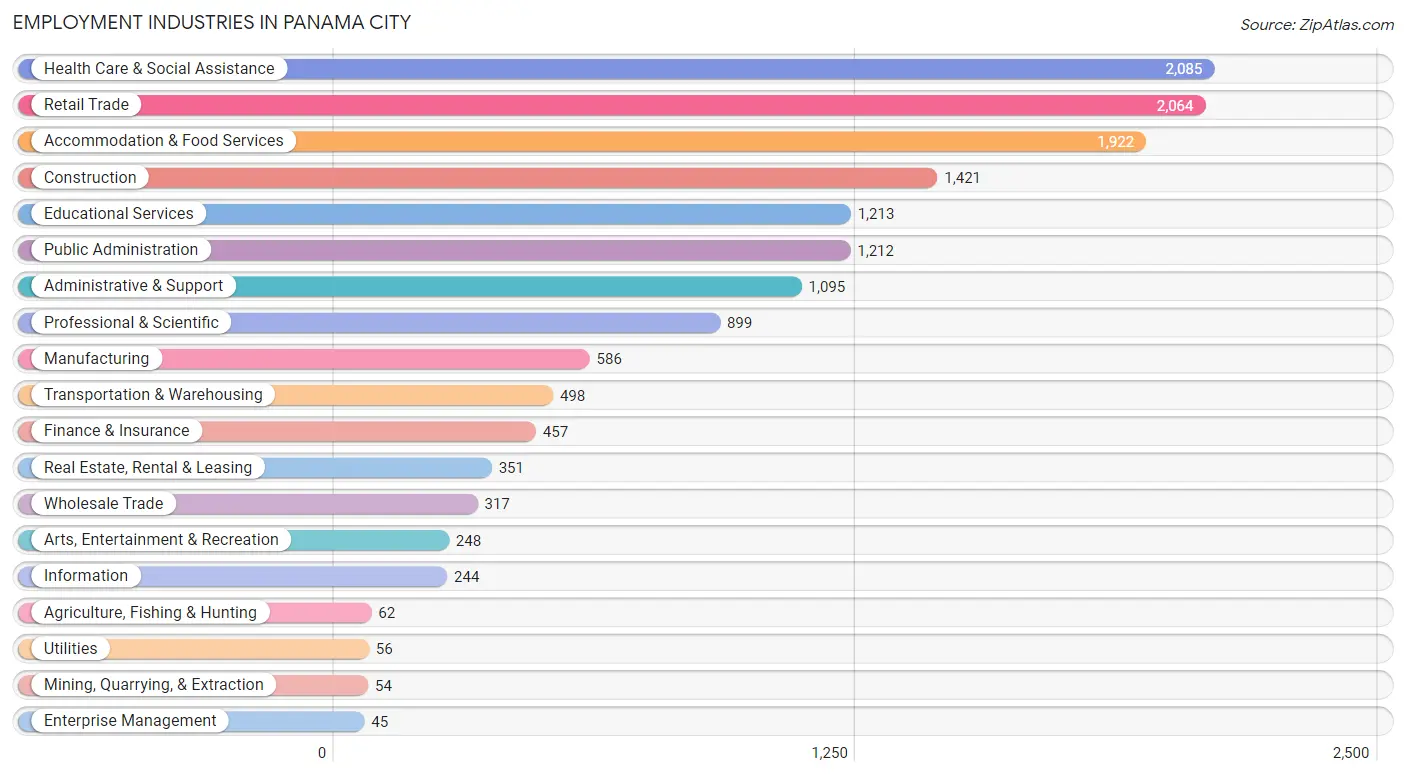
Employment Industries in Panama City
The major employment industries in Panama City include Health Care & Social Assistance (2,085 | 13.4%), Retail Trade (2,064 | 13.2%), Accommodation & Food Services (1,922 | 12.3%), Construction (1,421 | 9.1%), and Educational Services (1,213 | 7.8%).
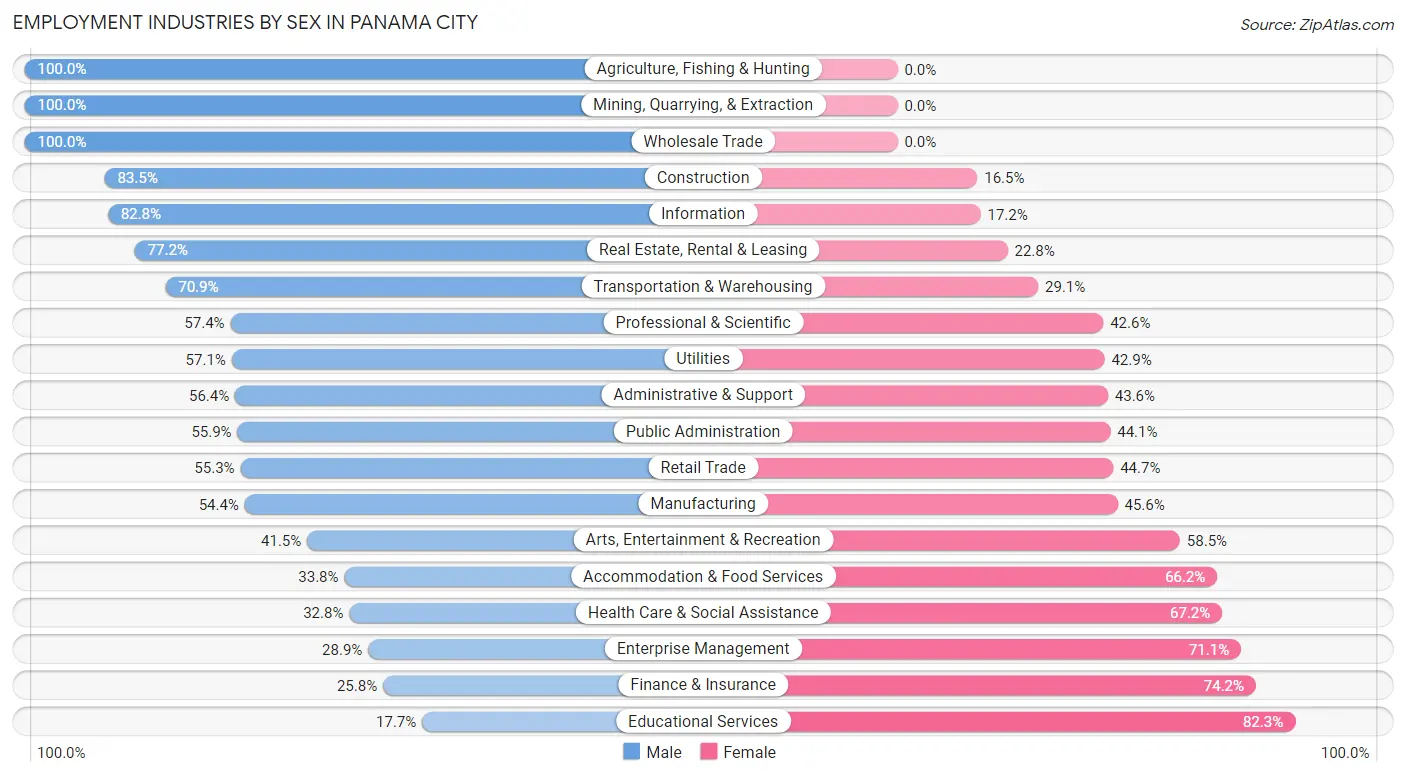
Employment Industries by Sex in Panama City
The Panama City industries that see more men than women are Agriculture, Fishing & Hunting (100.0%), Mining, Quarrying, & Extraction (100.0%), and Wholesale Trade (100.0%), whereas the industries that tend to have a higher number of women are Educational Services (82.3%), Finance & Insurance (74.2%), and Enterprise Management (71.1%).
| Industry | Male | Female |
| Agriculture, Fishing & Hunting | 62 (100.0%) | 0 (0.0%) |
| Mining, Quarrying, & Extraction | 54 (100.0%) | 0 (0.0%) |
| Construction | 1,186 (83.5%) | 235 (16.5%) |
| Manufacturing | 319 (54.4%) | 267 (45.6%) |
| Wholesale Trade | 317 (100.0%) | 0 (0.0%) |
| Retail Trade | 1,142 (55.3%) | 922 (44.7%) |
| Transportation & Warehousing | 353 (70.9%) | 145 (29.1%) |
| Utilities | 32 (57.1%) | 24 (42.9%) |
| Information | 202 (82.8%) | 42 (17.2%) |
| Finance & Insurance | 118 (25.8%) | 339 (74.2%) |
| Real Estate, Rental & Leasing | 271 (77.2%) | 80 (22.8%) |
| Professional & Scientific | 516 (57.4%) | 383 (42.6%) |
| Enterprise Management | 13 (28.9%) | 32 (71.1%) |
| Administrative & Support | 618 (56.4%) | 477 (43.6%) |
| Educational Services | 215 (17.7%) | 998 (82.3%) |
| Health Care & Social Assistance | 684 (32.8%) | 1,401 (67.2%) |
| Arts, Entertainment & Recreation | 103 (41.5%) | 145 (58.5%) |
| Accommodation & Food Services | 650 (33.8%) | 1,272 (66.2%) |
| Public Administration | 678 (55.9%) | 534 (44.1%) |
| Total | 7,722 (49.5%) | 7,864 (50.5%) |
Education in Panama City
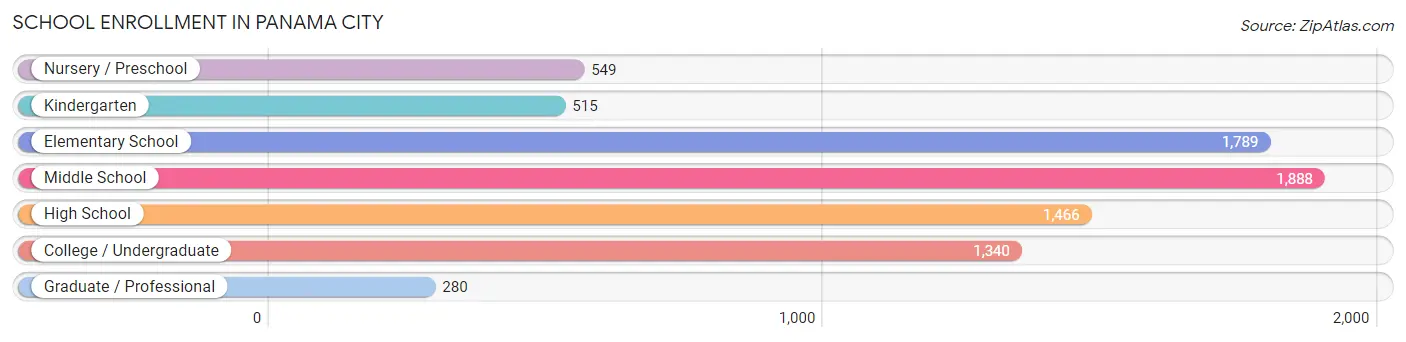
School Enrollment in Panama City
The most common levels of schooling among the 7,827 students in Panama City are middle school (1,888 | 24.1%), elementary school (1,789 | 22.9%), and high school (1,466 | 18.7%).
| School Level | # Students | % Students |
| Nursery / Preschool | 549 | 7.0% |
| Kindergarten | 515 | 6.6% |
| Elementary School | 1,789 | 22.9% |
| Middle School | 1,888 | 24.1% |
| High School | 1,466 | 18.7% |
| College / Undergraduate | 1,340 | 17.1% |
| Graduate / Professional | 280 | 3.6% |
| Total | 7,827 | 100.0% |
School Enrollment by Age by Funding Source in Panama City
Out of a total of 7,827 students who are enrolled in schools in Panama City, 1,080 (13.8%) attend a private institution, while the remaining 6,747 (86.2%) are enrolled in public schools. The age group of 3 to 4 year olds has the highest likelihood of being enrolled in private schools, with 204 (46.5% in the age bracket) enrolled. Conversely, the age group of 18 to 19 year olds has the lowest likelihood of being enrolled in a private school, with 377 (97.7% in the age bracket) attending a public institution.
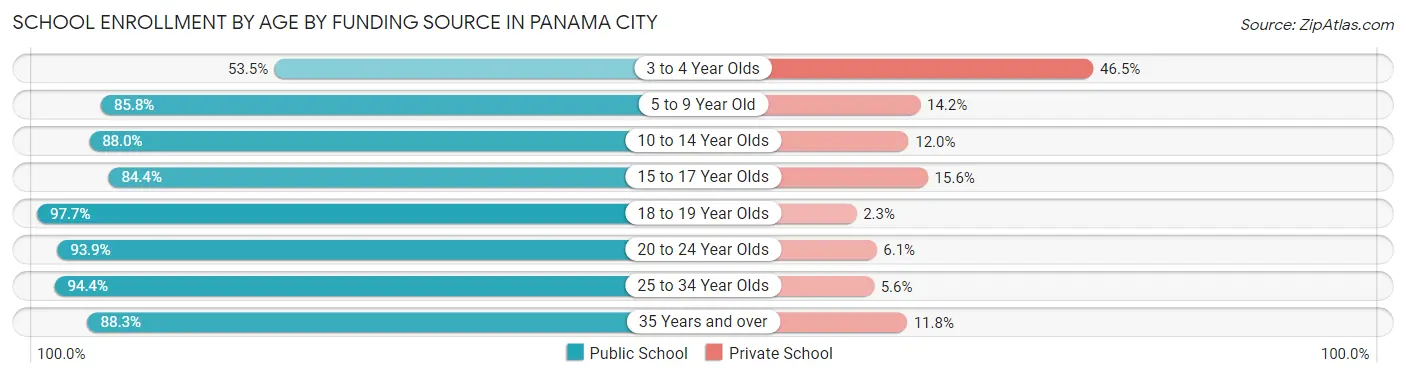
| Age Bracket | Public School | Private School |
| 3 to 4 Year Olds | 235 (53.5%) | 204 (46.5%) |
| 5 to 9 Year Old | 1,815 (85.8%) | 301 (14.2%) |
| 10 to 14 Year Olds | 2,148 (88.0%) | 294 (12.0%) |
| 15 to 17 Year Olds | 906 (84.4%) | 168 (15.6%) |
| 18 to 19 Year Olds | 377 (97.7%) | 9 (2.3%) |
| 20 to 24 Year Olds | 478 (93.9%) | 31 (6.1%) |
| 25 to 34 Year Olds | 371 (94.4%) | 22 (5.6%) |
| 35 Years and over | 413 (88.2%) | 55 (11.7%) |
| Total | 6,747 (86.2%) | 1,080 (13.8%) |
Educational Attainment by Field of Study in Panama City
Business (1,378 | 22.1%), education (1,212 | 19.5%), engineering (520 | 8.4%), science & technology (512 | 8.2%), and social sciences (408 | 6.6%) are the most common fields of study among 6,225 individuals in Panama City who have obtained a bachelor's degree or higher.
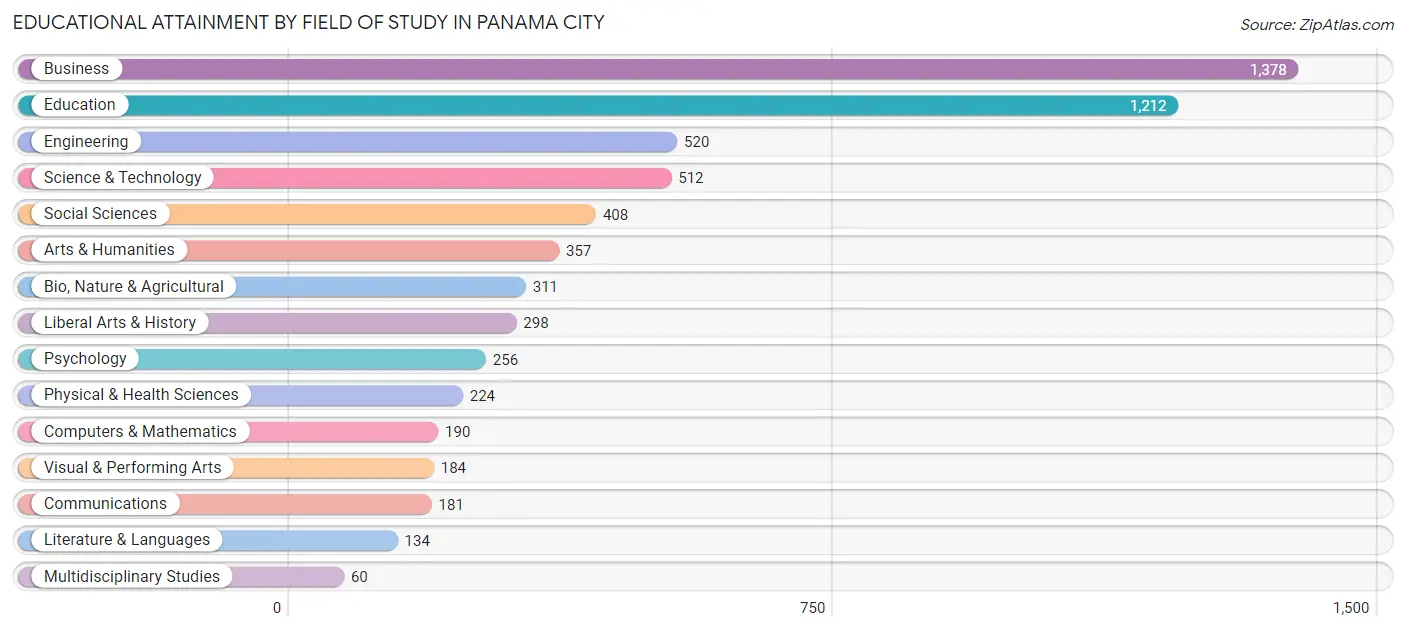
| Field of Study | # Graduates | % Graduates |
| Computers & Mathematics | 190 | 3.0% |
| Bio, Nature & Agricultural | 311 | 5.0% |
| Physical & Health Sciences | 224 | 3.6% |
| Psychology | 256 | 4.1% |
| Social Sciences | 408 | 6.6% |
| Engineering | 520 | 8.4% |
| Multidisciplinary Studies | 60 | 1.0% |
| Science & Technology | 512 | 8.2% |
| Business | 1,378 | 22.1% |
| Education | 1,212 | 19.5% |
| Literature & Languages | 134 | 2.1% |
| Liberal Arts & History | 298 | 4.8% |
| Visual & Performing Arts | 184 | 3.0% |
| Communications | 181 | 2.9% |
| Arts & Humanities | 357 | 5.7% |
| Total | 6,225 | 100.0% |
Transportation & Commute in Panama City
Vehicle Availability by Sex in Panama City
The most prevalent vehicle ownership categories in Panama City are males with 2 vehicles (3,747, accounting for 47.2%) and females with 2 vehicles (3,540, making up 49.5%).
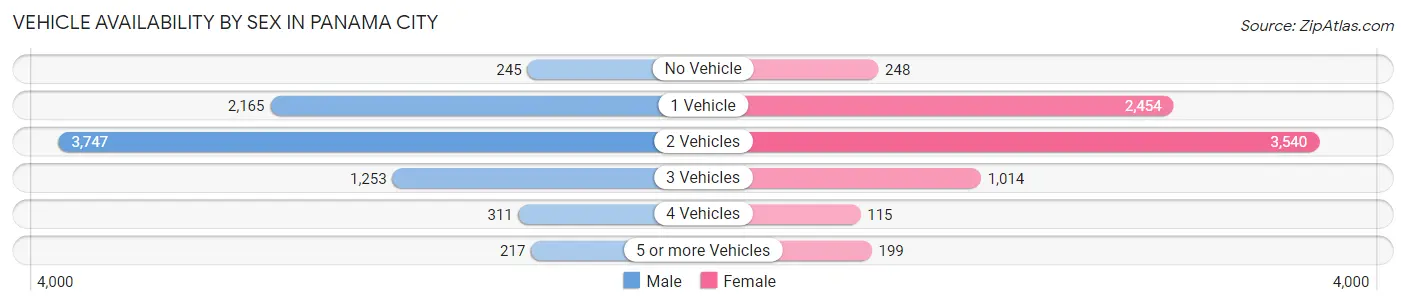
| Vehicles Available | Male | Female |
| No Vehicle | 245 (3.1%) | 248 (3.3%) |
| 1 Vehicle | 2,165 (27.3%) | 2,454 (32.4%) |
| 2 Vehicles | 3,747 (47.2%) | 3,540 (46.8%) |
| 3 Vehicles | 1,253 (15.8%) | 1,014 (13.4%) |
| 4 Vehicles | 311 (3.9%) | 115 (1.5%) |
| 5 or more Vehicles | 217 (2.7%) | 199 (2.6%) |
| Total | 7,938 (100.0%) | 7,570 (100.0%) |
Commute Time in Panama City
The most frequently occuring commute durations in Panama City are 15 to 19 minutes (3,226 commuters, 22.1%), 10 to 14 minutes (2,527 commuters, 17.3%), and 5 to 9 minutes (2,155 commuters, 14.8%).
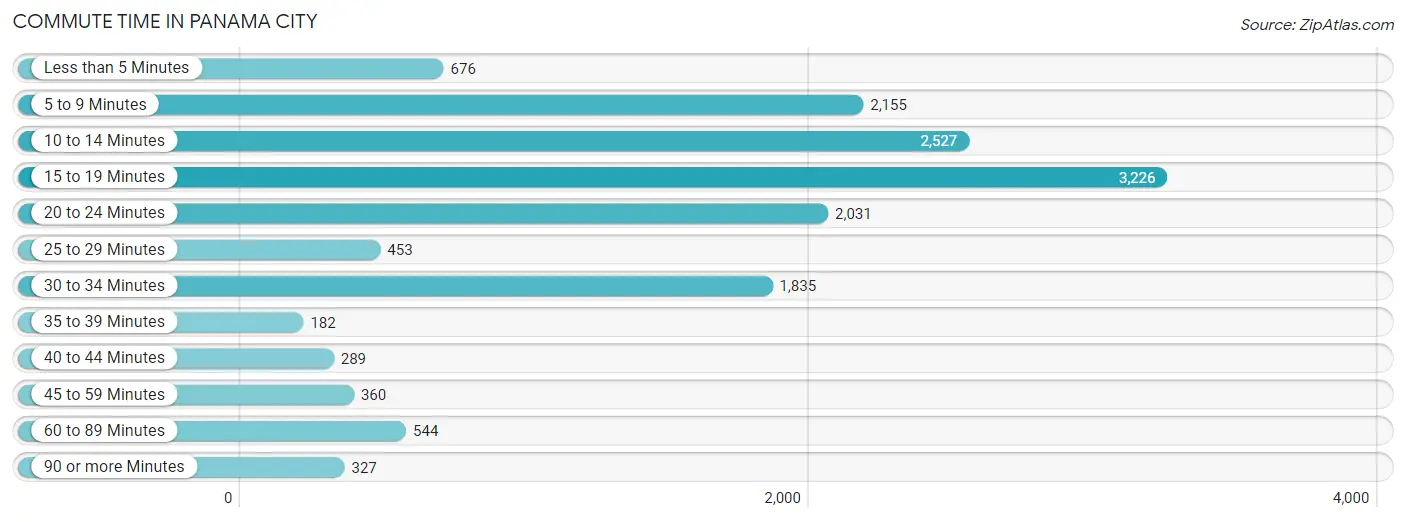
| Commute Time | # Commuters | % Commuters |
| Less than 5 Minutes | 676 | 4.6% |
| 5 to 9 Minutes | 2,155 | 14.8% |
| 10 to 14 Minutes | 2,527 | 17.3% |
| 15 to 19 Minutes | 3,226 | 22.1% |
| 20 to 24 Minutes | 2,031 | 13.9% |
| 25 to 29 Minutes | 453 | 3.1% |
| 30 to 34 Minutes | 1,835 | 12.6% |
| 35 to 39 Minutes | 182 | 1.3% |
| 40 to 44 Minutes | 289 | 2.0% |
| 45 to 59 Minutes | 360 | 2.5% |
| 60 to 89 Minutes | 544 | 3.7% |
| 90 or more Minutes | 327 | 2.2% |
Commute Time by Sex in Panama City
The most common commute times in Panama City are 15 to 19 minutes (1,552 commuters, 20.8%) for males and 15 to 19 minutes (1,674 commuters, 23.4%) for females.
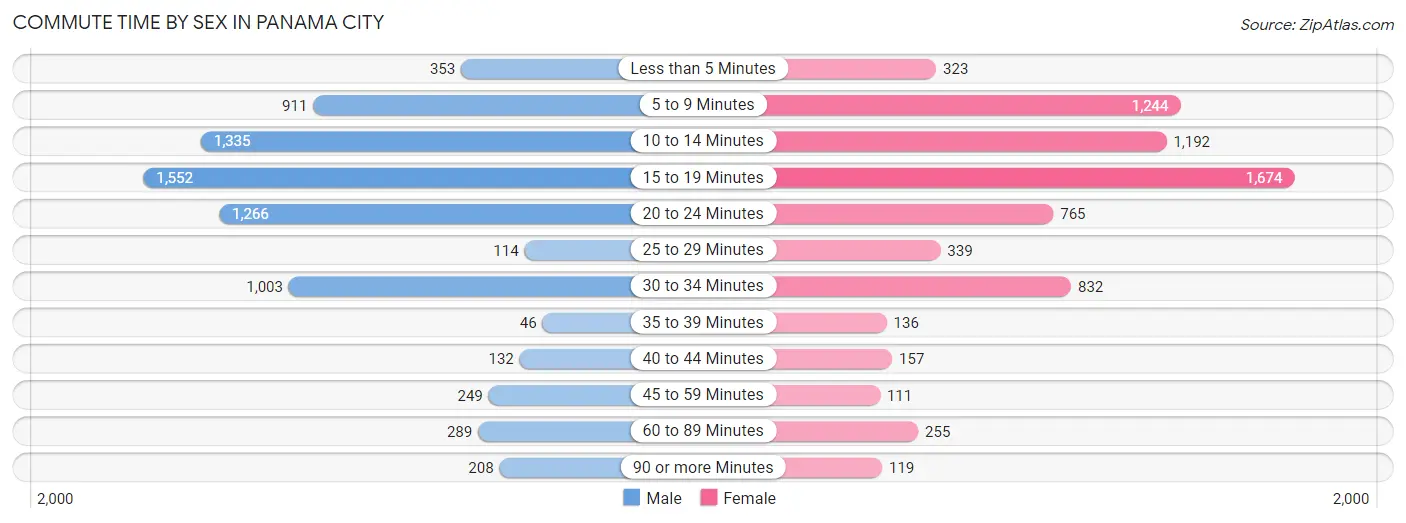
| Commute Time | Male | Female |
| Less than 5 Minutes | 353 (4.7%) | 323 (4.5%) |
| 5 to 9 Minutes | 911 (12.2%) | 1,244 (17.4%) |
| 10 to 14 Minutes | 1,335 (17.9%) | 1,192 (16.7%) |
| 15 to 19 Minutes | 1,552 (20.8%) | 1,674 (23.4%) |
| 20 to 24 Minutes | 1,266 (17.0%) | 765 (10.7%) |
| 25 to 29 Minutes | 114 (1.5%) | 339 (4.7%) |
| 30 to 34 Minutes | 1,003 (13.5%) | 832 (11.6%) |
| 35 to 39 Minutes | 46 (0.6%) | 136 (1.9%) |
| 40 to 44 Minutes | 132 (1.8%) | 157 (2.2%) |
| 45 to 59 Minutes | 249 (3.3%) | 111 (1.5%) |
| 60 to 89 Minutes | 289 (3.9%) | 255 (3.6%) |
| 90 or more Minutes | 208 (2.8%) | 119 (1.7%) |
Time of Departure to Work by Sex in Panama City
The most frequent times of departure to work in Panama City are 7:30 AM to 7:59 AM (1,209, 16.2%) for males and 8:00 AM to 8:29 AM (1,162, 16.3%) for females.
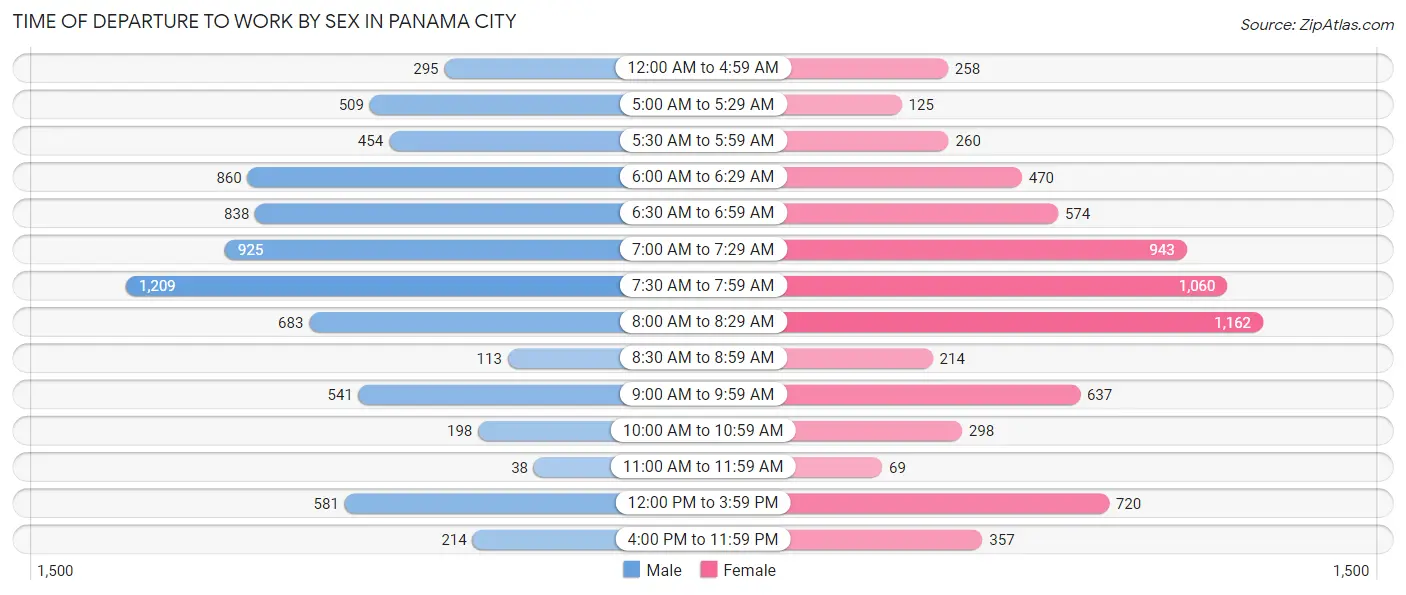
| Time of Departure | Male | Female |
| 12:00 AM to 4:59 AM | 295 (4.0%) | 258 (3.6%) |
| 5:00 AM to 5:29 AM | 509 (6.8%) | 125 (1.8%) |
| 5:30 AM to 5:59 AM | 454 (6.1%) | 260 (3.6%) |
| 6:00 AM to 6:29 AM | 860 (11.5%) | 470 (6.6%) |
| 6:30 AM to 6:59 AM | 838 (11.2%) | 574 (8.0%) |
| 7:00 AM to 7:29 AM | 925 (12.4%) | 943 (13.2%) |
| 7:30 AM to 7:59 AM | 1,209 (16.2%) | 1,060 (14.8%) |
| 8:00 AM to 8:29 AM | 683 (9.2%) | 1,162 (16.3%) |
| 8:30 AM to 8:59 AM | 113 (1.5%) | 214 (3.0%) |
| 9:00 AM to 9:59 AM | 541 (7.2%) | 637 (8.9%) |
| 10:00 AM to 10:59 AM | 198 (2.6%) | 298 (4.2%) |
| 11:00 AM to 11:59 AM | 38 (0.5%) | 69 (1.0%) |
| 12:00 PM to 3:59 PM | 581 (7.8%) | 720 (10.1%) |
| 4:00 PM to 11:59 PM | 214 (2.9%) | 357 (5.0%) |
| Total | 7,458 (100.0%) | 7,147 (100.0%) |
Housing Occupancy in Panama City
Occupancy by Ownership in Panama City
Of the total 14,550 dwellings in Panama City, owner-occupied units account for 8,046 (55.3%), while renter-occupied units make up 6,504 (44.7%).
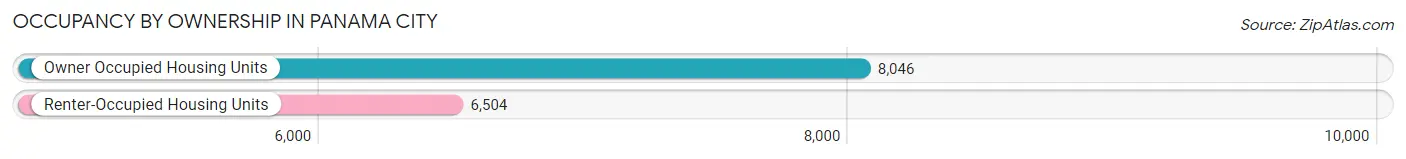
| Occupancy | # Housing Units | % Housing Units |
| Owner Occupied Housing Units | 8,046 | 55.3% |
| Renter-Occupied Housing Units | 6,504 | 44.7% |
| Total Occupied Housing Units | 14,550 | 100.0% |
Occupancy by Household Size in Panama City
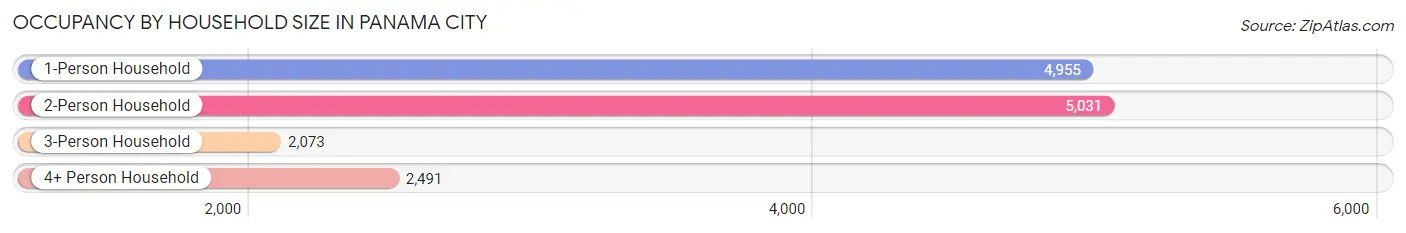
| Household Size | # Housing Units | % Housing Units |
| 1-Person Household | 4,955 | 34.1% |
| 2-Person Household | 5,031 | 34.6% |
| 3-Person Household | 2,073 | 14.2% |
| 4+ Person Household | 2,491 | 17.1% |
| Total Housing Units | 14,550 | 100.0% |
Occupancy by Ownership by Household Size in Panama City
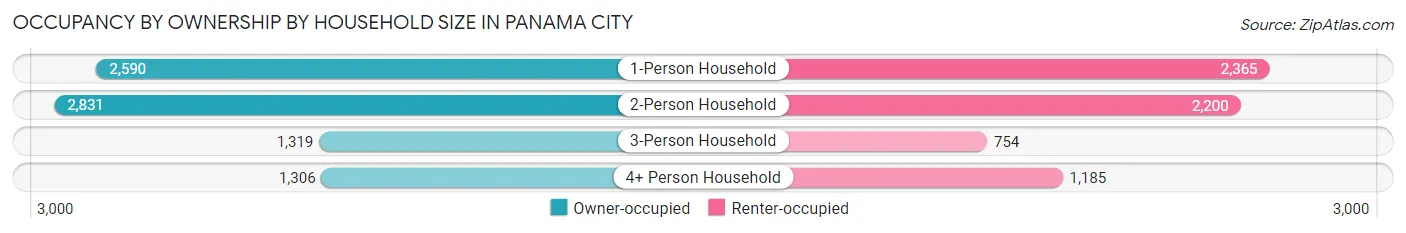
| Household Size | Owner-occupied | Renter-occupied |
| 1-Person Household | 2,590 (52.3%) | 2,365 (47.7%) |
| 2-Person Household | 2,831 (56.3%) | 2,200 (43.7%) |
| 3-Person Household | 1,319 (63.6%) | 754 (36.4%) |
| 4+ Person Household | 1,306 (52.4%) | 1,185 (47.6%) |
| Total Housing Units | 8,046 (55.3%) | 6,504 (44.7%) |
Occupancy by Educational Attainment in Panama City
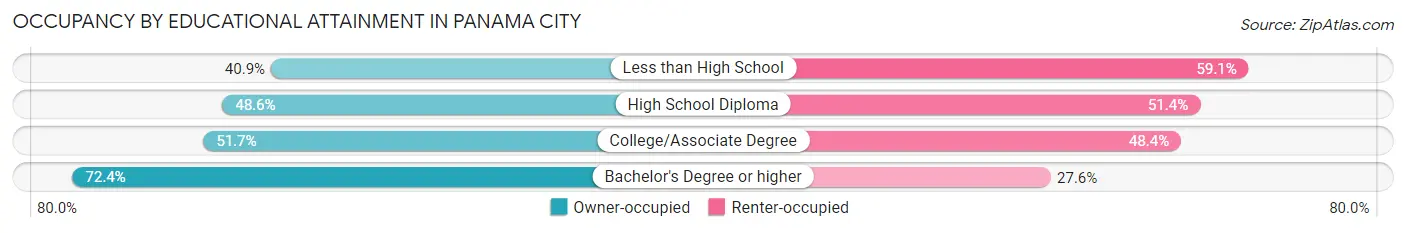
| Household Size | Owner-occupied | Renter-occupied |
| Less than High School | 578 (40.9%) | 834 (59.1%) |
| High School Diploma | 1,751 (48.6%) | 1,849 (51.4%) |
| College/Associate Degree | 2,959 (51.6%) | 2,770 (48.3%) |
| Bachelor's Degree or higher | 2,758 (72.4%) | 1,051 (27.6%) |
Occupancy by Age of Householder in Panama City
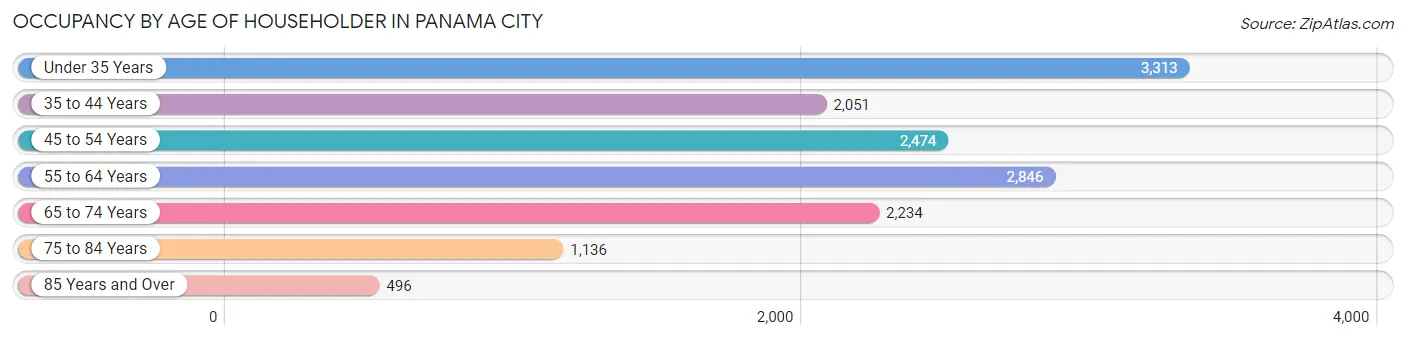
| Age Bracket | # Households | % Households |
| Under 35 Years | 3,313 | 22.8% |
| 35 to 44 Years | 2,051 | 14.1% |
| 45 to 54 Years | 2,474 | 17.0% |
| 55 to 64 Years | 2,846 | 19.6% |
| 65 to 74 Years | 2,234 | 15.3% |
| 75 to 84 Years | 1,136 | 7.8% |
| 85 Years and Over | 496 | 3.4% |
| Total | 14,550 | 100.0% |
Housing Finances in Panama City
Median Income by Occupancy in Panama City
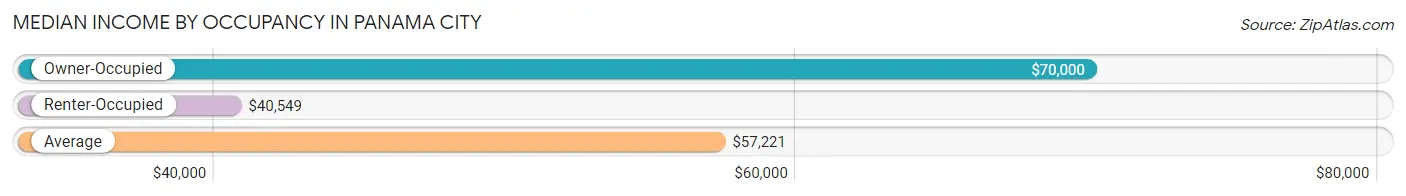
| Occupancy Type | # Households | Median Income |
| Owner-Occupied | 8,046 (55.3%) | $70,000 |
| Renter-Occupied | 6,504 (44.7%) | $40,549 |
| Average | 14,550 (100.0%) | $57,221 |
Occupancy by Householder Income Bracket in Panama City
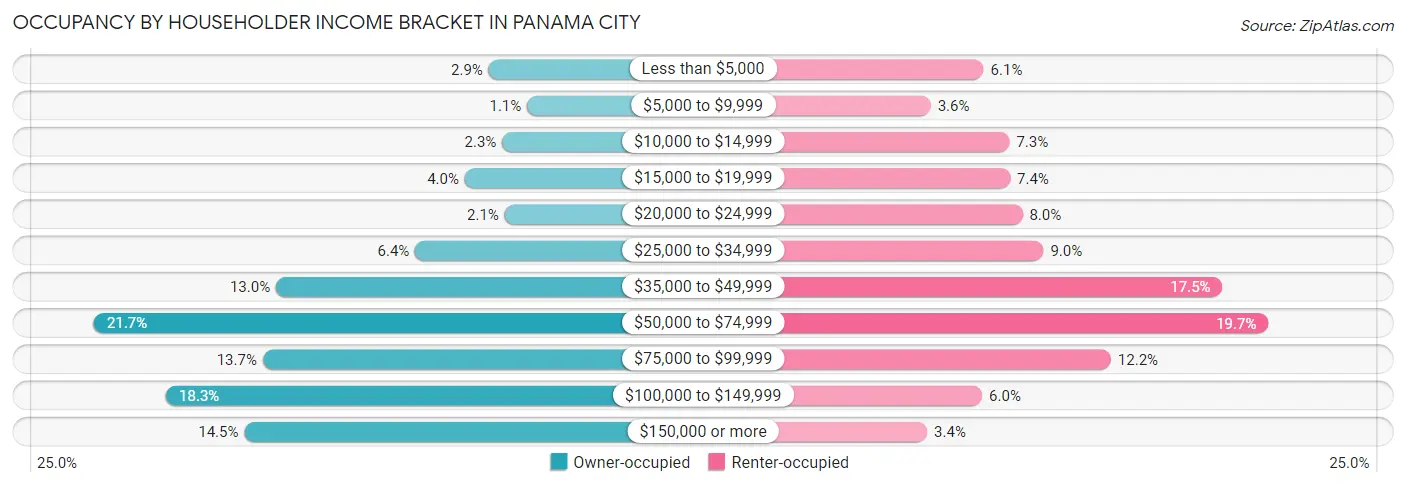
| Income Bracket | Owner-occupied | Renter-occupied |
| Less than $5,000 | 233 (2.9%) | 397 (6.1%) |
| $5,000 to $9,999 | 86 (1.1%) | 233 (3.6%) |
| $10,000 to $14,999 | 182 (2.3%) | 477 (7.3%) |
| $15,000 to $19,999 | 325 (4.0%) | 479 (7.4%) |
| $20,000 to $24,999 | 172 (2.1%) | 517 (8.0%) |
| $25,000 to $34,999 | 515 (6.4%) | 582 (8.9%) |
| $35,000 to $49,999 | 1,048 (13.0%) | 1,136 (17.5%) |
| $50,000 to $74,999 | 1,746 (21.7%) | 1,278 (19.7%) |
| $75,000 to $99,999 | 1,099 (13.7%) | 791 (12.2%) |
| $100,000 to $149,999 | 1,470 (18.3%) | 392 (6.0%) |
| $150,000 or more | 1,170 (14.5%) | 222 (3.4%) |
| Total | 8,046 (100.0%) | 6,504 (100.0%) |
Monthly Housing Cost Tiers in Panama City
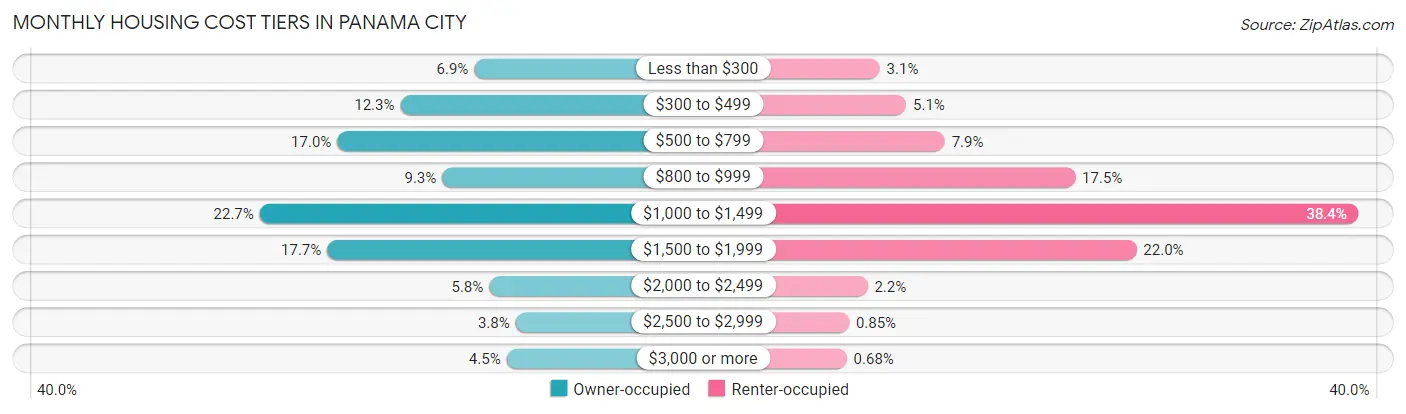
| Monthly Cost | Owner-occupied | Renter-occupied |
| Less than $300 | 554 (6.9%) | 202 (3.1%) |
| $300 to $499 | 992 (12.3%) | 329 (5.1%) |
| $500 to $799 | 1,366 (17.0%) | 514 (7.9%) |
| $800 to $999 | 744 (9.2%) | 1,139 (17.5%) |
| $1,000 to $1,499 | 1,826 (22.7%) | 2,496 (38.4%) |
| $1,500 to $1,999 | 1,426 (17.7%) | 1,432 (22.0%) |
| $2,000 to $2,499 | 466 (5.8%) | 144 (2.2%) |
| $2,500 to $2,999 | 309 (3.8%) | 55 (0.9%) |
| $3,000 or more | 363 (4.5%) | 44 (0.7%) |
| Total | 8,046 (100.0%) | 6,504 (100.0%) |
Physical Housing Characteristics in Panama City
Housing Structures in Panama City
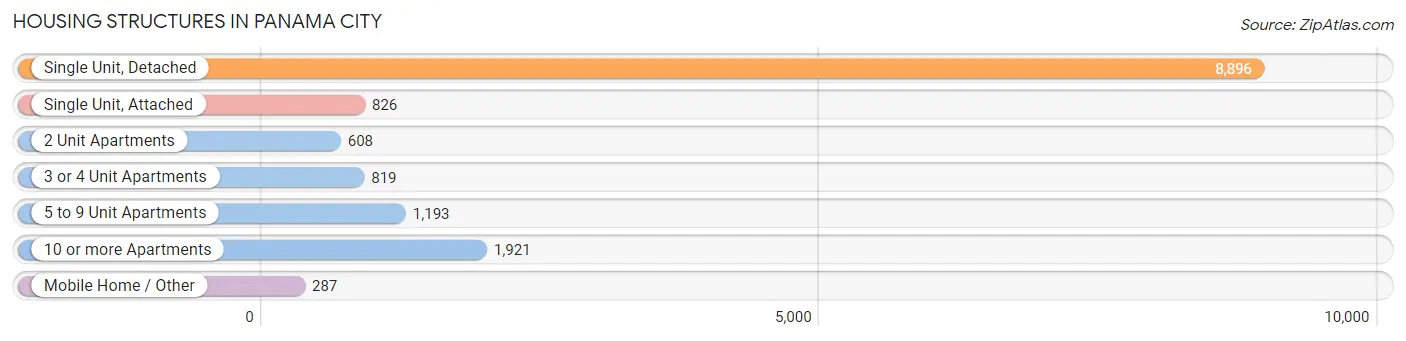
| Structure Type | # Housing Units | % Housing Units |
| Single Unit, Detached | 8,896 | 61.1% |
| Single Unit, Attached | 826 | 5.7% |
| 2 Unit Apartments | 608 | 4.2% |
| 3 or 4 Unit Apartments | 819 | 5.6% |
| 5 to 9 Unit Apartments | 1,193 | 8.2% |
| 10 or more Apartments | 1,921 | 13.2% |
| Mobile Home / Other | 287 | 2.0% |
| Total | 14,550 | 100.0% |
Housing Structures by Occupancy in Panama City
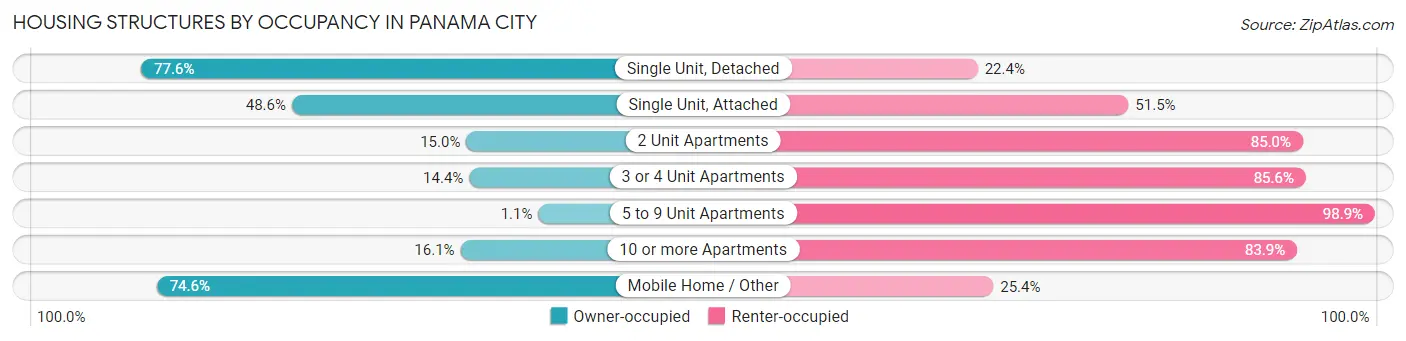
| Structure Type | Owner-occupied | Renter-occupied |
| Single Unit, Detached | 6,900 (77.6%) | 1,996 (22.4%) |
| Single Unit, Attached | 401 (48.5%) | 425 (51.4%) |
| 2 Unit Apartments | 91 (15.0%) | 517 (85.0%) |
| 3 or 4 Unit Apartments | 118 (14.4%) | 701 (85.6%) |
| 5 to 9 Unit Apartments | 13 (1.1%) | 1,180 (98.9%) |
| 10 or more Apartments | 309 (16.1%) | 1,612 (83.9%) |
| Mobile Home / Other | 214 (74.6%) | 73 (25.4%) |
| Total | 8,046 (55.3%) | 6,504 (44.7%) |
Housing Structures by Number of Rooms in Panama City
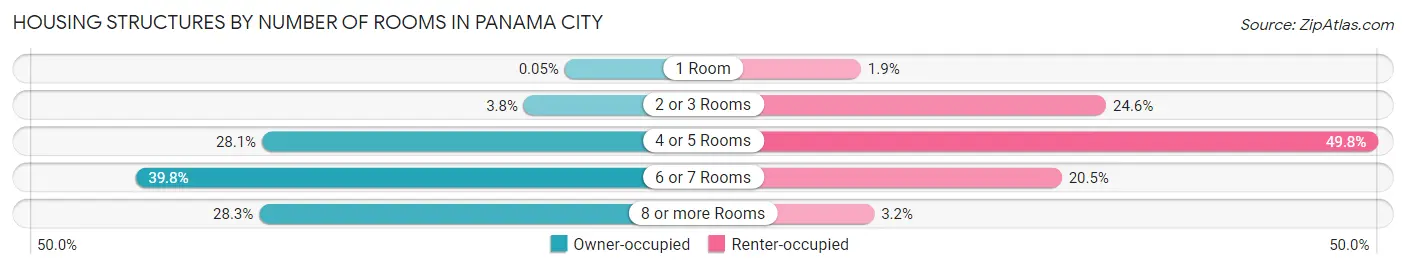
| Number of Rooms | Owner-occupied | Renter-occupied |
| 1 Room | 4 (0.1%) | 126 (1.9%) |
| 2 or 3 Rooms | 308 (3.8%) | 1,601 (24.6%) |
| 4 or 5 Rooms | 2,257 (28.1%) | 3,237 (49.8%) |
| 6 or 7 Rooms | 3,199 (39.8%) | 1,334 (20.5%) |
| 8 or more Rooms | 2,278 (28.3%) | 206 (3.2%) |
| Total | 8,046 (100.0%) | 6,504 (100.0%) |
Housing Structure by Heating Type in Panama City
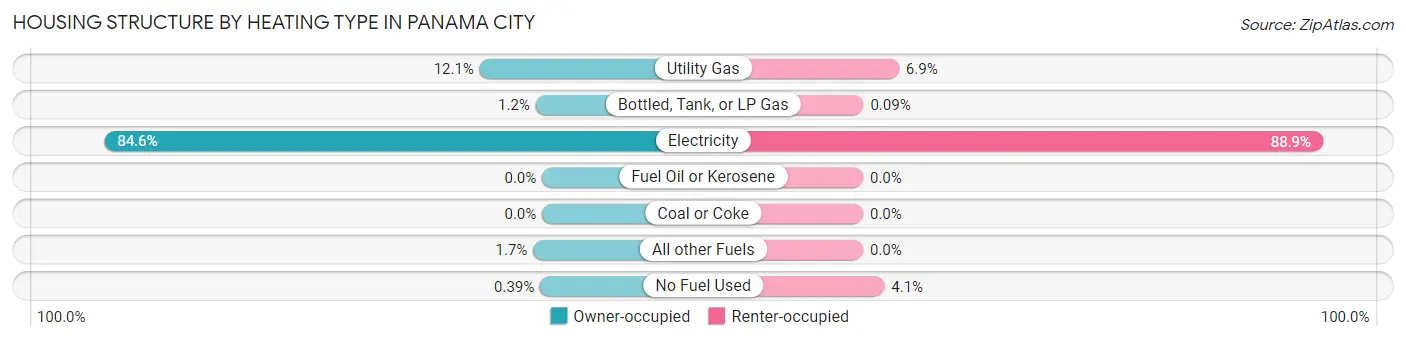
| Heating Type | Owner-occupied | Renter-occupied |
| Utility Gas | 970 (12.1%) | 451 (6.9%) |
| Bottled, Tank, or LP Gas | 100 (1.2%) | 6 (0.1%) |
| Electricity | 6,807 (84.6%) | 5,779 (88.8%) |
| Fuel Oil or Kerosene | 0 (0.0%) | 0 (0.0%) |
| Coal or Coke | 0 (0.0%) | 0 (0.0%) |
| All other Fuels | 138 (1.7%) | 0 (0.0%) |
| No Fuel Used | 31 (0.4%) | 268 (4.1%) |
| Total | 8,046 (100.0%) | 6,504 (100.0%) |
Household Vehicle Usage in Panama City
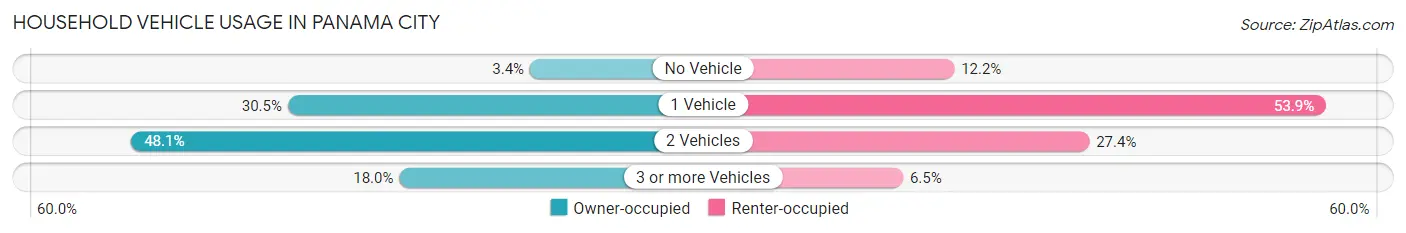
| Vehicles per Household | Owner-occupied | Renter-occupied |
| No Vehicle | 273 (3.4%) | 796 (12.2%) |
| 1 Vehicle | 2,456 (30.5%) | 3,505 (53.9%) |
| 2 Vehicles | 3,866 (48.0%) | 1,780 (27.4%) |
| 3 or more Vehicles | 1,451 (18.0%) | 423 (6.5%) |
| Total | 8,046 (100.0%) | 6,504 (100.0%) |
Real Estate & Mortgages in Panama City
Real Estate and Mortgage Overview in Panama City
| Characteristic | Without Mortgage | With Mortgage |
| Housing Units | 3,271 | 4,775 |
| Median Property Value | $178,700 | $237,200 |
| Median Household Income | $56,534 | $847 |
| Monthly Housing Costs | $518 | $343 |
| Real Estate Taxes | $1,090 | $203 |
Property Value by Mortgage Status in Panama City
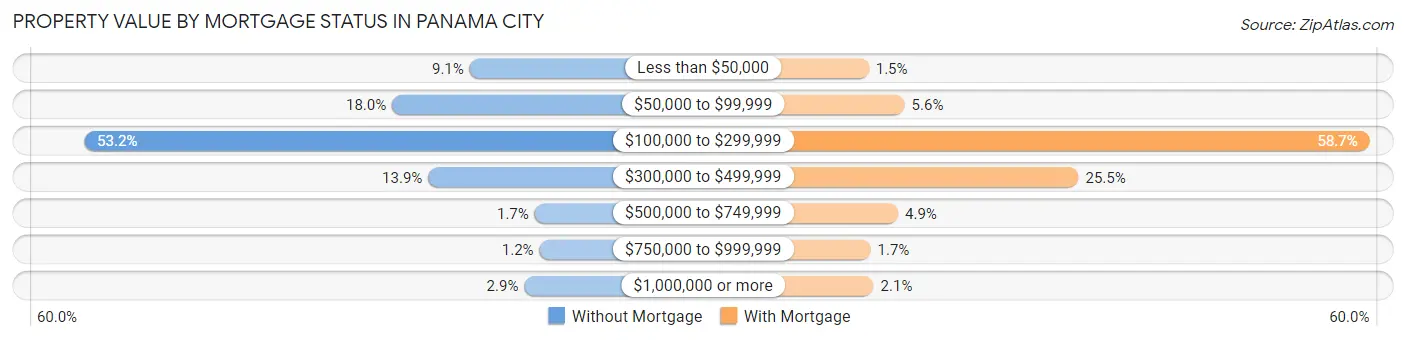
| Property Value | Without Mortgage | With Mortgage |
| Less than $50,000 | 299 (9.1%) | 72 (1.5%) |
| $50,000 to $99,999 | 589 (18.0%) | 268 (5.6%) |
| $100,000 to $299,999 | 1,740 (53.2%) | 2,805 (58.7%) |
| $300,000 to $499,999 | 454 (13.9%) | 1,217 (25.5%) |
| $500,000 to $749,999 | 56 (1.7%) | 232 (4.9%) |
| $750,000 to $999,999 | 38 (1.2%) | 82 (1.7%) |
| $1,000,000 or more | 95 (2.9%) | 99 (2.1%) |
| Total | 3,271 (100.0%) | 4,775 (100.0%) |
Household Income by Mortgage Status in Panama City
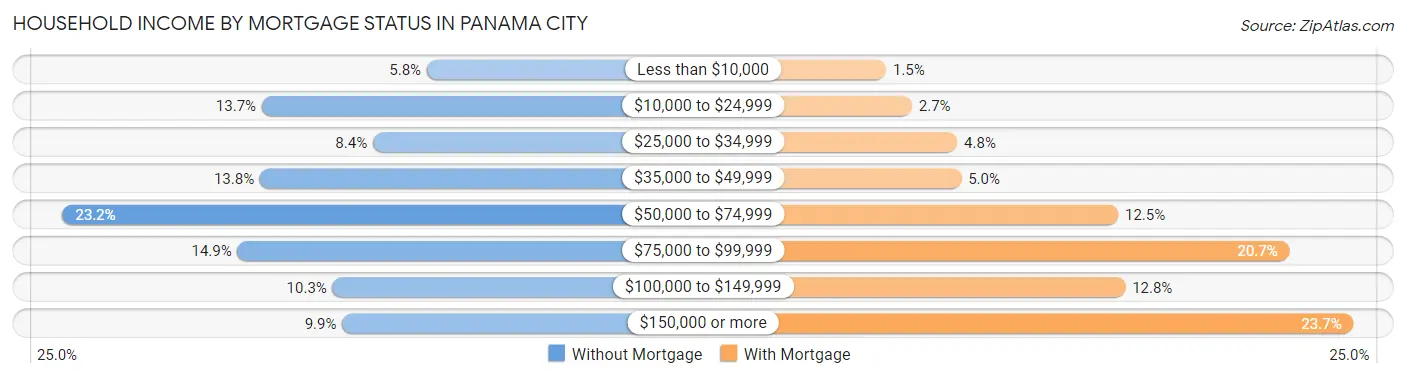
| Household Income | Without Mortgage | With Mortgage |
| Less than $10,000 | 191 (5.8%) | 69 (1.5%) |
| $10,000 to $24,999 | 448 (13.7%) | 128 (2.7%) |
| $25,000 to $34,999 | 275 (8.4%) | 231 (4.8%) |
| $35,000 to $49,999 | 451 (13.8%) | 240 (5.0%) |
| $50,000 to $74,999 | 759 (23.2%) | 597 (12.5%) |
| $75,000 to $99,999 | 486 (14.9%) | 987 (20.7%) |
| $100,000 to $149,999 | 338 (10.3%) | 613 (12.8%) |
| $150,000 or more | 323 (9.9%) | 1,132 (23.7%) |
| Total | 3,271 (100.0%) | 4,775 (100.0%) |
Property Value to Household Income Ratio in Panama City
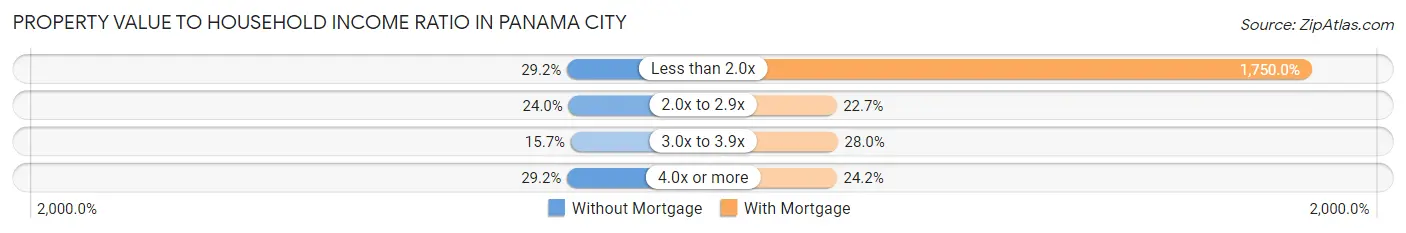
| Value-to-Income Ratio | Without Mortgage | With Mortgage |
| Less than 2.0x | 954 (29.2%) | 83,561 (1,750.0%) |
| 2.0x to 2.9x | 785 (24.0%) | 1,085 (22.7%) |
| 3.0x to 3.9x | 514 (15.7%) | 1,338 (28.0%) |
| 4.0x or more | 954 (29.2%) | 1,153 (24.1%) |
| Total | 3,271 (100.0%) | 4,775 (100.0%) |
Real Estate Taxes by Mortgage Status in Panama City

| Property Taxes | Without Mortgage | With Mortgage |
| Less than $800 | 1,028 (31.4%) | 32 (0.7%) |
| $800 to $1,499 | 867 (26.5%) | 1,069 (22.4%) |
| $800 to $1,499 | 965 (29.5%) | 1,297 (27.2%) |
| Total | 3,271 (100.0%) | 4,775 (100.0%) |
Health & Disability in Panama City
Health Insurance Coverage by Age in Panama City
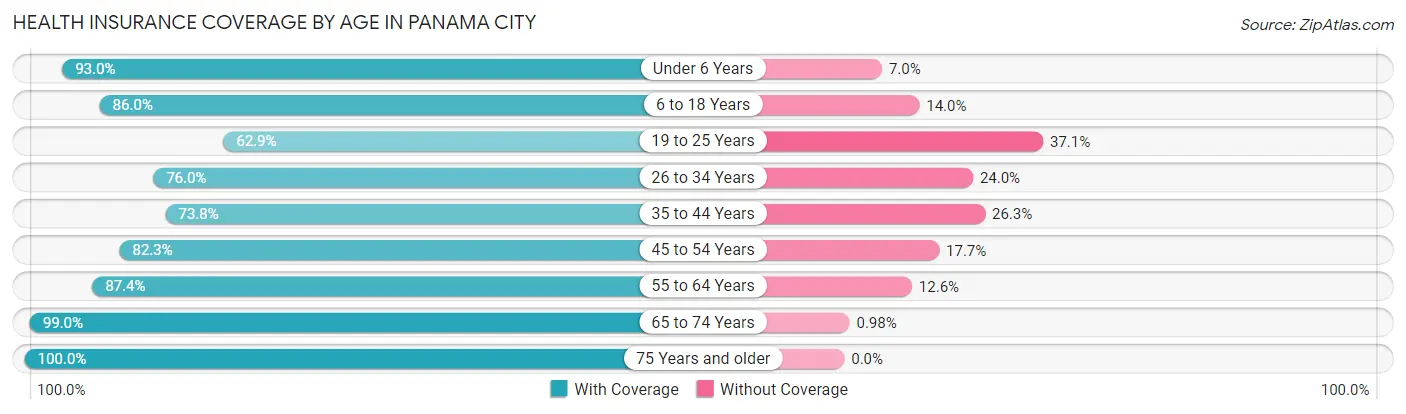
| Age Bracket | With Coverage | Without Coverage |
| Under 6 Years | 2,409 (93.0%) | 182 (7.0%) |
| 6 to 18 Years | 4,730 (86.0%) | 769 (14.0%) |
| 19 to 25 Years | 1,972 (62.9%) | 1,161 (37.1%) |
| 26 to 34 Years | 3,288 (76.0%) | 1,038 (24.0%) |
| 35 to 44 Years | 2,768 (73.8%) | 985 (26.3%) |
| 45 to 54 Years | 3,235 (82.3%) | 695 (17.7%) |
| 55 to 64 Years | 3,757 (87.4%) | 542 (12.6%) |
| 65 to 74 Years | 3,336 (99.0%) | 33 (1.0%) |
| 75 Years and older | 2,313 (100.0%) | 0 (0.0%) |
| Total | 27,808 (83.7%) | 5,405 (16.3%) |
Health Insurance Coverage by Citizenship Status in Panama City
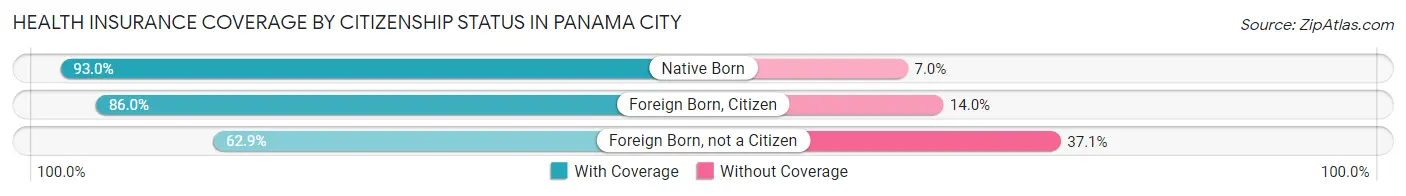
| Citizenship Status | With Coverage | Without Coverage |
| Native Born | 2,409 (93.0%) | 182 (7.0%) |
| Foreign Born, Citizen | 4,730 (86.0%) | 769 (14.0%) |
| Foreign Born, not a Citizen | 1,972 (62.9%) | 1,161 (37.1%) |
Health Insurance Coverage by Household Income in Panama City
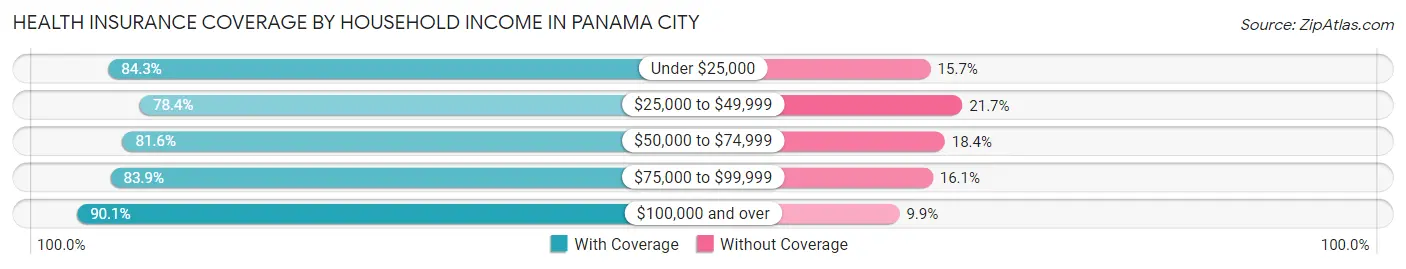
| Household Income | With Coverage | Without Coverage |
| Under $25,000 | 4,217 (84.3%) | 786 (15.7%) |
| $25,000 to $49,999 | 5,725 (78.3%) | 1,582 (21.6%) |
| $50,000 to $74,999 | 5,938 (81.6%) | 1,335 (18.4%) |
| $75,000 to $99,999 | 3,748 (83.9%) | 720 (16.1%) |
| $100,000 and over | 8,053 (90.1%) | 882 (9.9%) |
Public vs Private Health Insurance Coverage by Age in Panama City
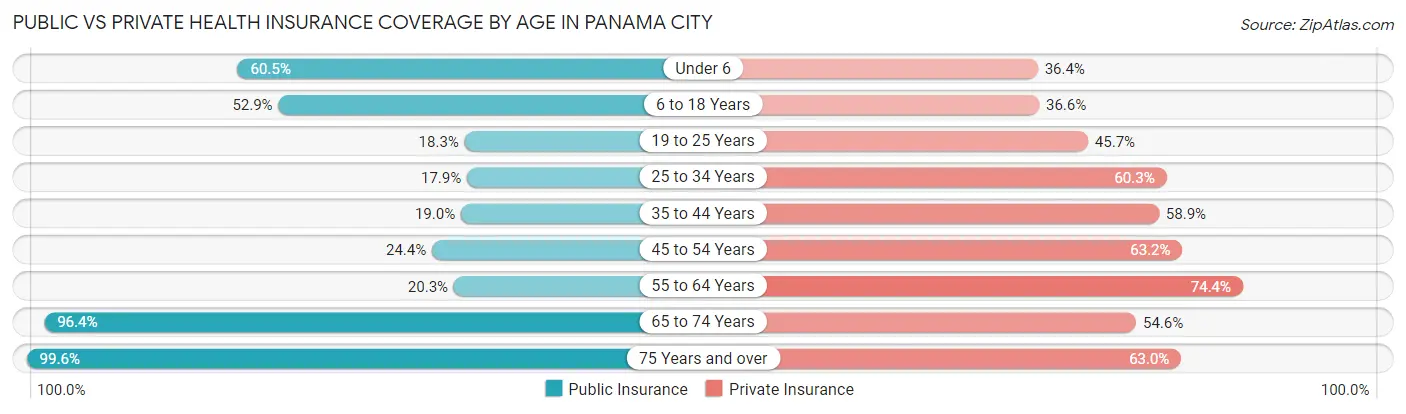
| Age Bracket | Public Insurance | Private Insurance |
| Under 6 | 1,567 (60.5%) | 942 (36.4%) |
| 6 to 18 Years | 2,908 (52.9%) | 2,013 (36.6%) |
| 19 to 25 Years | 574 (18.3%) | 1,431 (45.7%) |
| 25 to 34 Years | 773 (17.9%) | 2,607 (60.3%) |
| 35 to 44 Years | 713 (19.0%) | 2,209 (58.9%) |
| 45 to 54 Years | 958 (24.4%) | 2,484 (63.2%) |
| 55 to 64 Years | 873 (20.3%) | 3,200 (74.4%) |
| 65 to 74 Years | 3,246 (96.4%) | 1,840 (54.6%) |
| 75 Years and over | 2,304 (99.6%) | 1,457 (63.0%) |
| Total | 13,916 (41.9%) | 18,183 (54.7%) |
Disability Status by Sex by Age in Panama City
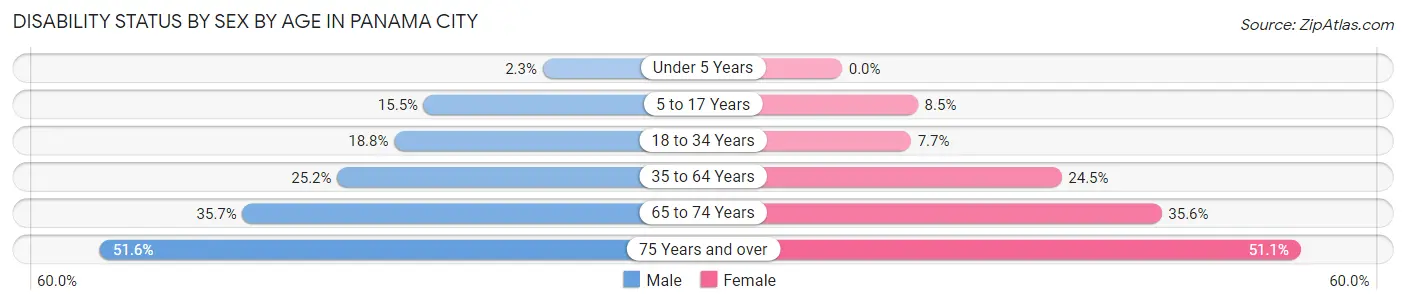
| Age Bracket | Male | Female |
| Under 5 Years | 30 (2.3%) | 0 (0.0%) |
| 5 to 17 Years | 452 (15.5%) | 241 (8.5%) |
| 18 to 34 Years | 641 (18.8%) | 323 (7.7%) |
| 35 to 64 Years | 1,410 (25.2%) | 1,560 (24.4%) |
| 65 to 74 Years | 543 (35.7%) | 658 (35.6%) |
| 75 Years and over | 423 (51.6%) | 763 (51.1%) |
Disability Class by Sex by Age in Panama City
Disability Class: Hearing Difficulty
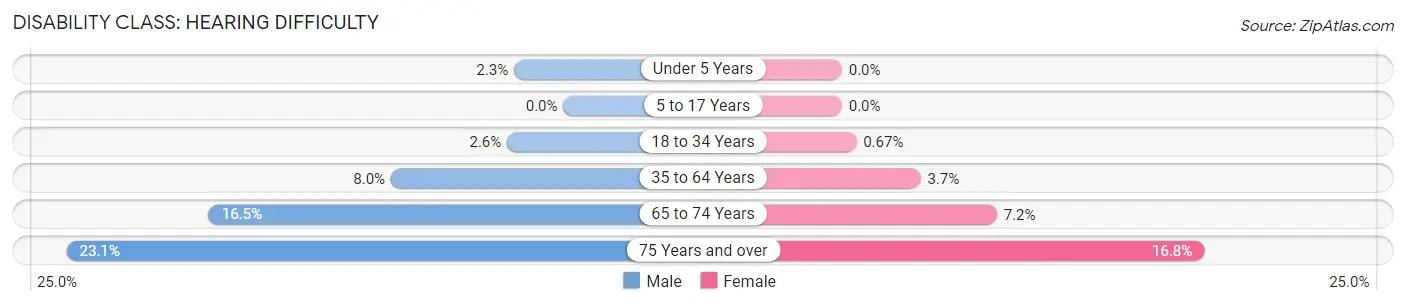
| Age Bracket | Male | Female |
| Under 5 Years | 30 (2.3%) | 0 (0.0%) |
| 5 to 17 Years | 0 (0.0%) | 0 (0.0%) |
| 18 to 34 Years | 89 (2.6%) | 28 (0.7%) |
| 35 to 64 Years | 448 (8.0%) | 233 (3.6%) |
| 65 to 74 Years | 250 (16.5%) | 133 (7.2%) |
| 75 Years and over | 189 (23.1%) | 251 (16.8%) |
Disability Class: Vision Difficulty
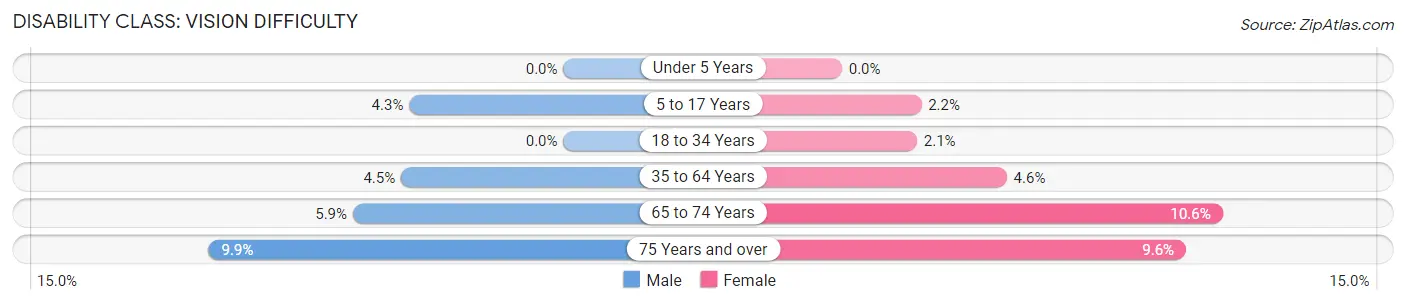
| Age Bracket | Male | Female |
| Under 5 Years | 0 (0.0%) | 0 (0.0%) |
| 5 to 17 Years | 125 (4.3%) | 63 (2.2%) |
| 18 to 34 Years | 0 (0.0%) | 88 (2.1%) |
| 35 to 64 Years | 253 (4.5%) | 293 (4.6%) |
| 65 to 74 Years | 89 (5.9%) | 196 (10.6%) |
| 75 Years and over | 81 (9.9%) | 143 (9.6%) |
Disability Class: Cognitive Difficulty
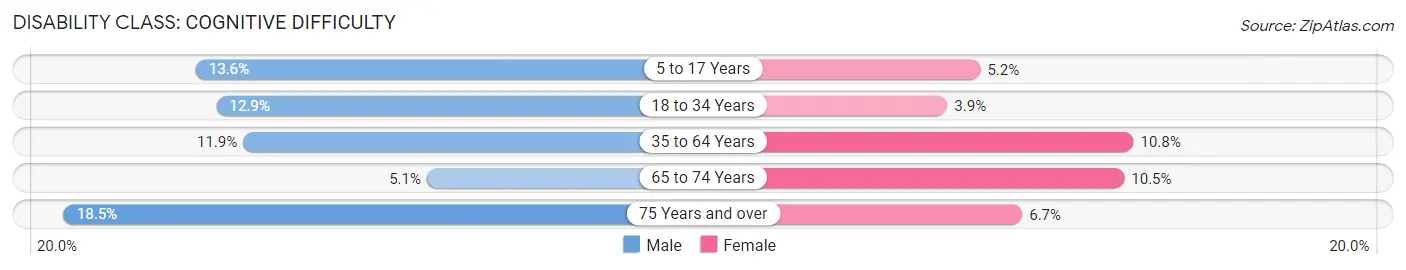
| Age Bracket | Male | Female |
| 5 to 17 Years | 397 (13.6%) | 147 (5.1%) |
| 18 to 34 Years | 438 (12.9%) | 165 (3.9%) |
| 35 to 64 Years | 666 (11.9%) | 691 (10.8%) |
| 65 to 74 Years | 77 (5.1%) | 194 (10.5%) |
| 75 Years and over | 152 (18.5%) | 100 (6.7%) |
Disability Class: Ambulatory Difficulty
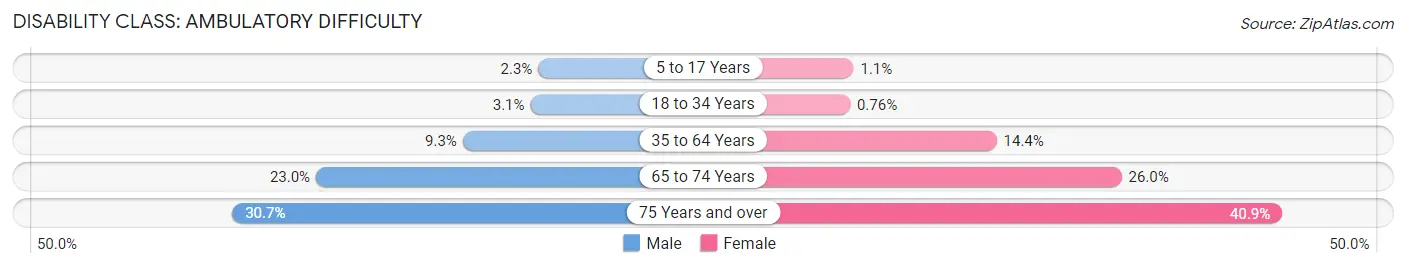
| Age Bracket | Male | Female |
| 5 to 17 Years | 68 (2.3%) | 31 (1.1%) |
| 18 to 34 Years | 104 (3.1%) | 32 (0.8%) |
| 35 to 64 Years | 523 (9.3%) | 917 (14.4%) |
| 65 to 74 Years | 349 (23.0%) | 480 (26.0%) |
| 75 Years and over | 252 (30.7%) | 610 (40.9%) |
Disability Class: Self-Care Difficulty
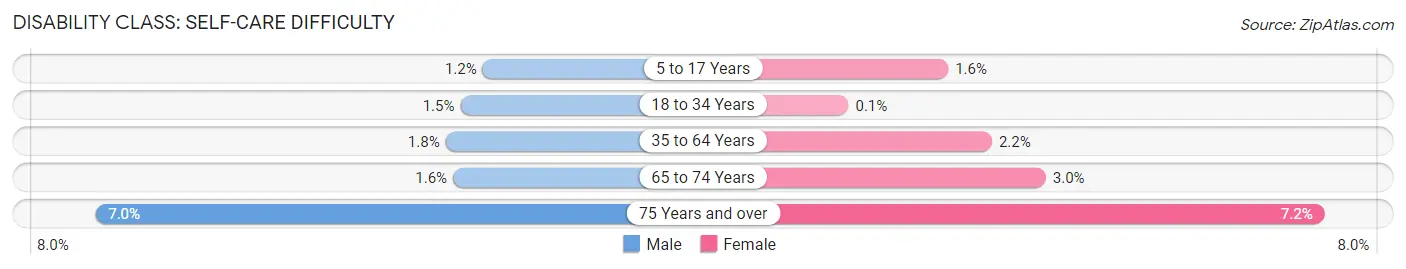
| Age Bracket | Male | Female |
| 5 to 17 Years | 35 (1.2%) | 45 (1.6%) |
| 18 to 34 Years | 52 (1.5%) | 4 (0.1%) |
| 35 to 64 Years | 98 (1.8%) | 142 (2.2%) |
| 65 to 74 Years | 25 (1.6%) | 56 (3.0%) |
| 75 Years and over | 57 (7.0%) | 107 (7.2%) |
Technology Access in Panama City
Computing Device Access in Panama City
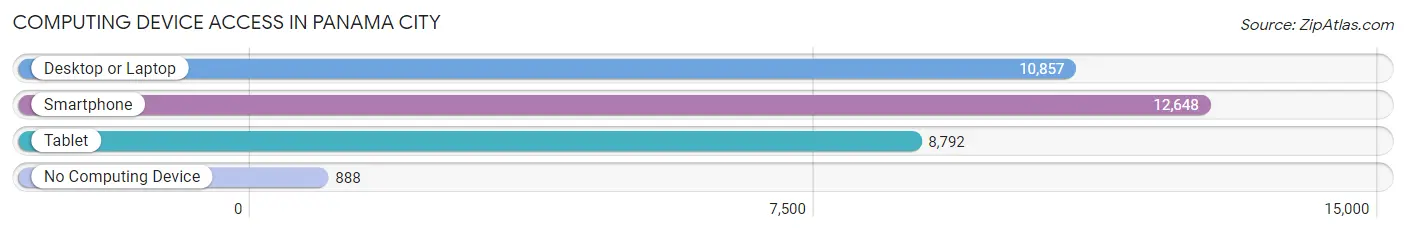
| Device Type | # Households | % Households |
| Desktop or Laptop | 10,857 | 74.6% |
| Smartphone | 12,648 | 86.9% |
| Tablet | 8,792 | 60.4% |
| No Computing Device | 888 | 6.1% |
| Total | 14,550 | 100.0% |
Internet Access in Panama City
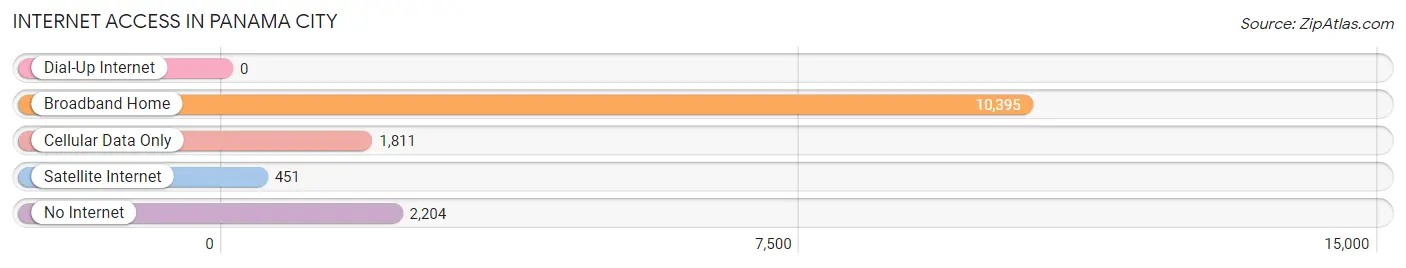
| Internet Type | # Households | % Households |
| Dial-Up Internet | 0 | 0.0% |
| Broadband Home | 10,395 | 71.4% |
| Cellular Data Only | 1,811 | 12.4% |
| Satellite Internet | 451 | 3.1% |
| No Internet | 2,204 | 15.1% |
| Total | 14,550 | 100.0% |
Panama City Summary
Panama City, Florida is a city located in Bay County, Florida, United States. It is the county seat and largest city in Bay County. The city is located along the Gulf of Mexico and is part of the Panama City-Lynn Haven-Panama City Beach Metropolitan Statistical Area. As of the 2010 census, the population was 36,484.
History
The area that is now Panama City was originally inhabited by Native Americans. The first European settlers arrived in the area in the early 19th century. The city was founded in 1813 by John Lee Williams, who named it after the nearby Panama Canal. The city was incorporated in 1909.
During World War II, Panama City was a major training center for the U.S. Navy. After the war, the city experienced a period of growth and development. In the 1950s, the city was a popular tourist destination, and it continues to be a popular destination today.
Geography
Panama City is located in the Florida Panhandle, along the Gulf of Mexico. It is situated on St. Andrew Bay, which is part of the larger Choctawhatchee Bay. The city is bordered by Bay County to the north, Gulf County to the east, and Walton County to the west.
The city has a total area of 28.3 square miles, of which 25.2 square miles is land and 3.1 square miles is water. The city is located at an elevation of 16 feet above sea level.
Economy
The economy of Panama City is largely based on tourism and the military. The city is home to Tyndall Air Force Base, which is a major employer in the area. The city is also a popular tourist destination, with many visitors coming to enjoy the beaches and other attractions.
The city is also home to several major employers, including Gulf Power, Bay Medical Center, and Gulf Coast State College. The city is also home to several major retail stores, including Walmart, Target, and Lowe's.
Demographics
As of the 2010 census, there were 36,484 people, 15,890 households, and 9,845 families residing in the city. The population density was 1,444.3 people per square mile. The racial makeup of the city was 79.2% White, 14.2% African American, 0.5% Native American, 2.2% Asian, 0.1% Pacific Islander, 1.7% from other races, and 2.1% from two or more races. Hispanic or Latino of any race were 5.3% of the population.
The median income for a household in the city was $37,845, and the median income for a family was $45,836. The per capita income for the city was $21,845. About 14.2% of families and 17.7% of the population were below the poverty line, including 25.2% of those under age 18 and 11.2% of those age 65 or over.
Common Questions
What is Per Capita Income in Panama City?
Per Capita income in Panama City is $33,853.
What is the Median Family Income in Panama City?
Median Family Income in Panama City is $69,338.
What is the Median Household income in Panama City?
Median Household Income in Panama City is $57,221.
What is Income or Wage Gap in Panama City?
Income or Wage Gap in Panama City is 26.1%.
Women in Panama City earn 73.9 cents for every dollar earned by a man.
What is Family Income Deficit in Panama City?
Family Income Deficit in Panama City is $11,375.
Families that are below poverty line in Panama City earn $11,375 less on average than the poverty threshold level.
What is Inequality or Gini Index in Panama City?
Inequality or Gini Index in Panama City is 0.48.
What is the Total Population of Panama City?
Total Population of Panama City is 34,254.
What is the Total Male Population of Panama City?
Total Male Population of Panama City is 16,240.
What is the Total Female Population of Panama City?
Total Female Population of Panama City is 18,014.
What is the Ratio of Males per 100 Females in Panama City?
There are 90.15 Males per 100 Females in Panama City.
What is the Ratio of Females per 100 Males in Panama City?
There are 110.92 Females per 100 Males in Panama City.
What is the Median Population Age in Panama City?
Median Population Age in Panama City is 38.5 Years.
What is the Average Family Size in Panama City
Average Family Size in Panama City is 3.0 People.
What is the Average Household Size in Panama City
Average Household Size in Panama City is 2.3 People.
How Large is the Labor Force in Panama City?
There are 16,836 People in the Labor Forcein in Panama City.
What is the Percentage of People in the Labor Force in Panama City?
62.2% of People are in the Labor Force in Panama City.
What is the Unemployment Rate in Panama City?
Unemployment Rate in Panama City is 5.1%.